


Highlights
What are the main findings?
- Among the four machine learning algorithms evaluated (RF, MLR, SVM, and PLS), the random forest (RF) model achieved the highest estimation accuracy for oilseed rape canopy water content (OWC), with a training R2 of 0.970 (RRMSE = 2.10%) and a testing R2 of 0.901 (RRMSE = 3.83%), significantly outperforming the conventional linear approaches.
- Principal component analysis (PCA) for vegetation index screening proved more effective than simple correlation-based selection, and the red-edge/near-infrared indices (CIre, NDRE, and NNIR) were identified as the most sensitive spectral predictors, with consistent inter-annual performance across the 2024–2025 growing seasons.
What are the implications of the main findings?
- This study demonstrates that UAV-based multispectral data, when coupled with appropriate machine learning algorithms, provides a robust, non-destructive, and scalable solution for large-scale OWC monitoring, overcoming the labor-intensive and destructive limitations of traditional gravimetric methods.
- The high-performance RF and PLS models established here offer a reliable scientific basis for precision irrigation scheduling and early drought stress warning in oilseed rape production, thereby facilitating data-driven water resource management and supporting yield stability under variable field conditions.
Abstract
Accurate estimation of canopy water content (OWC) is essential for precision irrigation, crop growth monitoring, and yield prediction. Unmanned aerial vehicle (UAV)-based multispectral remote sensing provides a rapid and non-destructive approach for monitoring crop water status; however, the selection of effective spectral features and appropriate machine learning algorithms for robust OWC estimation remains insufficiently investigated, particularly across multiple growing seasons. This study evaluated the potential of UAV multispectral imagery for estimating oilseed rape canopy water content using two feature selection strategies and four representative machine learning algorithms. Field experiments were conducted during two consecutive growing seasons (2023–2024 and 2024–2025). Different sowing dates, nitrogen application rates, and planting densities were used to create a broad range of canopy water conditions. UAV multispectral images were acquired at ten representative growth stages during the reproductive period, from stem elongation to physiological maturity. Fourteen vegetation indices (VIs) were extracted from the multispectral imagery. Pearson correlation analysis and principal component analysis (PCA) were used to select informative features. These features were then used to develop multiple linear regression (MLR), partial least squares (PLS), support vector machine (SVM), and random forest (RF) models. Model performance was evaluated using each single-year dataset and the combined two-year dataset to assess robustness under different seasonal conditions. The RF model consistently achieved the highest prediction accuracy. The correlation-based RF model developed from the combined two-year dataset produced the best performance. It achieved an R2 of 0.966, an RMSE of 1.734%, and an RRMSE of 2.360% for the training dataset. For the independent testing dataset, the corresponding values were 0.901, 2.794%, and 3.830%, respectively. The PCA-based models showed similar performance and effectively reduced feature redundancy. However, they did not consistently outperform the correlation-based models. These results indicate that combining UAV multispectral imagery with appropriate feature selection and machine learning algorithms can accurately estimate oilseed rape canopy water content under field conditions. Integrating data from multiple growing seasons further improves model robustness and provides a practical basis for UAV-assisted crop water monitoring and precision agricultural management.
1. Introduction
Crop water content is an important indicator of physiological activity, drought resilience, and overall plant water status [1]. When integrated with phenological data, canopy water content offers enhanced predictive accuracy for assessing crop water status [2]. Plant water status is influenced by a complex interplay of edaphic factors, meteorological conditions, cultivar-specific traits, and agronomic practices. Water status not only directly influences photosynthesis and nutrient transport, but also triggers complex physiological responses, including stomatal closure, osmoregulatory solute accumulation, and hormonal signaling shifts [3,4]. As a primary physiological metric at the crop canopy scale, water content varies significantly across developmental stages, particularly during the water-sensitive period from flowering to grain filling. Therefore, timely and accurate assessment of crop canopy water content (OWC) is essential for precision irrigation, drought monitoring, crop growth evaluation, and yield prediction [5,6,7].
Conventional measurements of crop water content mainly rely on destructive sampling and gravimetric analysis. Although these methods provide reliable measurements, they are labor-intensive, time-consuming, and unsuitable for large-scale or repeated monitoring. Satellite remote sensing has been widely applied for regional crop monitoring [8,9]; however, its spatial and temporal resolutions are often insufficient for field-scale precision agriculture because of mixed pixels, cloud contamination, and fixed revisit intervals. Compared with satellite and ground-based measurements, unmanned aerial vehicles (UAVs) equipped with multispectral sensors provide a flexible and efficient platform for acquiring high-spatial-resolution imagery with user-defined acquisition times [10,11,12]. Consequently, UAV remote sensing has become an important technology for the non-destructive monitoring of crop physiological traits under field conditions.
Numerous studies have demonstrated that changes in canopy water status can be effectively detected using spectral reflectance, particularly in the visible, red-edge, and near-infrared regions [5,6,7]. Vegetation indices (VIs) derived from multispectral imagery, such as NDVI, NDRE, CIre, VARI, and RVI, have been widely used to estimate crop water status [13,14,15] because they are sensitive to chlorophyll concentration, canopy structure, and leaf cellular characteristics that are closely associated with plant water conditions. Recent advances in UAV multispectral imaging have further enabled the high-throughput acquisition of canopy spectral information with centimeter-level spatial resolution [14], making UAV-based water status estimation increasingly attractive for precision agriculture.
During the past decade, machine learning has substantially improved the capability of remote sensing for the quantitative estimation of crop physiological traits [16,17]. Compared with traditional statistical models, machine learning algorithms can better characterize nonlinear relationships between spectral features and target variables. Representative algorithms, including random forest (RF), support vector machine (SVM), partial least squares (PLS), and multiple linear regression (MLR), have been successfully applied to estimate leaf water content, canopy water content, biomass, chlorophyll concentration, and nitrogen status in numerous crops [18,19]. Among them, RF has attracted considerable attention because of its strong nonlinear fitting capability, robustness against noise, and ability to handle multicollinearity, whereas SVM performs well for relatively small datasets with complex feature distributions. These characteristics make machine learning particularly suitable for UAV-based crop monitoring.
Recent studies have reported encouraging results for estimating crop water status using UAV multispectral imagery in crops such as wheat, maize, soybean, and almond orchards [19,20,21]. Nevertheless, the reported prediction performance varies considerably among crops, environmental conditions, sensors, and modeling approaches. In particular, differences in feature selection strategies frequently lead to inconsistent model performance because vegetation indices derived from the same multispectral bands are often highly correlated. Redundant spectral variables may increase model complexity, reduce interpretability, and potentially affect model generalization. Consequently, selecting informative and physiologically meaningful predictors has become an important step in UAV-based crop water estimation.
Despite the encouraging progress achieved in UAV-based crop water monitoring, several important challenges remain. First, although numerous vegetation indices have been proposed for estimating crop water status, most studies select predictors solely according to their correlation with the target variable [13,22]. Such approaches often overlook the physiological significance of spectral features and ignore the substantial multicollinearity among vegetation indices derived from the same multispectral bands. Consequently, redundant information may reduce model interpretability and limit prediction robustness.
Second, previous studies have mainly focused on comparing different machine learning algorithms [17,23,24], whereas relatively little attention has been paid to systematically evaluating different feature selection strategies before model construction. Feature selection is a critical step because the quality of the input variables directly influences model performance, computational efficiency, and model generalization. Correlation analysis and principal component analysis (PCA) represent two widely used but fundamentally different feature selection strategies. Correlation analysis aims to identify predictors with strong direct relationships to the target variable, whereas PCA reduces feature redundancy by transforming correlated variables into a smaller number of orthogonal components. However, comparative evaluations of these two strategies for UAV-based canopy water content estimation remain limited, particularly for oilseed rape.
Third, most published studies have developed prediction models using data collected during a single growing season or under relatively homogeneous environmental conditions [11,17,19]. Crop canopy water status is influenced by complex interactions among meteorological conditions, crop phenology, agronomic management, and seasonal variability [11,13,19]. Consequently, models developed using single-season datasets may exhibit limited robustness when applied under different growing conditions. Integrating observations from multiple growing seasons provides an effective approach for improving model stability and evaluating model generalization across seasonal conditions, yet such investigations remain relatively scarce.
Oilseed rape is one of the most important oilseed crops worldwide; however, compared with cereals such as wheat and maize, relatively few studies have focused on UAV-based estimation of oilseed rape canopy water content under field conditions. Furthermore, few studies have simultaneously evaluated different feature selection strategies and machine learning algorithms using multi-season datasets. These knowledge gaps motivated the present study. Therefore, the objectives of this study were to: (1) evaluate the capability of UAV multispectral imagery for estimating oilseed rape canopy water content under field conditions; (2) compare the performance of two representative feature selection strategies (Pearson correlation analysis and principal component analysis) for selecting informative spectral predictors; (3) systematically evaluate four representative machine learning algorithms (RF, SVM, PLS, and MLR) using individual annual datasets and a combined two-year dataset; (4) identify an effective modeling framework capable of improving prediction robustness across different growing seasons.
2. Materials and Methods
2.1. Experimental Site and Field Experimental Design
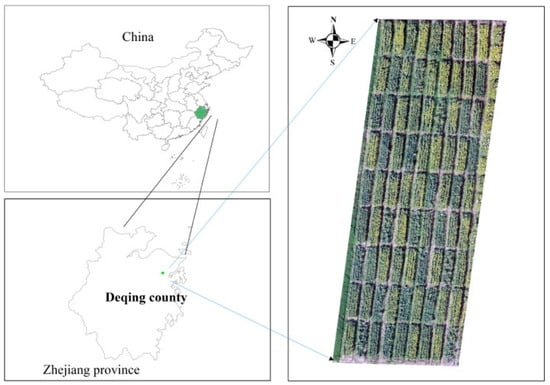
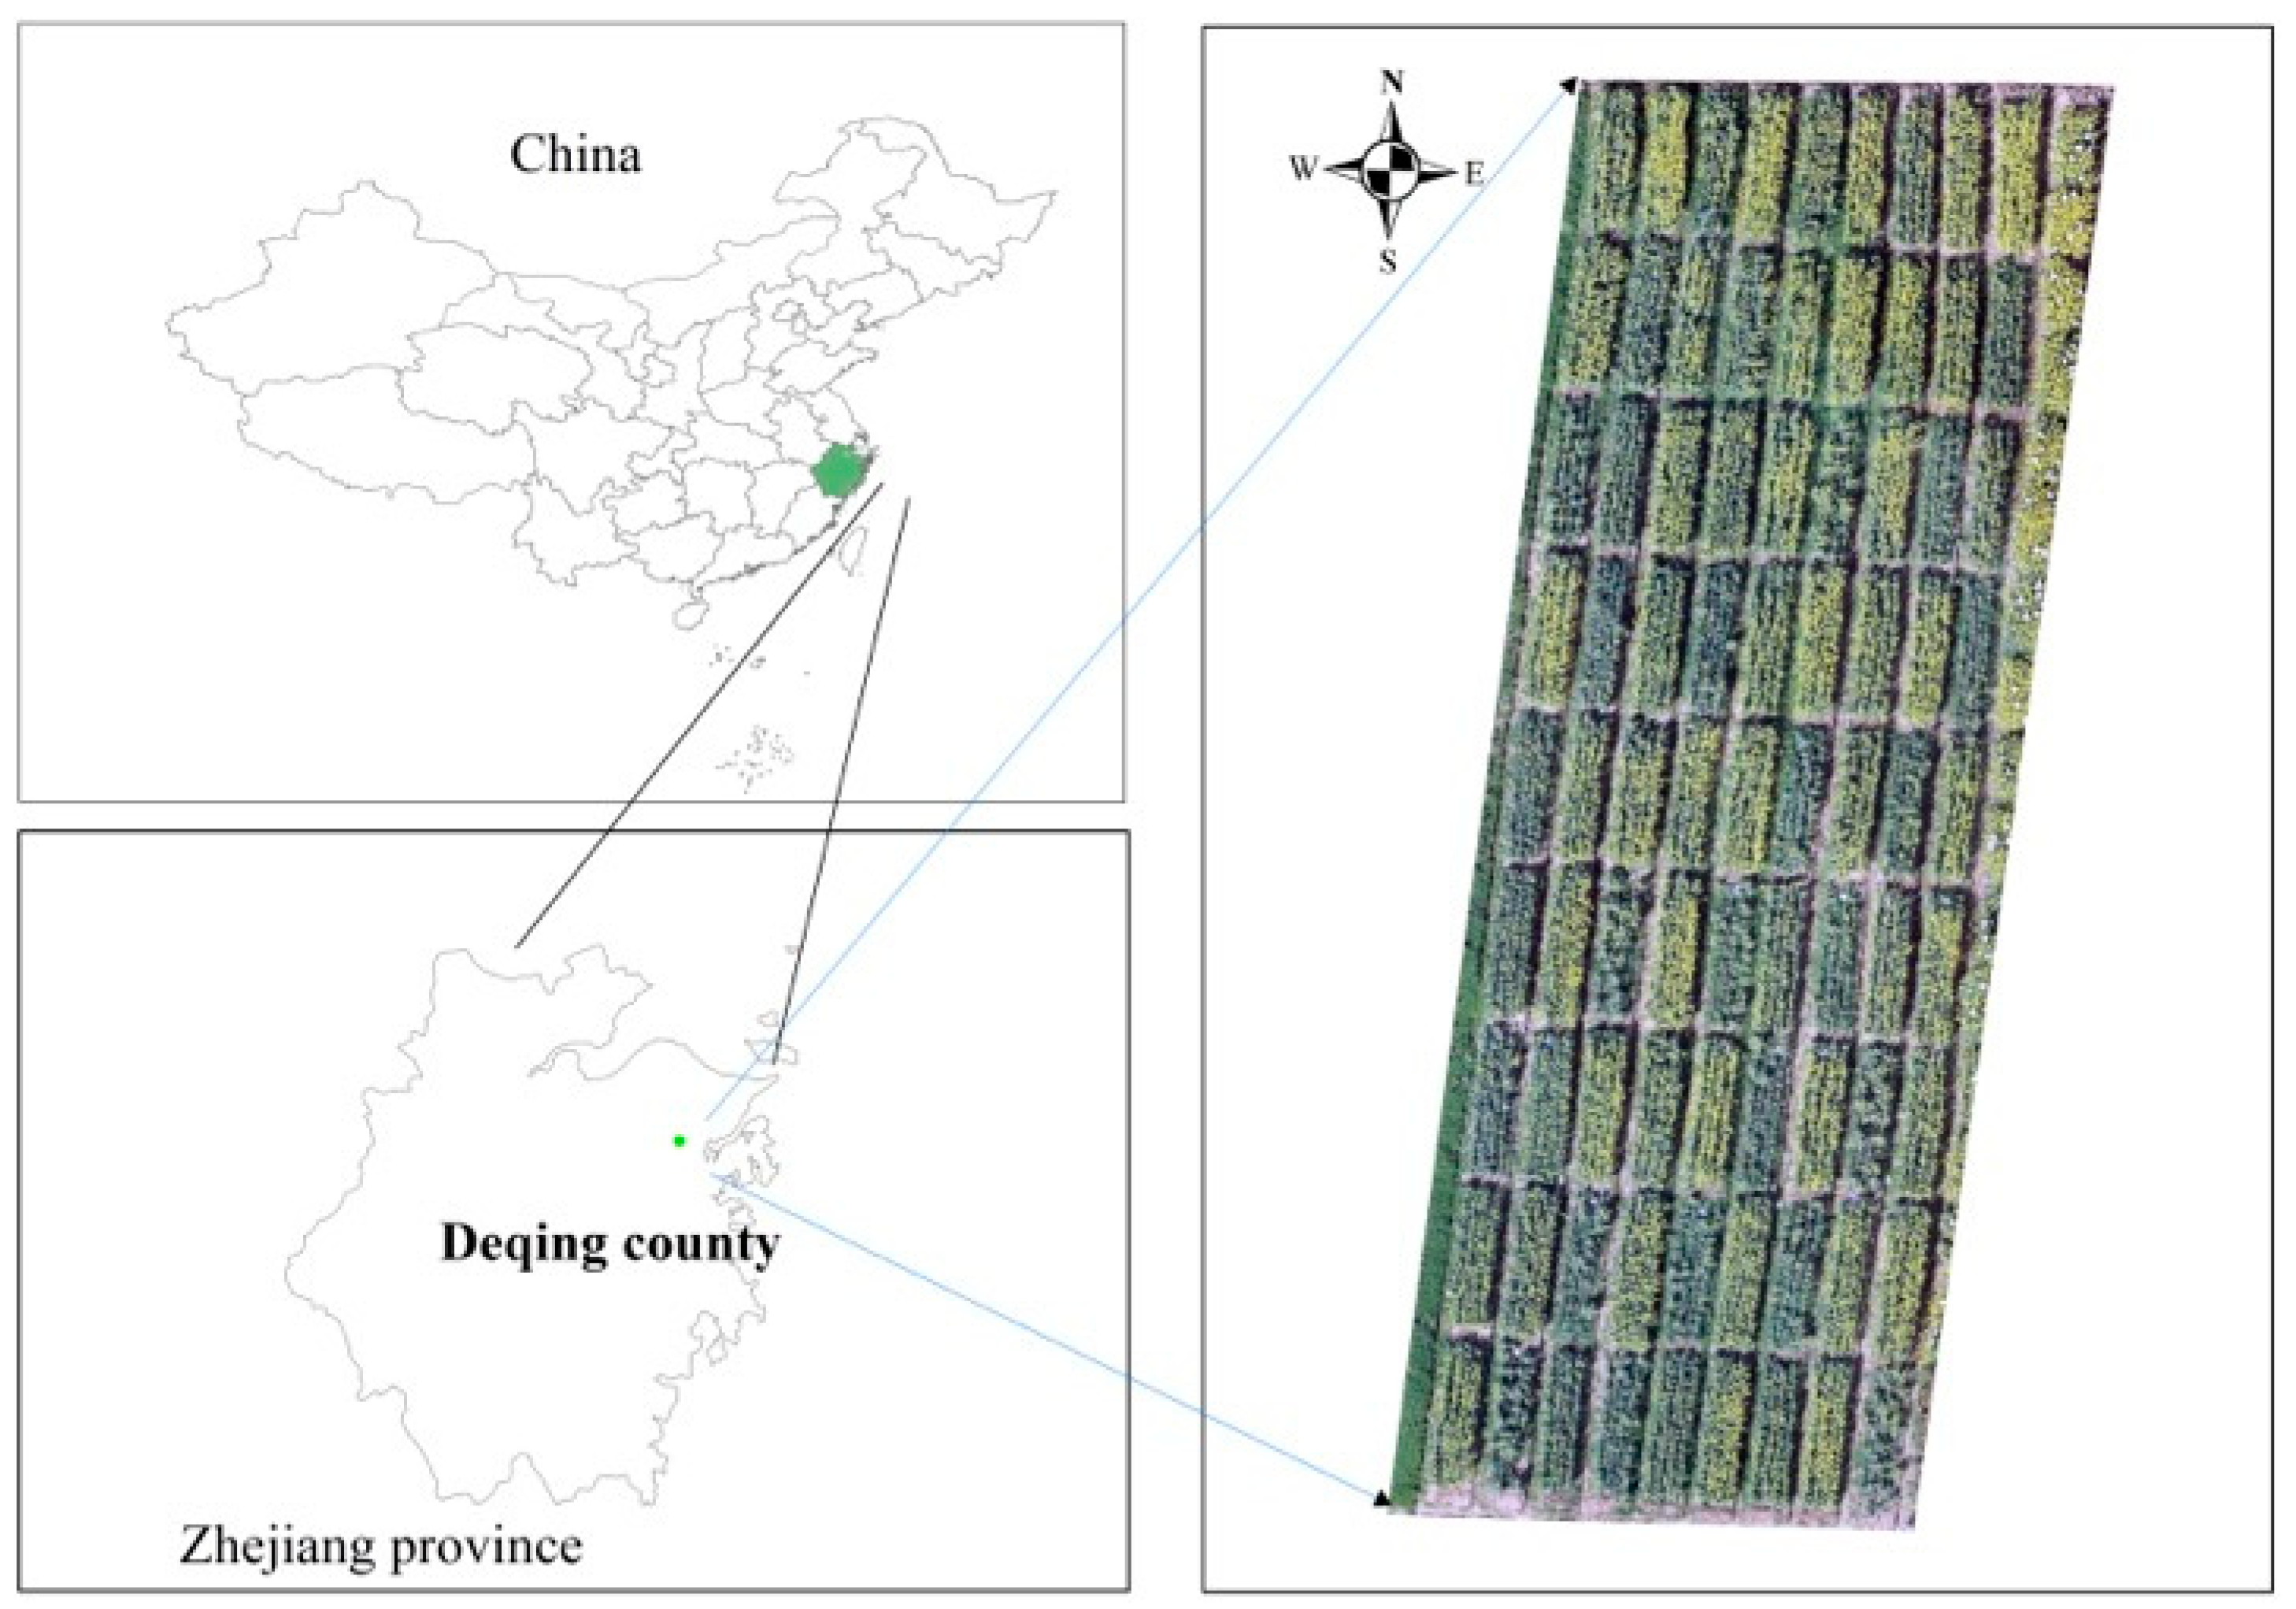
The field experiment was conducted at the base of the Zhejiang Academy of Agricultural Sciences in Deqing County, Huzhou City, China (as shown in Figure 1) during two consecutive growing seasons (2023–2024 and 2024–2025). The experimental site has a typical subtropical monsoon climate characterized by mild winters and abundant precipitation, providing suitable environmental conditions for winter oilseed rape cultivation. The experimental soil belongs to clay loam (red soil) according to the Chinese soil classification system. Routine agronomic management practices, including weed and pest control, were implemented throughout the experiment. Irrigation was supplied only when necessary to avoid severe water stress and maintain normal crop growth, following local agronomic recommendations. No artificial drought or irrigation treatments were imposed because the objective of this study was to evaluate canopy water content variation under practical field conditions.
Figure 1.
Location of the field experimental site. The experiment consisted of 27 treatment combinations (3 sowing dates × 3 nitrogen rates × 3 planting densities) with three replicates, resulting in 81 experimental plots.
To generate sufficient variability in canopy water content, three agronomic management factors were considered, including sowing date, nitrogen application rate, and planting density. Three levels were established for each factor, resulting in 27 treatment combinations (3 × 3 × 3). Each treatment was replicated three times, giving a total of 81 experimental plots. Details of the experimental design are given in Table 1. The experimental plots were arranged using a randomized complete block design to minimize the influence of spatial heterogeneity across the field. Furthermore, all destructive sampling and UAV measurements were conducted within the central area of each plot, thereby avoiding edge effects. Unless indicated otherwise, oilseed rape was sown at 3.0 × 10⁵ plants/ha, compound fertilizer was supplied at 500 kg/ha, and herbicide S-metolachlor was applied pre-emergence at 1.5 L/ha.
Table 1.
Experimental design in this study.
2.2. Field Sampling and Determination of Canopy Water Content
Field sampling was performed at ten representative growth stages during the reproductive growth period of oilseed rape, extending from stem elongation to physiological maturity. The ten sampling campaigns are denoted as T1–T10, corresponding to the principal phenological stages listed in Table 2. At each sampling date, representative plants were collected from the central area of every experimental plot. The sampled aboveground biomass consisted of leaves and stems throughout the growing season. At the silique stage, siliques were also included because they formed part of the aboveground biomass.
Table 2.
Sampling and UAV flight dates for the 2023–2024 and 2024–2025 experimental cycle.
Sampling was performed within 1.0 m2 quadrants, with coordinates recorded via GPS. Once sampling was completed, the fresh weight (FW) of oilseed rape was recorded. After being transported to the laboratory, the samples were deactivated at 105 °C for 30 min, then oven-dried at 80 °C for 72 h. Once the dry weight (DW) became constant, the OWC was calculated according to the following equation:
where FW represents the fresh weight of the aboveground biomass (g), and DW represents the corresponding dry weight after oven drying (g).
A total of 724 field samples were collected during the two growing seasons. These samples were subsequently used for vegetation index extraction, feature selection, and machine learning model development. Because several plots were excluded due to missing plants, lodging, or incomplete UAV observations, 724 valid samples were retained for subsequent analysis.
2.3. UAV Image Acquisition and Image Processing
UAV multispectral images were acquired using a DJI Phantom 4 Multispectral (DJI Technology Co., Shenzhen, China), which is equipped with six synchronized cameras, including one RGB sensor and five monochrome multispectral sensors centered at blue (450 ± 16 nm), green (560 ± 16 nm), red (650 ± 16 nm), red-edge (730 ± 16 nm), and near-infrared (840 ± 26 nm).
To minimize illumination variability, all UAV flights were conducted under stable weather conditions between 10:00 and 14:00 local time. The flight altitude was maintained at 30 m above ground level. The forward and side image overlaps were set to 70% and 80%, respectively, to ensure sufficient image matching for orthomosaic generation. Before each flight, radiometric calibration was performed using the calibrated reflectance panel. Image acquisition was conducted under cloud-free or uniformly overcast conditions to reduce illumination differences among sampling dates. The built-in sunshine sensor of the UAV was used to compensate for changes in incident solar irradiance during image acquisition.
The multispectral images were processed using DJI Terra (DJI Technology Co., Shenzhen, China), including image alignment, orthorectification, radiometric correction, and orthomosaic generation. Regions of interest (ROIs) corresponding to the sampled plots were manually delineated according to the RGB image collected by DJI Phantom 4 RTK (DJI Technology Co., Shenzhen, China), and the mean reflectance of each spectral band within each ROI was extracted for subsequent analysis.
2.4. Vegetation Indices and Feature Selection
Fourteen vegetation indices (VIs) commonly used for crop water status estimation were calculated from the UAV multispectral imagery (Table 3). These indices represent different physiological characteristics of crop canopies, including chlorophyll concentration, canopy vigor, biomass accumulation, and leaf internal structure, all of which are closely associated with canopy water status. Two-tailed Pearson correlation analysis was performed between each vegetation index and the measured canopy water content (OWC). The objective was to quantify the linear relationship between individual VIs and OWC rather than to evaluate correlations among different vegetation indices. Vegetation indices exhibiting relatively strong correlations with OWC and clear physiological relevance were selected as candidate predictors for subsequent model development. Prior to correlation analysis, descriptive statistics of all variables were examined to identify abnormal observations and evaluate data distributions. Principal component analysis was subsequently applied to the standardized vegetation-index dataset to reduce feature redundancy caused by multicollinearity among vegetation indices derived from the same multispectral bands.
Table 3.
Vegetation indices used in this study.
2.5. Machine Learning Models
Four representative machine learning algorithms, including multiple linear regression (MLR), partial least squares regression (PLS), support vector machine (SVM), and random forest (RF), were employed to estimate canopy water content. The complete dataset was randomly partitioned into training and independent testing datasets at a ratio of 2:1 using the cvpartition function in MATLAB R2023a. Random partitioning ensured that samples collected from different treatments and sampling dates were distributed across both datasets, thereby reducing sampling bias and improving model generalization.
Only principal components with eigenvalues greater than one were retained. The cumulative variance explained by the retained principal components exceeded 80%, indicating that most spectral information was preserved. Vegetation indices with relatively high loading values in the retained principal components were subsequently selected as representative predictors for machine learning modeling. Compared with correlation analysis, PCA aims to reduce feature redundancy while preserving the majority of spectral information.
The RF model was developed using the TreeBagger algorithm in MATLAB. The number of decision trees was set to 500, bootstrap aggregation was enabled, and the minimum leaf size was fixed at 1. MLR was implemented using the ordinary least-squares method to establish linear relationships between the selected vegetation indices and canopy water content. PLS regression was implemented using the SIMPLS algorithm. The optimal number of latent variables was determined using tenfold cross-validation. SVM regression was implemented using the radial basis function (RBF) kernel. The Box Constraint parameter (C) was set to 1, while the Kernel Scale parameter was automatically determined by MATLAB. Hyperparameter optimization was not performed because the objective of this study was to compare representative machine learning algorithms under consistent parameter settings.
Model performance was evaluated using the coefficient of determination (R2), root mean square error (RMSE), and relative root mean square error (RRMSE). The corresponding equations are given as follows:
where x represents the measured values and y represents the estimated values; denotes the mean of the measured OWC values, represents the average value of the estimated OWC, and N represents the number of observations.
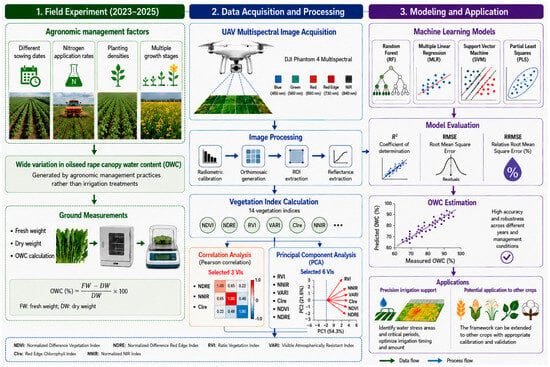
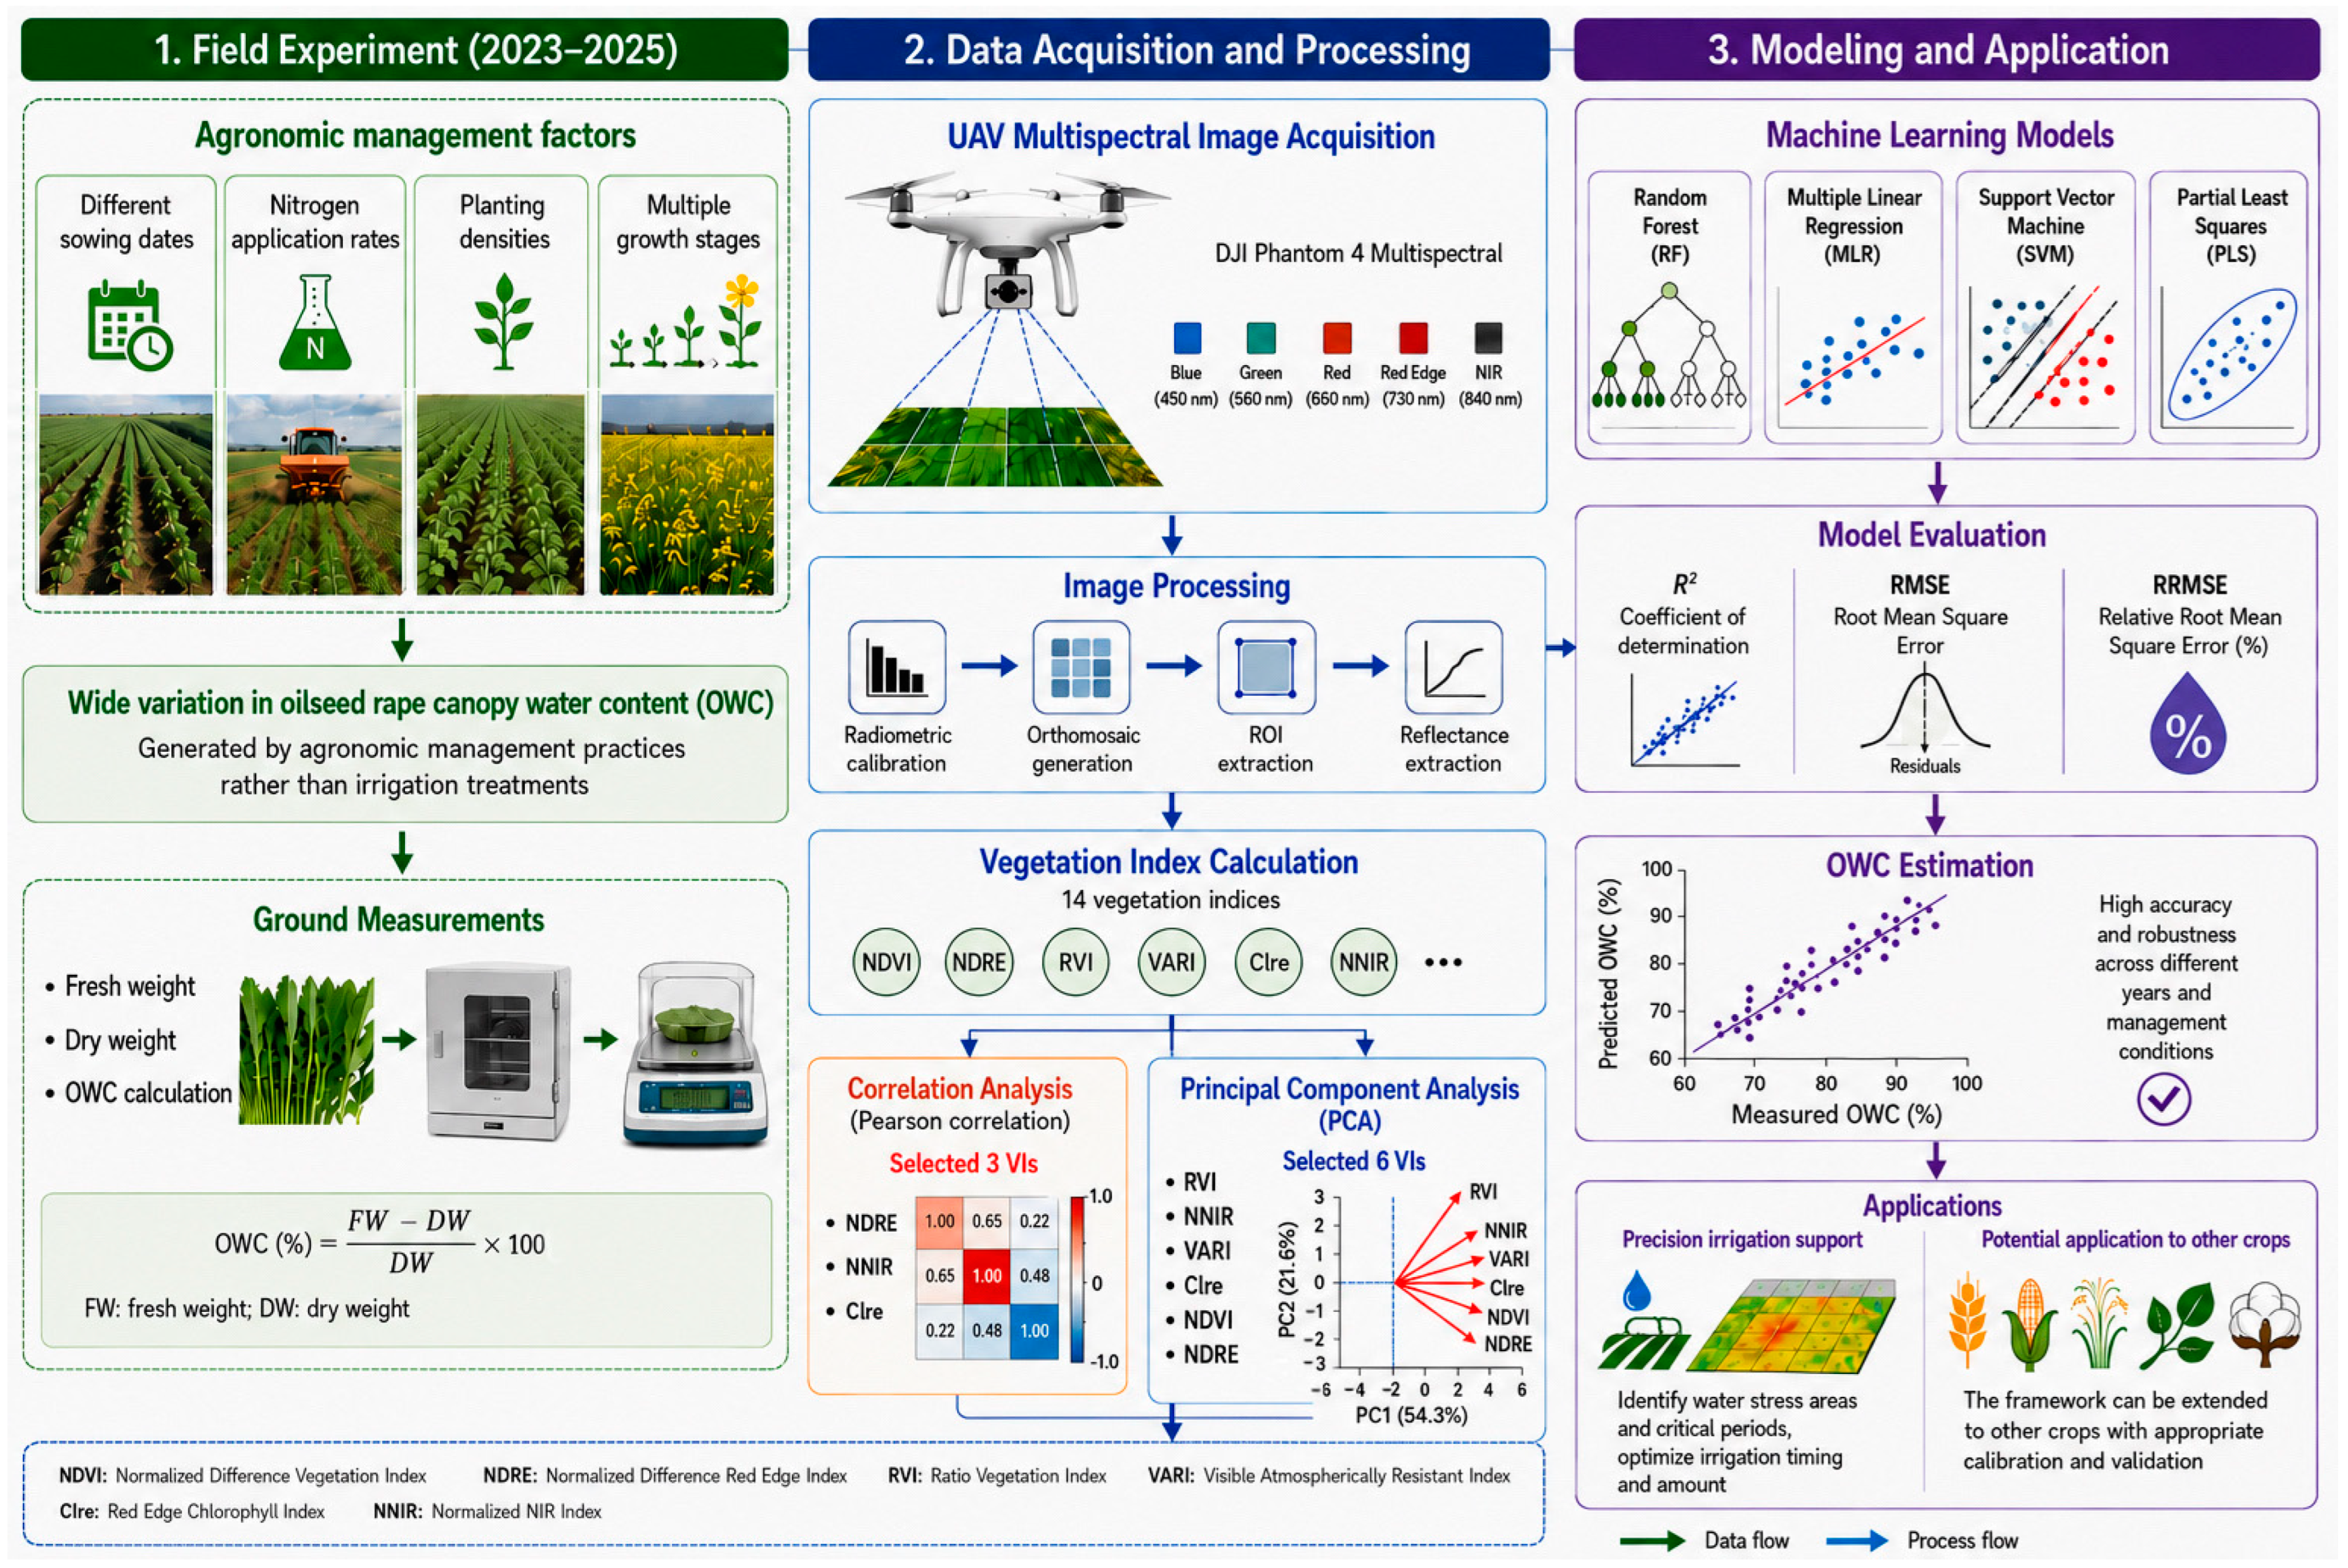
Two independent modeling frameworks were established in this study. The first framework employed predictors selected by Pearson correlation analysis, whereas the second framework used predictors selected by PCA. For each framework, identical machine learning algorithms (RF, MLR, SVM, and PLS) were implemented to ensure a fair comparison between the two feature selection strategies. The schematic workflow for the OWC estimation model is shown in Figure 2.
Figure 2.
Schematic workflow for the OWC estimation model, encompassing image acquisition, feature selection, and model construction.
2.6. Statistical Analysis
Two-tailed Pearson correlation and PCA were conducted using IBM SPSS Statistics 25.0. Origin 2024 was used to generate the correlation and PCA plots. RF-, SVM-, MLR-, and PLS-based machine learning models were implemented using MATLAB R2023a.
3. Results
3.1. OWC
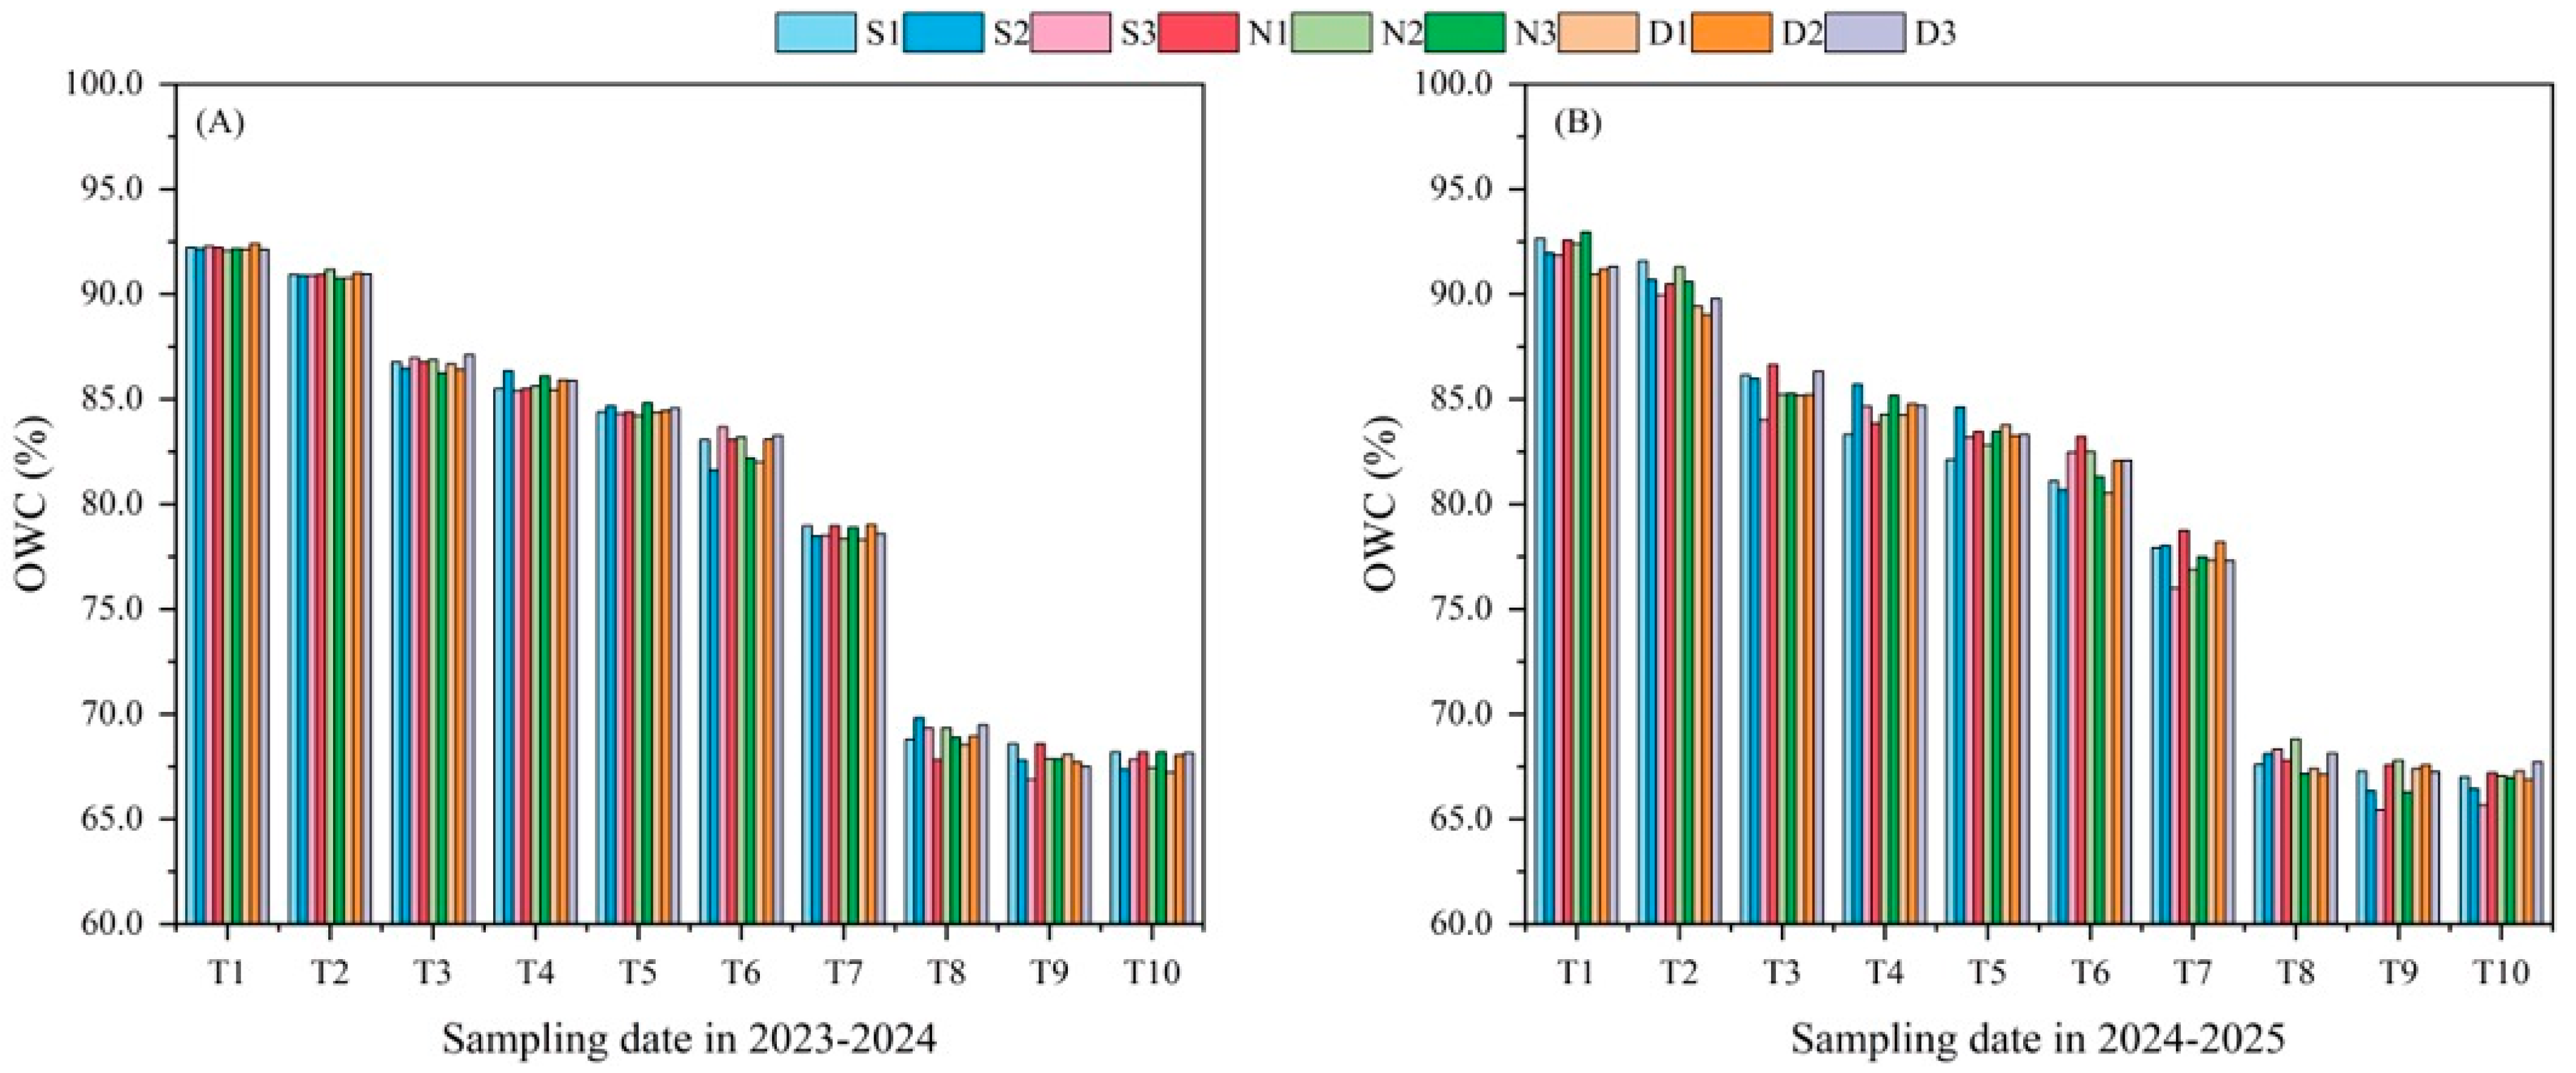
The descriptive statistics of OWC measured during the two growing seasons are presented in Table 4, while the temporal variation in OWC across the ten sampling stages is illustrated in Figure 3. In 2024, OWC values ranged from 51.21% to 98.63%, with a mean of 73.24%. OWC in 2025 ranged from 51.37% to 94.48%, with a mean of 73.26%. Substantial variation in OWC was observed among sampling stages and growing seasons, indicating that the experimental design successfully generated a wide range of canopy water conditions suitable for model development. The measured OWC values generally decreased as crop development progressed from stem elongation to physiological maturity, reflecting the gradual decline in plant water content associated with leaf senescence, biomass accumulation, and seed filling.
Table 4.
Descriptive statistics of OWC (oilseed rape canopy water content (%)) in the 2024 and 2025 growing seasons.
Figure 3.
Temporal dynamics of OWC during the 2024 (A) and 2025 (B) experimental years. S, N, and D indicate seeding date, nitrogen application, and planting density treatments. T in the graph represents sampling and UAV flight date. Details are shown in Table 2.
Although similar temporal trends were observed in both growing seasons, slight differences in OWC distribution were evident between individual years. These differences are likely attributable to seasonal variations in meteorological conditions, including rainfall, temperature, and atmospheric evaporative demand, which influence crop water status under field conditions. Such interannual variability further highlights the importance of evaluating model robustness using datasets collected over multiple growing seasons rather than relying solely on a single-season dataset. The combined two-year dataset therefore provides a broader representation of canopy water conditions than either annual dataset alone, allowing machine learning models to learn from a wider range of environmental and physiological variability. Consequently, models developed using the combined dataset are expected to exhibit improved generalization capability under practical field conditions.
3.2. Selection of Informative Vegetation Indices
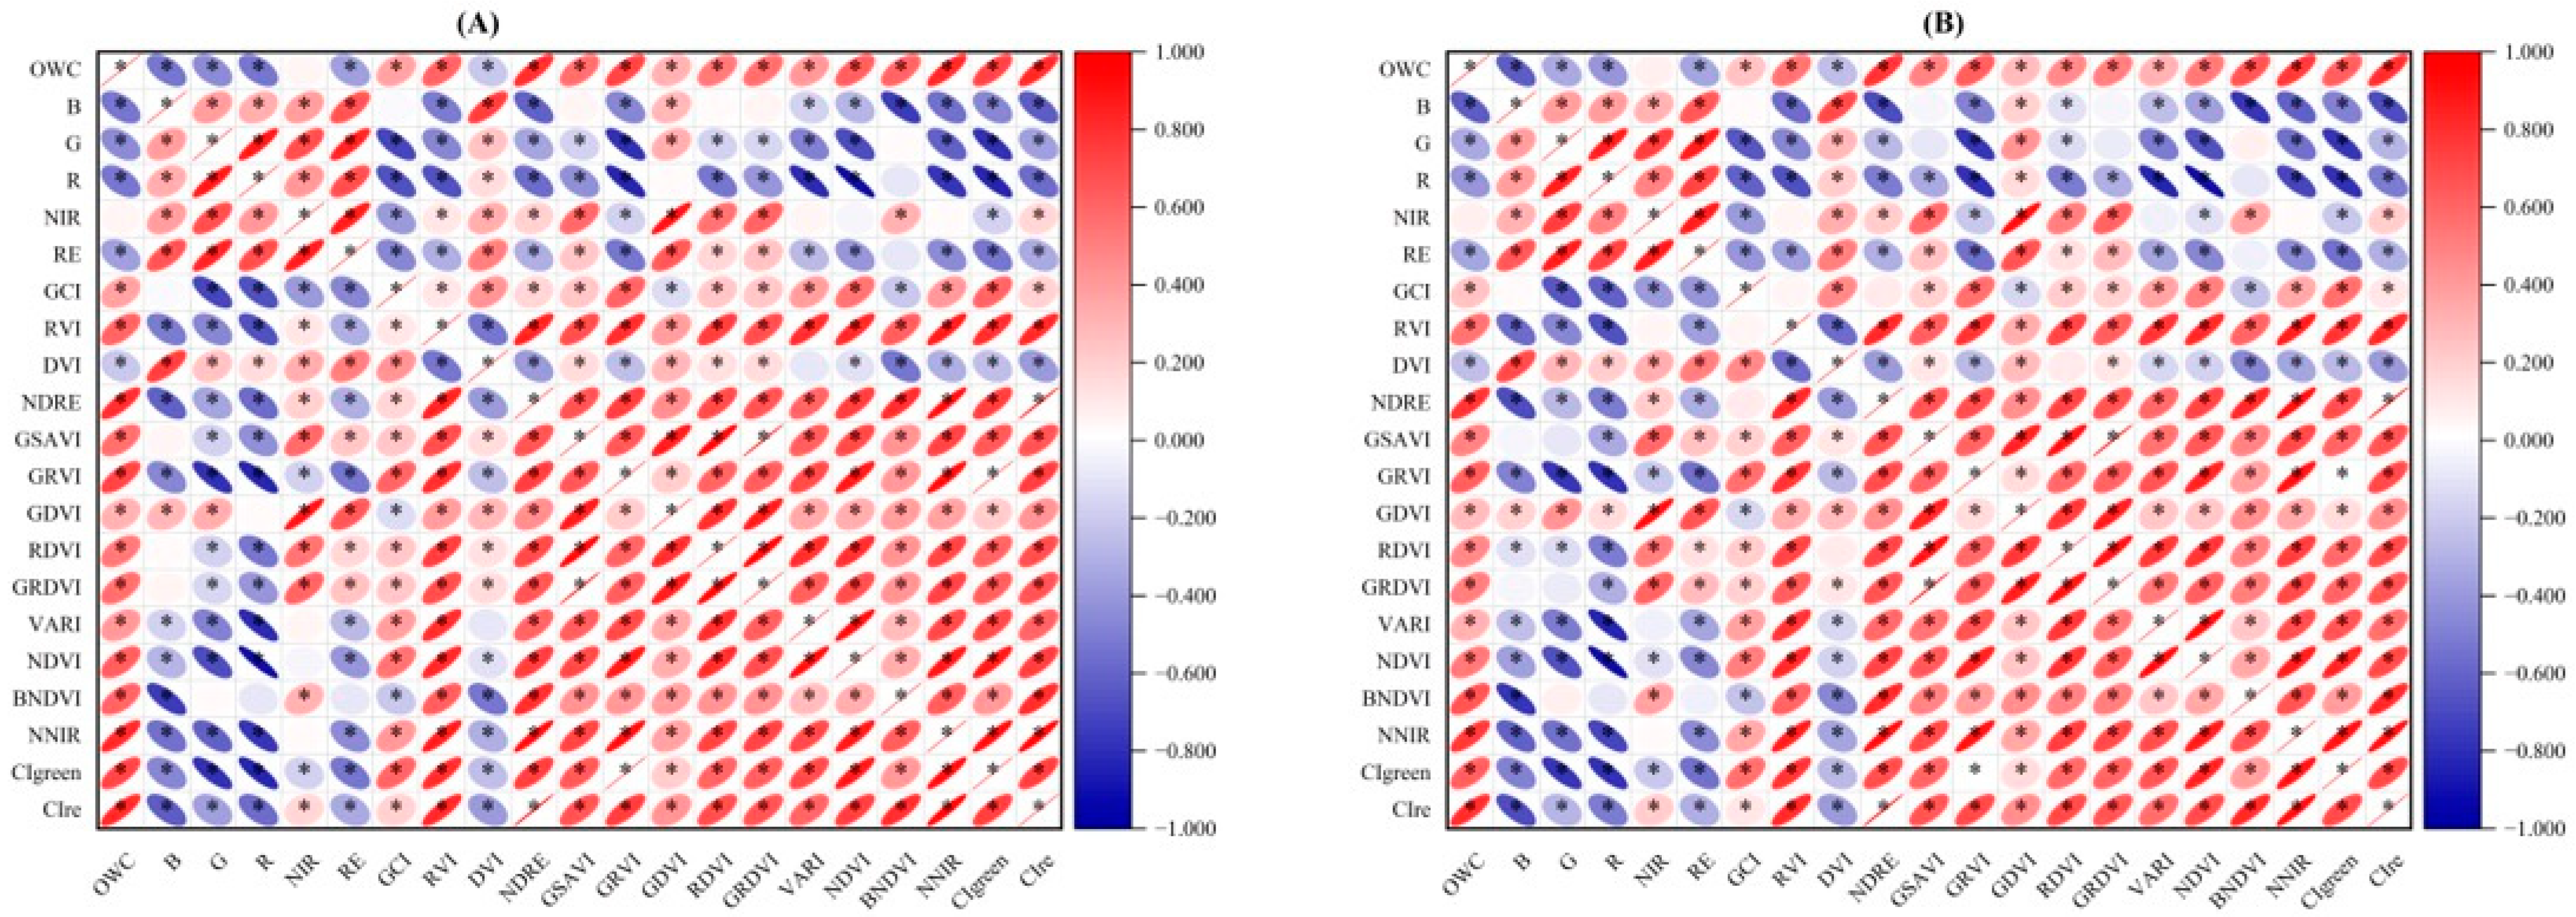
The relationships between VIs and OWC were first evaluated using Pearson correlation analysis. As shown in Figure 4, all of the VIs exhibited significant correlations with OWC across both years. However, the correlation coefficients varied considerably among vegetation indices, indicating substantial differences in their sensitivity to OWC. Vegetation indices derived from the red-edge and near-infrared spectral bands generally exhibited stronger correlations with OWC than those relying primarily on visible wavelengths. This finding is consistent with the physiological characteristics of crop canopies because red-edge reflectance is highly sensitive to chlorophyll concentration and internal leaf structure, whereas near-infrared reflectance is closely associated with leaf cellular architecture and canopy water status. In 2024, NNIR, CIre, and NDRE exhibited the strongest correlation with OWC, yielding coefficients of 0.828, 0.824, and 0.812, respectively. A similar trend was observed in 2025, where CIre (0.807), NDRE (0.796), and NNIR (0.777) remained superior to other VIs. A correlation threshold of 0.750 was established for feature selection. Based on the correlation coefficients criterion together with their physiological relevance, three vegetation indices (NDRE, NNIR, and CIre) were selected for subsequent machine learning modeling. These indices collectively represent complementary information regarding canopy greenness, biomass accumulation, chlorophyll concentration, and leaf structural characteristics, which are closely related to crop water status.
Figure 4.
Pearson correlation coefficients between VIs and OWC in (A) 2024 and (B) 2025. Asterisk (*) indicates that the result is statistically significant according to a two-tailed test with p < 0.05.
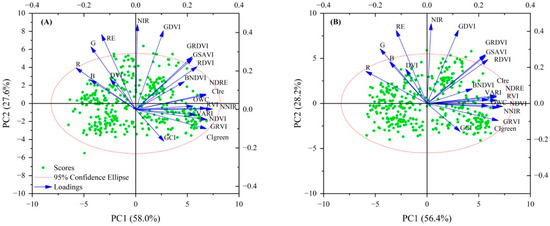
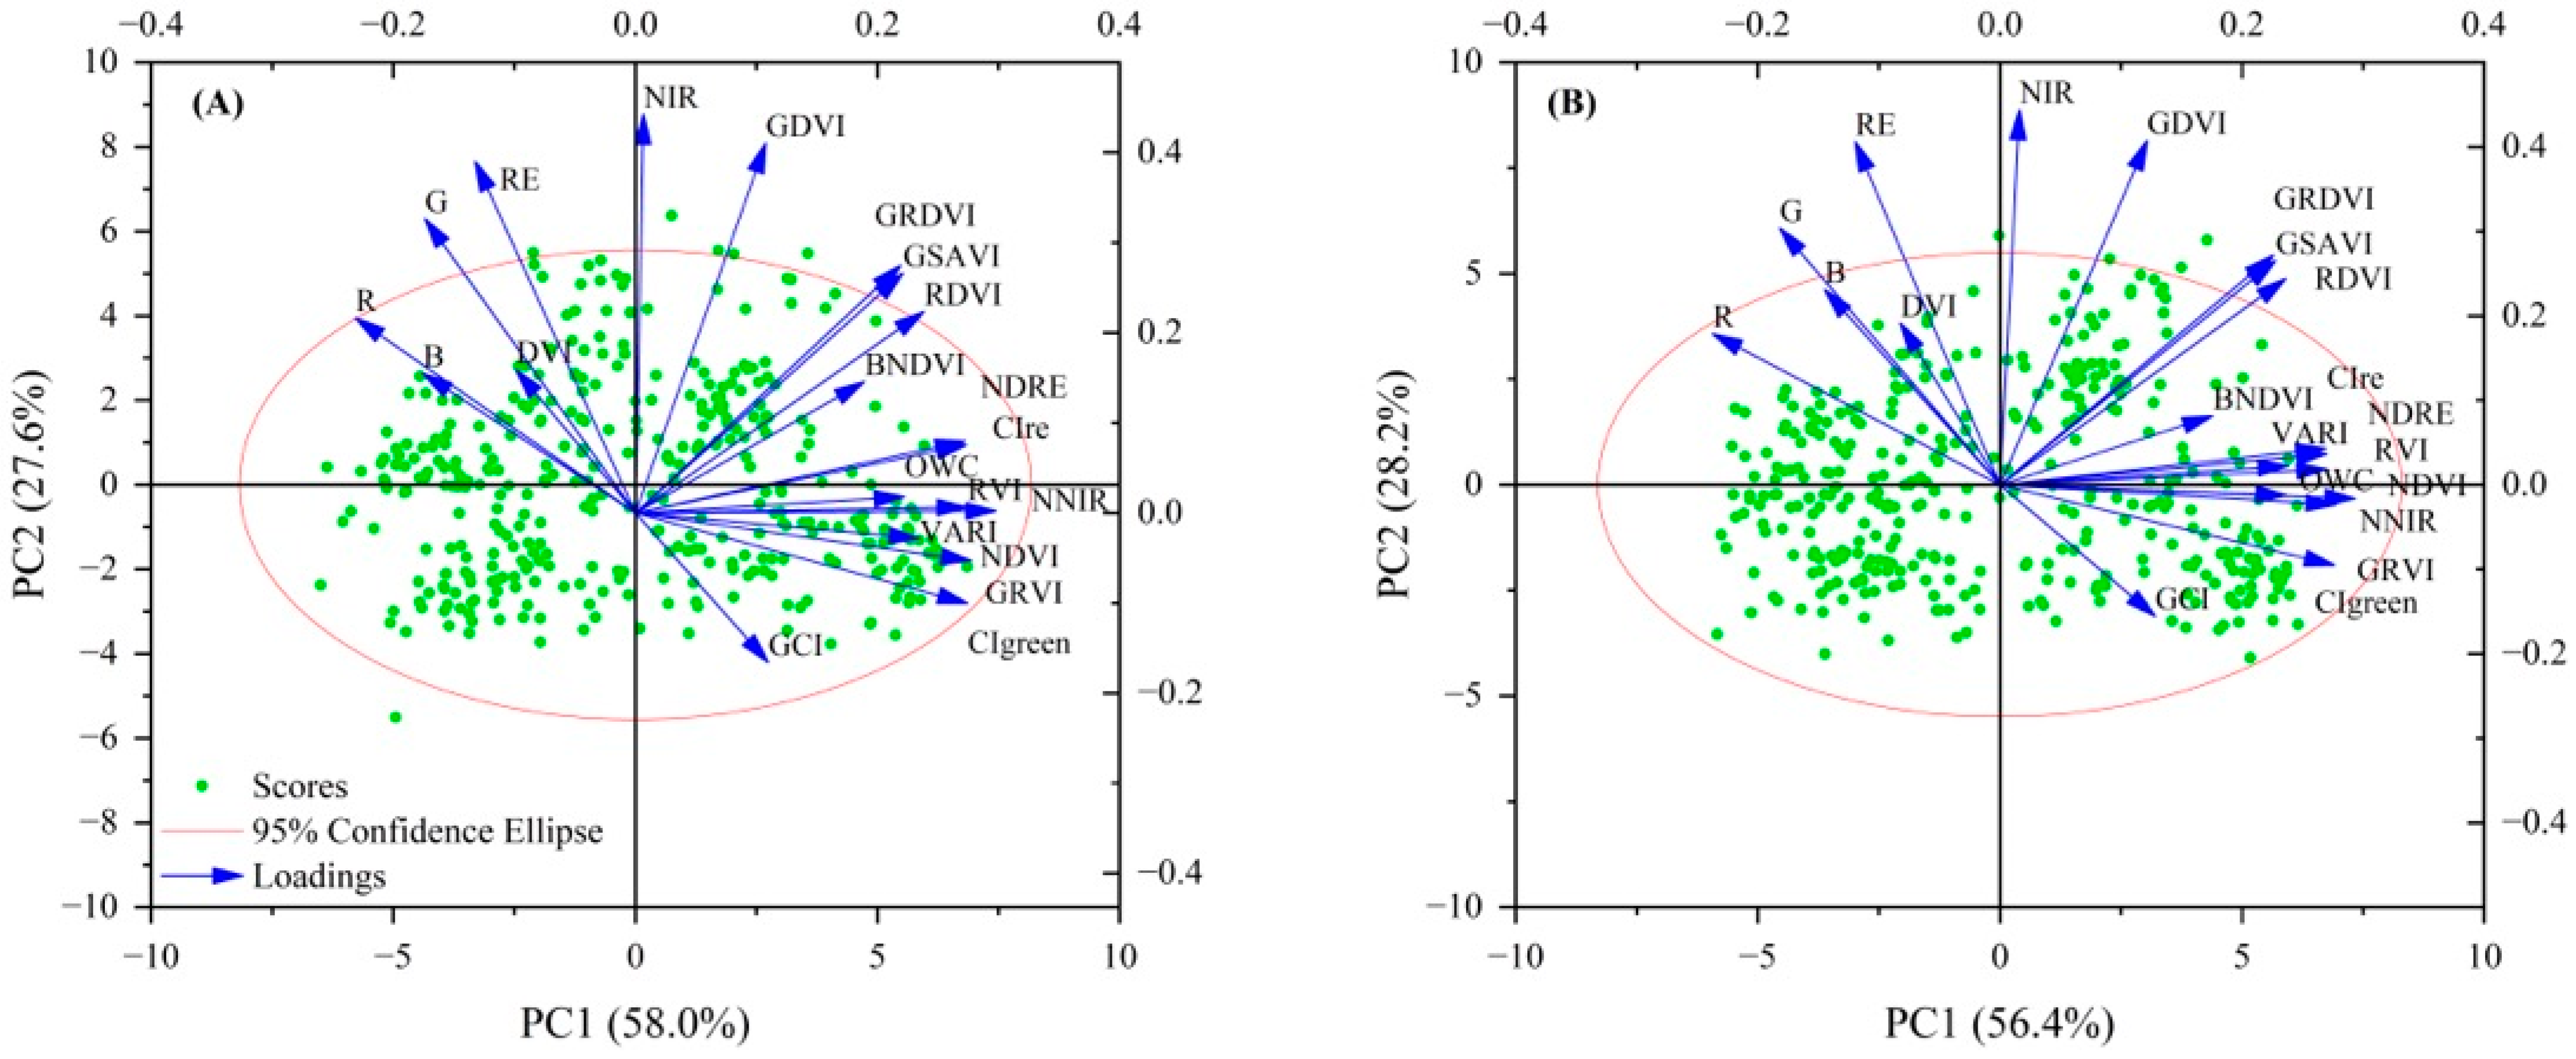
Principal component analysis (PCA) was subsequently conducted to reduce feature redundancy among the fourteen vegetation indices. The first two principal components explained 85.6% and 84.6% of the total variance in 2024 and 2025 (Figure 5), indicating that most spectral information was preserved. In 2024, RVI, NNIR, VARI, CIre, NDVI, and NDRE exhibited the strongest loadings and associations. A similar pattern was observed in 2025. Consequently, these variables were selected as representative predictors for the PCA-based modeling framework.
Figure 5.
PCA plots of oilseed rape VIs in 2024 (A) and 2025 (B) years.
Although both feature selection strategies ultimately retained similar vegetation indices, their underlying principles differ substantially. Pearson correlation analysis identifies variables with strong direct relationships to canopy water content, whereas PCA emphasizes reducing redundancy among correlated predictors. Therefore, comparing these two feature selection strategies enables an evaluation of whether dimensionality reduction can improve machine learning performance for UAV-based canopy water content estimation.
3.3. Performance of Machine Learning Models Based on Pearson Correlation and PCA
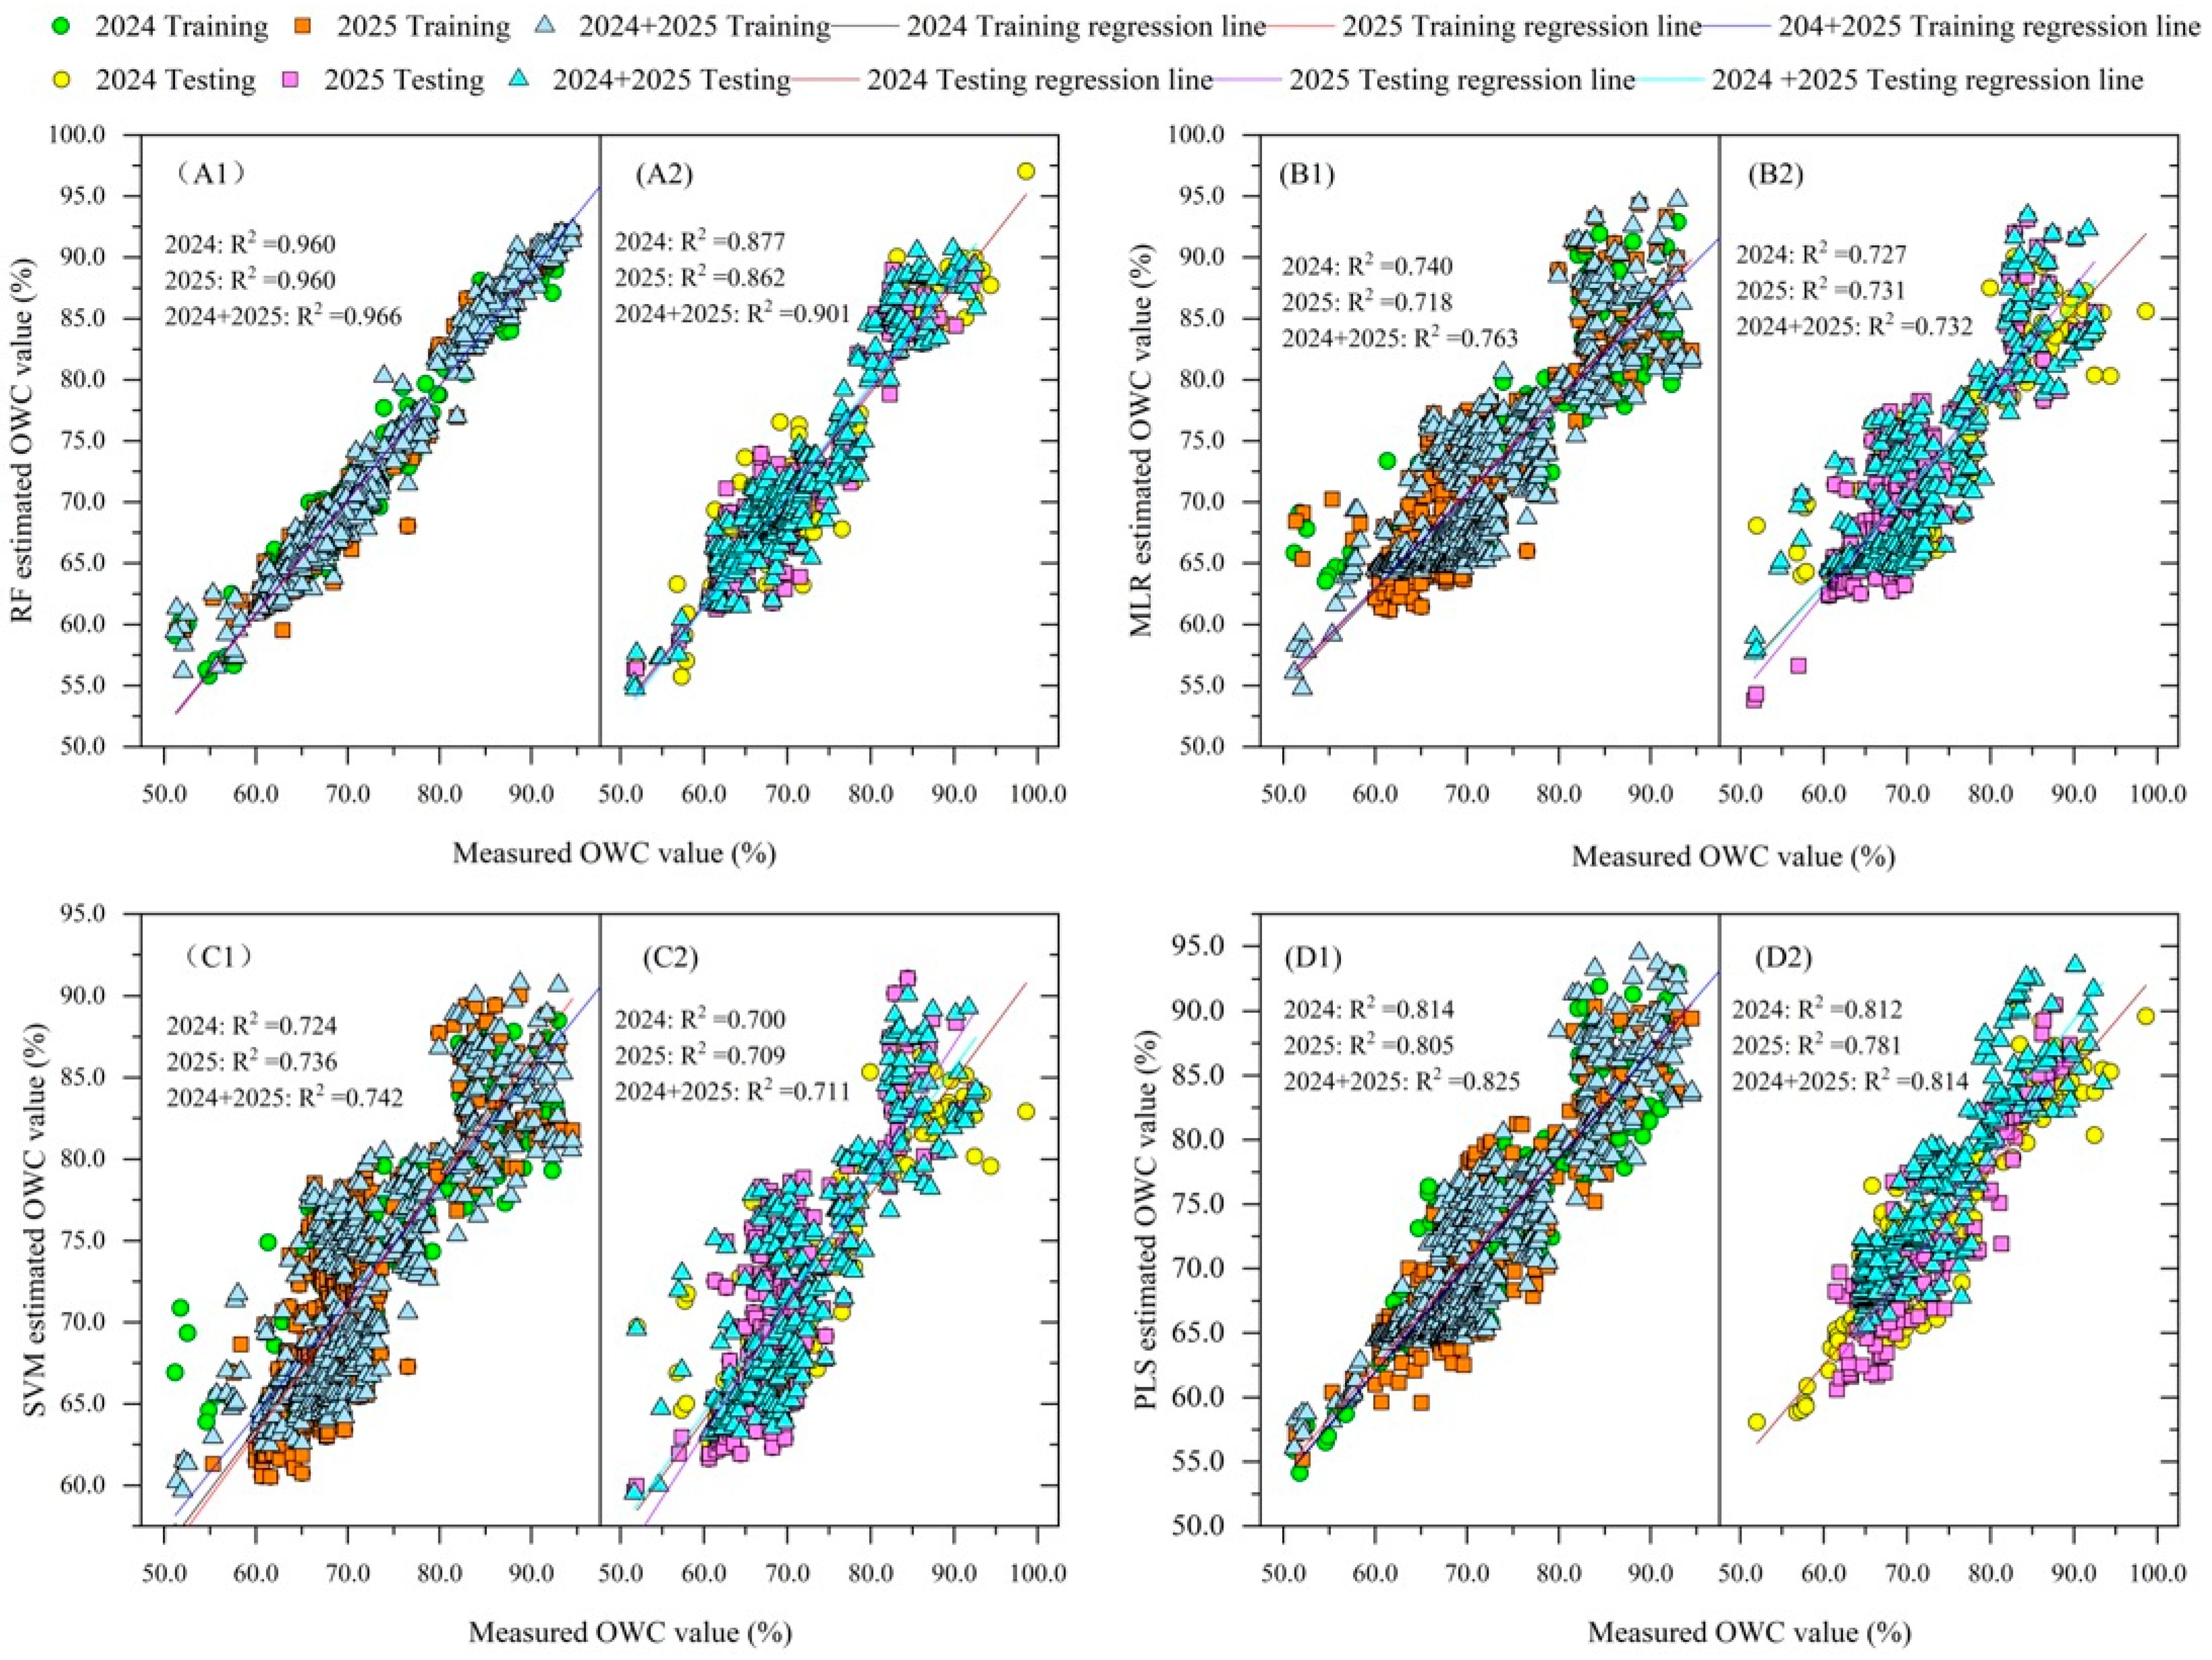
The prediction performance of the four machine learning algorithms developed using vegetation indices selected by Pearson correlation analysis is summarized in Table 5. Overall, considerable differences in model performance were observed among the four algorithms for both individual growing seasons and the combined two-year dataset. Among the evaluated algorithms, random forest (RF) consistently achieved the highest prediction accuracy. For the combined two-year dataset, the RF model produced an R2 of 0.966, RMSE of 1.734%, and RRMSE of 2.360% for the training dataset, while the corresponding testing dataset achieved an R2 of 0.901, RMSE of 2.794%, and RRMSE of 3.830%. These results indicate that RF effectively captured the nonlinear relationship between vegetation indices and canopy water content while maintaining satisfactory predictive performance for the independent testing dataset.
Table 5.
Training and testing performance of the OWC estimation models utilizing the correlation-based feature selection method.
Compared with RF, the SVM model also showed good prediction capability. However, its testing accuracy was slightly lower. In contrast, the PLS and MLR models showed lower coefficients of determination and higher prediction errors. These results indicate that linear regression methods were less effective in describing the complex relationships between multispectral vegetation indices and canopy water content. The prediction accuracy of the combined two-year dataset was generally comparable to, or slightly higher than, that of the individual annual datasets. This result suggests that integrating observations from different seasons improved model robustness. Meanwhile, it did not substantially increase the prediction errors. Overall, the results indicate that the correlation-based feature selection strategy effectively identified predictors for canopy water content estimation. This strategy showed better performance when combined with nonlinear machine learning algorithms, such as RF.
Table 6 summarizes the performance of the machine learning models developed using the PCA-based feature selection method. Overall, RF consistently achieved the best prediction performance among the four evaluated models. For the combined two-year dataset, the RF model produced the highest training accuracy, with an R2 of 0.970, an RMSE of 1.605%, and an RRMSE of 2.100%. The corresponding testing dataset also showed excellent performance (R2 = 0.878, RMSE = 3.085%, and RRMSE = 4.200%), indicating that the RF model effectively learned the relationship between the selected principal components and canopy water content while maintaining good generalization ability. Compared with RF, the remaining machine learning algorithms exhibited noticeably lower prediction accuracy. PLS ranked second, with testing R2 values ranging from 0.781 to 0.839, whereas MLR and SVM generally achieved testing R2 values between 0.743–0.776 and 0.709–0.772, respectively. These models also produced larger RMSE values than RF across all datasets.
Table 6.
Training and testing performance of the OWC estimation models utilizing the PCA-based feature selection method.
3.4. Comparison Between Correlation-Based and PCA-Based Modeling Frameworks
The correlation analysis retained three vegetation indices (NDRE, NNIR, and CIre) with absolute Pearson correlation coefficients greater than the predefined threshold. In contrast, the PCA-based approach retained six representative vegetation indices (RVI, NNIR, VARI, CIre, NDVI, and NDRE) according to the loading values of the retained principal components. Because the two feature selection methods produced different predictor sets, the resulting machine learning models exhibited different prediction performances.
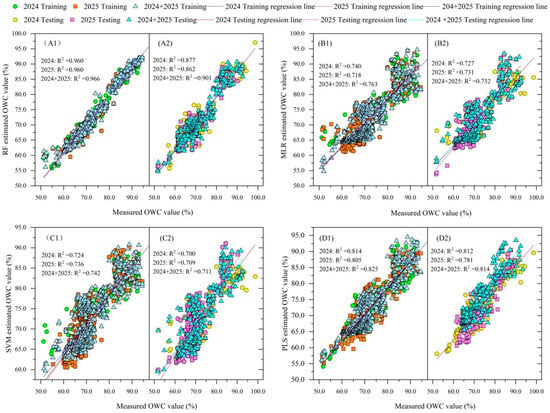
The prediction performances obtained using the two feature selection strategies are compared in Table 5 and Table 6, while the corresponding scatter plots are presented in Figure 6 and Figure 7. Overall, both Pearson correlation analysis and principal component analysis (PCA) successfully identified effective predictors for OWC estimation. The RF model consistently achieved the best performance among all machine learning algorithms, regardless of the feature selection method. This result highlights its strong ability to model nonlinear relationships between multispectral vegetation indices and crop canopy water content.
Figure 6.
Comparison of training and testing results for RF, MLR, SVM, and PLS OWC estimation models based on correlation-based feature selection. (A1,A2) represent the RF training and testing results, (B1,B2) represent the MLR training and testing results, (C1,C2) represent the SVM training and testing results, and (D1,D2) represent the PLS training and testing results.
Figure 7.
Comparison of training and testing results for RF, MLR, SVM, and PLS OWC estimation models based on PCA feature selection. (A1,A2) represent the RF training and testing results, (B1,B2) represent the MLR training and testing results, (C1,C2) represent the SVM training and testing results, and (D1,D2) represent the PLS training and testing results.
PCA effectively reduced feature redundancy and achieved competitive prediction performance. However, its advantage over correlation analysis was not consistently observed. For example, in the combined two-year dataset, the correlation-based RF model achieved slightly higher prediction accuracy than the PCA-based RF model on the independent testing dataset. This finding suggests that reducing multicollinearity alone may not always improve prediction performance.
The effectiveness of feature selection depends on both dataset characteristics and the selected machine learning algorithm. Correlation analysis directly selects variables that show strong relationships with canopy water content. In contrast, PCA mainly reduces redundancy among correlated variables. Therefore, these two methods should be considered complementary feature selection strategies rather than competing approaches. From a practical perspective, Pearson correlation analysis maintains the physical meaning of individual vegetation indices. PCA provides a more compact representation of spectral information by reducing feature redundancy. Therefore, both methods are valuable for UAV-based canopy water content estimation. The optimal method should be selected based on the modeling objective and dataset characteristics rather than assuming that one method is always superior.
4. Discussion
4.1. Physiological Interpretation of Selected Vegetation Indices
The results of this study demonstrate that vegetation indices derived from the red-edge and near-infrared bands had stronger predictive capability for canopy water content than indices based mainly on visible wavelengths. This finding is consistent with the physiological mechanisms underlying crop canopy spectral responses [5,6,7]. Canopy water content affects not only the leaf water status, but also chlorophyll concentration, mesophyll structure, and canopy architecture [39,40]. Changes in leaf water content modify internal light scattering within leaf tissues [41]. This effect is particularly evident in the near-infrared region. Changes in chlorophyll concentration also alter reflectance in the red-edge region [42]. As a result, vegetation indices that include red-edge and near-infrared bands, such as NDRE, CIre, RVI, and NNIR, are more sensitive to canopy water variation than conventional visible-band indices.
Among the selected predictors, NDRE and CIre mainly reflect changes in chlorophyll concentration and canopy photosynthetic activity [42]. These physiological characteristics are closely related to leaf hydration under field conditions. In contrast, RVI and NNIR are more sensitive to changes in leaf internal structure and multiple scattering within the canopy [43]. Both processes are affected by plant water status. Therefore, these vegetation indices provide complementary physiological information. Together, they improve canopy water content estimation. These findings also explain why selecting predictors based only on statistical correlation is insufficient. The physiological relevance of spectral variables should also be considered during feature selection. This is especially important when multiple vegetation indices are derived from the same multispectral bands.
4.2. Comparison with Previous Studies
Numerous studies have demonstrated the potential of UAV multispectral remote sensing for estimating crop water status [19,20,21]. However, reported prediction accuracies differ substantially because of differences in crop species, sensor characteristics, environmental conditions, and modeling approaches. For example, Zhang et al. [44] reported an RF-based model for estimating cotton water content using UAV multispectral imagery with an R2 of approximately 0.86, whereas Li et al. [45] obtained an R2 of 0.88 for maize using support vector regression. In the present study, the RF model developed using the combined two-year dataset achieved a testing R2 of 0.901, indicating prediction accuracy comparable to or higher than many previously published studies.
Rather than proposing a novel machine learning algorithm, the present study emphasizes a systematic comparison of feature selection strategies together with an evaluation across multiple growing seasons, thereby providing improved evidence regarding model robustness under practical field conditions. Unlike many previous studies that relied on single-season datasets, the integration of two consecutive growing seasons enabled the developed models to capture broader environmental variability. This strategy contributes to improved model generalization and may facilitate future application under similar production environments.
Unlike previous studies that mainly relied on controlled irrigation treatments to generate canopy water variability, this study quantified OWC across multiple agronomic management practices, including sowing dates, nitrogen application rates, and planting densities, thereby providing a more realistic framework for UAV-based crop water monitoring under field production conditions.
4.3. Comparison of Feature Selection Strategies and Machine Learning Algorithms
Feature selection plays an important role in machine learning. Redundant predictors can increase model complexity without improving prediction accuracy [46]. Pearson correlation analysis and principal component analysis represent two different feature selection approaches. Pearson correlation analysis directly identifies variables that are strongly related to canopy water content. It also preserves the physical meaning of individual vegetation indices. In contrast, PCA transforms correlated variables into orthogonal principal components [47]. This process reduces feature redundancy while retaining most spectral information.
The results of this study indicate that both methods successfully identified informative predictors. However, PCA did not consistently outperform correlation analysis. For the combined two-year dataset, the correlation-based RF model achieved slightly higher testing accuracy than the PCA-based RF model. This finding suggests that dimensionality reduction alone does not necessarily improve prediction performance when informative vegetation indices have already been selected.
Among the evaluated machine learning algorithms, RF consistently achieved the highest prediction accuracy. This advantage is mainly attributed to the characteristics of ensemble learning. First, RF effectively captures nonlinear relationships between multispectral vegetation indices and canopy water content. Second, bootstrap aggregation reduces prediction variance and improves model robustness. Finally, RF is relatively insensitive to multicollinearity and noise. These characteristics make it well-suited for UAV multispectral datasets. In comparison, MLR assumes linear relationships. Therefore, it cannot adequately represent the complex interactions among spectral variables. SVM also showed competitive performance. However, its prediction accuracy was slightly lower than that of RF under the present experimental conditions.
4.4. Limitations and Future Perspectives
Several limitations of this study should be acknowledged. First, all field experiments were conducted at a single experimental site. Data collected during two consecutive growing seasons improved model robustness. However, further validation across different climatic regions, soil types, and management systems is still needed before broader application. Second, canopy water content variation was generated by differences in sowing date, nitrogen application rate, and planting density, and was not produced through controlled irrigation treatments. Although these agronomic practices provided sufficient variability for model development, future studies should include controlled water-stress experiments. This would allow model performance to be evaluated under a wider range of hydrological conditions. Third, only multispectral vegetation indices were used as model predictors. Future studies could integrate thermal infrared imagery, hyperspectral data, solar-induced chlorophyll fluorescence, and LiDAR-derived canopy structural information. These data sources may improve prediction accuracy by providing complementary information on crop water status. Finally, deep learning has shown promising performance in agricultural remote sensing in recent years. However, the dataset used in this study was relatively small, containing 724 samples. Deep learning models usually require much larger datasets. Larger datasets help achieve stable performance and reduce the risk of overfitting. Therefore, conventional machine learning algorithms were considered more suitable for the present study. Future research will investigate deep learning approaches, including convolutional neural networks and Transformer-based models, using larger datasets collected from multiple sites.
Specifically, we now explain that UAV-estimated OWC can serve as an indicator of crop water status and help identify spatial and temporal variability in crop water conditions. When combined with meteorological information, soil moisture observations, crop growth stage, and crop water balance models, the estimated OWC can support irrigation scheduling by identifying areas or periods where water stress is likely to occur. We have also clarified that the proposed approach is intended to provide decision support for precision irrigation rather than directly estimating irrigation requirements.
The proposed modeling framework is not limited to oilseed rape. It has the potential to be extended to other crops when appropriate calibration datasets are available. The general workflow includes UAV multispectral image acquisition, vegetation index extraction, feature selection, and machine learning modeling. This workflow is applicable to many field crops, such as wheat, maize, rice, soybean, and cotton. However, canopy architecture, spectral characteristics, and water distribution vary among crop species. Therefore, the selected vegetation indices and model parameters should be optimized and validated for each crop before practical application.
5. Conclusions
UAV multispectral imagery provides an effective and non-destructive approach for estimating OWC. The selected vegetation indices successfully captured variations in canopy water status throughout the reproductive growth period. This result demonstrates the potential of UAV-based multispectral remote sensing for field-scale crop water monitoring. Both Pearson correlation analysis and principal component analysis effectively identified informative spectral predictors for OWC estimation. Neither method consistently outperformed the other. This finding indicates that their performance depends on both dataset characteristics and the selected machine learning algorithm. Among the evaluated models, RF consistently achieved the highest prediction accuracy. The correlation-based RF model developed using the combined two-year dataset showed the best overall performance. Integrating datasets from two consecutive growing seasons also improved model robustness. Overall, this study demonstrates that combining appropriate feature selection with robust machine learning algorithms enables accurate OWC estimation using UAV multispectral imagery. Future research should validate the proposed framework across multiple locations, climatic regions, and management systems. This will further improve the accuracy and generalization capability of crop water status monitoring.
Author Contributions
Conceptualization, H.H. and S.H.; methodology, W.M., H.Z., A.Z., J.L. and K.Z.; software, H.Z., W.M., J.L. and D.L.; validation, D.L., K.Z., A.Z. and Z.Z.; formal analysis, H.H., Z.Z. and W.M.; resources, D.L., A.Z., J.L. and S.H.; data curation, H.H. and S.H.; writing—original draft preparation, H.H.; writing—review and editing, S.H. and H.H. All authors have read and agreed to the published version of the manuscript.
Funding
This research was financially supported by the Application of Low-Loss Harvesting Equipment for Rapeseed in Hilly and Mountainous Areas of China (Granted No.: Zhenongjifa[2025]2), Modern Agriculture Research System of China (Granted No.: CARS12), and the National Key Research and Development Program of China (Granted No.: 2024YFD12004002).
Data Availability Statement
The original contributions of this work are presented within this article. Further questions should be directed to the corresponding author.
Conflicts of Interest
The authors declare no conflicts of interest.
References
- Ievinsh, G. Water content of plant tissues: So simple that almost forgotten? Plants 2023, 12, 1238. [Google Scholar] [CrossRef] [Scilit] [PubMed]
- Zhang, F.; Zhou, G. Estimation of vegetation water content using hyperspectral vegetation indices: A comparison of crop water indicators in response to water stress treatments for summer maize. BMC Ecol. 2019, 19, 18. [Google Scholar] [CrossRef] [Scilit] [PubMed]
- Farooq, M.; Wahid, A.; Kobayashi, N.; Fujita, D.; Basra, S.M.A. Plant drought stress: Effects, mechanisms and management. Agron. Sustain. Dev. 2009, 29, 185–212. [Google Scholar] [CrossRef] [Scilit]
- Osakabe, Y.; Osakabe, K.; Shinozaki, K.; Tran, L.S. Response of plants to water stress. Front. Plant Sci. 2014, 5, 86. [Google Scholar] [CrossRef] [Scilit] [PubMed]
- Sims, D.A.; Gamon, J.A. Estimation of vegetation water content and photosynthetic tissue area from spectral reflectance: A comparison of indices based on liquid water and chlorophyll absorption features. Remote Sens. Environ. 2003, 84, 526–537. [Google Scholar] [CrossRef] [Scilit]
- Li, H.; Yang, W.; Lei, J.; She, J.; Zhou, X. Estimation of leaf water content from hyperspectral data of different plant species by using three new spectral absorption indices. PLoS ONE 2021, 16, e0249351. [Google Scholar] [CrossRef] [Scilit] [PubMed]
- Quemada, C.; Pérez-Escudero, J.M.; Gonzalo, R.; Ederra, I.; Santesteban, L.G.; Torres, N.; Iriarte, J.C. Remote sensing for plant water content monitoring: A review. Remote Sens. 2021, 13, 2088. [Google Scholar] [CrossRef] [Scilit]
- Atzberger, C. Advances in remote sensing of agriculture: Context description, existing operational monitoring systems and major Information needs. Remote Sens. 2013, 5, 949–981. [Google Scholar] [CrossRef] [Scilit]
- Xue, J.; Su, B. Significant remote sensing vegetation indices: A review of developments and applications. J. Sens. 2017, 2017, 1353691. [Google Scholar] [CrossRef] [Scilit]
- Kiranmai, Y.; Potdar, M.P.; Biradar, D.P.; Kuligod, V.B.; Kanade, A.K.; Parmar, B.; Malunjkar, V. Moisture stress assessment in rabi maize through UAV-mounted multispectral sensor. Front. Environ. Sci. 2025, 13, 1651422. [Google Scholar] [CrossRef] [Scilit]
- Yang, X.; Chen, J.; Lu, X.; Liu, H.; Liu, Y.; Bai, X.; Qian, L.; Zhang, Z. Advances in UAV remote sensing for monitoring crop water and nutrient status: Modeling methods, influencing factors, and challenges. Plants 2025, 14, 2544. [Google Scholar] [CrossRef] [Scilit] [PubMed]
- Mowla, M.N.; Mowla, N.; Chowdhury, S.R.; Rabie, K.M.; Shongwe, T. Unmanned aerial vehicles (UAVs) for smart agriculture with machine learning: A system-oriented review of methods, applications, and challenges. Smart Agric. Technol. 2026, 13, 101880. [Google Scholar] [CrossRef] [Scilit]
- Sharma, H.; Sidhu, H.; Bhowmik, A. Remote sensing using unmanned aerial vehicles for water stress detection: A review focusing on specialty crops. Drones 2025, 9, 241. [Google Scholar] [CrossRef] [Scilit]
- Zhang, S.; Wang, X.; Lin, H.; Dong, Y.; Qiang, Z. A review of the application of UAV multispectral remote sensing technology in precision agriculture. Smart Agric. Technol. 2025, 12, 101406. [Google Scholar] [CrossRef] [Scilit]
- Zhang, Y.; Wang, P.; Li, Y.; Han, D.; Wu, D.; Liu, S.; Guo, J. A quantification method for cumulative drought effects on summer maize yield incorporating recovery dynamics based on vegetation water index. Agric. Water Manag. 2025, 320, 109865. [Google Scholar] [CrossRef] [Scilit]
- Abdelbaki, A.; Udelhoven, T. A review of hybrid approaches for quantitative assessment of crop traits using optical remote sensing: Research trends and future directions. Remote Sens. 2022, 14, 3515. [Google Scholar] [CrossRef] [Scilit]
- Ndour, A.; Blasch, G.; Valente, J.; Gebrekidan, B.H.; Sida, T.S. Optimal machine learning algorithms and UAV multispectral imagery for crop phenotypic trait estimation: A comprehensive review and meta-analysis. Environ. Res. Commun. 2025, 7, 072002. [Google Scholar] [CrossRef] [Scilit]
- Li, X.; Zhu, B.; Li, S.; Liu, L.; Song, K.; Liu, J. A comprehensive review of crop chlorophyll mapping using remote sensing approaches: Achievements, limitations, and future perspectives. Sensors 2025, 25, 2345. [Google Scholar] [CrossRef] [Scilit] [PubMed]
- Yang, N.; Zhang, Z.; Yang, X.; Dong, N.; Xu, Q.; Chen, J.; Sun, S.; Cui, N.; Ning, J. Evaluation of crop water status using UAV-based images data with a model updating strategy. Agric. Water Manag. 2025, 312, 109445. [Google Scholar] [CrossRef] [Scilit]
- Jia, S.; Cui, M.; Chen, L.; Guo, S.; Zhang, H.; Bai, Z.; Li, Y.; Deng, L.; Li, F.; Zhang, W. Soybean water monitoring and water demand prediction in arid region based on UAV multispectral data. Agronomy 2024, 15, 88. [Google Scholar] [CrossRef] [Scilit]
- Efrat, N.; Dubinin, V.; Baram, S.; Paz-Kagan, T. Modeling seasonal water status and predicting yield in almond orchards using UAV multi-sensor and meteorological data. Agric. Water Manag. 2025, 320, 109868. [Google Scholar] [CrossRef] [Scilit]
- Abbatantuono, F.; Lopriore, G.; Tallou, A.; Brillante, L.; Ali, S.A.; Camposeo, S.; Vivaldi, G.A. Recent progress on grapevine water status assessment through remote and proximal sensing: A review. Sci. Hortic. 2024, 338, 113658. [Google Scholar] [CrossRef] [Scilit]
- Wang, Y.; Wang, J.; Li, J.; Wang, J.; Xu, H.; Liu, T.; Wang, J. Estimating maize leaf water content using machine learning with diverse multispectral image features. Plants 2025, 14, 973. [Google Scholar] [CrossRef] [Scilit] [PubMed]
- Yu, X.; Qian, L.; Chen, K.; Ye, S.; Yin, Q.; Shao, L.; Ran, D.; Wang, W.e.; Zhang, B.; Hu, X. Estimating winter wheat leaf Water content by combining UAV spectral and texture features with stacking ensemble learning. Agronomy 2025, 15, 2610. [Google Scholar] [CrossRef] [Scilit]
- Gitelson, A.A.; Viña, A.; Ciganda, V.; Rundquist, D.C.; Arkebauer, T.J. Remote estimation of canopy chlorophyll content in crops. Geophys. Res. Lett. 2005, 32, L08403. [Google Scholar] [CrossRef] [Scilit]
- Jordan, C.F. Derivation of leaf-area Index from quality of light on the forest floor. Ecology 1969, 50, 663–666. [Google Scholar] [CrossRef] [Scilit]
- Zhang, T.; Guan, H.; Ma, X.; Shen, P. Drought recognition based on feature extraction of multispectral images for the soybean canopy. Ecol. Inform. 2023, 77, 102248. [Google Scholar] [CrossRef] [Scilit]
- Trentin, C.; Ampatzidis, Y.; Tasioulas, S.; Tsouvaltzis, P. Optimizing tomato yield prediction using phenologically timed UAV-based spectral data and machine learning. Smart Agric. Technol. 2025, 12, 101158. [Google Scholar] [CrossRef] [Scilit]
- Sripada, R.P.; Heiniger, R.W.; White, J.G.; Weisz, R. Aerial color infrared photography for determining late-season nitrogen requirements in corn. Agron. J. 2005, 97, 1443–1451. [Google Scholar] [CrossRef] [Scilit]
- Tucker, C.J. Red and photographic infrared linear combinations for monitoring vegetation. Remote Sens. Environ. 1979, 8, 127–150. [Google Scholar] [CrossRef] [Scilit]
- Yin, H.; Huang, W.; Li, F.; Yang, H.; Li, Y.; Hu, Y.; Yu, K. Multi-temporal UAV imaging-based mapping of chlorophyll content in potato crop. PFG-J. Photogramm. Remote Sens. Geoinf. Sci. 2022, 91, 91–106. [Google Scholar] [CrossRef] [Scilit]
- Zaigham Abbas Naqvi, S.M.; Awais, M.; Khan, F.S.; Afzal, U.; Naz, N.; Khan, M.I. Unmanned air vehicle based high resolution imagery for chlorophyll estimation using spectrally modified vegetation indices in vertical hierarchy of citrus grove. Remote Sens. Appl. Soc. Environ. 2021, 23, 100596. [Google Scholar] [CrossRef] [Scilit]
- Schneider, P.; Roberts, D.A.; Kyriakidis, P.C. A VARI-based relative greenness from MODIS data for computing the Fire Potential Index. Remote Sens. Environ. 2008, 112, 1151–1167. [Google Scholar] [CrossRef] [Scilit]
- Hassan, M.A.; Yang, M.; Rasheed, A.; Yang, G.; Reynolds, M.; Xia, X.; Xiao, Y.; He, Z. A rapid monitoring of NDVI across the wheat growth cycle for grain yield prediction using a multi-spectral UAV platform. Plant Sci. 2019, 282, 95–103. [Google Scholar] [CrossRef] [Scilit] [PubMed]
- Novo, A.; Fernández, C.; Míguez, C.; Suárez-Vidal, E. Analysing the capacity of multispectral indices to map the spatial distribution of potential post-fire soil losses based on soil burn severity. Ecol. Inform. 2024, 83, 102793. [Google Scholar] [CrossRef] [Scilit]
- Sripada, R.P.; Heiniger, R.W.; White, J.G.; Meijer, A.D. Aerial color infrared photography for determining early in-season nitrogen requirements in corn. Agron. J. 2006, 98, 968–977. [Google Scholar] [CrossRef] [Scilit]
- Zhang, C.; Chen, Z.; Chen, R.; Zhang, W.; Zhao, D.; Yang, G.; Xu, B.; Feng, H.; Yang, H. Retrieving the chlorophyll content of individual apple trees by reducing canopy shadow impact via a 3D radiative transfer model and UAV multispectral imagery. Plant Phenomics 2025, 7, 100015. [Google Scholar] [CrossRef] [Scilit] [PubMed]
- Gitelson, A.A.; Gritz, Y.; Merzlyak, M.N. Relationships between leaf chlorophyll content and spectral reflectance and algorithms for non-destructive chlorophyll assessment in higher plant leaves. J. Plant Physiol. 2003, 160, 271–282. [Google Scholar] [CrossRef] [Scilit] [PubMed]
- Sharma, S.; Bhatt, U.; Sharma, J.; Kalaji, H.M.; Mojski, J.; Soni, V. Ultrastructure, adaptability, and alleviation mechanisms of photosynthetic apparatus in plants under waterlogging: A review. Photosynthetica 2022, 60, 430–444. [Google Scholar] [CrossRef] [Scilit] [PubMed]
- Niinemets, U. Variation in leaf photosynthetic capacity within plant canopies: Optimization, structural, and physiological constraints and inefficiencies. Photosynth. Res. 2023, 158, 131–149. [Google Scholar] [CrossRef] [Scilit] [PubMed]
- Gao, Y.; Tang, B.; Lu, B.; Ji, G.; Ye, H. Investigation on the effects of water loss on the solar spectrum reflectance and transmittance of Osmanthus fragrans leaves based on optical experiment and PROSPECT model. RSC. Adv. 2021, 11, 37268–37275. [Google Scholar] [CrossRef] [Scilit] [PubMed]
- Zeng, Y.; Hao, D.; Huete, A.; Dechant, B.; Berry, J.; Chen, J.M.; Joiner, J.; Frankenberg, C.; Bond-Lamberty, B.; Ryu, Y.; et al. Optical vegetation indices for monitoring terrestrial ecosystems globally. Nat. Rev. Earth Environ. 2022, 3, 477–493. [Google Scholar] [CrossRef] [Scilit]
- Wu, S.; Zeng, Y.; Hao, D.; Liu, Q.; Li, J.; Chen, X.; Asrar, G.R.; Yin, G.; Wen, J.; Yang, B.; et al. Quantifying leaf optical properties with spectral invariants theory. Remote Sens. Environ. 2021, 253, 112131. [Google Scholar] [CrossRef] [Scilit]
- Zhang, S.; Jing, H.; Dong, J.; Su, Y.; Hu, Z.; Bao, L.; Fan, S.; Sarsen, G.; Lin, T.; Jin, X. Accurate estimation of plant water content in cotton using UAV multi-source and multi-stage data. Drones 2025, 9, 163. [Google Scholar] [CrossRef] [Scilit]
- Li, D.; Yu, W.; Zheng, H.; Guo, C.; Yao, X.; Zhu, Y.; Cao, W.; Cheng, T. Towards practical semi-empirical models for the estimation of leaf and canopy water contents from hyperspectral reflectance. Comput. Electron. Agric. 2023, 214, 108309. [Google Scholar] [CrossRef] [Scilit]
- van Dijk, A.D.J.; Kootstra, G.; Kruijer, W.; de Ridder, D. Machine learning in plant science and plant breeding. iScience 2021, 24, 101890. [Google Scholar] [CrossRef] [Scilit] [PubMed]
- Lever, J.; Krzywinski, M.; Altman, N. Principal component analysis. Nat. Methods 2017, 14, 641–642. [Google Scholar] [CrossRef] [Scilit]

Disclaimer/Publisher’s Note: The statements, opinions and data contained in all publications are solely those of the individual author(s) and contributor(s) and not of MDPI and/or the editor(s). MDPI and/or the editor(s) disclaim responsibility for any injury to people or property resulting from any ideas, methods, instructions or products referred to in the content. |
© 2026 by the authors. Licensee MDPI, Basel, Switzerland. This article is an open access article distributed under the terms and conditions of the Creative Commons Attribution (CC BY) license.