


Highlights
What are the main findings?
- Four-season Sentinel-1/2 and topographic feature fusion achieved the best estimation performance for Richness, Shannon, and Gini–Simpson, with optimal R2 values of 0.51, 0.63, and 0.57, respectively.
- Sentinel-2 optical features were the primary information source for tree species diversity estimation, while Sentinel-1 radar features and topographic variables provided complementary structural and environmental information.
What are the implications of the main findings?
- Multi-season remote sensing features can capture phenological differences among tree species, reducing spectral confusion and improving biodiversity estimation in complex temperate mixed forests.
- The framework combining Boruta feature selection, multi-source satellite data, and machine learning provides a practical approach for regional tree species diversity mapping and precision forest management.
Abstract
Accurate estimation of forest tree species diversity at regional scales is essential for biodiversity monitoring, forest resource management, and ecological conservation. Because tree species differ in canopy spectral responses and phenological dynamics, multi-season remote sensing observations can provide critical information for characterizing species composition and diversity patterns. However, the potential contribution of seasonal image features to improving remote-sensing-based tree species diversity estimation has often been insufficiently considered. In this study, the Yichun forest region in Heilongjiang Province, northeastern China, was selected as the study area. Sentinel-1, Sentinel-2, and topographic data were integrated to extract multi-seasonal spectral, vegetation index, texture, radar, and topographic features. The Boruta algorithm was used for feature selection, and random forest (RF), extreme gradient boosting (XGBoost), k-nearest neighbor (KNN), support vector regression (SVR), Bayesian regularized neural network (BRNN), and Stacking ensemble learning were developed to estimate and map Richness, Shannon, and Gini–Simpson indices. The results showed that: (1) Sentinel-2 optical features were the primary information source for tree species diversity estimation, topographic factors further improved model performance, and Sentinel-1 radar features mainly provided complementary structural information; (2) seasonal remote sensing features differed in their predictive ability, with Richness performing better in spring, while Shannon and Gini–Simpson achieved higher accuracy in winter. The four-season fusion scenario produced the highest accuracy for all three indices, with optimal R2 values of 0.51, 0.63, and 0.57, respectively; (3) the Stacking ensemble generally improved estimation accuracy and model stability, although the optimal model differed among diversity indices, with Stacking, SVR, and RF performing best for Richness, Shannon, and Gini–Simpson, respectively; and (4) summer Sentinel-2 NDVI, GNDVI, and NDWI contributed strongly to all three indices, elevation was particularly important for Richness, and winter vegetation indices and autumn red-edge bands and texture features were also informative for Shannon and Gini–Simpson. These findings indicate that integrating multi-seasonal remote sensing features and multi-source data using machine learning models can effectively improve forest tree species diversity estimation, providing technical support for regional forest biodiversity monitoring and precision forest management.
1. Introduction
Rich forest biodiversity is fundamental for maintaining ecosystem stability, productivity, and multifunctionality [1]. It includes tree, shrub, herbaceous, bryophyte, and fungal diversity, as well as structural complexity associated with multilayered canopies and mixed species composition [2]. As a key component of forest biodiversity, tree species diversity directly reflects forest community composition, structural complexity, and ecosystem stability [3]. Accurate assessment of large-scale patterns of tree species diversity at regional or landscape scales is therefore essential for understanding forest ecosystem dynamics, developing biodiversity conservation strategies, and supporting precision forest management [4]. However, conventional biodiversity assessments rely heavily on intensive field plot surveys [5]. Although such surveys provide high accuracy, they are costly, time-consuming, and difficult to implement continuously across large and complex forest landscapes. These limitations constrain regional-scale biodiversity monitoring and forest management decision-making [6].
Satellite remote sensing provides a reliable approach for continuous biodiversity monitoring owing to its large-area coverage, non-destructive observation, and repeated acquisition capability [7,8]. Among available satellite data sources, Sentinel-2 multispectral imagery is freely accessible and offers broad spatial coverage with relatively high spatial and temporal resolution. It can capture interspecific differences in chlorophyll content, water status, canopy reflectance, and phenological dynamics, thereby providing two-dimensional spectral information on forest canopies [9,10]. In contrast, Sentinel-1 synthetic aperture radar (SAR), based on C-band microwave penetration and backscattering mechanisms, is more sensitive to three-dimensional physical structural attributes, such as canopy surface roughness, branch and stem structure, and internal scattering differences within forest layers [11]. These two data sources are highly complementary in terms of information representation: Sentinel-2 primarily characterizes canopy spectral and physiological properties, whereas Sentinel-1 provides additional information on stand structure and scattering characteristics. Furthermore, topographic variables capture gradients in solar radiation, thermal conditions, moisture availability, and habitat associated with elevation, slope, and aspect. These environmental gradients shape tree species distributions and community composition while providing critical contextual constraints for interpreting remote sensing-derived spectral and structural signals [12]. Accordingly, integrating Sentinel-1, Sentinel-2, and topographic variables enables a comprehensive characterization of forest canopy conditions and associated habitat characteristics from spectral, structural, and environmental perspectives, thereby providing a more complete observational basis for estimating tree species diversity in complex forest environments.
Previous studies have demonstrated the potential of multitemporal Sentinel imagery for estimating tree species diversity [9,13,14]. For example, Chrysafis et al. [15] integrated multi-season Sentinel-2 spectral information with geodiversity variables to predict forest tree species diversity, showing that both seasonal spectral information and environmental heterogeneity associated with topography and geology contributed to diversity estimation. Liu et al. [16] further integrated Sentinel-1, Sentinel-2, and topographic data to map tree species diversity in temperate montane forests and compared the effects of different sensors, phenological stages, and image heterogeneity metrics on mapping accuracy. Collectively, these studies provide an important foundation for applying multi-season observations and multisource remote sensing data to tree species diversity estimation. However, the relative contributions of different seasonal combinations, data source configurations, and modeling algorithms to the estimation accuracy of individual tree species diversity indices remain to be systematically evaluated.
In dense forest ecosystems, canopies are typically highly developed during the growing season, particularly in summer, which may lead to saturation of optical signals. Meanwhile, leaf structure, chlorophyll content, and canopy reflectance among tree species tend to become more similar, resulting in pronounced spectral confusion and increasing the difficulty of tree species discrimination and diversity estimation [17]. In fact, different tree species exhibit distinct phenological rhythms, such as subtle differences in leaf emergence, flowering, senescence, and leaf fall, which can be captured in remote sensing imagery as identifiable spectral dynamics [14,18]. For example, differences in the timing of spring leaf-out, autumn pigment changes, and asynchronous leaf fall can cause non-synchronous variations in biochemical composition and canopy status among species, forming discriminative temporal–spectral response trajectories in multi-temporal imagery [19]. Therefore, incorporating multi-seasonal remote sensing features introduces a critical temporal dimension into tree species diversity estimation. This approach can help alleviate spectral confusion in single-date imagery, enhance interspecific separability, and improve the accuracy and robustness of tree species diversity estimation in complex forest environments [20].
Meanwhile, although multi-seasonal and multi-source remote sensing features provide richer information for estimating tree species diversity, they also create high-dimensional feature spaces characterized by variable redundancy and complex nonlinear relationships. To address these challenges, Kursa and Rudnicki [21] developed Boruta, a random forest-based feature selection algorithm designed to identify all relevant variables in high-dimensional feature spaces while accommodating nonlinearity and interactions among predictors. Moreover, conventional empirical models and individual machine learning algorithms are often constrained by model architecture and sample size when handling such complex features, potentially limiting their spatial generalizability [22]. To overcome this methodological limitation, the Stacking ensemble learning framework offers considerable potential [23]. Through a meta learner, Stacking systematically integrates predictions from multiple heterogeneous base learners and leverages their complementary strengths in capturing complex nonlinear relationships [24], thereby enhancing model robustness and reducing dependence on any single model architecture [25].
Building on this background, this study developed a forest tree species diversity estimation framework that integrates multi-seasonal remote sensing features with machine learning algorithms. The study was conducted in a northern temperate mixed coniferous–broadleaf forest in the Xiaoxing’an Mountains, northeastern China. Field plot surveys provided ground-based observations of tree species composition and diversity, while multi-seasonal Sentinel-1/2 imagery and topographic features were used as remote sensing predictors for estimating tree species diversity across the study area. Tree species diversity was quantified using three complementary indices: Richness, Shannon, and Gini–Simpson [26]. The effects of different seasonal combinations, data source combinations, and modeling algorithms on estimation accuracy were then systematically evaluated. The objectives of this study were threefold: (1) compare the roles of Sentinel-1, Sentinel-2, topographic factors, and their combinations in estimating tree species diversity, and clarify the contribution of different data sources to remote sensing characterization of diversity patterns; (2) quantify the effects of seasonal remote sensing features and four-season fusion on estimation accuracy, and assess the relative importance of multi-seasonal image features for different diversity indices; and (3) to evaluate different modeling approaches, identify the most suitable model and predictor set for each diversity index, and map the spatial variation in tree species diversity across the study area. The findings are expected to support regional forest biodiversity assessment and remote sensing-based precision forest management.
2. Materials and Methods
2.1. Study Area
The study site lies within the northeastern forest belt of China and is administratively located in Yichun City, Heilongjiang Province (Figure 1), with an area of approximately 1.36 × 10⁵ ha. This region is governed by a northern temperate continental monsoon climate, with an average annual temperature of about 1 °C and annual precipitation ranging from 750 to 820 mm [27]. Summers are short and mild, whereas winters are long and cold, with snow cover generally persisting for 5 to 6 months [28]. Elevation ranges from 81 to 1043 m, with relatively high terrain in the southwest and northeast and lower elevations distributed in the southeast and northwest. The soil is mainly dark brown forest soil, meadow soil, and swamp soil [29]. The region is characterized by dense forest vegetation and rich tree species composition. Dominant and common species include Pinus koraiensis Siebold, Larix gmelinii Kuzen., Picea asperata Mast., Abies fabri Craib, Populus davidiana Dode, Betula costata, Juglans mandshurica Maxim., and Fraxinus mandshurica Rupr [30]. Based on forest management inventory data, the study area is dominated by natural forests, which account for 93.44% of the total forest area, whereas plantations account for 6.56%. Field surveys and recent silvicultural treatment plans indicated that forest quality enhancement treatments were implemented in 2023, with a planned treatment area of approximately 2353.62 ha. These treatments primarily comprised growth thinning and integrated thinning, supplemented by shrub removal, weeding, and pruning. The prescribed removal intensities were approximately 14.2% by stem number and 7.8% by stand volume.
Figure 1.
Location of the study area with sample plot distributions.
2.2. Data Acquisition and Preprocessing
2.2.1. Field Plot Data Collection
Fieldwork was carried out from mid-September to mid-October 2024. A total of 145 square plots, each covering 0.0667 ha, were established to represent the main forest types and stand conditions within the study area. For each plot, the coordinates of the four plot corners were recorded. A full tree census was then performed, in which every individual tree with diameter at breast height (DBH) ≥ 5 cm was identified to species and its DBH was measured. In total, 10,090 individual trees belonging to 39 species were documented.
The dominant species included Pinus koraiensis Siebold (2284 individuals), Picea asperata Mast. (1905), Larix gmelinii Kuzen. (1701), Betula platyphylla Sukaczev (764), Abies fabri Craib (639), Tilia spp. (495), Betula costata Trautv. (489), Quercus mongolica Fisch. ex Ledeb. (277), Acer mono Maxim. (231), Ulmus spp. (209), Fraxinus mandshurica Rupr. (181), and Betula dahurica Pall. (159), in addition to 90 individuals of other coniferous species and 666 individuals of other broadleaf species. The proportions of the dominant tree species are shown in Figure 2b.
Figure 2.
Distribution of plot-level tree species diversity indices and composition of dominant tree species: (a) boxplots of species richness, Shannon index, and Gini–Simpson index across field plots; (b) proportional composition of dominant tree species.
2.2.2. Tree Species Diversity Indices
Based on the field survey data, species richness (Richness), the basal-area-weightedShannon diversity index (Shannon), and the basal-area-weighted Gini–Simpson diversity index (Gini–Simpson) were calculated to characterize tree species diversity at the plot scale [31,32]. These indices were selected to describe different aspects of tree species diversity. Richness represents the number of tree species within each plot [33], Shannon reflects species richness and the evenness of basal area distribution among species [34], whereas Gini–Simpson quantifies the probability that two randomly selected units of basal area are contributed by different species [35]. For each plot, the relative abundance of each species was calculated using the proportion of basal area contributed by that species. The total basal area of each species integrates information on both stem abundance and individual tree size and is commonly used to quantify structural dominance within forest communities [36,37,38]. Accordingly, weighting species by their proportional basal area characterizes tree species diversity in terms of their relative contributions to stand structure and the distribution of dominance among species. The distributions of Richness, Shannon, and Gini–Simpson across all plots are shown in Figure 2a. The indices were calculated as follows:
where denotes the number of tree species within a plot, and represents the proportion of basal area of the -th tree species relative to the total basal area of all trees in the plot.
2.2.3. Multi-Source Satellite Remote Sensing Data
Sentinel-1 SAR and Sentinel-2 multispectral data were obtained from the Google Earth Engine (GEE) platform to construct the multi-source satellite feature set. To capture seasonal variations in the spectral and structural properties of forest canopies, both optical and radar imagery were processed separately by season. The seasonal delineation followed the meteorological definition commonly used in the Northern Hemisphere, which divides seasons according to the annual temperature cycle and calendar months: spring from March to May, summer from June to August, autumn from September to November, and winter from December to February of the following year. Sentinel-2 images acquired from December 2023 to November 2024 were used to represent the complete seasonal cycle corresponding to the field survey year. Because gaps in valid Sentinel-1 coverage occurred within the study area between 2022 and 2024, available observations from 2021 and 2025 were incorporated into the seasonal median composites to ensure complete spatial coverage. For Sentinel-2 preprocessing, images with scene-level cloud cover exceeding 20% were excluded. Cloud, cloud-shadow, and snow or ice pixels were masked using the Scene Classification Layer (SCL). An additional snow mask based on the Normalized Difference Snow Index (NDSI) was then applied to reduce residual snow contamination of winter spectral features. Following masking, median composites were generated separately for each season. Sentinel-1 GRD products were processed to generate seasonal mean composites after standard SAR corrections, including noise removal, backscatter calibration, and terrain-related geometric correction, in order to reduce speckle effects. The seasonal availability of Sentinel-1 and Sentinel-2 imagery and the number of valid plot-level observations are summarized in Table 1. To maintain spatial consistency among all predictors, the datasets were harmonized to a 30 m grid using nearest-neighbor resampling and projected to the WGS 1984 coordinate system. Topographic data were obtained from the NASADEM product by accessing the NASADEM_HGT/001 dataset through GEE. Elevation, slope, aspect, and hillshade were derived and clipped to the study area boundary. Because aspect is a circular variable, directly using angular values ranging from 0° to 360° may introduce artificial discontinuities. Aspect was therefore transformed into the transformed aspect (TRASP) index using a trigonometric function, and the resulting index was used in subsequent modeling analyses.
Table 1.
Availability of seasonal Sentinel-1 and Sentinel-2 imagery and the number of valid plot observations.
The 2024 China Land Cover Dataset (CLCD) [39] was adopted to identify forest-covered areas in the study region. This product maps annual land-cover conditions across China at 30 m resolution and distinguishes nine major surface types, including cropland, forest, shrubland, grassland, wetland, water, impervious surfaces, bare ground, and snow/ice. In this study, the forest class was extracted and used as a mask to define the forest extent of the study area.
2.3. Methods
2.3.1. Feature Extraction
In this study, a multidimensional feature set comprising spectral, texture, and topographic variables was extracted. For spectral features, in addition to the original bands, eight vegetation indices were calculated, including the normalized difference vegetation index (NDVI), enhanced vegetation index (EVI), soil-adjusted vegetation index (SAVI), modified soil-adjusted vegetation index (MSAVI), green normalized difference vegetation index (GNDVI), normalized difference water index (NDWI), normalized burn ratio (NBR), and red-edge chlorophyll index (CIre). Tasseled cap transformation was also applied to derive brightness, greenness, and wetness components.
For texture features, the near-infrared band of Sentinel-2 (Band 8), which is sensitive to vegetation structure, and the Sentinel-1 SAR backscatter bands (VV and VH) were used as input layers. Seven gray-level co-occurrence matrix (GLCM) texture measures were calculated using a 3 × 3 pixel window, including contrast (Con), correlation (Cor), entropy (Ent), inverse difference moment (Idm), sum average (Savg), variance (Var), and dissimilarity (Diss), to characterize stand-scale spatial heterogeneity. Topographic factors, including elevation, slope, aspect index, and hillshade, were derived from the NASA DEM. In total, 184 multidimensional features were constructed for subsequent analysis (Table 2).
Table 2.
Specific indicators included in the multidimensional feature space.
2.3.2. Feature Selection
The Boruta algorithm was used to select the important predictors from the multi-source feature set. Boruta is a random-forest-based wrapper algorithm that evaluates feature relevance by creating shuffled shadow features from the original variables and combining them with the real features during model training. The importance scores of the shadow features are then used as a reference to identify real variables that are strongly associated with the response variable [40,41]. In addition to ranking feature importance, Boruta classifies variables into three categories: confirmed, rejected, and tentative, thereby providing a qualitative assessment of variable relevance [42,43,44]. In this study, only the confirmed features retained by Boruta were used as input variables for subsequent model development.
According to the research objectives, prediction scenarios were designed based on data-source combinations and seasonal image features. First, six data-source scenarios were established, including Topography, S1, S2, S1 + Topography, S2 + Topography, and S1 + S2 + Topography, to evaluate the effects of multi-source remote sensing data fusion on forest tree species diversity estimation. Second, for each remote sensing data source and its combinations, five seasonal scenarios were further defined, namely spring, summer, autumn, winter, and four-season fusion, to compare the predictive performance of different seasonal feature combinations. Feature selection was conducted separately for each prediction scenario using Richness, Shannon, and Gini–Simpson indices as response variables. The selected features were then used as inputs for the machine learning models. To prevent information leakage from validation samples during feature selection, Boruta was applied independently within the training fold of each cross-validation iteration, with the corresponding validation fold excluded from the selection process. The number of final predictor variables reported in Table 3 corresponds to the Boruta selection results obtained using all field plots when fitting the final models for spatial mapping.
Table 3.
Feature sets and Boruta-selected variables under different prediction scenarios.
2.3.3. Model Development
The objective of model construction was to establish statistical relationships between ground-based tree species diversity metrics and remote-sensing-derived predictor variables. In this study, species richness, the Shannon index, and the Gini–Simpson index calculated from field plot data were used as response variables, whereas Sentinel-1, Sentinel-2, and topographic features selected by the Boruta algorithm were used as predictor variables. Because tree species diversity is influenced by spectral, structural, phenological, and environmental factors, its relationship with remote sensing variables is often nonlinear and complex. Therefore, multiple machine learning algorithms were applied to compare their predictive ability and identify the most suitable modeling approach for each diversity index. Random forest (RF) [45], extreme gradient boosting (XGBoost) [46], k-nearest neighbors (KNN) [47], support vector regression (SVR) [48], and Bayesian regularized neural network (BRNN) [49] models were implemented using the caret package in R 4.5.3. A Stacking ensemble model was further developed based on the individual models. Stacking generally consists of two learning layers: base learners in the first layer and a meta-learner in the second layer. The basic procedure is to first train multiple base models using the training data [50], then use the predictions from these base models as new input features to construct a second-level training dataset together with the response variable, and finally generate the final prediction through the meta-learner [51]. In this study, RF, XGBoost, KNN, SVR, and BRNN were used as base learners, while ridge regression was adopted as the meta-learner. Ridge regression introduces L2 regularization, which can alleviate multicollinearity among input features and reduce overfitting, thereby improving prediction stability and generalization performance [52]. Model hyperparameters were optimized using grid search. The main tuning parameters and their search ranges are listed in Table 4, while the optimal hyperparameter configurations for the best-performing model of each tree species diversity index are provided in Table S1.
Table 4.
Hyperparameter settings and grid search ranges for different machine learning models.
A total of 145 field plots were used for model training and validation. To improve the robustness of model performance assessment, both random 10-fold cross-validation and spatial 10-fold cross-validation were implemented, with the spatial folds generated by applying k-means clustering to the plot coordinates. In each cross-validation iteration, Boruta feature selection, hyperparameter tuning, and model fitting were conducted exclusively within the corresponding training folds, while the validation fold was excluded from all these procedures. For the Stacking model, each base learner generated out-of-fold predictions within the training data, which were then used as input features for the ridge regression meta-learner. The resulting ensemble was subsequently used to predict the outer validation fold, thereby reducing the risks of information leakage and overfitting.
2.3.4. Accuracy Assessment and Prediction Mapping
Model performance was evaluated using the coefficient of determination () root mean square error (RMSE) as follows [53]:
where is the observed value of the -th sample, is the corresponding predicted value, is the mean observed value, and is the number of samples. A higher indicates greater explanatory power of the model, whereas lower RMSE values indicate higher prediction accuracy and better model performance.
Model performance metrics were calculated separately from the validation-fold predictions generated by random 10-fold cross-validation and spatial 10-fold cross-validation and were reported as the mean ± standard deviation. The mean represents average predictive performance, whereas the standard deviation reflects model stability across cross-validation folds. In addition, the pixel-level coefficient of variation (CV) was calculated from the mean and standard deviation of repeated predictions to characterize spatial prediction uncertainty. A higher CV indicates greater relative uncertainty and lower prediction stability for a given pixel.
3. Results
3.1. Effects of Multi-Source Remote Sensing Data Fusion on Tree Species Diversity Estimation
To evaluate the effect of different data sources on tree species diversity estimation, models were constructed under six data-source scenarios using Richness, Shannon, and Gini–Simpson indices as response variables. Model performance was evaluated using random 10-fold cross-validation. The results showed clear differences in predictive performance among data-source combinations (Figure 3). Overall, the S2-related scenarios consistently outperformed the S1 scenarios. When Sentinel-1 features were used alone, the values for Richness, Shannon, and Gini–Simpson were generally low. In contrast, the inclusion of Sentinel-2 features improved the prediction accuracy for all three diversity indices.
Figure 3.
Model accuracy for tree species diversity estimation under different data-source combinations under random 10-fold cross-validation.
Topographic factors alone provided a certain level of predictive ability, but their overall performance was lower than that of the S2-related scenarios. When topographic factors were combined with remote sensing features, model accuracy generally improved. In particular, the S2 + Topography and S1 + S2 + Topography scenarios achieved relatively high values in most cases. However, the difference between the S1 + S2 + Topography and S2 + Topography scenarios was small, and their performance was similar for some indices and models. Overall, Sentinel-2 optical features showed superior performance in estimating tree species diversity. The integration of topographic factors further improved model performance, and multi-source remote sensing data fusion generally enhanced the estimation of tree species diversity.
3.2. Performance of Tree Species Diversity Estimation Using Seasonal Remote Sensing Imagery
To assess the effects of seasonal image feature combinations on tree species diversity estimation, five prediction scenarios were constructed based on the S1 + S2 + Topography configuration, including spring, summer, autumn, winter, and four-season fusion. Richness, Shannon, and Gini–Simpson indices were used as response variables, and model accuracy is shown in Figure 4.
Figure 4.
Model accuracy for tree species diversity estimation under different prediction scenarios under random 10-fold cross-validation.
For single-season scenarios, prediction accuracy varied among seasons. For Richness, the spring scenarios performed relatively well, with maximum values of 0.48, whereas the autumn scenario showed slightly lower accuracy. For the Shannon index, the winter scenario achieved the highest prediction accuracy, with a maximum of 0.59 and an RMSE of 0.38. For the Gini–Simpson index, the winter scenario also performed best, achieving a maximum of 0.55 with a corresponding RMSE of 0.18. The spring and autumn scenarios followed, with maximum values of 0.50 and 0.49, respectively, whereas the summer scenario showed relatively low overall accuracy, with a maximum R2 of only 0.39.
Compared with single-season scenarios, the four-season fusion scenario achieved the highest prediction accuracy for all three tree species diversity indices. The optimal values for Richness, Shannon, and Gini–Simpson were 0.51, 0.63, and 0.57, respectively, with corresponding RMSE values of 2.45, 0.36, and 0.17. Overall, the four-season fusion scenario outperformed the single-season scenarios.
3.3. Performance of Different Models in Tree Species Diversity Estimation
To compare the predictive performance of different machine learning models, six models were evaluated across all prediction scenarios (Figure 4). Model performance varied among scenarios. Overall, the Stacking model showed relatively strong performance, achieving higher and lower RMSE values in most scenarios, indicating good overall predictive ability. RF and SVR also showed advantages in estimating the Shannon and Gini–Simpson indices, with relatively high accuracy in some seasonal scenarios. In contrast, BRNN generally showed lower prediction accuracy and weaker model stability.
In terms of the optimal model for each diversity index, Stacking performed best for Richness, SVR performed best for Shannon, and RF performed best for Gini–Simpson. Figure 5 shows the relationship between the predicted and observed values for the optimal models of the three diversity indices. Overall, the samples were mainly distributed around the 1:1 line, indicating good agreement between predicted and observed values.
Figure 5.
Observed versus predicted values for the best-performing model of each tree species diversity index under random 10-fold cross-validation.
3.4. Feature Importance Analysis Under the Optimal Models for Tree Species Diversity Estimation
The Boruta-based feature importance rankings of the optimal models showed that the key predictors differed among tree species diversity indices (Figure 6). For Richness, S_S2_NDVI had the highest importance, followed by Topo_Elev, S_S2_GNDVI, S_S2_NDWI, W_S2_SAVI, S_S2_B8A, S_S2_B4, and W_S2_MSAVI. Overall, the important predictors for the Richness model consisted primarily of summer Sentinel-2 vegetation indices and spectral bands, while winter vegetation indices and elevation also contributed substantially.
Figure 6.
Feature importance ranking of the optimal models for tree species diversity estimation. The optimal models were Stacking for Richness, SVR for Shannon, and RF for Gini–Simpson.
For the Shannon index, the important predictors included S_S2_NDVI, S_S2_GNDVI, S_S2_NDWI, W_S2_MSAVI, W_S2_SAVI, Topo_Elev, and W_S2_NDVI. In addition, A_S2_B7, A_S2_B6, and A_S2_B8_Tex_savg also showed relatively high importance. Compared with Richness, the important predictors for the Shannon index involved a wider range of seasons and feature types.
For the Gini–Simpson index, S_S2_NDVI, S_S2_NDWI, and S_S2_GNDVI remained among the most important variables, while winter vegetation indices, including W_S2_MSAVI, W_S2_SAVI, W_S2_NDVI, and W_S2_EVI, also showed high importance. In addition, A_S2_B6, W_S2_CIre, A_S2_B7, Topo_Elev, W_S2_NBR, and several texture features were included among the important predictors. Compared with Richness and Shannon, winter vegetation indices and variables related to red-edge contributed more prominently to Gini–Simpson estimation.
Overall, the key predictors for all three diversity indices were dominated by Sentinel-2 optical features, and summer vegetation indices consistently ranked among the most important variables. This indicates that growing-season spectral information is a major source of information for estimating tree species diversity. Meanwhile, winter vegetation indices, red-edge bands, texture features, and topographic factors also contributed to different indices, suggesting that tree species diversity metrics respond differently to seasonal information and feature types.
3.5. Spatial Distribution Patterns of Tree Species Diversity
Spatial distribution maps of Richness, Shannon, and Gini–Simpson indices, together with their corresponding coefficients of variation (CV), were generated using the optimal prediction models, namely Stacking for Richness, SVR for Shannon, and RF for Gini–Simpson (Figure 7). All three indices exhibited clear spatial variation and showed generally consistent distribution patterns. By comparing the diversity maps with land-use types (Figure 1), areas near cropland, built-up land, and roads generally exhibited lower diversity and greater prediction variability, whereas areas farther from human disturbance and characterized by greater forest continuity showed higher diversity and lower prediction uncertainty.
Figure 7.
Spatial distributions of Richness (a), Shannon (b), and Gini–Simpson (c), with their corresponding coefficients of variation shown in panels (d), (e), and (f), respectively.
To further examine the relationship between tree species diversity and topographic factors, correlation analyses were conducted between the field-measured diversity indices and elevation, slope, and the TRASP index (Figure 8). Elevation was significantly and positively correlated with Richness, Gini–Simpson, and Shannon, with correlation coefficients of 0.52, 0.37, and 0.42, respectively. Correlations between slope and all three diversity indices were weak and statistically nonsignificant. In contrast, the TRASP index was significantly and negatively correlated with Richness, Shannon, and Gini–Simpson, with correlation coefficients of −0.24, −0.24, and −0.21, respectively, indicating a general decline in tree species diversity with increasing TRASP.
Figure 8.
Correlations between tree species diversity indices and topographic factors. Asterisks indicate statistical significance: * p < 0.05, ** p < 0.01, and *** p < 0.001.
4. Discussion
4.1. Complementary Roles of Sentinel-1, Sentinel-2, and Topographic Features in Tree Species Diversity Estimation
The results showed that Sentinel-2 optical features contributed more strongly to tree species diversity estimation than Sentinel-1 features. The most important predictors in the best-performing models were primarily Sentinel-2 vegetation indices, red-edge and near-infrared bands, and their associated texture features. This finding is consistent with the spectral variation hypothesis, which posits that interspecific differences in functional traits can be indirectly captured through canopy spectral and spatial heterogeneity [54,55]. Red-edge bands are sensitive to variations in chlorophyll content and red-edge position, whereas near-infrared reflectance is primarily influenced by internal leaf scattering, leaf area index, and canopy cover. Water-related indices combining near-infrared and shortwave-infrared bands are sensitive to vegetation liquid water content and canopy moisture conditions [56,57,58]. Previous studies have also demonstrated that Sentinel-2 red-edge and near-infrared bands, EVI, and texture metrics effectively characterize variations in canopy chlorophyll content, leaf area index, and tree species composition [59,60]. Collectively, these findings indicate that Sentinel-2 captures complementary information on canopy physiological status, moisture conditions, and structural heterogeneity, making it the primary source of predictive information for tree species diversity estimation.
Compared with Sentinel-2 optical features, Sentinel-1 SAR contributed relatively little to tree species diversity estimation, possibly because C-band SAR has limited sensitivity to interspecific differences [61]. Nevertheless, its backscatter coefficients remain sensitive, to some extent, to canopy roughness, branch and stem structure, and vertical canopy organization, thereby providing structural information complementary to optical observations [62]. In this study, the S1 + S2 + Topography and S2 + Topography scenarios achieved comparable overall accuracy. However, incorporating Sentinel-1 reduced RMSE for all three diversity indices, indicating a modest complementary benefit despite limited improvement in overall predictive performance. Sentinel-1 may therefore be more appropriately used as a structural complement to optical information rather than as the primary data source for tree species diversity estimation.
The inclusion of topographic predictors further improved the predictive performance of some models, suggesting that topography contributes to the spatial differentiation of tree species diversity by regulating local hydrothermal conditions and habitat heterogeneity. Elevation was positively correlated with all three diversity indices; however, this relationship should be interpreted within the local elevational range of 81–1043 m and does not imply a continuous increase in tree species diversity with elevation. Zhu et al. [63] found that tree species composition in montane forests was primarily shaped by elevation, with tree abundance and phylogenetic diversity declining at higher elevations. McCain and Grytnes [64] similarly reported that species richness commonly decreases or exhibits a unimodal pattern with a mid-elevation peak along elevational gradients. Therefore, the positive relationships observed here more likely reflect greater forest continuity and a higher degree of species mixing at relatively high elevations, together with weaker disturbances associated with roads, cropland expansion, and intensive forest management. The negative correlations between TRASP and the diversity indices may reflect the regulation of local hydrothermal conditions by slope aspect. South- and southwest-facing slopes with higher TRASP values generally receive more solar radiation and experience higher temperatures and evapotranspirative demand, potentially intensifying soil moisture limitation. In contrast, lower radiation inputs and relatively moist microclimates on shaded slopes can alleviate water stress and provide more suitable habitat conditions for richer tree species assemblages [65,66].
Overall, Sentinel-2 optical features, Sentinel-1 radar features, and topographic factors provided information from spectral–phenological, canopy structural, and environmental-gradient perspectives, respectively [67]. Their complementary integration helped compensate for the limitations of single-source data and improved the stability of tree species diversity estimation.
4.2. Effects of Seasonal Features and Multi-Seasonal Fusion on Tree Species Diversity
The differences in estimation accuracy among seasonal scenarios indicate that the relationship between tree species diversity and remote sensing features was strongly influenced by vegetation phenology. Richness showed relatively high accuracy in spring, whereas the Shannon and Gini–Simpson indices performed best in winter. This suggests that the optimal observation window differed among diversity metrics. Richness mainly reflects the number of tree species within a plot and is sensitive to rare species, stand boundaries, and habitat heterogeneity. In contrast, the Shannon and Gini–Simpson indices further incorporate relative abundance and dominance, and are therefore more responsive to community evenness and structural differences [68,69]. The seasonal differences among diversity metrics thus reflect distinct sensitivities of species number and community evenness to remote sensing information.
The study area is a typical northern temperate mixed coniferous–broadleaf forest, where evergreen conifers, deciduous conifers, and deciduous broadleaf species coexist. These tree groups differ markedly in phenological processes, including leaf emergence, canopy development, leaf senescence, and leaf fall, leading to seasonal variation in canopy spectral properties. Phenological differences among tree species have been recognized as an important source of information for improving remote sensing-based species discrimination, and late-spring and autumn imagery often enhances spectral separability among tree species [15,59,60,70,71]. In this study, the relatively better performance of winter scenarios for several diversity indices also indicates the contribution of non-peak growing-season phenological information to tree species diversity estimation. Figure 9 further shows seasonal differences in the reflectance of key Sentinel-2 bands. Overall, distinct seasonal reflectance patterns were observed in the visible, red-edge, near-infrared, and shortwave infrared regions. Summer reflectance was higher in the red-edge and near-infrared bands, reflecting vigorous canopy activity during the growing season, whereas winter showed spectral responses in the visible and shortwave infrared regions that differed from those in spring, summer and autumn. These seasonal spectral differences provide a basis for incorporating multi-seasonal features into tree species diversity estimation.
Figure 9.
Seasonal reflectance differences in key Sentinel-2 bands.
The feature importance results also showed that S_S2_NDVI, S_S2_GNDVI, and S_S2_NDWI were highly important for all three diversity indices, indicating that summer canopy growth status remained an important source of information for remote sensing-based tree species diversity characterization. During summer, forest canopies are fully developed, with high leaf area, chlorophyll content, and canopy water content; differences in physiological status among tree species can therefore be reflected by vegetation indices [38,58]. However, the summer scenario did not achieve the highest accuracy for all indices, possibly because dense canopy closure reduced spectral separability, increased saturation effects, and weakened the contribution of understory and structural information [15].
In contrast, winter imagery performed relatively well in estimating the Shannon and Gini–Simpson indices, possibly owing to the combined effects of snow-covered backgrounds and dormant-season canopy contrasts between evergreen and deciduous tree species. Residual snow within forest gaps and on roads, croplands, bare ground, and other non-canopy surfaces may elevate visible-band reflectance during winter [72,73]. Moreover, interspecific variation in leaf habit, crown architecture, branch and foliage density, and canopy closure may regulate canopy snow interception and understory exposure. Following leaf fall, diminished chlorophyll absorption and increased canopy openness enhance the spectral contributions of woody components and understory surfaces, whereas evergreen conifers maintain relatively stable canopy reflectance. Collectively, seasonal shifts in canopy phenology, snow distribution, and background reflectance may enhance spectral contrasts associated with dominant species composition and community evenness [70].
Notably, both random 10-fold and spatial 10-fold cross-validation showed that the four-season S1 + S2 + Topography fusion scenario achieved the highest predictive accuracy for Richness, Shannon, and Gini–Simpson (Table S2). The RMSE values of the four-season fusion scenario were generally lower than those of the individual-season scenarios (Figure 10; p < 0.001). These results indicate that the advantages of multi-season and multisource integration are not contingent on a specific sample partitioning scheme but instead arise from the complementarity among different observational dimensions. Single-season imagery is insufficient to fully characterize variations in tree species composition and diversity. In contrast, multiseason observations jointly capture growing-season canopy activity, phenological differences during autumn senescence, and winter structural and background information [74,75,76], while multisource integration combines complementary optical, radar, and topographic features. Together, these dimensions provide a more comprehensive representation of forest tree species composition, canopy condition, and spatial heterogeneity [77]. Liu et al. [16] also reported that multi-temporal remote sensing data can integrate information from key phenological stages and generally outperform single-date imagery in temperate mountain forests. Therefore, integrating multi-seasonal and multi-source data is an effective strategy for improving the accuracy and stability of tree species diversity estimation.
Figure 10.
Statistical comparison of predictive performance across data sources, seasons, and machine-learning models under random cross-validation. Asterisks indicate statistical significance: * p < 0.05, ** p < 0.01, and *** p < 0.001; ns indicates no statistically significant difference (p ≥ 0.05).
4.3. Prediction Performance of Machine Learning Models for Tree Species Diversity
Differences in model performance essentially reflect the complexity of the relationships between tree species diversity and remote sensing variables. Tree species diversity is not a direct response to a single spectral signal; rather, it is jointly shaped by canopy structure, phenological dynamics, stand density, and environmental gradients [78]. In this context, multi-source remote sensing features and topographic variables form a high-dimensional input space, in which correlations, redundancy, and nonlinear interactions among variables may occur. Such complexity is difficult to capture using traditional linear approaches [24].
In this study, Stacking achieved relatively high performance in most scenarios, indicating that ensemble learning can effectively capture the complex nonlinear relationships between multisource, multitemporal remote-sensing features and tree species diversity [79]. The constituent base learners provide complementary modeling capabilities. Specifically, RF reduces variance and enhances model stability through random sampling and multiple decision trees [80]; XGBoost improves the representation of complex nonlinear relationships by iteratively fitting residuals through gradient boosting [81]; and SVR has strong generalization ability in high-dimensional feature spaces, particularly under limited sample conditions [82]. Stacking further combines the out-of-fold predictions of these base models using a ridge-regression meta-learner. Its L2 regularization stabilizes coefficient estimation in the presence of correlated base-model outputs, thereby reducing reliance on any single model structure, limiting overfitting under small-sample conditions, and improving overall predictive stability [23,24,25].
However, stacking did not consistently yield the best performance across all diversity indices and validation strategies. Under the four-season S1 + S2 + Topography scenario, the best-performing models for richness, Shannon, and Gini–Simpson under random cross-validation were stacking, SVR, and RF, respectively. Under spatial cross-validation, stacking performed best for richness and Gini–Simpson, with R2 values of 0.43 and 0.50, respectively, whereas XGBoost achieved the highest accuracy for Shannon (R2 = 0.62, RMSE = 0.37; Table S2). Although the optimal model varied with the target index and validation strategy, stacking generally maintained relatively low RMSE values under both cross-validation schemes, demonstrating robust performance across analytical scenarios. These findings suggest that algorithms differ in their ability to capture the underlying relationships between predictor variables and diversity metrics, and that greater model complexity does not necessarily translate into superior accuracy across all prediction tasks [83,84]. Overall, compared with individual machine-learning models, the stacking ensemble exhibited greater performance stability in the remote-sensing-based estimation of forest tree species diversity.
Moreover, spatial cross-validation generally yielded lower predictive accuracy than random cross-validation for all three diversity indices. Random data partitioning may assign spatially adjacent plots with similar environmental conditions, tree species composition, and remote-sensing characteristics to both the training and validation sets. This reduces the spatial independence of validation samples and may consequently overestimate model transferability to new locations [85]. In contrast, spatial cross-validation withholds entire groups of spatially clustered plots, thereby reducing spatial dependence between the training and validation sets and more rigorously simulating model extrapolation to unsampled areas. It therefore provides a more conservative and operationally realistic assessment of predictive performance for spatial mapping applications [86]. Collectively, these findings indicate that no universally optimal model should be assumed for tree species diversity mapping. Instead, feature selection, model choice, and hyperparameter optimization should be tailored to the target diversity metric, predictor structure, sample size, and intended degree of spatial extrapolation.
4.4. Comparison with Previous Studies
Relatively few studies have spatially estimated multiple tree species diversity metrics, including richness, Shannon, and Gini–Simpson indices, in the Yichun region. To objectively evaluate model performance while maintaining cross-study comparability, we primarily compared our results with studies using Sentinel-2, multi-season Sentinel-2, Sentinel-1/2, topographic variables, or their combinations. Studies relying predominantly on LiDAR, GEDI, unmanned aerial vehicle imagery, or very-high-spatial-resolution imagery were therefore excluded from the primary comparison.
Mallinis et al. [87] used Sentinel-2 Multispectral Instrument imagery and a random forest model to estimate tree species diversity in Northern Pindos National Park, Greece, achieving R2 = 0.29 and RMSE = 0.35 for the Shannon index and R2 = 0.31 and RMSE = 0.20 for the Simpson index. Chrysafis et al. [15] further integrated multi-season Sentinel-2 spectral information with geodiversity variables. Their multi-season models achieved R2 = 0.31 and RMSE = 0.33 for the Shannon index and R2 = 0.37 and RMSE = 0.18 for the Simpson index, demonstrating that seasonal spectral information and environmental heterogeneity can improve the characterization of differences in forest community composition. Liu et al. [16] combined Sentinel-1, Sentinel-2, and topographic data to map tree species diversity in temperate montane forests, obtaining maximum predictive accuracies of R2 = 0.56 and RMSE = 1.50 for species richness and R2 = 0.63 and RMSE = 0.23 for the Shannon–Wiener index. Hoffmann et al. [88] used Sentinel-1/2 imagery and deep neural networks to estimate biodiversity in temperate forests in Germany; their best-performing model yielded an R2 of 0.25 for the Shannon–Wiener index, indicating that greater model complexity does not necessarily translate into improved tree species diversity estimation.
By comparison, under the four-season imagery fusion scenario, our models achieved maximum R2 values of 0.51, 0.63, and 0.57 for the richness, Shannon, and Gini–Simpson indices, respectively. Although direct comparisons are constrained by differences in plot design, forest type, spatial scale, validation strategy, and diversity-index calculation, the predictive performance achieved in this study is generally among the highest reported for comparable Sentinel-based studies. Collectively, these findings demonstrate that the synergistic integration of multi-season Sentinel-1/2 imagery, topographic features, feature-selection procedures, and machine-learning models can effectively characterize tree species composition and its spatial heterogeneity in natural-forest-dominated northern temperate mixed coniferous–broadleaved forests.
4.5. Limitations and Future Perspectives
Although this study achieved promising results in mapping tree species diversity using multi-seasonal Sentinel features and topographic factors, several issues still remain to be resolved. First, the models were mainly developed using Sentinel-1, Sentinel-2, and topographic variables, which can characterize tree species diversity from the perspectives of spectral response, phenology, canopy structure, and topographic gradients. However, ecological process-related variables, such as climate, soil properties, stand age, forest type, management history, and landscape configuration, were not fully incorporated. Therefore, the current models mainly explain the spatial variation in tree species diversity through remote sensing and topographic representations, while the underlying ecological mechanisms require further investigation. In addition, this study included only 145 field plots, resulting in a relatively limited sample size and spatial coverage. Although model performance was evaluated using both random and spatial ten-fold cross-validation, model generalizability across broader geographic areas and independent datasets remains to be verified.
Second, Sentinel-2 optical features played a dominant role in the models and effectively captured canopy spectral differences and seasonal phenological variation. However, medium-resolution imagery remains limited in characterizing vertical forest structure, understory vegetation, and complex mixed-species stand structures. Sentinel-1 SAR features provided supplementary structural information, but the limited penetration capability of C-band SAR makes it difficult to fully capture internal vertical structural differences within forest stands. This limitation may affect the fine-scale estimation of community evenness- and dominance-related indices, such as the Shannon and Gini–Simpson indices. Moreover, the Shannon and Gini–Simpson indices were calculated using the proportional basal area of each tree species. This approach emphasizes the contributions of dominant trees and canopy-dominant species but may underrepresent rare species, small-diameter trees, and understory regeneration. The resulting estimates should therefore be interpreted as measures of dominance-weighted tree species diversity. Future studies should compare these results with diversity indices calculated from species-specific stem abundances.
Regarding the temporal definition of seasons, this study used fixed calendar months to generate seasonal composite imagery, primarily to assess model sensitivity to different combinations of seasonal observations. The effects of alternative monthly boundaries were not explicitly examined, and calendar-based seasons represent only an approximation of actual phenological phases. Although incorporating multi-season features enhanced the use of phenological information, it also increased the potential for predictor redundancy and information coupling. The Boruta algorithm identified predictively robust features; however, these selections reflect variable contributions to model prediction rather than strict ecological causality. Feature importance should therefore not be directly interpreted as evidence of underlying ecological mechanisms.
Future research should increase the number of field plots, broaden their coverage across spatial and environmental gradients, and conduct external validation using independent plot datasets. Multisource observations from GEDI, ICESat-2, airborne LiDAR, and unmanned aerial vehicle imagery could then be incorporated to improve the characterization of canopy height, vertical structure, and spatial heterogeneity. Phenology-based temporal windows or continuous time-series observations should also be evaluated to determine the sensitivity of diversity estimates to seasonal boundaries. Finally, comparisons between basal-area-weighted and stem-abundance-weighted diversity indices would further clarify the extent to which different dimensions of tree species diversity can be reliably retrieved from remote-sensing data.
5. Conclusions
This study developed a tree species diversity estimation framework for northern temperate mixed coniferous–broadleaf forests by incorporating multi-seasonal Sentinel-1/2 imagery and topographic features into multiple machine learning models. The effects of data-source combinations, seasonal image features, model performance, feature contributions, and spatial distribution patterns were systematically evaluated. The main conclusions are as follows:
- (1)
- Sentinel-2 optical features outperformed Sentinel-1 radar features and served as the primary information source for tree species diversity estimation. Model performance was further improved by incorporating topographic factors, and the S1 + S2 + Topography scenario showed the best overall performance.
- (2)
- Multi-seasonal fusion improved the estimation accuracy of tree species diversity. Under single-season scenarios, Richness performed better in spring, whereas Shannon and Gini–Simpson showed higher accuracy in winter. The four-season fusion scenario achieved the highest accuracy for all three indices, with values of 0.51, 0.63, and 0.57, respectively.
- (3)
- The optimal model differed among diversity indices. Stacking performed best for Richness, SVR for Shannon, and RF for Gini–Simpson, indicating that model selection should be optimized according to the target diversity metric.
- (4)
- Important predictors were dominated by Sentinel-2 optical features, especially summer NDVI, GNDVI, and NDWI. Elevation contributed notably to Richness, whereas winter vegetation indices, autumn red-edge bands, and texture features were more important for Shannon and Gini–Simpson.
- (5)
- Tree species diversity showed clear spatial heterogeneity. Higher diversity was mainly distributed in mid-to-high-elevation areas with greater forest continuity, whereas lower diversity was more common in low-elevation areas close to cropland, built-up land, and roads.
Overall, incorporating multi-seasonal Sentinel-1/2 imagery and topographic features into machine learning models improved tree species diversity estimation and provides methodological support for biodiversity monitoring and precision forest management in northern temperate forests. Future research should further integrate canopy vertical-structure information and advanced modeling approaches to improve prediction accuracy and ecological interpretation.
Supplementary Materials
The following supporting information can be downloaded at: https://www.mdpi.com/article/10.3390/rs18162651/s1, Table S1. Hyperparameter Search Spaces and Optimal Values. Table S2. Random and Spatial Cross Validation Results.
Author Contributions
Conceptualization, W.L. and T.H.; methodology, W.L. and T.H.; formal analysis, W.L. and T.H.; writing—original draft, W.L.; writing—review and editing, T.H., R.P.S., D.H., J.L., P.Z. and X.H.; supervision, S.C.; project administration, S.C. All authors provided constructive suggestions on research ideas, data processing, manuscript structure, and revision. All authors have read and agreed to the published version of the manuscript.
Funding
This research was supported by the commissioned project “Forest Quality Precision Improvement Services in the New Era” funded by Heilongjiang Yichun Forest Industry Group Co., Ltd.
Data Availability Statement
The raw data supporting the conclusions of this article will be made available by the authors on request.
Conflicts of Interest
The authors declare no conflicts of interest.
References
- Brockerhoff, E.G.; Barbaro, L.; Castagneyrol, B.; Forrester, D.I.; Gardiner, B.; González-Olabarria, J.R.; Lyver, P.O.; Meurisse, N.; Oxbrough, A.; Taki, H.; et al. Forest Biodiversity, Ecosystem Functioning and the Provision of Ecosystem Services. Biodivers. Conserv. 2017, 26, 3005–3035. [Google Scholar] [CrossRef] [Scilit]
- Sabatini, F.M.; de Andrade, R.B.; Paillet, Y.; Ódor, P.; Bouget, C.; Campagnaro, T.; Gosselin, F.; Janssen, P.; Mattioli, W.; Nascimbene, J.; et al. Trade-Offs between Carbon Stocks and Biodiversity in European Temperate Forests. Glob. Change Biol. 2019, 25, 536–548. [Google Scholar] [CrossRef] [Scilit] [PubMed]
- Gamfeldt, L.; Snäll, T.; Bagchi, R.; Jonsson, M.; Gustafsson, L.; Kjellander, P.; Ruiz-Jaen, M.C.; Fröberg, M.; Stendahl, J.; Philipson, C.D.; et al. Higher Levels of Multiple Ecosystem Services Are Found in Forests with More Tree Species. Nat. Commun. 2013, 4, 1340. [Google Scholar] [CrossRef] [Scilit] [PubMed]
- Jetz, W.; McGeoch, M.A.; Guralnick, R.; Ferrier, S.; Beck, J.; Costello, M.J.; Fernandez, M.; Geller, G.N.; Keil, P.; Merow, C.; et al. Essential Biodiversity Variables for Mapping and Monitoring Species Populations. Nat. Ecol. Evol. 2019, 3, 539–551. [Google Scholar] [CrossRef] [Scilit] [PubMed]
- Kacic, P.; Kuenzer, C. Forest Biodiversity Monitoring Based on Remotely Sensed Spectral Diversity—A Review. Remote Sens. 2022, 14, 5363. [Google Scholar] [CrossRef] [Scilit]
- Kerr, J.T.; Ostrovsky, M. From Space to Species: Ecological Applications for Remote Sensing. Trends Ecol. Evol. 2003, 18, 299–305. [Google Scholar] [CrossRef] [Scilit]
- Pettorelli, N.; Wegmann, M.; Skidmore, A.; Mücher, S.; Dawson, T.P.; Fernandez, M.; Lucas, R.; Schaepman, M.E.; Wang, T.; O’Connor, B.; et al. Framing the Concept of Satellite Remote Sensing Essential Biodiversity Variables: Challenges and Future Directions. Remote Sens. Ecol. Conserv. 2016, 2, 122–131. [Google Scholar] [CrossRef] [Scilit]
- Timmermans, J.; Daniel Kissling, W. Advancing Terrestrial Biodiversity Monitoring with Satellite Remote Sensing in the Context of the Kunming-Montreal Global Biodiversity Framework. Ecol. Indic. 2023, 154, 110773. [Google Scholar] [CrossRef] [Scilit]
- Blickensdörfer, L.; Oehmichen, K.; Pflugmacher, D.; Kleinschmit, B.; Hostert, P. National Tree Species Mapping Using Sentinel-1/2 Time Series and German National Forest Inventory Data. Remote Sens. Environ. 2024, 304, 114069. [Google Scholar] [CrossRef] [Scilit]
- Saint, T.L.; Nabucet, J.; Lefebvre, S.; Gastellu-Etchegorry, J.-P.; Hubert-Moy, L.; Adeline, K. Sensitivity Analysis of Sentinel-2 Imagery to Assess Urban Tree Functional Traits: A Physical Approach Based on Local Climate Zones. Remote Sens. 2024, 16, 4402. [Google Scholar] [CrossRef] [Scilit]
- Udali, A.; Lingua, E.; Persson, H.J. Assessing Forest Type and Tree Species Classification Using Sentinel-1 C-Band SAR Data in Southern Sweden. Remote Sens. 2021, 13, 3237. [Google Scholar] [CrossRef] [Scilit]
- Robinson, C.; Saatchi, S.; Clark, D.; Astaiza, J.H.; Hubel, A.F.; Gillespie, T.W. Topography and Three-Dimensional Structure Can Estimate Tree Diversity along a Tropical Elevational Gradient in Costa Rica. Remote Sens. 2018, 10, 629. [Google Scholar] [CrossRef] [Scilit]
- Zhong, L.; Dai, Z.; Fang, P.; Cao, Y.; Wang, L. A Review: Tree Species Classification Based on Remote Sensing Data and Classic Deep Learning-Based Methods. Forests 2024, 15, 852. [Google Scholar] [CrossRef] [Scilit]
- Kollert, A.; Bremer, M.; Löw, M.; Rutzinger, M. Exploring the Potential of Land Surface Phenology and Seasonal Cloud Free Composites of One Year of Sentinel-2 Imagery for Tree Species Mapping in a Mountainous Region. Int. J. Appl. Earth Obs. Geoinf. 2021, 94, 102208. [Google Scholar] [CrossRef] [Scilit]
- Chrysafis, I.; Korakis, G.; Kyriazopoulos, A.P.; Mallinis, G. Predicting Tree Species Diversity Using Geodiversity and Sentinel-2 Multi-Seasonal Spectral Information. Sustainability 2020, 12, 9250. [Google Scholar] [CrossRef] [Scilit]
- Liu, X.; Frey, J.; Munteanu, C.; Still, N.; Koch, B. Mapping Tree Species Diversity in Temperate Montane Forests Using Sentinel-1 and Sentinel-2 Imagery and Topography Data. Remote Sens. Environ. 2023, 292, 113576. [Google Scholar] [CrossRef] [Scilit]
- Mutanga, O.; Masenyama, A.; Sibanda, M. Spectral Saturation in the Remote Sensing of High-Density Vegetation Traits: A Systematic Review of Progress, Challenges, and Prospects. ISPRS J. Photogramm. Remote Sens. 2023, 198, 297–309. [Google Scholar] [CrossRef] [Scilit]
- Koch, T.L.; Grubinger, S.; Coops, N.C.; Damm, A.; Morsdorf, F.; Waser, L.T.; Wegner, J.D.; Hobi, M.L. Assessment of Tree Species Specific Phenology Metrics from Sentinel-2 Data to Complement in Situ Monitoring. Ecol. Indic. 2025, 180, 114299. [Google Scholar] [CrossRef] [Scilit]
- Grabska-Szwagrzyk, E.; Tymińska-Czabańska, L. Sentinel-2 Time Series: A Promising Tool in Monitoring Temperate Species Spring Phenology. For. Int. J. For. Res. 2024, 97, 267–281. [Google Scholar] [CrossRef] [Scilit]
- Liu, P.; Ren, C.; Wang, Z.; Jia, M.; Yu, W.; Ren, H.; Xia, C. Evaluating the Potential of Sentinel-2 Time Series Imagery and Machine Learning for Tree Species Classification in a Mountainous Forest. Remote Sens. 2024, 16, 293. [Google Scholar] [CrossRef] [Scilit]
- Kursa, M.; Rudnicki, W. Feature Selection with theBorutaPackage. J. Stat. Softw. 2010, 36, 1–13. [Google Scholar] [CrossRef] [Scilit]
- Chen, J.; Du, H.; Mao, F.; Huang, Z.; Chen, C.; Hu, M.; Li, X. Improving Forest Age Prediction Performance Using Ensemble Learning Algorithms Base on Satellite Remote Sensing Data. Ecol. Indic. 2024, 166, 112327. [Google Scholar] [CrossRef] [Scilit]
- Breiman, L. Stacked Regressions. Mach. Learn. 1996, 24, 49–64. [Google Scholar] [CrossRef] [Scilit]
- Zhang, Y.; Liu, J.; Shen, W. A Review of Ensemble Learning Algorithms Used in Remote Sensing Applications. Appl. Sci. 2022, 12, 8654. [Google Scholar] [CrossRef] [Scilit]
- Wolpert, D.H. Stacked Generalization. Neural Netw. 1992, 5, 241–259. [Google Scholar] [CrossRef] [Scilit]
- Roswell, M.; Dushoff, J.; Winfree, R. A Conceptual Guide to Measuring Species Diversity. Oikos 2021, 130, 321–338. [Google Scholar] [CrossRef] [Scilit]
- Liu, J.; Huang, X.; Chen, S.; Zheng, P.; Han, D.; Liu, W. Effects of Stand Age Gradient and Thinning Intervention on the Structure and Productivity of Larix Gmelinii Plantations. Forests 2025, 16, 1552. [Google Scholar] [CrossRef] [Scilit]
- Wang, Z.; Zhang, D.; Zhang, T.; Li, X.; Wang, X.; Luo, T.; Zhong, S.; Song, K. Reconstructing the Temperature and Precipitation Changes in the Northern Part of the Greater Khingan Mountains over the Past 210 Years Using Tree Ring Width Data. Forests 2024, 15, 1450. [Google Scholar] [CrossRef] [Scilit]
- Liu, Q.; Bi, L.; Song, G.; Wang, Q.; Jin, G. Species–Habitat Associations in an Old-Growth Temperate Forest in Northeastern China. BMC Ecol. 2018, 18, 20. [Google Scholar] [CrossRef] [Scilit] [PubMed]
- Liu, J.; Chen, J.; Chen, S.; Wu, K. Forest Management Type Identification Based on Stacking Ensemble Learning. Forests 2024, 15, 887. [Google Scholar] [CrossRef] [Scilit]
- Pielou, E.C. The Measurement of Diversity in Different Types of Biological Collections. J. Theor. Biol. 1966, 13, 131–144. [Google Scholar] [CrossRef] [Scilit]
- Shannon, C.E. A Mathematical Theory of Communication. Bell Syst. Tech. J. 1948, 27, 379–423. [Google Scholar] [CrossRef] [Scilit]
- Zhang, L.; Yang, L.; Sun, J.; Zhu, Q.; Wang, T.; Zhao, H. Estimation of Tree Species Diversity in Warm Temperate Forests via GEDI and GF-1 Imagery. Forests 2025, 16, 570. [Google Scholar] [CrossRef] [Scilit]
- Madonsela, S.; Cho, M.A.; Ramoelo, A.; Mutanga, O. Remote Sensing of Species Diversity Using Landsat 8 Spectral Variables. ISPRS J. Photogramm. Remote Sens. 2017, 133, 116–127. [Google Scholar] [CrossRef] [Scilit]
- Simpson, E.H. Measurement of Diversity. Nature 1949, 163, 688. [Google Scholar] [CrossRef] [Scilit]
- Liang, J.; Buongiorno, J.; Monserud, R.A.; Kruger, E.L.; Zhou, M. Effects of Diversity of Tree Species and Size on Forest Basal Area Growth, Recruitment, and Mortality. For. Ecol. Manag. 2007, 243, 116–127. [Google Scholar] [CrossRef] [Scilit]
- Kamoske, A.G.; Dahlin, K.M.; Read, Q.D.; Record, S.; Stark, S.C.; Serbin, S.P.; Zarnetske, P.L. Towards Mapping Biodiversity from above: Can Fusing Lidar and Hyperspectral Remote Sensing Predict Taxonomic, Functional, and Phylogenetic Tree Diversity in Temperate Forests? Glob. Ecol. Biogeogr. 2022, 31, 1440–1460. [Google Scholar] [CrossRef] [Scilit]
- Arekhi, M.; Yılmaz, O.Y.; Yılmaz, H.; Akyüz, Y.F. Can Tree Species Diversity Be Assessed with Landsat Data in a Temperate Forest? Environ. Monit. Assess. 2017, 189, 586. [Google Scholar] [CrossRef] [Scilit] [PubMed]
- Yang, J.; Huang, X. The 30 m Annual Land Cover Dataset and Its Dynamics in China from 1990 to 2019. Earth Syst. Sci. Data 2021, 13, 3907–3925. [Google Scholar] [CrossRef] [Scilit]
- Zhang, N.; Chen, M.; Yang, F.; Yang, C.; Yang, P.; Gao, Y.; Shang, Y.; Peng, D. Forest Height Mapping Using Feature Selection and Machine Learning by Integrating Multi-Source Satellite Data in Baoding City, North China. Remote Sens. 2022, 14, 4434. [Google Scholar] [CrossRef] [Scilit]
- Huang, T.; Ou, G.; Wu, Y.; Zhang, X.; Liu, Z.; Xu, H.; Xu, X.; Wang, Z.; Xu, C. Estimating the Aboveground Biomass of Various Forest Types with High Heterogeneity at the Provincial Scale Based on Multi-Source Data. Remote Sens. 2023, 15, 3550. [Google Scholar] [CrossRef] [Scilit]
- Shakhovska, N.; Melnykova, N.; Chopiyak, V.; Ml, M. An Ensemble Methods for Medical Insurance Costs Prediction Task. Comput. Mater. Contin. 2021, 70, 3969–3984. [Google Scholar] [CrossRef] [Scilit]
- Yu, S.; Ye, Q.; Zhao, Q.; Li, Z.; Zhang, M.; Zhu, H.; Zhao, Z. Effects of Driving Factors on Forest Aboveground Biomass (AGB) in China’s Loess Plateau by Using Spatial Regression Models. Remote Sens. 2022, 14, 2842. [Google Scholar] [CrossRef] [Scilit]
- Uniyal, S.; Chaurasia, K.; Purohit, S.; Rao, S.S.; Mahammood, V. Geo-ML Enabled Above Ground Biomass and Carbon Estimation for Urban Forests. In Proceedings of the Advanced Computing; Garg, D., Jagannathan, S., Gupta, A., Garg, L., Gupta, S., Eds.; Springer International Publishing: Cham, Switzerland, 2022; pp. 599–617. [Google Scholar]
- Fiorillo, E.; Di Giuseppe, E.; Fontanelli, G.; Maselli, F. Lowland Rice Mapping in Sédhiou Region (Senegal) Using Sentinel 1 and Sentinel 2 Data and Random Forest. Remote Sens. 2020, 12, 3403. [Google Scholar] [CrossRef] [Scilit]
- Ma, X.; Ding, C.; Luan, S.; Wang, Y.; Wang, Y. Prioritizing Influential Factors for Freeway Incident Clearance Time Prediction Using the Gradient Boosting Decision Trees Method. IEEE Trans. Intell. Transp. Syst. 2017, 18, 2303–2310. [Google Scholar] [CrossRef] [Scilit]
- Chomboon, K.; Chujai, P.; Teerarassamee, P.; Kerdprasop, K.; Kerdprasop, N. An Empirical Study of Distance Metrics for K-Nearest Neighbor Algorithm. In Proceedings of the 3rd International Conference on Industrial Application Engineering 2015; The Institute of Industrial Applications Engineers: Kitakyushu, Japan, 2015; pp. 280–285. [Google Scholar]
- Dabija, A.; Kluczek, M.; Zagajewski, B.; Raczko, E.; Kycko, M.; Al-Sulttani, A.H.; Tardà, A.; Pineda, L.; Corbera, J. Comparison of Support Vector Machines and Random Forests for Corine Land Cover Mapping. Remote Sens. 2021, 13, 777. [Google Scholar] [CrossRef] [Scilit]
- Huang, T.; Ou, G.; Xu, H.; Zhang, X.; Wu, Y.; Liu, Z.; Zou, F.; Zhang, C.; Xu, C. Comparing Algorithms for Estimation of Aboveground Biomass in Pinus Yunnanensis. Forests 2023, 14, 1742. [Google Scholar] [CrossRef] [Scilit]
- Ma, J.; Zhang, W.; Ji, Y.; Huang, J.; Huang, G.; Wang, L. Total and Component Forest Aboveground Biomass Inversion via LiDAR-Derived Features and Machine Learning Algorithms. Front. Plant Sci. 2023, 14, 1258521. [Google Scholar] [CrossRef] [Scilit] [PubMed]
- Grimm, R.; Behrens, T.; Märker, M.; Elsenbeer, H. Soil Organic Carbon Concentrations and Stocks on Barro Colorado Island—Digital Soil Mapping Using Random Forests Analysis. Geoderma 2008, 146, 102–113. [Google Scholar] [CrossRef] [Scilit]
- Hoerl, A.E.; Kennard, R.W. Ridge Regression: Biased Estimation for Nonorthogonal Problems. Technometrics 1970, 12, 55–67. [Google Scholar] [CrossRef]
- Li, C.; Li, Y.; Li, M. Improving Forest Aboveground Biomass (AGB) Estimation by Incorporating Crown Density and Using Landsat 8 OLI Images of a Subtropical Forest in Western Hunan in Central China. Forests 2019, 10, 104. [Google Scholar] [CrossRef] [Scilit]
- Rocchini, D.; Chiarucci, A.; Loiselle, S.A. Testing the Spectral Variation Hypothesis by Using Satellite Multispectral Images. Acta Oecol. 2004, 26, 117–120. [Google Scholar] [CrossRef] [Scilit]
- Rocchini, D. Effects of Spatial and Spectral Resolution in Estimating Ecosystem α-Diversity by Satellite Imagery. Remote Sens. Environ. 2007, 111, 423–434. [Google Scholar] [CrossRef] [Scilit]
- Delegido, J.; Verrelst, J.; Alonso, L.; Moreno, J. Evaluation of Sentinel-2 Red-Edge Bands for Empirical Estimation of Green LAI and Chlorophyll Content. Sensors 2011, 11, 7063–7081. [Google Scholar] [CrossRef] [Scilit] [PubMed]
- Korhonen, L.; Hadi; Packalen, P.; Rautiainen, M. Comparison of Sentinel-2 and Landsat 8 in the Estimation of Boreal Forest Canopy Cover and Leaf Area Index. Remote Sens. Environ. 2017, 195, 259–274. [Google Scholar] [CrossRef] [Scilit]
- Gao, B. NDWI—A Normalized Difference Water Index for Remote Sensing of Vegetation Liquid Water from Space. Remote Sens. Environ. 1996, 58, 257–266. [Google Scholar] [CrossRef] [Scilit]
- Grabska, E.; Hostert, P.; Pflugmacher, D.; Ostapowicz, K. Forest Stand Species Mapping Using the Sentinel-2 Time Series. Remote Sens. 2019, 11, 1197. [Google Scholar] [CrossRef] [Scilit]
- Immitzer, M.; Neuwirth, M.; Böck, S.; Brenner, H.; Vuolo, F.; Atzberger, C. Optimal Input Features for Tree Species Classification in Central Europe Based on Multi-Temporal Sentinel-2 Data. Remote Sens. 2019, 11, 2599. [Google Scholar] [CrossRef] [Scilit]
- Veloso, A.; Mermoz, S.; Bouvet, A.; Le Toan, T.; Planells, M.; Dejoux, J.-F.; Ceschia, E. Understanding the Temporal Behavior of Crops Using Sentinel-1 and Sentinel-2-like Data for Agricultural Applications. Remote Sens. Environ. 2017, 199, 415–426. [Google Scholar] [CrossRef] [Scilit]
- Bruggisser, M.; Dorigo, W.; Dostálová, A.; Hollaus, M.; Navacchi, C.; Schlaffer, S.; Pfeifer, N. Potential of Sentinel-1 C-Band Time Series to Derive Structural Parameters of Temperate Deciduous Forests. Remote Sens. 2021, 13, 798. [Google Scholar] [CrossRef] [Scilit]
- Zhu, Z.-X.; Nizamani, M.M.; Sahu, S.K.; Kunasingam, A.; Wang, H.-F. Tree Abundance, Richness, and Phylogenetic Diversity along an Elevation Gradient in the Tropical Forest of Diaoluo Mountain in Hainan, China. Acta Oecologica 2019, 101, 103481. [Google Scholar] [CrossRef] [Scilit]
- McCain, C.M.; Grytnes, J.-A. Elevational Gradients in Species Richness. In Encyclopedia of Life Sciences; John Wiley & Sons, Ltd.: Chichester, NH, USA, 2010. [Google Scholar]
- Bennie, J.; Huntley, B.; Wiltshire, A.; Hill, M.O.; Baxter, R. Slope, Aspect and Climate: Spatially Explicit and Implicit Models of Topographic Microclimate in Chalk Grassland. Ecol. Model. 2008, 216, 47–59. [Google Scholar] [CrossRef] [Scilit]
- Galicia, L.; López-Blanco, J.; Zarco-Arista, A.E.; Filips, V.; García-Oliva, F. The Relationship between Solar Radiation Interception and Soil Water Content in a Tropical Deciduous Forest in Mexico. CATENA 1999, 36, 153–164. [Google Scholar] [CrossRef] [Scilit]
- Lechner, M.; Dostálová, A.; Hollaus, M.; Atzberger, C.; Immitzer, M. Combination of Sentinel-1 and Sentinel-2 Data for Tree Species Classification in a Central European Biosphere Reserve. Remote Sens. 2022, 14, 2687. [Google Scholar] [CrossRef] [Scilit]
- Magurran, A.E. Measuring Biological Diversity. Curr. Biol. 2021, 31, R1174–R1177. [Google Scholar] [CrossRef] [Scilit] [PubMed]
- Morris, E.K.; Caruso, T.; Buscot, F.; Fischer, M.; Hancock, C.; Maier, T.S.; Meiners, T.; Müller, C.; Obermaier, E.; Prati, D.; et al. Choosing and Using Diversity Indices: Insights for Ecological Applications from the German Biodiversity Exploratories. Ecol. Evol. 2014, 4, 3514–3524. [Google Scholar] [CrossRef] [Scilit] [PubMed]
- Fassnacht, F.E.; Latifi, H.; Stereńczak, K.; Modzelewska, A.; Lefsky, M.; Waser, L.T.; Straub, C.; Ghosh, A. Review of Studies on Tree Species Classification from Remotely Sensed Data. Remote Sens. Environ. 2016, 186, 64–87. [Google Scholar] [CrossRef] [Scilit]
- Persson, M.; Lindberg, E.; Reese, H. Tree Species Classification with Multi-Temporal Sentinel-2 Data. Remote Sens. 2018, 10, 1794. [Google Scholar] [CrossRef] [Scilit]
- Madonsela, S.; Cho, M.A.; Ramoelo, A.; Mutanga, O. Investigating the Relationship between Tree Species Diversity and Landsat-8 Spectral Heterogeneity across Multiple Phenological Stages. Remote Sens. 2021, 13, 2467. [Google Scholar] [CrossRef] [Scilit]
- Wang, R.; Gamon, J.A. Remote Sensing of Terrestrial Plant Biodiversity. Remote Sens. Environ. 2019, 231, 111218. [Google Scholar] [CrossRef] [Scilit]
- Huete, A.R. A Soil-Adjusted Vegetation Index (SAVI). Remote Sens. Environ. 1988, 25, 295–309. [Google Scholar] [CrossRef] [Scilit]
- Qi, J.; Chehbouni, A.; Huete, A.; Kerr, Y.; Sorooshian, S. A Modified Soil Adjusted Vegetation Index. Remote Sens. Environ. 1994, 48, 119–126. [Google Scholar] [CrossRef] [Scilit]
- Gitelson, A.A.; Merzlyak, M.N. Signature Analysis of Leaf Reflectance Spectra: Algorithm Development for Remote Sensing of Chlorophyll. J. Plant Physiol. 1996, 148, 494–500. [Google Scholar] [CrossRef] [Scilit]
- Pflugmacher, D.; Rabe, A.; Peters, M.; Hostert, P. Mapping Pan-European Land Cover Using Landsat Spectral-Temporal Metrics and the European LUCAS Survey. Remote Sens. Environ. 2019, 221, 583–595. [Google Scholar] [CrossRef] [Scilit]
- Cavender-Bares, J.; Gamon, J.A.; Townsend, P.A. Remote Sensing of Plant Biodiversity; Springer Nature: Cham, Switzerland, 2020. [Google Scholar]
- Maxwell, A.E.; Warner, T.A.; Fang, F. Implementation of Machine-Learning Classification in Remote Sensing: An Applied Review. Int. J. Remote Sens. 2018, 39, 2784–2817. [Google Scholar] [CrossRef] [Scilit]
- Breiman, L. Random Forests. Mach. Learn. 2001, 45, 5–32. [Google Scholar] [CrossRef] [Scilit]
- Chen, T.; Guestrin, C. XGBoost: A Scalable Tree Boosting System. In Proceedings of the 22nd ACM Sigkdd International Conference on Knowledge Discovery and Data Mining, San Francisco, CA, USA, 13–17 August 2016; ACM Digital Library: New York, NY, USA, 2016; pp. 785–794. [Google Scholar]
- Cortes, C.; Vapnik, V. Support-Vector Networks. Mach. Learn. 1995, 20, 273–297. [Google Scholar] [CrossRef] [Scilit]
- Fernandez-Delgado, M.; Cernadas, E.; Barro, S.; Amorim, D. Do We Need Hundreds of Classifiers to Solve Real World Classification Problems? J. Mach. Learn. Res. 2014, 15, 3133–3181. [Google Scholar]
- Hastie, T.; Tibshirani, R.; Friedman, J. The Elements of Statistical Learning; Springer Series in Statistics; Springer: New York, NY, USA, 2009. [Google Scholar]
- Roberts, D.R.; Bahn, V.; Ciuti, S.; Boyce, M.S.; Elith, J.; Guillera-Arroita, G.; Hauenstein, S.; Lahoz-Monfort, J.J.; Schröder, B.; Thuiller, W.; et al. Cross-Validation Strategies for Data with Temporal, Spatial, Hierarchical, or Phylogenetic Structure. Ecography 2017, 40, 913–929. [Google Scholar] [CrossRef] [Scilit]
- Ploton, P.; Mortier, F.; Réjou-Méchain, M.; Barbier, N.; Picard, N.; Rossi, V.; Dormann, C.; Cornu, G.; Viennois, G.; Bayol, N.; et al. Spatial Validation Reveals Poor Predictive Performance of Large-Scale Ecological Mapping Models. Nat. Commun. 2020, 11, 4540. [Google Scholar] [CrossRef] [Scilit] [PubMed]
- Mallinis, G.; Chrysafis, I.; Korakis, G.; Pana, E.; Kyriazopoulos, A.P. A Random Forest Modelling Procedure for a Multi-Sensor Assessment of Tree Species Diversity. Remote Sens. 2020, 12, 1210. [Google Scholar] [CrossRef] [Scilit]
- Hoffmann, J.; Muro, J.; Dubovyk, O. Predicting Species and Structural Diversity of Temperate Forests with Satellite Remote Sensing and Deep Learning. Remote Sens. 2022, 14, 1631. [Google Scholar] [CrossRef] [Scilit]
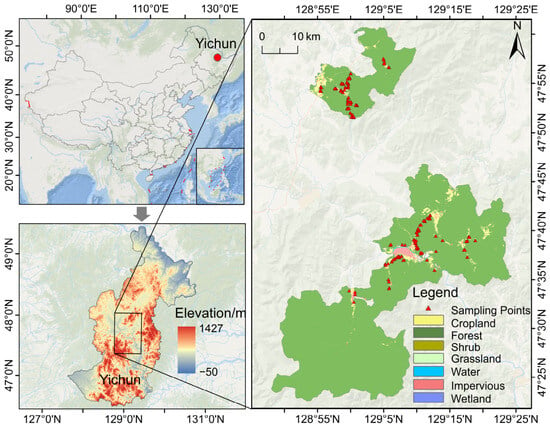
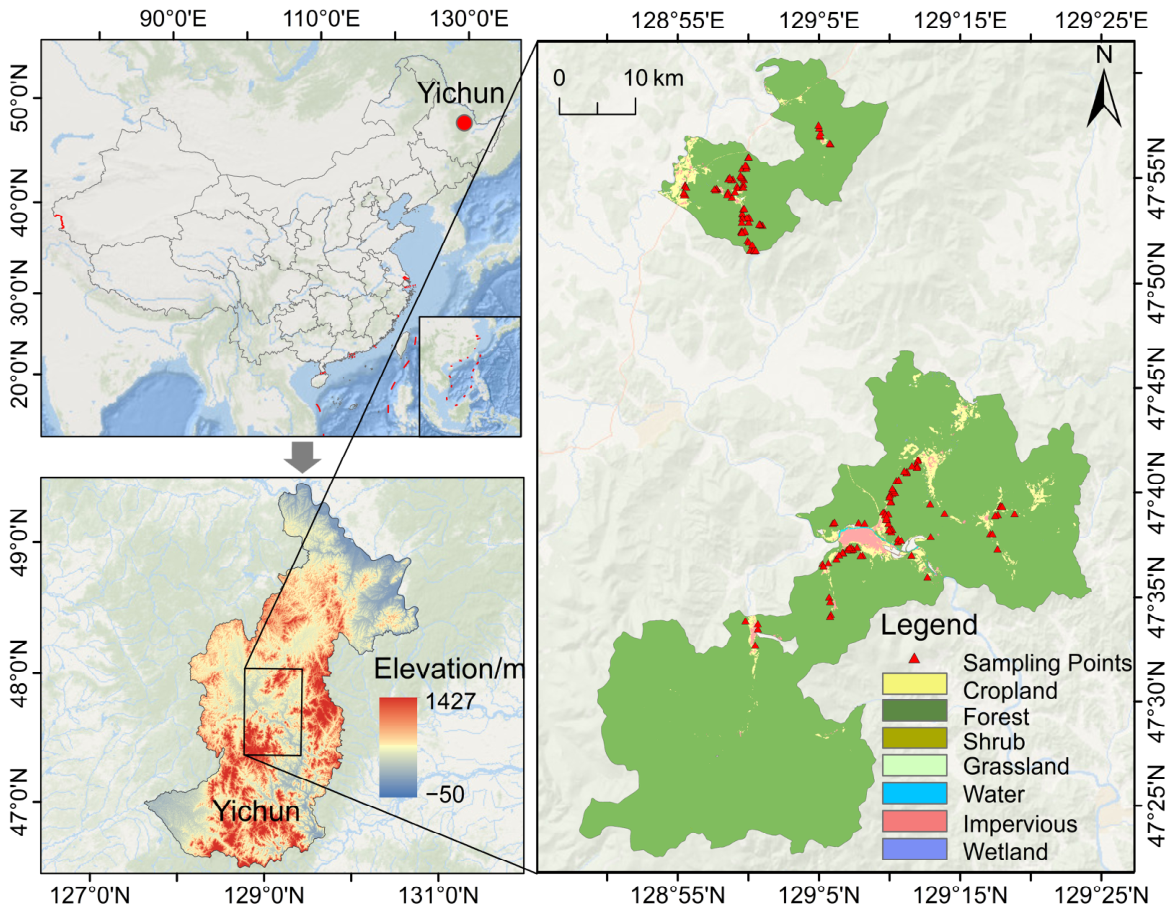
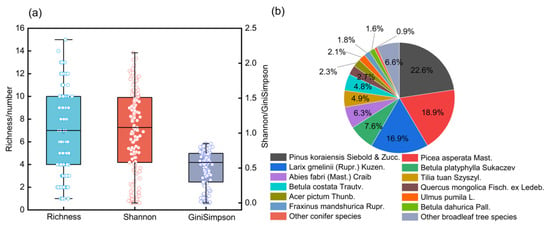
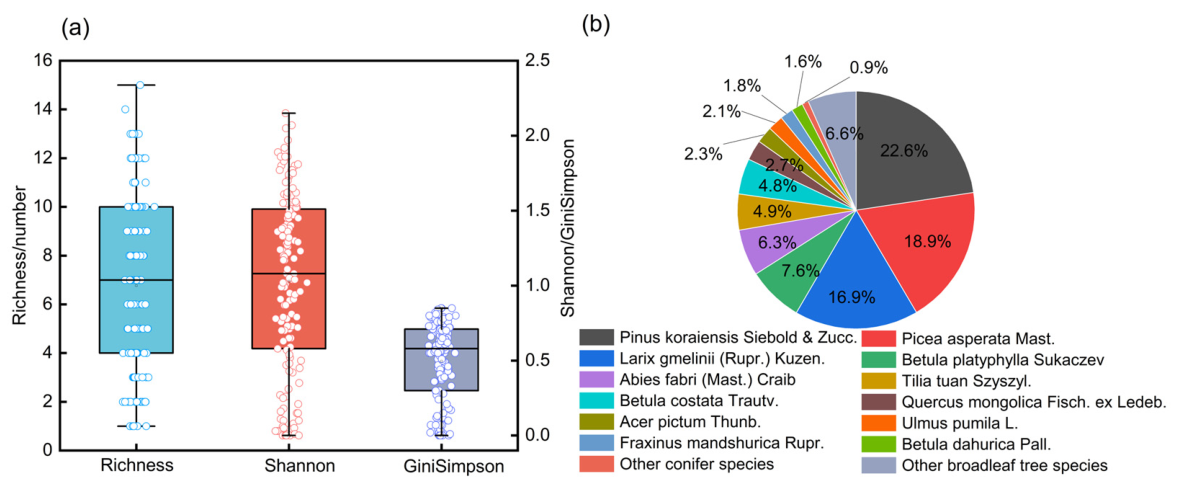
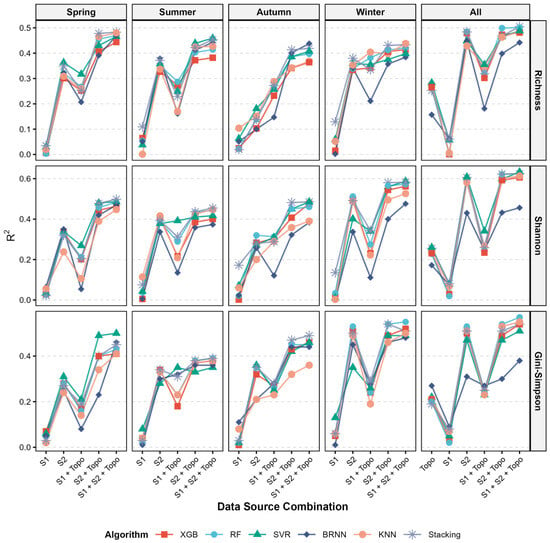
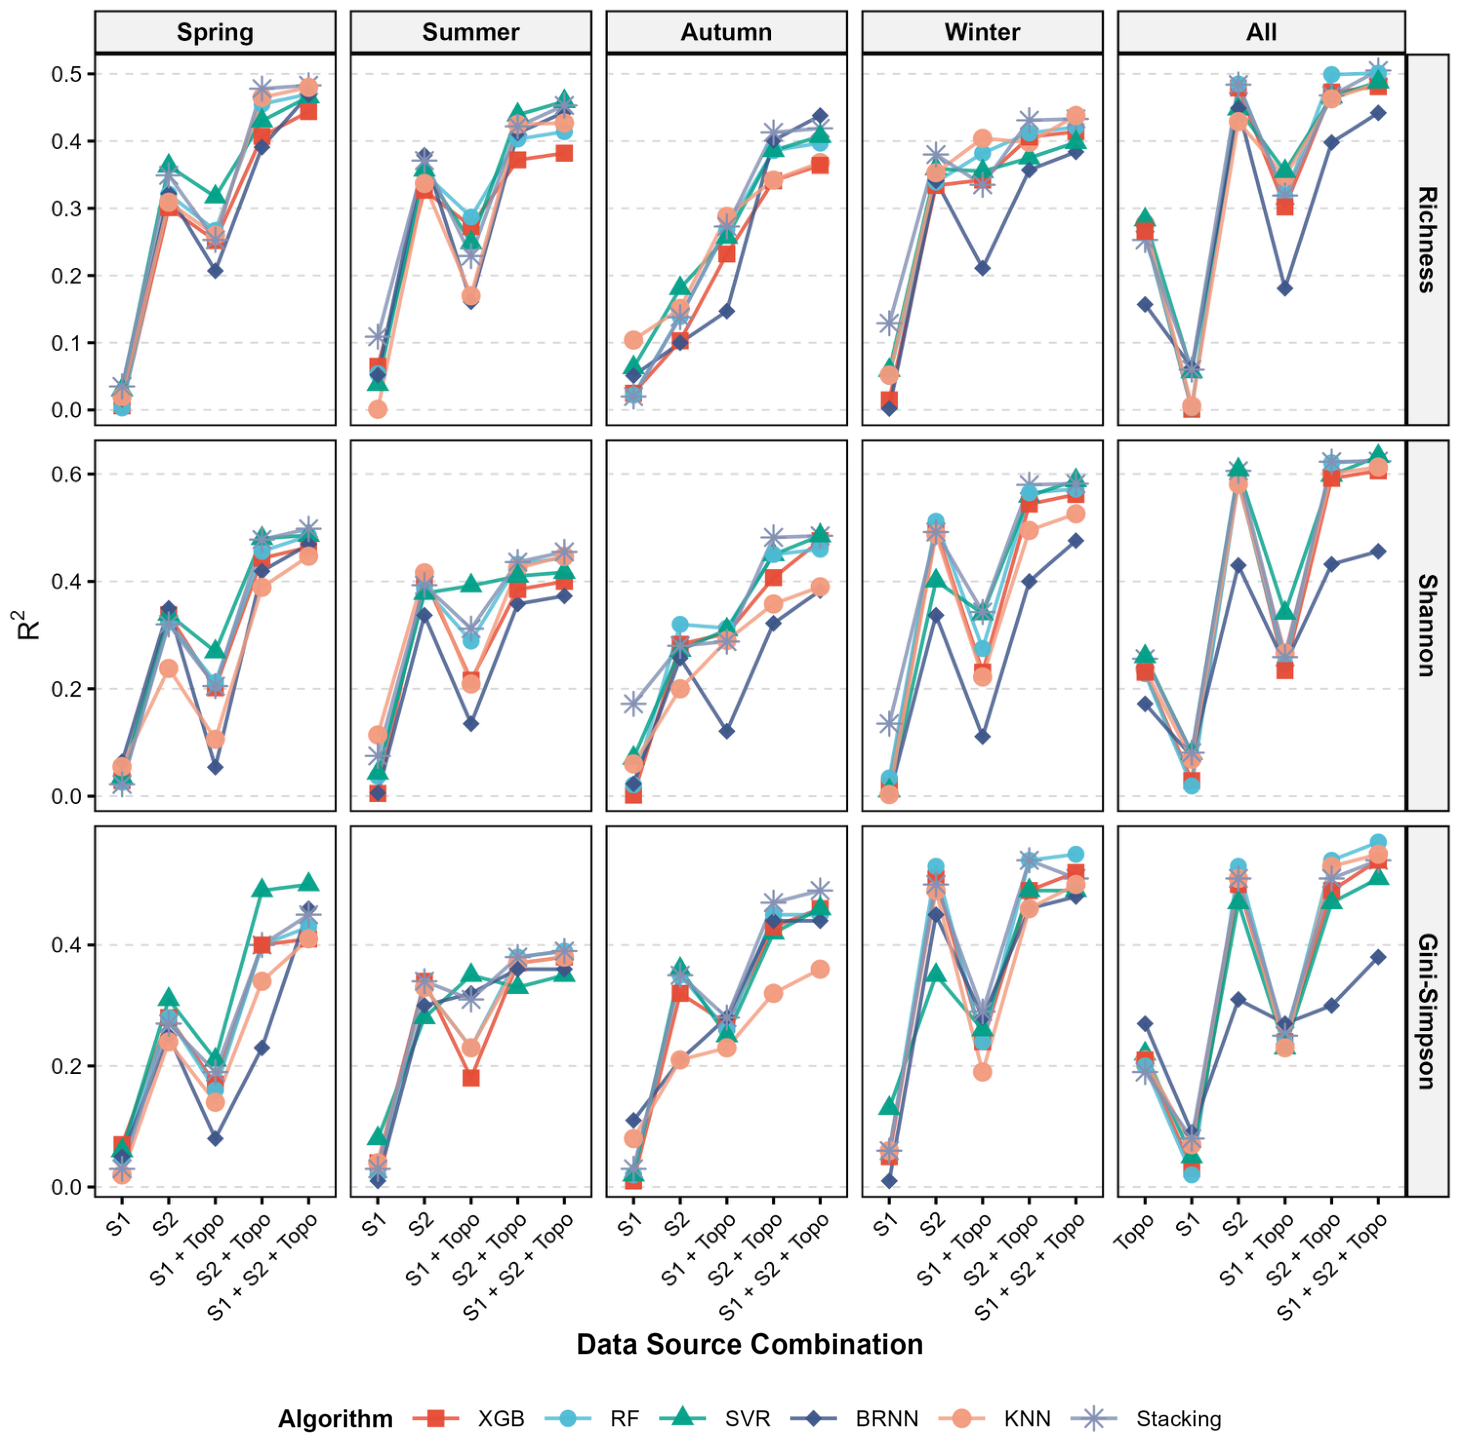
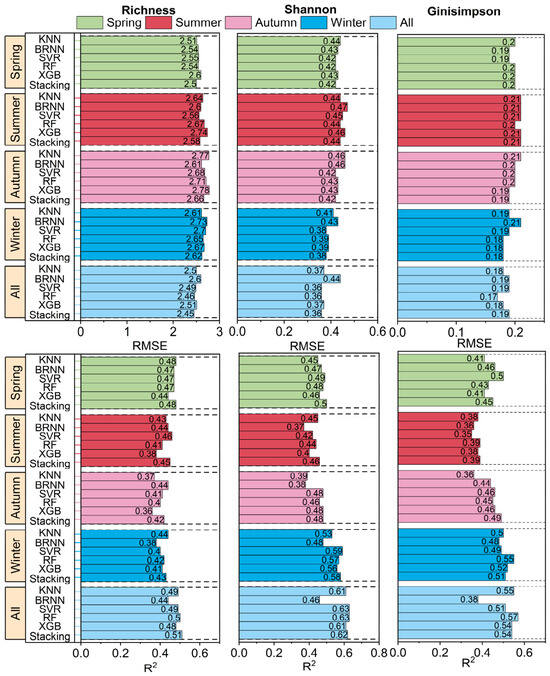
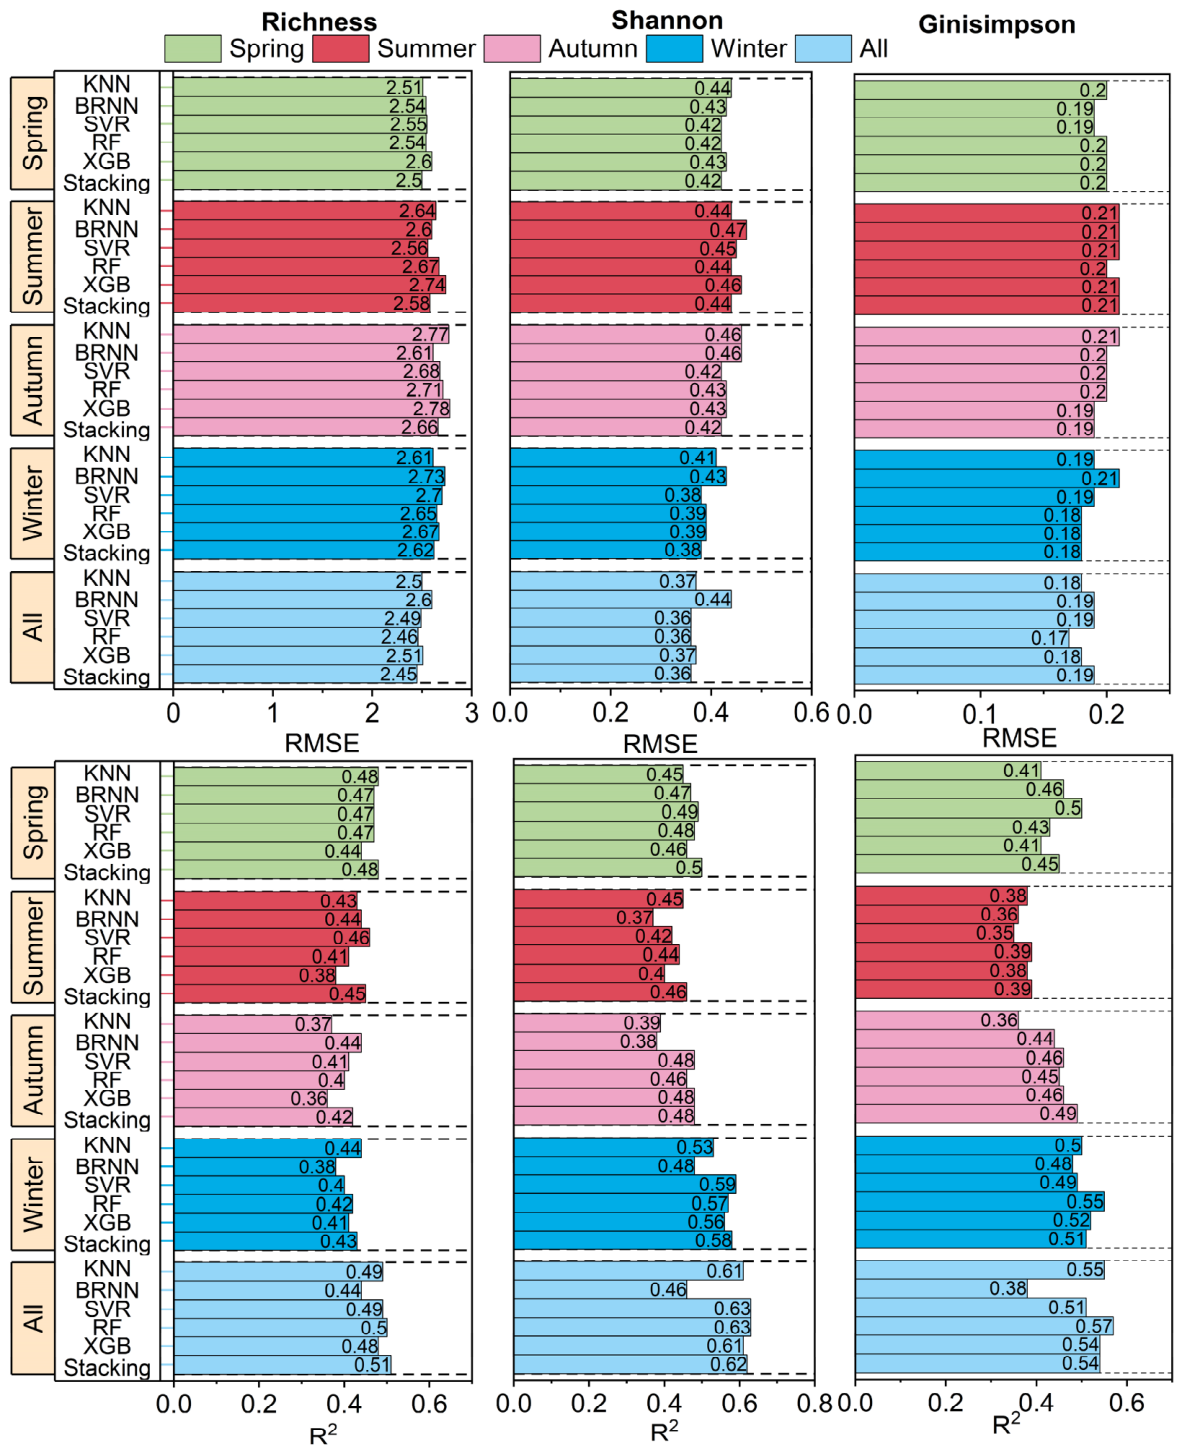
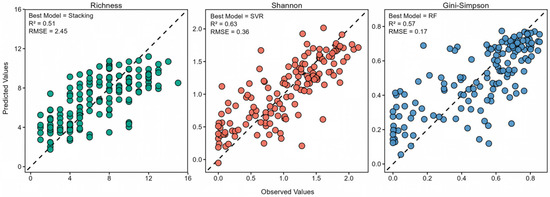
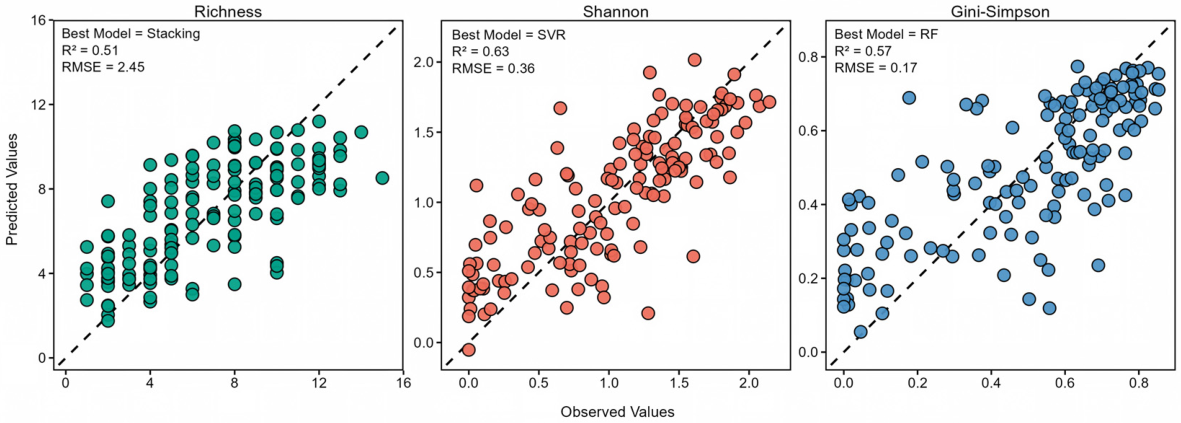
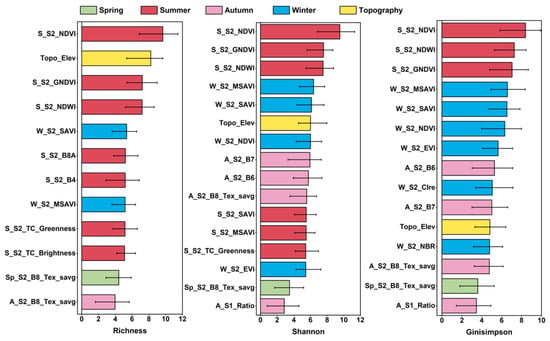
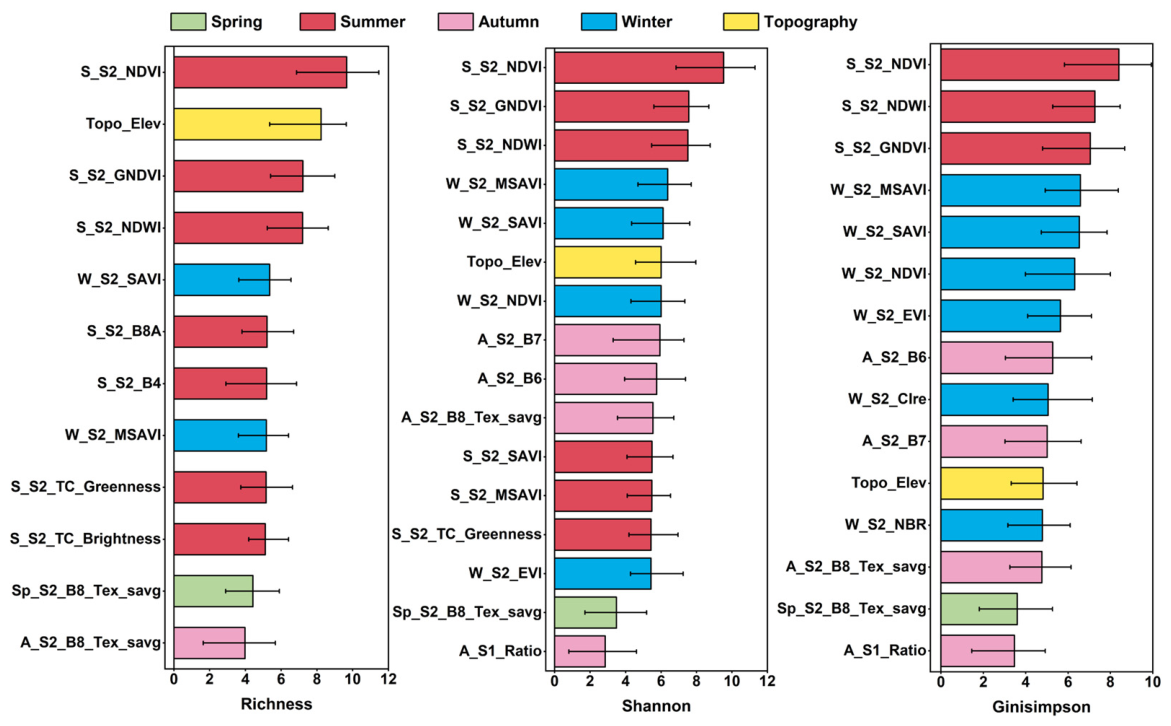
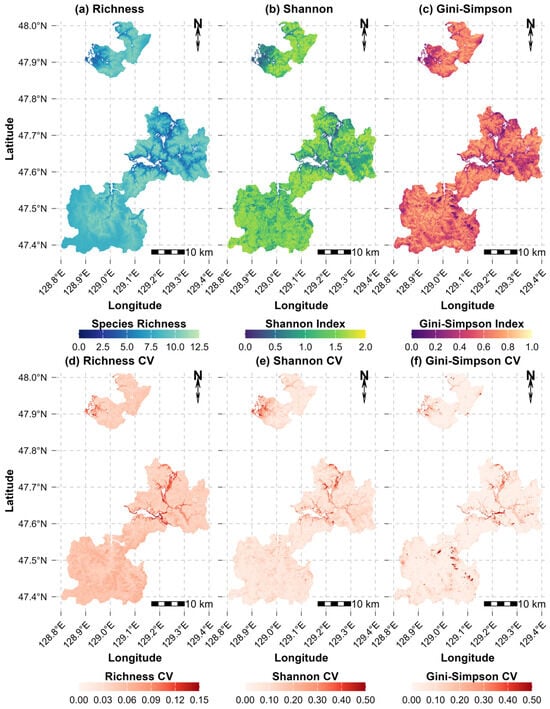
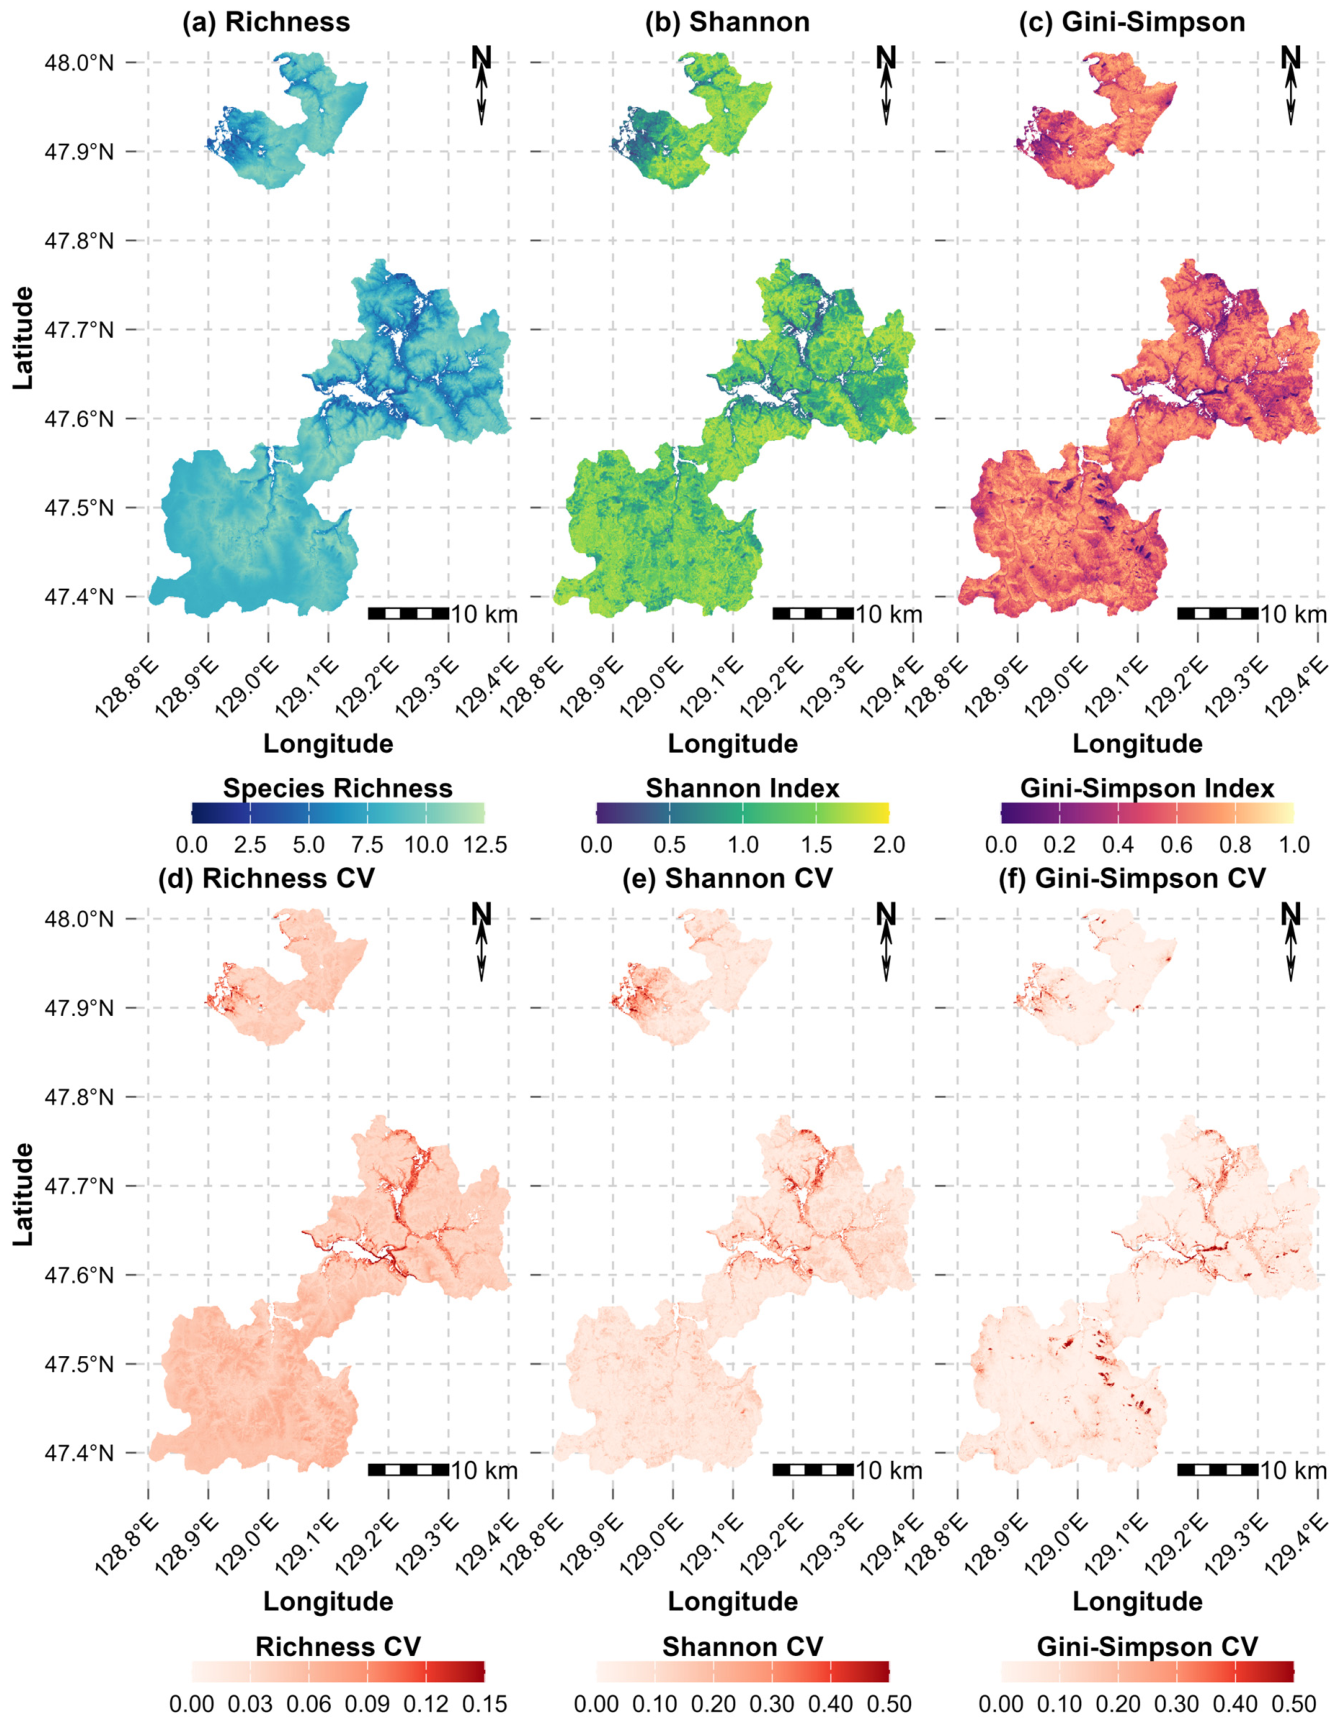
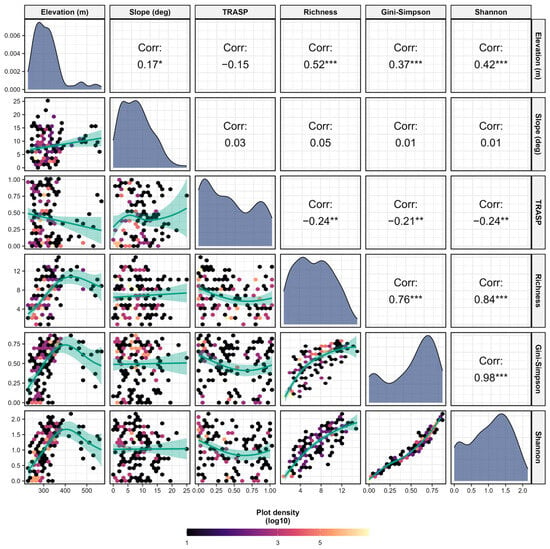
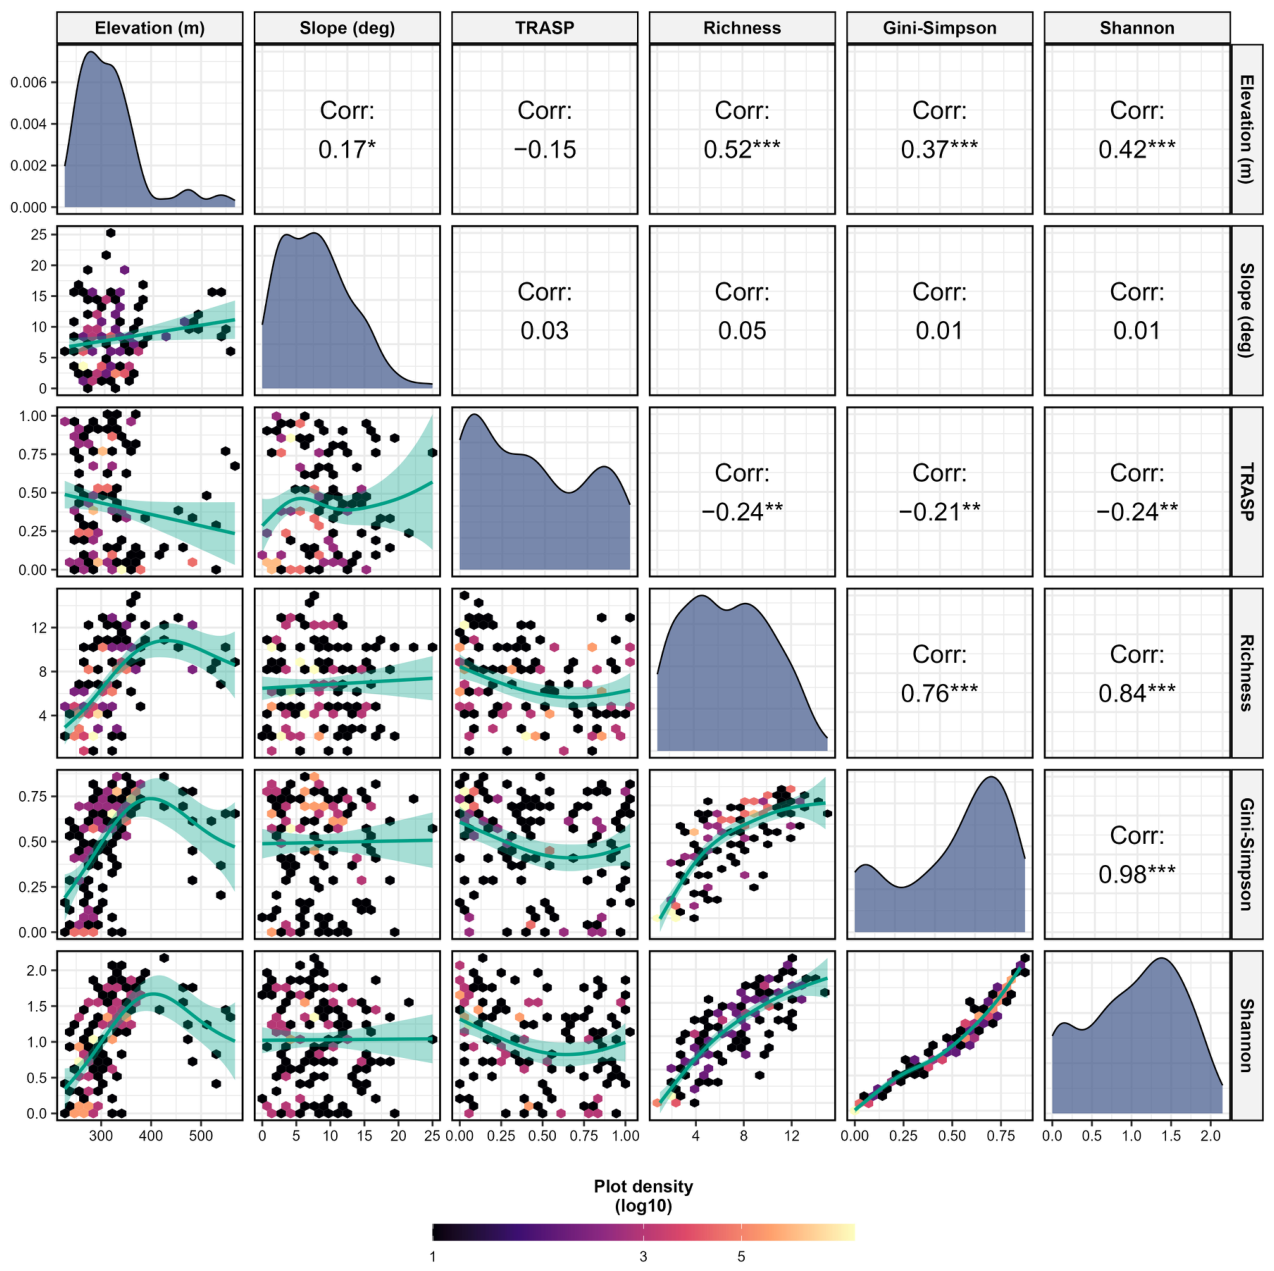
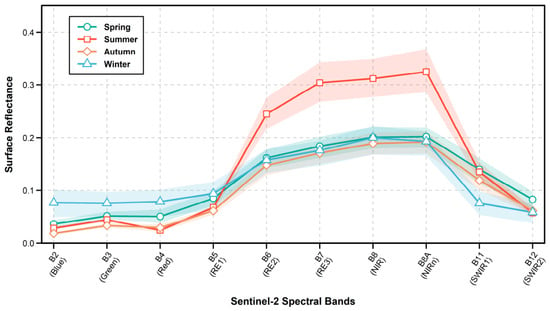
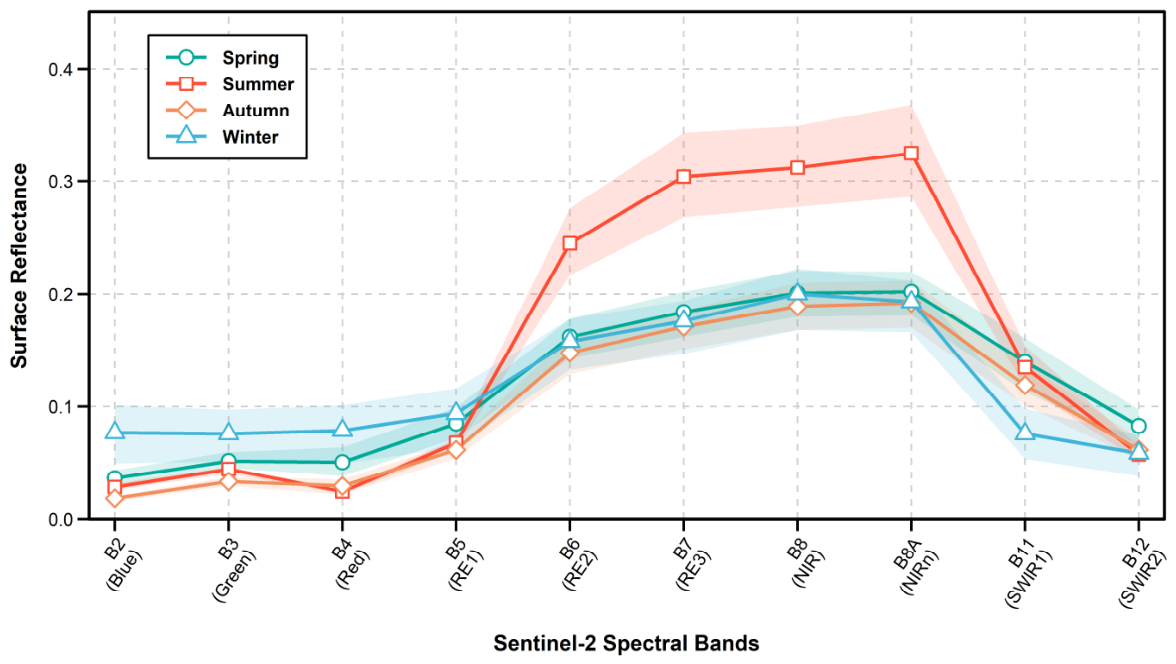
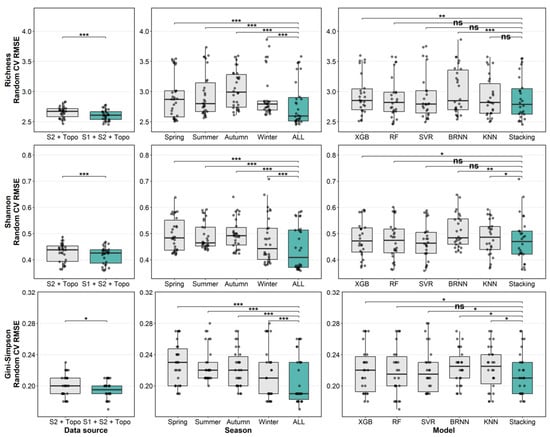
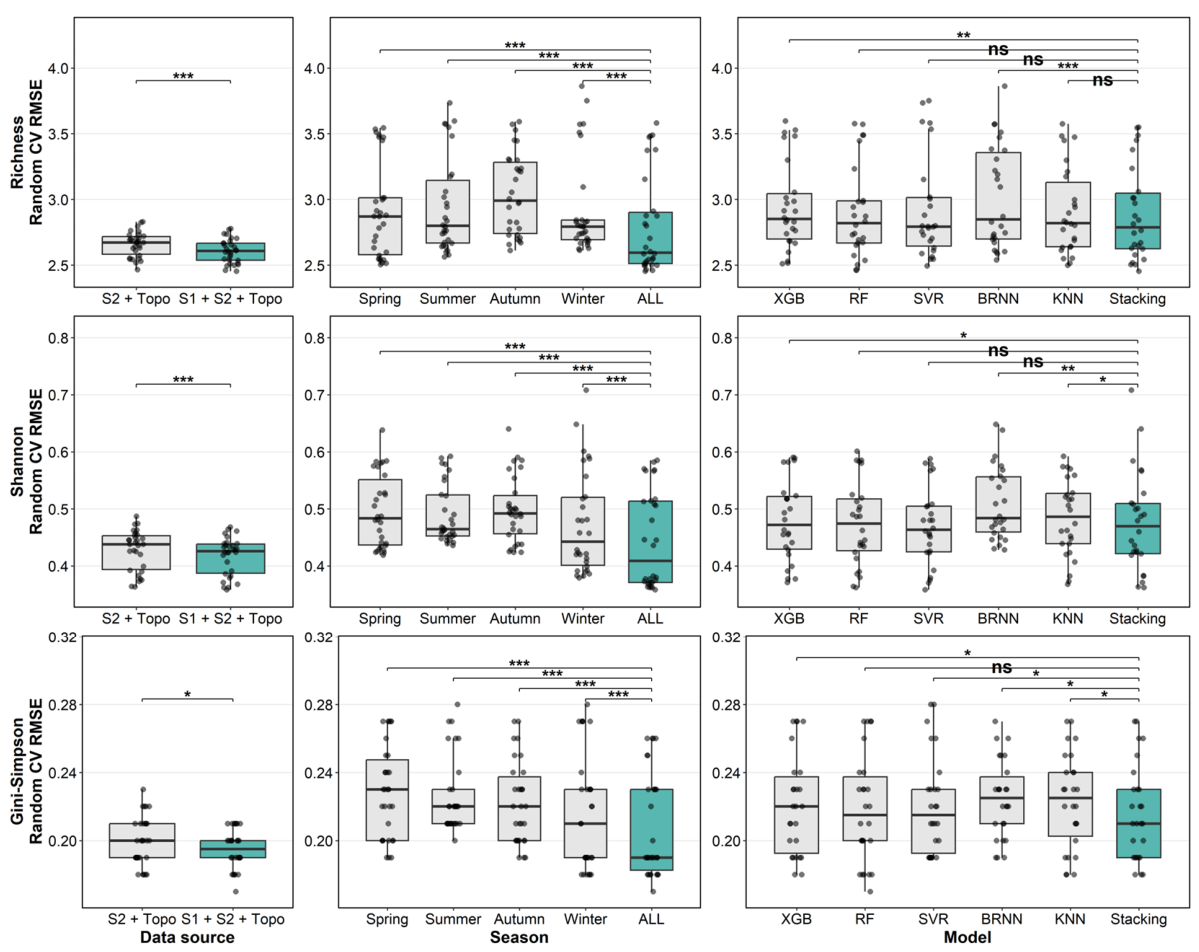

Disclaimer/Publisher’s Note: The statements, opinions and data contained in all publications are solely those of the individual author(s) and contributor(s) and not of MDPI and/or the editor(s). MDPI and/or the editor(s) disclaim responsibility for any injury to people or property resulting from any ideas, methods, instructions or products referred to in the content. |
© 2026 by the authors. Licensee MDPI, Basel, Switzerland. This article is an open access article distributed under the terms and conditions of the Creative Commons Attribution (CC BY) license.