


Highlights
What are the main findings?
- The weekend effect on nitrogen dioxide (NO2) levels is more evident in Rio de Janeiro (23% reduction) than in Volta Redonda (3% reduction).
- Non-traffic emission sources are predominant in Volta Redonda.
What are the implications of the main findings?
- The industrial zone in the region is likely the dominant local source of NO2 in Volta Redonda.
- An increase of 1 μg/m3 in the NO minimum concentration results in a 34% increase in hospitalization rates for the children age group and 25% for the individuals aged 60 and older.
Abstract
Driven by regional demand for stringent emission controls and the associated public health impacts, this study investigates tropospheric NO2 concentrations in Volta Redonda, a major metallurgical hub in Rio de Janeiro State. Initially, TROPOMI data were used to establish spatiotemporal patterns from 2019 to 2024, revealing that Volta Redonda maintains higher NO2 levels than similarly sized urban centers. A detailed analysis of the ‘weekend effect’ showed a minimal 3% reduction in NO2 concentrations during the weekend in Volta Redonda, compared with a 23% drop in Rio de Janeiro city, suggesting that industrial sources of this pollutant predominate over vehicular traffic. This finding is further supported by an analysis of Climate TRACE emissions data, which shows that industrial NOx emissions exceed transportation emissions in this industrial-urban cluster. Local ground station measurements, combined with satellite observations, indicate that the nearby industrial zone is likely the primary source of NO2. Finally, the study quantifies the human cost through a Relative Risk Index (RRI) analysis. Results indicate that a 1 µg/m3 increase in minimum NO2 concentrations leads to a 34% rise in pediatric hospitalizations and a 25% increase among older people, offering critical evidence for regional emission regulations and public health strategies.
1. Introduction
Recent studies combining satellite-derived NO2 data with local and meteorological measurements have significantly advanced our understanding of pollutant emissions and their impacts on human exposure. The NO2 lifetime demonstrates pronounced seasonal variability, ranging from 2–5 h during summer daytime to 12–24 h in winter conditions [1,2], making it an important short-lived climate forcer and a significant public health concern. This pollutant gas is associated with the prevalence of several diseases, such as asthma, particularly in vulnerable populations [3,4,5], which can lead to premature mortality [6] or even lung cancer risk [7,8,9]. Cesar et al. demonstrated that in Taubaté, a medium-sized Brazilian city in São Paulo state, a 1 µg/m3 increase in NOx concentration raised the Relative Risk Index (RRI) of mortality by 8% five days after exposure [10]. On the other hand, Gruzieva et al. demonstrated that a 10 µg/m3 increase in NO2 concentration can result in a 9% elevation in the relative risk of childhood asthma incidence in Sweden [11]. Furthermore, in addition to its direct effects, NOx emissions can have indirect, harmful effects as a precursor to other pollutants, such as ozone (O3) and particulate matter (PM2.5). Recent publications have addressed pollutant gas emissions by incorporating diverse datasets. Goldberg et al. demonstrated that TROPOMI data provide precise spatiotemporal patterns of NO2 concentrations [2], enabling inference of NOx emissions and the detection of lower concentrations during weekends. The authors in References [12,13] investigated how urban NO2 pollution was impacted by COVID-19 lockdown periods, revealing significant changes in air quality. Román-Cascón et al. integrated meteorological data, such as wind and turbulence, to explain the diurnal evolution of pollutants [14]. Stewart et al. analyzed specific vehicular NOx and NO2 emissions, providing critical insights for advancing air pollution modeling [15]. Additionally, OMI-retrieved NO2 and SO2 concentrations have been examined to provide insights into improving air quality [16], and several modeling analyses have been conducted [17,18], among others. Although studies on NO2 concentrations have been widely investigated in the literature, including those addressing health outcomes in the state of São Paulo [10], there is a lack of research analyzing the relationship between NO2, health, and industrial sources in southern Rio de Janeiro state, which is impacted by local pollution.
In light of the global health implications of nitrogen dioxide (NO2) exposure, this work aims to address this research gap by quantitatively examining NO2 concentrations in southern Rio de Janeiro state, a region significantly affected by persistent air pollution, particularly in the industrial hub of Volta Redonda. Volta Redonda is an important logistical hub for freight transportation between two of Brazil’s most populous states, Rio de Janeiro and Minas Gerais, which intensifies heavy-duty truck traffic and further contributes to local and regional NO2 emissions. This study uses TROPOMI observations from 2019 to 2024 to analyze spatiotemporal patterns of tropospheric NO2 concentrations and their impact on the Volta Redonda environment, and to compare these patterns with those in other urban centers in southern Rio de Janeiro state and the Rio de Janeiro metropolitan region. Annual and monthly average NO2 concentrations are provided to achieve this goal. To address the challenge of isolating industrial contributions from traffic-related ones, analyses of weekday–weekend patterns and Climate Trace emissions analysis were conducted to provide insights into their identification. Given the meteorological conditions that influence NO2 concentrations, both local ground-station measurements and satellite observations are incorporated to better characterize weather effects and identify the pollutant source. To reinforce the importance of investigating this pollutant gas in Volta Redonda, the Relative Risk Index (RRI) methodology is employed to highlight the increase in hospitalization rates associated with it [5].
This paper is organized as follows. Section 2 describes the data acquisition process and methodology. Section 3 discusses the results and NO2 trends, integrating satellite and ground-based observations to characterize the environmental issue. Finally, Section 4 presents the main findings and offers recommendations for future research.
2. Materials and Methods
2.1. Air Pollution in the South Region of Rio de Janeiro
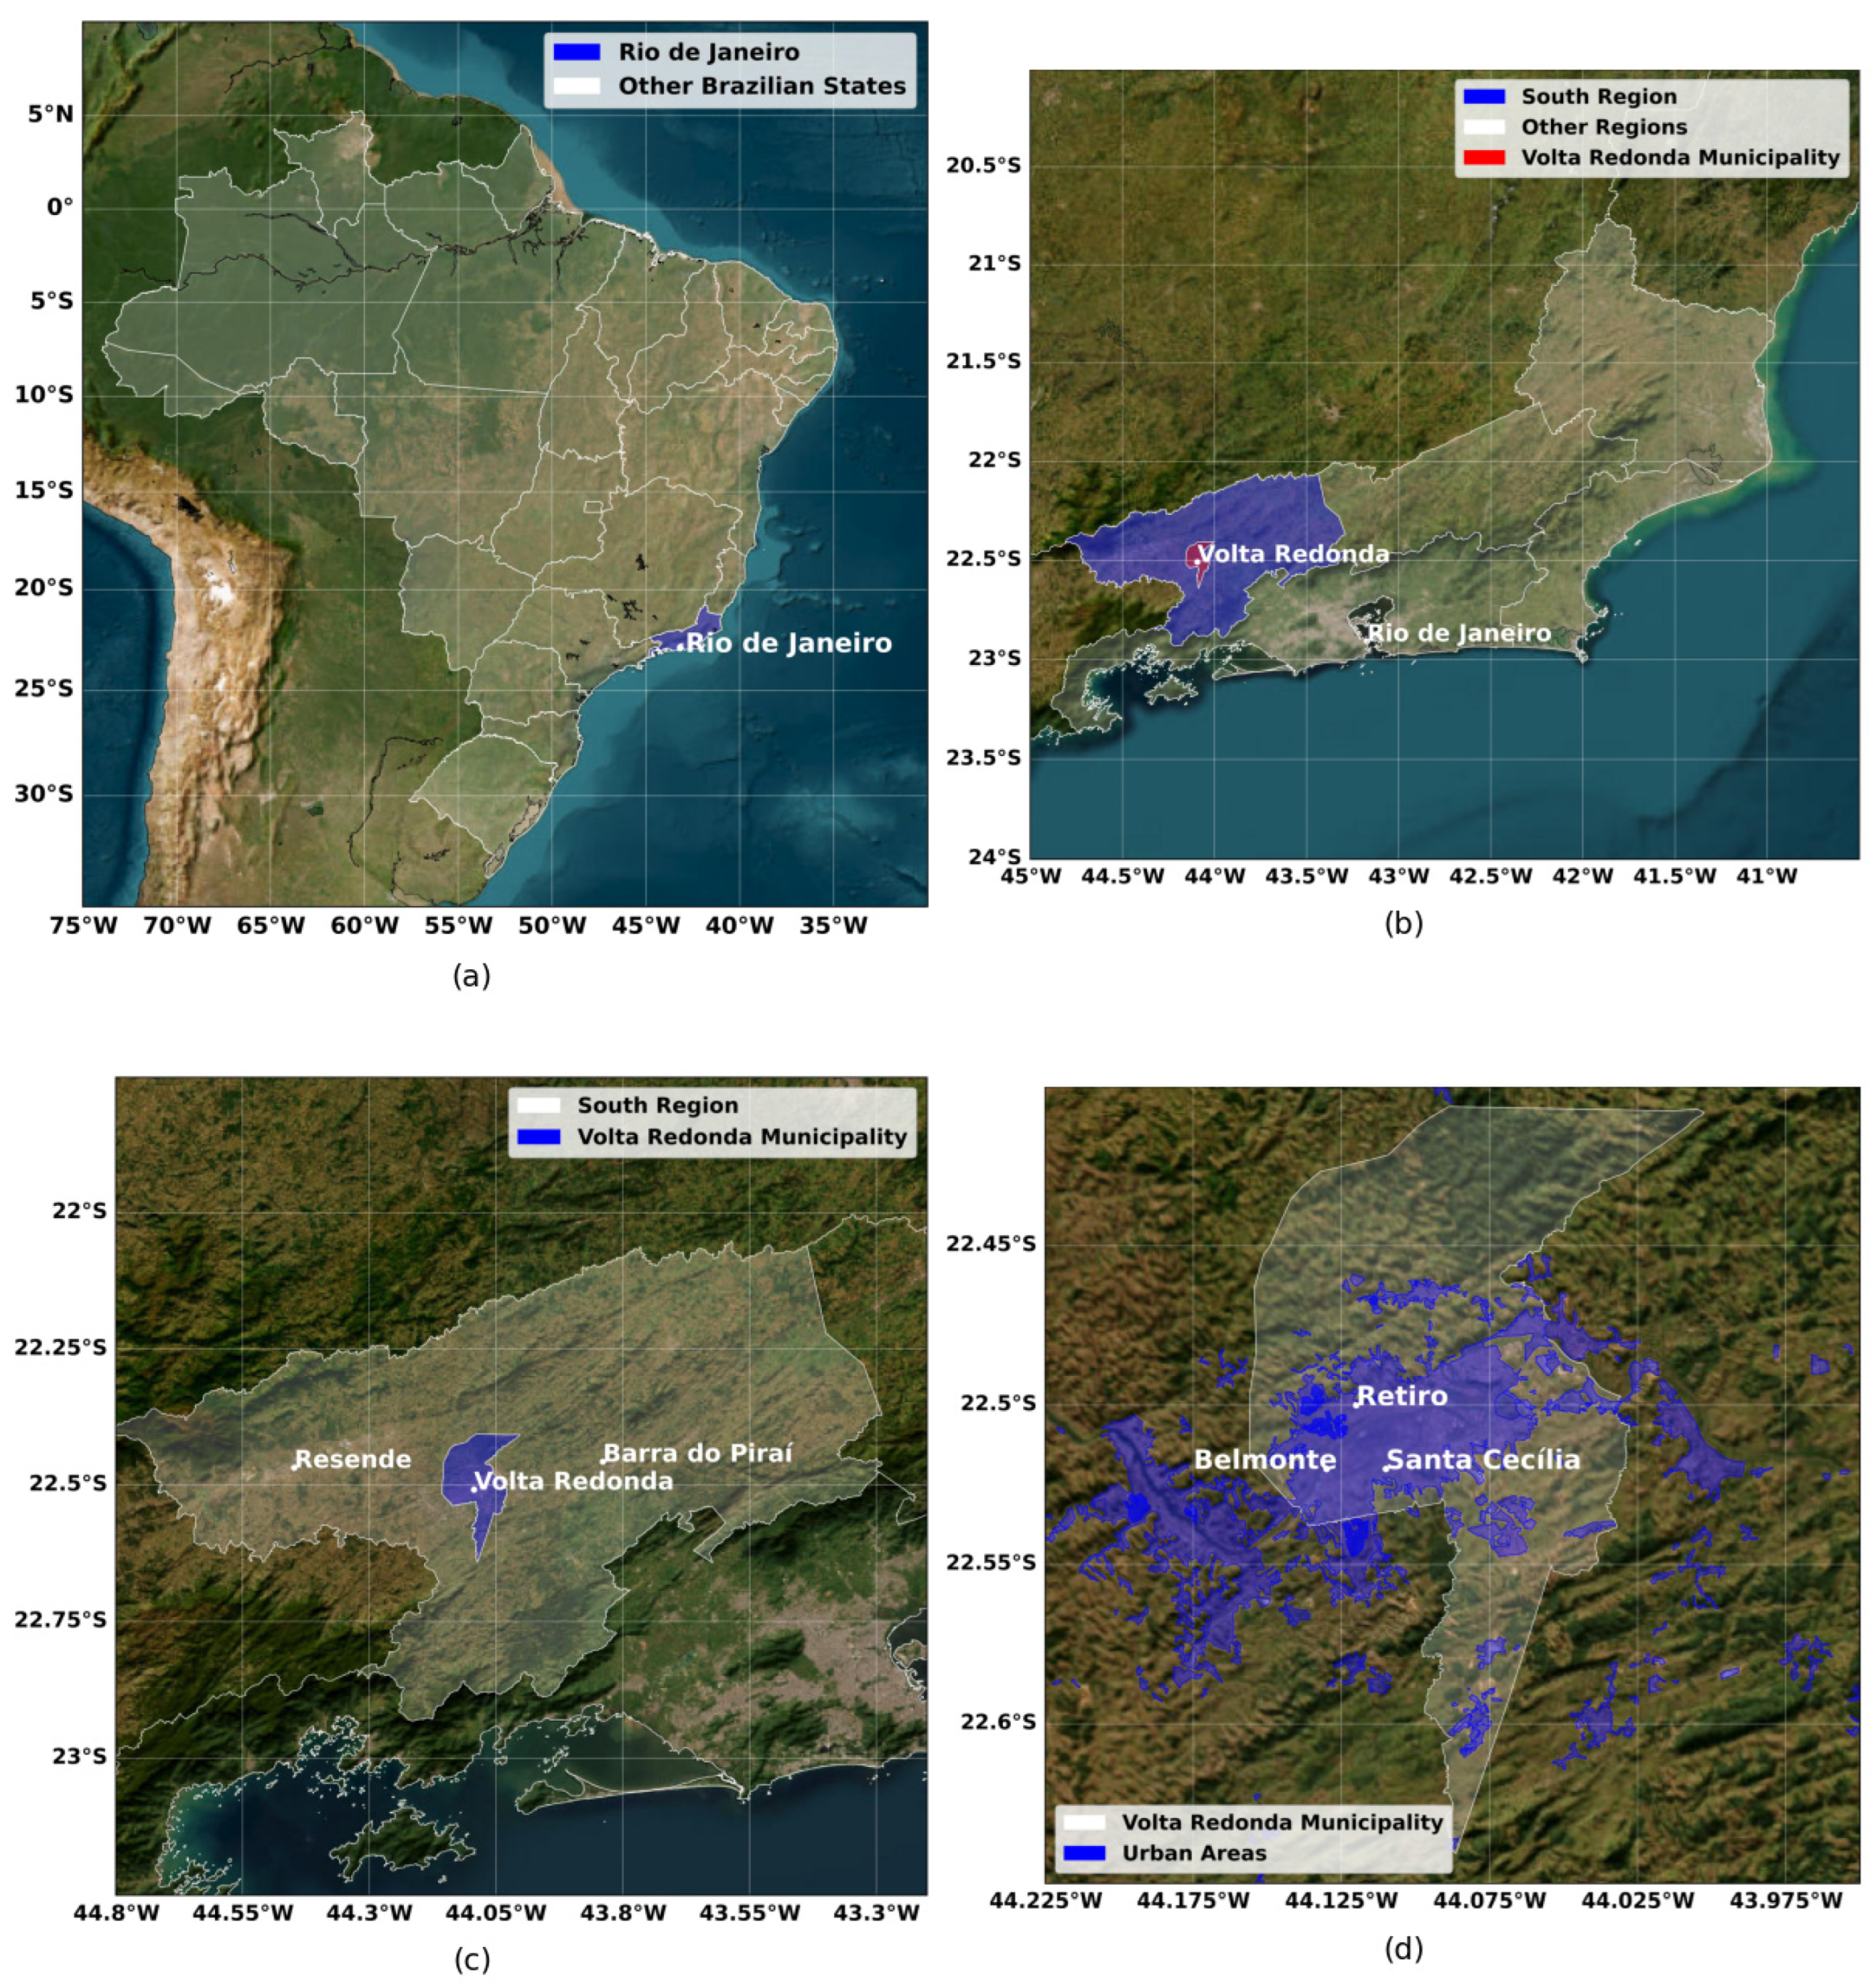
This study examines the southern region of Rio de Janeiro state, focusing on three key municipalities: Volta Redonda (22.52°S, 44.10°W; 390 m above sea level), Resende (22.47°S, 44.45°W; 407 m a.s.l.), and Barra do Piraí (22.46°S, 43.84°W; 363 m a.s.l.); see Figure 1. Volta Redonda, with a population of approximately 262,000 inhabitants [19], stands out for its substantial industrial activity, particularly large-scale steel production, being one of the most significant in Latin America [20]. This facility and associated operations are primary contributors to air pollution in the region.
Figure 1.
Maps showing (a) Brazil, (b) the state of Rio de Janeiro, (c) the southern region of the state with the cities included in the study, and (d) the INEA monitoring stations.
Resende, home to around 129,612 residents [19], derives economic importance from its extensive industrial park, encompassing metalworking, mechanical, chemical, and pharmaceutical sectors. Barra do Piraí, with 92,883 inhabitants [19], holds historical significance for coffee production. Rio de Janeiro (22.91°S, 43.17°W; 8 m a.s.l.), the state capital with 6,211,223 residents, serves distinctly as the region’s principal tourist center. The present study compares tropospheric NO2 concentrations in Volta Redonda against those in Resende and Barra do Piraí, as well as the capital, as illustrated in Figure 1.
2.2. Data Collection
2.2.1. Sentinel-5P Satellite Data (TROPOMI)
The NO2 concentrations were derived from TROPOMI data [21]. The TROPOMI (Tropospheric Monitoring Instrument) is a spectrometer that provides hyperspectral measurements in the ultraviolet (UV), visible (VIS), near-infrared (NIR), and shortwave infrared (SWIR) spectral ranges. The instrument measures key atmospheric constituents, including ozone (O3), nitrogen dioxide (NO2), sulfur dioxide (SO2), carbon monoxide (CO), methane (CH4), formaldehyde (CH2O), and aerosol properties with a spatial resolution of 7 × 3.5 km. It is onboard the Sentinel-5 Precursor (Sentinel-5P) satellite, launched in October 2017 by the European Space Agency (ESA), as part of the Copernicus Earth Observation Program [22,23,24]. Preprocessed (RPRO) and offline (OFF) Sentinel-5P L2-NO2 (level 2) products are utilized with measurements, between 2019 and 2024, calculating weekly, monthly, and annual averages. In our analysis, box plots are provided by considering a radius of 0.04° centered at the latitude and longitude values of each town to better evaluate the variation in pollutant concentration.
2.2.2. Local Station (INEA)
Due to the meteorological influence on NO2 concentrations, an analysis of local station data was also performed. The Rio de Janeiro State Environmental Institute (INEA) serves as the state’s official monitoring agency for atmospheric pollutants. In Volta Redonda, three fixed monitoring stations (Retiro: 22.50°S, 44.12°W; Belmonte: 22.52°S, 44.13°W; Vila Santa Cecília: 22.52°S, 44.11°W) and one mobile station (Nossa Senhora das Graças, installed in 2023 and thus excluded from our analysis), at approximately 390 m a.s.l., provide continuous air quality measurements. NO2 concentration [µg/m3], wind speed [m/s], and wind direction (°) data were extracted to generate bivariate polar plots integrated with Google Earth spatial analyses. Data is available with a temporal resolution of 1 h [25]. To characterize the possible source apportionment of NO2 at the INEA local stations in Volta Redonda, bivariate polar plots were employed. These representations illustrate the average pollutant concentration (indicated by a color scale) for specific wind speed (represented on a radial scale) and direction (angular coordinate) categories. Bivariate polar plots have been commonly used to detect NOx or PM sources, for example, in [26,27,28,29,30]. With this visualization, higher mean concentrations in a particular sector can be linked to a potential NO2 source from that direction, especially when elevated concentrations persist across all radii (corresponding to wind speeds) in that direction.
2.2.3. Climate TRACE Emission Data
To better understand the industrial contribution to total NO2 concentrations, emission inventory data from the Climate TRACE coalition was analyzed. Climate TRACE (Tracking Real-Time Atmospheric Carbon Emissions) is a global non-profit initiative that uses satellite data, ground-based sensors, and artificial intelligence to monitor greenhouse gas emissions in near-real time, as presented in the Climate Trace website [31]. Its publicly available database provides asset-level emission estimates for greenhouse gases, including carbon dioxide equivalent (CO2e), carbon dioxide (CO2), methane (CH4), and nitrous oxide (N2O), as well as for other (not necessarily greenhouse gas) pollutants such as sulfur dioxide (SO2) and black carbon [32,33]. It is possible to obtain information on emissions from several sectors, including agriculture, buildings, manufacturing, fossil-fuel operations, power, and transportation [32,33]. This enables detailed time-series analysis. For example, monthly contributions across different cities can be studied and how local industrial activity and road transportation influence observed NO2 levels (one of the components of the NOx) can be assessed.
As the primary focus of this study is NO2, the terms NO and NOx are mentioned when referring to theoretical model and emission sources, respectively. Specifically, NOx represents the sum of nitric oxide (NO) and nitrogen dioxide (NO2) emitted during combustion processes. Therefore, NO or NOx emissions contribute to ambient NO2 concentrations.
2.2.4. DATASUS and Methodology RRI
All data related to hospitalizations were obtained from the DataSUS platform (https://datasus.saude.gov.br/, accessed on 28 May 2025), a Brazilian federal government tool that provides information on hospitalizations and deaths for all municipalities nationwide. In this work, respiratory diseases correspond to the following International Statistical Classification of Diseases and Related Health Problems (ICDs): J00 (Acute nasopharyngitis), J01 (Acute sinusitis), J02 (Acute pharyngitis), J03 (Acute tonsillitis), J04 (Acute laryngitis and tracheitis), J05 (Acute obstructive laryngitis [croup] and epiglottitis), J06 (Acute upper respiratory tract infections of multiple and unspecified sites), J11 (Influenza [flu] due to unidentified virus), J18 (Pneumonia due to unspecified microorganism), J20 (Acute bronchitis), J21 (Acute bronchiolitis), J22 (Unspecified acute lower respiratory tract infections), J30 (Allergic and vasomotor rhinitis), J32 (Chronic sinusitis), J40 (Bronchitis not specified as acute or chronic), J44 (Other chronic obstructive pulmonary diseases), J45 (Asthma), J46 (Status malaria Asthmatic) and J47 (Bronchiectasis). All information was collected in a daily format, then it was grouped into epidemiological weeks and, finally, separated according to different age groups (children [0–16 years], adults [17–59 years], and older adults [60 years or older]), in accordance with World Health Organization (WHO) guidelines [34].
The Relative Risk Index (RRI) represents the relationship between exposure to a specific factor and the likelihood of disease occurrence [5]. In this work, this index was used to identify how exposure to certain pollutants affects different age groups. First, all pollutant concentration (covariates) data were placed in weekly temporal resolution, generating three sub-series for each, containing the maximum, average, and minimum weekly concentration values, respectively. Finally, a multivariate generalized linear model (GLM) with a negative binomial link function, commonly adopted in the analysis of hospital admission counts [5], is generated, such that the linear predictor takes the form:
where μt is the expected number of hospitalizations at time t, x1t,…,xnt are the exposure variables of interest (e.g., temperature, relative humidity, pollutant concentration, etc.), and z1t,…,zpt are control covariates with coefficients β,Yj,δt, respectively. The RRI associated with a unit increase in x is obtained by the exponential of the estimated coefficient:
The 95% confidence interval is calculated by propagating the uncertainty of . Since logRRI is asymptotically normal with variance equal to the estimated variance of , applying the exponential transformation to both limits yields the 95% CI of RRI on the original scale:
where SE() is the standard error of the coefficient, derived from the diagonal of the estimated covariance matrix.
log(μt) = α + β1x1t + ⋯ + βnxnt + Y1Z1t + ⋯ + YpZpt + δt
The initial model included all covariates. Covariates with a p-value [35] greater than 0.01 were removed using manual backward stepwise elimination. The final model was created based on the most relevant covariates. This approach enables us to assess how different covariates affect each age group.
3. Results and Discussions
3.1. Annual TROPOMI NO2 Tropospheric Column
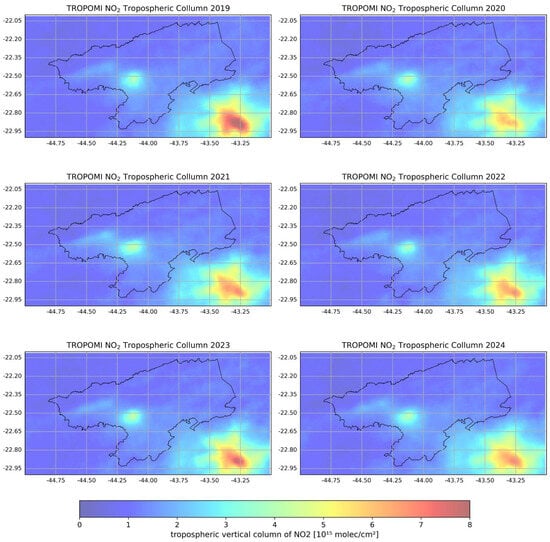
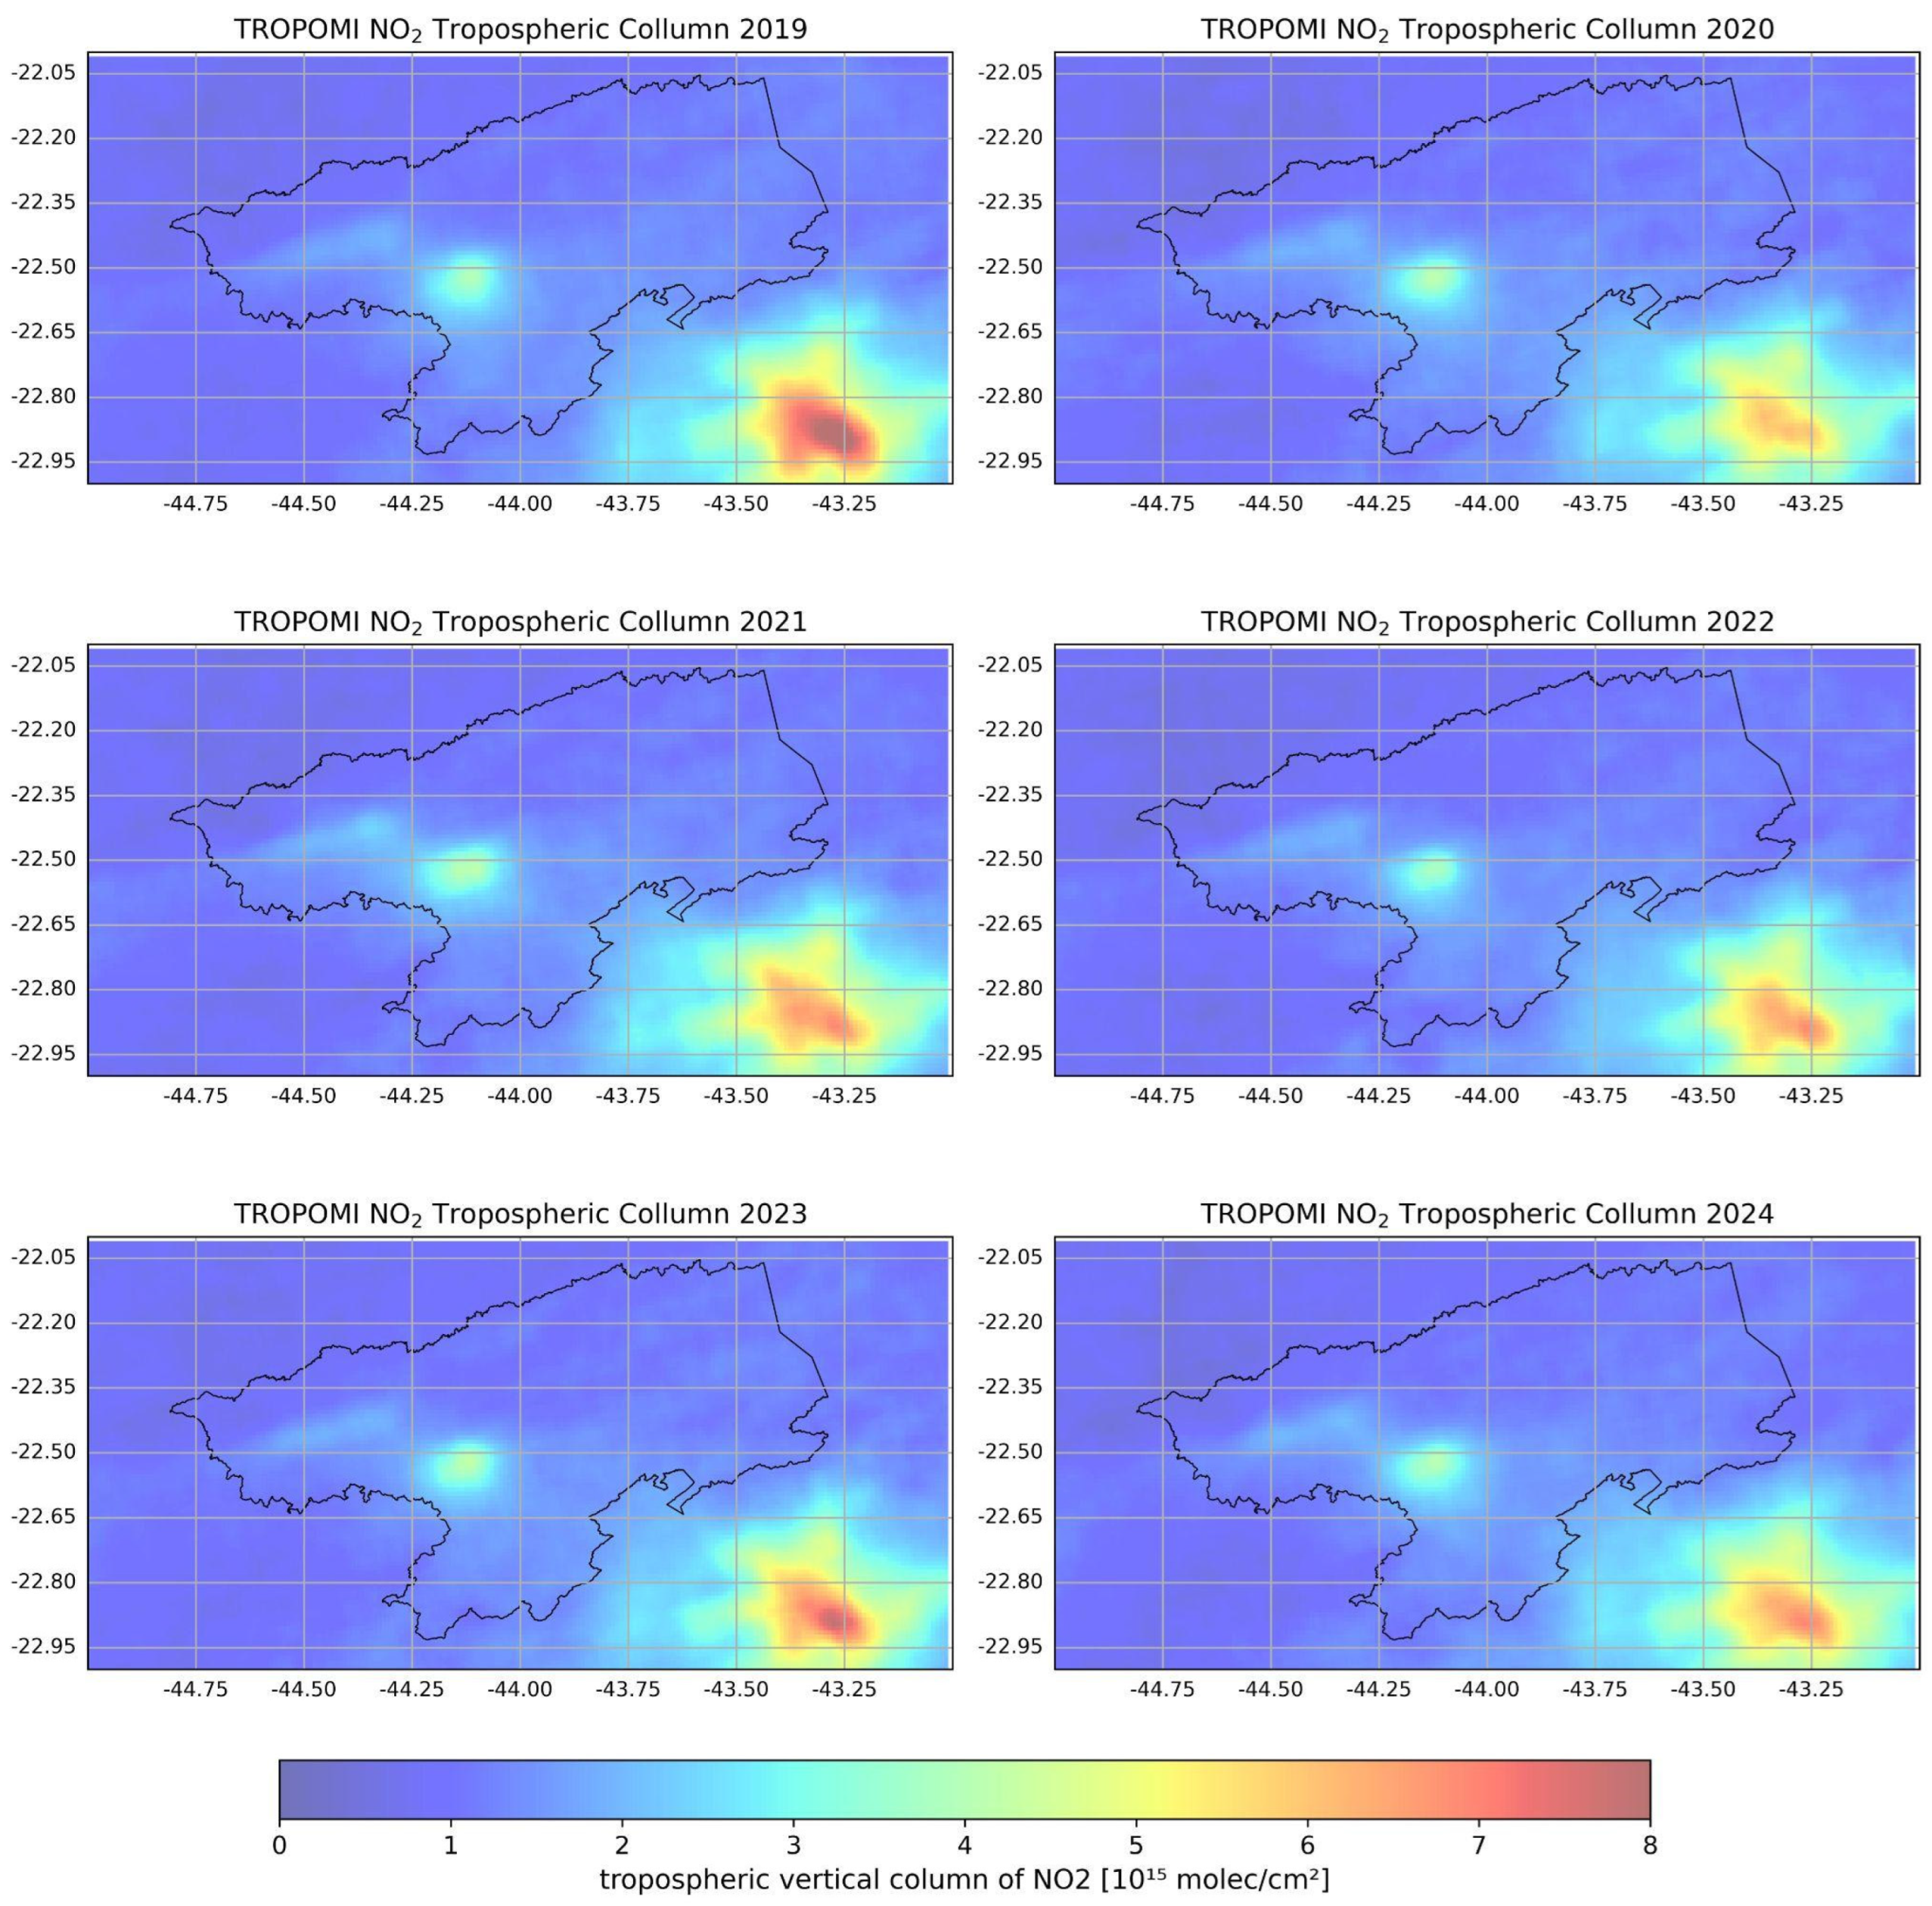
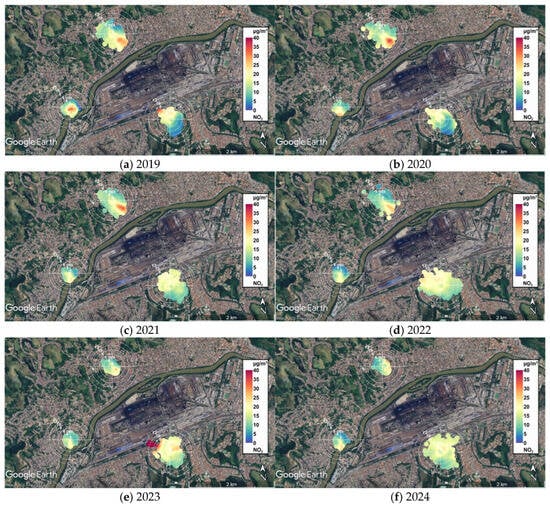
Figure 2 shows the annual averages of TROPOMI NO2 tropospheric vertical column for the South region of Rio de Janeiro for the period 2019–2024. Persistently elevated NO2 concentrations are observed annually in both Volta Redonda (3–4 × 10¹⁵ molecules/cm2) and Rio de Janeiro (6–8 × 10¹⁵ molecules/cm2) cities, with values consistent in magnitude with those reported by [2] for similar industrial and urban environments in the United States. To assess spatiotemporal variations in NO2 concentrations, boxplots were generated for each study city (Section 2) using data within a 0.04° radius of their geographic coordinates [36].
Figure 2.
Annual TROPOMI NO2 concentration averages for the period between 2019 and 2024 in the southern part of Rio de Janeiro.
The TROPOMI tropospheric NO2 column measures the total number of NO2 molecules integrated vertically throughout the troposphere and it is expressed in Pmolec cm−2 (1 Pmolec = 1015 molecules). In contrast, ground-based monitoring stations measure the near-surface mass concentration of NO2, typically at low altitudes above ground level, and report the results in µg m−3. These quantities represent different physical properties of the atmosphere; there is no direct conversion from tropospheric column density (Pmolec cm−2) to surface concentration (µg m−3). Such a conversion requires additional information on the vertical distribution of NO2, including the planetary boundary layer height, atmospheric temperature, pressure, and other meteorological variables together with chemical transport models or atmospheric reanalysis datasets [37,38]. As some additional information required to convert satellite-derived NO2 column densities into ground-level concentrations is unavailable in our region, we instead combined multiple complementary datasets to investigate the association between NO2 concentrations and population health outcomes.
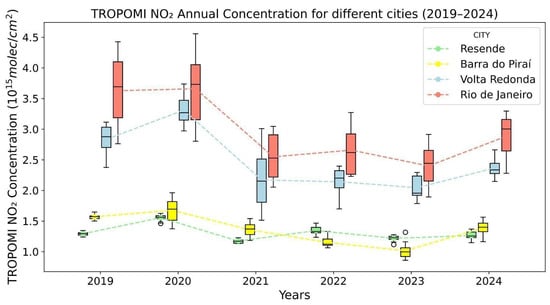
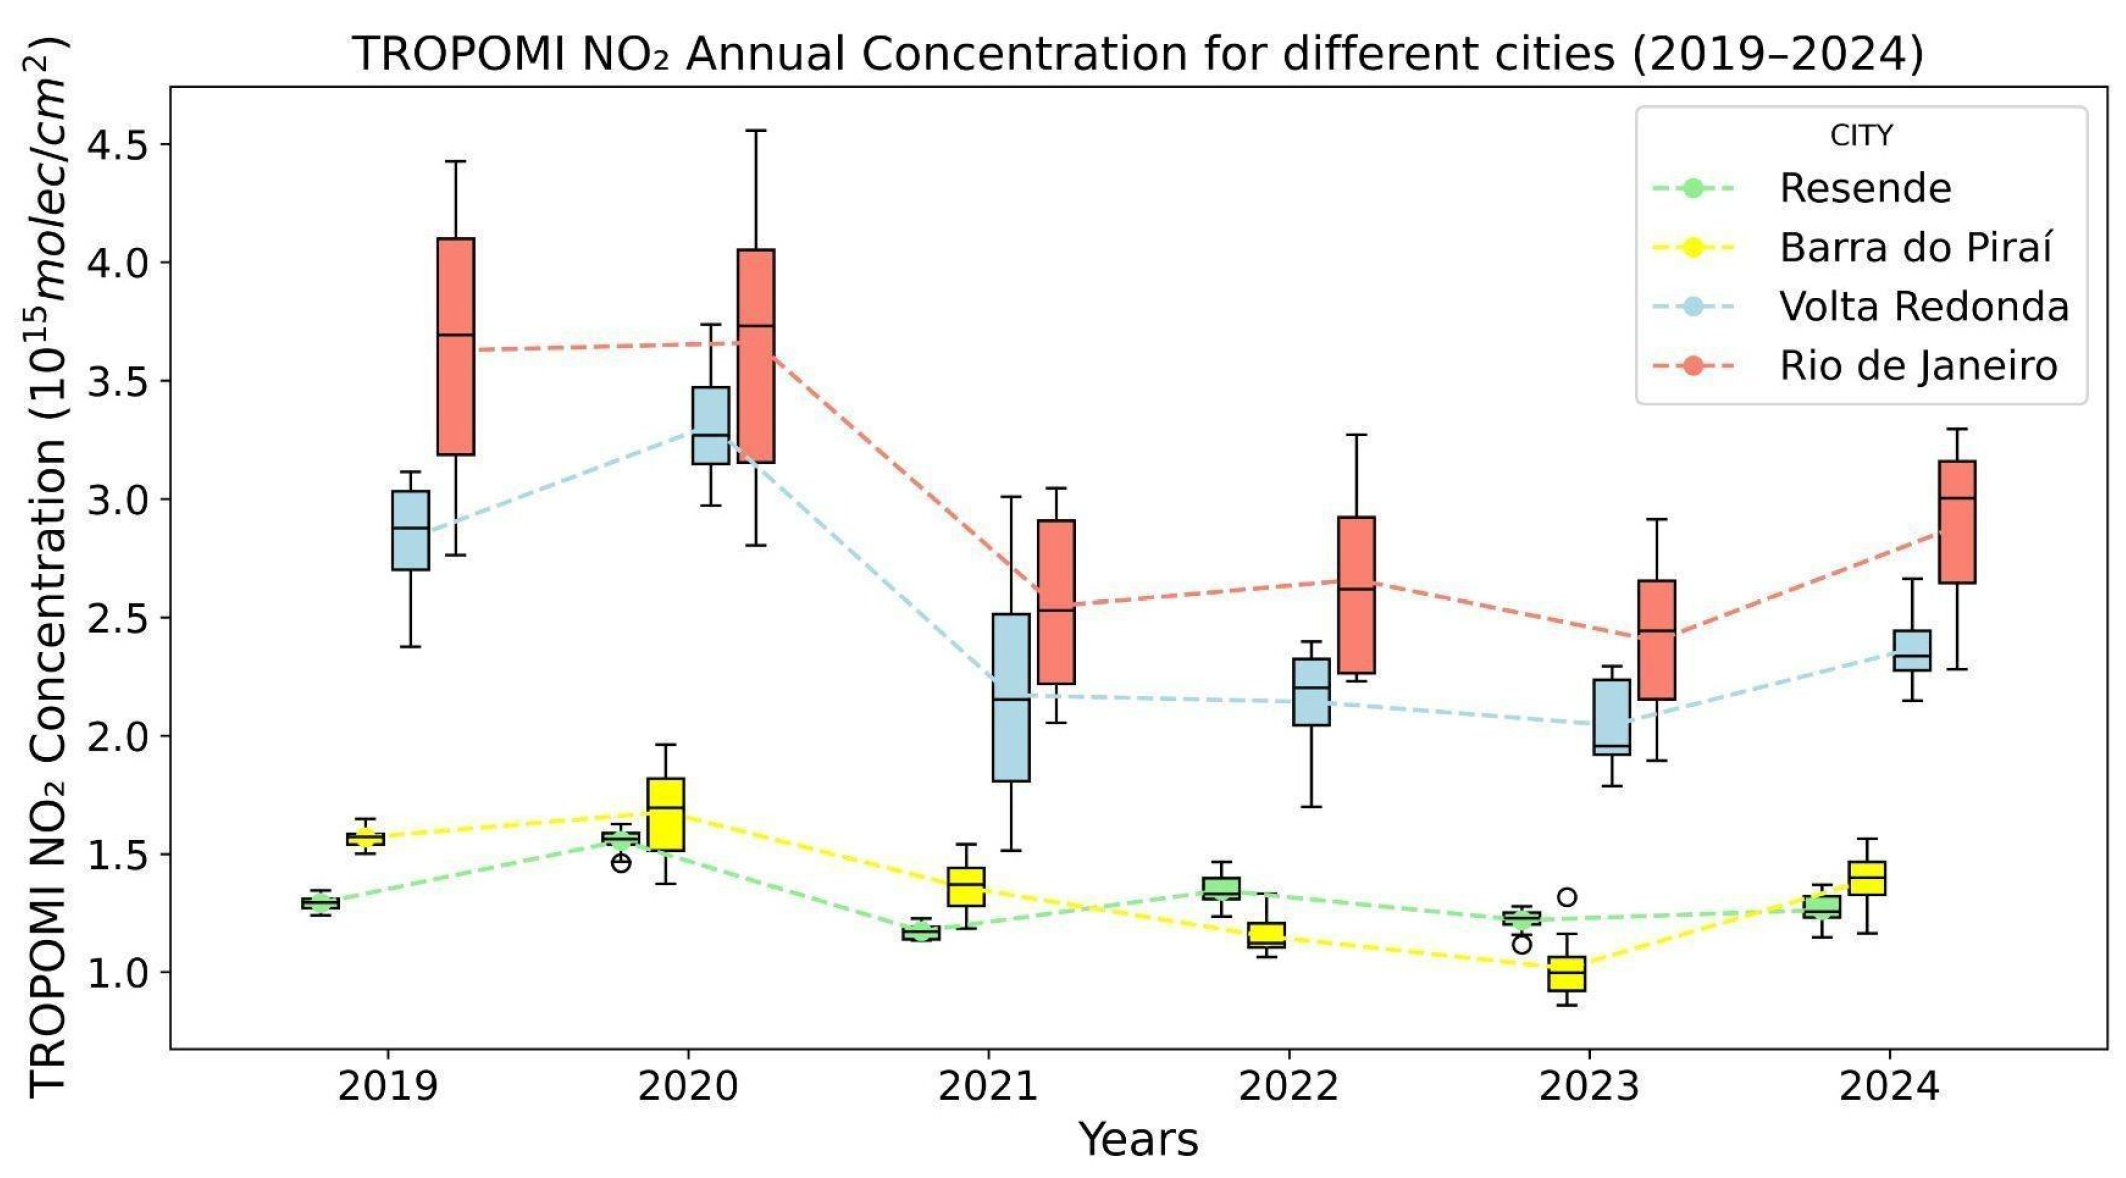
Figure 3 demonstrates the comparative annual averages, showing: (1) similar magnitude between Volta Redonda and Rio de Janeiro, and (2) substantially lower values in Resende and Barra do Piraí (despite their comparable urban characteristics to Volta Redonda). To better understand the distinct weekday and weekend patterns, these annual averages of TROPOMI NO2 (all numerical values in the plot) were analyzed by dividing them into weekday and weekend categories. The numerical data show that while Resende and Barra do Piraí maintained consistent ranges (0.5–2.0 × 10¹⁵ molecules/cm2) across both periods, Volta Redonda showed moderately higher concentrations (1.5–3.5 × 10¹⁵ molecules/cm2) in both periods, and Rio de Janeiro exhibited the most pronounced variability, with weekday levels (2.0–4.5 × 10¹⁵ molecules/cm2) significantly exceeding weekend measurements (0.5–3.0 × 10¹⁵ molecules/cm2). This preliminary analysis suggests a weekend effect, likely driven by reduced road traffic, but only in the Rio de Janeiro dataset. To highlight the weekday–weekend effect, the monthly average was investigated along with the weekday–weekend division in the sequence.
Figure 3.
Boxplots for the annual mean tropospheric NO2 vertical column densities from TROPOMI, comparing urban areas in southern Rio de Janeiro (Volta Redonda, Resende, Barra do Piraí) with the city of Rio de Janeiro (2019–2024). A colored point in the boxplot marks the mean value. The box shows the 25th percentile (Q1), the median (50th percentile), and the 75th percentile (Q3).
3.2. Monthly TROPOMI NO2 Tropospheric Column Average: Weekday and Weekend Analysis
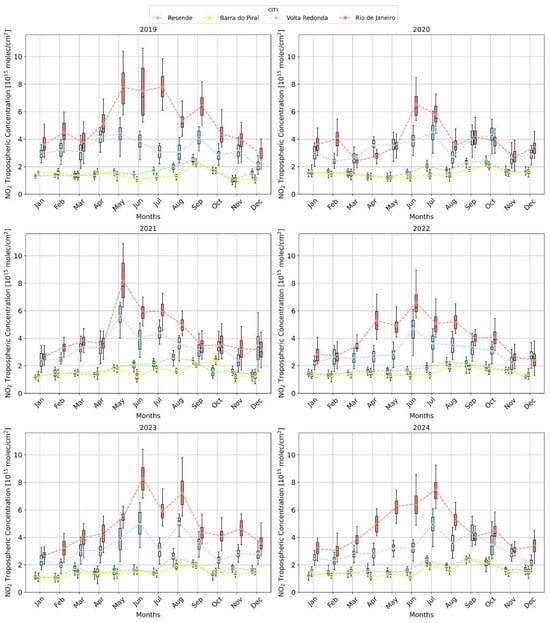
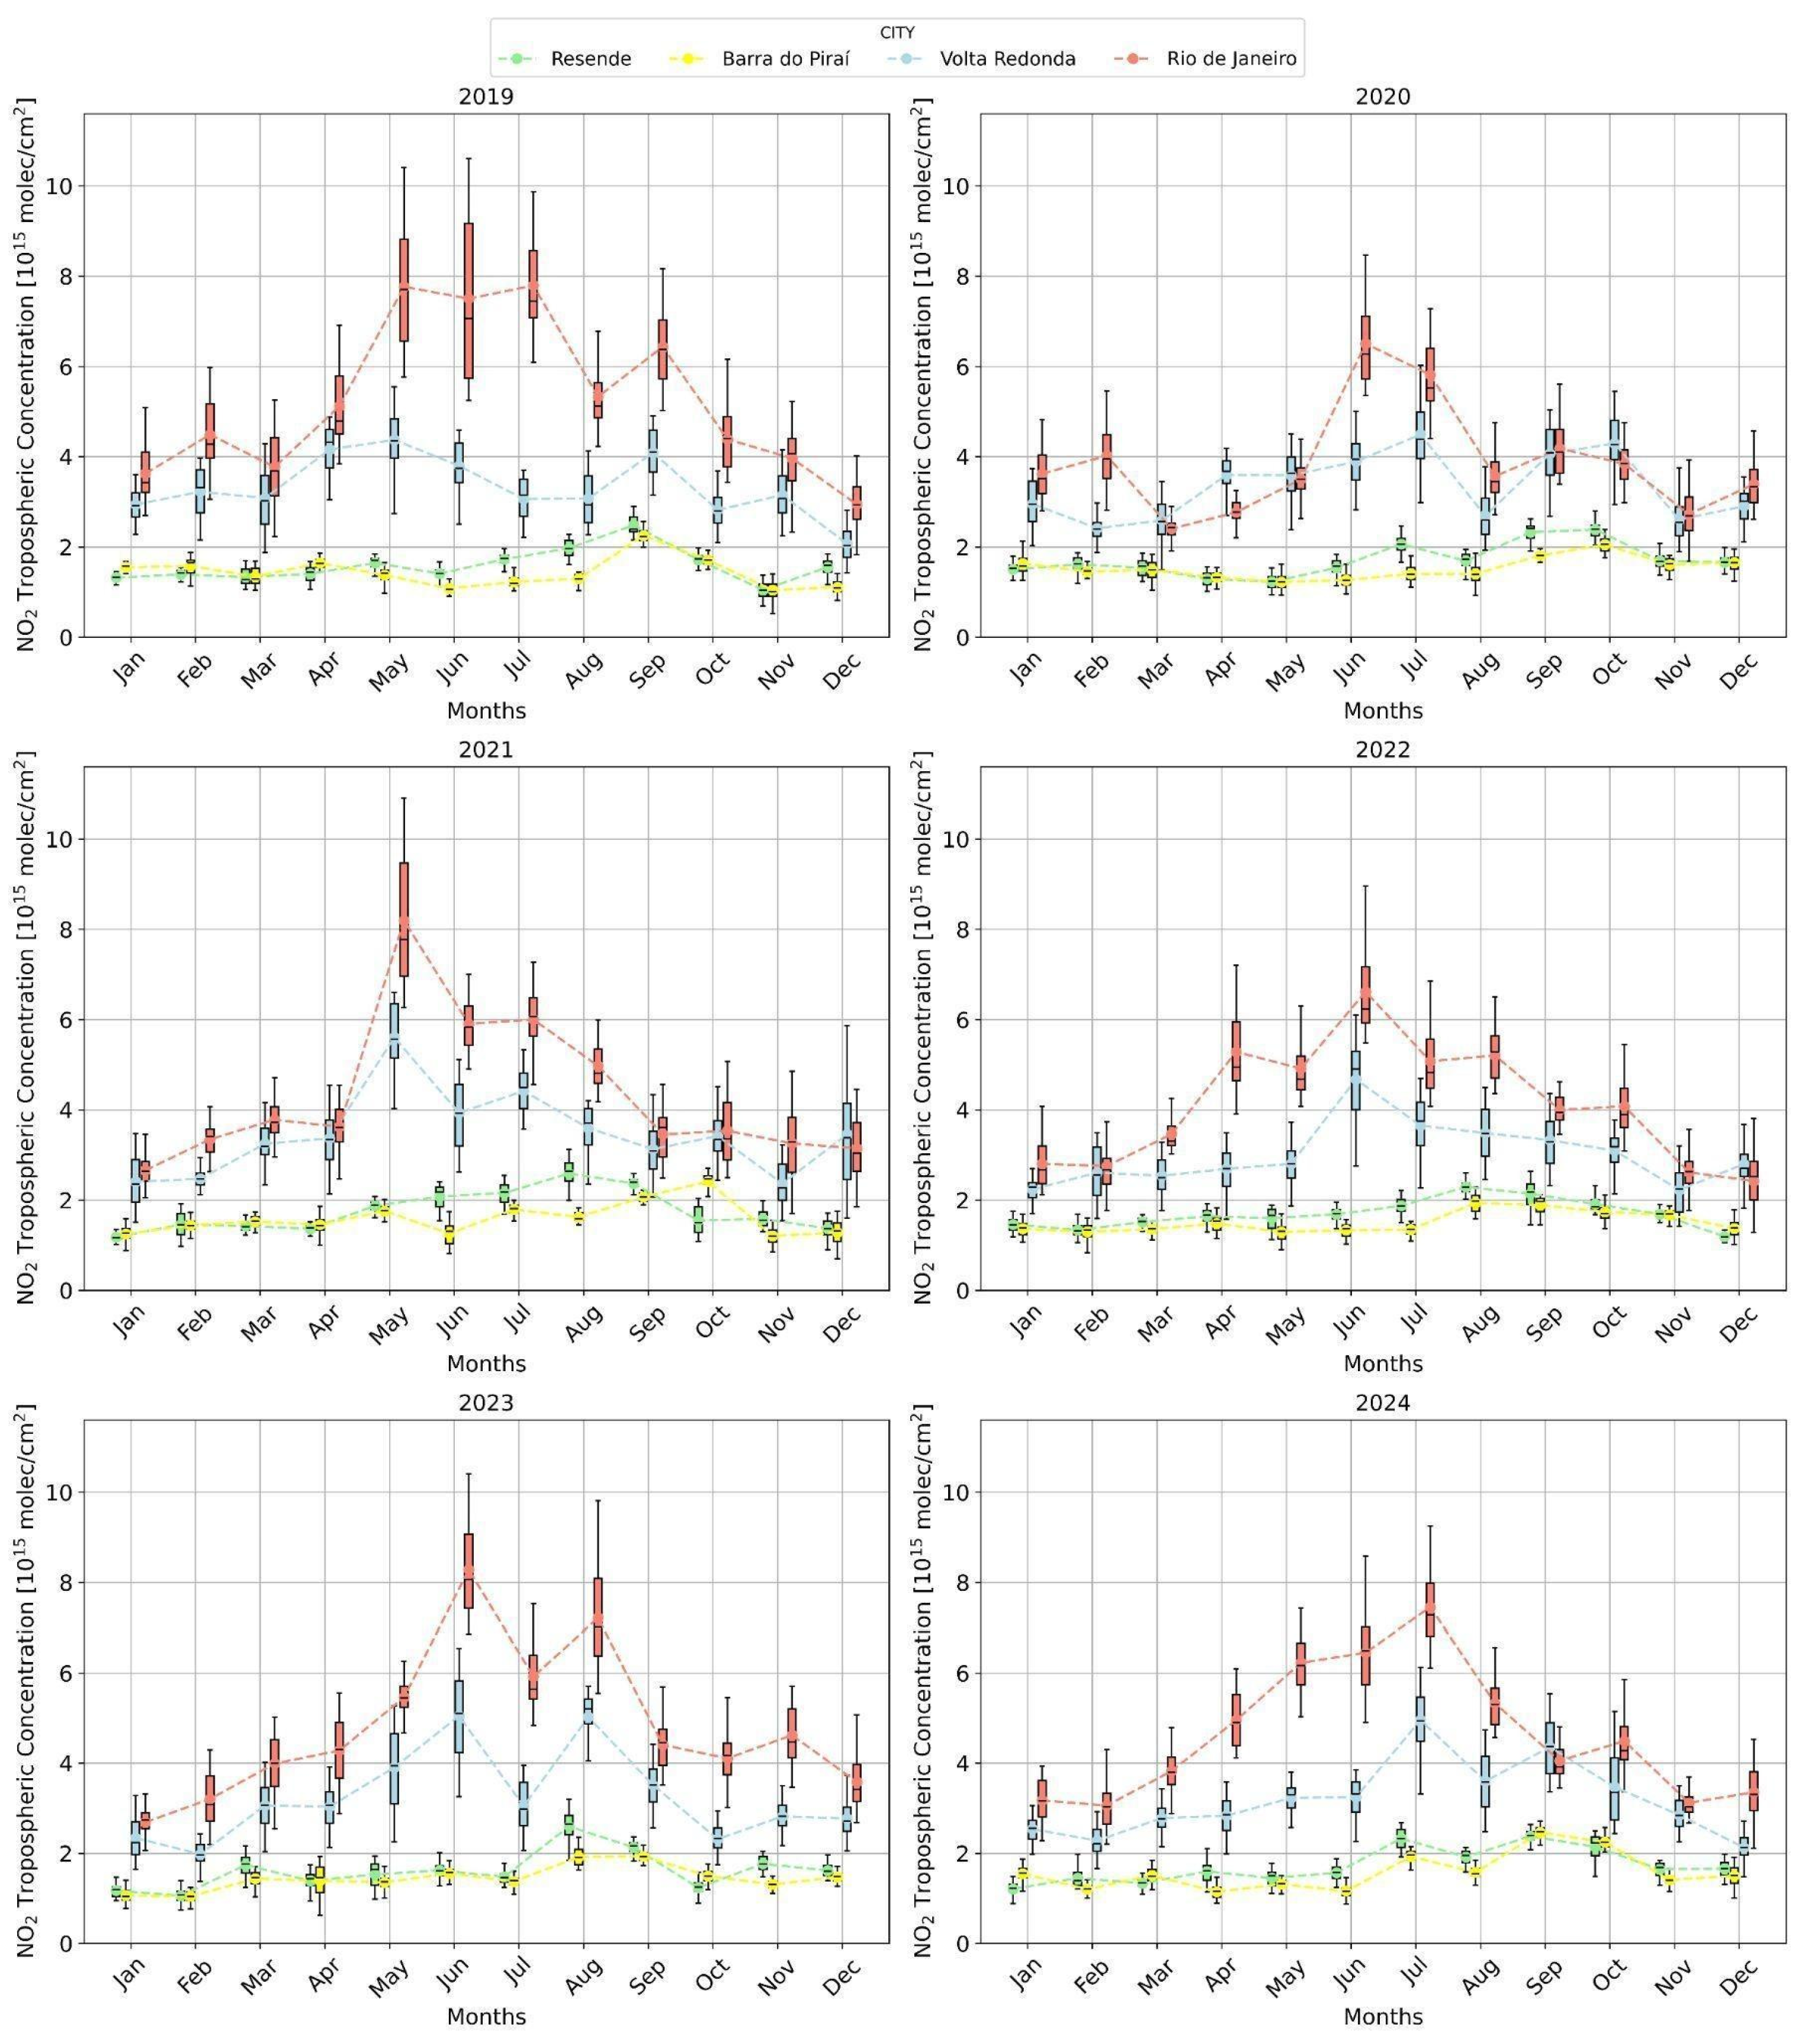
The monthly TROPOMI NO2 Tropospheric average provided the NO2 concentration behavior as a function of month for each city. It can be observed that the typical decrease in NO2 with increasing temperature occurs during the summer months (December to February) for the cities of Rio de Janeiro and Volta Redonda, as reported in [2]. Furthermore, higher values are observed for these two cities compared to the other cities (see Figure 4). We will focus on discussing cities with higher values. Still, all cities will be kept to illustrate the discrepancy between Volta Redonda and other cities of the South region. The higher NO2 concentration, mainly between May and September, corresponds to the cold months (see Figure A1 and Figure A2 in the Appendix A). It is worth noting that 2020 is the only year in which the Volta Redonda city values for March, April, and May exceed those of Rio de Janeiro. It is essential to note that these were the initial months of the complete lockdown during the COVID-19 pandemic, characterized by a significant reduction in all activities and a substantial decrease in vehicle circulation (see Figure 4).
Figure 4.
Boxplots for the monthly mean tropospheric NO2 vertical column densities from TROPOMI, comparing urban areas in southern Rio de Janeiro (Volta Redonda, Resende, Barra do Piraí) with the city of Rio de Janeiro (2019–2024). A colored point in the boxplot marks the mean value.
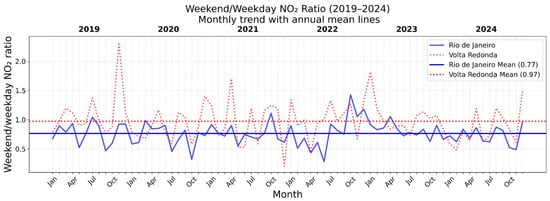
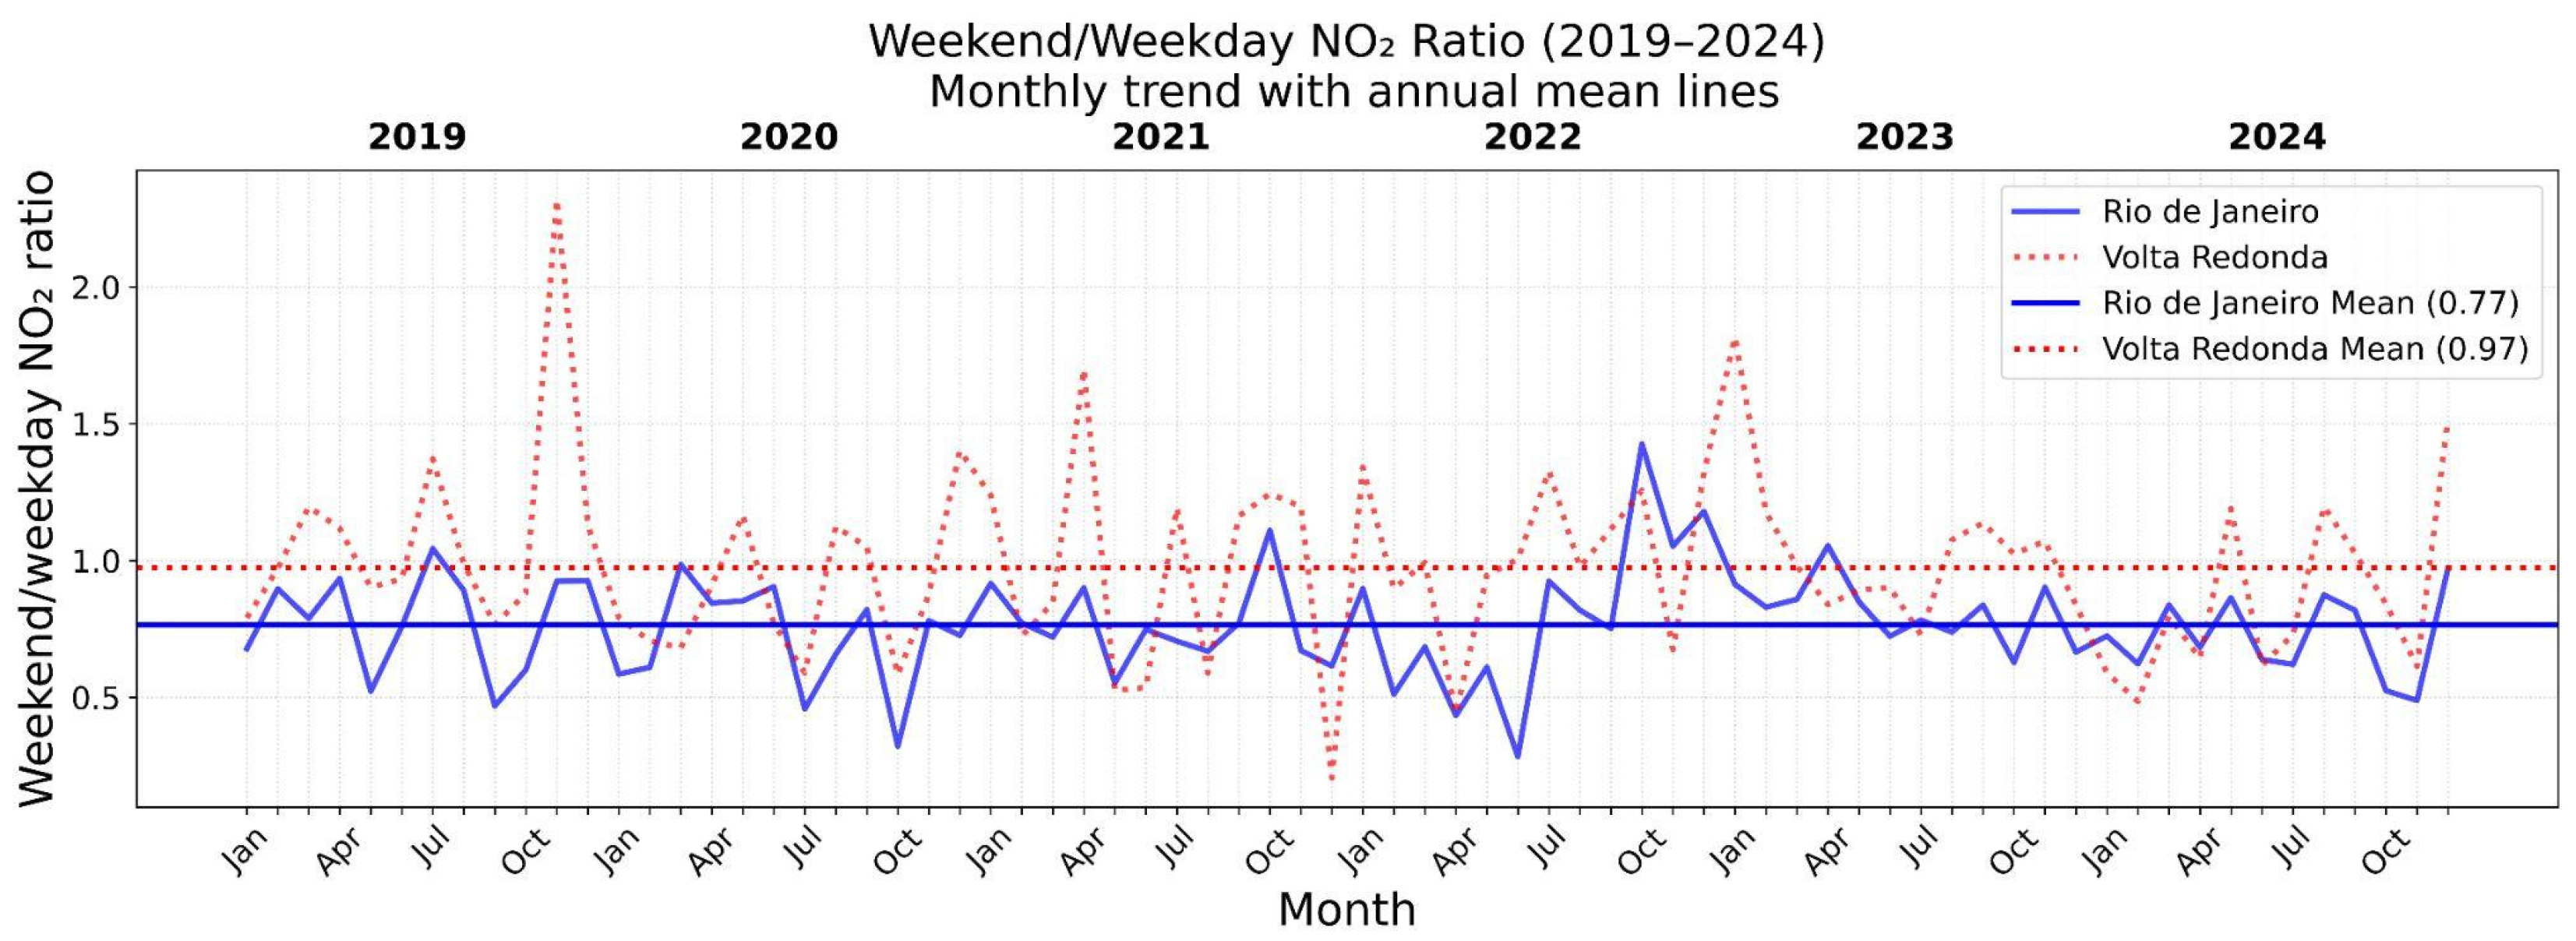
As was also pointed out in the discussion of Figure 3, the monthly average for TROPOMI NO2 tropospheric vertical column was divided into two groups: weekdays and weekends. The analysis revealed a notable decrease in NO2 concentration for the city of Rio de Janeiro in 2019. Higher values were observed on weekdays compared to weekends, suggesting the potential impact of road traffic and industrial activities. However, the reduction is not evident in the other cities, whereas an increase is observed, for example, in Volta Redonda for several months between 2019–2024. Due to the remarkable decrease in road traffic during the weekend, a reduction in NO2 concentration was expected; however, this was not observed, particularly in Volta Redonda. A thorough investigation considering the number of vehicles should be included in future studies to complement this analysis. However, it highlights the atypical behavior of NO2 concentration for Volta Redonda city. To gain a deeper insight into the weekend effect, the Weekend/Weekday NO2 ratio was estimated, and it represents the ratio between the weekend mean NO2 value and the weekday mean value for the cities of Rio de Janeiro and Volta Redonda, as shown in Figure 5. One can observe that the NO2 concentration tends to increase more for Volta Redonda on weekends than for Rio de Janeiro. In some months, such as November 2019, values exceed 2, indicating a significant difference in emission patterns between weekends and weekdays. The general trend in Rio de Janeiro shows that the values are more stable and generally lower than those in Volta Redonda. The results show that, while the weekend average reduction in NO2 concentration in Rio de Janeiro is 23%, Volta Redonda presents a weekend average reduction of only 3%. Moreover, an increase in weekend NO2 concentration is observed in 43% of the months in Volta Redonda, compared to 6% in Rio de Janeiro. These results indicate that the contribution of NO2 from vehicle traffic is subdominant in Volta Redonda compared to production from local industries, or that NO2 emissions from industries increase during weekends to compensate for the expected decline in emissions from road transport.
Figure 5.
Monthly weekend/weekday NO2 ratio as a function of years between 2019–2024 for Rio de Janeiro (mean value ± standard deviation: 0.77 ± 0.19) and Volta Redonda (mean value ± standard deviation: 0.97 ± 0.34) cities, together with the annual mean lines.
To further evaluate the significance of the observed difference, a paired t-test has been performed for monthly weekend/weekday NO2 ratio. The test yielded a statistic of t = −6.079, indicating a substantial difference between the weekend/workday NO2 ratio in Volta Redonda (VR) and Rio de Janeiro (RJ). Since the analysis was performed using paired differences (RJ − VR), the negative t-value indicates that weekend/workday NO2 ratios are, on average, higher in Volta Redonda. Moreover, the associated p-value (p < 0.001) demonstrates that this difference is highly statistically significant.
The number of vehicles increased by 10% for Volta Redonda, 15% for Resende, and 12% for Barra do Piraí between 2019 and 2024, reaching a total of 158,314, 88,044, and 42,026 vehicles, respectively, as presented on the Instituto Brasileiro de Geografia e Estatística (IBGE) [39]. On the other hand, it was not possible to observe a trend in the pollution concentration over the years, similar to the rise in the number of vehicles. Although NO2 emissions are related to fossil fuel combustion, it was not possible to observe a decrease in NO2 concentration for weekday–weekend analysis or a behavior related to the increase in vehicle rate, indicating that other parameters should be included in future investigations. A deeper analysis should consider meteorological data, pollutant emission contributions by sector and year, and vehicle flow information to infer the primary reason for the variation over the years [15,16].
3.3. Meteorological Variables and INEA NO2 Concentration
The meteorological parameters of temperature and water vapor content affect the environment and contribute to atmospheric variation. NO2 concentration presents high values for the period between April–September for every year. This period coincides with months of low rainwater content and low temperatures, as illustrated in the Appendix A.1 (see Figure A1 and Figure A2). It is readily apparent that the seasonality observed in the TROPOMI data is due to the concentration increase between May and September, which corresponds to the less rainy and warmer period (see Figure 4). Consequently, the seasonal spatial distribution of NO2 was observed, and it is evident that meteorological information provides related insights into our results, as widely discussed in some references [15,40].
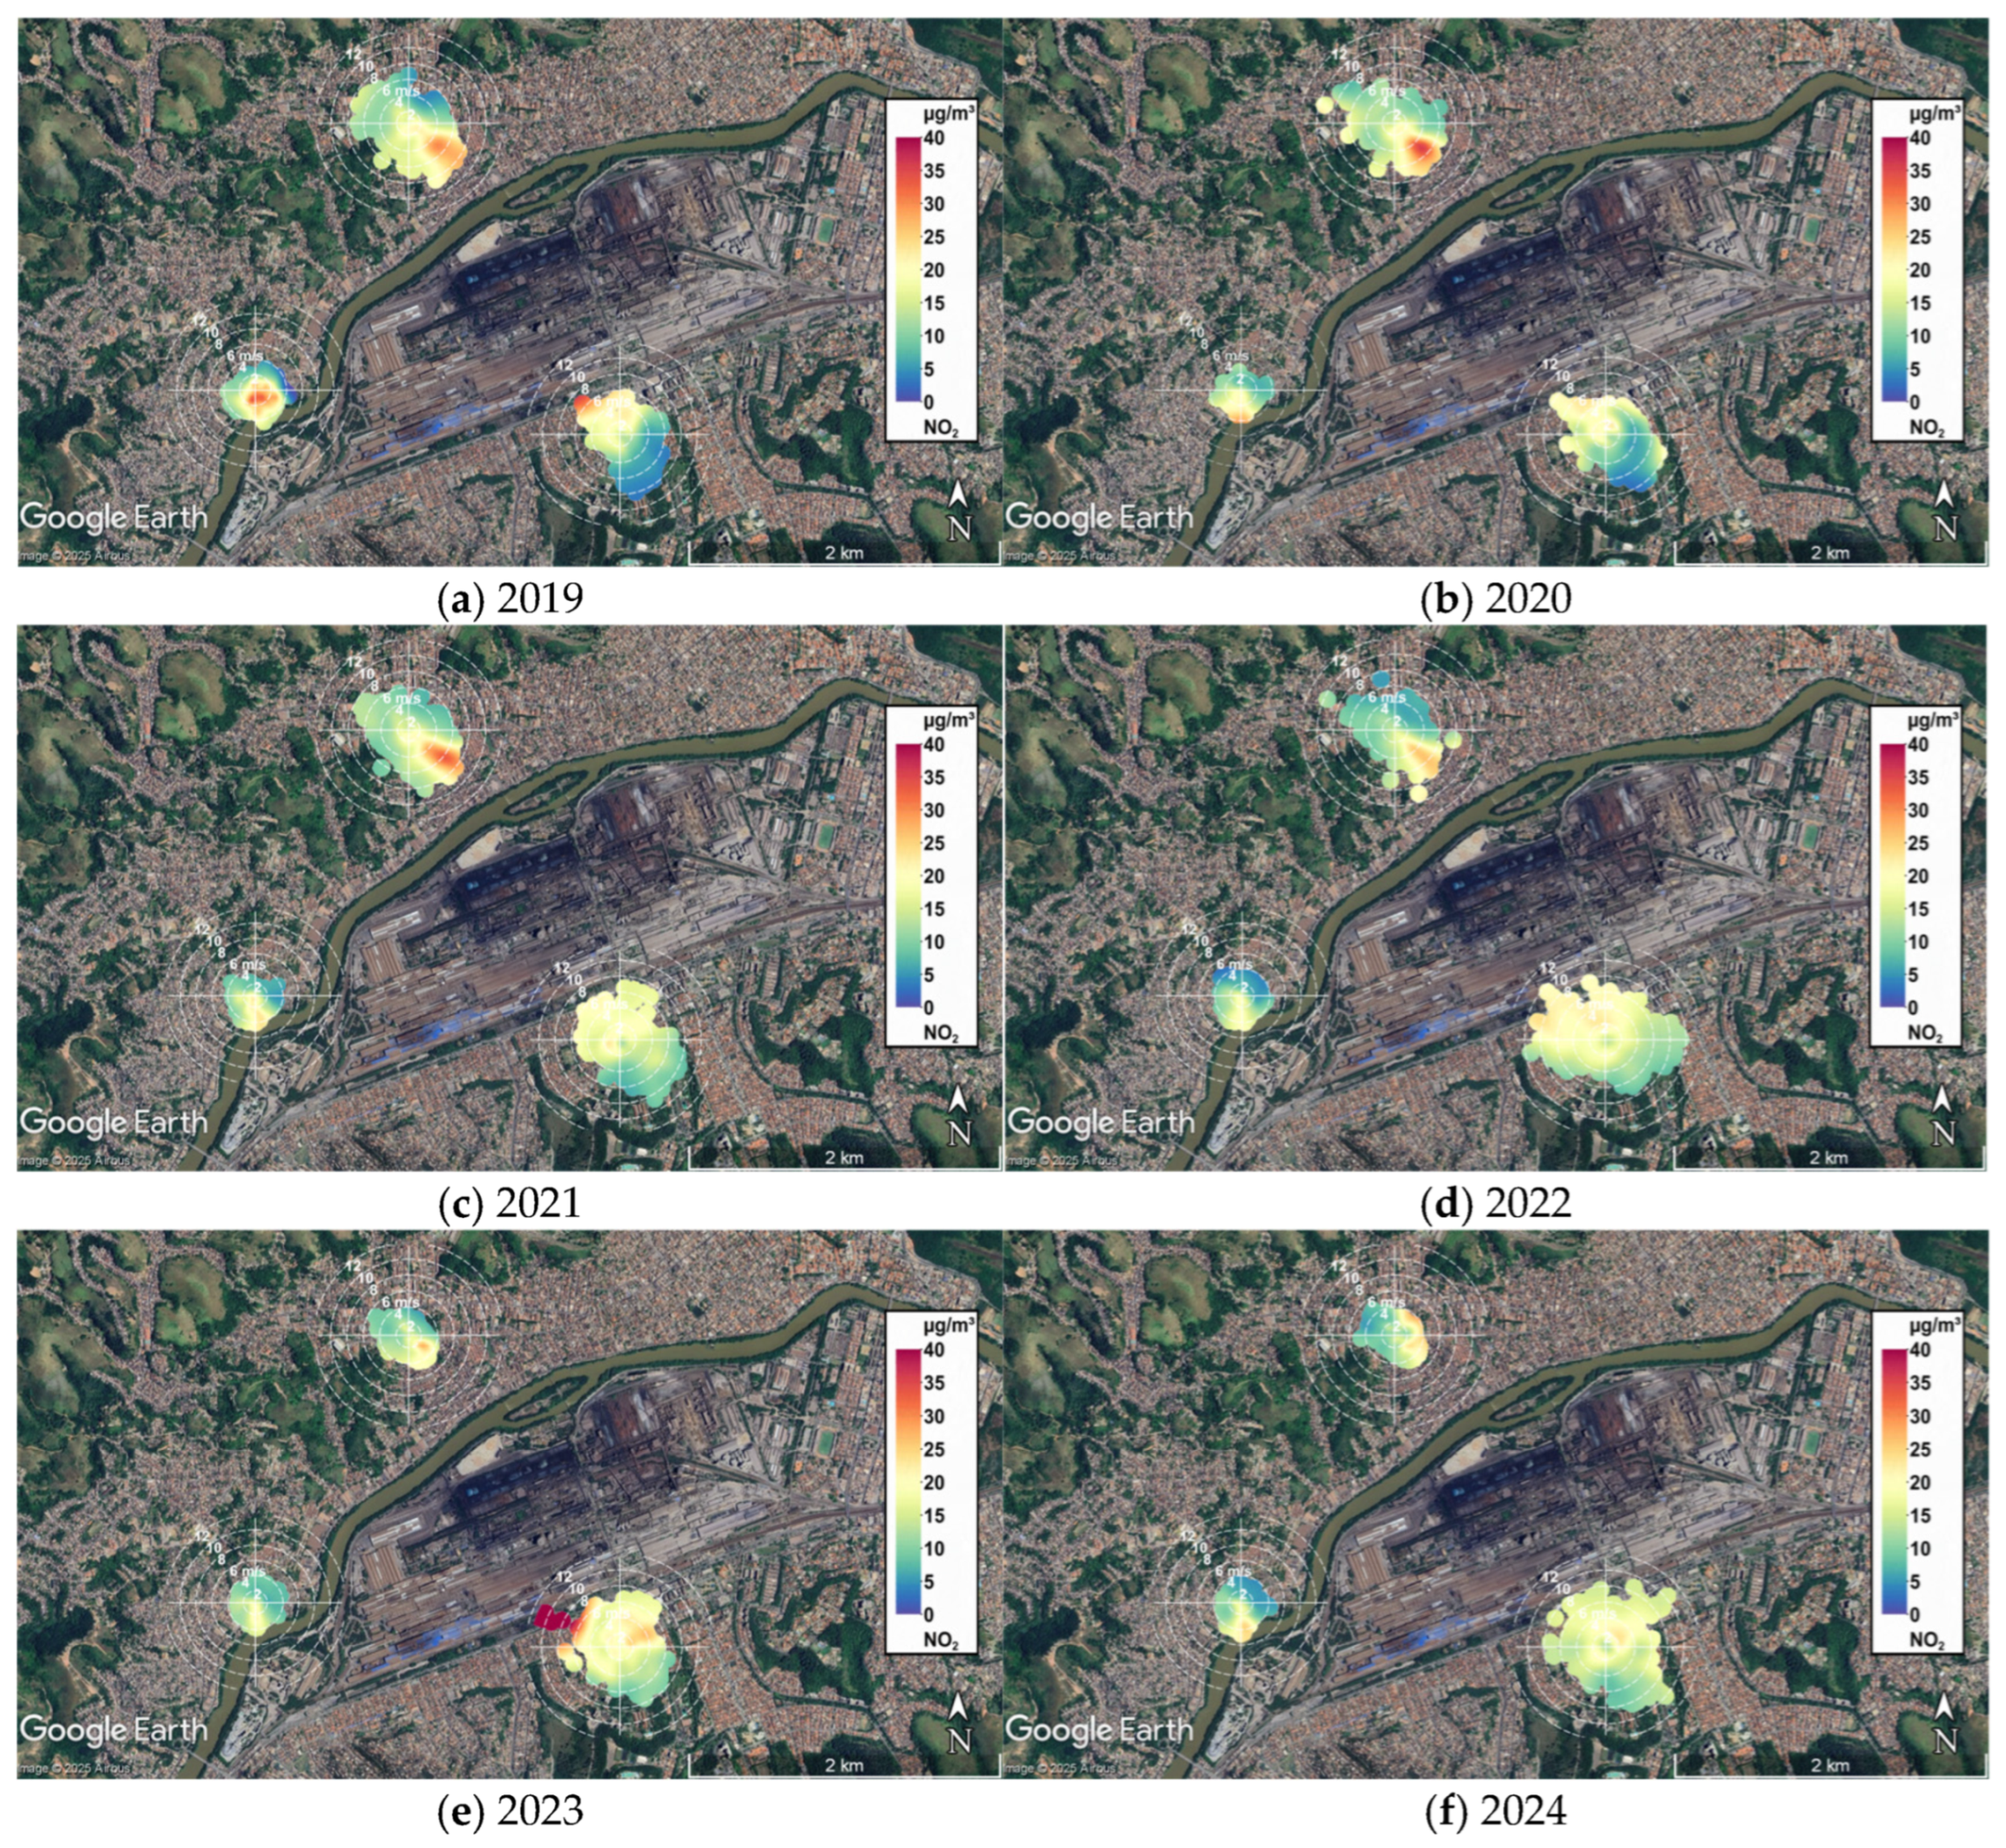
To explore the influence of wind patterns on NO2 concentrations from INEA local stations, bivariate polar plots [26,27,28,29,30] were generated using wind speed and direction data from INEA local stations, together with NO2 concentration measurements. Figure 6 displays the results for the years 2019–2024, overlaid on the Volta Redonda map, with the center of each polar plot coinciding with the location of INEA stations.
Figure 6.
Bivariate polar plots obtained for the wind speed and direction data from INEA local stations, together with NO2 concentration measurements for the years 2019–2024.
A common feature observed across most years is the higher NO2 concentrations over Retiro for winds from the southeast (SE) and over Vila Santa Cecília for winds from the northwest (NW), with the exception of 2024. In that year, Retiro showed greater contributions from the northeast to east (NE-E), while Vila Santa Cecília exhibited a more homogeneous distribution across wind directions. This contrast is most likely attributable to the primary NO2 source being located between these two stations, corresponding to the area of intensive industrial activity, particularly extensive steel production facilities. It is also worth noting that there are other potential sources nearby, as the peaks at large wind speeds (6–8 m/s) might suggest a slightly more distant source. However, the fact that Retiro and Santa Cecilia stations present exactly the opposite pattern is indicative that the primary source is located in the middle. Still, Belmonte station must be taken into account, which exhibited lower wind speeds (with data less scattered towards larger radii) and NO2 concentrations in all wind directions for the year 2019, as well as a slight predominance of the South direction in the remaining years. This behavior can be explained by the wind direction of forward trajectories predominantly in the Southwest direction, as illustrated in Appendix A.2.
3.4. Climate TRACE Emission Analysis
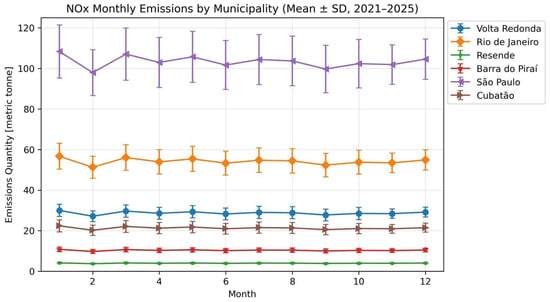
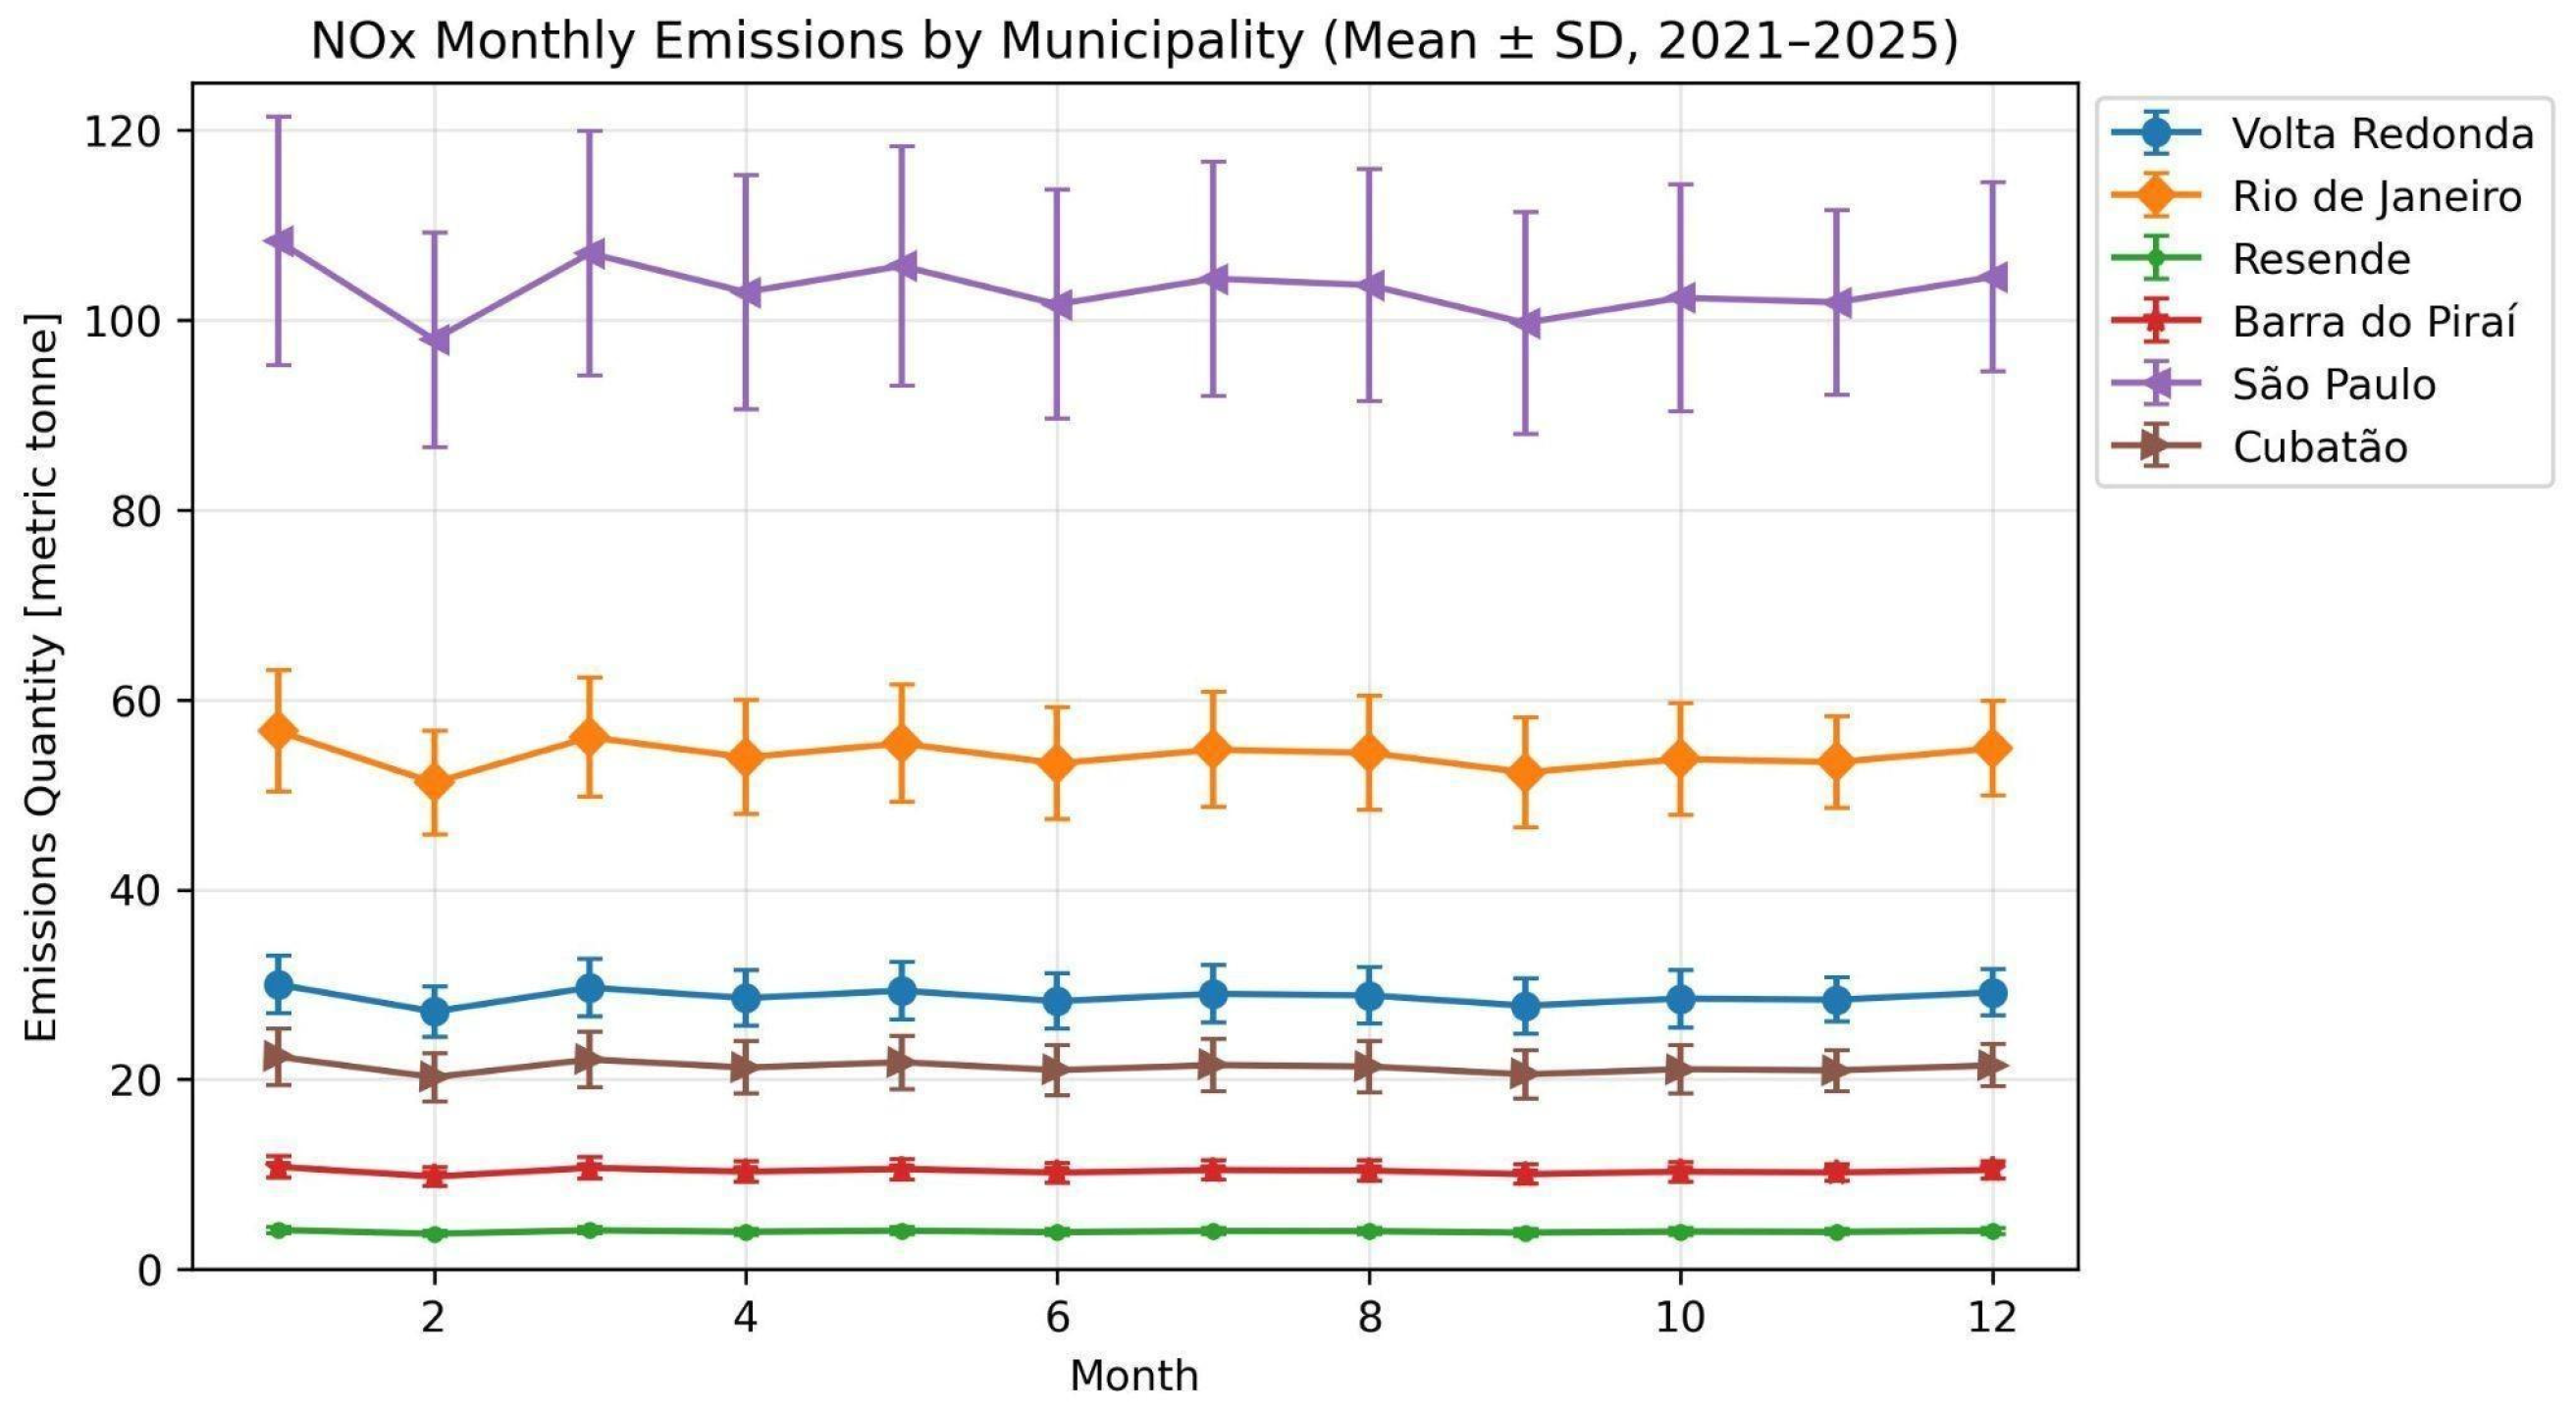
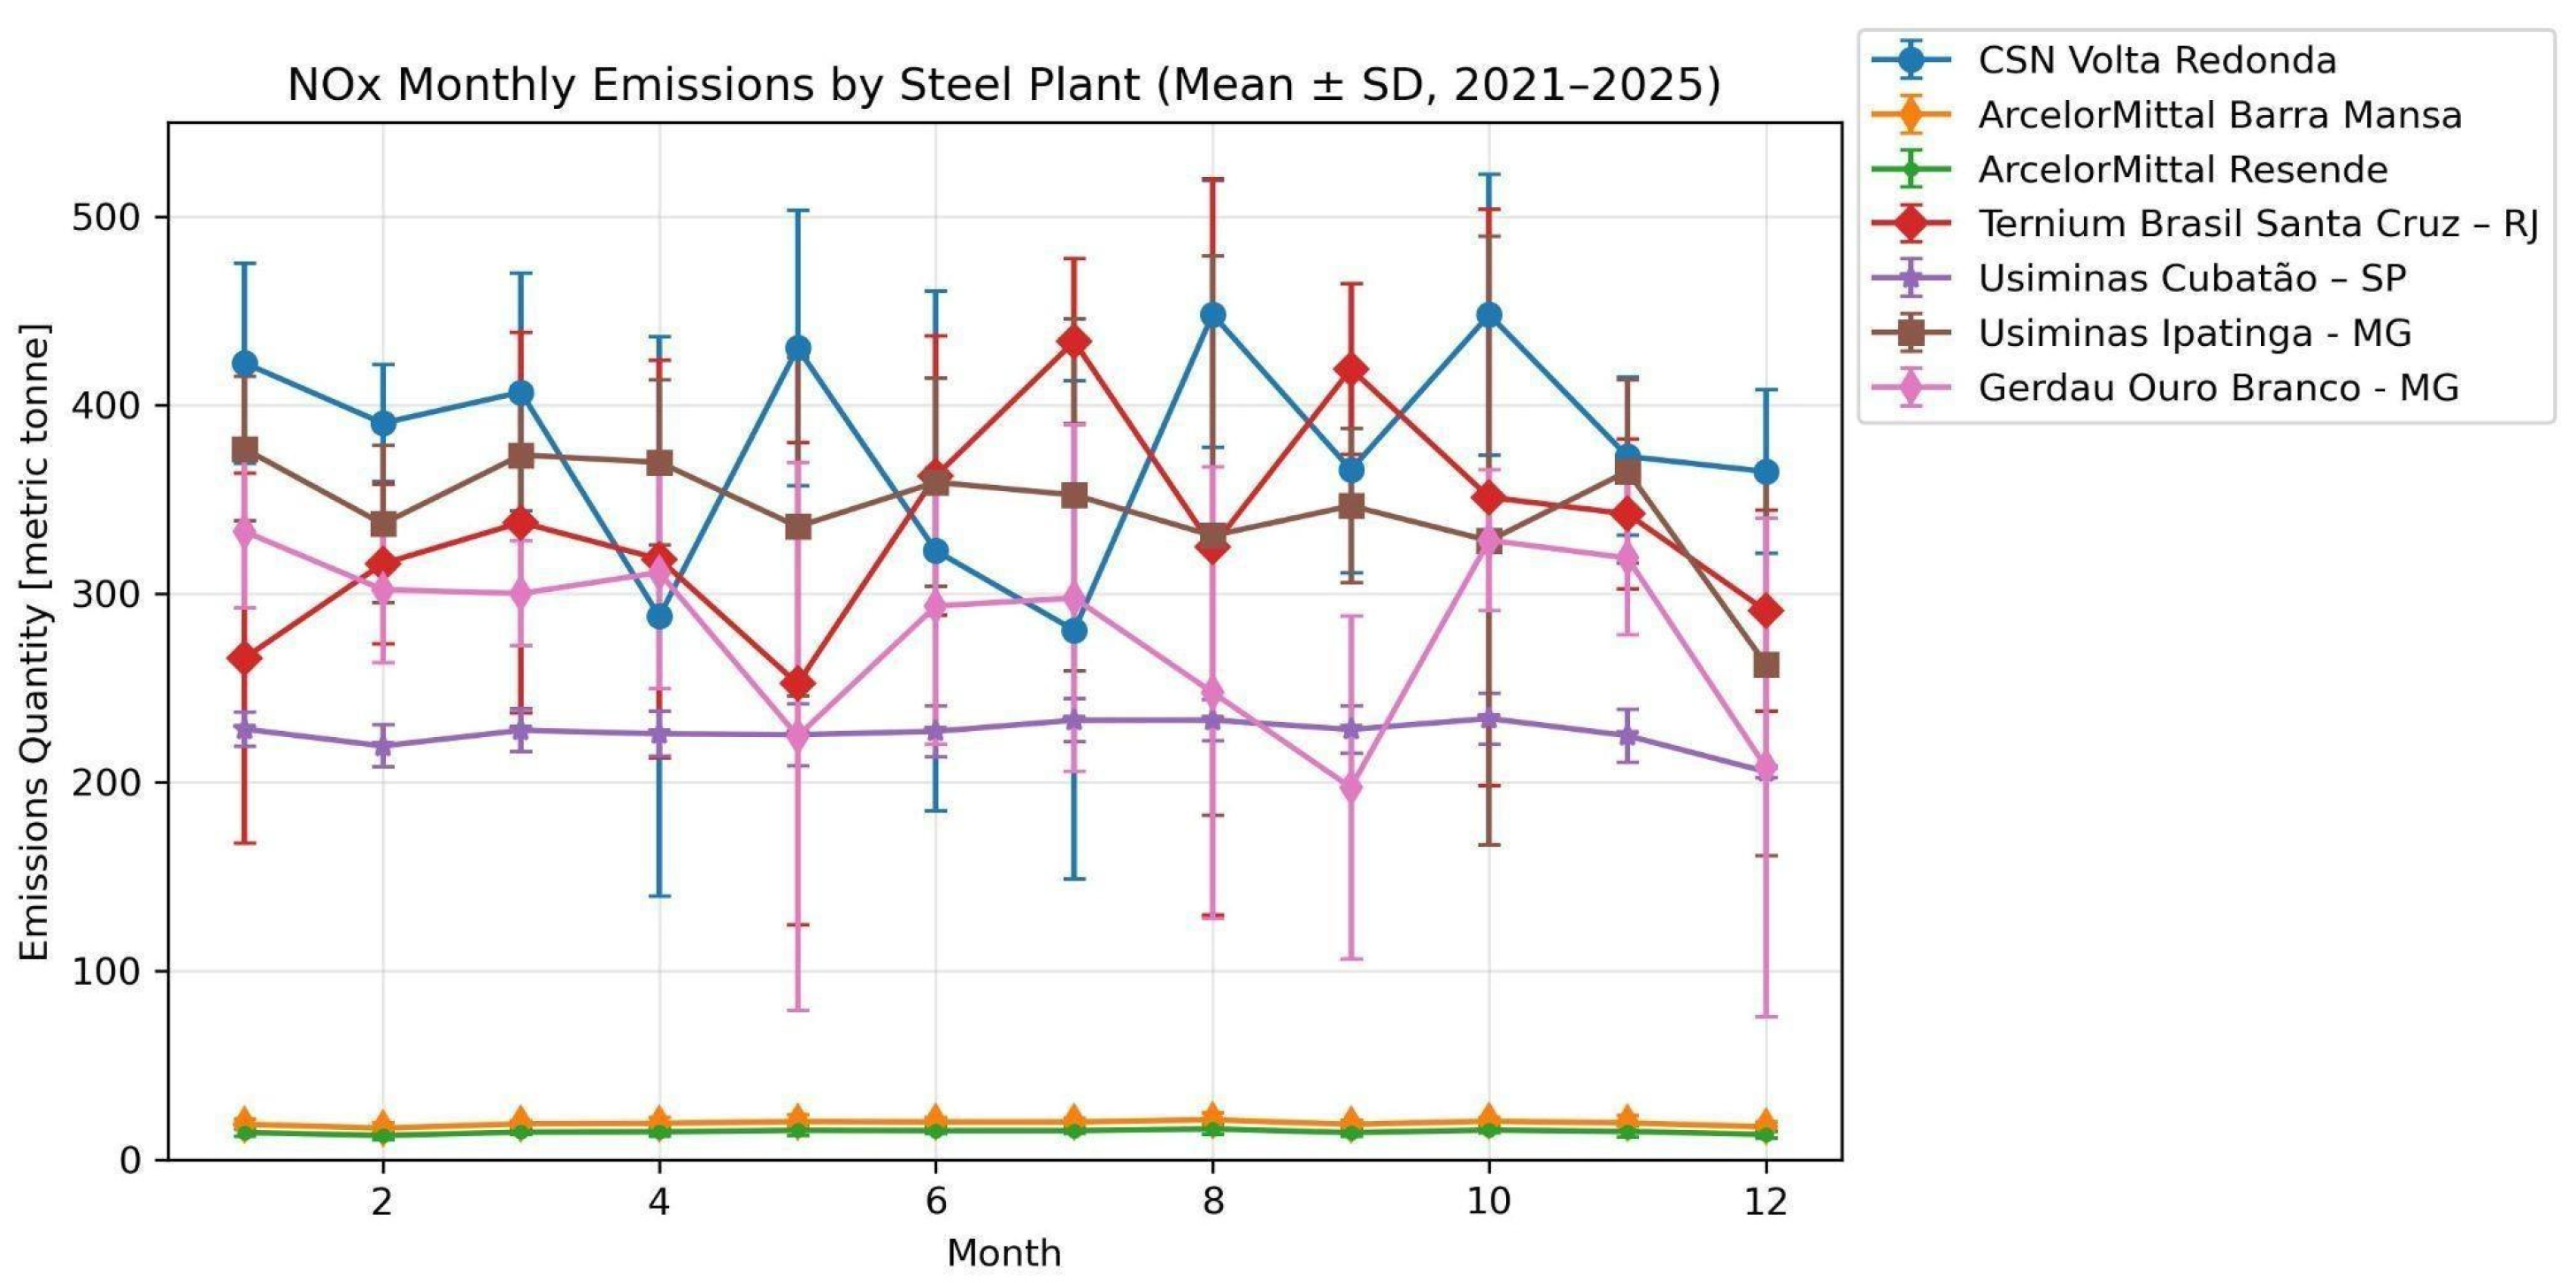
Isolating the industrial contribution from traffic-related ones remains difficult due to the lack of high-resolution local traffic data. To address this gap, Climate TRACE monthly NOx emissions data were analyzed from 2021 to 2025, considering local plants in some cities. Figure 7 illustrates the monthly NOx emissions from the transportation sector for cities in Southern Rio de Janeiro state (Volta Redonda, Resende, and Barra do Piraí) compared to the metropolitan areas of Rio de Janeiro and São Paulo from 2021 to 2025. São Paulo city was included because it is considered one of the largest megacities on the planet. It is estimated that São Paulo has a fleet of over 7 million vehicles using fuel containing a high combination of gasoline and ethanol for light-duty vehicles (LDVs), and diesel and biodiesel for heavy-duty vehicles (HDVs). Over the last decade, numerous studies have focused on monitoring vehicle emission rates in São Paulo and tracking their impacts on air quality and public health [41].
Figure 7.
Monthly time series of NOx emissions from the transportation sector. The plot compares emissions from cities in the South region of Rio de Janeiro state (Volta Redonda, Resende, Barra do Piraí) with those from Rio de Janeiro and São Paulo for the period 2021–2025. To facilitate comparison, the values for Rio de Janeiro and São Paulo are displayed at one-tenth of their actual magnitude. The error bars represent the standard deviation (SD).
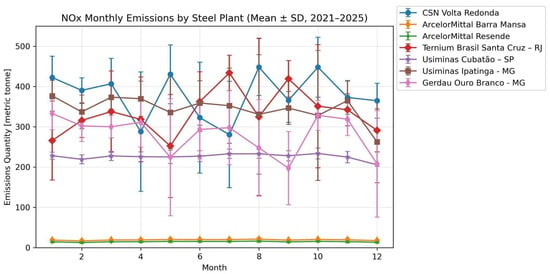
The NOx emissions from Volta Redonda are higher than those from Resende and Barra do Piraí, which are urban centers of similar size. This difference in NOx emissions is attributed to lower industrial emissions in the latter cities. Additionally, data for Cubatão (in São Paulo State) are presented, which has a well-documented history of industrial pollution [42,43]. In this context, Volta Redonda presents values similar to those of Cubatão, as both cities are significantly affected by local industrial pollution. The analysis also shows that emissions from local industrial plants (see Figure 8) consistently surpass those from the transportation sector when compared to the values in Figure 7. Notably, emissions from the Volta Redonda plants are of the same order of magnitude as those from plants in Rio de Janeiro and exceed those from the Cubatão industrial complex. These findings reinforce the view that local industrial emissions can exert a stronger influence on NO2 concentrations than local traffic. This is consistent with earlier inferences from TROPOMI data, which showed that the typical decrease in road traffic on weekends was not reflected as a decrease in NO2 concentration, suggesting that industrial contributions are dominant. Furthermore, the unexpectedly high emissions in Volta Redonda, compared with other industrial cities such as Cubatão, highlight the need for more focused research in this region. Together, these results confirm the TROPOMI satellite observations that Volta Redonda experiences air pollution levels that are elevated for a city of its size. Emission data from industrial facilities in the state of Minas Gerais, located in the Southeast region, which was also included, are classified as high-emission plants. It is worth noting that these facilities have emission levels of the same order of magnitude as those observed in the cities of Santa Cruz and Volta Redonda in the state of Rio de Janeiro.
Figure 8.
NOx monthly emissions due to local plants located in cities in the South region of Rio de Janeiro (Resende, Barra Mansa, and Volta Redonda) compared to Rio de Janeiro, Minas Gerais and São Paulo plants. To facilitate comparison, all the values are displayed at one-tenth of their actual magnitude.
The analysis of selected industrial plants helps clarify the level of pollution associated with each facility. The Resende unit is primarily dedicated to rolling and wire drawing processes. It typically does not produce liquid steel (i.e., it has no blast furnace or steelmaking shop), but instead processes steel billets or blooms supplied by other plants to manufacture wire rods and other long products. Consequently, its direct industrial NOx emissions are expected to be significantly lower than those of integrated steel plants such as Volta Redonda, Cubatão, or the ArcelorMittal unit in Barra Mansa. CSN (Volta Redonda), Ternium (Santa Cruz), and Usiminas (Cubatão) are all large integrated steel plants. In contrast, the Barra Mansa and especially the Resende facilities fall into different size and process categories, with substantially lower expected emission levels. Official national emission inventories, such as Brazil’s National Inventory Report produced under the SIRENE system, provide sectoral estimates for NOx emissions, indicating that industrial sources are a major contributor, though they do not disaggregate emissions by individual industrial plants [44]. There is no single confidence estimate applicable to all Climate TRACE emission data, as the confidence level is reported separately for each asset, gas, and time period as a classification in the Climate TRACE website. Therefore, the data were interpreted as indicators of the relative spatial distribution and temporal variability of emissions rather than as absolute emission estimates. The error bars shown in the figures represent the standard deviation of the monthly mean values.
In this study, the dominance of industrial over traffic sources in Volta Redonda was initially based on the absence of a “weekend effect” in TROPOMI data, as local traffic decreases substantially on weekends. However, other factors could influence this, such as changes in meteorological conditions that affect pollutant accumulation, shifts in the schedule of industrial freight traffic to weekends, or the specificities of the NOx chemical cycle. However, the Climate TRACE data confirmed this industrial dominance, showing that emissions from local plants can be three or four times higher than the maximum values recorded from road traffic. These results support the conclusion that Volta Redonda has higher-than-expected air pollution levels for its size, with a considerable contribution coming from industry. Further investigation will be conducted to incorporate meteorological conditions and the scheduling of industrial freight traffic on weekends.
3.5. Health Data Correlation
The tables below present the RRIs for the different age groups, taking into account the atmospheric pollutants/variables specific to each group. The occurrence of respiratory diseases in adults (ages 17–59 years), as shown in Table 1, is significantly influenced by the concentrations of NO and NO2 covariant values. An increase of 1 [µg/m3] in the minimum concentration of NO, compared to the average minimum value recorded throughout this study, results in a 28% [1.05–1.59—95% CI] increase in hospitalization rates. In contrast, an increase of 1 [µg/m3] in the maximum concentration of NO2 represents an increase of 2% [1.00–1.04—95% CI] in hospitalization rates.
Table 1.
RRI analysis for the adult age group for data in the period 2021–2024.
Children (ages 0–16 years) were also highly susceptible to variations in NO concentrations, with an increase of 1 [µg/m3] in the minimum concentration resulting in a 34% increase in hospitalization rates [1.14–1.58—95% CI], while an increase of 1 [µg/m3] in the maximum concentration resulting in a 2% increase [1.01–1.02—95% CI] in hospitalization rates (see Table 2). This age group was also shown to be influenced by PM2.5, with a 1 [µg/m3] increase in the mean concentration resulting in a 3% increase [1.00–1.07—95% CI] in hospitalization rates. It is worth mentioning that NO2 is related to the particulate PM2.5 due to its participation in reactions that create particulate nitrate (NO−), which is a component of delicate particulate matter such as PM2.5 [45].
Table 2.
RRI analysis for the children’s age group for data in the period 2021–2024.
Regarding older people (aged 60 years or older), NO and PM2.5 are the primary pollutants analyzed for their impact on hospitalizations. An increase of 1 [µg/m3] in the minimum concentration of NO covariant value results in a 25% increase in hospitalizations [1.09–1.43—95% CI]. On the other hand, an increase of 1 [µg/m3] in the minimum concentration of PM2.5 implies a 9% increase [1.02–1.16—95% CI] in hospitalizations; see Table 3.
Table 3.
RRI analysis for the individuals aged 60 and older for data in the period 2021–2024.
It is worth noting that excluding 2020 and 2021 data helps to minimize the impact of COVID-19 on our analysis. Even when all populations are considered, an increase in hospitalizations due to NO and PM2.5 contributions is observed, as illustrated in Table 4.
Table 4.
RRI analysis for all age groups for data in the period 2021–2024.
It is essential to note that the level of influence of NO and NO2 on the occurrence of hospitalizations due to respiratory diseases in the city of Volta Redonda is higher than that observed in other studies conducted in larger cities, such as São Paulo [5] and Hong Kong [46]. This fact underscores the critical importance of this city’s exposure to high concentrations of NO and NO2 pollution. The DataSUS data provide hospitalization/care figures aggregated by epidemiological week instead of daily resolution. This limitation does not affect our results, as the effects of meteorological variables and air pollutants are not necessarily immediate, as demonstrated by [47].
Uncertainty estimates for TROPOMI, CLIMATE TRACE, and INEA were not incorporated into an uncertainty propagation analysis because such analyses were beyond the scope of this study. However, they represent an important direction for future research.
4. Conclusions
This study provides novel insights into the role of industrial dominance of urban NO2 and associated health risks through a multi-source analysis in the southern region of Rio de Janeiro state. We begin with spatiotemporal patterns of tropospheric NO2 concentrations derived from TROPOMI satellite observations. Our analysis revealed two key findings: pronounced seasonal variations and distinct weekday–weekend differences in NO2 levels, along with significantly elevated concentrations in Volta Redonda compared to other urban centers in southern Rio de Janeiro state. Particularly noteworthy were the results: the weekend average reduction in NO2 concentration in Rio de Janeiro city of 23% in contrast to that of Volta Redonda city of only 3%, and an increase in weekend NO2 concentration was observed in 43% of the months in Volta Redonda, compared to 6% in Rio de Janeiro, underscoring the dominant influence of industrial emissions in Volta Redonda’s air quality profile. It is worth noting that a statistical test (t-test) was also performed, revealing a highly statistically significant difference between the weekend-to-workday NO2 ratio in Volta Redonda (VR) and Rio de Janeiro (RJ). Besides that, paired t-tests of ERA5 temperature and cloud rain water content revealed similar weekday and weekend conditions, indicating that meteorological variability is unlikely to account for the observed TROPOMI NO2 differences and supporting anthropogenic emissions as the dominant driver. These findings underscore the crucial need for region-specific air quality management strategies that consider both anthropogenic activity patterns and local meteorological conditions.
Concerning the pollutant gas source, our results indicated that the primary source is located in the industrial area of Volta Redonda city, which is home to extensive steel production facilities. Furthermore, the HYSPLIT forward trajectories enabled us to understand the contribution from the South region to the Belmonte station, illustrating the air mass propagation predominantly in a southwest direction. Last but not least, it is worth emphasizing the significant contribution of NO2 and PM2.5 to the increase in hospitalization rates, with children and older individuals being particularly susceptible to variations in these concentrations. It underscored the need for emission regulation and public health strategies in the southern region of Rio de Janeiro state.
Future investigations could significantly enhance our understanding of NO2 dynamics through different approaches: high-temporal-resolution analysis comparing early morning and late afternoon concentrations to assess traffic-related emission patterns, examination of the characteristic daytime minimum around 13:30 UT resulting from photodissociation processes and NOx conversion pathways, and evaluation of nighttime chemistry through expanded monitoring networks capturing NO2 conversion to other NOx species. Such studies would particularly benefit from integration of dense ground-based monitoring data with satellite observations to elucidate diurnal chemical processes at finer spatial and temporal scales.
Author Contributions
Conceptualization, S.A.C., A.C., G.d.A.M., J.L.G.-R.; Data curation, S.A.C., D.M.d.S., R.M.d.A., A.C., G.d.A.M., J.A.-M., P.O.-A.; Formal analysis, S.A.C., D.M.d.S., R.M.d.A., A.C., G.d.A.M., J.A.-M., P.O.-A., F.J.d.S.L.; Funding acquisition, S.A.C., J.L.G.-R.; Investigation, S.A.C., R.M.d.A., A.C., G.d.A.M., J.L.G.-R.; Methodology, S.A.C., A.C., G.d.A.M., J.L.G.-R., F.J.d.S.L.; Project administration, S.A.C., J.L.G.-R.; Resources, S.A.C., A.C.; Supervision, S.A.C., A.C., R.M.d.A., J.L.G.-R.; Visualization, S.A.C., R.M.d.A., A.C.; Writing—original draft, S.A.C., D.M.d.S., R.M.d.A., A.C., G.d.A.M., P.O.-A.; Writing—review and editing, S.A.C., R.M.d.A., A.C., G.d.A.M., J.L.G.-R., L.A.-A. All authors have read and agreed to the published version of the manuscript.
Funding
Public Call ATLÂNTICAS MCTI/CNPq/MIR/MMULHERES/MPI-No.36/2023-Brazil is acknowledged for scholarship financial support (Number: 200294/2024-5) for (S.A.C.). This research was also funded by FAPERJ (S.A.C.) Grant 210.578/2024-E-13/2023 and also supported by the Horizon Europe program under the Marie Sklodowska-Curie Staff Exchange Actions with the project AERIS (grant agreement No 101236396). The authors also thanked the National Council for Scientific and Technological Development (CNPq)/DECIT of Brazil for financing the CAIPORA project (444761/2023-3).
Data Availability Statement
INEA data files are publicly available at https://qualidadedoar.inea.rj.gov.br/INEAPublico/AMSTabularData, last access: 1 April 2025. The meteorological data used in this study were obtained from the NOAA Air Resources Laboratory (ARL) Global Data Assimilation System (GDAS) archive, available from the NOAA Air Resources Laboratory FTP server https://www.ready.noaa.gov/gdas1.php, last access: 1 September 2025. ERA5 reanalysis files are publicly available at the ECWF Website https://cds.climate.copernicus.eu/datasets/reanalysis-era5-single-levels?tab=overview, last access: 9 June 2026. The healthy data is available at the DataSUS platform https://datasus.saude.gov.br, last access: 28 May 2025.
Acknowledgments
Public Call ATLÂNTICAS MCTI/CNPq/MIR/MMULHERES/MPI-No.36/2023-Brazil is acknowledged for scholarship financial support (Number: 200294/2024-5) for (S.A.C.).
Conflicts of Interest
The authors declare no conflicts of interest.
Abbreviations
The following abbreviations are used in this manuscript:
| HYSPLIT | Hybrid Single-Particle Lagrangian Integrated Trajectory |
| INEA | Instituto Estadual do Ambiente |
| NOAA | National Oceanic and Atmospheric Administration |
| RRI | Relative Risk Index |
| OMIO | zone Monitoring Instrument |
| TROPOMI | Tropospheric Monitoring Instrument |
Appendix A
Appendix A.1. ERA5 Meteorological Analysis
Data from the ERA5 hourly pressure levels product for temperatures at two meters from the surface and specific rainwater content were employed. ERA5 is the fifth-generation ECMWF reanalysis for the global climate and weather from 1940 to the present. Reanalysis considers not only model data but also observations from around the world to create a globally complete dataset.
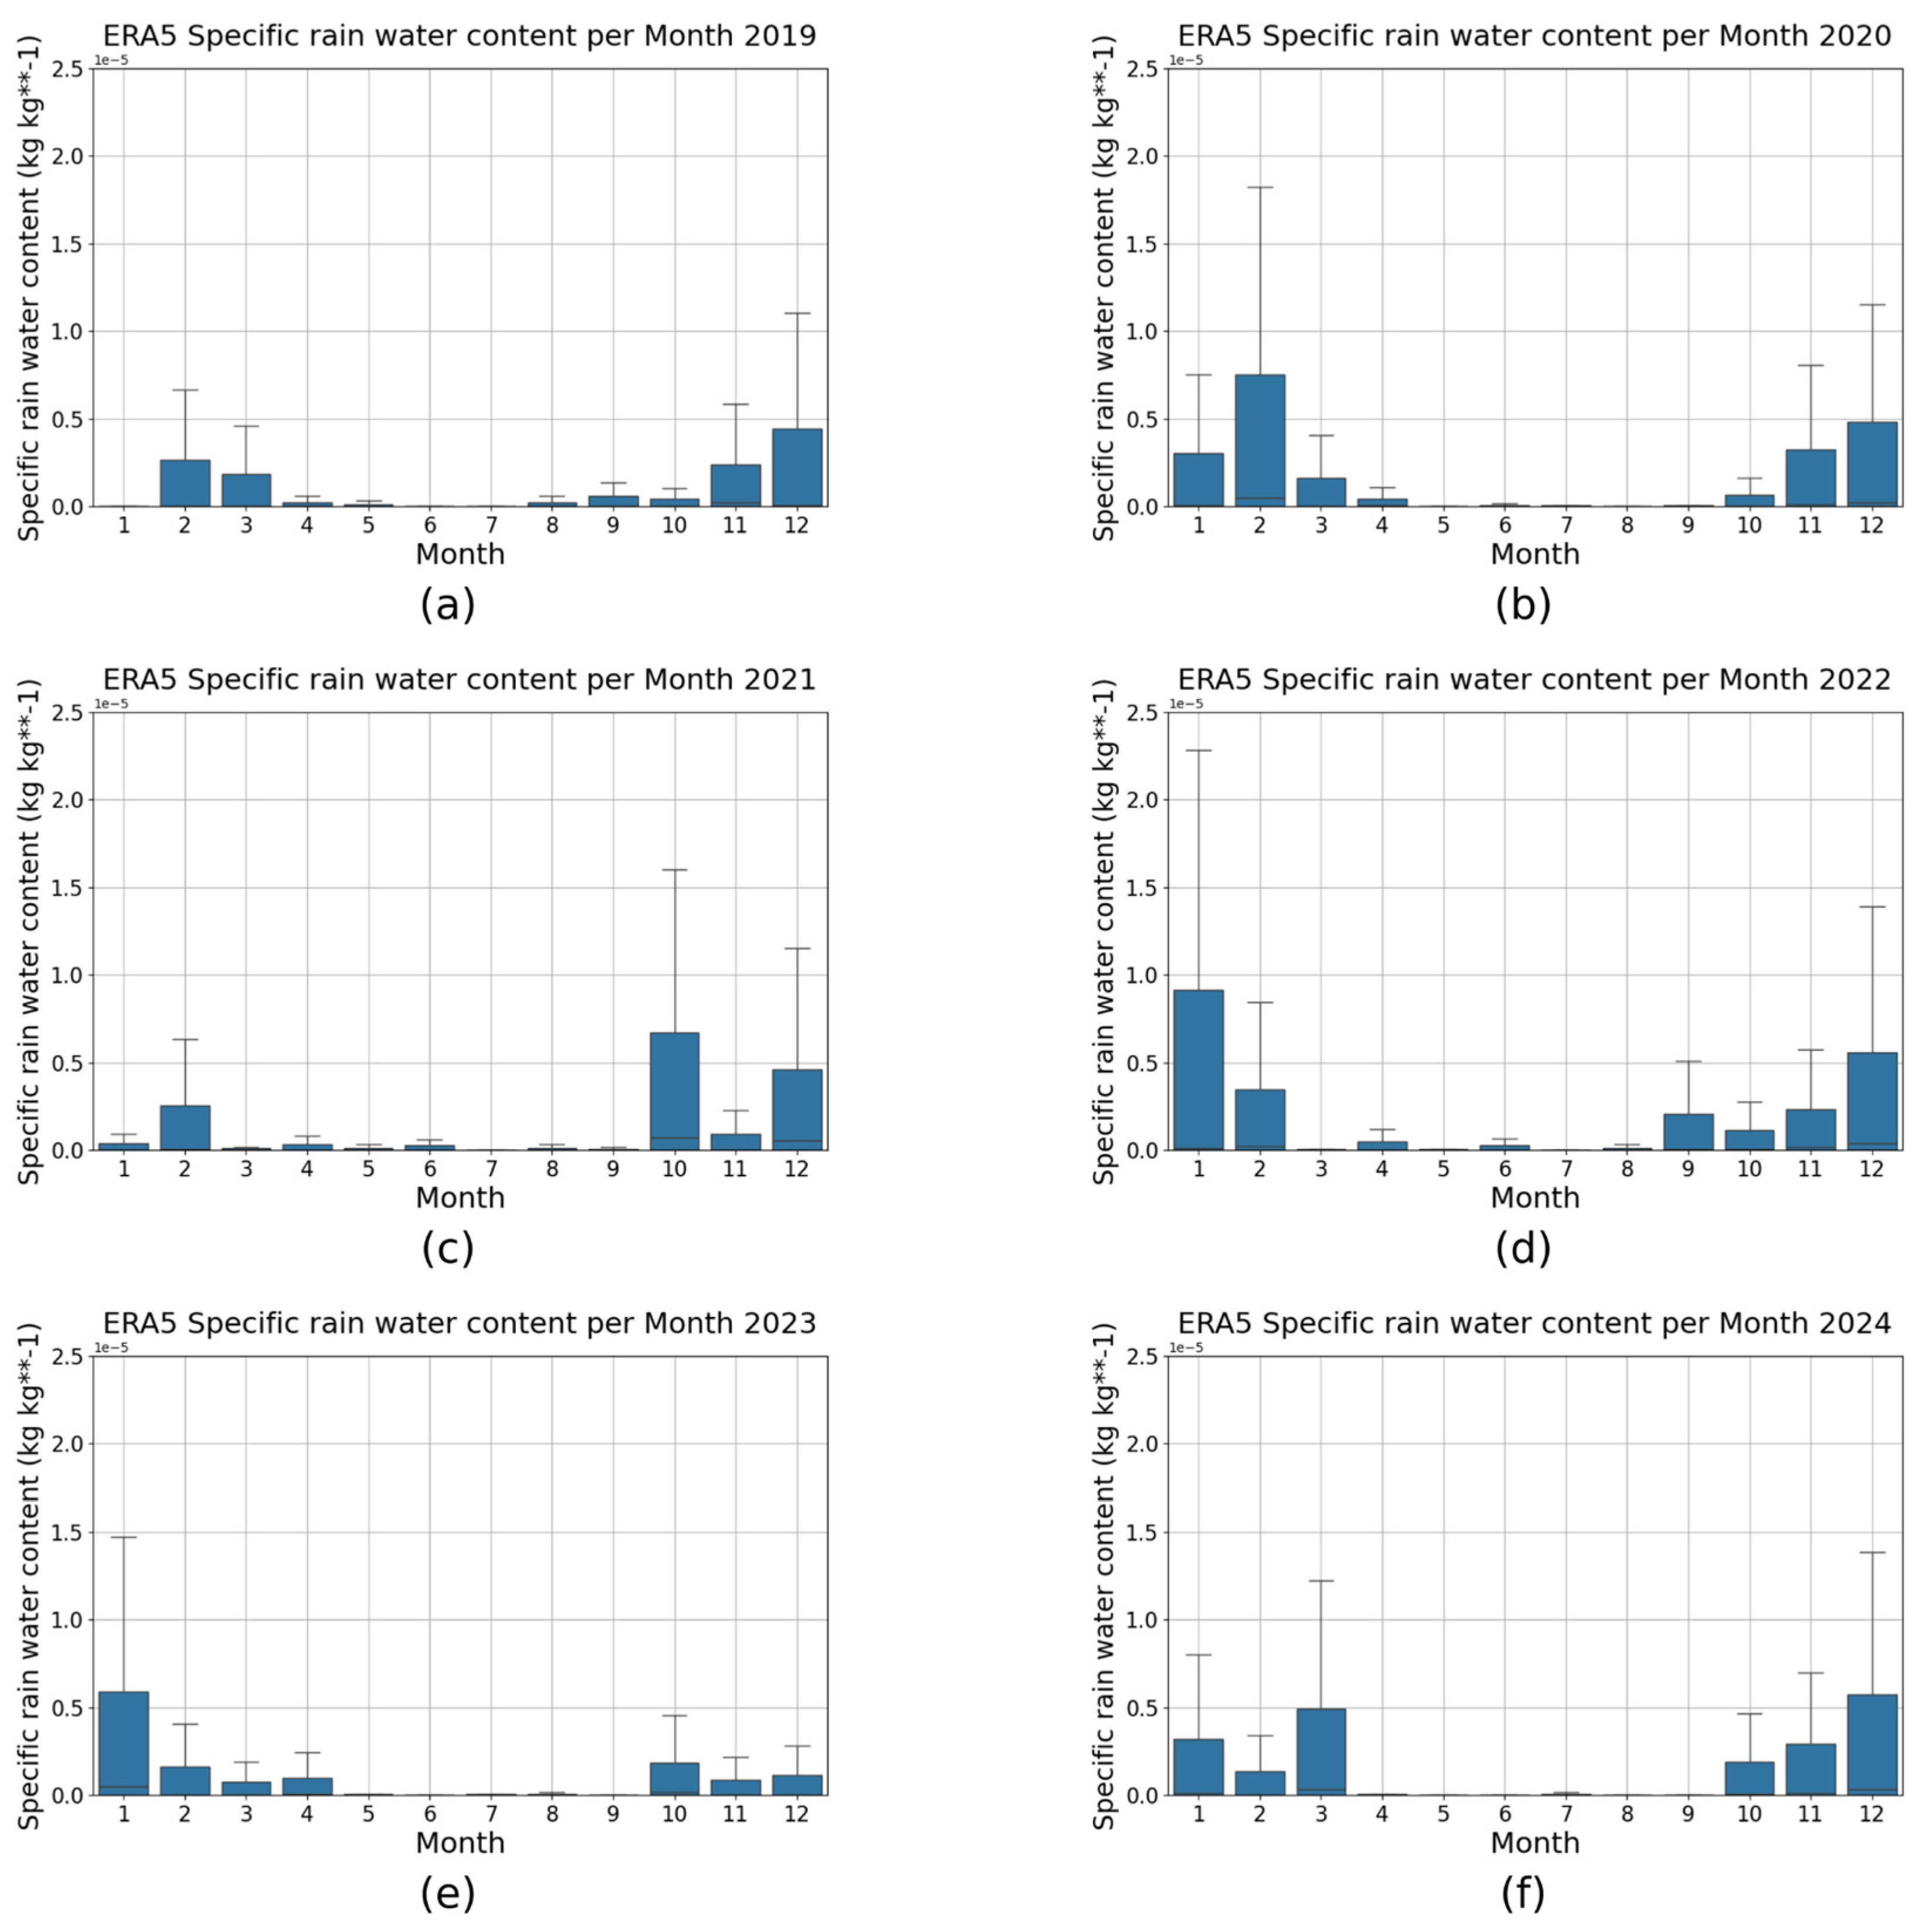
Hourly meteorological data between 2019–2024 were selected to provide the monthly average for latitudes between 22.62°S and 22.42°S and longitudes between 44.20°W and 44.00°W, and an altitude of 1000 hPa. The box plot was created using these values to investigate the meteorological influence in our analysis of Volta Redonda city. A seasonal effect was observed, with the colder months (April to September) coinciding with periods of higher NO2 concentrations in our analysis; see Figure A1 and Figure A2.
In addition, paired t-tests were applied to the ERA5 temperature and cloud rain water content data to determine whether these meteorological variables exhibited significant differences between weekdays and weekends, similar to those observed in the TROPOMI NO2 data. Both parameters illustrated no statistically significant differences between weekdays and weekends during the study period (p > 0.05) and the relatively small t-values and alternating signs (Temperature: ranging from −0.801 to 1.436 and CRWC: ranging from −1.739 to 1.901), indicate that the observed differences were weak and inconsistent among years. To better evaluate the differences between weekdays and weekends in the ERA5 temperature and cloud rain water content data, we repeated the statistical analysis using weekly mean values derived from daily observations, rather than monthly mean values. This approach provides a finer temporal resolution while reducing the influence of day-to-day variability. The weekly analysis performed even better, generally yielding smaller absolute t-values and higher p-values.
Figure A1.
ERA5-derived temperature measurements over the southern region of Rio de Janeiro, focusing on Volta Redonda, from 2019 to 2024 in (a–f).
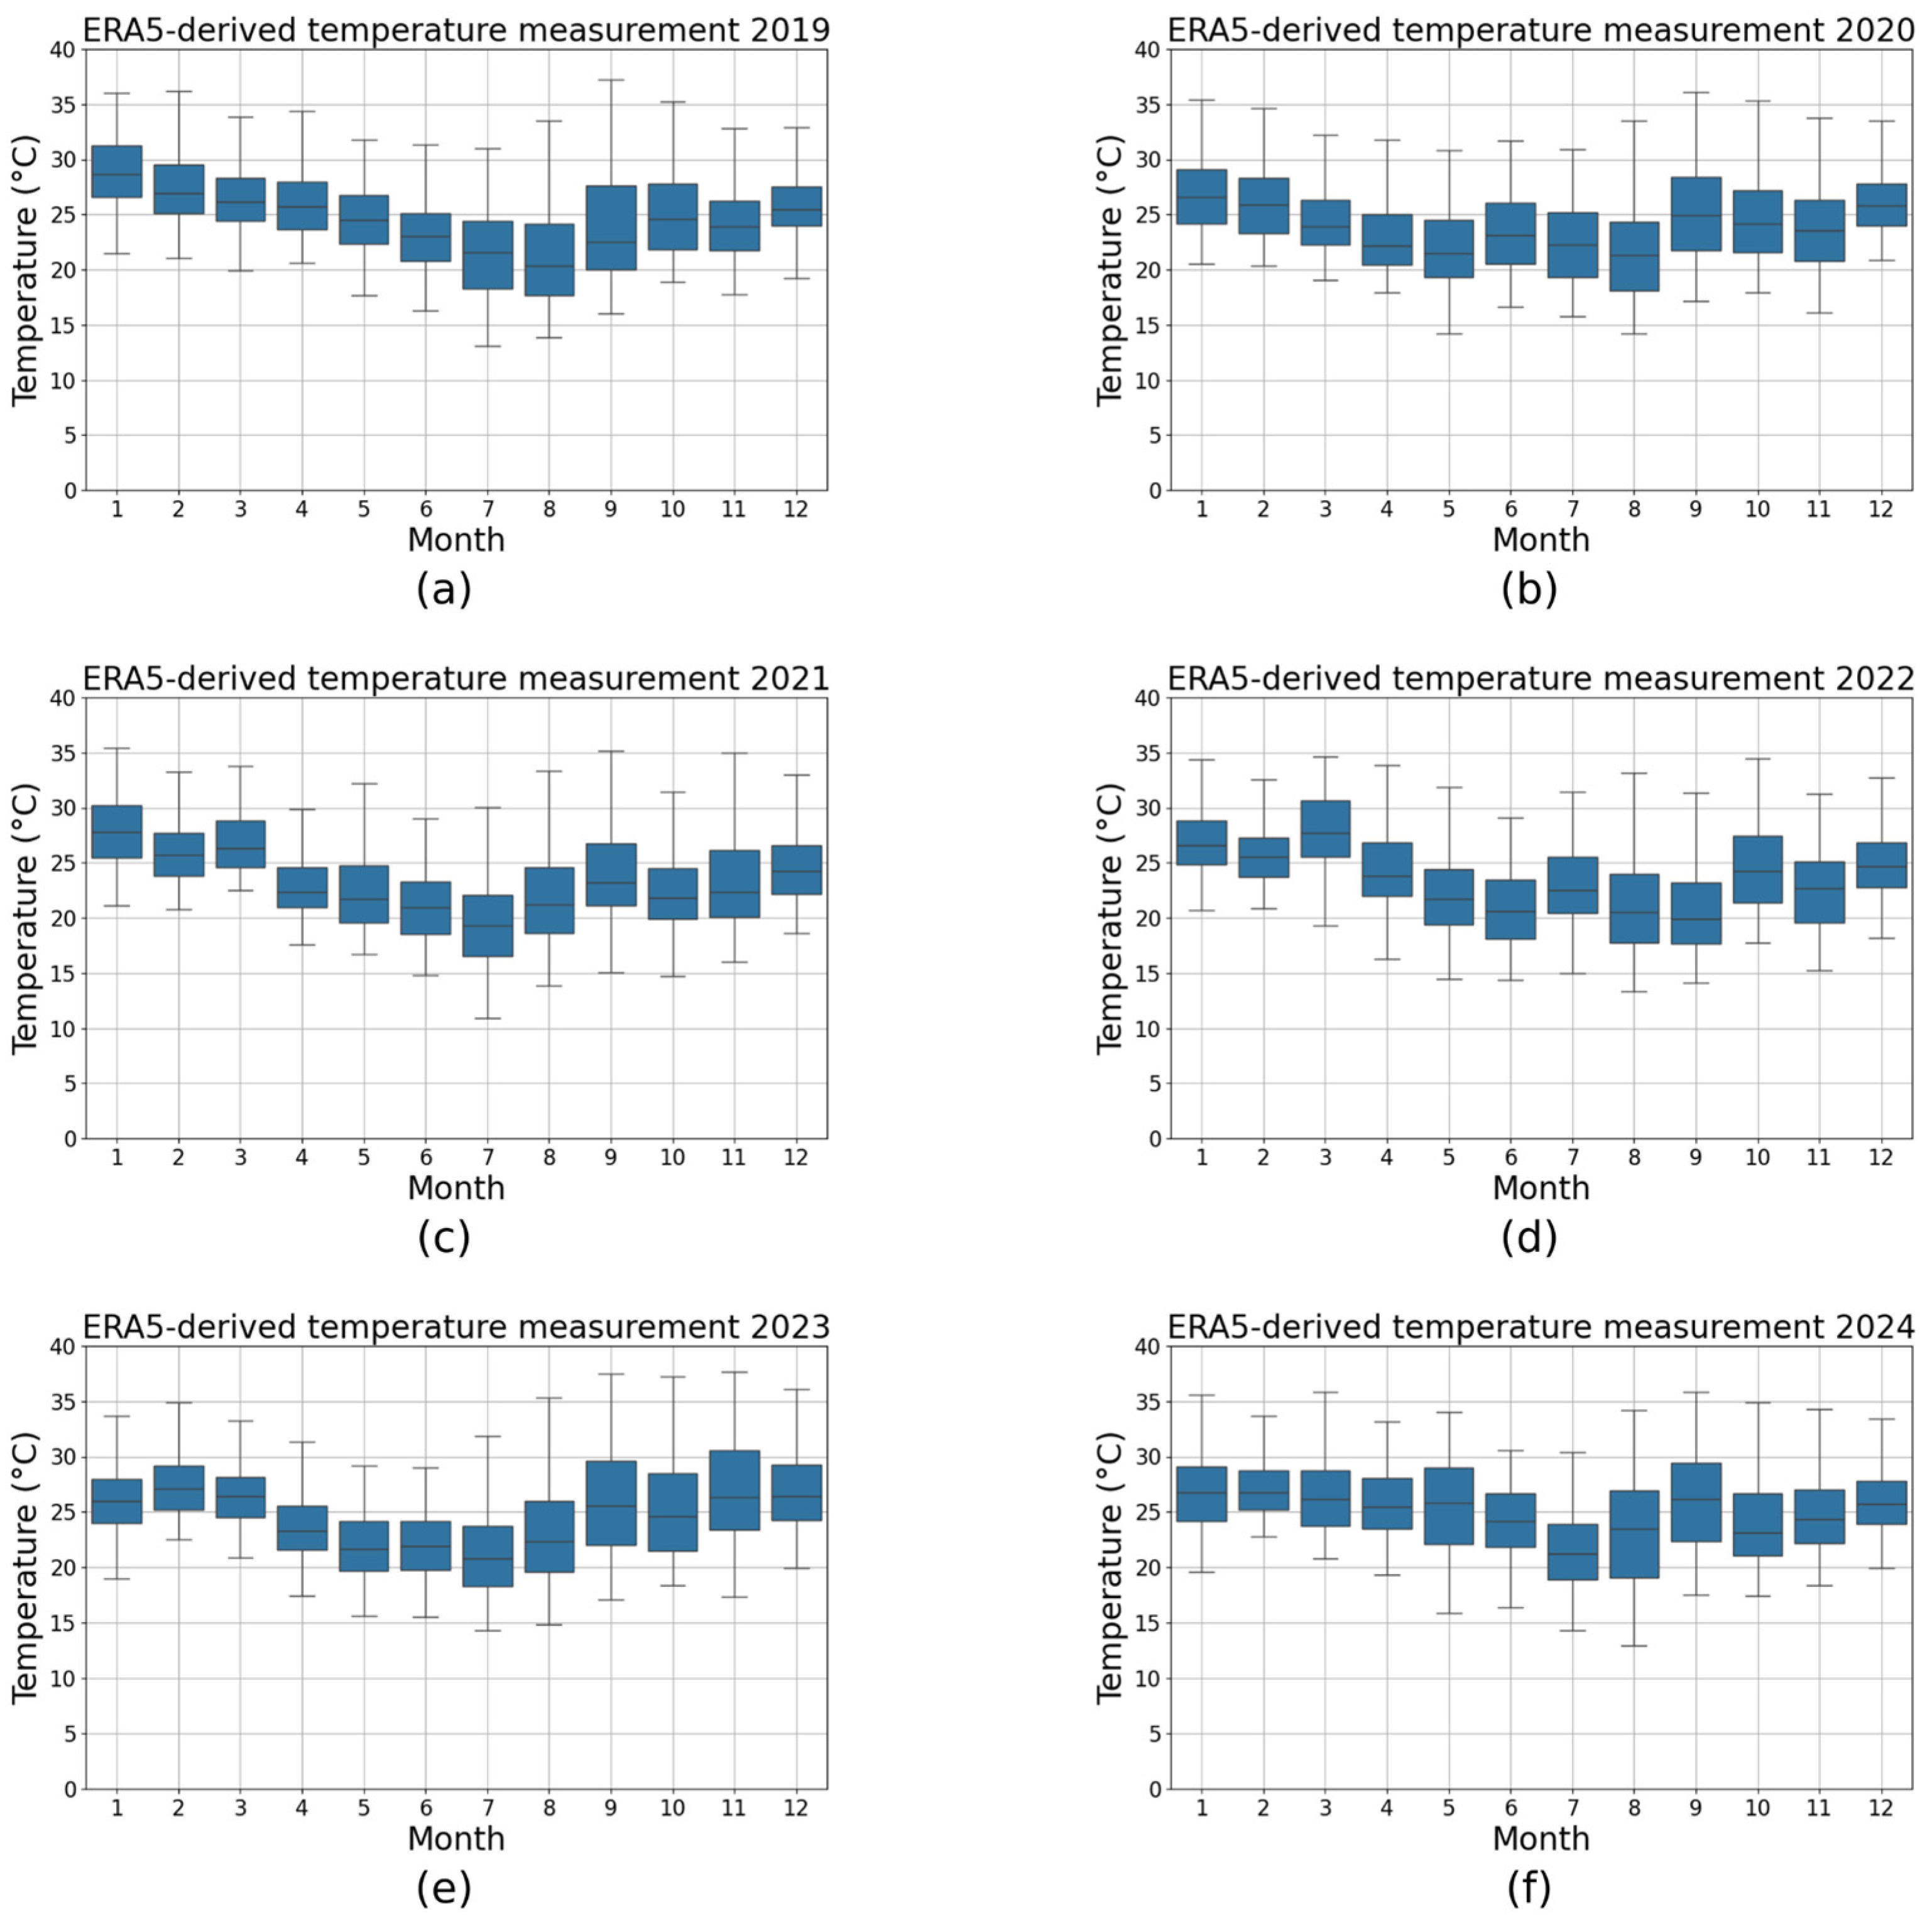
These results suggest that temperature and cloud rain water content exhibited similar conditions on weekdays and weekends and is therefore unlikely to explain the weekday–weekend differences observed in the TROPOMI NO2 concentrations, supporting the interpretation that changes in anthropogenic emissions are the dominant factor.
Figure A2.
Specific rainwater content data from ERA5 for the southern region of Rio de Janeiro, focusing on Volta Redonda, from 2019 to 2024 in (a–f).
Appendix A.2. HYSPLIT Analysis
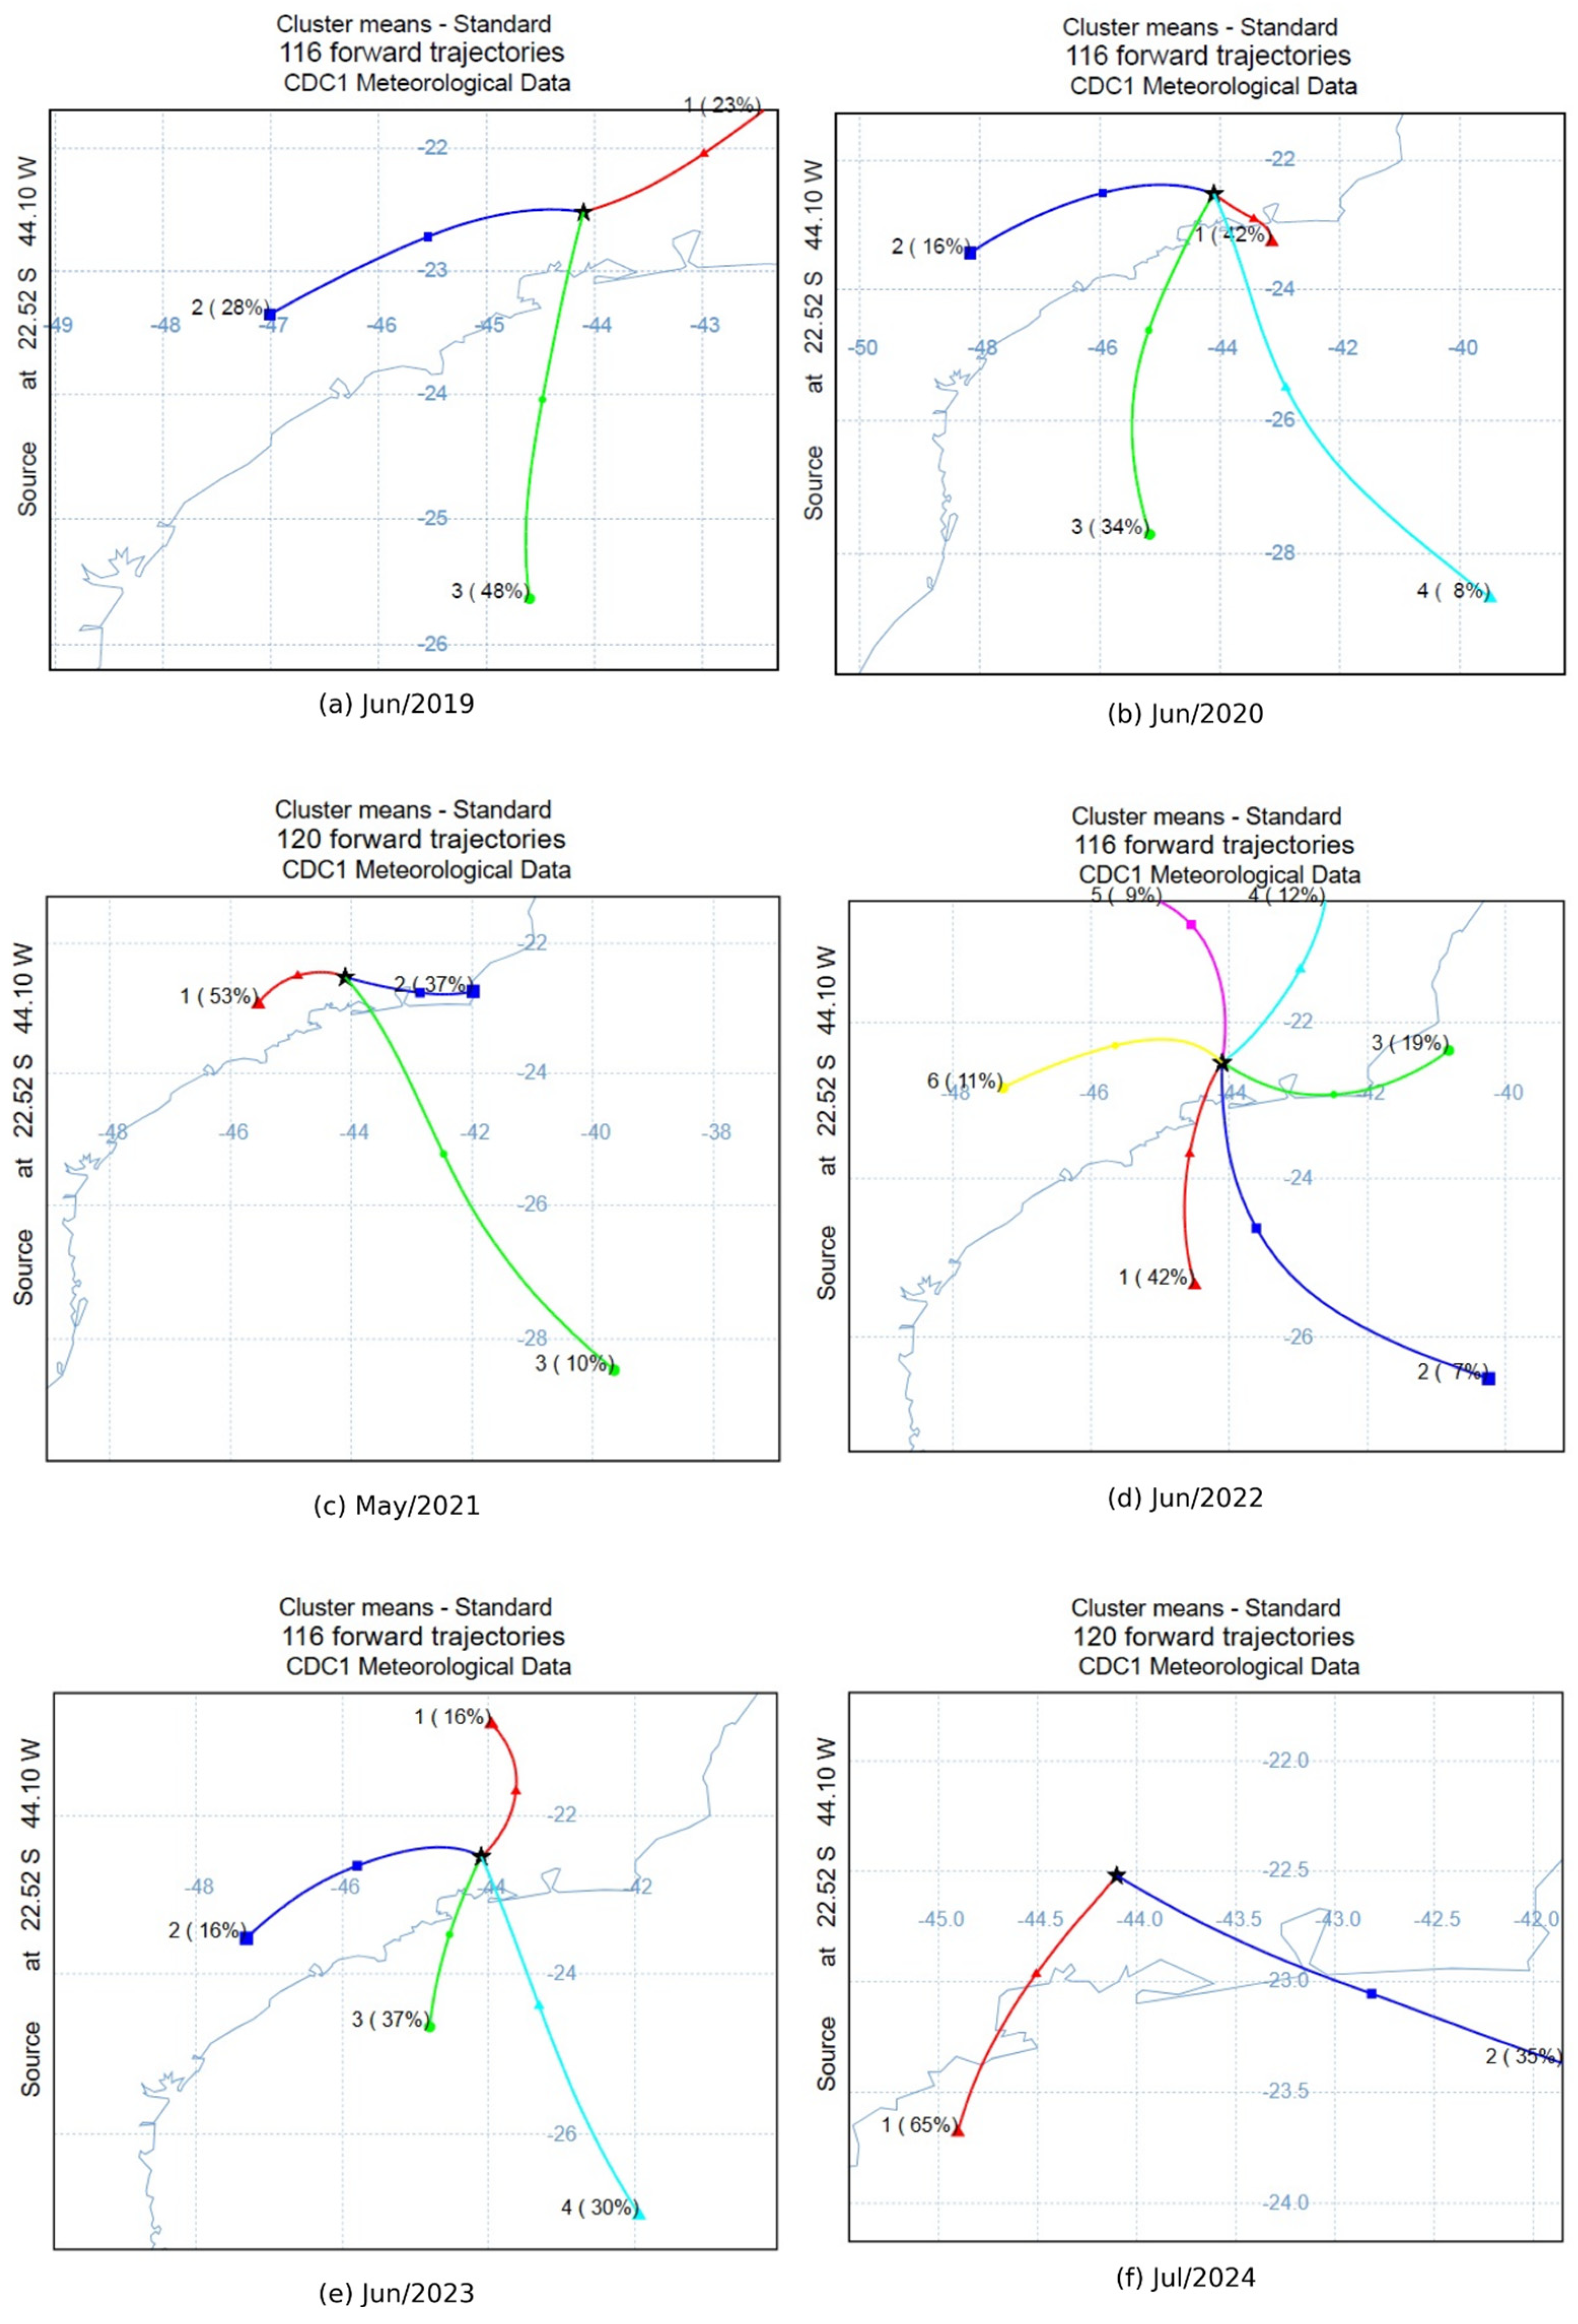
The HYSPLIT (Hybrid Single-Particle Lagrangian Integrated Trajectory) model [48] is widely used in atmospheric sciences to simulate the transport and dispersion of air masses and particles over scales ranging from regional to long-distance. Developed by NOAA 1, it combines Lagrangian and Eulerian approaches to model trajectories, dispersion, deposition, and even chemical transformations in the atmosphere. In trajectory mode, HYSPLIT can track air masses forward or backward in time using meteorological data, linking a specific location and time to potential source or destination regions. The analysis focused on investigating the directional characteristics of air mass trajectories departing from Volta Redonda (coordinates (22.52°S, 44.10°W), 500 m height a.g.l.). The Global Data Assimilation System (GDAS) [48] was used as the meteorological input data to drive the HYSPLIT simulation.
At each temporal interval, air mass trajectories are classified into one of eight cardinal wind sectors based on their directional components: north (N, 0.0° ± 22.5°), northeast (NE, 45.0° ± 22.5°), east (E, 90.0° ± 22.5°), southeast (SE, 135.0° ± 22.5°), south (S, 180.0° ± 22.5°), southwest (SW, 225.0° ± 22.5°), west (W, 270.0° ± 22.5°), and northwest (NW, 315.0° ± 22.5°). This sectoral classification enables comprehensive trajectory analysis and probabilistic assessment of air mass transport patterns.
The wind direction of forward trajectories predominantly in the Southwest direction can be explained by HYSPLIT analysis, to 500 m above ground level, as illustrated in Figure A3 for the period from April to September, that is the period with higher NO2 concentration. In Figure A3, the direction of every individual step along each 6-h forward trajectory generated with the HYSPLIT model [49] was analyzed. Trajectories were simulated forward in time, starting at each hour during the period from 2019 to 2024, to provide behavior specifically for the study period. The recorded directions obtained for each month of the years 2019–2024 are displayed in polar histograms (see Figure A3), normalized so that the total sum of all directional frequencies equals one.
Figure A3.
Distribution of directional probabilities for HYSPLIT forward trajectories to 500 m above ground level with monthly TROPOMI NO2 concentration for 2021 between April–September in (a–f).
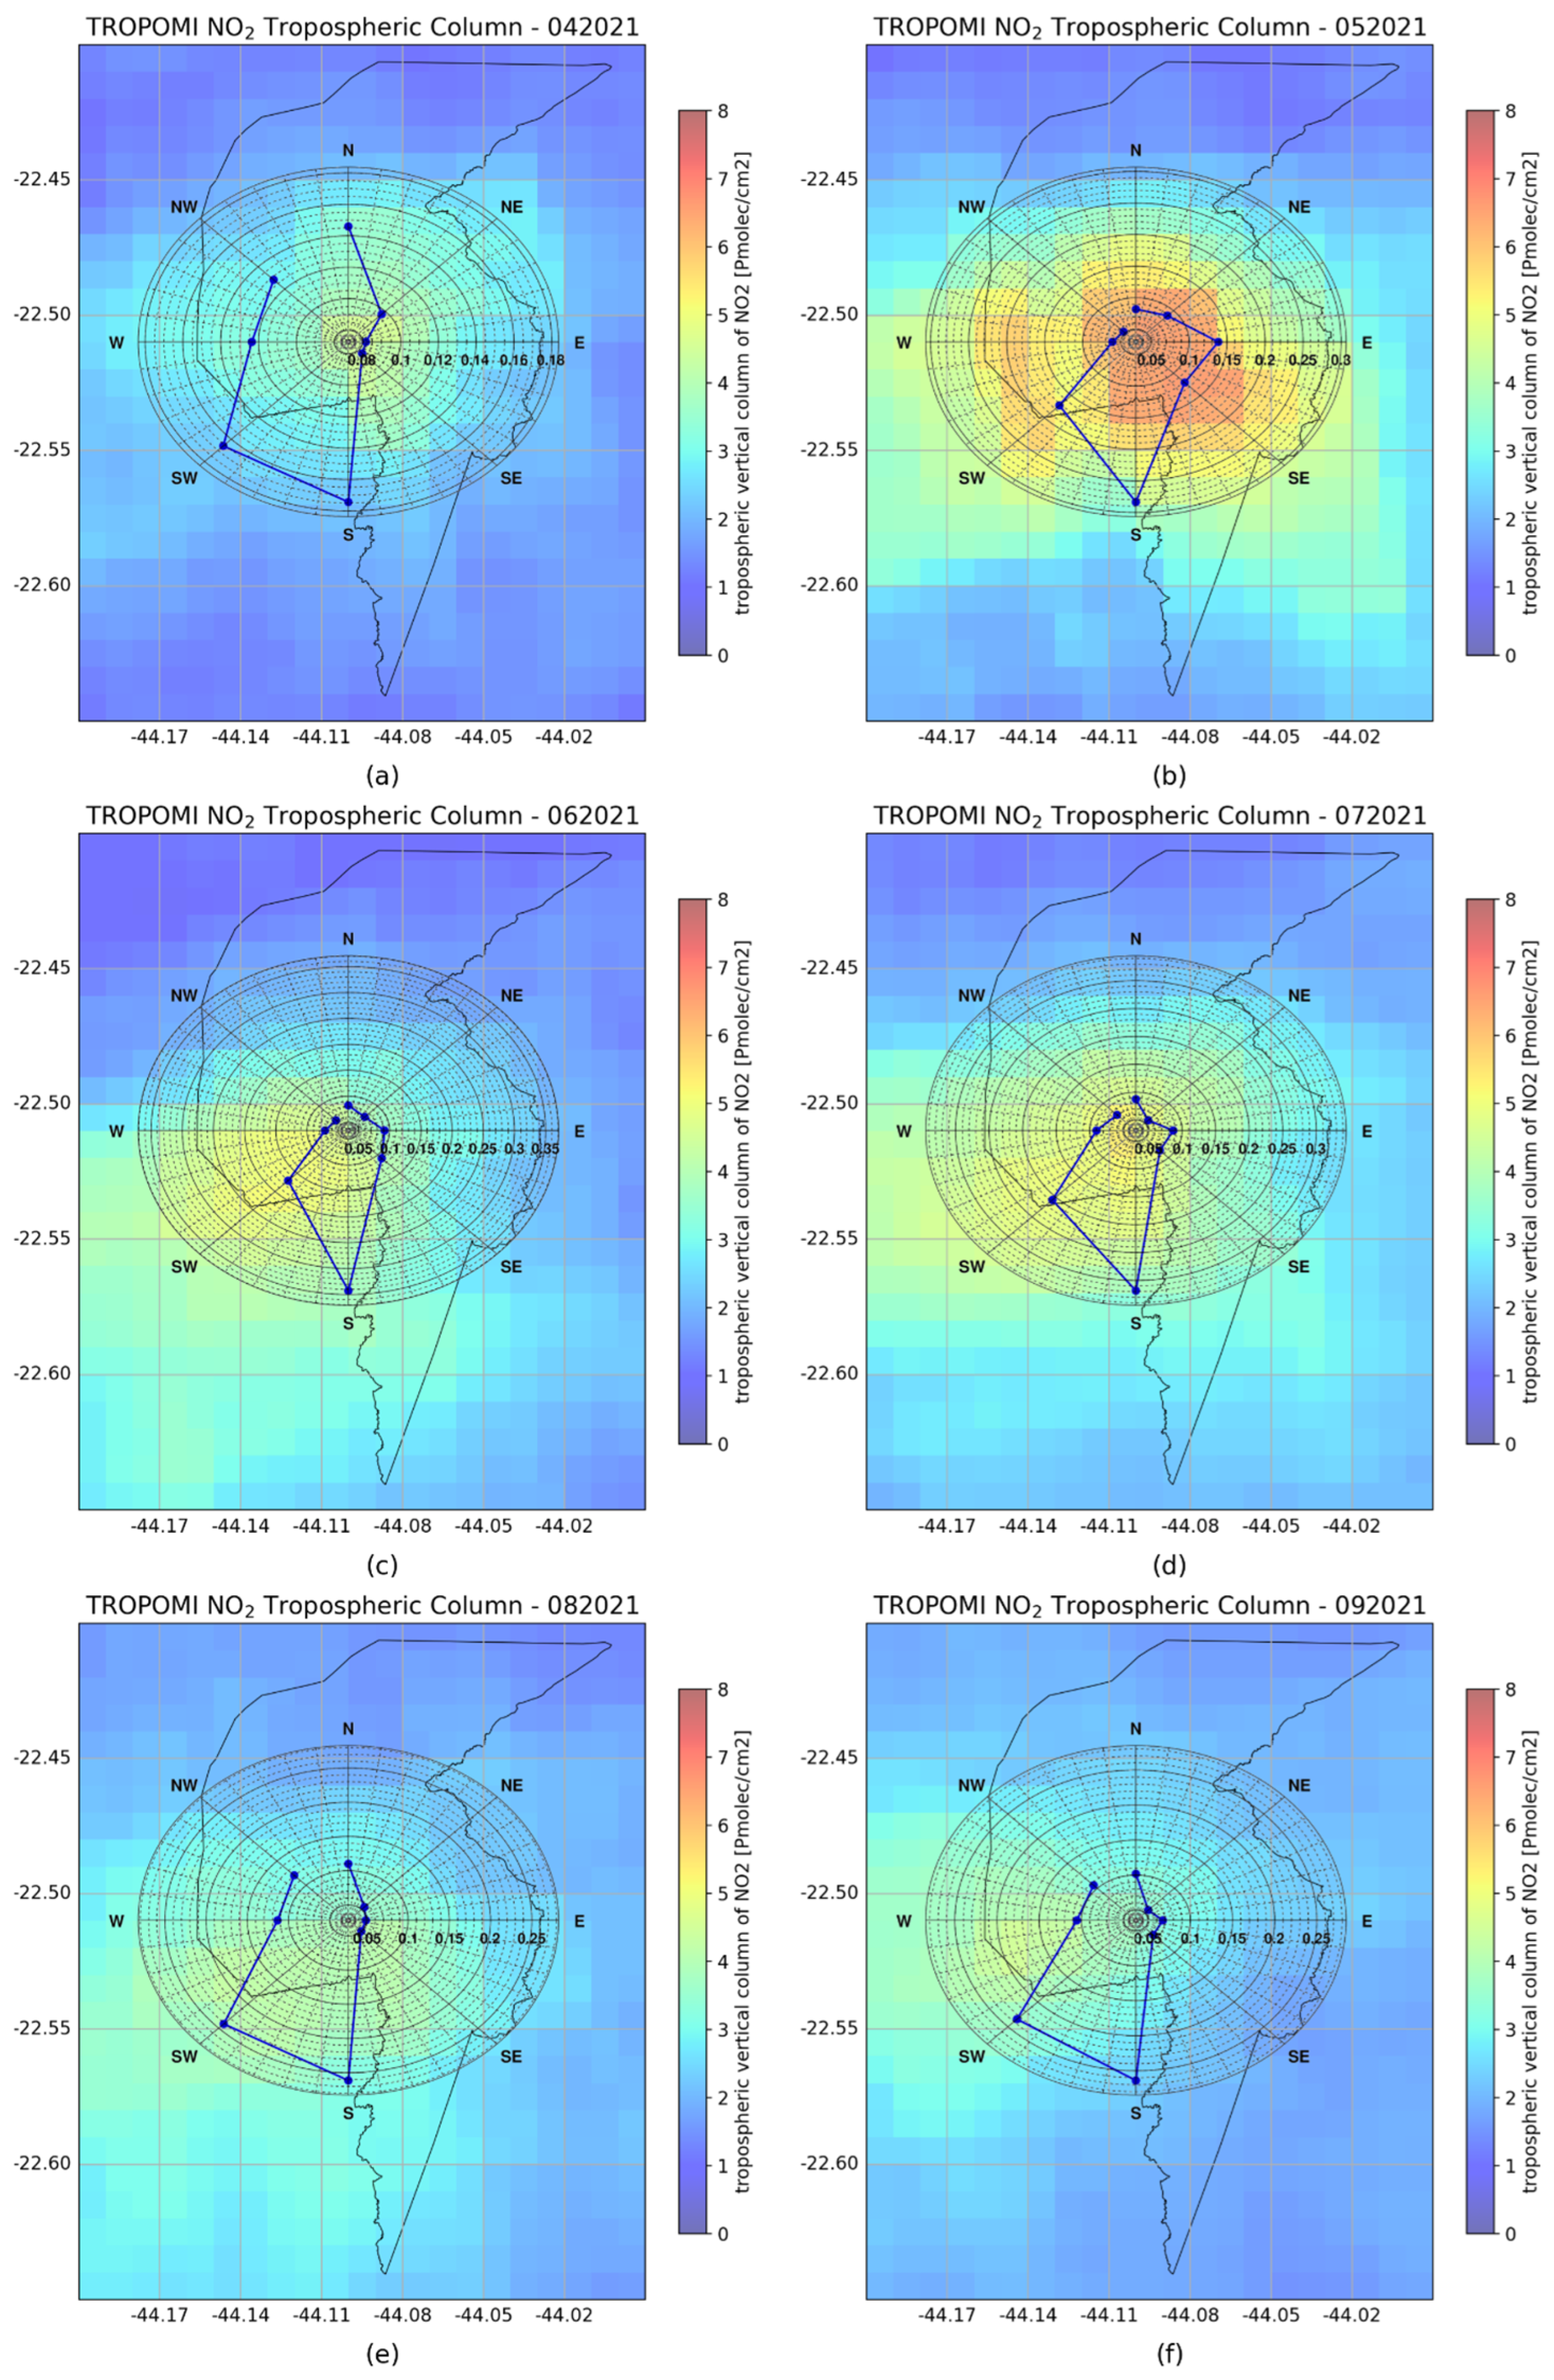
As one can see, in most months, air masses predominantly move toward the south/southwest, whereas those heading north are notably uncommon. It contributes to the understanding of how air pollution arrives from the south at the Belmonte station. Similar patterns are also observed even when the initial altitude of the forward trajectories is changed to 1000 m above ground level. It is worth noting that an initial trajectory altitude of 4000 m above ground level was also evaluated. However, these results were not discussed because they primarily represent transport in the free troposphere, whereas our study focuses on near-surface transport. In addition, the analysis using an initial altitude of 200 m above ground level was repeated for the study period (2019–2024); see Figure A4.
Figure A4.
Distribution of directional probabilities for HYSPLIT forward trajectories to 200 m above ground level with monthly TROPOMI NO2 concentration for 2021 between April–September in (a–f).
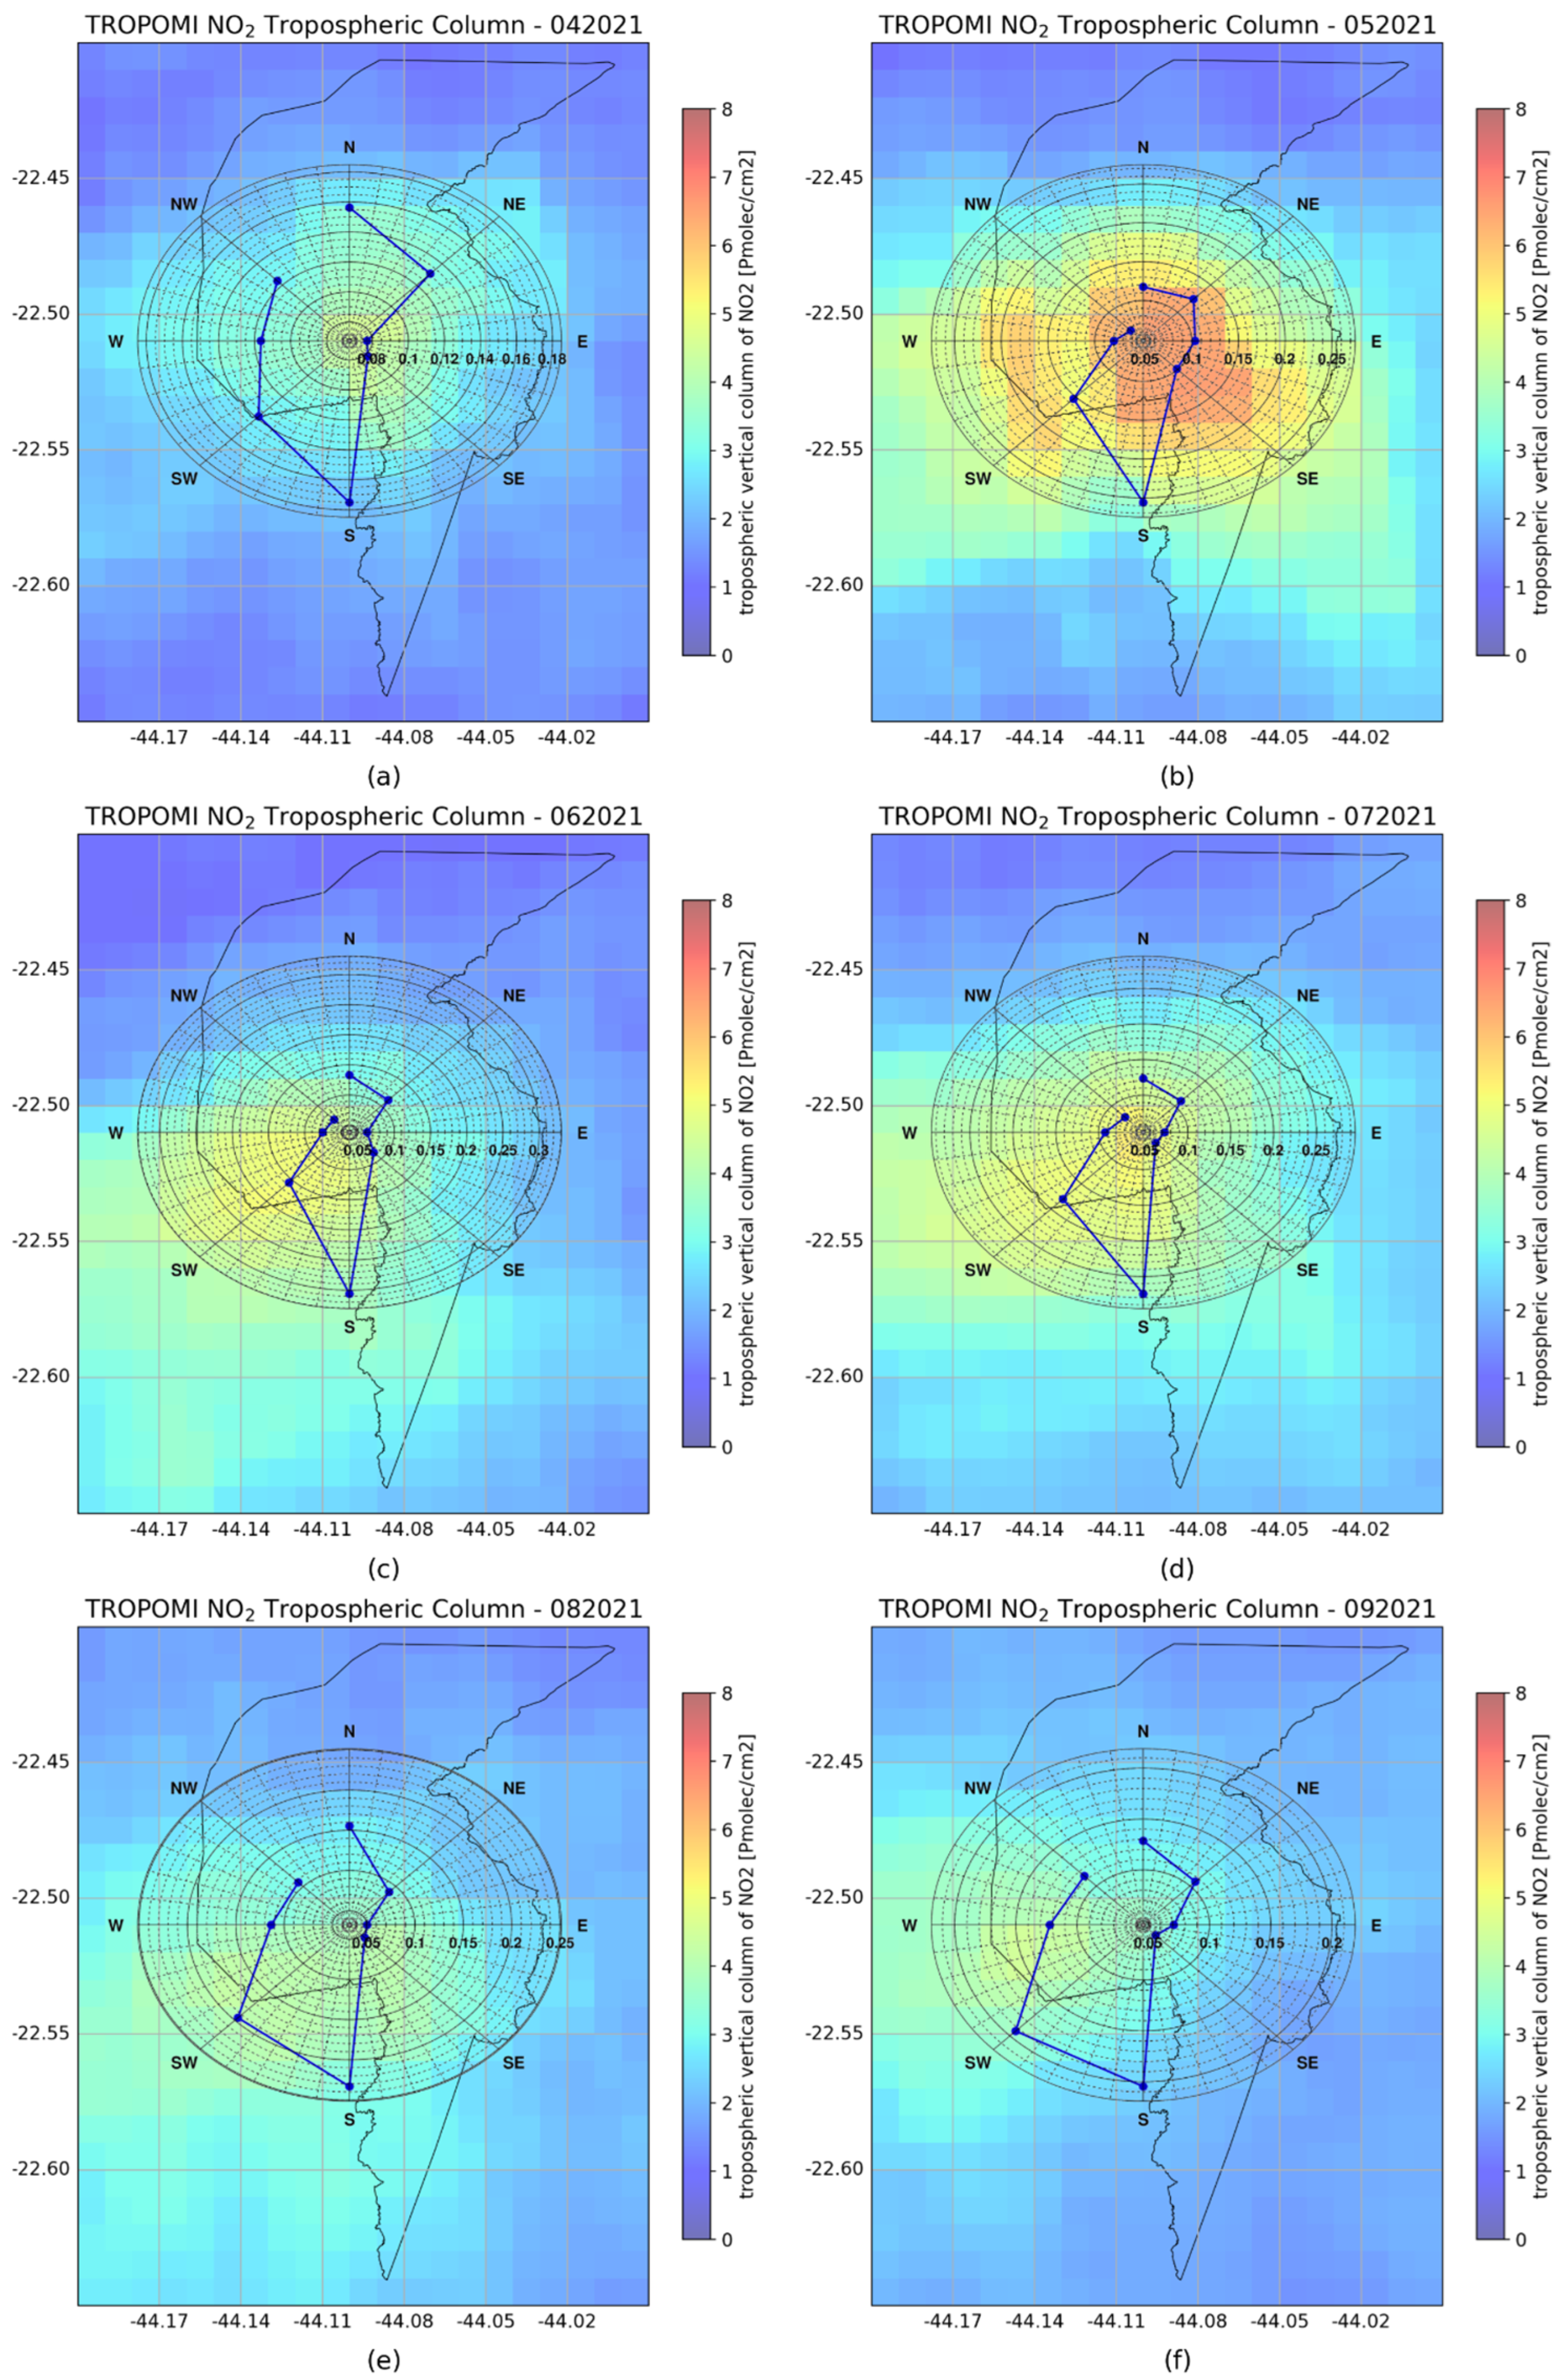
This additional analysis yielded similar behavior, which is consistent with and further supports our original findings, demonstrating that the identified transport patterns are robust to reasonable variations in the initial trajectory altitude (near the surface). To reinforce the air masses’ movement toward the south/southwest, the HYSPLIT cluster analysis was applied to the months of higher NO2 concentration between 2019–2024, as illustrated in Figure A5. The mean trajectory showed a higher percentage (>60%) in the south/southwest as expected.
Figure A5.
HYSPLIT cluster analysis for forward trajectories in the period between 2019–2024 for the months with higher NO2 concentration in (a–f).
References
- Vandaele, A.C.; Hermans, C.; Simon, P.C.; Carleer, M.; Colin, R.; Fally, S.; Mérienne, M.; Jenouvrier, A.; Coquart, B. Measurements of the no absorption cross-section from 42,000 cm−1 to 10,000 cm−1 (238–1000 nm) at 220 k and 294 k. J. Quant. Spectrosc. Radiat. Transf. 1998, 59, 171–184. [Google Scholar] [CrossRef] [Scilit]
- Goldberg, D.L.; Anenberg, S.C.; Kerr, G.H.; Mohegh, A.; Lu, Z.; Streets, D.G. TROPOMI no in the United States: A detailed look at the annual averages, weekly cycles, effects of temperature, and correlation with surface no2 concentrations. Earth’s Future 2021, 9, e2020EF001665. [Google Scholar] [CrossRef] [Scilit] [PubMed]
- Anenberg, S.C.; Henze, D.K.; Tinney, V.; Kinney, P.L.; Raich, W.; Fann, N.; Malley, C.S.; Roman, H.; Lamsal, L.; Duncan, B.; et al. Estimates of the global burden of ambient PM2.5, ozone, and NO on asthma incidence and emergency room visits. Environ. Health Perspect. 2018, 126, 107004. [Google Scholar] [CrossRef] [Scilit] [PubMed]
- Achakulwisut, P.; Brauer, M.; Hystad, P.; Anenberg, S.C. Global, national, and urban burdens of pediatric asthma incidence attributable to ambient no pollution: Estimates from global datasets. Lancet Planet. Health 2019, 3, e166–e178. [Google Scholar] [CrossRef] [Scilit] [PubMed]
- Moreira, G.d.A.; Carbone, S.; Guerrero-Rascado, J.L.; Andrade, I.d.S.; Cacheffo, A.; Vélez-Pereira, A.M.; Zamora-Ledezma, E.; Thielen, D.; Gomes, A.A.; Duarte, E.d.S.F.; et al. Evidence of the consequences of the prolonged fire season on air quality and public health from 2024 São Paulo (brazil) data. Sci. Rep. 2025, 15, 28337. [Google Scholar] [CrossRef] [Scilit] [PubMed]
- Burnett, R.T.; Stieb, D.; Brook, J.R.; Cakmak, S.; Dales, R.; Raizenne, M.; Vincent, R.; Dann, T. Associations between short-term changes in nitrogen dioxide and mortality in Canadian cities. Arch. Environ. Health Int. J. 2004, 59, 228–236. [Google Scholar] [CrossRef] [Scilit] [PubMed]
- Chen, X.; Zhang, L.-W.; Huang, J.-J.; Song, F.-J.; Zhang, L.-P.; Qian, Z.-M.; Trevathan, E.; Mao, H.-J.; Han, B.; Vaughn, M.; et al. Long-term exposure to urban air pollution and lung cancer mortality: A 12-year cohort study in northern China. Sci. Total Environ. 2016, 571, 855–861. [Google Scholar] [CrossRef] [Scilit] [PubMed]
- Raaschou-Nielsen, O.; Beelen, R.; Wang, M.; Hoek, G.; Andersen, Z.; Hoffmann, B.; Stafoggia, M.; Samoli, E.; Weinmayr, G.; Dimakopoulou, K.; et al. Particulate matter air pollution components and risk for lung cancer. Environ. Int. 2016, 87, 66–73. [Google Scholar] [CrossRef] [Scilit] [PubMed]
- Fisher, J.A.; Liao, L.M.; Graubard, B.I.; Kaufman, J.D.; Silverman, D.T.; Jones, R.R. Ambient air pollution exposure and lung cancer risk in a large prospective u.s. cohort. Sci. Total Environ. 2025, 1002, 180490. [Google Scholar] [CrossRef] [Scilit] [PubMed]
- César, A.C.G.; Carvalho, J.A.; Nascimento, L.F.C. Association between NOx exposure and deaths caused by respiratory diseases in a medium-sized Brazilian city. Braz. J. Med. Biol. Res. 2015, 48, 1130–1135. [Google Scholar] [CrossRef] [Scilit] [PubMed]
- Gruzieva, O.; Bergström, A.; Hulchiy, O.; Kull, I.; Lind, T.; Melén, E.; Moskalenko, V.; Pershagen, G.; Bellander, T. Exposure to air pollution from traffic and childhood asthma until 12 years of age. Epidemiology 2013, 24, 54–61. [Google Scholar] [CrossRef] [Scilit] [PubMed]
- Prunet, P.; Lezeaux, O.; Camy-Peyret, C.; Thevenon, H. Analysis of the no tropospheric product from s5p TROPOMI for monitoring pollution at city scale. City Environ. Interact. 2020, 8, 100051. [Google Scholar] [CrossRef] [Scilit]
- Volke, M.I.; Abarca-Del-Rio, R.; Ulloa-Tesser, C. Impact of mobility restrictions on no concentrations in key latin american cities during the first wave of the COVID-19 pandemic. Urban Clim. 2023, 48, 101412. [Google Scholar] [CrossRef] [Scilit] [PubMed]
- Román-Cascón, C.; Yagüe, C.; Ortiz-Corral, P.; Serrano, E.; Sánchez, B.; Sastre, M.; Maqueda, G.; Alonso-Blanco, E.; Artiñano, B.; Gómez-Moreno, F.; et al. Wind and turbulence relationship with no in an urban environment: A fine-scale observational analysis. Urban Clim. 2023, 51, 101663. [Google Scholar] [CrossRef] [Scilit]
- Stewart, G.B.; Dajnak, D.; Davison, J.; Carslaw, D.C.; Beddows, A.V.; Phantawesak, N.; Stettler, M.E.; Hollaway, M.J.; Beevers, S.D. New NOx and NO vehicle emission curves, and their implications for emissions inventories and air pollution modeling. Urban Clim. 2024, 57, 102103. [Google Scholar] [CrossRef] [Scilit]
- Yarragunta, Y.; Francis, D.; Fonseca, R.; Nelli, N. Long-term trends in omi-retrieved no and so concentrations over the Arabian peninsula. Urban Clim. 2025, 61, 102422. [Google Scholar] [CrossRef] [Scilit]
- Larkin, A.; Anenberg, S.; Goldberg, D.L.; Mohegh, A.; Brauer, M.; Hystad, P. A global spatial-temporal land use regression model for nitrogen dioxide air pollution. Front. Environ. Sci. 2023, 11, 1125979. [Google Scholar] [CrossRef] [Scilit]
- Nawaz, M.O.; Goldberg, D.L.; Kerr, G.H.; Anenberg, S.C. TROPOMI satellite data reshape no air pollution land-use regression modeling capabilities in the United States. ACS ES&T Air 2025, 2, 187–200. [Google Scholar] [CrossRef] [Scilit] [PubMed]
- IBGE. Censo Demográfico 2022. 2022. Available online: https://www.ibge.gov.br/estatisticas/sociais/saude/22827-censo-demografico-2022.html (accessed on 24 July 2025).
- Gioda, A.; Sales, J.A.; Cavalcanti, P.M.S.; Maia, M.F.; Maia, L.F.P.G.; Neto, F.R.A.A. Evaluation of air quality in Volta Redonda, the main metallurgical industrial city in Brazil. J. Braz. Chem. Soc. 2004, 15, 856–864. [Google Scholar] [CrossRef] [Scilit]
- Koninklijk Nederlands Meteorologisch Instituut (KNMI). Sentinel-5p TROPOMI Tropospheric NO2 1-Orbit L2 5.5 km × 3.5 km Data. 2021. Available online: https://www.esa.int/ (accessed on 1 March 2025).
- Veefkind, J.P.; Aben, I.; McMullan, K.; Förster, H.; de Vries, J.; Otter, G.; Claas, J.; Eskes, H.J.; de Haan, J.F.; Kleipool, Q.; et al. TROPOMI on the esa sentinel-5 precursor: A gmes mission for global observations of the atmospheric composition for climate, air quality and ozone layer applications. Remote Sens. Environ. 2012, 120, 70–83. [Google Scholar] [CrossRef] [Scilit]
- van Gent, J.; Danckaert, T.; Theys, N.; De Smedt, I.; Lerot, C.; Lange-rock, B.; Sha, M.K. Multi-Year TROPOMI Trace gas Columns, Created on the Occasion of Three Years s-5p/Tropomi. 2024. Available online: https://data.aeronomie.be/dataset/multi-year-tropomi-trace-gas-columns-created-on-the-occasion-of-three-years-s-5p-tropomi (accessed on 10 March 2025).
- Fioletov, V.; McLinden, C.A.; Griffin, D.; Zhao, X.; Eskes, H. Global seasonal urban, industrial, and background NO2 estimated from TROPOMI satellite observations. Atmos. Chem. Phys. 2025, 25, 575–596. [Google Scholar] [CrossRef] [Scilit]
- INEA. Inea Analytics Platform. 2025. Available online: https://qualidadedoar.inea.rj.gov.br/INEAPublico/AMSTabularData (accessed on 1 July 2025).
- Carslaw, D.C.; Beevers, S.D.; Ropkins, K.; Bell, M.C. Detecting and quantifying aircraft and other on-airport contributions to ambient nitrogen oxides in the vicinity of a large international airport. Atmos. Environ. 2006, 40, 5424–5434. [Google Scholar] [CrossRef] [Scilit]
- Carslaw, D.C.; Beevers, S.D. Characterising and understanding emission sources using bivariate polar plots and k-means clustering. Environ. Model. Softw. 2013, 40, 325–329. [Google Scholar] [CrossRef] [Scilit]
- Grange, S.K.; Lewis, A.C.; Carslaw, D.C. Source apportionment advances using polar plots of bivariate correlation and regression statistics. Atmos. Environ. 2016, 145, 128–134. [Google Scholar] [CrossRef] [Scilit]
- Titos, G.; Jefferson, A.; Sheridan, P.J.; Andrews, E.; Lyamani, H.; Alados-Arboledas, L.; Ogren, J.A. Aerosol light-scattering enhancement due to water uptake during the tcap campaign. Atmos. Chem. Phys. 2014, 14, 7031–7043. [Google Scholar] [CrossRef] [Scilit]
- Titos, G.; del Águila, A.; Cazorla, A.; Lyamani, H.; Casquero-Vera, J.A.; Colombi, C.; Cuccia, E.; Gianelle, V.; Mocnik, G.; Alastuey, A.; et al. Spatial and temporal variability of carbonaceous aerosols: Assessing the impact of biomass burning in the urban environment. Sci. Total Environ. 2017, 578, 613–625. [Google Scholar] [CrossRef] [Scilit] [PubMed]
- Gurney, K.R.; Romero-Lankao, P.; Seto, K.C.; Hutyra, L.R.; Duren, R.; Kennedy, C.; Grimm, N.B.; Ehleringer, J.R.; Marcotullio, P.; Hughes, S.; et al. Climate change: Track urban emissions on a human scale. Nature 2015, 525, 179–181. [Google Scholar] [CrossRef] [Scilit] [PubMed]
- Couture, H.D.; Alvara, M.; Freeman, J.; Davitt, A.; Koenig, H.; Kargar, A.R.; O’Connor, J.; Söldner-Rembold, I.; Ferreira, A.; Jeyaratnam, J.; et al. Estimating carbon dioxide emissions from power plant water vapor plumes using satellite imagery and machine learning. Remote Sens. 2024, 16, 1290. [Google Scholar] [CrossRef] [Scilit]
- Gurney, K.R.; Aslam, B.; Dass, P.; Gawuc, L.; Hocking, T.; Barber, J.J.; Kato, A. Assessment of the climate trace global powerplant co2 emissions. Environ. Res. Lett. 2024, 19, 114062. [Google Scholar] [CrossRef] [Scilit]
- Alsubaie, A.S.R. Adolescents and school health: Toward future public health. J. Public Health Issues Pract. 2018, 2, 128. [Google Scholar] [CrossRef] [Scilit]
- Dahiru, T. P-value, a true test of statistical significance? a cautionary note. Ann. Ib. Postgrad. Med. 2011, 6, 21–26. [Google Scholar] [CrossRef] [Scilit] [PubMed]
- Krotkov, N.A.; Lamsal, L.N.; Marchenko, S.V.; Celarier, E.A.; Bucsela, E.J.; Swartz, W.H.; Joiner, J.; OMI Core Team. Omi/Aura no Total and Tropospheric Column Daily L2 Global Gridded 0.25 Degree × 0.25 Degree v3. 2019. Available online: https://cmr.earthdata.nasa.gov/search/concepts/C1266136111-GES_DISC.html (accessed on 1 April 2025).
- Jeong, U.; Hong, H. Assessment of tropospheric concentrations of NO2 from the TROPOMI/Sentinel-5 precursor for the estimation of long-term exposure to surface NO2 over south korea. Remote Sens. 2021, 13, 1877. [Google Scholar] [CrossRef] [Scilit]
- Bechle, M.J.; Millet, D.B.; Marshall, J.D. Remote sensing of exposure to NO2: Satellite versus ground-based measurement in a large urban area. Atmos. Environ. 2013, 69, 345–353. [Google Scholar] [CrossRef] [Scilit]
- IBGE. Instituto Brasileiro de Geografia e Estatística—Cidades e Estados do Brasil. 2025. Available online: https://cidades.ibge.gov.br/ (accessed on 1 June 2025).
- Sekiya, T.; Miyazaki, K.; Eskes, H.; Sudo, K.; Takigawa, M.; Kanaya, Y. A comparison of the impact of TROPOMI and omi tropospheric no on global chemical data assimilation. Atmos. Meas. Tech. 2022, 15, 1703–1728. [Google Scholar] [CrossRef] [Scilit]
- Nogueira, T.; Kamigauti, L.Y.; Pereira, G.M.; Gavidia-Calderón, M.E.; Ibarra-Espinosa, S.; de Oliveira, G.L.; de Miranda, R.M.; Vasconcellos, P.d.C.; de Freitas, E.D.; Andrade, M.d.F. Evolution of vehicle emission factors in a megacity affected by extensive biofuel use: Results of tunnel measurements in São Paulo, Brazil. Environ. Sci. Technol. 2021, 55, 6677–6687. [Google Scholar] [CrossRef] [Scilit] [PubMed]
- Guerrero-Rascado, J.L.; da Costa, R.F.; Bedoya, A.E.; Guardani, R.; Alados-Arboledas, L.; Bastidas, A.E.; Landulfo, E. Multispectral elastic scanning lidar for flares research: Characterizing the electronic subsystem and application. Opt. Express 2014, 22, 31063–31077. [Google Scholar] [CrossRef] [Scilit] [PubMed]
- da Costa, R.F.; Marques, M.T.A.; Macedo, F.d.M.; Andrade, I.d.S.; Araujo, E.C.; Correa, T.; Salani, M.H.G.d.A.; Lopes, D.S.; Guardani, M.L.G.; Landulfo, E.; et al. Monitoring the industrial sources of aerosol in cubatão, brazil, using a scanning elastic lidar and a lidar doppler. In EPJ Web of Conferences; EDP Sciences: Les Ulis, France, 2018; Volume 176, p. 04011. [Google Scholar] [CrossRef] [Scilit]
- Ministry of Science, Technology and Innovation (MCTI). National Inventory Report (nir) 2024: Greenhouse Gas Emissions and Removals 1990–2022. Prepared Under the Sistema de Registro Nacional de Emissões (SIRENE). 2024. Available online: https://www.gov.br/mcti/pt-br/acompanhe-o-mcti/sirene/publicacoes/relatorios-bienais-de-transparencia-btrs/relatorios_slogo/relatorio_deinventario_nacionalnir_2024_port_slogo.pdf (accessed on 4 December 2025).
- Cohen, A.J.; Brauer, M.; Burnett, R.; Anderson, H.R.; Frostad, J.; Estep, K.; Balakrishnan, K.; Brunekreef, B.; Dandona, L.; Dandona, R.; et al. Estimates and 25-year trends of the global burden of disease attributable to ambient air pollution: An analysis of data from the global burden of diseases study 2015. Lancet 2017, 389, 1907–1918. [Google Scholar] [CrossRef] [Scilit] [PubMed]
- Chen, J.; Zeng, Y.; Lau, A.K.H.; Guo, C.; Wei, X.; Lin, C.; Huang, B.; Lao, X.Q. Chronic exposure to ambient pm2.5/no and respiratory health in school children: A prospective cohort study in Hong Kong. Ecotoxicol. Environ. Saf. 2023, 252, 114558. [Google Scholar] [CrossRef] [Scilit] [PubMed]
- Gasparrini, A.; Guo, Y.; Hashizume, M.; Lavigne, E.; Zanobetti, A.; Schwartz, J.; Tobias, A.; Tong, S.; Rockl, J.; Forsberg, B.; et al. Mortality risk attributable to high and low ambient temperature: A multicountry observational study. Lancet 2015, 386, 369–375. [Google Scholar] [CrossRef] [Scilit] [PubMed]
- Stein, A.F.; Draxler, R.R.; Rolph, G.D.; Stunder, B.J.B.; Cohen, M.D.; Ngan, F. Noaa’s hysplit atmospheric transport and dispersion modeling system. Bull. Am. Meteorol. Soc. 2015, 96, 2059–2077. [Google Scholar] [CrossRef] [Scilit]
- Aab, A.; Abreu, P.; Aglietta, M.; Ahlers, M.; Ahn, E.; Albuquerque, I.; Allekotte, I.; Allen, J.; Allison, P.; Almela, A.; et al. Origin of atmospheric aerosols at the pierre auger observatory using studies of air mass trajectories in South America. Atmos. Res. 2014, 149, 120–135. [Google Scholar] [CrossRef] [Scilit]

Disclaimer/Publisher’s Note: The statements, opinions and data contained in all publications are solely those of the individual author(s) and contributor(s) and not of MDPI and/or the editor(s). MDPI and/or the editor(s) disclaim responsibility for any injury to people or property resulting from any ideas, methods, instructions or products referred to in the content. |
© 2026 by the authors. Licensee MDPI, Basel, Switzerland. This article is an open access article distributed under the terms and conditions of the Creative Commons Attribution (CC BY) license.