


Highlights
What are the main findings?
- Haikou’s 2020–2025 LOS deformation field shows strong spatial heterogeneity, with persistent negative LOS anomalies concentrated in reclaimed coastal sectors, port-adjacent areas, and Jiangdong New District.
- The combined use of PS-InSAR and DS-InSAR improves the spatial characterization of deformation in complex coastal urban environments, especially in reclaimed and low-coherence areas.
What is the implication of the main finding?
- The results indicate that coastal urban deformation in Haikou is hydrogeologically conditioned and development-amplified, rather than being controlled by a single factor.
- The proposed PS/DS-InSAR and spatial attribution framework can support priority monitoring-zone identification and risk-informed planning in rapidly urbanizing tropical coastal cities.
Abstract
Surface deformation in rapidly urbanizing coastal cities is often shaped by the interplay between hydrogeological setting and development disturbance, yet these controls remain insufficiently constrained in tropical coastal environments. Using 119 ascending Sentinel-1A scenes acquired between September 2020 and August 2025, we derived a high-density line-of-sight (LOS) deformation field over Haikou, China, through the combined use of PS-InSAR and DS-InSAR time-series analysis. The results show pronounced spatial heterogeneity, with negative LOS anomalies concentrated in reclaimed coastal sectors, port-adjacent zones, and Jiangdong New District, where cumulative LOS displacement locally approaches 90 mm. DS-InSAR increased the number of valid observations to 764,573, approximately 2.8 times that of PS-InSAR, and showed good internal consistency with collocated PS estimates (R2 = 0.8048). Positive LOS zones are present but are generally weaker and more spatially diffuse than the major negative anomalies, indicating that the near-zero city-wide mean partly reflects compensation between localized negative and positive signals. Spatial attribution analysis suggests that groundwater type, aquifer water-yield property, and geological zoning provide the main hydrogeological background associated with deformation, whereas human activity intensity, road density, and land-use intensity are associated with stronger negative deformation where hydrogeological conditions are susceptible. Because the dataset is limited to a single ascending viewing geometry, the reported deformation is interpreted as LOS motion rather than a fully resolved vertical subsidence field. These results support a cautiously framed interpretation in which coastal urban deformation in Haikou is hydrogeologically conditioned and development-amplified, providing a basis for targeted monitoring and risk-informed planning in newly developed coastal districts.
1. Introduction
Land subsidence and associated ground deformation have become increasingly recognized as critical geohazards constraining sustainable urban development, particularly in rapidly expanding coastal cities where land reclamation, groundwater extraction, and infrastructure loading co-occur and may jointly amplify deformation risk. Global syntheses indicate that subsidence is not an isolated anomaly but a widespread hazard that exacerbates flood exposure and damages critical assets through differential settlement and long-term elevation loss [1]. In coastal settings, subsidence contributes directly to relative sea-level rise, compounding storm-surge and tidal inundation risks [2,3,4]. This coupling is especially acute in deltaic and estuarine environments, where sediment starvation and anthropogenic loading can cause land-surface lowering at rates comparable to or exceeding climate-induced sea-level rise [5]. Satellite observations further suggest that the spatial extent of flood vulnerability has expanded significantly in recent decades, underscoring the societal relevance of centimeter-scale vertical motion at regional to continental scales [6]. Consequently, coastal cities require not only continuous deformation monitoring but also the ability to identify geospatial explanatory variables to inform land-use planning and infrastructure mitigation strategies [7].
From a mechanistic perspective, land subsidence is classically attributed to the consolidation of compressible deposits and to reductions in pore pressure, often triggered by fluid withdrawal [8]. However, modern coastal subsidence regimes are seldom controlled by a single process. Instead, they emerge from a complex interplay among hydrogeological constraints, land-use transitions, engineered ground modifications, and time-dependent consolidation under evolving urban loads. The New Orleans case illustrates how subsidence and flooding can interact nonlinearly in highly engineered coastal settings, producing compounded hazards even when individual drivers are moderate in isolation [9]. These complexities necessitate monitoring frameworks that resolve localized deformation gradients while maintaining continuity across heterogeneous surfaces.
Conventional geodetic techniques such as leveling and GNSS offer high precision but suffer from limited spatial coverage, high deployment costs, and challenges in long-term maintenance for urban-scale surveillance. Interferometric synthetic aperture radar (InSAR) offers a scalable alternative, delivering spatially continuous deformation fields at the meter-to-tens-of-meter resolution with revisit frequencies compatible with urban dynamics. Crucially, InSAR error sources can be explicitly modeled and constrained through time-series formulations [10]. Permanent scatterer (PS) InSAR enables millimeter-level displacement tracking over radar-bright targets [11], and has been widely validated in tectonic and volcanic settings [12]. Complementary to this, small-baseline approaches extend InSAR applicability by limiting temporal and perpendicular baselines to reduce decorrelation and phase-unwrapping instability, thereby improving reliability in more complex terrain [13].
Despite these advances, applying time-series InSAR in rapidly changing coastal cities remains challenging. First, classical PS-InSAR assumes the presence of temporally stable reflectors, which may not exist in reclaimed districts, vegetated zones, or mixed land-cover mosaics. These low-coherence settings limit the spatial completeness of deformation maps. Second, accurate deformation inference at the urban scale requires robust mitigation of orbital ramps, atmospheric delays, and residual topographic errors, which can alias into long-wavelength trends if not carefully addressed [14,15]. Third, the objective of deformation monitoring has shifted from static “mapping” to dynamic “attribution”: decision-makers increasingly demand not just LOS deformation rates, but quantitative identification of associated explanatory factors and their interactions to inform spatial planning, hazard mitigation, and infrastructure governance.
Recent methodological developments have addressed these challenges by integrating distributed scatterer (DS) analysis and advanced phase-linking strategies. Nonlinear phase linking across statistically homogeneous pixels has proven effective in recovering coherent deformation signals in low-coherence or spatially textured urban surfaces, thereby increasing measurement density beyond classical PS targets [16]. For Sentinel-1 TOPS acquisitions, precise co-registration is critical; dedicated stack co-registration techniques are necessary to preserve phase fidelity in long time series [17]. Moreover, mature processing pipelines and user-friendly software ecosystems have enabled systematic InSAR analysis over urban regions using multi-year data. Improvements in atmospheric and ionospheric correction—such as filtering of phase screens and burst-wise delay artifacts—also enhance the reliability of long-term deformation trends [18,19]. These advances support a practical conclusion: PS and DS techniques are not substitutes but complementary sampling regimes whose integration enhances both precision and spatial continuity in complex coastal environments.
Monitoring, however, is only one side of the challenge. Coastal land subsidence often arises from multiple coupled factors—groundwater withdrawal, fill heterogeneity, lithological compressibility—resulting in strong spatial heterogeneity that cannot be explained by globally linear models. The Mekong Delta provides a clear example: groundwater extraction drives widespread subsidence and elevates sea-level rise risks across large regions [20]. Similarly, studies in Bangkok and Houston show that subsidence often aligns with hydrogeological gradients and urban development corridors, suggesting a multi-factor control structure with varying importance across spatial scales [21,22,23,24]. Globally, both climate extremes and anthropogenic activities jointly shape exposure, reinforcing the need to quantify not only main effects but also interaction-driven amplification [25]. Furthermore, the proliferation of InSAR products demands careful reference-point selection, uncertainty assessment, and interpretative discipline to avoid over-interpretation in planning and policy contexts [26,27,28,29,30].
In this context, factor-detection frameworks targeting spatial stratified heterogeneity offer a promising avenue. Traditional regression-based models often assume linearity and struggle to capture heterogeneous interactions across spatial units. GeoDetector provides a statistically grounded alternative by assessing whether the spatial partitioning of a given factor aligns with the variance structure of the response variable [31]. The q-statistic formalizes explanatory power without assuming linearity and enables interaction detection through stratified combinations [32,33]. In parallel, the broader geospatial modeling community increasingly emphasizes interpretability, as evidenced by model-agnostic techniques such as LIME and game-theoretic approaches like SHAP, which aim to replace black-box prediction with decision-relevant explanation [34,35].
Against this background, Haikou provides a representative tropical coastal setting for examining a hydrogeological-conditioning and development-amplification pattern of urban surface deformation. In this study, 119 ascending Sentinel-1A scenes acquired between September 2020 and August 2025 are used to derive a high-density line-of-sight (LOS) deformation field through complementary PS-InSAR and DS-InSAR time-series analysis. Recognizing the limitation of single-geometry InSAR observations, we do not directly interpret the retrieved deformation field as fully resolved vertical subsidence; instead, we analyze negative and positive LOS deformation domains and interpret subsidence-dominated hotspots only where supported by hydrogeological and development evidence. A spatial attribution framework is then used to evaluate the explanatory power and interactions of groundwater type, aquifer water-yield property, geological zoning, and urban-development proxies. The objectives are to: (1) map the spatiotemporal evolution of urban surface deformation in Haikou; (2) compare the spatial completeness and consistency of PS- and DS-InSAR observations in a complex coastal urban environment; and (3) assess how hydrogeological background and urban development are associated with the observed deformation heterogeneity.
2. Study Area and Data Sources
2.1. Study Area Overview
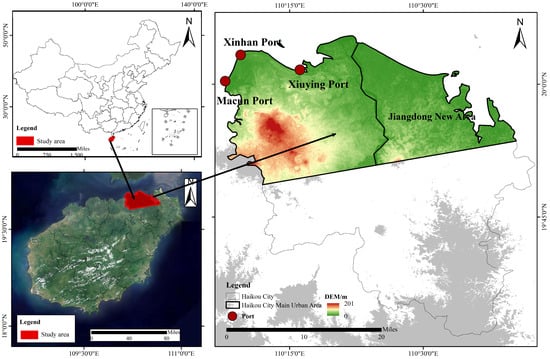
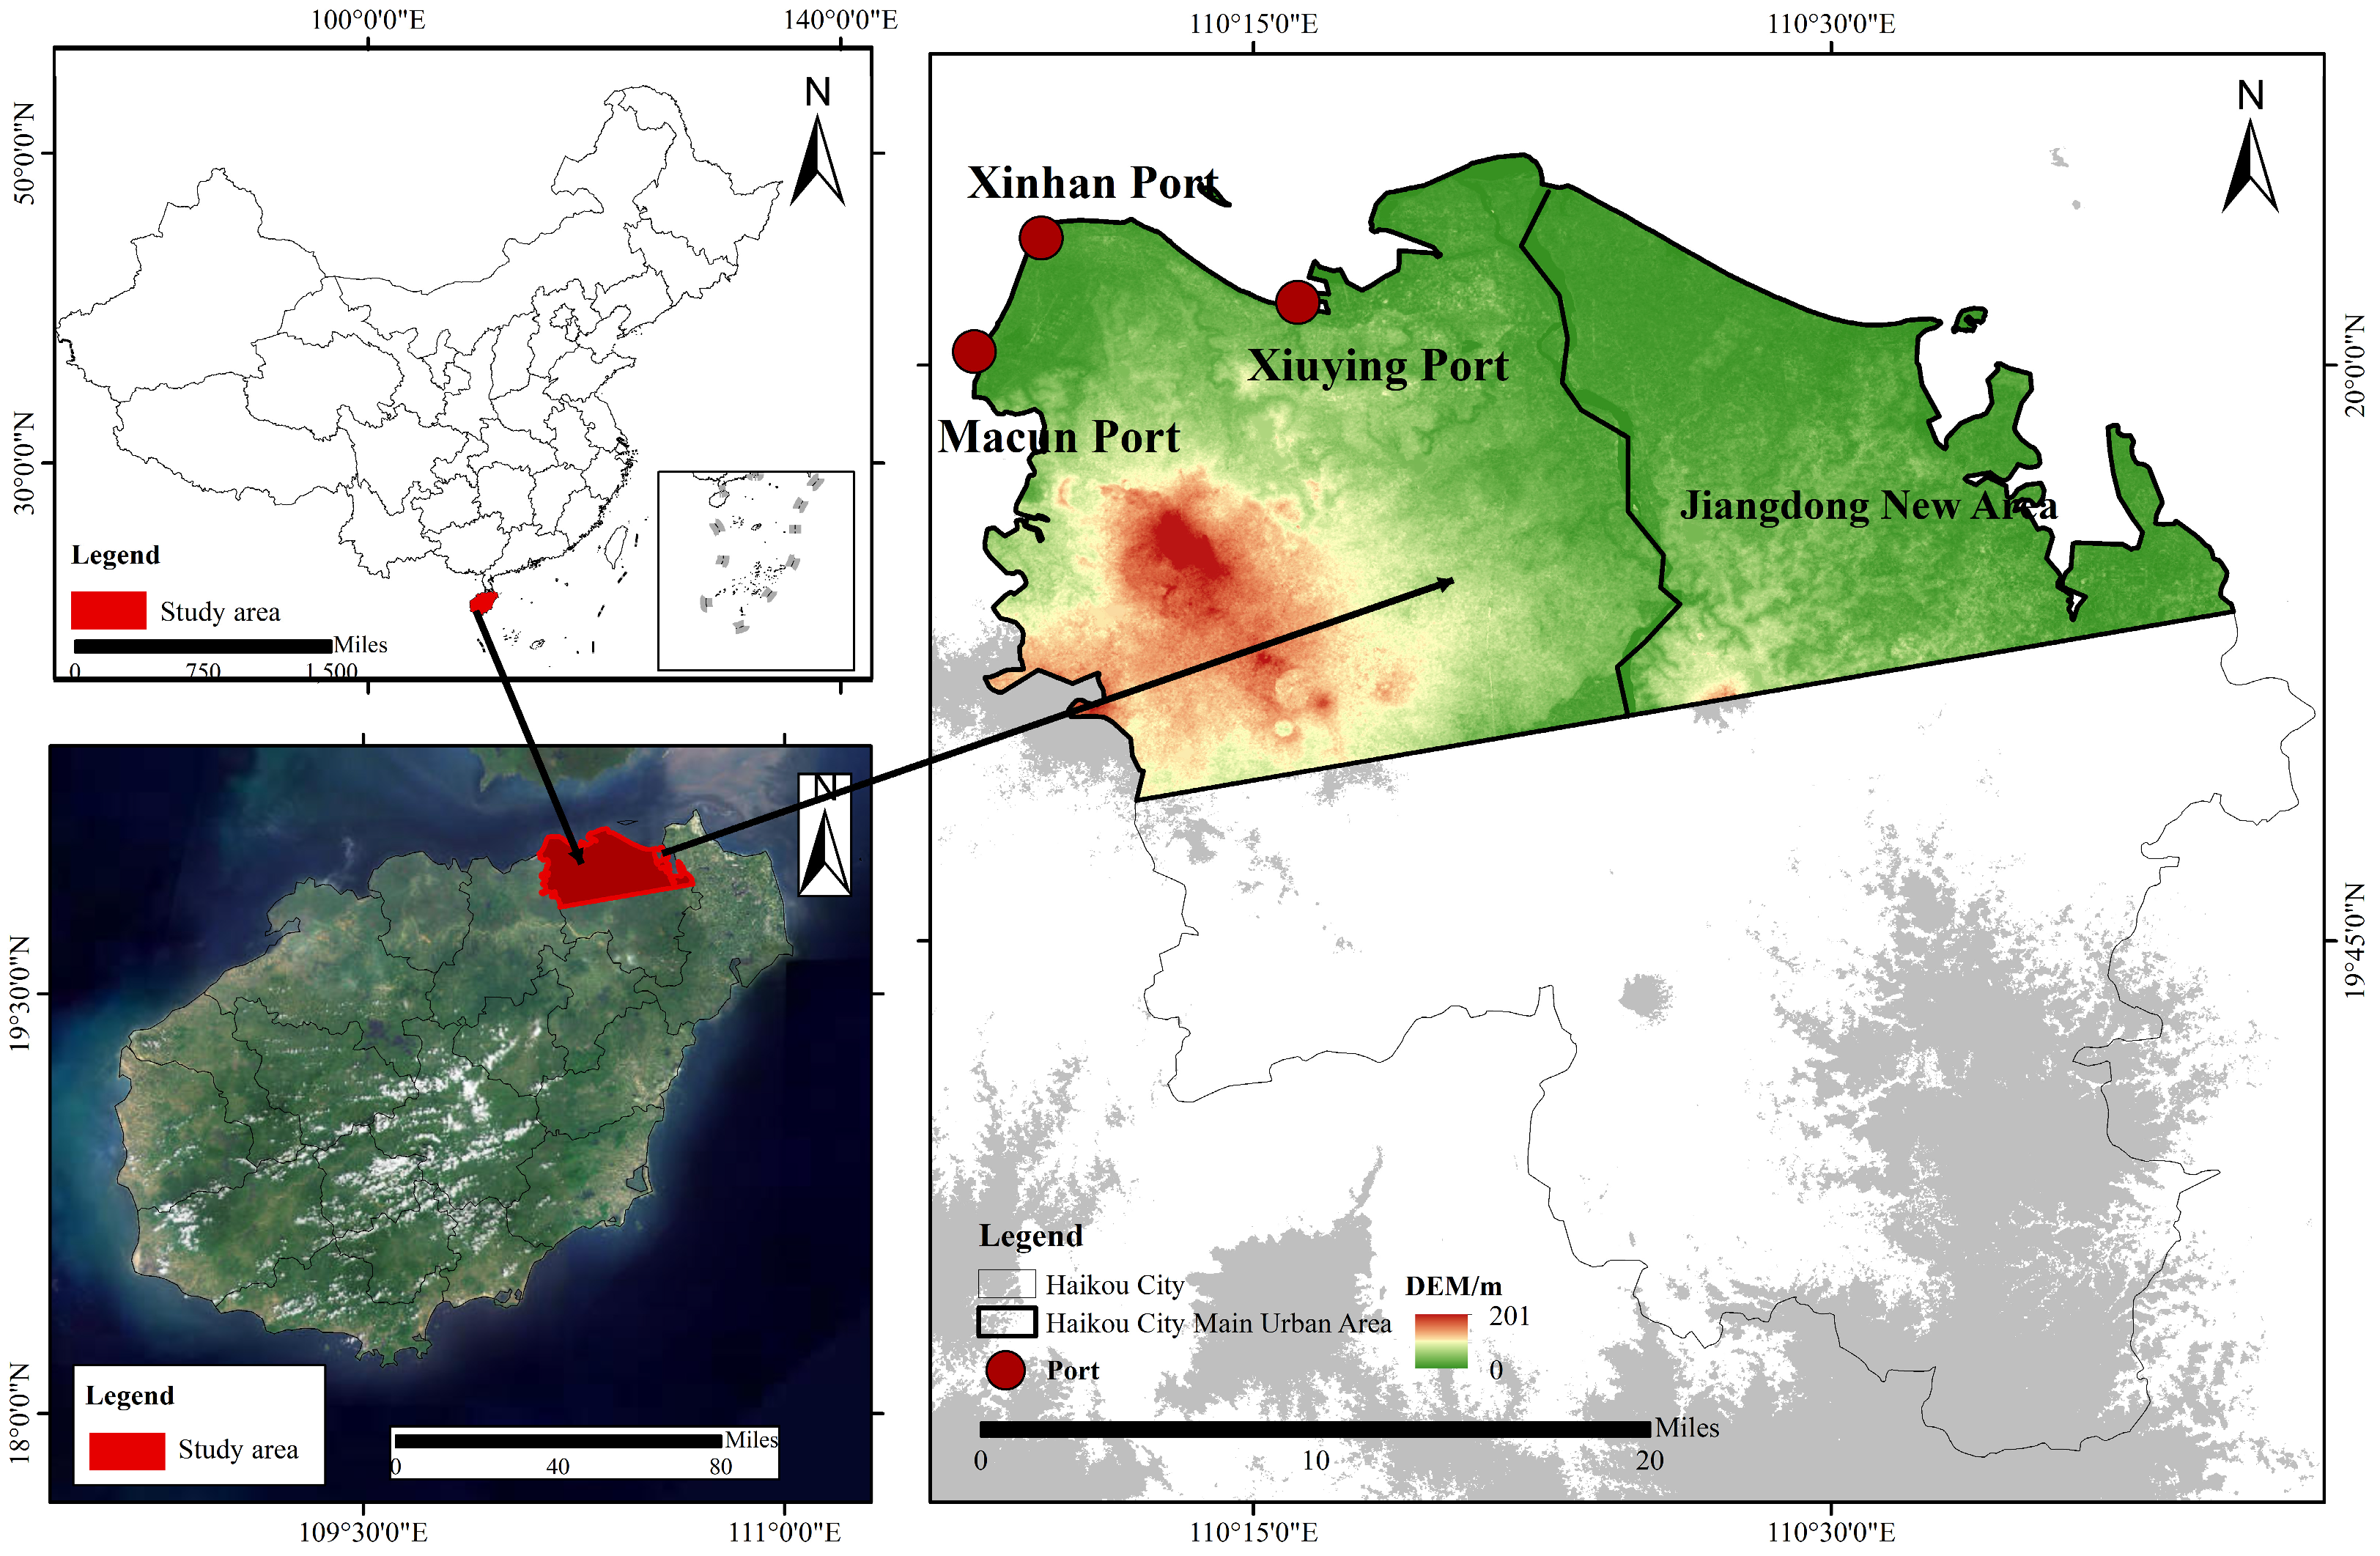
The study area encompasses the built-up zone and its continuous expansion corridor within the urban core of Haikou (see Figure 1), located in the northern part of Hainan Island near the estuary of the Nandu River and facing the Qiongzhou Strait to the north. Geographically, Haikou spans approximately from 110°10′E to 110°41′E and from 19°32′N to 20°05′N, with the urban core primarily situated in the northern coastal plains of this range. The area represents a typical coastal–estuarine composite geomorphic unit characteristic of rapidly developing waterfront cities.
Figure 1.
Location of the study area.
The topography is generally flat and dominated by coastal alluvial and marine-depositional plains, with localized micro-relief induced by volcanic platforms and low residual hills. Surface runoff and drainage are jointly shaped by riverine and coastal processes, with the Nandu River and its tributaries traversing the city’s periphery. Tidal backwater effects coupled with episodic storm runoff result in highly seasonal and event-driven hydrological dynamics, particularly near the shoreline.
Hydrogeologically, the urban core is underlain by widespread Quaternary unconsolidated sediments. Groundwater occurs mainly as phreatic and confined aquifers, whose distribution and yield characteristics vary spatially due to the interplay between saline–freshwater mixing in coastal zones, estuarine recharge/discharge processes, and lithological heterogeneity across stratigraphic units. These conditions establish a differentiated hydrological framework that directly informs the design of deformation monitoring strategies and the construction of geospatial explanatory variables.
2.2. Data Sources
This study utilizes a total of 119 ascending-orbit Sentinel-1A C-band SLC images acquired between September 2020 and August 2025 as the primary dataset for deformation monitoring. The images are collected in Interferometric Wide Swath (IW) mode with VV polarization, and spatial resolutions of approximately 5 m in the range direction and 20 m in the azimuth direction. Ancillary datasets include the 30-m resolution Shuttle Radar Topography Mission (SRTM) Digital Elevation Model (DEM) and precise orbit files, which are used for orbit correction, removal of topographic phase, and geocoding during the InSAR pre-processing.
To support spatial attribution of deformation patterns, nine spatial explanatory factors were constructed based on OpenStreetMap (OSM) and other open-access data sources: groundwater type, aquifer water-yield property, geological zoning, human activity intensity, road network density, land-use intensity, distance to water bodies, distance to railways, and elevation. Roadways, railways, and hydrological features were extracted from vector layers and converted into raster indicators via kernel density estimation or Euclidean distance transformation. Elevation data were derived from the SRTM DEM, while thematic attributes such as groundwater type, aquifer characteristics, and geological classification were rasterized into a unified grid structure.
All factor layers were projected into a common coordinate reference system, clipped to the study area boundary, and resampled to a consistent spatial resolution. Each variable was then stratified through discretization procedures to serve as input for the GeoDetector-based spatial attribution model. A detailed summary of data sources and processing workflows is provided in Table 1.
Table 1.
Summary of data sources.
3. Methods
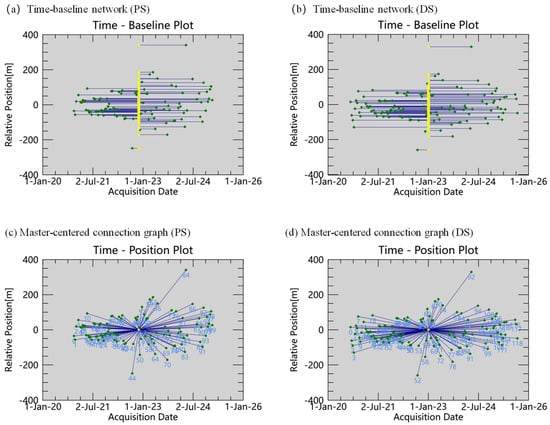
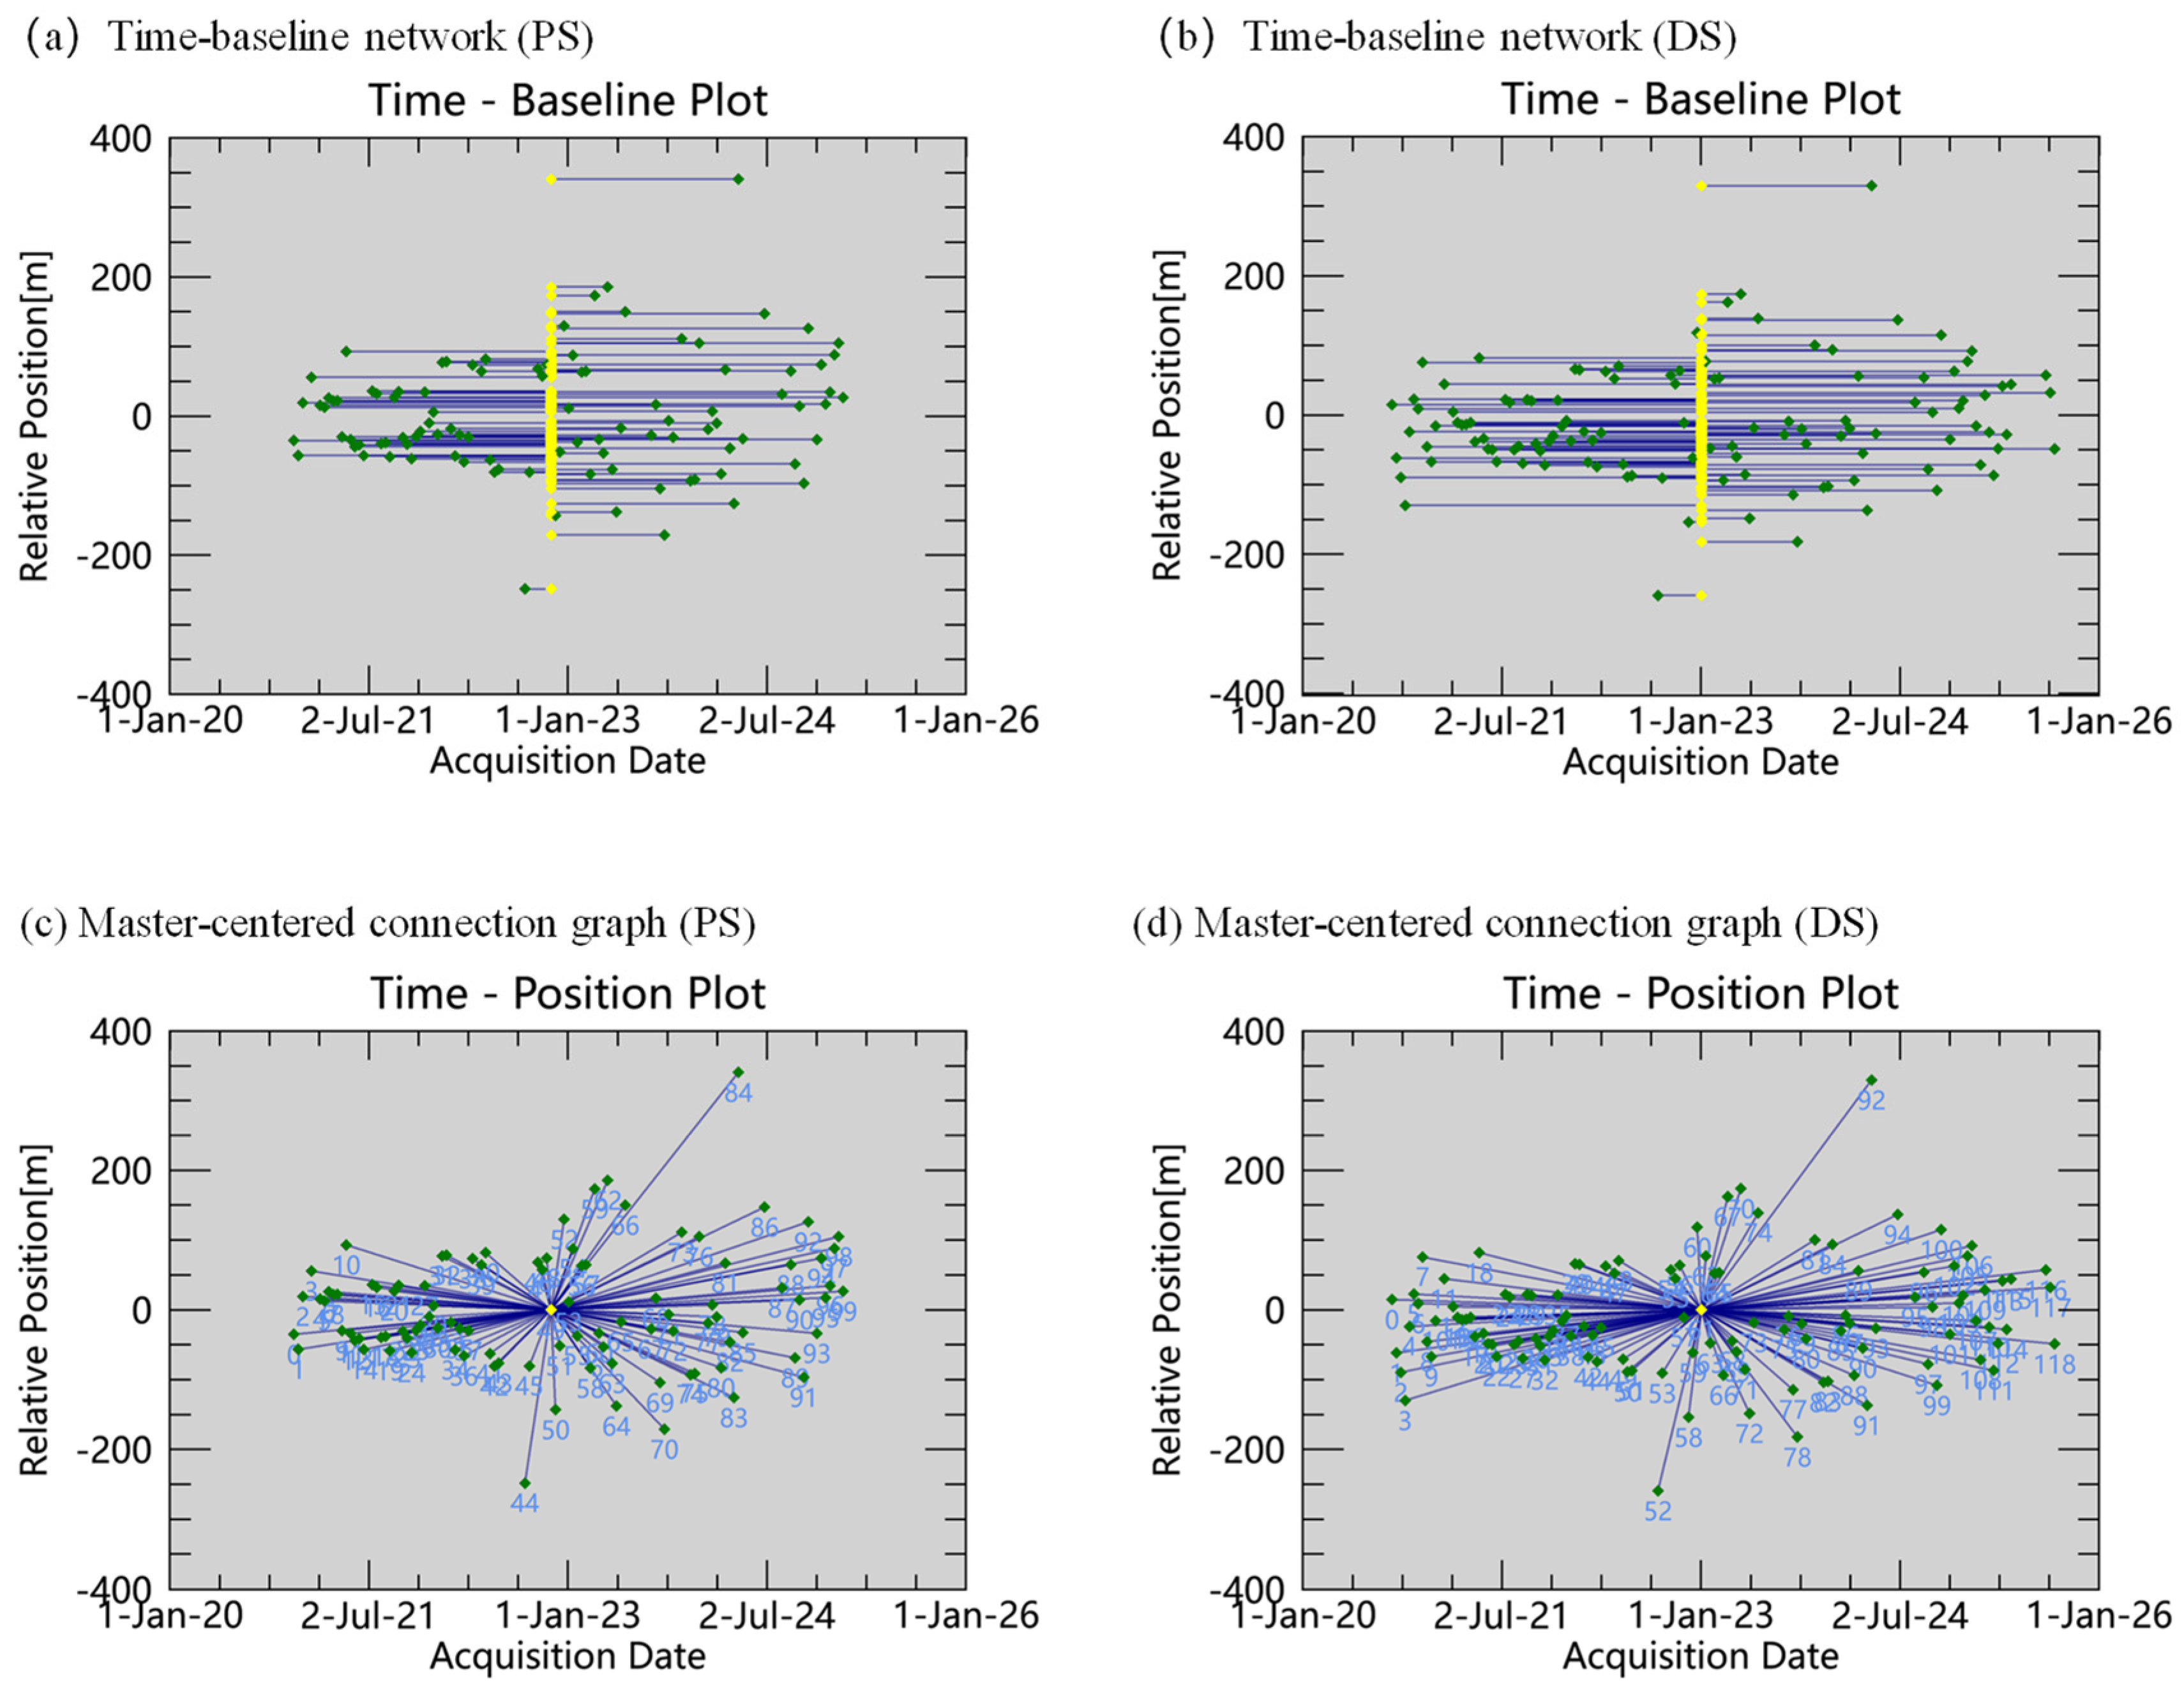
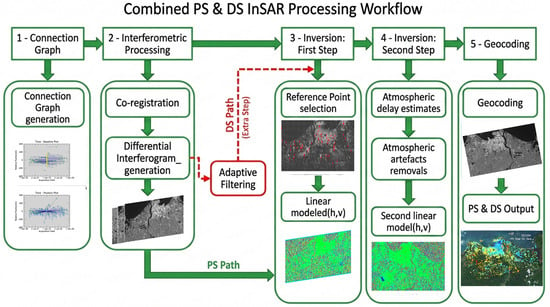
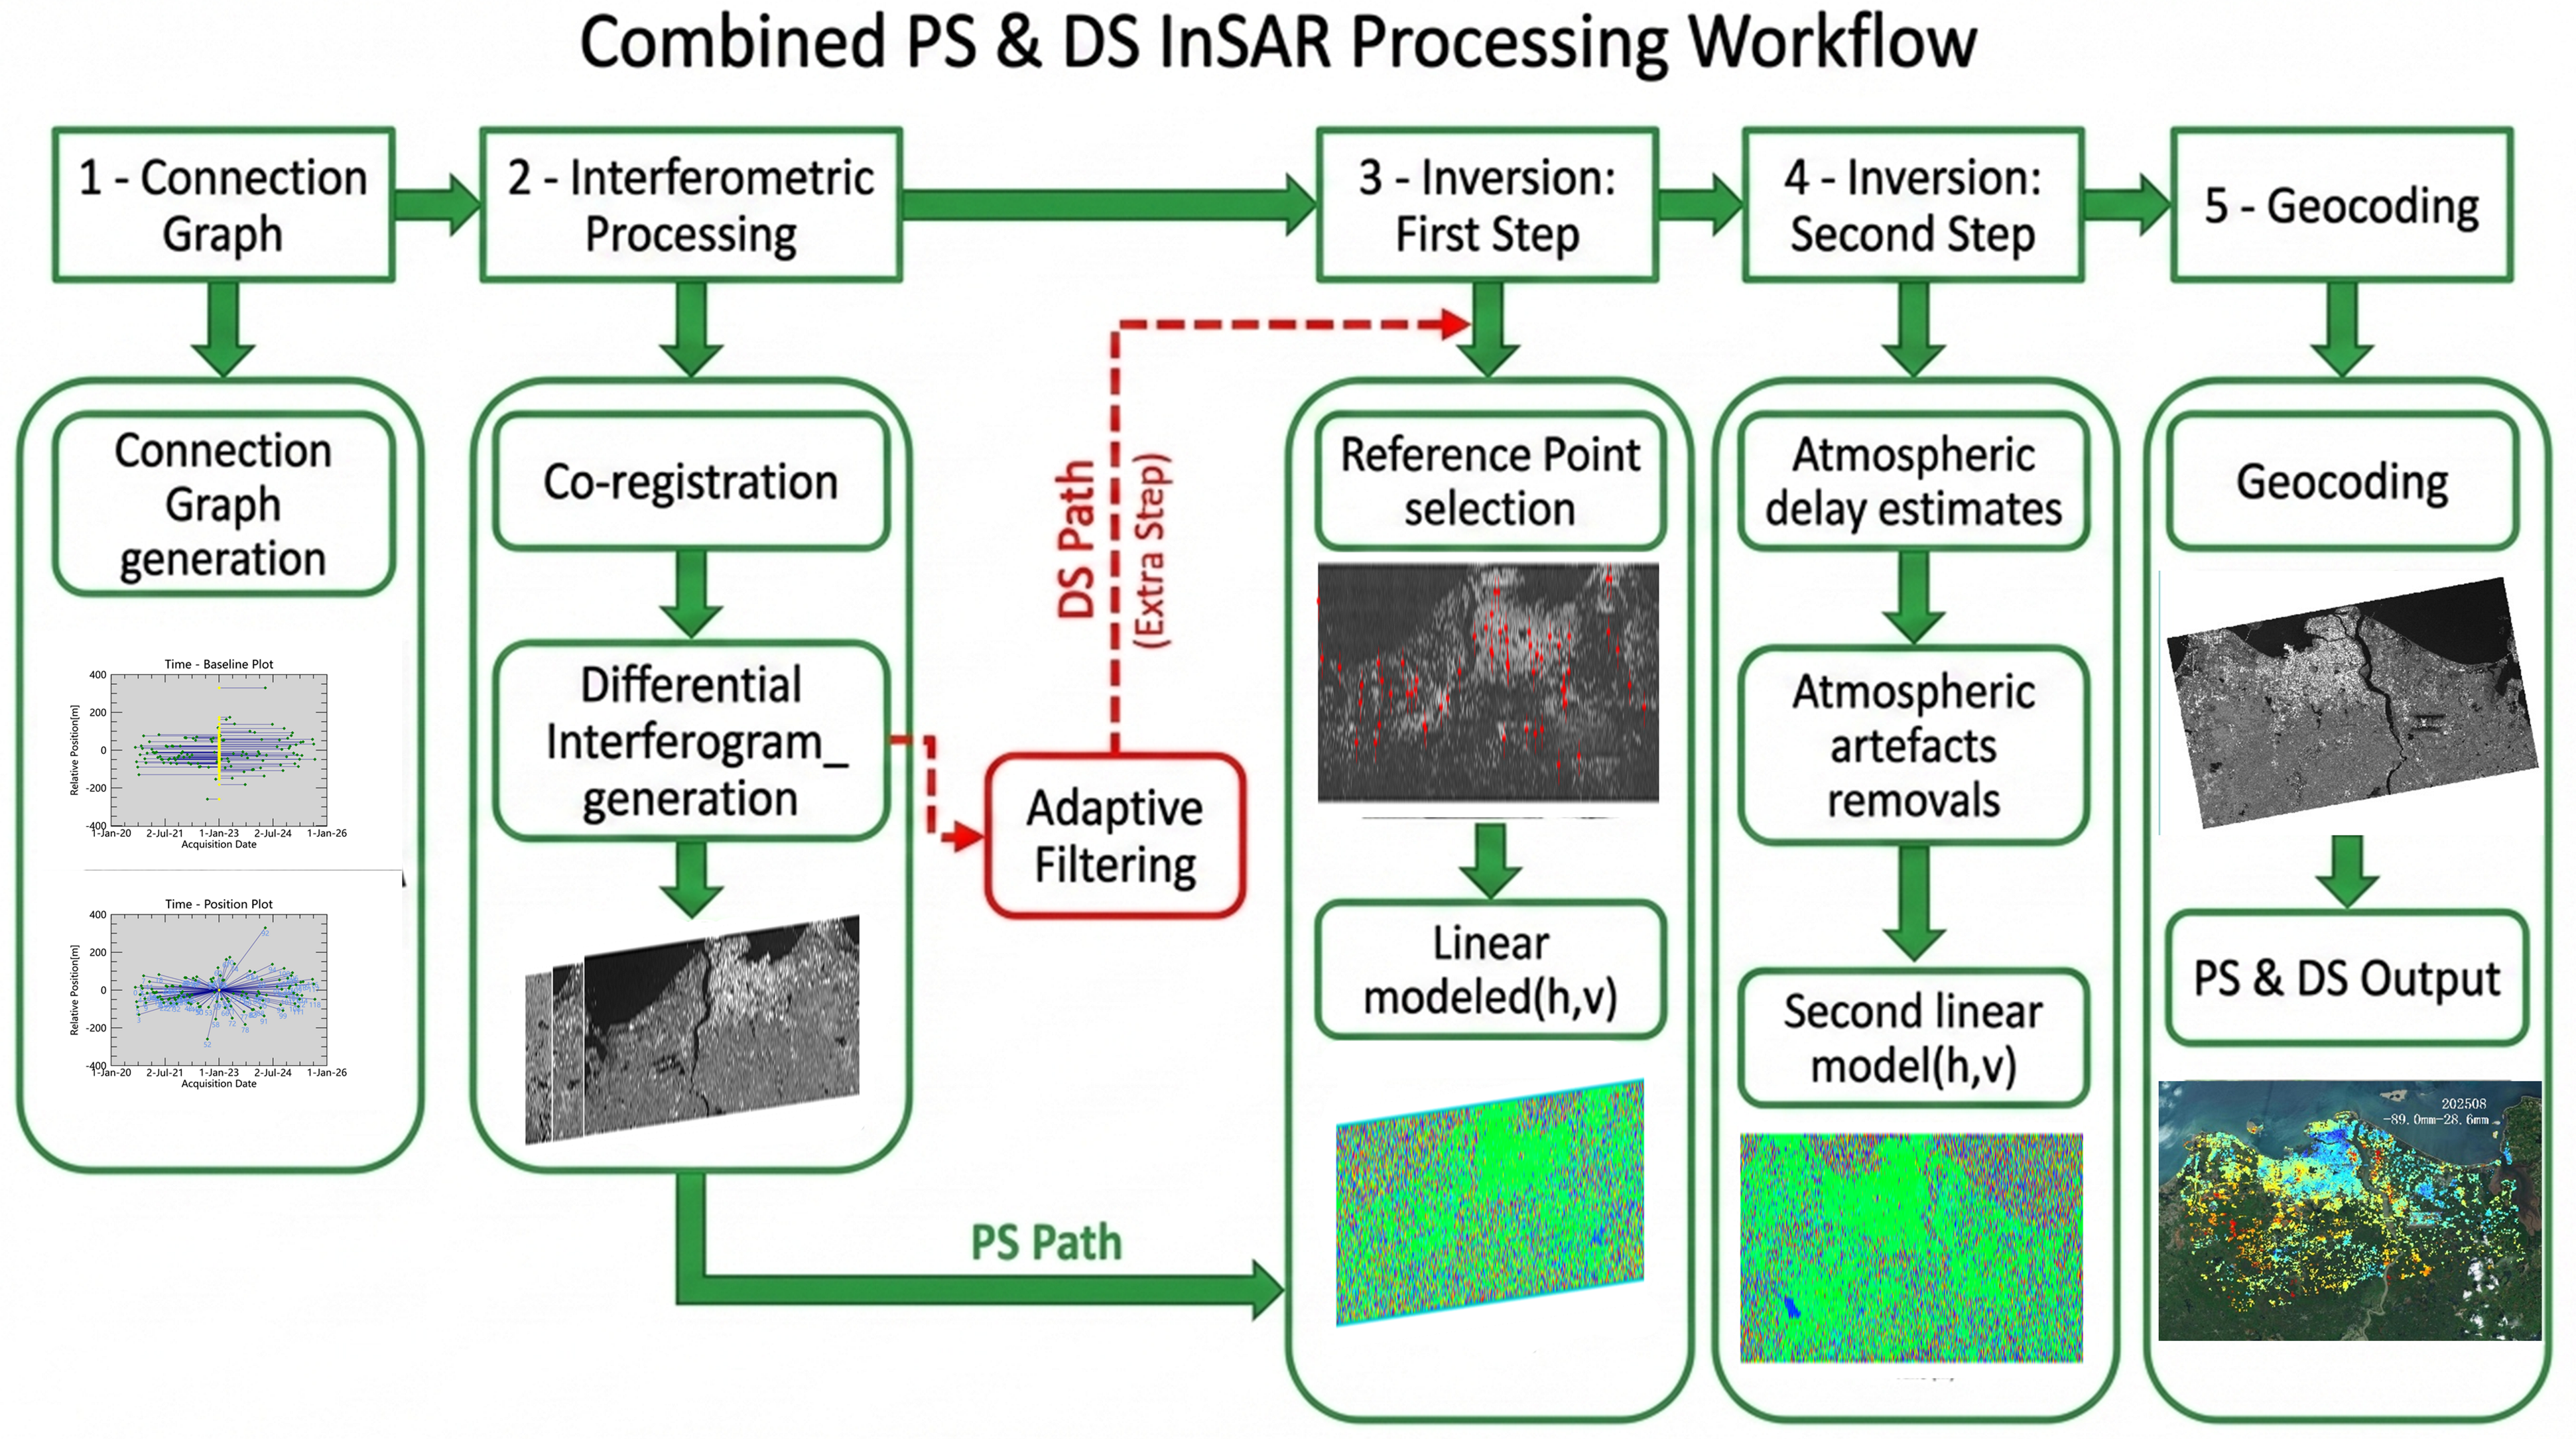
To characterize surface deformation in Haikou, we processed 119 ascending-track Sentinel-1A C-band SLC acquisitions acquired between September 2020 and August 2025 using a time-series InSAR framework. All deformation estimates reported in this study are line-of-sight (LOS) measurements derived from a single ascending viewing geometry. Therefore, the retrieved deformation field cannot be decomposed into independent vertical and horizontal components. Under the sign convention adopted in this study, negative LOS values represent negative deformation anomalies in the radar viewing direction, while positive values represent positive LOS anomalies. Accordingly, the results are interpreted primarily as LOS surface deformation. The term “subsidence-dominated deformation” is used only for persistent negative LOS anomalies where the local geomorphic, hydrogeological, and urban-development context supports a predominantly downward displacement process. The temporal-perpendicular baseline distributions and master-centered interferometric networks are shown in Figure 2. The time-series InSAR workflow includes image preprocessing and co-registration, interferometric network construction, differential interferometry, PS/DS selection and phase optimization, time-series inversion with error correction, and final geocoding and product generation (Figure 3). Relevant data inputs are listed in Table 1.
Figure 2.
Temporal-perpendicular baseline distribution and single-master interferometric network of the Sentinel-1A stack. (a,b) Time-baseline networks for the PS- and DS-InSAR processing streams; (c,d) master-centered connection graphs for the PS- and DS-InSAR processing streams. Yellow markers denote master images, green markers denote slave acquisitions, and blue lines denote interferometric pairs. Numbers in panels (c,d) denote acquisition indices.
Figure 3.
Workflow of PS- and DS-InSAR time-series processing for LOS surface deformation mapping.
3.1. Key Parameter Configuration
To ensure the comparability between PS-InSAR and DS-InSAR outputs, consistent settings were applied for pre-processing steps, interferometric network structure, and quality control filters. The primary differences between the two methods stem from the scattering model—i.e., persistent scatterer identification versus distributed scatterer grouping and phase linking—as well as the subsequent phase estimation strategies. Key parameters influencing the stability of the results are configured as follows:
Interferometric network and baseline distribution. A total of 119 Sentinel-1A ascending IW-VV SLC acquisitions were used. The master image was acquired on 2 January 2023. All slave images were co-registered to the master, and a single-master (star) network was used to generate 118 interferograms. The temporal-perpendicular baseline distribution was inspected before time-series inversion. The master scene lies close to the temporal center of the observation period and within the central part of the relative perpendicular-baseline distribution, which helps reduce temporal and spatial decorrelation and produces a balanced interferometric network for the 2020–2025 stack.
Residual Height Range: −100 m to +500 m. This parameter is used to absorb residual topographic phase introduced by discrepancies between the DEM and actual surface elevations. Given the presence of high-rise structures in the study area—such as the Haikou Tower (Haikou City Center Building), which reaches approximately 428 m—the DEM may inadequately capture local vertical variations. Therefore, the residual height range was conservatively set from −100 m to +500 m to account for potential elevation differences and suppress related artifacts in the deformation inversion.
Atmospheric Phase Filtering: Low-pass = 1200 m, High-pass = 365 days. These parameters constrain the spatiotemporal filtering for Atmospheric Phase Screen (APS) correction. Identical settings were applied to both PS and DS processing streams to ensure consistent atmospheric error suppression.
Maximum LOS Deformation Velocity Range: −25 mm/y to +25 mm/y. This threshold bounds the search space for LOS velocity inversion and helps suppress anomalous or physically implausible estimates caused by phase-unwrapping errors or outlier points. The range is broad enough to accommodate the expected LOS deformation dynamics in the study area while maintaining inversion stability.
DS identification and filtering (SARscape 5.7). SHP window sizes were 7 px in azimuth and 41 px in range (ks. Win Az Size = 7; Win Rg Size = 41). This anisotropic window was selected to provide enough statistically homogeneous samples for DS phase linking while avoiding an excessively large neighborhood in the azimuth direction, where mixed urban land covers such as buildings, roads, vegetation, and water bodies may occur over short distances. PCA-based adaptive filtering was used to suppress phase noise, and low-quality distributed scatterer candidates were removed using DS thresholding (DS threshold = 20; Activate Filtering Batch Mode = True).
Product Temporal Coherence Threshold: 0.85. This value was used as a minimum output-quality threshold for retaining reliable PS and DS measurement points. It should not be confused with the mean temporal coherence reported in Table 2, which was calculated after quality filtering from all retained measurement points. Therefore, the threshold and the reported mean values refer to different statistical quantities: the former is a selection criterion, whereas the latter is a post-processing summary statistic.
Table 2.
Comparison of PS-InSAR and DS-InSAR LOS deformation results under identical processing settings.
3.2. InSAR Workflow
The InSAR time-series analysis in this study follows a five-step processing workflow.
Data Preprocessing and Precise Co-Registration. All SAR images were corrected using precise orbit files and cropped to the study area extent. Master and slave images were co-registered with sub-pixel accuracy, and TOPS burst alignment was applied to ensure spatial phase consistency across the time series. The SRTM DEM was used to remove topographic phase and to provide a geometric reference for geocoding.
Interferometric Network Construction and Differential Interferometry. A single-master (star) interferometric configuration was adopted using the acquisition on 2 January 2023 as the master scene. All slave images were co-registered to the master, and one interferogram was generated for each slave acquisition. Temporal and perpendicular baselines were inspected to characterize baseline dispersion and to screen extreme-baseline acquisitions when necessary. Differential interferograms were then formed after removing the flat-Earth phase and the topographic phase using the DEM, followed by spatial filtering to suppress phase noise. Coherence maps and amplitude stability indices were computed to support scatterer selection, phase unwrapping, and time-series inversion.
PS Pixel Selection and Phase Modeling (PS-InSAR). Persistent scatterer (PS) candidates were selected based on amplitude stability, primarily located on built-up areas with strong radar backscatter. A phase model was then constructed on the PS ensemble to estimate LOS deformation velocities and temporal evolution, including correction for atmospheric and orbital errors. Key parameters were configured consistently with those in Section 3.1.
DS Pixel Selection and Phase Linking Optimization (DS-InSAR). For areas with low coherence—such as vegetated zones, bare land, and reclaimed surfaces—statistical homogeneity was used to identify distributed scatterer (DS) groups. Phase linking and coherence-constrained optimization were performed within each homogeneous region to derive stable DS phase series for LOS deformation inversion. Low-quality pixels were removed using thresholding to retain only reliable DS measurements.
Time-Series Inversion, Reference Unification, and Product Generation. All valid PS and DS points were referenced to a relatively stable zone to ensure a consistent LOS deformation baseline. The reference area was selected from spatially continuous low-gradient sectors where both PS and DS results showed near-zero velocities and low local dispersion. Reference-area stability was then evaluated by point count, mean LOS velocity, standard deviation, and PS-DS velocity difference statistics. The LOS deformation time series was inverted to obtain mean LOS velocity fields and cumulative LOS displacement maps. Displacement-time profiles for selected key locations were also extracted. Final outputs were geocoded and visualized to support the interpretation of LOS deformation patterns and spatial attribution analysis.
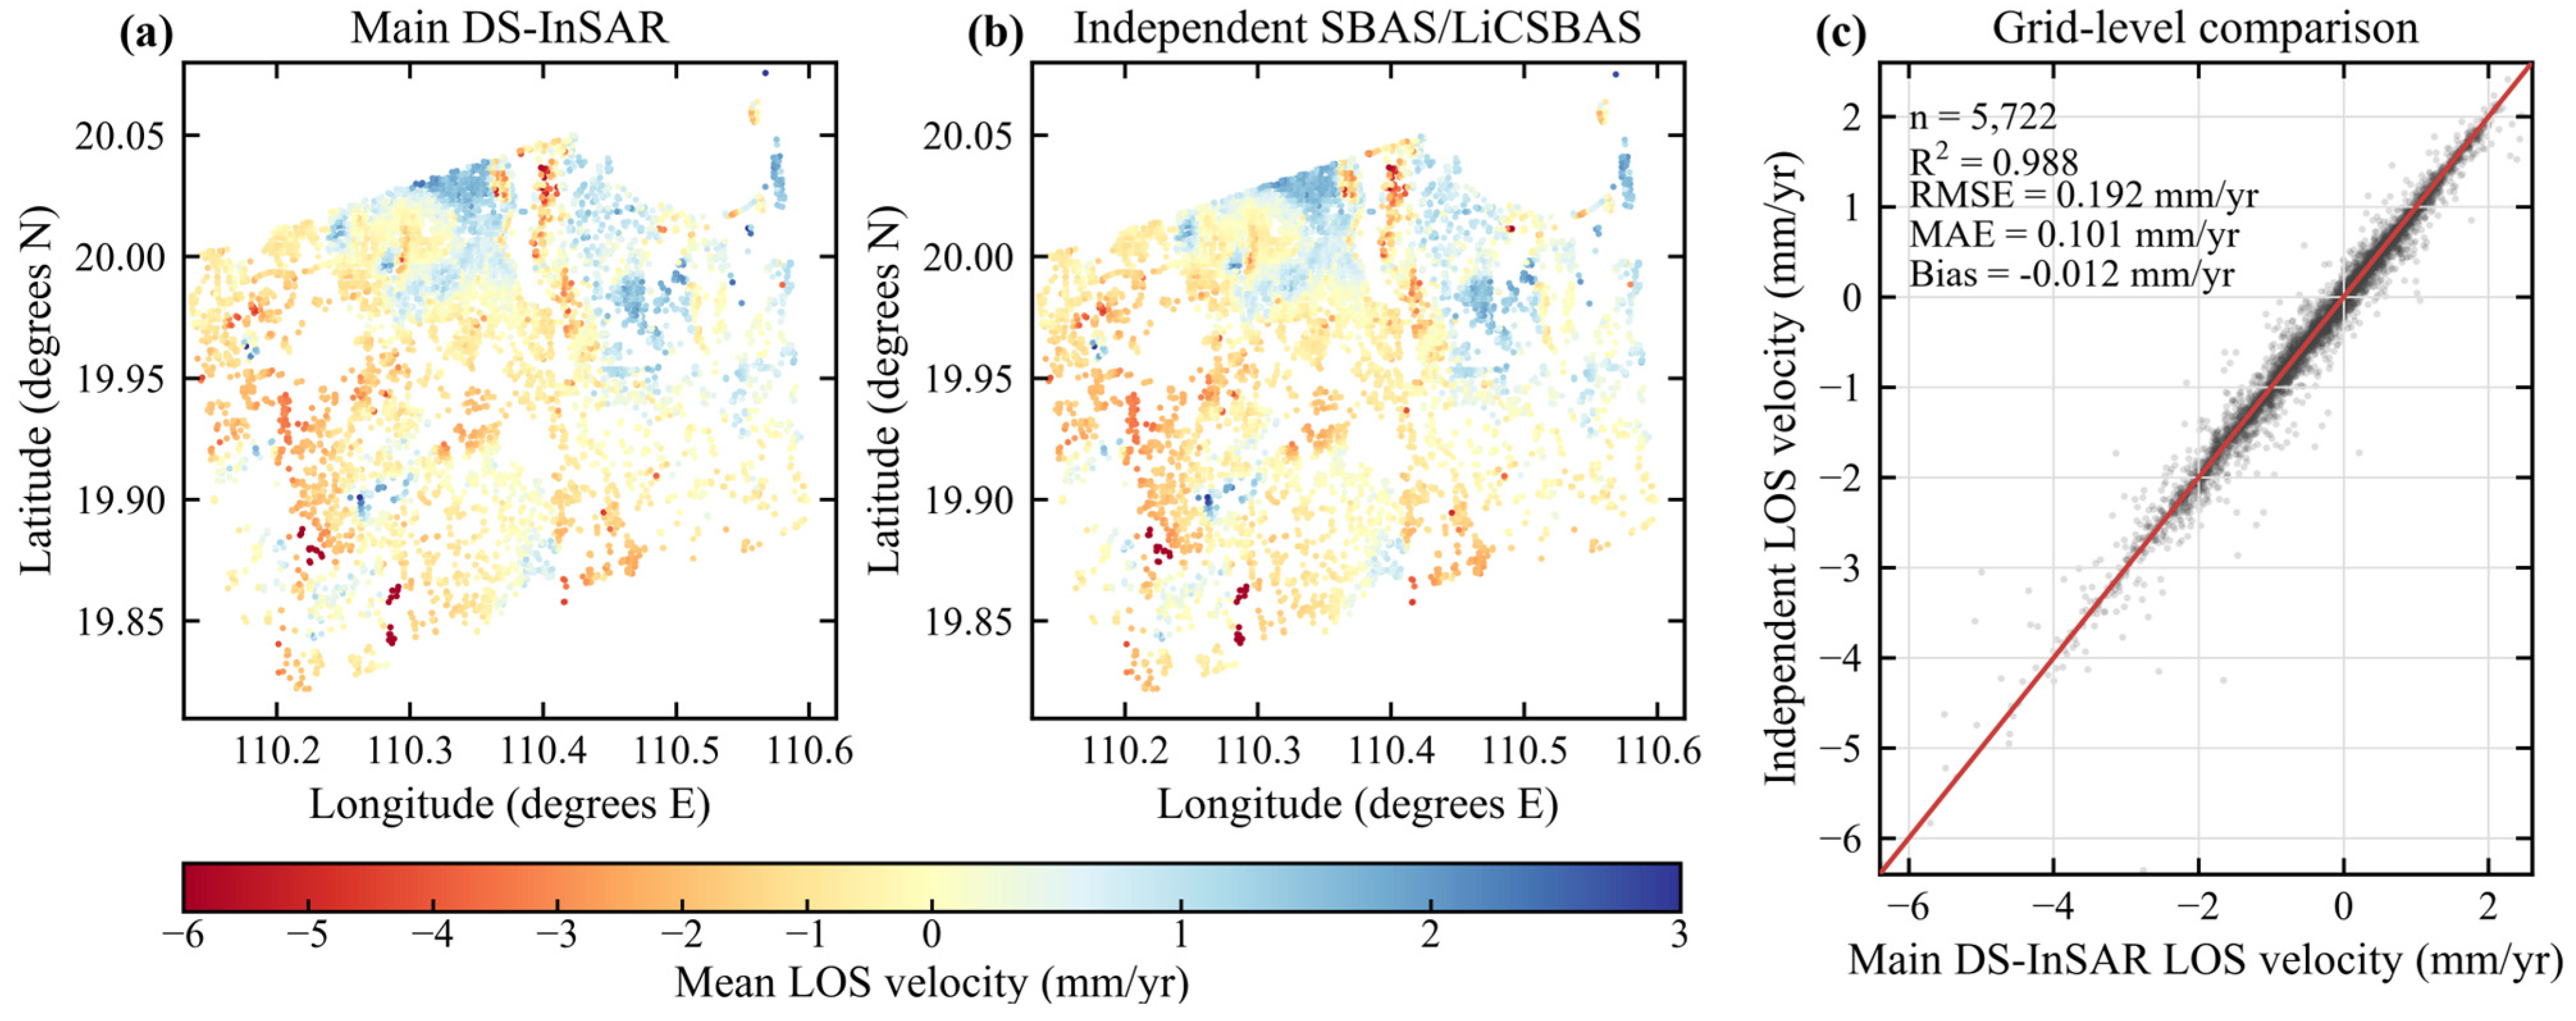
Independent processing-chain consistency check. Because independent GNSS, leveling, and descending-track InSAR observations were unavailable for Haikou during 2020–2025, an additional ascending-track SBAS/LiCSBAS processing-chain result was used to assess whether the main deformation pattern depends on the adopted PS/DS-InSAR processing stream. This comparison was designed as a processing-chain consistency check rather than as absolute external validation, because both datasets are derived from ascending Sentinel-1 observations. The independent point product contained 1,843,330 valid LOS velocity records after quality screening. To ensure spatial comparability, the independent product and the main PS/DS-InSAR products were aggregated to a 250 m grid, and only grid cells containing at least three valid points in both products were retained. Agreement was quantified using R2, RMSE, MAE, and mean bias between grid-averaged LOS velocities.
3.3. GeoDetector Workflow
To explore the spatial heterogeneity and associated explanatory factors of InSAR-derived LOS deformation in Haikou’s urban core, GeoDetector was employed to assess the spatial association between deformation patterns and multiple potential influencing factors. Based on the principle of spatial stratified heterogeneity, GeoDetector quantifies the explanatory power of each factor by comparing the variance within and between stratified layers. It further identifies the type of interaction effects among multiple factors. Spatial preprocessing steps—including rasterization, projection alignment, and resolution normalization—were conducted in ArcMap, and the statistical analysis was implemented using the GeoDetector software (http://geodetector.cn/, accessed on 30 July 2026). The procedure includes factor detection and interaction detection, as described below:
Dependent Variable Construction. The dependent variable is the mean annual LOS deformation velocity derived from the InSAR time series. Since the InSAR results are point-based, they were first converted into a regular grid using GIS tools to ensure spatial consistency. Each grid cell was assigned a consistent coordinate system, resolution, and spatial extent. The median LOS deformation velocity within each cell was used to represent local deformation while mitigating the influence of extreme values. Cells with insufficient valid InSAR points were excluded to maintain statistical stability.
Construction and Harmonization of Explanatory Factors. Nine candidate explanatory factors were considered: groundwater type, aquifer water yield, geological zone, human activity intensity, road network density, land-use intensity, distance to water bodies, distance to railways, and elevation. Road, railway, and waterbody features were derived from OSM and converted into raster layers via kernel density or Euclidean distance transformations. Elevation was extracted from the DEM. Categorical factors (e.g., geological or hydrogeological) were rasterized. All explanatory factor layers were resampled to match the dependent variable in projection, resolution, and extent, establishing a one-to-one correspondence at the pixel level for model input.
Variable Discretization. GeoDetector requires stratified discrete inputs. Categorical variables retained their original class labels. Continuous variables (e.g., density, distance, intensity, elevation) were discretized into six classes using the Jenks natural breaks method to optimize intra-class homogeneity and inter-class separation. Class distributions were checked to avoid sparsely populated bins. Where necessary, classification thresholds were adjusted to ensure statistical robustness and spatial interpretability.
Factor Detection and Interaction Analysis. Factor detection computes the explanatory power (q-statistic) of each factor on the spatial variation in LOS deformation. Higher q-values indicate stronger spatial explanatory capacity. Interaction detection involves combining two factors into stratified overlays and recalculating the q-value. By comparing the interaction q-value with individual factor q-values, the interaction type is identified, such as enhancement, weakening, or independence. This analysis supports the identification of synergistic or compound explanatory factors associated with LOS deformation.
4. Results
4.1. Spatial Pattern of InSAR-Derived LOS Surface Deformation
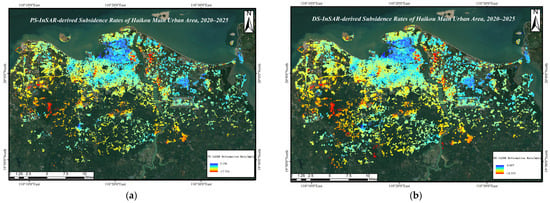
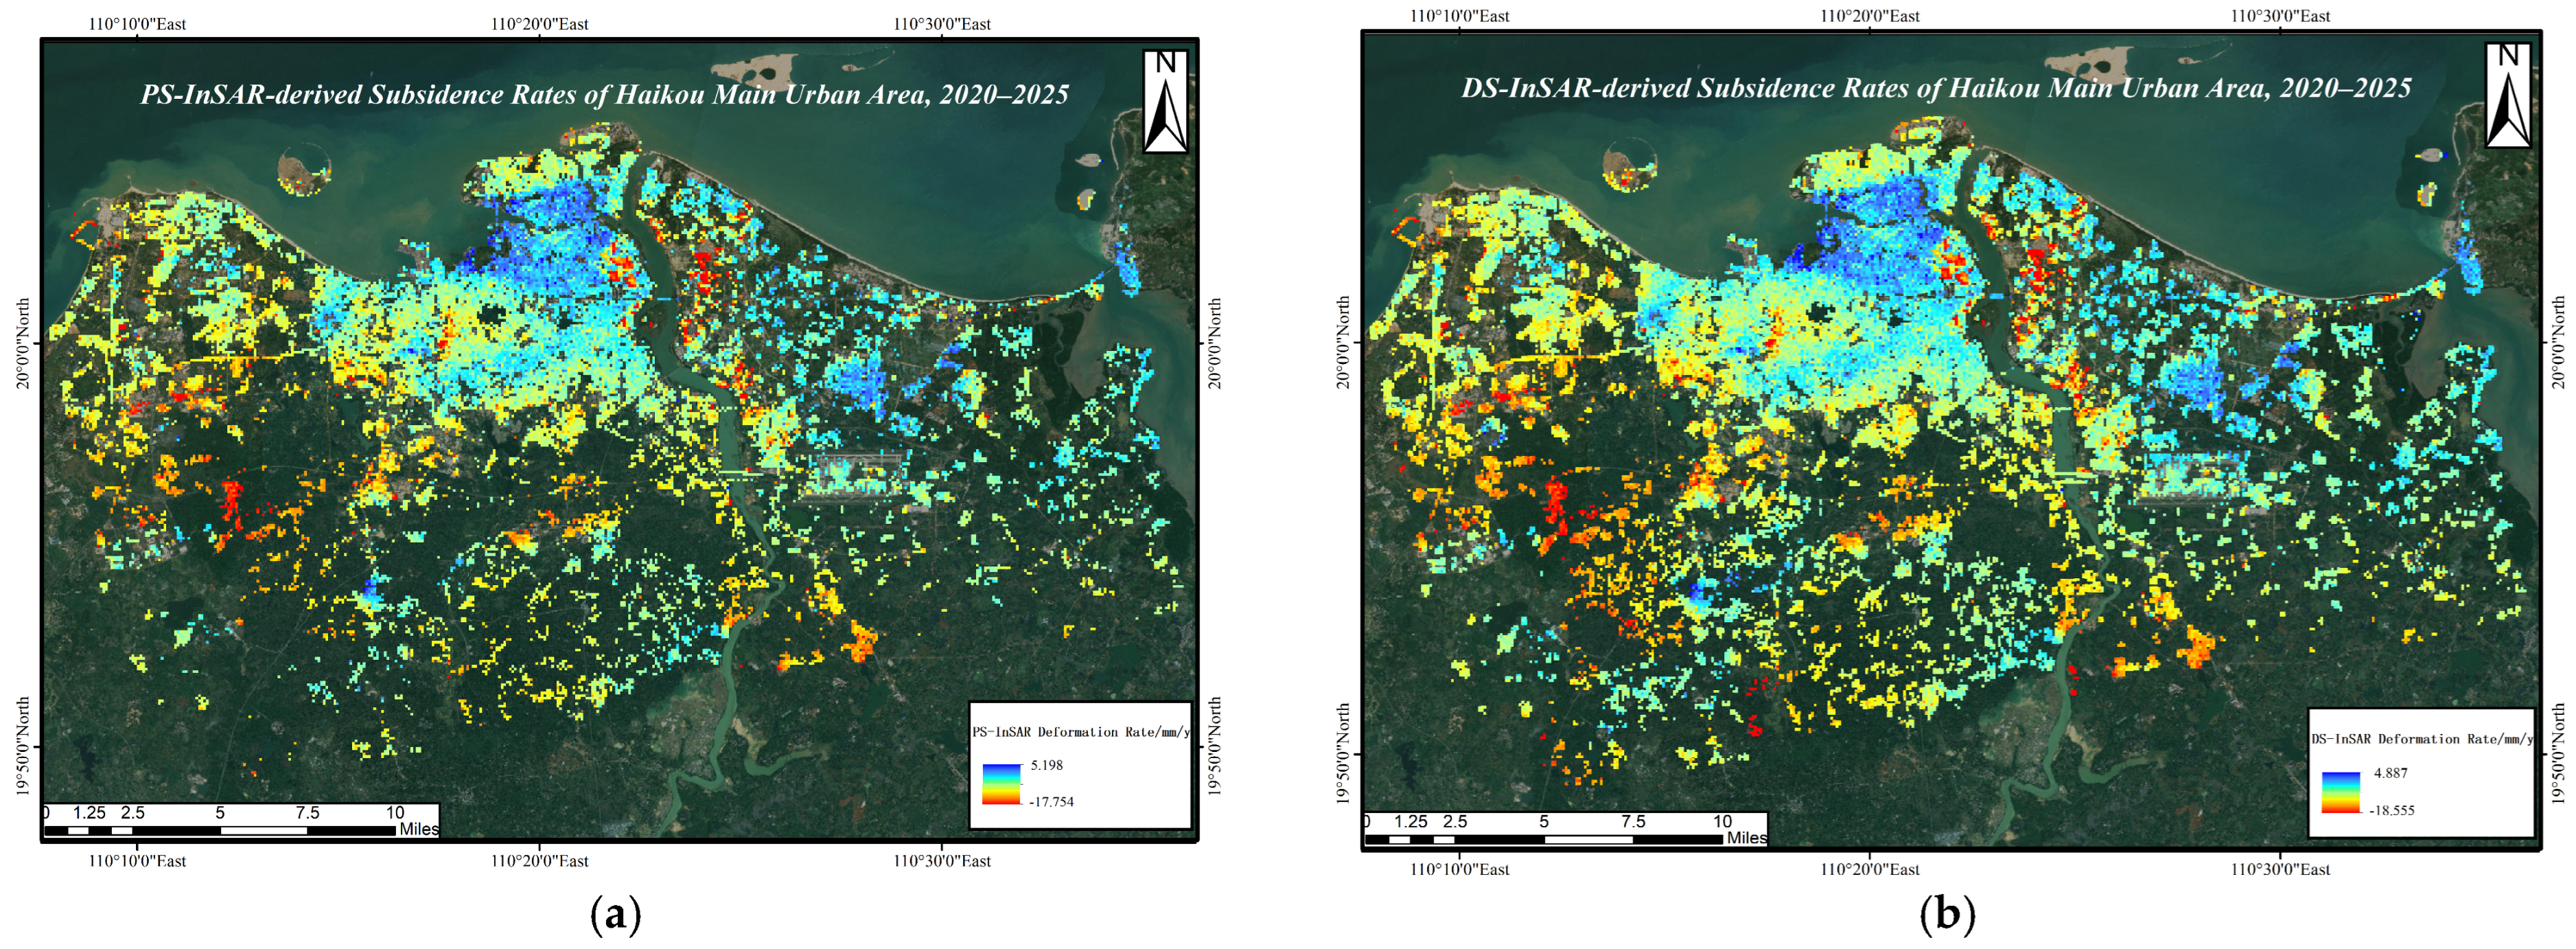
Based on Sentinel-1A time-series InSAR observations from September 2020 to August 2025, Haikou’s urban core exhibits spatially heterogeneous LOS surface deformation. Figure 4 presents the mean annual LOS deformation velocity fields derived from PS-InSAR and DS-InSAR (Figure 4a,b). Under the sign convention adopted in this study, negative values denote negative LOS deformation anomalies, whereas positive values denote positive LOS deformation anomalies. Because the results are derived from a single ascending viewing geometry, these LOS measurements are not directly interpreted as a fully resolved vertical displacement field. Apart from differences in scatterer selection and phase estimation strategies, the two approaches use the same SAR dataset, preprocessing workflow, atmospheric filtering strategy, reference framework, and quality-control criteria, allowing their spatial patterns to be compared consistently. Spatial gaps in the velocity maps mainly correspond to water bodies, vegetation-covered surfaces, rapidly changing construction areas, and other low-coherence sectors where reliable PS/DS measurement points could not be retained after quality screening; therefore, these blank areas reflect scatterer availability and masking criteria rather than confirmed absence of deformation.
Figure 4.
Mean annual LOS deformation velocity fields derived from time-series InSAR: (a) PS-InSAR; (b) DS-InSAR. Negative values denote negative LOS deformation anomalies, and positive values denote positive LOS deformation anomalies.
DS-InSAR yielded 764,573 valid measurement points, approximately 2.80 times the number obtained from PS-InSAR (272,876), indicating a substantial improvement in spatial sampling density under complex coastal urban surface conditions. The post-filtering mean temporal coherence was 0.890 for PS-InSAR and 0.871 for DS-InSAR. Therefore, the advantage of DS-InSAR in this study is not a higher mean coherence than PS-InSAR, but its ability to retain a much denser and more spatially continuous set of reliable distributed scatterers in reclaimed, mixed land-cover, and relatively low-coherence areas. The city-wide mean annual LOS velocities were −0.08 mm/yr for PS-InSAR and 0.06 mm/yr for DS-InSAR, both close to zero. These near-zero mean values should not be interpreted as evidence of negligible deformation; rather, they reflect compensation between localized negative LOS anomalies and weaker positive LOS signals, as well as the influence of reference-area selection. Therefore, the following interpretation emphasizes the spatial distribution, magnitude range, and persistence of deformation anomalies rather than the city-wide mean value alone.
Spatially, DS-InSAR provides a more continuous LOS deformation field than PS-InSAR, especially in reclaimed coastal sectors, mixed land-cover mosaics, and newly developed urban districts where point scatterers are less spatially complete. Pronounced negative LOS anomalies are mainly distributed in coastal reclaimed sectors, soft-deposit areas, and zones undergoing intensive urban construction. Given the geomorphic and development context of these areas, persistent negative LOS anomalies are interpreted as subsidence-dominated deformation only where supporting contextual evidence is available, rather than as automatically resolved vertical subsidence. The PS-InSAR result shows a more fragmented spatial pattern because valid points are mainly concentrated on buildings, paved surfaces, and exposed ground. Coverage gaps are more frequent in vegetated, reclaimed, or decorrelated surfaces, highlighting the complementary value of DS-InSAR for coastal urban deformation mapping.
Overall, both methods identify broadly consistent negative LOS deformation hotspots, primarily located in the southwestern urban core, port-adjacent areas, and coastal development zones. DS-InSAR improves spatial completeness in low-coherence regions and is well suited for delineating continuous deformation domains, whereas PS-InSAR provides stable time-series measurements over strongly coherent built-up targets. Their complementary characteristics improve the spatial integrity of the deformation field and provide a more reliable basis for subsequent spatial attribution analysis, although they do not replace independent ground validation of absolute deformation magnitude.
4.2. Positive LOS Deformation Zones and Their Possible Interpretations
In addition to the major negative LOS deformation hotspots, scattered positive LOS deformation zones are also observed in both PS-InSAR and DS-InSAR results. These positive signals generally exhibit smaller magnitudes than the negative anomalies, with maximum values of approximately 4.9 mm/y in the DS-InSAR result and 5.8 mm/y in the PS-InSAR result. Spatially, the positive LOS signals are more fragmented and less spatially coherent than the major negative deformation zones, and they do not form a continuous city-wide deformation belt. This pattern indicates that the positive LOS component is unlikely to represent a single regional uplift process. Instead, it may reflect a combination of localized hydrological rebound, residual atmospheric or orbital artifacts, reference-point effects, minor horizontal motion projected into the LOS direction, or local ground adjustment related to construction and drainage conditions.
Because the deformation field is derived from a single ascending Sentinel-1 geometry, positive LOS values cannot be interpreted straightforwardly as vertical uplift. In the adopted observation geometry, a positive LOS signal only indicates motion toward the satellite along the radar line of sight. Without descending-track observations or independent GNSS/leveling measurements, the vertical and horizontal contributions cannot be separated. Therefore, these zones are referred to as positive LOS deformation zones rather than uplift areas in this study. Their explicit consideration is nevertheless important, because they partly explain the near-zero mean LOS velocities of the PS- and DS-InSAR solutions and help avoid an overemphasis on negative deformation alone.
4.3. Temporal Evolution of Negative LOS Deformation Hotspots
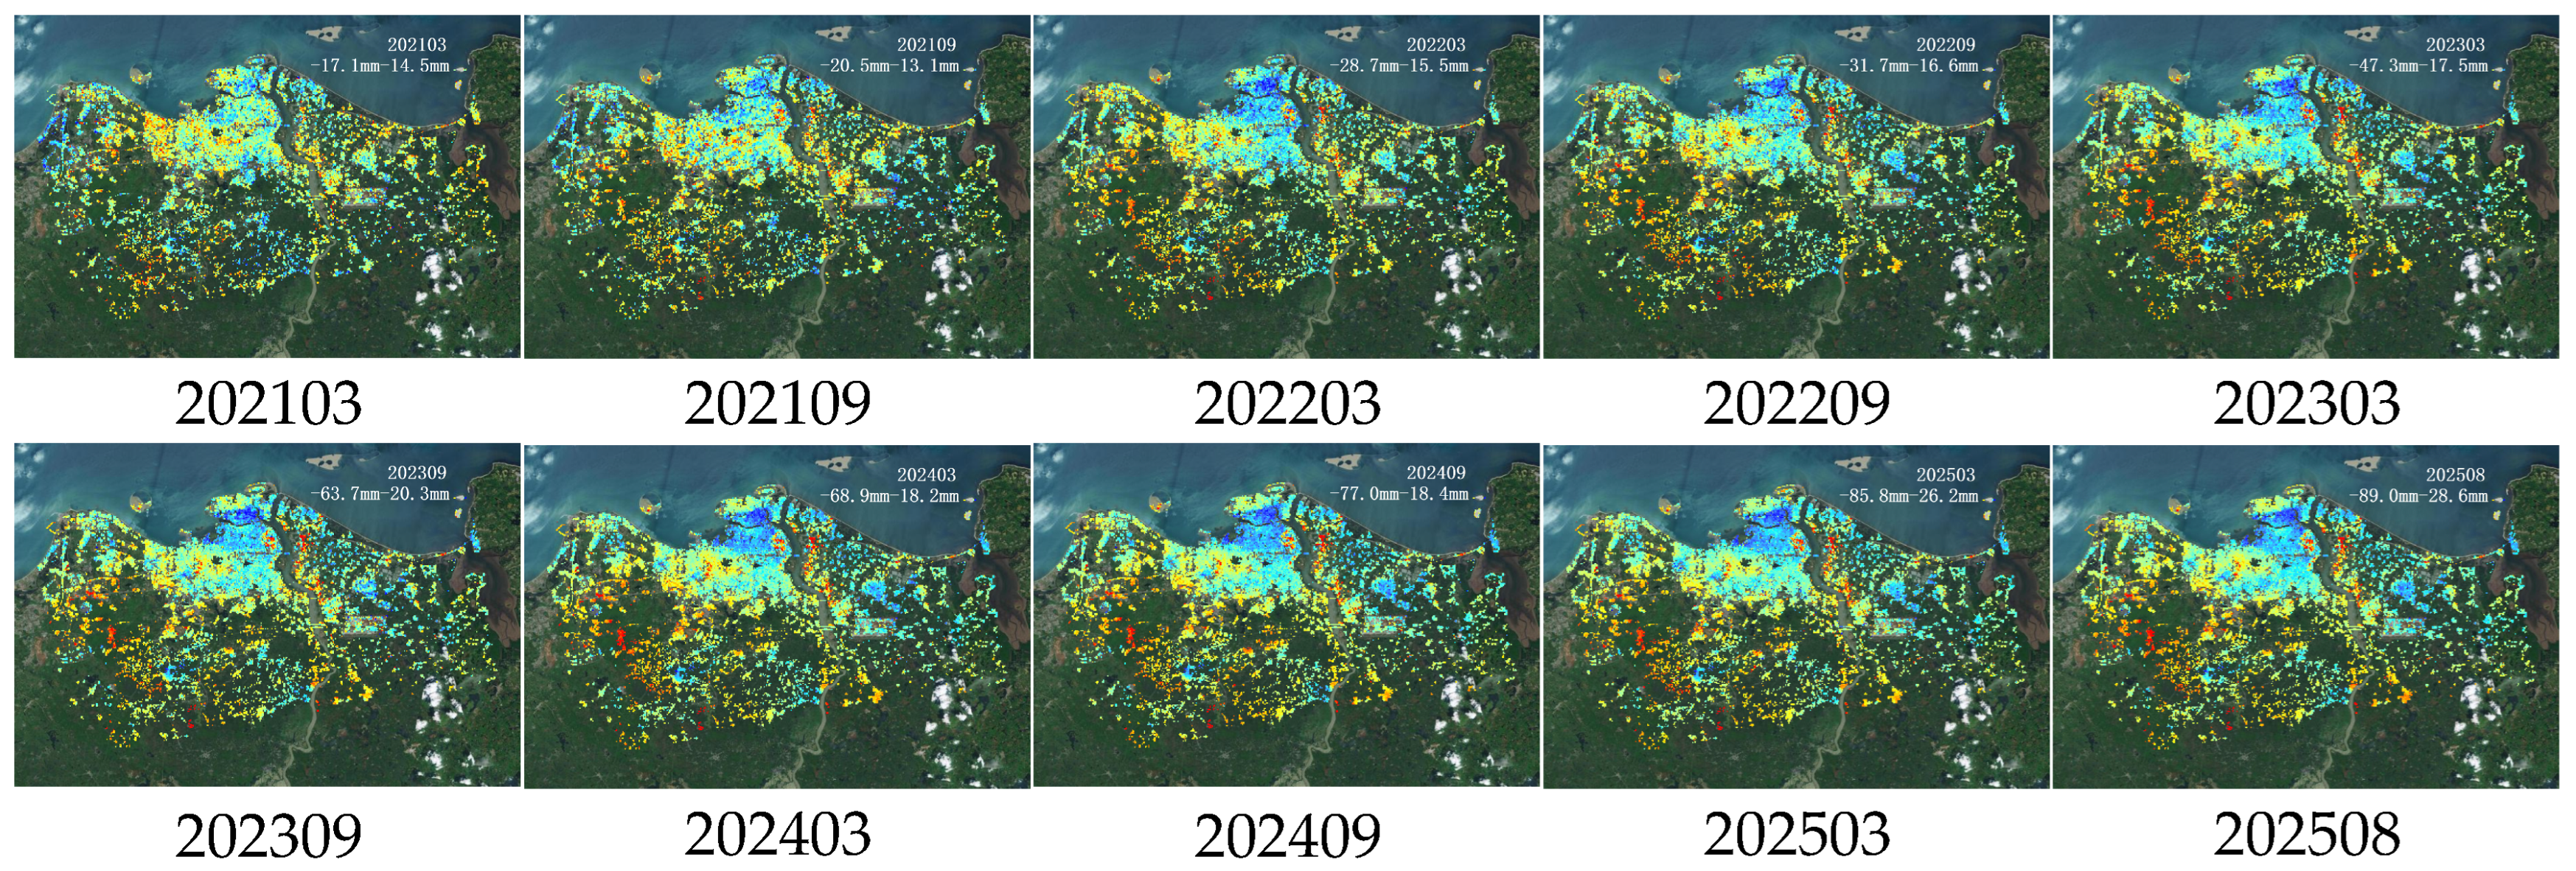
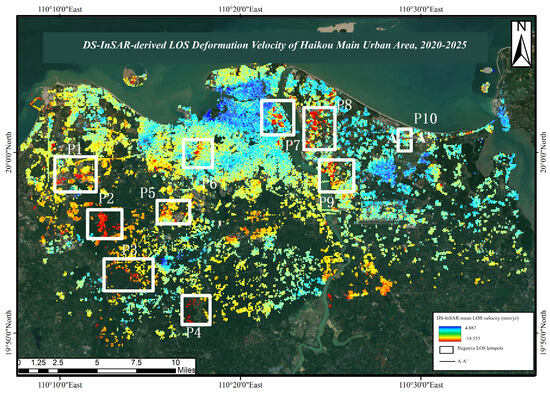
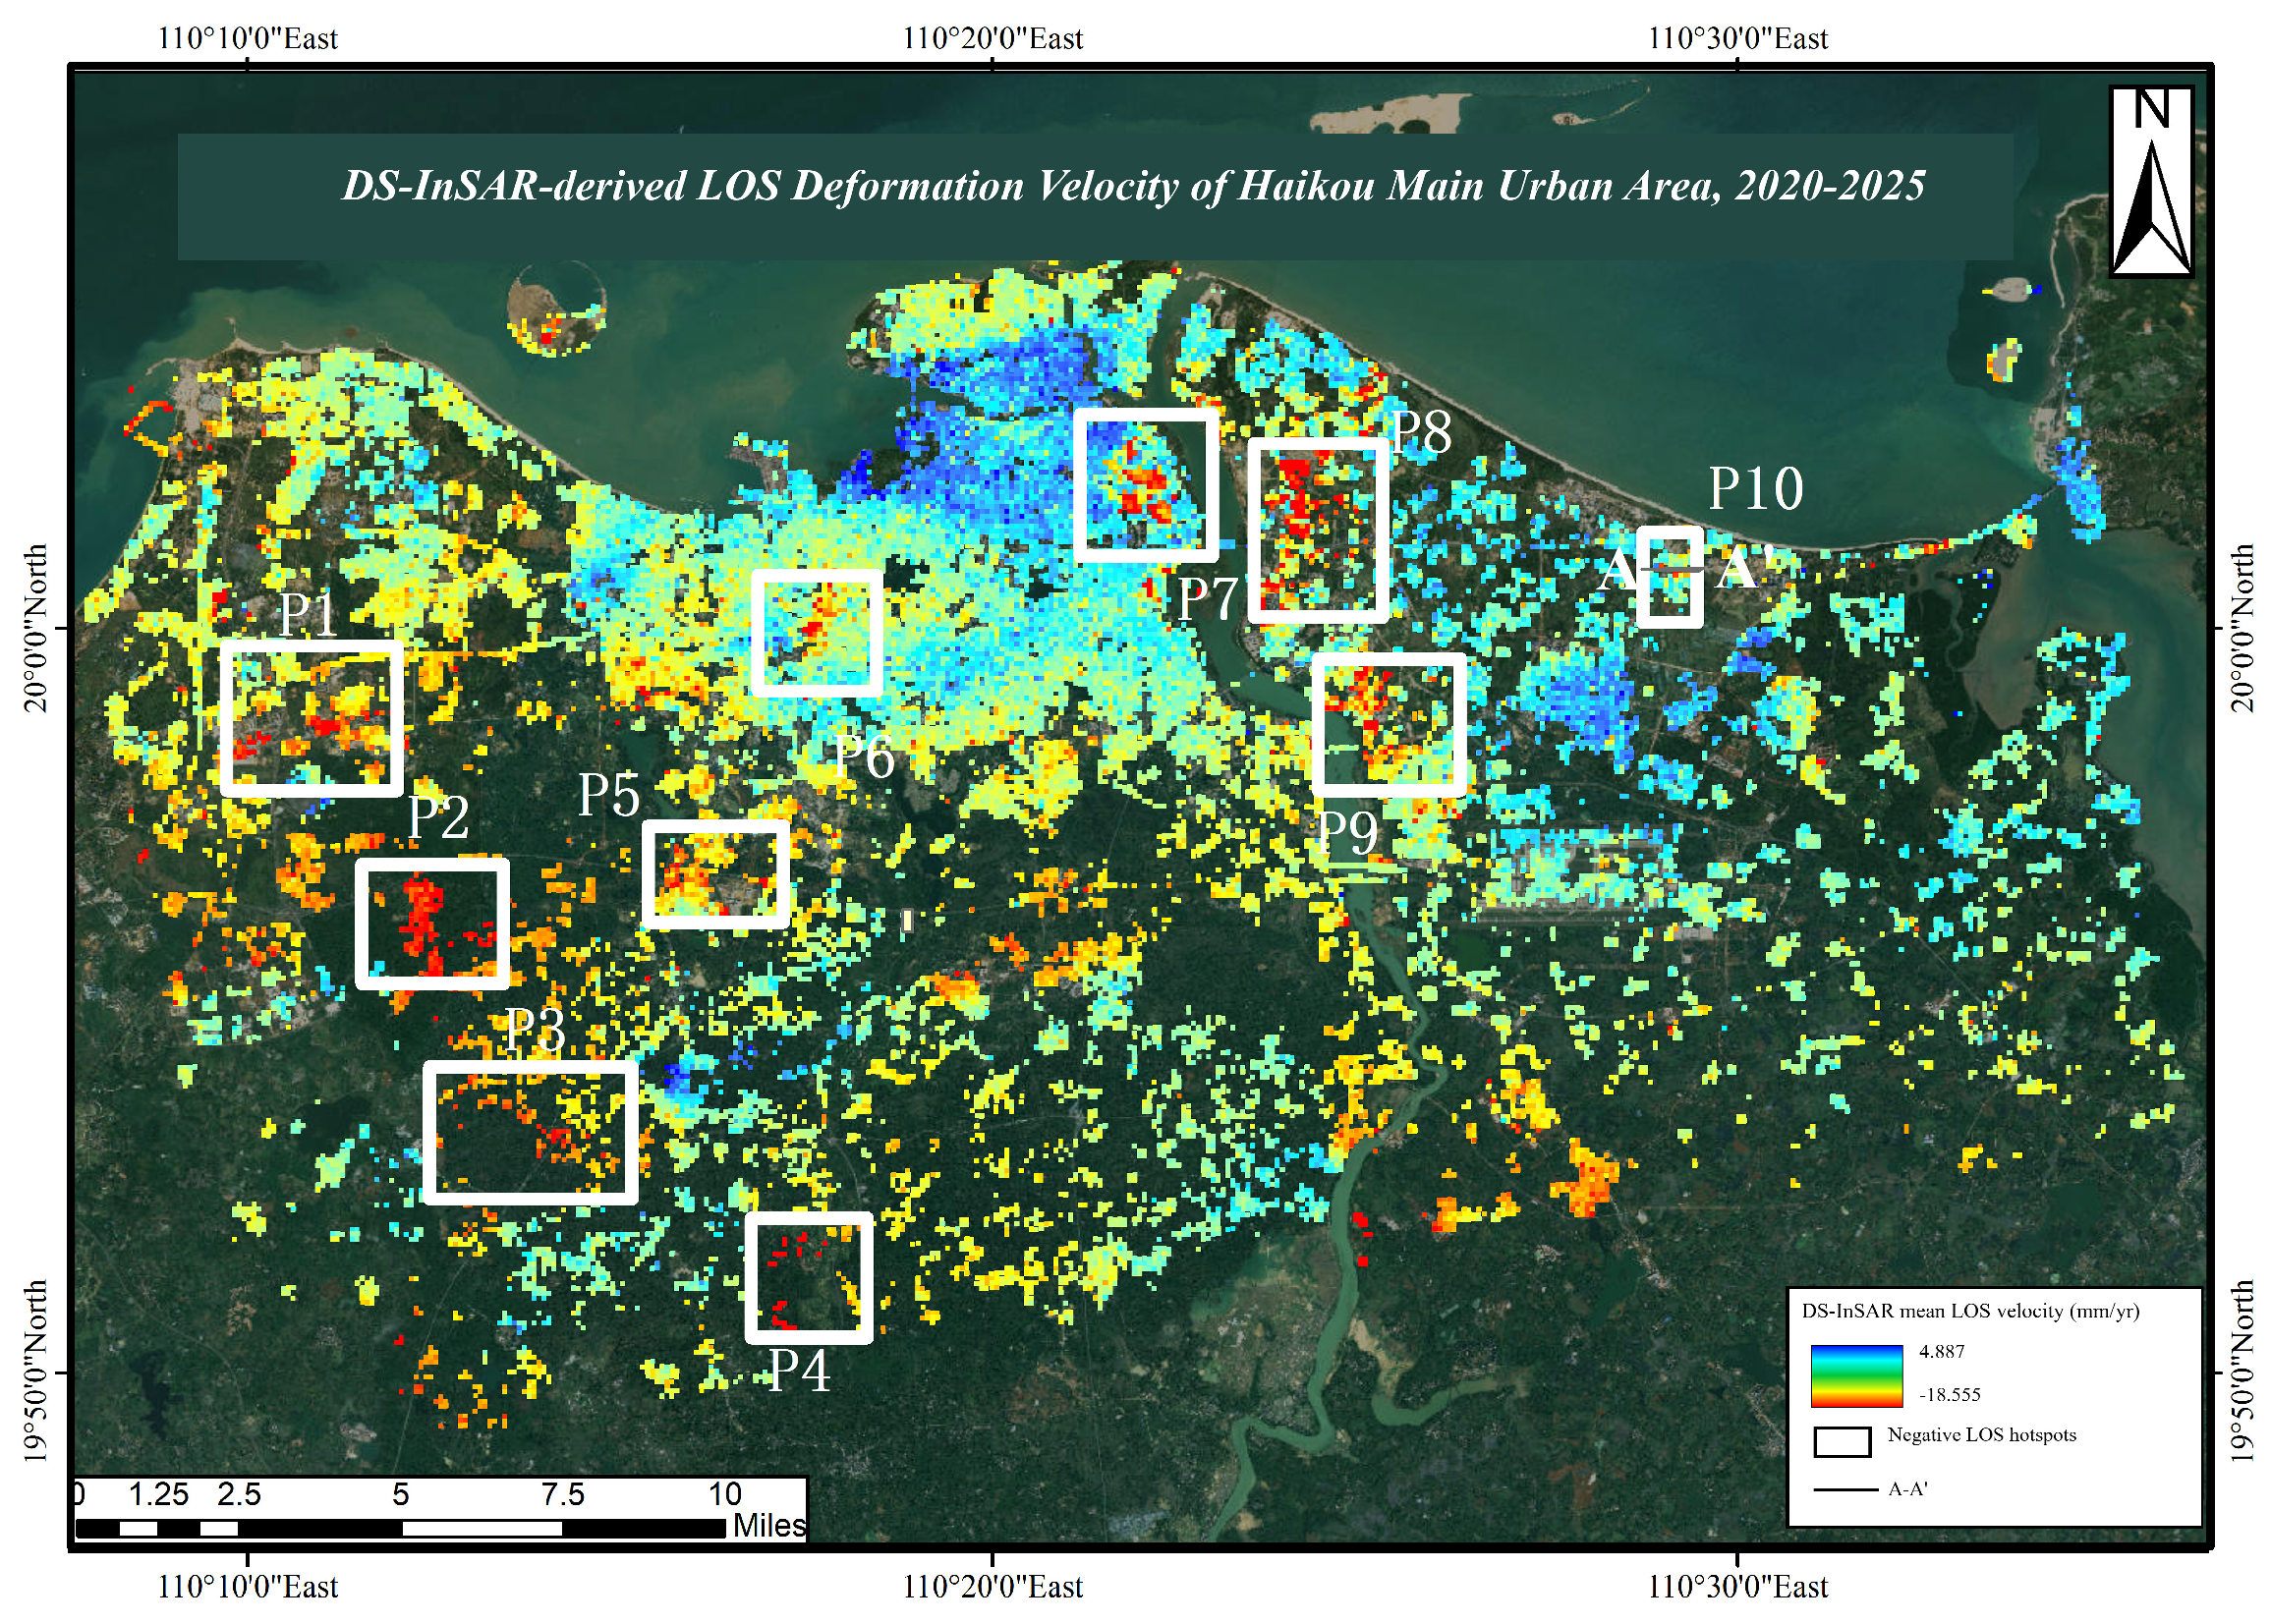
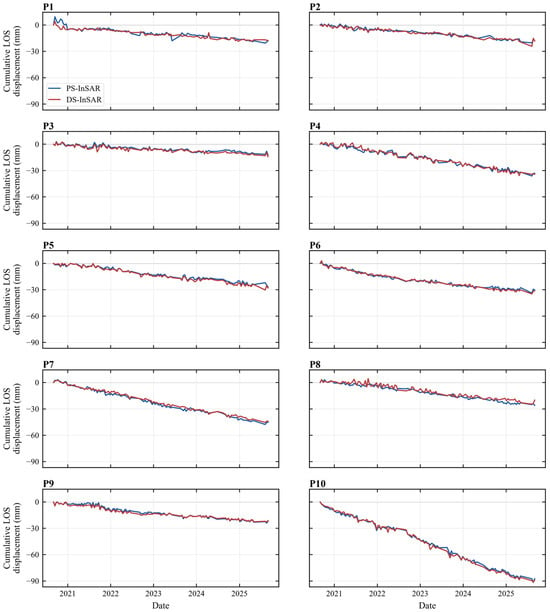
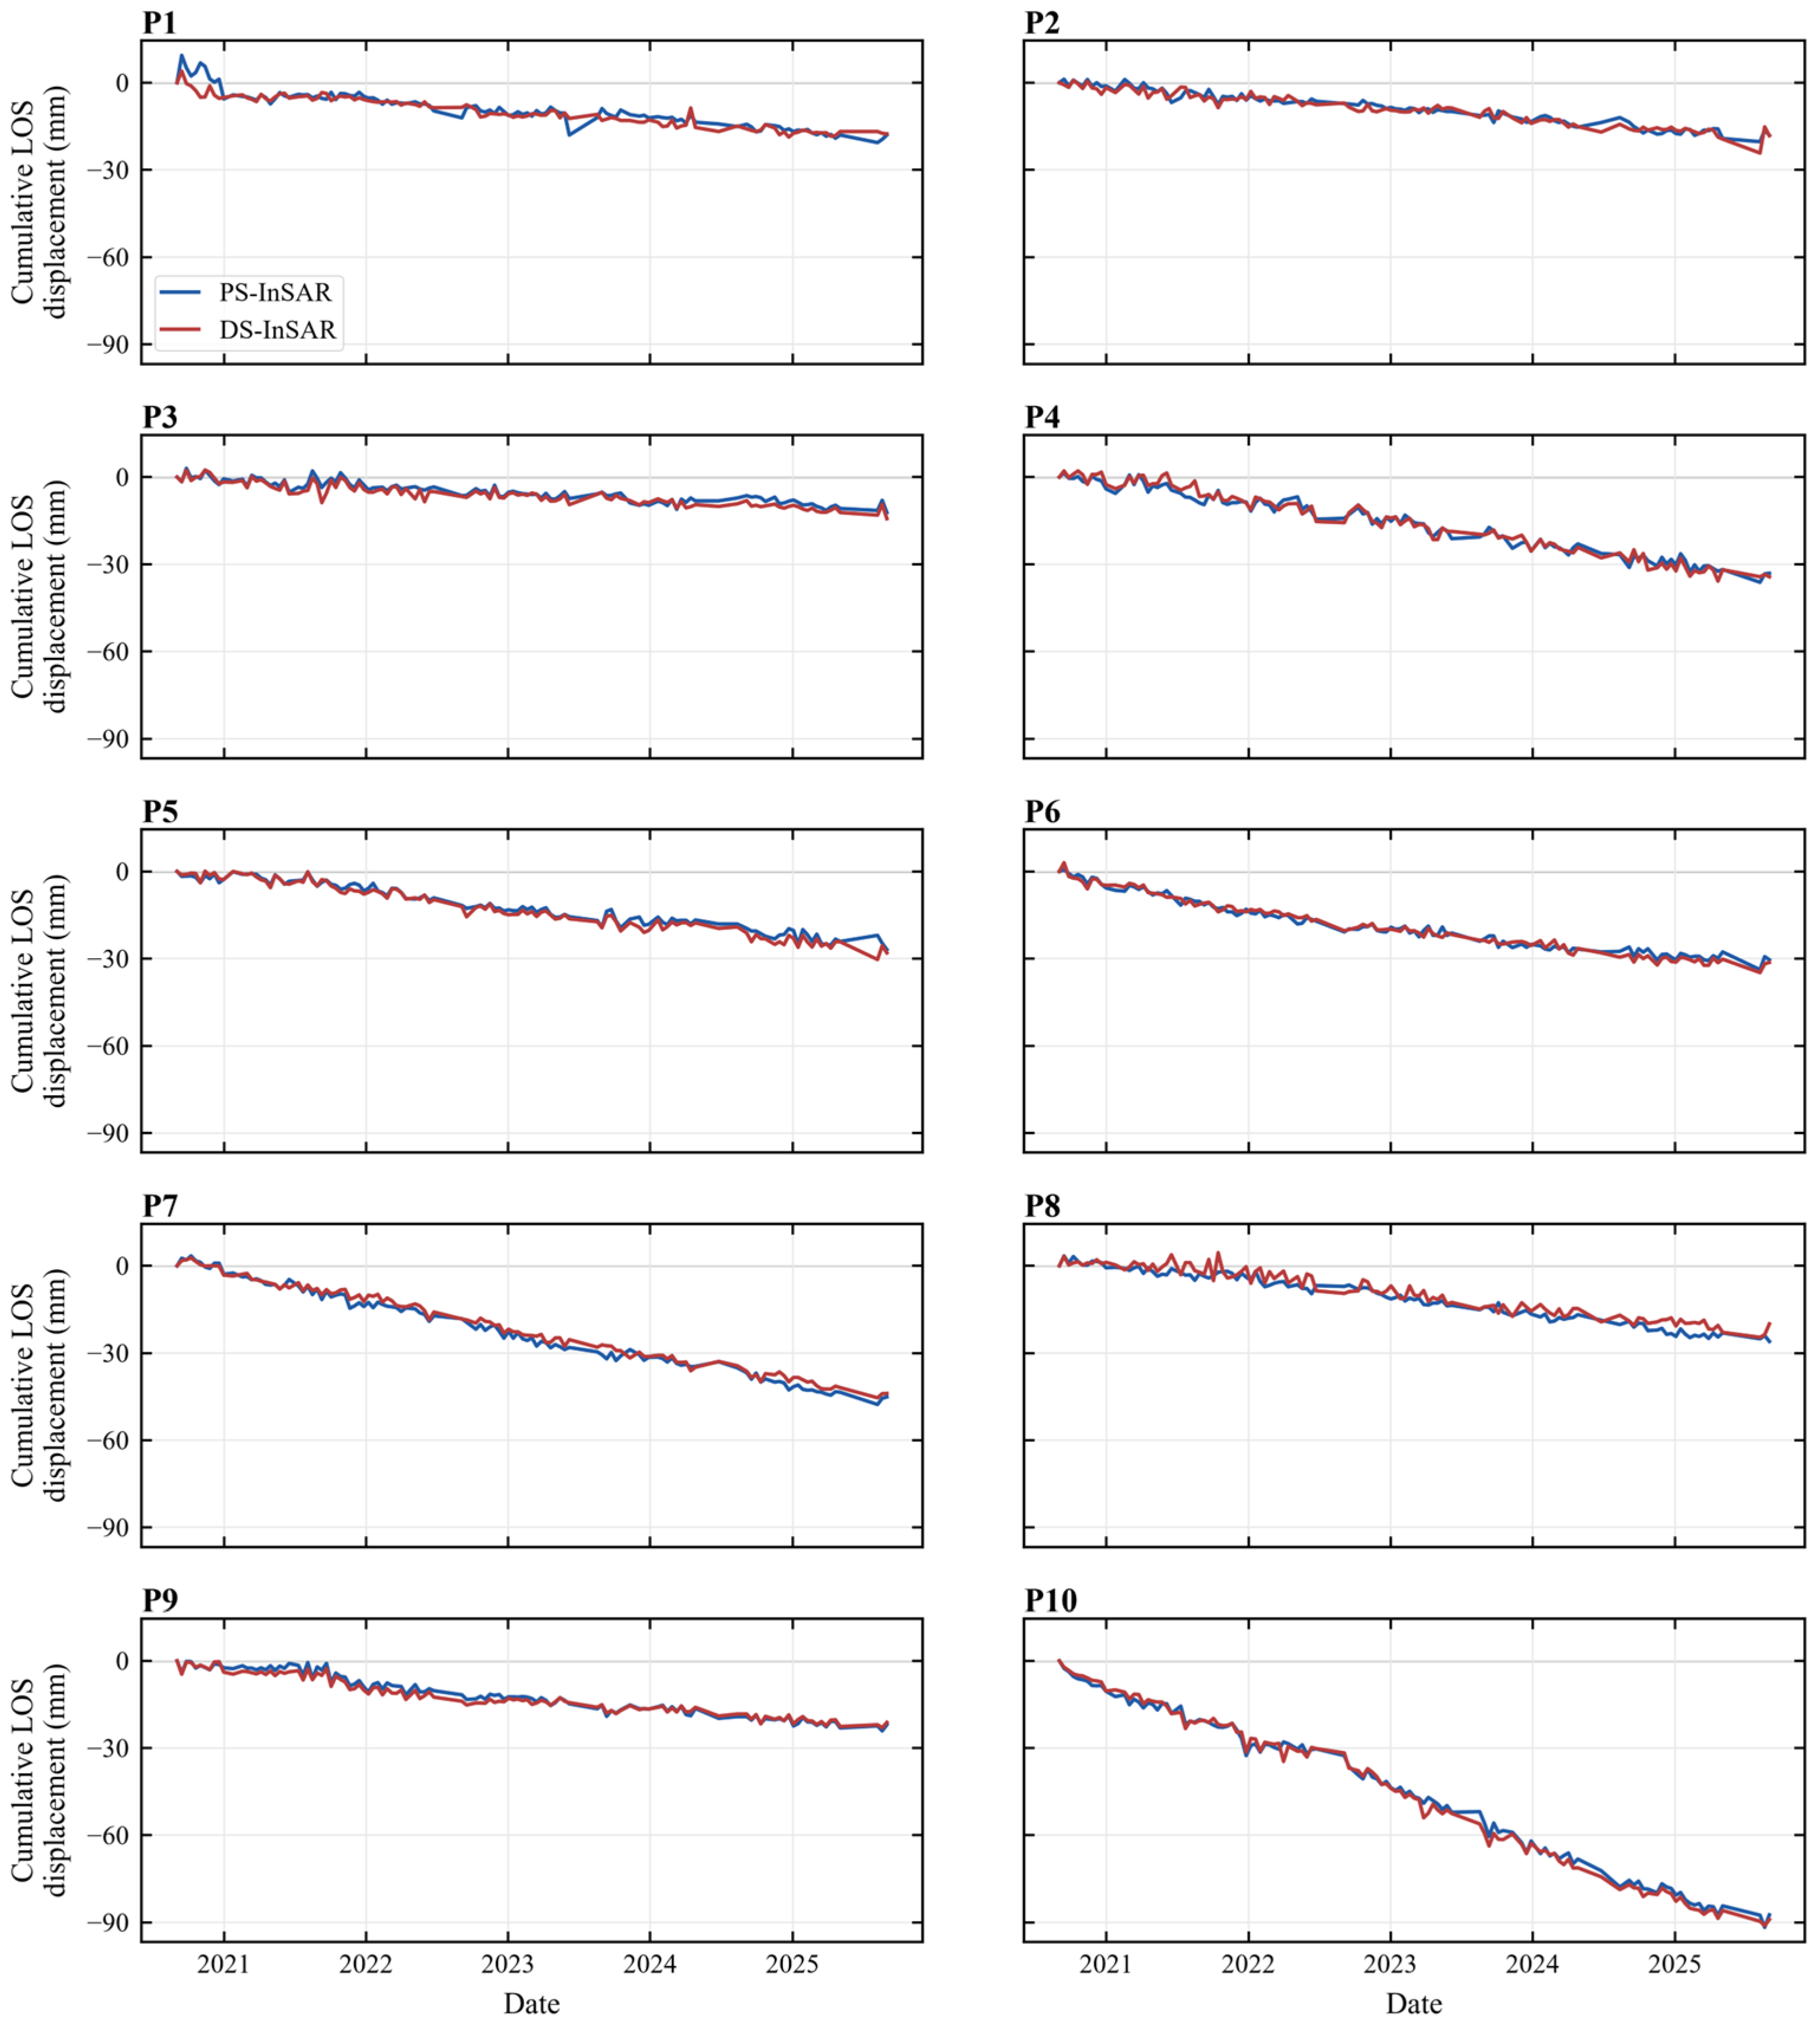
To further characterize the temporal evolution of negative LOS deformation hotspots in Haikou’s urban core, we extracted 10 representative time slices of cumulative LOS displacement from the DS-InSAR results between March 2021 and August 2025 (Figure 5). The Sentinel-1 observation period begins in September 2020, which is used as the reference epoch for cumulative displacement; therefore, the initial 2020 epoch is zero by definition and the displayed cumulative snapshots start from March 2021. In parallel, 10 representative negative LOS monitoring points (P1–P10, Figure 6) were selected from spatially persistent negative LOS hotspots while considering spatial coverage across the major deformation zones, local deformation magnitude, and the availability of both PS- and DS-InSAR time-series measurements. Their coordinates and time-series-derived PS/DS LOS deformation metrics are summarized in Table 3. These points were used to construct cumulative LOS displacement time series (Figure 7), enabling joint analysis from regional and point-scale perspectives.
Figure 5.
Temporal evolution of cumulative LOS displacement in Haikou’s urban core. The full Sentinel-1 observation period begins in September 2020, which is used as the reference epoch; representative cumulative displacement snapshots are therefore shown from March 2021 onward. Colors represent cumulative LOS displacement (mm) according to the color scale shown within each panel.
Figure 6.
Spatial distribution of representative negative LOS deformation hotspots and the A–A′ cross-section profile.
Table 3.
Coordinates and LOS deformation characteristics of representative monitoring points P1–P10.
Figure 7.
Cumulative LOS displacement time series at representative negative LOS deformation hotspots. Panels P1–P10 show paired PS-InSAR (blue) and DS-InSAR (red) cumulative LOS displacement curves during the observation period.
Interannual Evolution Patterns. As shown in Figure 5, the spatial progression of negative LOS deformation exhibits distinct stage-wise characteristics during the observation period. In the initial mapped stage after March 2021, negative LOS anomalies were limited to several localized low-lying and soft-deposit zones, with relatively small magnitudes and scattered distribution. As urban construction and coastal development continued, negative LOS deformation expanded and emerging development areas began to exhibit patchy deformation, indicating a shift from isolated anomalies to more connected deformation zones.
By 2023, pronounced negative LOS deformation occurred in reclaimed coastal areas, forming the most significant negative deformation hotspot across the study area. The deformation center shifted from the traditional western urban core toward the northeastern coastal district, with maximum cumulative LOS displacement exceeding 80 mm. During 2024–2025, the spatial extent of major negative LOS deformation zones became relatively stable, although deformation continued at a slower pace. This suggests a transition toward a decelerating or quasi-stable phase. By the end of 2025, cumulative LOS displacement at the most affected locations approached 90 mm, with the spatial pattern largely established.
Time-Series Behavior at Representative Points. Figure 7 presents the cumulative LOS displacement time series for the 10 selected points. Most points show sustained negative LOS trends without obvious rebound, indicating cumulative and persistent negative deformation behavior. Notable differences exist across points. P10 shows the largest cumulative LOS displacement, with total displacement approaching 90 mm over five years, corresponding to the highest average negative LOS velocity among all selected sites. This pattern is consistent with a setting characterized by soft subsoil conditions and intensive construction-related loading and disturbance. In contrast, P3, P6, and P7 also show steady negative LOS deformation but at lower rates of approximately 10–13 mm/y. Some points, such as P4 and P9, reveal phase-dependent rate changes, with acceleration or deceleration during certain intervals. These fluctuations may be related to construction timelines, seasonal groundwater-level variation, or differential soil consolidation processes, highlighting the combined influence of anthropogenic and hydrogeological conditions.
Rate Variability and Spatial Heterogeneity. Synthesizing the spatial and temporal patterns, negative LOS deformation in Haikou exhibits clear heterogeneity. The annual negative LOS velocities across the selected monitoring points range from approximately 8 to 18 mm/y. Faster negative LOS deformation is concentrated in coastal reclamation zones, newly developed districts, and soft-deposit areas, while slower rates occur in the established urban core where ground conditions are comparatively more stable. These patterns suggest that the observed negative LOS deformation is associated not only with subsurface lithology and groundwater conditions but also with urbanization intensity, development stage, and foundation treatment. Time-series characteristics such as slope, smoothness, and phase-dependent variation provide important temporal constraints for subsequent spatial attribution and mechanism interpretation.
4.4. Profile Interpretation of the P10 Negative LOS Deformation Hotspot
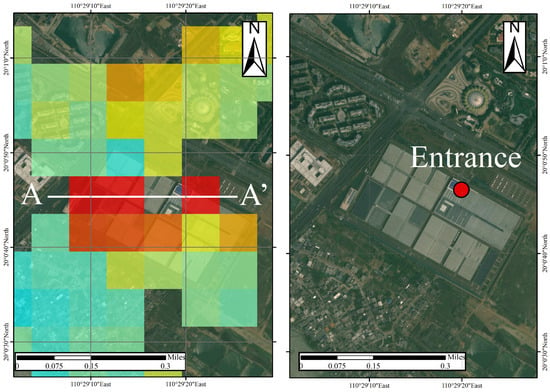
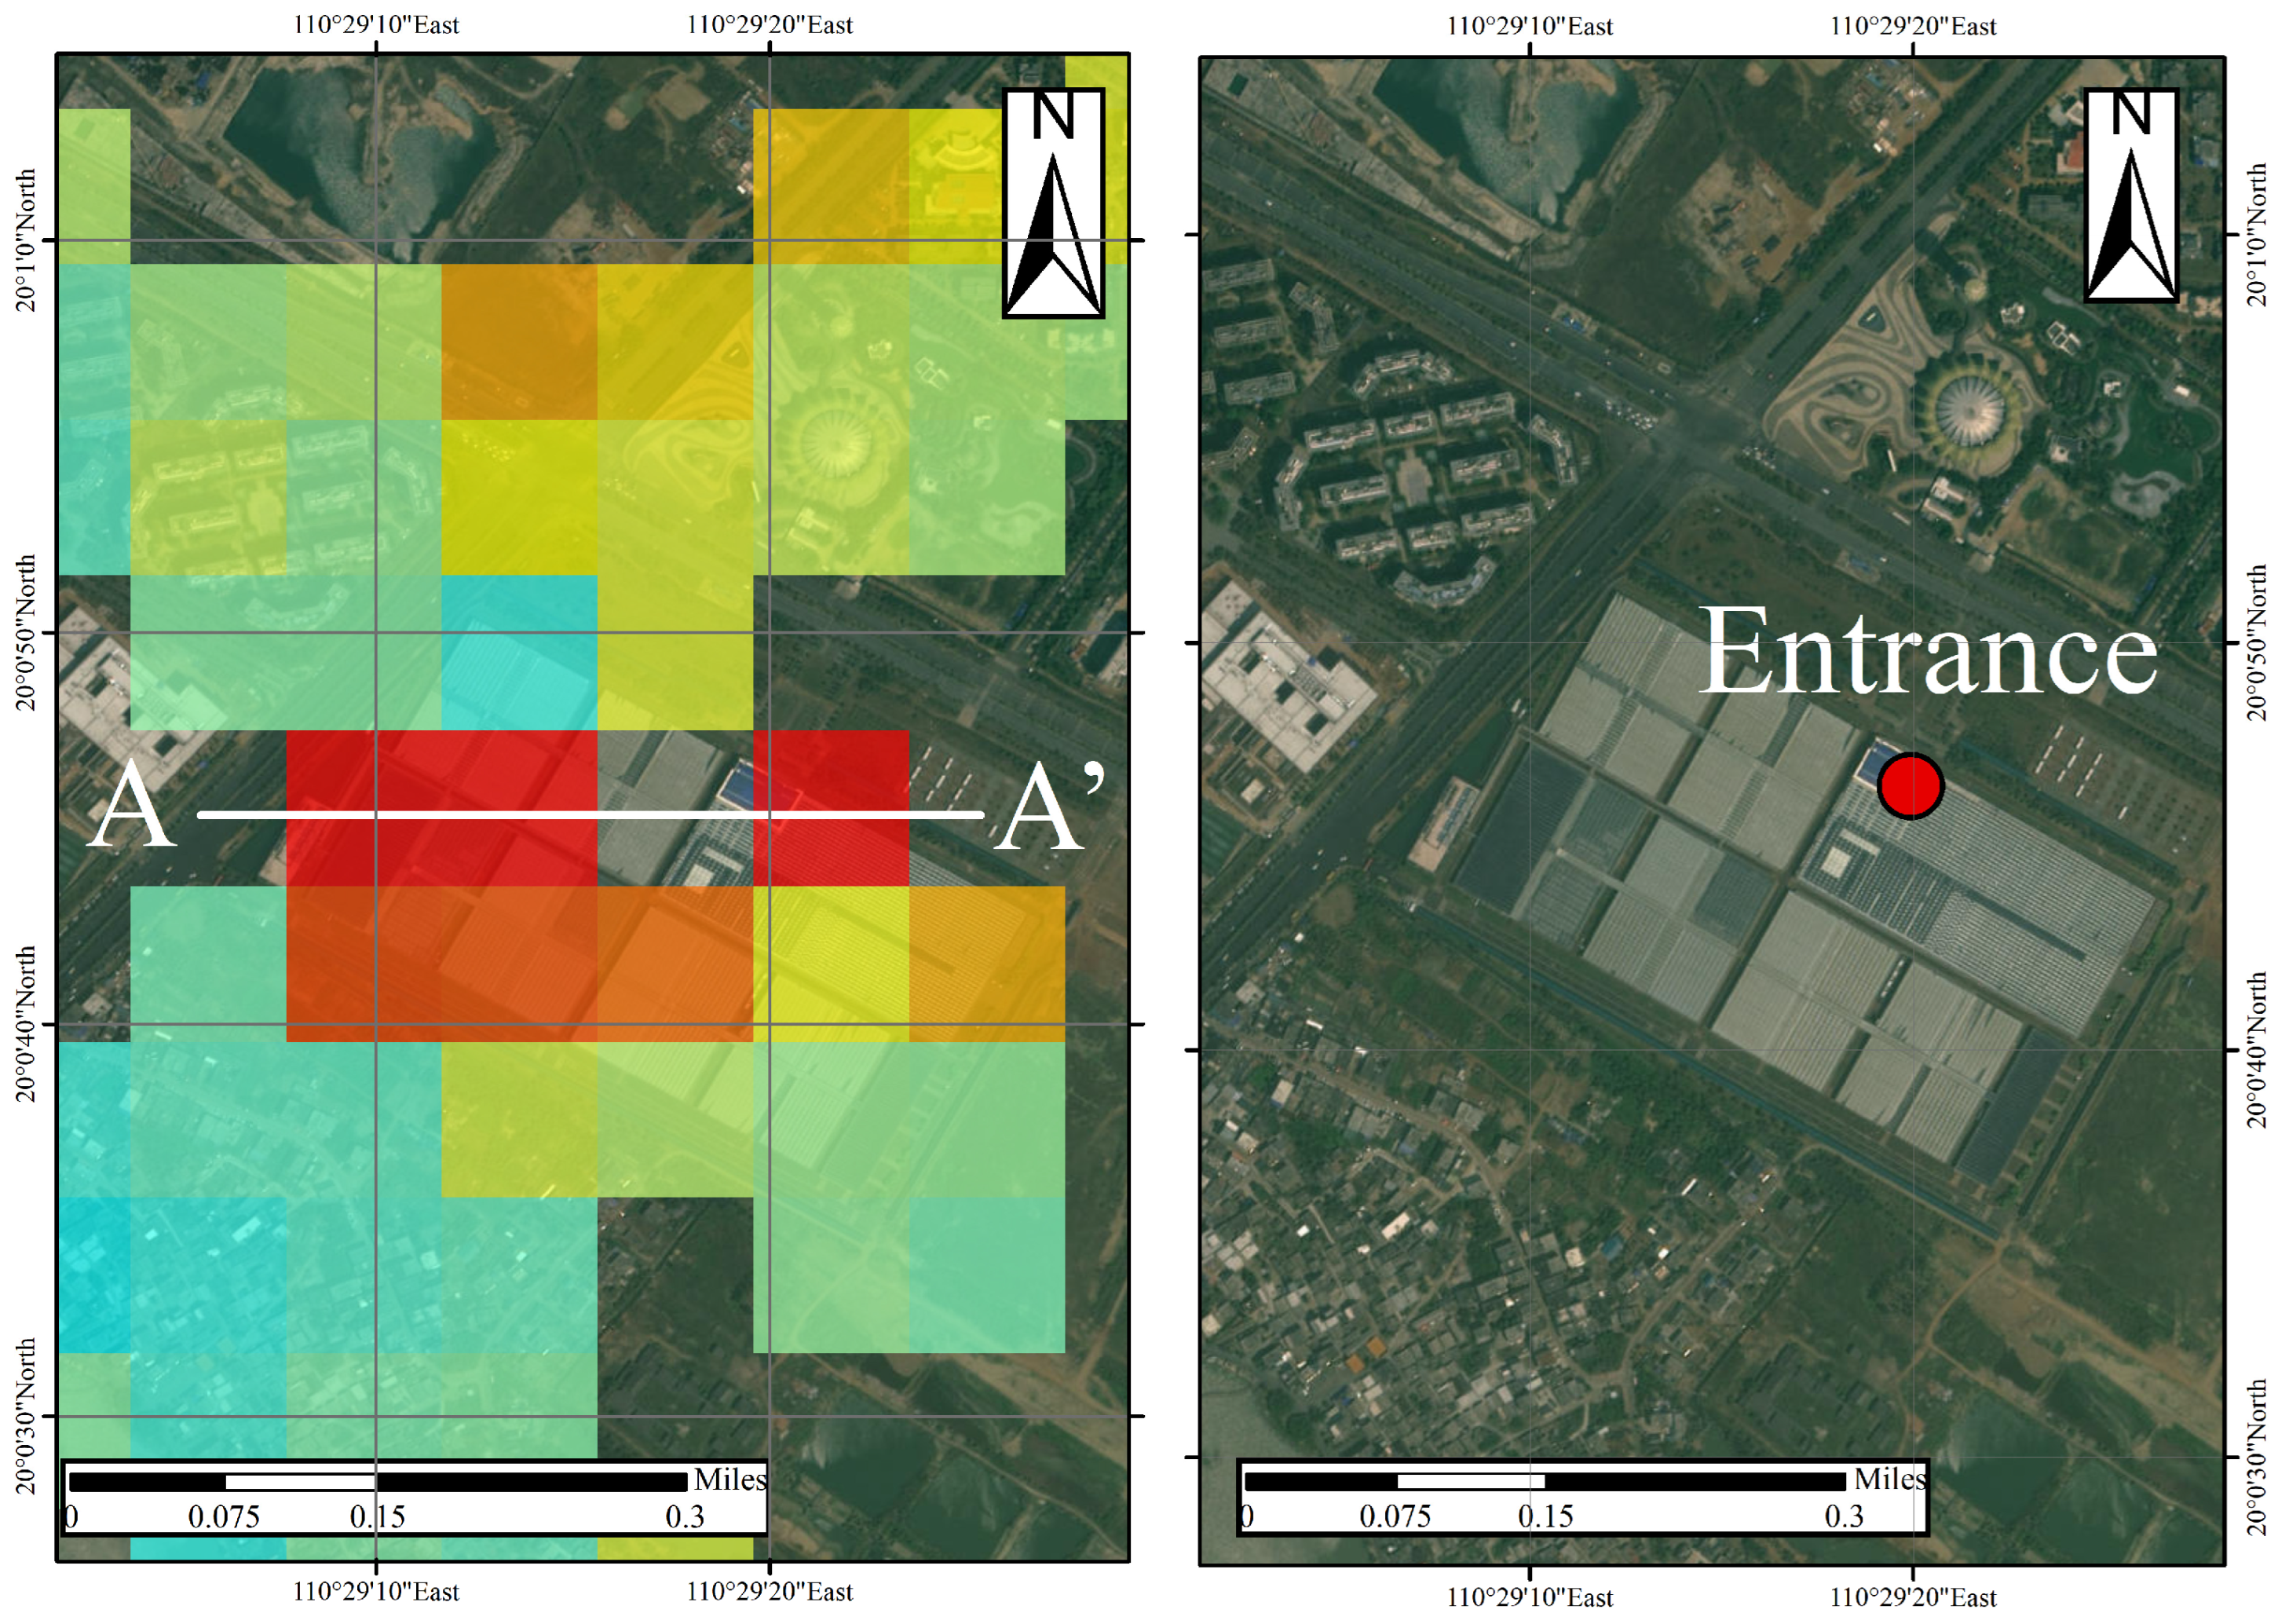
High-resolution optical imagery from Tianditu (Figure 8) indicates that the deformation hotspot spatially coincides with the Hainan National Tropical Agricultural Park, particularly near the main entrance where intensive built-up development and surface hardening are observed. This spatial correspondence is consistent with localized surface loading as a plausible contributor to the observed deformation pattern.
Figure 8.
Satellite imagery of the P10 negative LOS deformation hotspot. Colored cells in the (left) panel show LOS velocity (mm/yr; warmer colors indicate more negative values), and the white line marks A–A′. In the (right) Tianditu image, the red point marks the park entrance.
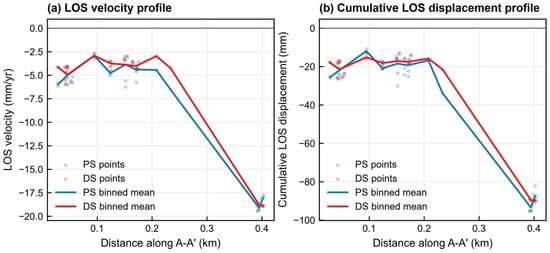
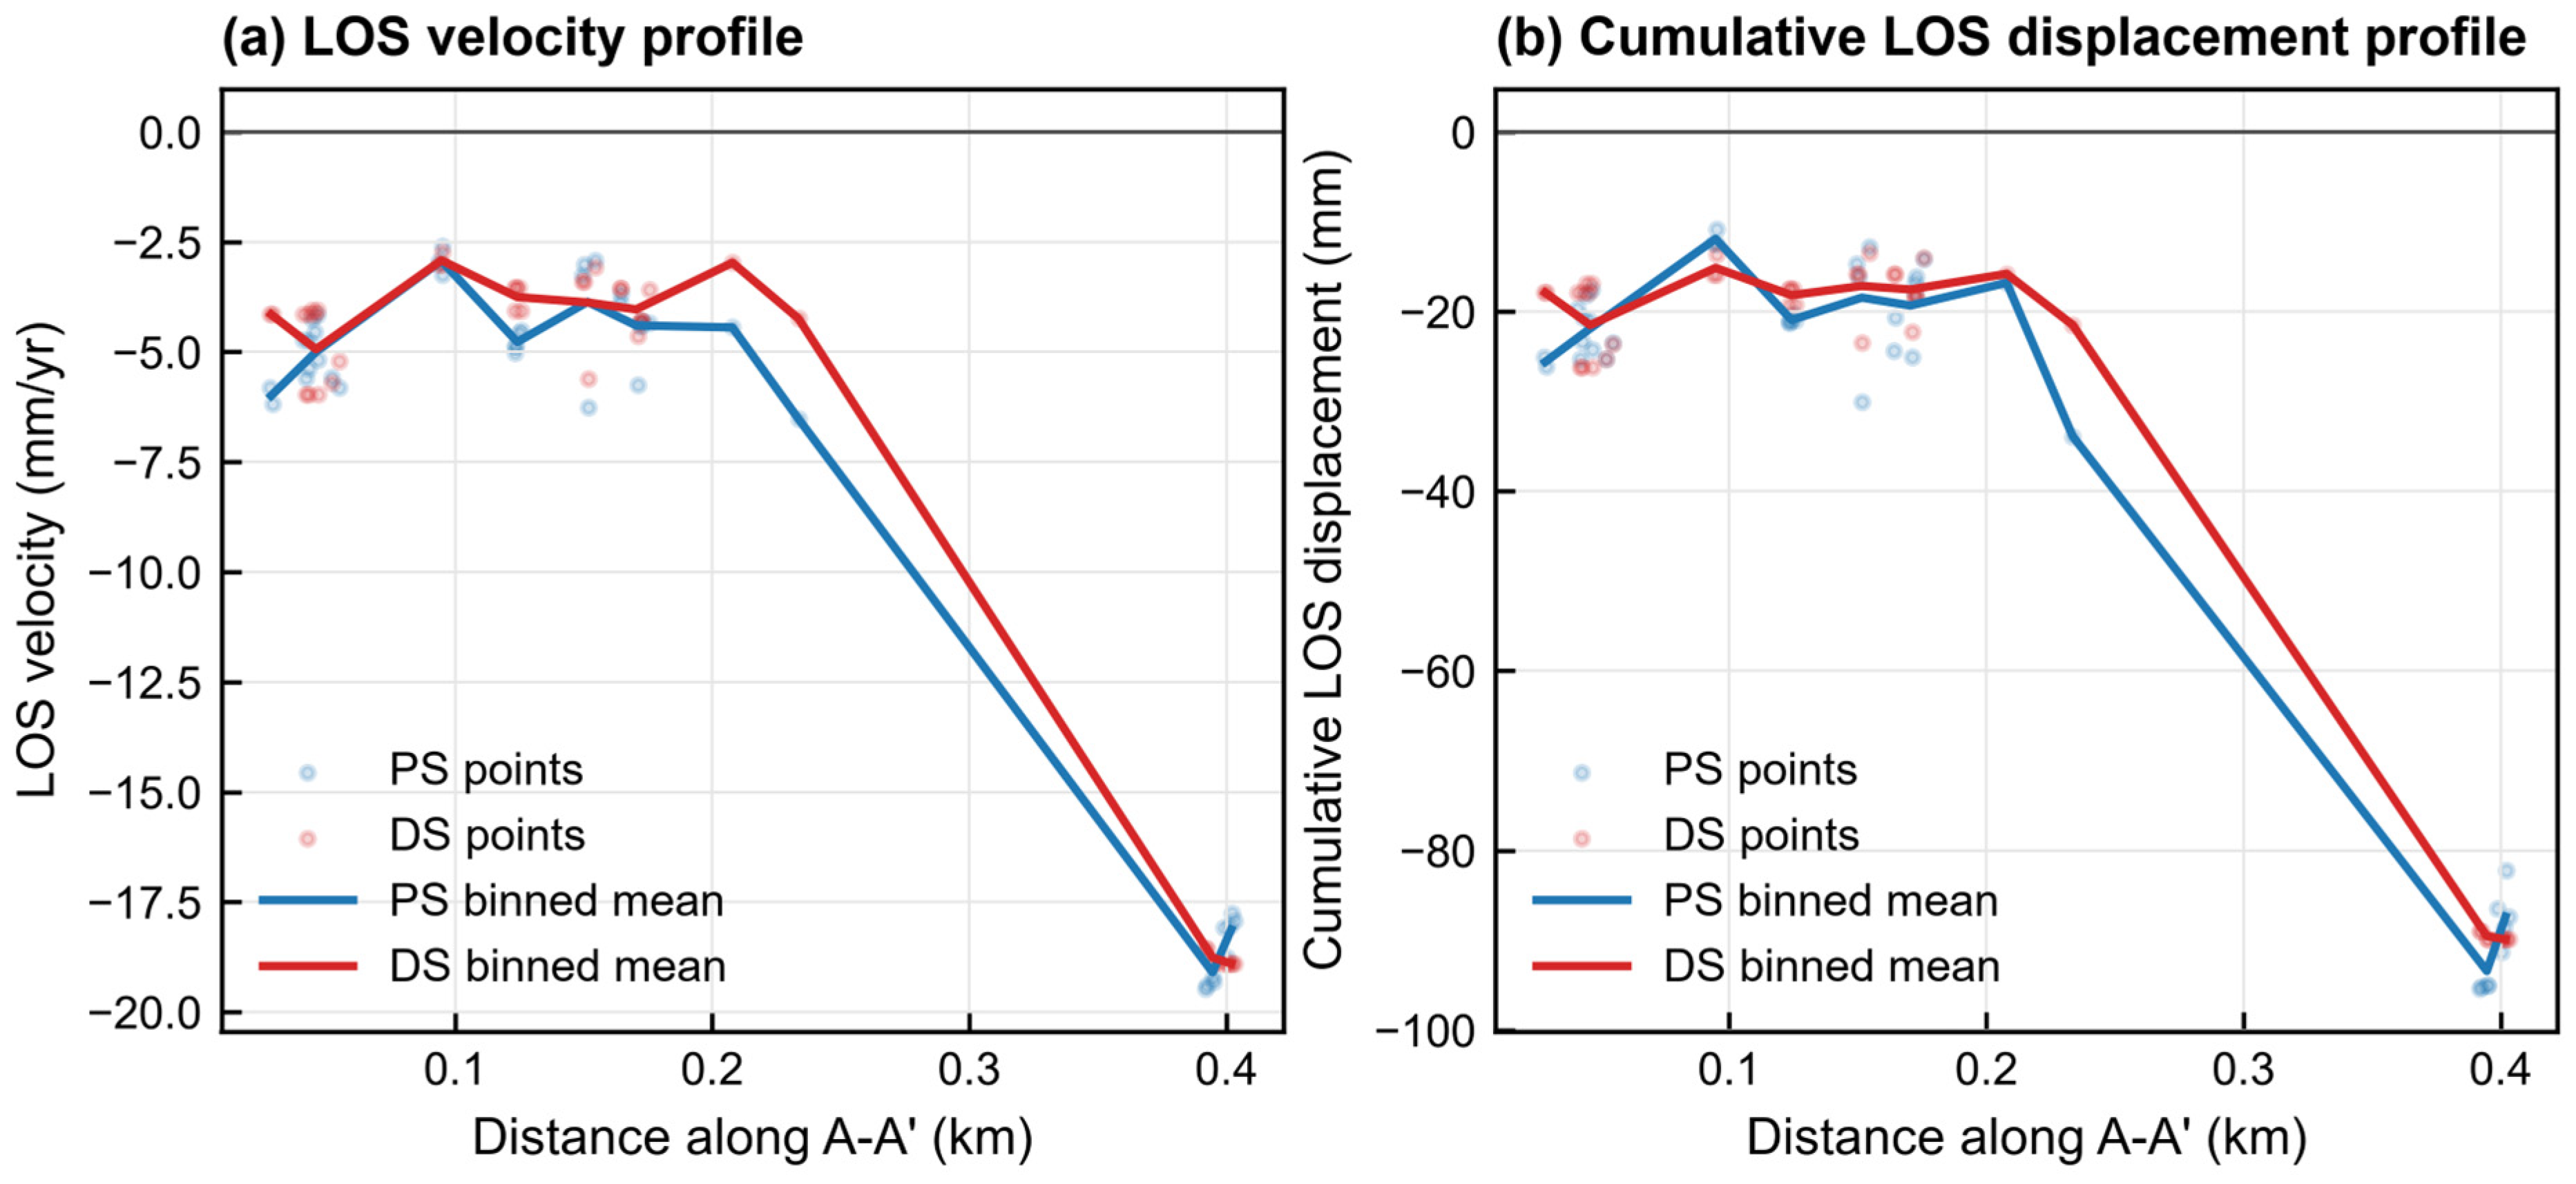
Located in Jiangdong New District, Point P10 exhibits one of the strongest deformation signals in the study area. The A–A′ profile (Figure 9) was constructed by projecting PS/DS measurement points onto the transect and summarizing them in approximately 20 m distance bins without additional smoothing. It shows a basin-like pattern with clear asymmetry: the maximum cumulative deformation (approximately 90 mm) is concentrated near the A′-end entrance and gradually decreases toward the A-end. The sharp lateral gradients indicate a localized deformation core and pronounced spatial heterogeneity along the profile, suggesting non-uniform controlling conditions across the transect.
Figure 9.
Cross-sectional profiles along A–A′ in the P10 negative LOS deformation zone. The horizontal axis is expressed as profile distance in kilometers, calculated from the endpoints A (110.485871°E, 20.012152°N) and A′ (110.489737°E, 20.012209°N). Profile points were projected onto the transect and summarized in approximately 20 m distance bins; no additional smoothing was applied.
From a geotechnical standpoint, the P10 zone is situated within a coastal reclaimed area where soft, compressible deposits are commonly present, which may favor long-term settlement under additional loads. In addition, rapid construction activities within the park and nearby plots can impose significant short-term loading; potential groundwater-level variations may further modulate effective stress and consolidation behavior. These factors, alone or in combination, may explain the concentrated deformation core near the A′ end of the profile.
4.5. Internal Consistency Between PS- and DS-InSAR LOS Deformation Results
Because no independent ground-based deformation measurements, such as GNSS or leveling observations, were available for the 2020–2025 study period, this section evaluates the inter-method consistency between PS-InSAR and DS-InSAR results rather than the absolute accuracy of the retrieved deformation. Both solutions were derived from the same Sentinel-1A dataset and share similar sources of uncertainty, including atmospheric residuals, phase-unwrapping errors, residual orbital ramps, DEM-related errors, and reference-point selection. Therefore, the comparison presented here should be regarded as an internal consistency assessment of LOS deformation patterns, not as an independent validation of true ground displacement.
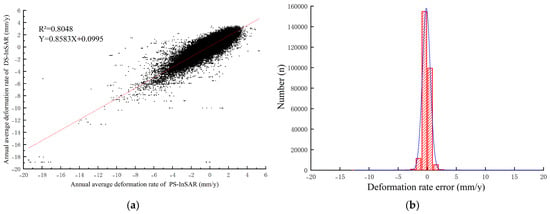
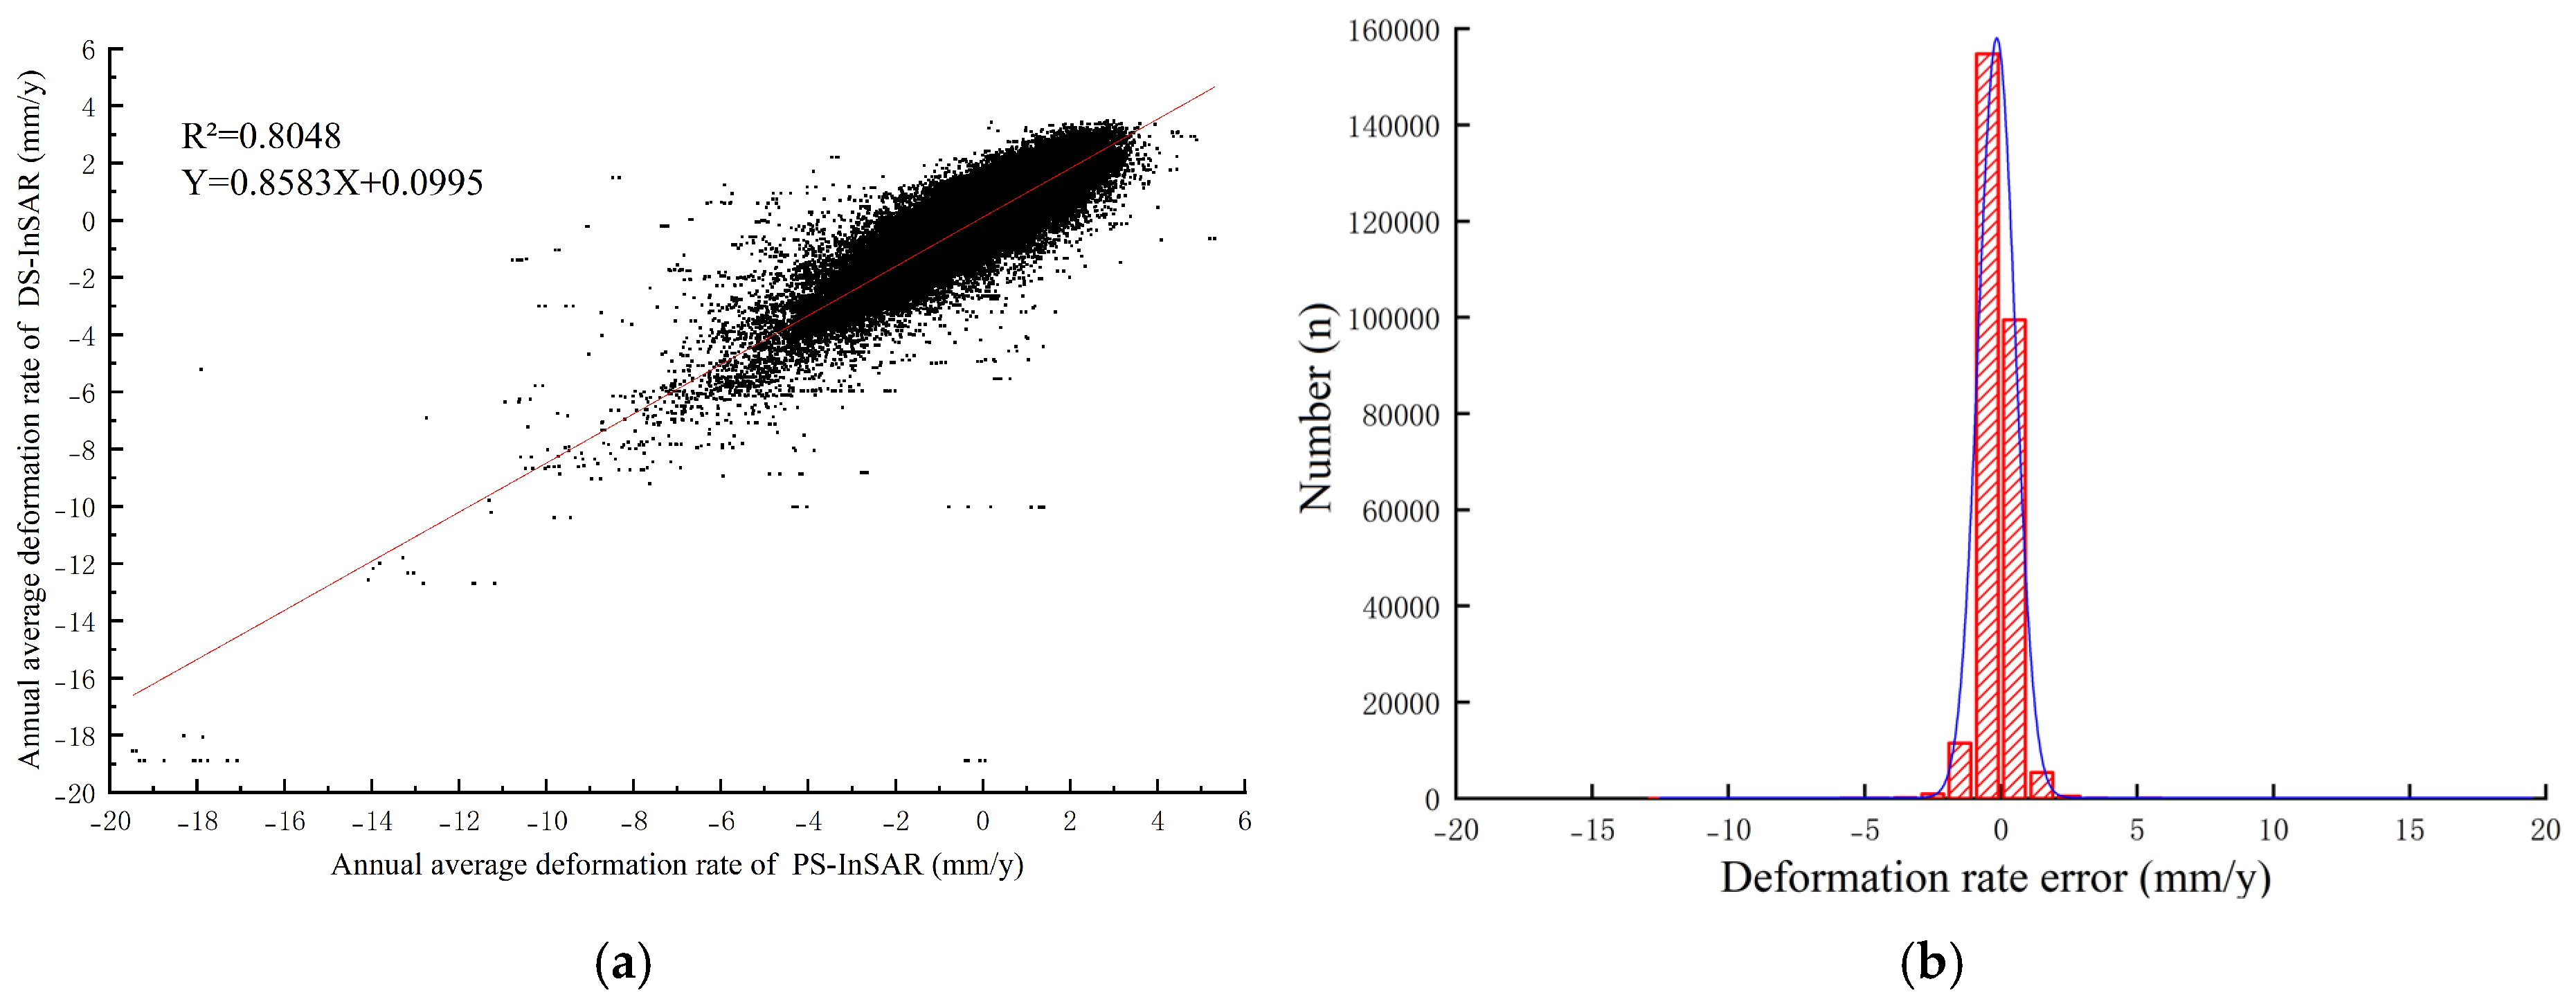
To ensure spatial comparability, each PS point was paired with its nearest DS point within a 15 m radius. After removing duplicate matches, 272,876 valid PS-DS point pairs were retained. For each pair, the mean annual LOS deformation velocities were extracted and denoted as VPS and VDS, respectively. A least-squares linear regression was then performed using VPS as the independent variable and VDS as the dependent variable. The coefficient of determination R2 was used to quantify the degree of linear agreement between the two solutions. In addition, the velocity difference Δv = VDS − VPS was calculated to evaluate the magnitude and distribution of inter-method deviations (Figure 10).
Figure 10.
Internal consistency assessment between PS- and DS-InSAR LOS deformation results at collocated points. (a) Scatterplot and linear regression of mean annual LOS deformation velocities; (b) distribution of inter-method velocity differences Δv = VDS − VPS. This comparison evaluates inter-method consistency rather than independent deformation accuracy. In panel (a), the red line denotes the fitted regression; in panel (b), the red outline denotes the histogram counts and the blue curve denotes the fitted distribution.
The regression analysis shows a clear linear relationship between the collocated PS- and DS-InSAR LOS velocity estimates (Figure 10a). The fitted model is VDS = 0.86VPS + 0.10, with R2 = 0.8048, RMSE = 0.569 mm/yr, MAE = 0.397 mm/yr, and a mean bias of 0.111 mm/yr, indicating substantial agreement in the first-order spatial pattern of LOS deformation. The slope below unity suggests that DS-InSAR produces a slightly smoother velocity field than PS-InSAR, probably because phase-linking and filtering suppress local extreme values. This agreement supports the spatial consistency of the two processing streams, but it should not be interpreted as an independent accuracy assessment because both results are derived from the same SAR observations.
The distribution of Δv further supports this interpretation (Figure 10b). Approximately 71.89% of the paired points have absolute PS-DS velocity differences within 0.5 mm/yr, 93.19% are within 1.0 mm/yr, and 99.36% are within 2.0 mm/yr. The 5th–95th percentile range of Δv is −0.729 to 0.973 mm/yr. This narrow residual distribution indicates that PS- and DS-InSAR produce highly similar LOS velocity estimates over most collocated points. Nevertheless, the small inter-method difference should not be equated with absolute deformation accuracy, because shared error components may remain in both solutions.
In summary, DS-InSAR provides better spatial continuity in reclaimed, vegetated, and mixed land-cover areas, whereas PS-InSAR provides stable measurements over strongly coherent built-up targets. The high level of agreement between the two solutions indicates that the main LOS deformation patterns are not artifacts of a single scatterer-selection strategy. However, this comparison only demonstrates inter-method consistency and does not remove the need for independent ground validation. Therefore, the PS–DS comparison is used here to support the robustness of spatial pattern interpretation, while the absolute magnitude and physical decomposition of deformation should be treated with caution.
An independent ascending-track SBAS/LiCSBAS processing-chain result was further compared with the main PS/DS-InSAR products at the grid scale (Figure 11). For the comparison with the main DS-InSAR result, 5722 common 250 m grid cells satisfied the minimum point-count criterion. The independent result shows very strong agreement with the main DS-InSAR velocity field, with R2 = 0.9879, RMSE = 0.192 mm/yr, MAE = 0.101 mm/yr, and a mean bias of −0.012 mm/yr. The comparison with the main PS-InSAR result also shows high consistency (5113 common grid cells; R2 = 0.9133; RMSE = 0.341 mm/yr; MAE = 0.222 mm/yr; bias = 0.085 mm/yr). These results indicate that the main LOS deformation pattern is not an artifact of a single scatterer-selection strategy or one specific processing chain. However, because the independent product is still based on ascending Sentinel-1 observations, this comparison should be interpreted as processing-chain consistency rather than ground-truth validation.
Figure 11.
Independent processing-chain consistency assessment of mean LOS velocity. (a) Main DS-InSAR mean LOS velocity aggregated to 250 m grid cells; (b) independent ascending-track SBAS/LiCSBAS processing-chain mean LOS velocity over the same common grid cells; (c) grid-level scatterplot between the two products. Mean LOS velocity denotes the average annual displacement rate projected onto the ascending Sentinel-1 radar line of sight; under the adopted sign convention, negative values indicate motion away from the satellite and positive values indicate motion toward the satellite. The comparison evaluates processing-chain consistency rather than independent ground validation.
4.6. GeoDetector-Based Spatial Attribution
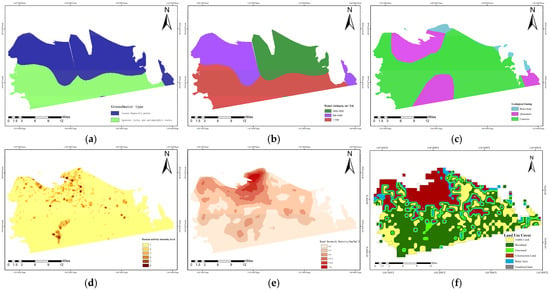
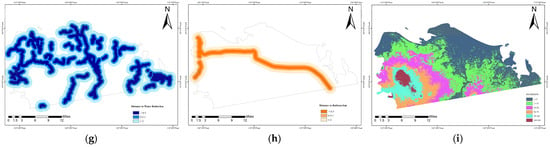
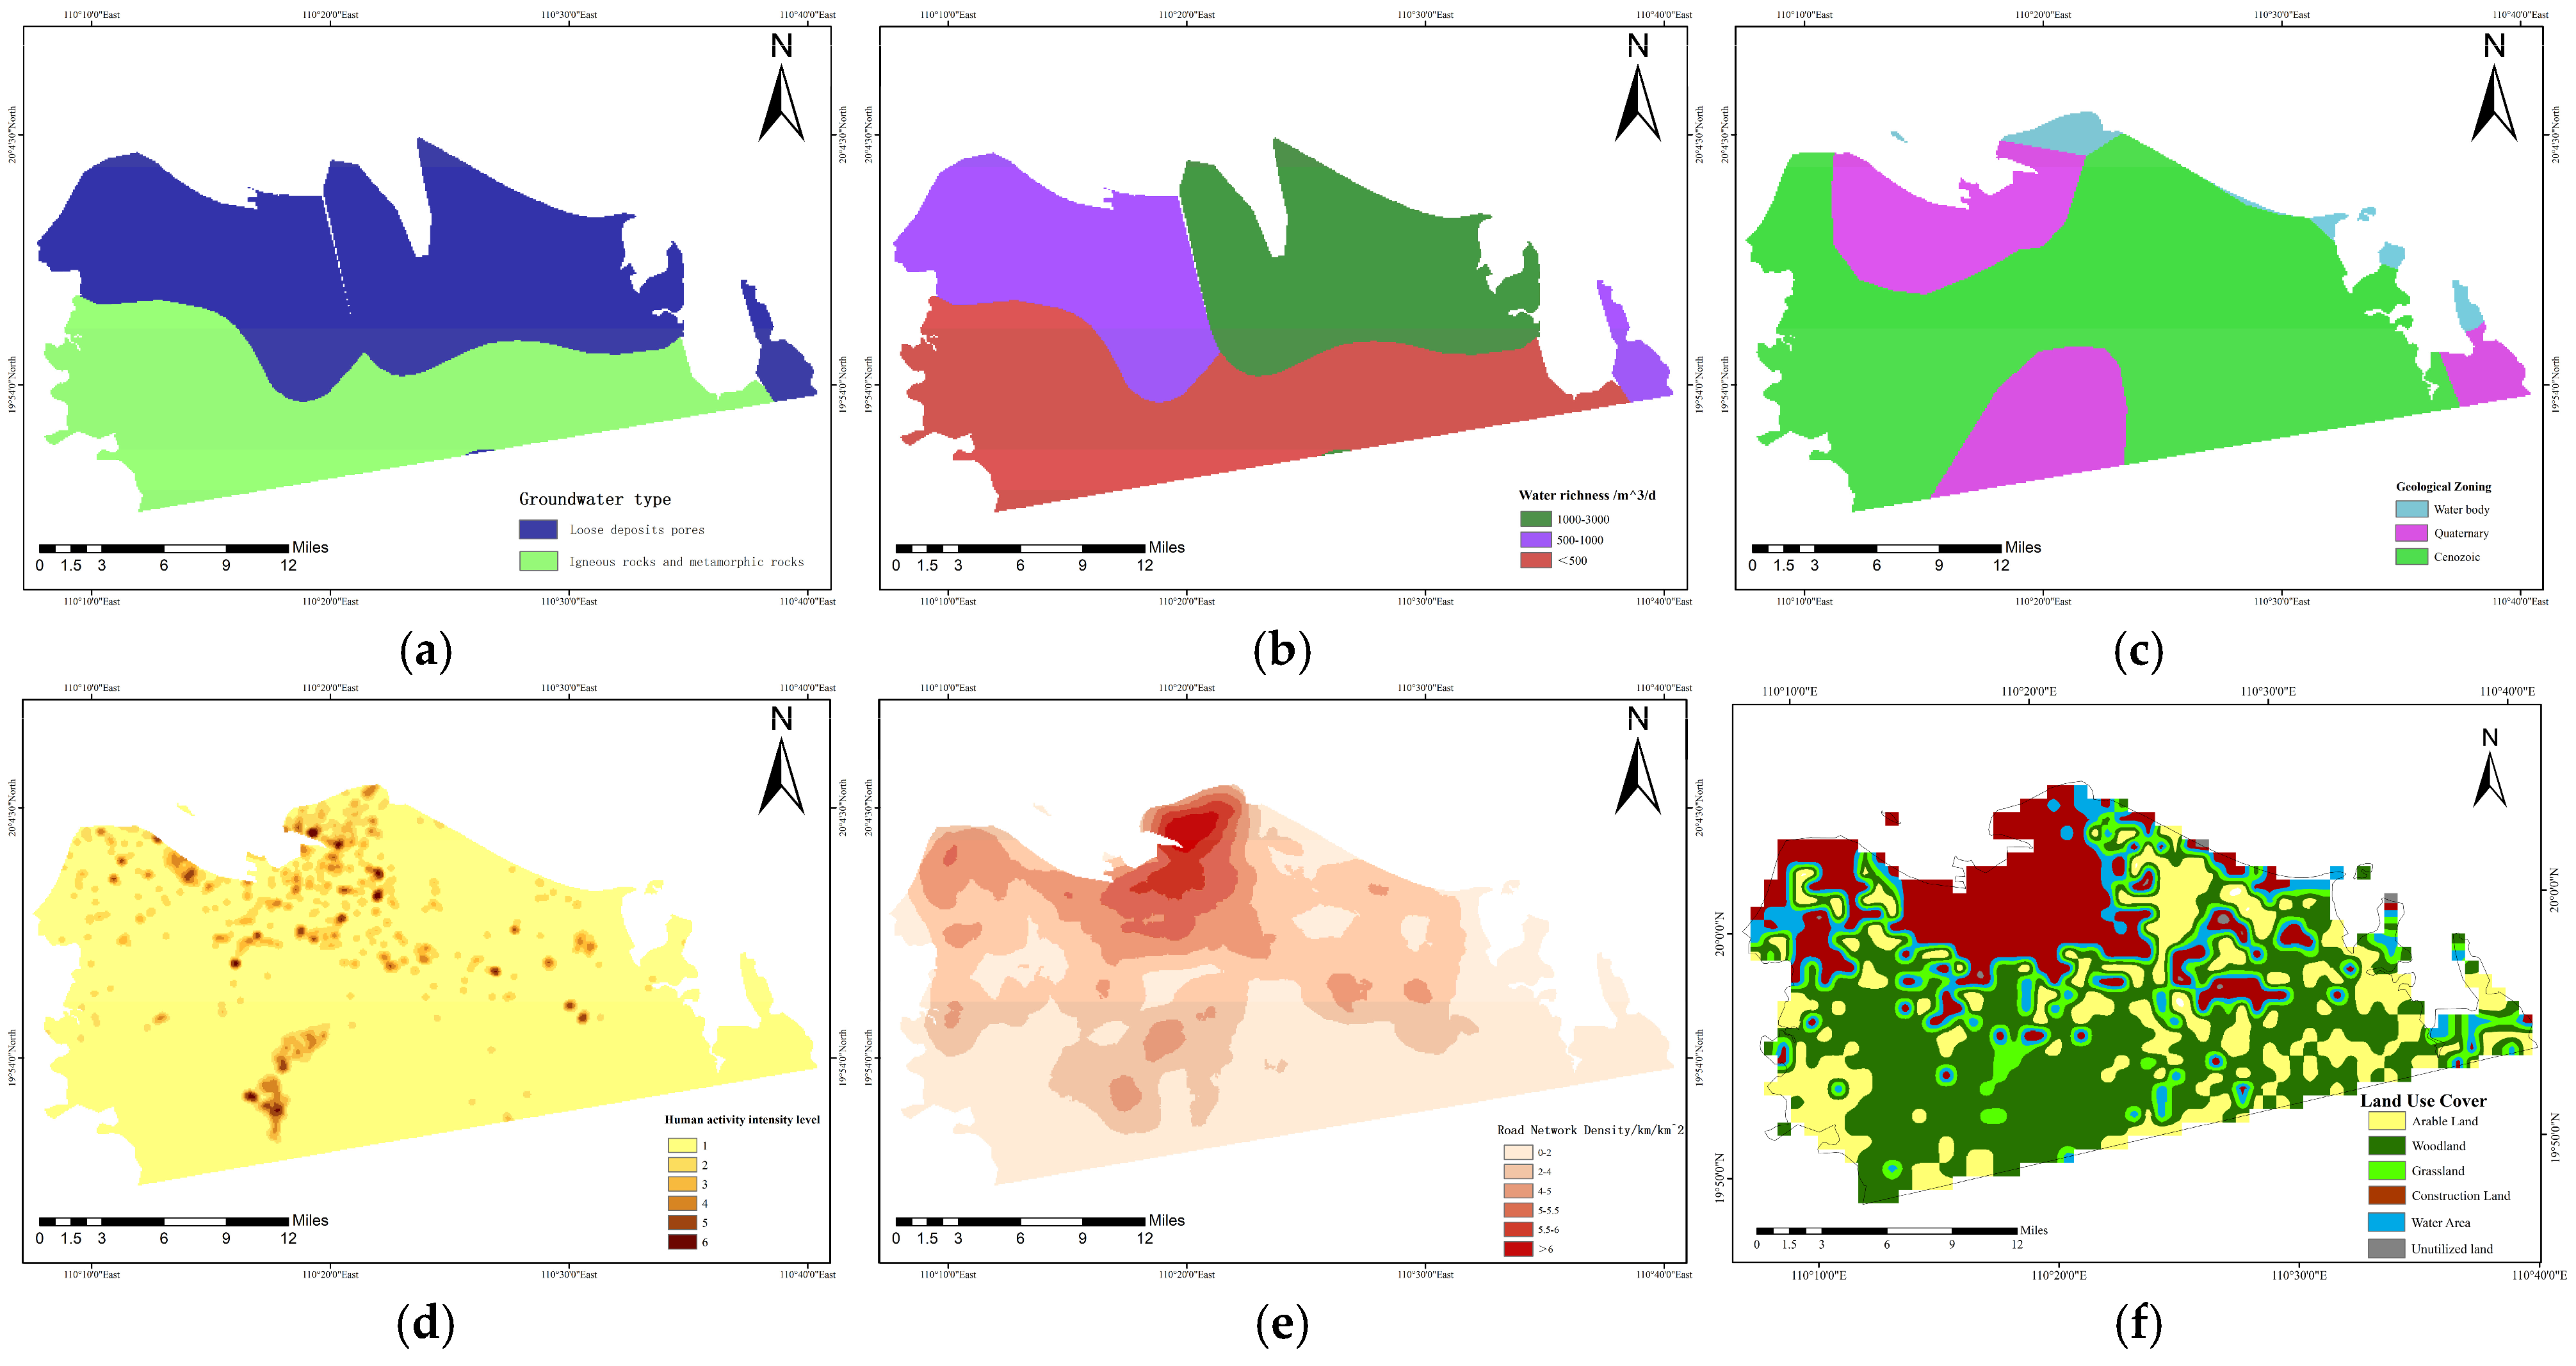
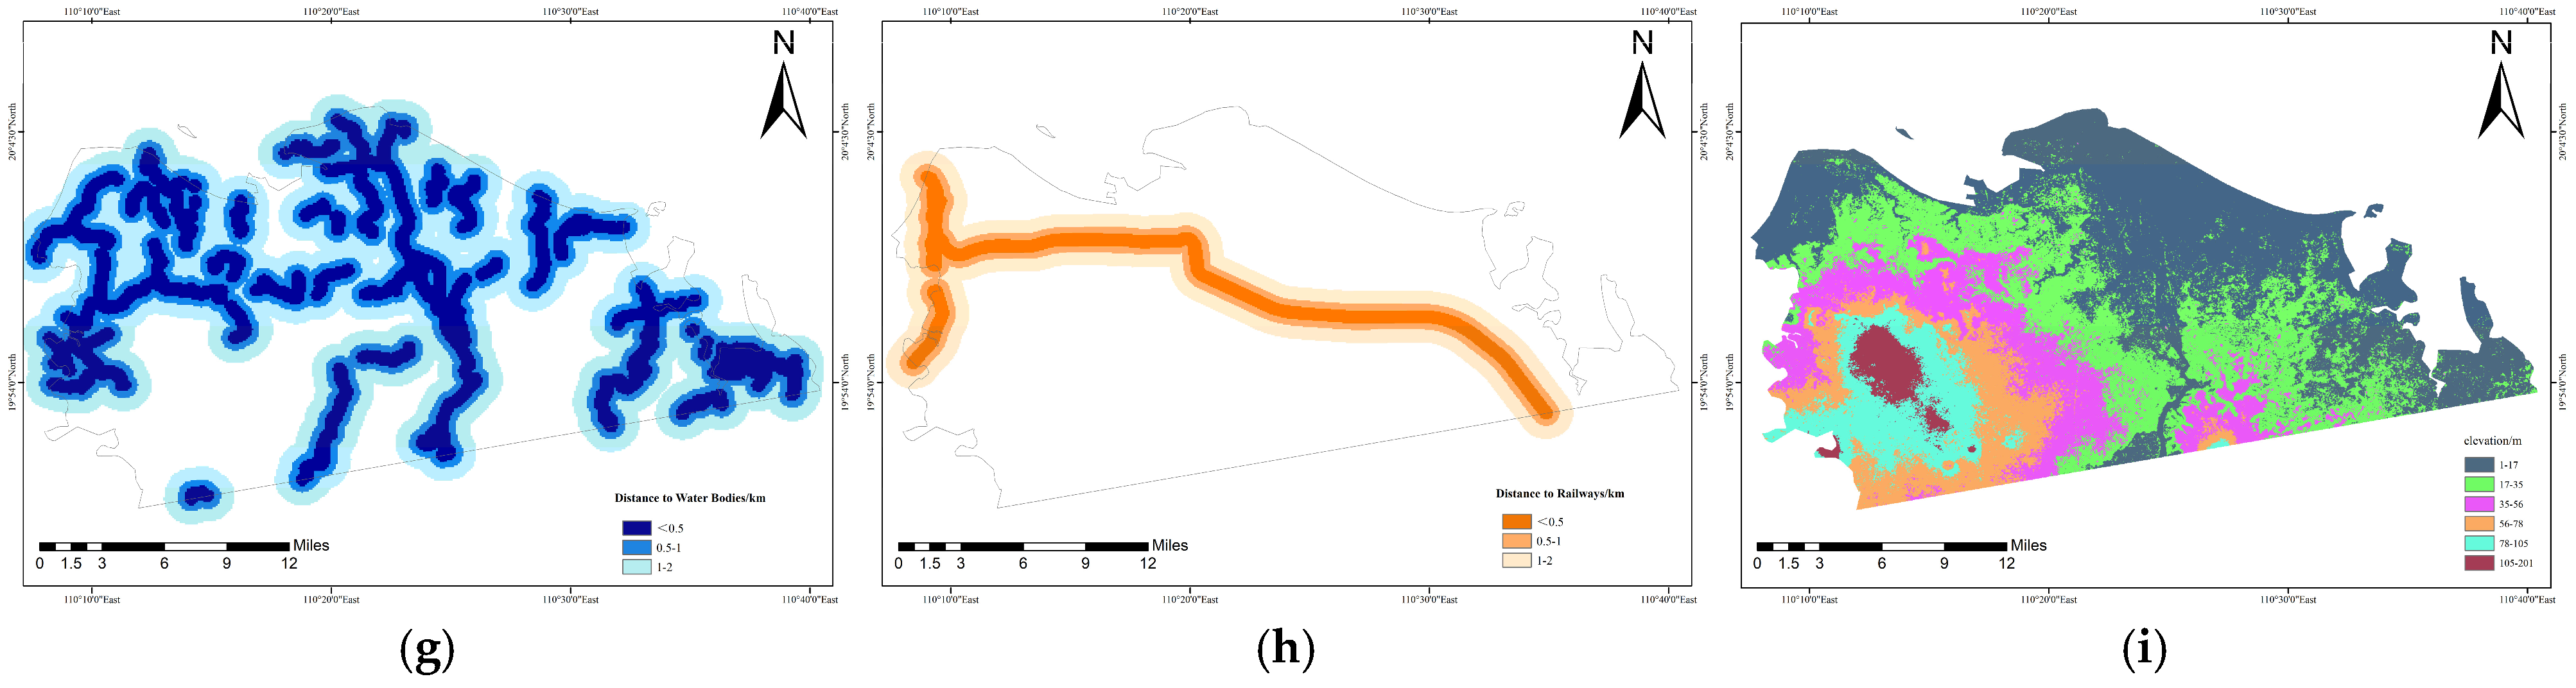
GeoDetector was employed to quantify the explanatory factors associated with spatial stratified heterogeneity in InSAR-derived LOS deformation. The annual mean LOS deformation velocity was used as the dependent variable Y (mm/y; negative values indicate negative LOS deformation anomalies). Nine candidate explanatory factors were considered: groundwater type (X1), water-yield property (X2), geological zoning (X3), human activity intensity (X4), road network density (X5), land-use intensity (X6), distance to water bodies (X7), distance to railways (X8), and elevation (X9). All factor layers were projected to a unified spatial reference system and aligned to the same analysis grid (cell size = 250 m). Point-based InSAR results were aggregated to this grid using the median LOS deformation velocity per cell; cells containing fewer than five InSAR points were excluded to reduce statistical instability.
For factor construction, OpenStreetMap (OSM) vector layers were converted into raster predictors using fixed, reproducible settings. Road network density (X5) was generated by kernel density estimation of OSM road polylines with highway tags including motorway, trunk, primary, secondary, tertiary, and residential roads, using a bandwidth/search radius of 1000 m and an output cell size consistent with the analysis grid. Distance to railways (X8) was derived from OSM railway features, and distance to water bodies (X7) was represented by Euclidean distance to OSM water features. These OSM-derived variables should be interpreted as spatial proxies for the urban-transport and surface-water setting during the study period rather than as fully time-resolved dynamic variables. Composite indices such as human activity intensity (X4) were constructed from OSM-derived density layers and normalized using min-max scaling to [0, 1]. Land-use intensity (X6) was derived by reclassifying land-use categories into ordinal intensity levels and resampling to the same grid. Spatial stratification maps of all nine factors are shown in Figure 12.
Figure 12.
Spatial stratification maps of nine explanatory factors for LOS deformation: (a) Groundwater type (X1); (b) water-yield property (X2); (c) geological zoning (X3); (d) human activity intensity (X4); (e) road network density (X5); (f) land-use intensity (X6); (g) distance to water bodies (X7); (h) distance to railways (X8); and (i) elevation (X9).
Prior to GeoDetector input, continuous explanatory variables were discretized using the natural breaks (Jenks) method with six strata (k = 6), while categorical variables retained their original classes. To avoid subjective tuning and ensure reproducibility, discretization quality was checked using an objective minimum-sample rule: if any stratum contained fewer than 1% of valid grid cells or fewer than 30 cells, it was merged with the nearest adjacent stratum iteratively until all strata met the minimum-sample criterion; the final breakpoints were then fixed for subsequent analyses.
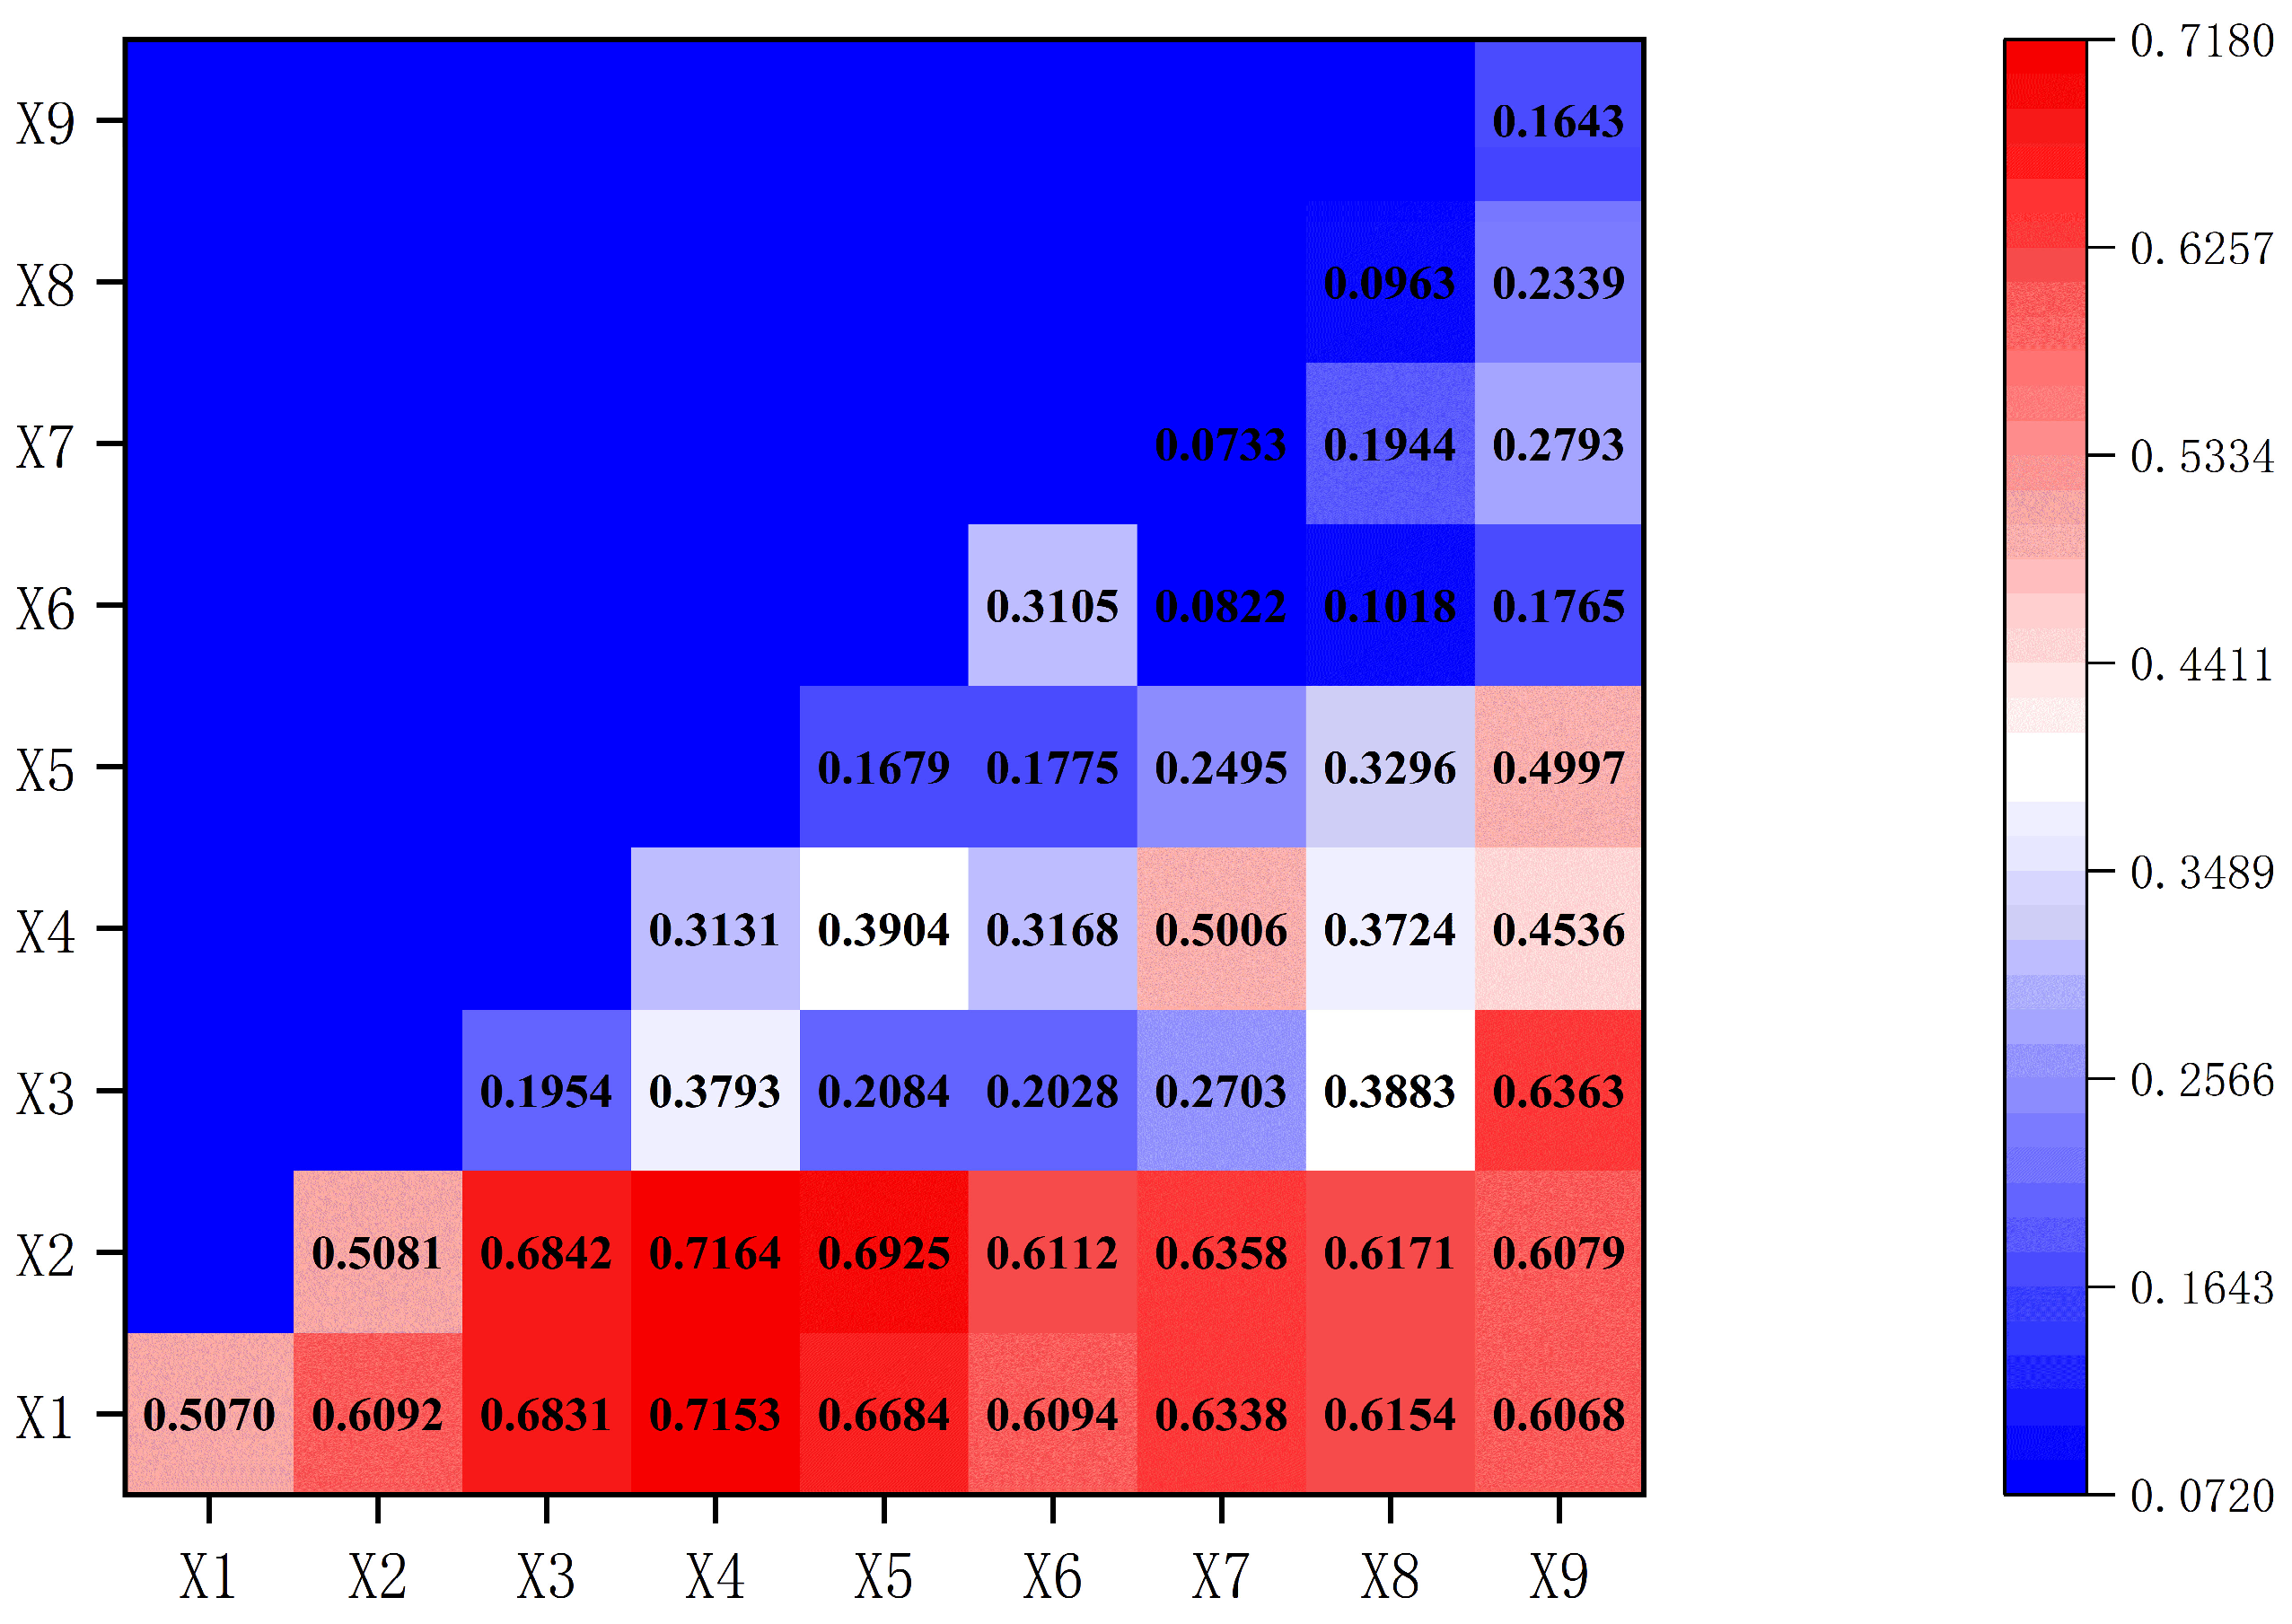
The factor detector was applied to obtain the q-statistic and associated p-value (significance level p < 0.05) for ranking the explanatory power of each factor. Statistical significance was evaluated using a permutation-based test with 999 random permutations: the dependent variable was randomly reassigned among grid cells while preserving factor stratification, and the p-value was computed as the proportion of permuted q-statistics greater than or equal to the observed q-statistic. The interaction detector was further used by overlaying two factors to evaluate whether their combined stratification increased explanatory power relative to each factor alone; interaction outcomes were reported as bivariate enhancement or nonlinear enhancement following standard GeoDetector criteria. The interaction heatmap is shown in Figure 13.
Figure 13.
Heatmap of interaction effects between explanatory factors based on GeoDetector analysis. Diagonal cells represent single-factor q-statistics from the factor detector, whereas off-diagonal cells represent two-factor interaction q-statistics obtained by overlaying paired factor strata.
The factor-detector results are summarized in Table 4. Water-yield property (X2; q = 0.5081) and groundwater type (X1; q = 0.5070) show the highest individual explanatory power, followed by human activity intensity (X4; q = 0.3131) and land-use intensity (X6; q = 0.3105). All nine factors are statistically significant at p ≤ 0.02; the p-values of X2 and X3 are 0.02, whereas those of the other factors are 0.01. These q-statistics correspond to the diagonal cells in Figure 13.
Table 4.
Factor-detector q-statistics and permutation-test p-values for the nine explanatory factors.
The interaction between geological zoning and elevation (X3 ∩ X9, q = 0.6363) is also prominent, indicating that topographic context may modulate geologically related deformation patterns. Although X7 and X8 show low individual q-values, their interactions with hydrogeological factors (e.g., X2 ∩ X7 = 0.6358, X1 ∩ X7 = 0.6338, X2 ∩ X8 = 0.6171, X1 ∩ X8 = 0.6154) exhibit nonlinear enhancement, suggesting that distance-related variables may act as conditional indicators whose relevance depends on the underlying hydrogeological environment rather than operating as independent drivers.
In contrast, several combinations (e.g., X6 ∩ X7, q = 0.0822; X6 ∩ X8, q = 0.1018; X5 ∩ X6, q = 0.1775; X6 ∩ X9, q = 0.1765) show limited improvement over individual factors, indicating weaker interaction effects under the adopted stratification scheme.
Overall, the GeoDetector results support a composite interpretation of Haikou’s LOS deformation pattern. Hydrogeological conditions (X1–X2) provide a primary spatial background, while development-related factors (X4–X6) and transportation density (X5) are associated with amplified negative LOS deformation when co-located with sensitive hydrogeological settings. These findings can inform spatially differentiated monitoring and risk management, while mechanism-level attribution should be further supported by site-specific evidence, such as hydrogeological observations and engineering records.
5. Discussion
5.1. Robustness and Spatial Meaning of the LOS Deformation Field
The combined PS- and DS-InSAR results reveal a spatially heterogeneous LOS deformation field in Haikou. The most robust feature is the recurrence of major negative LOS deformation anomalies in both processing streams, particularly in reclaimed coastal sectors, port-adjacent areas, and Jiangdong New District. The added value of DS-InSAR is demonstrated primarily by spatial coverage: DS-InSAR retained 764,573 valid points, approximately 2.80 times the PS-InSAR point count, and therefore provides a denser depiction of deformation domains in reclaimed, mixed land-cover, and relatively low-coherence areas. PS-InSAR, by contrast, provides stable measurements over strongly coherent built-up targets. Their collocated velocity agreement (R2 = 0.8048; RMSE = 0.569 mm/yr), the near-zero velocities of the reference sectors, and the independent SBAS/LiCSBAS processing-chain comparison with the main DS-InSAR result (R2 = 0.9879; RMSE = 0.192 mm/yr) jointly support the robustness of the relative LOS deformation pattern. These tests do not constitute independent ground validation, but they reduce the likelihood that the observed deformation pattern is merely a processing artifact.
5.2. Interpretation of Negative and Positive LOS Deformation Signals
The negative LOS deformation hotspots are mainly concentrated in zones where geomorphic and development conditions are consistent with subsidence-dominated processes, such as reclaimed coastal land, soft-deposit areas, and newly developed construction zones. In these areas, persistent negative LOS signals, basin-like spatial patterns, and their correspondence with intensive surface development provide contextual support for interpreting the anomalies as subsidence-dominated deformation. However, this interpretation remains conditional because the single ascending Sentinel-1 geometry does not allow the vertical and horizontal components to be separated. Therefore, negative LOS deformation is not treated as equivalent to pure vertical subsidence throughout the entire study area.
Positive LOS deformation signals are also present in the deformation field. Unlike the major negative hotspots, these positive signals are generally weaker, more scattered, and less spatially coherent. They do not form a continuous regional deformation belt and therefore should not be interpreted as confirmed uplift. Possible explanations include localized hydrological rebound, residual atmospheric or orbital artifacts, reference-point effects, local construction-related adjustment, or horizontal motion projected into the ascending LOS direction. Their presence partly explains the near-zero city-wide mean LOS velocity and highlights the need to interpret deformation patterns based on spatial persistence and local context rather than on mean values alone.
5.3. Hydrogeological Conditioning and Development Amplification
The spatial attribution results suggest that hydrogeological background variables, particularly groundwater type and aquifer water-yield property, have stronger explanatory power for the spatial distribution of LOS deformation than most development-related proxies. This does not prove a direct causal mechanism, but it indicates that the deformation pattern is spatially organized by hydrogeological heterogeneity. In other words, hydrogeological conditions appear to define the susceptibility background on which urban development processes operate.
Development-related variables, such as human activity intensity, road network density, and land-use intensity, show stronger explanatory value when combined with hydrogeological factors than when considered alone. This interaction pattern supports a “hydrogeologically conditioned and development-amplified” interpretation: coastal deposits and groundwater-related conditions provide the background susceptibility, while construction loading, surface hardening, drainage modification, and infrastructure development may amplify deformation where the subsurface is already sensitive. This interpretation is consistent with the spatial concentration of negative LOS hotspots in reclaimed and newly developed coastal sectors.
Nevertheless, the GeoDetector results should be interpreted as evidence of spatial association and interaction rather than as direct proof of process-level causality. Quantitative separation of groundwater withdrawal, soil consolidation, construction loading, and horizontal motion requires additional time-resolved hydrogeological and engineering observations.
5.4. Uncertainties, Limitations, and Future Work
Several limitations should be explicitly acknowledged. First, the deformation field was derived from a single ascending Sentinel-1 geometry. Therefore, the reported rates represent LOS deformation rather than a complete three-dimensional displacement field. Any interpretation in terms of subsidence-dominated deformation implicitly assumes that vertical motion is the primary component in the identified negative LOS hotspots, but this assumption cannot be fully verified without descending-track InSAR, GNSS, or leveling observations.
Second, no independent ground-based deformation measurements were available for the 2020–2025 study period. The PS-DS comparison, reference-area stability statistics, and independent SBAS/LiCSBAS processing-chain comparison demonstrate relative consistency of the LOS deformation field, but they do not constitute external validation of absolute deformation magnitude. Shared error sources, including atmospheric residuals, residual orbital ramps, phase-unwrapping errors, DEM-related errors, viewing-geometry limitations, and reference-point selection, may remain in Sentinel-1-derived products. Therefore, the absolute magnitude of deformation and its physical decomposition should be interpreted cautiously.
Third, the attribution analysis is based largely on spatial proxy variables derived from geological maps, hydrogeological classifications, DEM data, and OSM-based urban indicators. These variables are useful for identifying spatial stratified heterogeneity, but they cannot fully represent time-dependent processes such as groundwater-level fluctuations, staged construction loading, artificial fill consolidation, drainage changes, or temporal changes in the road and land-use network. As a result, the GeoDetector analysis quantifies spatial explanatory power and interaction patterns rather than direct causality.
Fourth, the GeoDetector results may be affected by the choice of analysis grid, discretization method, and factor classification. In this study, InSAR points were aggregated to a 250 m grid and continuous variables were discretized using the Jenks natural breaks method. Although minimum-sample rules were applied to avoid unstable strata, different grid sizes or discretization schemes may lead to variations in q-values and interaction strength. Future studies should test the sensitivity of attribution results to grid resolution and classification strategy.
Future work should integrate ascending and descending InSAR observations to better constrain vertical and horizontal deformation components. Independent GNSS, leveling, borehole stratigraphy, groundwater-level monitoring, and construction chronology data are also needed to validate the deformation magnitude and to quantify the relative contributions of hydrogeological conditions and development disturbance. Such data would enable a transition from spatial attribution toward more process-based modeling of coastal urban deformation.
6. Conclusions
This study characterized the spatiotemporal pattern of urban surface deformation in Haikou, China, during 2020–2025, by combining Sentinel-1A PS-InSAR and DS-InSAR time-series analysis with spatial attribution analysis. All deformation estimates were interpreted as line-of-sight (LOS) measurements derived from a single ascending viewing geometry.
The InSAR-derived LOS deformation field shows pronounced spatial heterogeneity. Major negative LOS deformation anomalies are concentrated in reclaimed coastal sectors, port-adjacent areas, and rapidly developing coastal districts, especially Jiangdong New District. In the most active hotspot, cumulative LOS displacement locally approaches 90 mm. These spatially persistent negative anomalies are interpreted as subsidence-dominated deformation only where supported by local geomorphic, hydrogeological, and development evidence.
The combined use of PS-InSAR and DS-InSAR improves the spatial characterization of deformation in complex coastal urban environments. Relative to PS-InSAR, DS-InSAR substantially increases the density and continuity of valid observations in reclaimed and low-coherence areas, while maintaining good internal consistency with collocated PS-InSAR estimates. The additional SBAS/LiCSBAS processing-chain comparison further confirms the stability of the main grid-scale LOS deformation pattern. Their joint application provides a more complete depiction of localized negative LOS anomalies and broader deformation domains, although these consistency checks do not replace independent ground validation.
Spatial attribution analysis indicates that hydrogeological background variables, especially groundwater type and aquifer water-yield property, show stronger explanatory power for the spatial distribution of LOS deformation than most development-related proxies. Human activity intensity, road network density, and land-use intensity are associated with stronger negative LOS deformation where hydrogeological conditions are susceptible. These results support a cautious interpretation that coastal urban deformation in Haikou is hydrogeologically conditioned and development-amplified, rather than being controlled by a single factor.
Taken together, the results indicate that Haikou’s coastal urban deformation should be interpreted as a spatially heterogeneous process associated with vulnerable coastal deposits, groundwater-related background conditions, and development-induced disturbance. Within the limitations of single-geometry InSAR and proxy-based spatial attribution, this study provides a basis for identifying priority monitoring zones, supporting groundwater-sensitive land development, and informing risk-aware infrastructure planning in rapidly urbanizing coastal cities.
Author Contributions
Conceptualization, Z.S. and J.H.; methodology, Z.S.; software, Z.S.; validation, Z.W. and K.W.; formal analysis, Z.S.; investigation, Y.Z.; resources, Z.W. and Y.Y.; data curation, Z.S.; writing—original draft preparation, Z.S.; writing—review and editing, J.H., K.W., Z.W., Y.Z. and Y.Y.; visualization, Z.S.; supervision, J.H.; project administration, J.H.; funding acquisition, J.H. All authors have read and agreed to the published version of the manuscript.
Funding
This research was funded by the Self-directed Research Fund of the State Key Laboratory of Tropic Ocean Engineering Materials and Materials Evaluation (No. STOEM99272619), the National Natural Science Foundation of China (No. 42467019), the High Technology Direction Project of the Key Research and Development Science and Technology of Hainan Province, China (No. ZDYF2024GXJS001), the Hainan Provincial Natural Science Foundation Enterprise Talent Project (No. 525QY918), and the 2025 Hainan Province Construction Science and Technology Program (No. 12).
Data Availability Statement
The original contributions presented in this study are included in the article. Further inquiries can be directed to the corresponding author.
Conflicts of Interest
Author Kai Wei is employed by China Railway Construction Urban Construction & Transportation Development Co., Ltd. Authors Zhixin Wang and Yongchang Yang are employed by Hainan Institute of Hydrogeology and Engineering Geology Survey Co., Ltd. The remaining authors declare that the research was conducted in the absence of any commercial or financial relationships that could be construed as a potential conflict of interest.
References
- Shirzaei, M.; Freymueller, J.; Törnqvist, T.E.; Galloway, D.L.; Dura, T.; Minderhoud, P.S.J. Measuring, Modelling and Projecting Coastal Land Subsidence. Nat. Rev. Earth Environ. 2021, 2, 40–58. [Google Scholar] [CrossRef] [Scilit]
- Syvitski, J.P.M.; Kettner, A.J.; Overeem, I.; Hutton, E.W.H.; Hannon, M.T.; Brakenridge, G.R.; Day, J.; Vörösmarty, C.; Saito, Y.; Giosan, L.; et al. Sinking Deltas Due to Human Activities. Nat. Geosci. 2009, 2, 681–686. [Google Scholar] [CrossRef] [Scilit]
- Bagheri-Gavkosh, M.; Hosseini, S.M.; Ataie-Ashtiani, B.; Sohani, Y.; Ebrahimian, H.; Morovat, F.; Ashrafi, S. Land Subsidence: A Global Challenge. Sci. Total Environ. 2021, 778, 146193. [Google Scholar] [CrossRef] [Scilit] [PubMed]
- Hasan, M.F.; Smith, R.; Vajedian, S.; Pommerenke, R.; Majumdar, S. Global Land Subsidence Mapping Reveals Widespread Loss of Aquifer Storage Capacity. Nat. Commun. 2023, 14, 6180. [Google Scholar] [CrossRef] [Scilit] [PubMed]
- Massonnet, D.; Feigl, K.L. Radar Interferometry and Its Application to Changes in the Earth’s Surface. Rev. Geophys. 1998, 36, 441–500. [Google Scholar] [CrossRef] [Scilit]
- Ferretti, A.; Prati, C.; Rocca, F. Permanent Scatterers in SAR Interferometry. IEEE Trans. Geosci. Remote Sens. 2002, 39, 8–20. [Google Scholar]
- Berardino, P.; Fornaro, G.; Lanari, R.; Sansosti, E. A New Algorithm for Surface Deformation Monitoring Based on Small Baseline Differential SAR Interferograms. IEEE Trans. Geosci. Remote Sens. 2003, 40, 2375–2383. [Google Scholar]
- Hooper, A.; Bekaert, D.; Spaans, K.; Arıkan, M. Recent Advances in SAR Interferometry Time Series Analysis for Measuring Crustal Deformation. Tectonophysics 2012, 514–517, 1–13. [Google Scholar] [CrossRef] [Scilit]
- Li, H.; Dong, J.; Wang, Y.; Liao, M. Monitoring Surface Deformation Using Distributed Scatterers InSAR. J. Geod. Geoinf. Sci. 2024, 7, 42–58. [Google Scholar] [CrossRef]
- Zhang, P.; Guo, Z.; Guo, S.; Xia, J. Land Subsidence Monitoring Method in Regions of Variable Radar Reflection Characteristics by Integrating PS-InSAR and SBAS-InSAR Techniques. Remote Sens. 2022, 14, 3265. [Google Scholar] [CrossRef] [Scilit]
- Wang, S.; Sun, H.; Wei, L.; Pi, P.; Zeng, M.; Pan, Y.; Xue, Z.; Jiang, X. Integrated Assessment of Coastal Subsidence in Nansha District, Guangzhou City, China: Insights from SBAS-InSAR Monitoring and Risk Evaluation. Remote Sens. 2024, 16, 248. [Google Scholar] [CrossRef] [Scilit]
- Yu, H.; Li, B.; Xiao, Y.; Sun, J.; Chen, C.; Jin, G.; Liu, H. Surface Subsidence over a Coastal City Using SBAS-InSAR with Sentinel-1A Data: A Case of Nansha District, China. Remote Sens. 2024, 16, 55. [Google Scholar] [CrossRef] [Scilit]
- Zheng, L.; Wang, Q.; Cao, C.; Shan, B.; Jin, T.; Zhu, K.; Li, Z. Development and Comparison of InSAR-Based Land Subsidence Prediction Models. Remote Sens. 2024, 16, 3345. [Google Scholar] [CrossRef] [Scilit]
- Li, H.; Zhu, L.; Dai, Z.; Gong, H.; Guo, T.; Guo, G.; Wang, J.; Teatini, P. Spatiotemporal Modeling of Land Subsidence Using a Geographically Weighted Deep Learning Method Based on PS-InSAR. Sci. Total Environ. 2021, 799, 149244. [Google Scholar] [CrossRef] [Scilit] [PubMed]
- Wang, Y.; Chen, X.; Wang, Z.; Gao, M.; Wang, L. Integrating SBAS-InSAR and Random Forest for Identifying and Controlling Land Subsidence and Uplift in a Multi-Layered Porous System of North China Plain. Remote Sens. 2024, 16, 830. [Google Scholar] [CrossRef] [Scilit]
- Cao, Q.; Zhang, Y.; Yang, L.; Chen, J.; Hou, C. Unveiling the Driving Factors of Urban Land Subsidence in Beijing, China. Sci. Total Environ. 2024, 916, 170134. [Google Scholar] [CrossRef] [Scilit] [PubMed]
- Wang, S.; Wang, G.; Huang, M.; Song, J.; Yang, X.; Zhang, T.; Ji, W.; Zhang, S.; Wu, W.; Wei, C.; et al. Spatio-Temporal Characteristics of Land Subsidence and Driving Factors Analysis in Shenzhen. Water 2024, 16, 1200. [Google Scholar] [CrossRef] [Scilit]
- He, Q.; Liu, H.; Wei, L.; Zhang, Z. Analysis of the Driving Factors for Land Subsidence in the Northern Anhui Plain: A Case Study of Bozhou City. Water 2025, 17, 1854. [Google Scholar] [CrossRef] [Scilit]
- Zhou, L.; Liang, L.; Chen, Q.; He, H.; Li, H.; Qin, J.; Yang, F.; Li, X.; Bai, J. Urban Land Subsidence Analyzed Through Time-Series InSAR Coupled with Refined Risk Modeling: A Wuhan Case Study. ISPRS Int. J. Geo-Inf. 2025, 14, 320. [Google Scholar] [CrossRef] [Scilit]
- Jiang, H.; Balz, T.; Cigna, F.; Tapete, D.; Li, J.; Han, Y. Multi-Sensor InSAR Time Series Fusion for Long-Term Land Subsidence Monitoring. Geo-Spat. Inf. Sci. 2024, 27, 1424–1440. [Google Scholar] [CrossRef] [Scilit]
- Rafiei, F.; Gharechelou, S.; Golian, S.; Johnson, B.A. Aquifer and Land Subsidence Interaction Assessment Using Sentinel-1 Data and DInSAR Technique. ISPRS Int. J. Geo-Inf. 2022, 11, 495. [Google Scholar] [CrossRef] [Scilit]
- Tay, C.; Lindsey, E.O.; Chin, S.T.; McCaughey, J.W.; Bekaert, D.; Nguyen, M.; Hua, H.; Manipon, G.; Karim, M.; Horton, B.P.; et al. Sea-Level Rise from Land Subsidence in Major Coastal Cities. Nat. Sustain. 2022, 5, 1049–1057. [Google Scholar] [CrossRef] [Scilit]
- Chen, Y.; Ding, K.; Wang, S.; Du, P. A Novel High-Precision Method for Surface Deformation Extraction from Time-Series InSAR Using Spatiotemporal Multiscale Decomposition. IEEE Trans. Geosci. Remote Sens. 2025, 63, 5219424. [Google Scholar] [CrossRef] [Scilit]
- Lima, T.A.S.; Vassileva, M.S.; Xia, Z.; Simões, S.J.C. Beyond Salt Mining: Urban Subsidence Hotspots Characterization in Maceió (Brazil), 2016–2024. Remote Sens. 2025, 17, 3974. [Google Scholar] [CrossRef] [Scilit]
- Gao, M.; Gong, H.; Chen, B.; Li, X.; Zhou, C.; Shi, M.; Si, Y.; Chen, Z.; Duan, G. Regional Land Subsidence Analysis in Eastern Beijing Plain by InSAR Time Series and Wavelet Transforms. Remote Sens. 2018, 10, 365. [Google Scholar] [CrossRef] [Scilit]
- Chen, F.; Zhou, W.; Xu, H.; Parcharidis, I.; Lin, H.; Fang, C. Space Technology Facilitates the Preventive Monitoring and Preservation of the Great Wall of the Ming Dynasty: A Comparative Study of the Qingtongxia and Zhangjiakou Sections in China. IEEE J. Sel. Top. Appl. Earth Obs. Remote Sens. 2020, 13, 5719–5729. [Google Scholar] [CrossRef] [Scilit]
- Gharechaee, H.; Samani, A.N.; Sigaroodi, S.K.; Baloochiyan, A.; Moosavi, M.S.; Hubbart, J.A.; Sadeghi, S.M.M. Land Subsidence Susceptibility Mapping Using Interferometric Synthetic Aperture Radar (InSAR) and Machine Learning Models in a Semiarid Region of Iran. Land 2023, 12, 843. [Google Scholar] [CrossRef] [Scilit]
- Wu, Z.; Zhang, X.; Cai, J.; Kwan, M.-P.; Lin, H.; Ma, P. Understanding Spatially Nonstationary Effects of Natural and Human-Induced Factors on Land Subsidence Based on Multi-Temporal InSAR and Multi-Source Geospatial Data: A Case Study in the Guangdong-Hong Kong-Macao Greater Bay Area. Int. J. Digit. Earth 2023, 16, 4404–4427. [Google Scholar] [CrossRef] [Scilit]
- Righini, M.; Bonì, R.; Sapio, S.; Gatti, I.; Salvadore, M.; Taramelli, A. Development of a Proof-of-Concept A-DInSAR-Based Monitoring Service for Land Subsidence. Remote Sens. 2024, 16, 1981. [Google Scholar] [CrossRef] [Scilit]
- Alatza, S.; Apostolakis, A.; Loupasakis, C.; Kontoes, C.; Kokkalidou, M.; Bartsotas, N.S.; Christopoulos, G. Harnessing InSAR and Machine Learning for Geotectonic Unit-Specific Landslide Susceptibility Mapping: The Case of Western Greece. Remote Sens. 2025, 17, 1161. [Google Scholar] [CrossRef] [Scilit]
- Wang, J.; Li, X.; Christakos, G.; Liao, Y.; Zhang, T.; Gu, X.; Zheng, X. Geographical Detectors-Based Health Risk Assessment and Its Application in the Neural Tube Defects Study of the Heshun Region, China. Int. J. Geogr. Inf. Sci. 2010, 24, 107–127. [Google Scholar] [CrossRef] [Scilit]
- Wang, J.-F.; Zhang, T.-L.; Fu, B.-J. A Measure of Spatial Stratified Heterogeneity. Ecol. Indic. 2016, 67, 250–256. [Google Scholar] [CrossRef] [Scilit]
- Song, Y.; Wang, J.; Ge, Y.; Xu, C. An Optimal Parameters-Based Geographical Detector Model Enhances Geographic Characteristics of Explanatory Variables for Spatial Heterogeneity Analysis: Cases with Different Types of Spatial Data. GISci. Remote Sens. 2020, 57, 593–610. [Google Scholar] [CrossRef] [Scilit]
- Ribeiro, M.T.; Singh, S.; Guestrin, C. “Why Should I Trust You?”: Explaining the Predictions of Any Classifier. In Proceedings of the 22nd ACM SIGKDD International Conference on Knowledge Discovery and Data Mining; ACM: San Francisco, CA, USA, 2016; pp. 1135–1144. [Google Scholar]
- Lundberg, S.M.; Lee, S.-I. A Unified Approach to Interpreting Model Predictions. In Proceedings of the 31st International Conference on Neural Information Processing Systems, Long Beach, CA, USA, 4–9 December 2017; Volume 30. [Google Scholar]

Disclaimer/Publisher’s Note: The statements, opinions and data contained in all publications are solely those of the individual author(s) and contributor(s) and not of MDPI and/or the editor(s). MDPI and/or the editor(s) disclaim responsibility for any injury to people or property resulting from any ideas, methods, instructions or products referred to in the content. |
© 2026 by the authors. Licensee MDPI, Basel, Switzerland. This article is an open access article distributed under the terms and conditions of the Creative Commons Attribution (CC BY) license.