Technical Note

Recommendations for Low-Noise Data Acquisition with UAV-Mounted Multi-Channel Magnetometer Systems


1
Bavarian State Department for Monuments and Sites (BLfD), Hofgraben 4, 80539 Munich, Germany
2
Geophysics Department of Earth and Environmental Sciences, Ludwig-Maximilians-Universität München (LMU), Theresienstrasse 41, 80333 Munich, Germany
3
ArchaeoTask, Carl Benz Strasse 7, 78234 Engen, Germany
*
Author to whom correspondence should be addressed.
Remote Sens. 2026, 18(15), 2564; https://doi.org/10.3390/rs18152564
Submission received: 16 June 2026 / Revised: 30 July 2026 / Accepted: 30 July 2026 / Published: 4 August 2026

Highlights

What are the main findings?
  • UAV-based multi-channel magnetometry is an efficient and highly flexible surveying method that enables measurements at headings and velocities previously not possible using conventional magnetic surveying techniques.
  • Compared to ground-based approaches, UAV magnetometry is more susceptible to noise, partly because the UAV platform itself acts as a noise source and amplifier.
What are the implications of the main findings?
  • A carefully designed data acquisition strategy is essential, and following the proposed recommendations can significantly reduce noise levels.
  • Despite its operational efficiency, UAV magnetometry is not a plug-and-play technique and requires substantial expert knowledge in acquisition and data processing.

Abstract

We present the results of tests conducted with a state-of-the-art drone-based multi-channel magnetometer system (SENSYS MagDrone R4) developed for efficient high-resolution near-surface surveys. The primary aim is to advance the application of this technology in proximal sensing and to identify acquisition strategies capable of achieving data quality comparable to that of established ground-based magnetometer surveys. The system is evaluated under varying operational conditions, with particular emphasis on the influence of flight altitude, heading, velocity, and UAV platform characteristics on magnetic data quality. Signal properties are analyzed using power spectral methods to identify and quantify platform- and survey-related sources of interference. The results reveal the noise sources and amplifiers affecting UAV-based magnetic measurements and demonstrate how survey design can substantially increase the signal-to-noise ratio. Based on these findings, practical recommendations for data acquisition and processing are proposed, contributing to the development of best-practice guidelines for high-resolution archeological, explosive ordnance (EO), and other near-surface magnetic survey applications.

1. Introduction

Magnetometer surveying is a widely used geophysical method for measuring and mapping variations in the ambient magnetic field, thereby producing magnetic field maps, commonly referred to as magnetograms, that resolve anomalies associated with magnetic or magnetized objects. The versatility of this technique has led to applications in a remarkably broad range of spatial scales, from imaging of magnetite nanoparticles in brain tissue [1] to satellite-based investigations of the Earth’s magnetic field at the planetary scale (e.g., [2]). This adaptability, together with its non-invasive nature and exceptional sensitivity to subtle magnetic anomalies, has made magnetometer surveying an indispensable tool not only in geophysical prospection but also in a wide range of other disciplines.
The techniques used to conduct measurements are just as diverse as the applications of magnetometers. In the proximal, ground-based survey, magnetometer arrays are deployed either as person-portable systems or as towed configurations mounted on vehicles (e.g., all-terrain vehicles). These setups provide high spatial resolution (effectively ≤0.5 m) and facilitate the detection of comparatively small anomalous bodies, including archeological structures [3,4] and ferromagnetic objects such as explosive ordnance (EO) and unexploded ordnance (UXO), as well as related remnants [5].
At greater sensor altitudes—typically exceeding 100 m above ground level, such as in airborne surveys—the detection of these small-scale features decreases significantly. Nevertheless, aeromagnetic surveys remain highly effective for the detection and structural characterization of large-scale geological features [6,7]. With the advent of high-performance and cost-effective unmanned aerial vehicles (UAVs), aeromagnetic surveys can now be conducted with substantially greater operational efficiency. Unlike crewed fixed-wing aircraft or helicopters, UAV platforms can operate at very low altitudes, often near the ground surface [8]. By reducing the sensor-to-target distance, UAV-based magnetometry bridges the gap between airborne and ground-based surveys and enables applications that were previously reserved primarily for ground-based (g-b) magnetometry. In recent years, a marked increase in the application of UAV-magnetometry for high-resolution surveys has been observed, particularly in EO detection [9,10] and archeological prospection [11,12,13].
Although UAV-based magnetometer surveying demonstrates considerable efficiency advantages over established g-b methods—and is often considered indispensable in difficult terrain [14] or heavily EO-contaminated areas [15]—it also introduces a range of technical challenges and unanswered methodological questions. The primary challenge arises from the UAV platform itself, which can influence magnetic measurements in multiple aspects. These include magnetic and electromagnetic interference generated by on-board components, such as electric motors [16], as well as the amplification of external temporal disturbances originating from infrastructure, including power transmission networks and railway systems [17,18]. In addition, the accuracy and reliability of UAV-based magnetometry remain constrained by limitations in flight control and navigation performance. Deviations from planned flight trajectories and variations in sensor altitude can significantly affect survey data quality and survey repeatability. Although approaches exist to improve UAV performance—such as 3D light detection and range (LiDAR)-based, forward-looking terrain sensing for adaptive control during automated flight [19]—these advanced systems remain complex and costly. Up to now, they have not matched the robustness and cost efficiency of established hub solutions, such as the UgCS SkyHub 2 combined with the NR24 nanoradar altimeter, which was used in the system presented and operated in this study (Figure 1).
Magnetometers in drone-based (d-b) systems navigate through space at high speed and therefore require much higher sampling rates (~100 Hz to 1000 Hz) than commonly employed in g-b surveys (~10 Hz to 100 Hz) to achieve comparable in-line spatial resolution. This also increases sensitivity to a broad spectrum of electromagnetic, mechanical, and kinematic disturbances. Noise sources that are often negligible or undersampled in conventional g-b surveys may become significant components of the recorded signal. In this study, we therefore address the fundamental questions: What types of interference occur during d-b magnetic surveys, how do they affect data quality, and how can they be avoided?
Signal processing of high-sampling-rate magnetometers in near-surface applications has traditionally received limited attention within archeogeophysics and EO detection. Research has historically focused on practical survey applications using magnetometers operating at comparatively low sampling rates. As a result, interferences occurring within a broader frequency range have remained underexplored. The archeogeophysicist Irwin Scollar, for example, addressed the importance of magnetic noise in his work and distinguished between spatially correlated noise, such as soil noise, and uncorrelated noise, such as uncompensated micropulsations of the Earth’s magnetic field (e.g., as a result of solar storms) [3,20]. High-resolution UAV-based magnetometry may introduce additional sources of interference and necessitate a renewed examination of potential noise sources and their impact on survey data.
For g-b magnetometer surveys, both the EO detection community and the field of archeological prospection have several established standards and guidelines (e.g., for EO/UXO detection [21], and for archeological surveys [22]). Currently, no accepted guidelines exist for UAV-based magnetometry in archeological prospection. For d-b EO surveys, an initial draft for guidelines has been proposed addressing important aspects [23]. However, the authors of the first version themselves emphasize that these guidelines require further refinement.
Given the current state of hardware, one of the most pressing challenges is optimizing survey operations. Experiences from ground-based magnetometry have demonstrated that carefully designed acquisition strategies can substantially improve data quality while reducing subsequent processing requirements. Although several approaches to optimizing flight parameters for high-resolution UAV-based magnetic surveys have been proposed, they either focus primarily on geological applications [24,25] or remain largely conceptual, supported by only limited empirical evidence [26].
In light of the ongoing revision of the EAC guidelines for archeological geophysics by the International Society of Archeological Prospection (ISAP), the present study investigates key aspects in high-resolution, near-surface d-b measurements, aiming to identify and mitigate interference frequencies through survey design and operational parameter optimization, with the ultimate goal of improving data quality.

2. Methodology and Approach

The primary objective of our approach is to evaluate UAV-based/d-b test measurements by comparing them with “traditional” g-b survey results, which are regarded as representing optimal reference conditions. To isolate and quantify individual noise contributions, the drone-mounted magnetometer system is also operated independently of the UAV in both person-portable and stationary configurations, enabling the separation of disturbances originating from the ambient magnetic environment from those introduced by the UAV platform itself.

2.1. Test Site

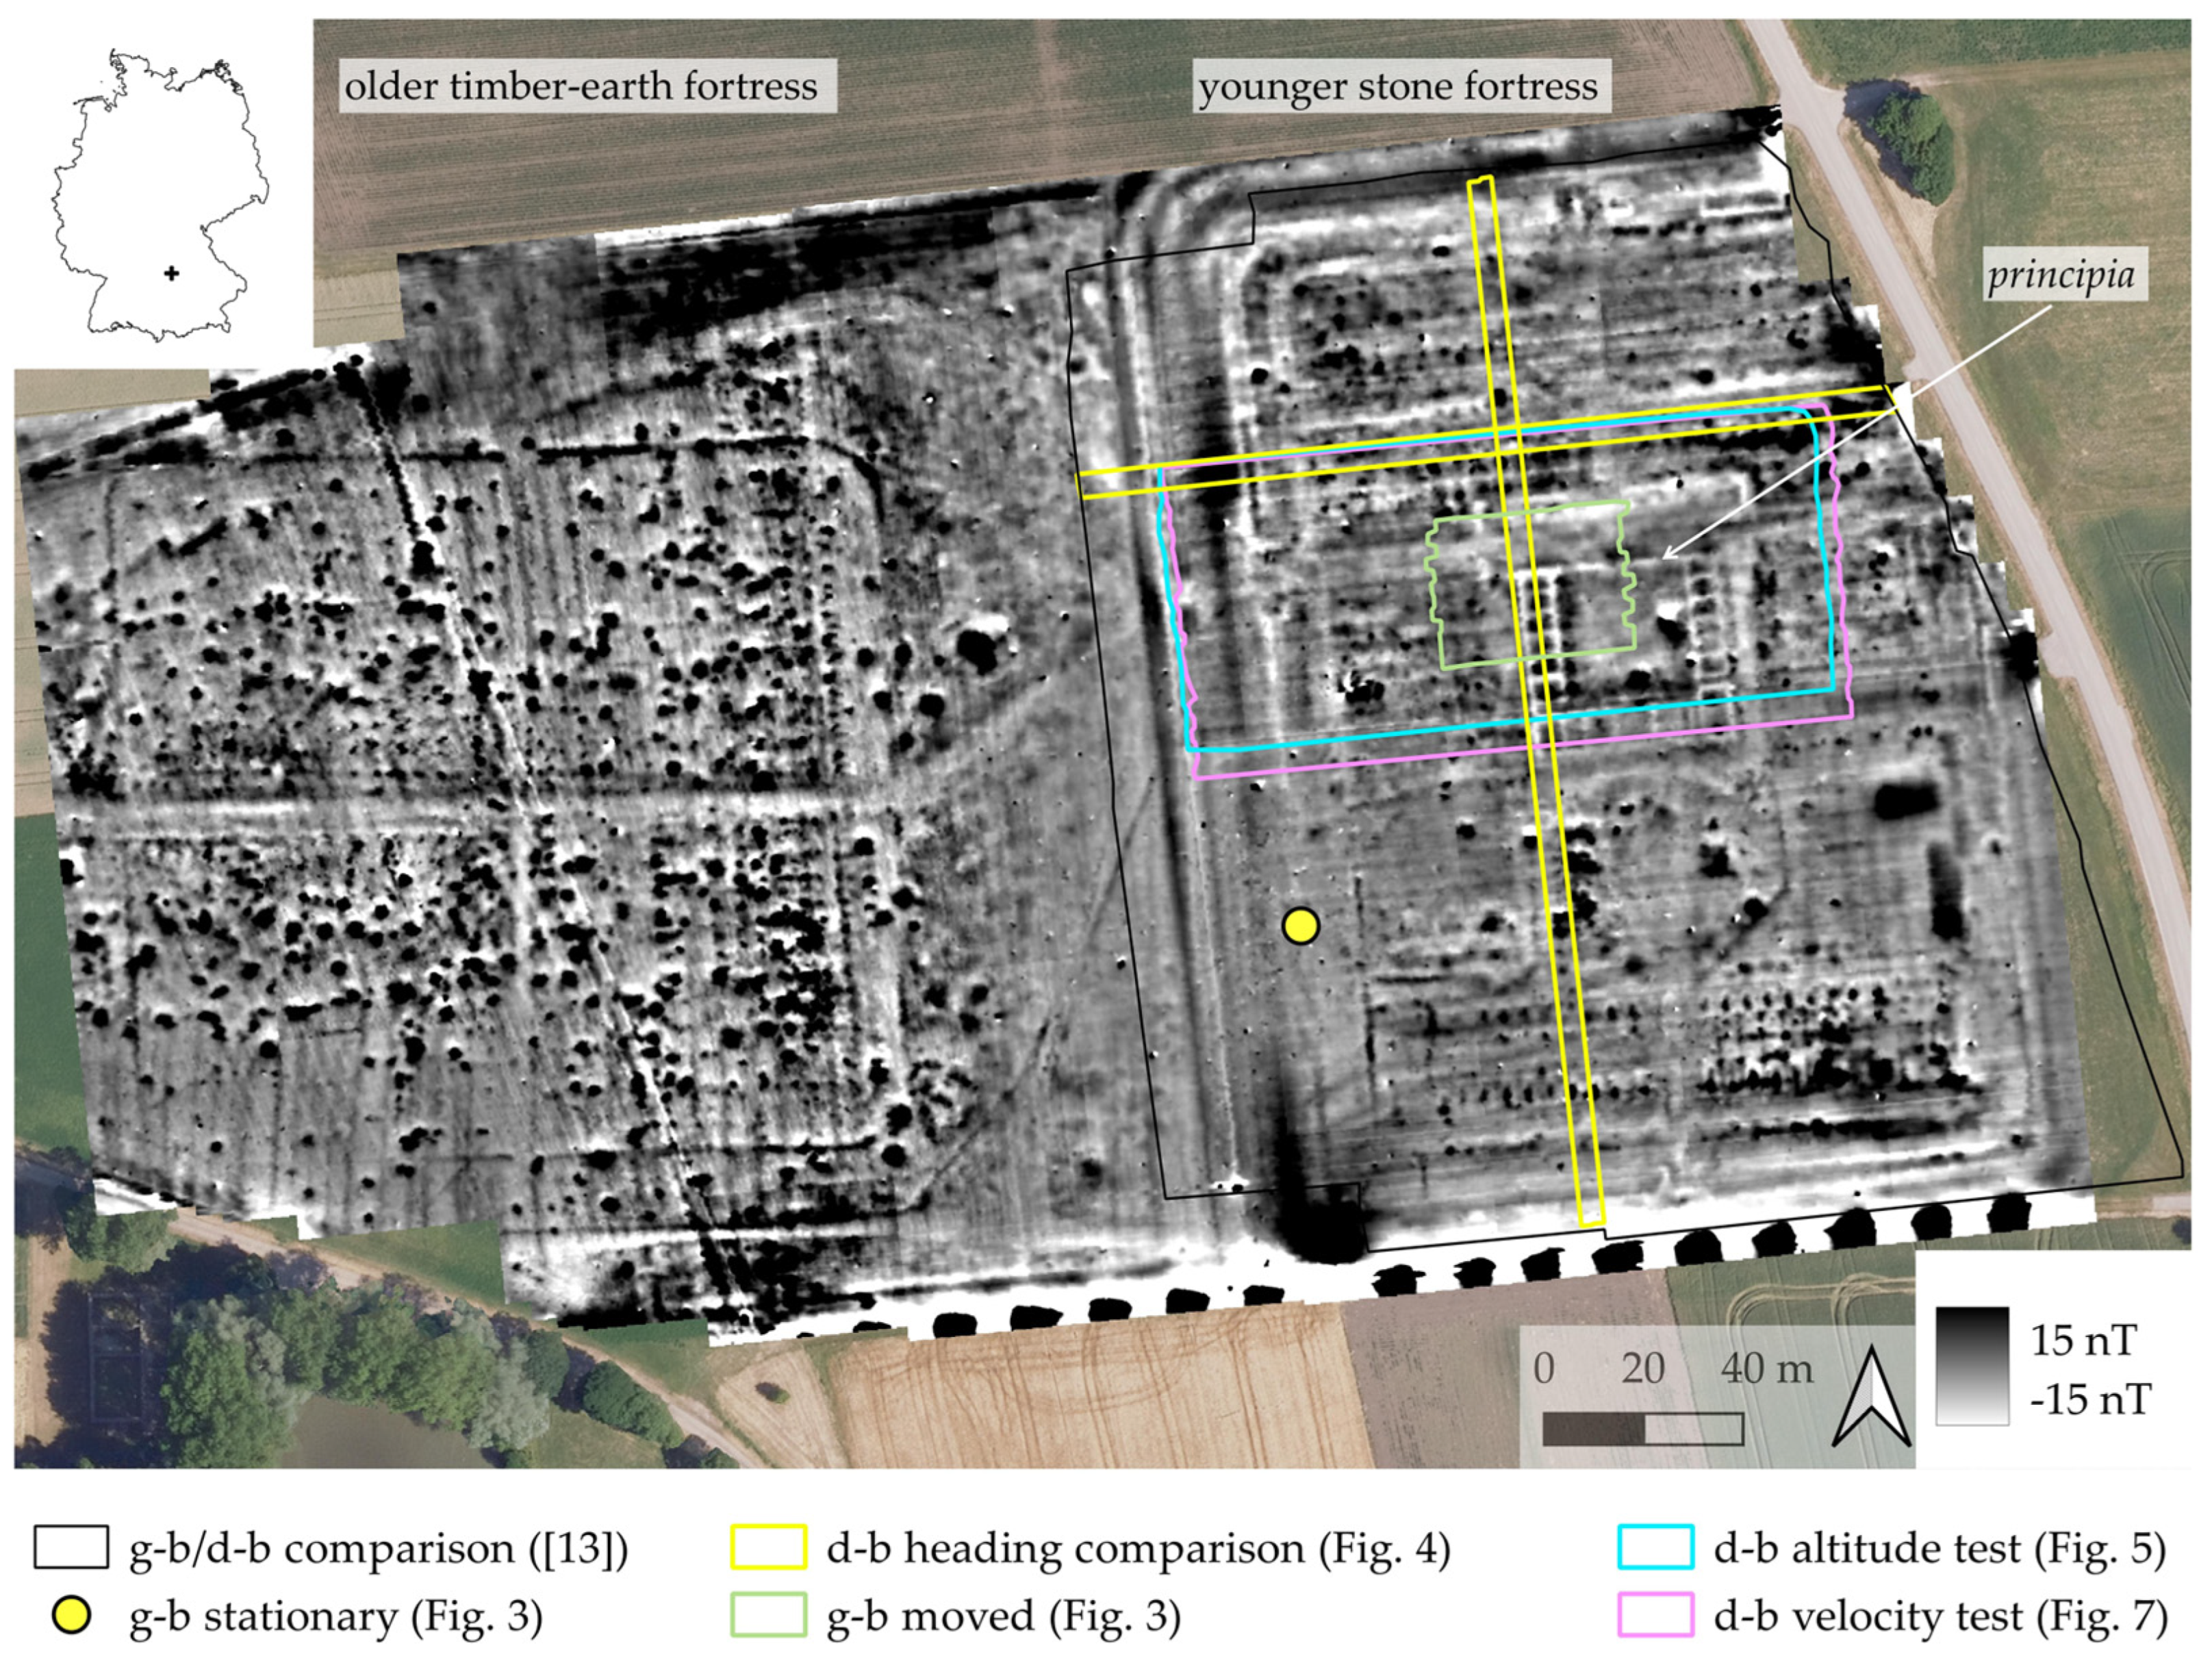
The data presented here originate from several test campaigns conducted between 2022 and 2025 at our test site, the Roman fort Iciacum in Theilenhofen in Middle Franconia (Bavaria, Germany) (Figure 2). Theilenhofen has been extensively investigated using archeological geophysics over the past few decades. It is divided into an older timber-earth fortress in the west and a younger stone-built fortress in the east. From a remote sensing perspective, the site is well-documented, with numerous aerial images available, particularly from periods when the area was under cultivation. Today, the area of the stone fortress is used as grassland and is therefore accessible throughout much of the year. Due to higher anomaly variability and favorable accessibility, test measurements were conducted within this part of the site, primarily in the northwestern area of the principia. More detailed information on the archeological context can be found in the works of Eidam [27], Reuter [28] and Fassbinder [29].
Historical and archeological sources indicate that the stone fortress was destroyed by fire. Also, the high magnetic susceptibilities of the topsoil, on the order of 10−3 SI, support this interpretation and provide in situ evidence for strong magnetic contrasts in the subsurface (after [3]). Therefore, the site is well-suited for magnetic prospection in general, and particularly for investigating our research questions and objectives, as the local ambient magnetic field and the archeological targets are well constrained by numerous magnetic base measurements, d-b and g-b magnetometer surveys, and their comparisons [13,29], as well as by complementary d-b and g-b ground-penetrating radar surveys and tests [30].

2.2. System Set-Up

The tests presented in this study were conducted using the commercial SENSYS MagDrone R4 system, SENSYS GmbH, Bad Saarow, Germany (R4) (Figure 1), which has become one of the most widely used platforms for high-resolution UAV-based near-surface magnetic prospection in recent years. Although the results presented here are derived solely from the Theilenhofen test site, they reflect more than five years of operational experience with the system. The R4 comprises five three-axis magnetometers spaced at 50 cm intervals on a rigid rod and mounted directly on the landing gear of commercially available real-time kinematic (RTK) enabled UAV platforms (e.g., DJI M300/350/400, Da-Jiang Innovations Science and Technology Co., Ltd., Shenzhen, China) [31]. The area progress and survey resolution are particularly noteworthy: the R4 multichannel array records five measurement profiles simultaneously, enabling the efficient coverage of a survey strip/path at least 2.5 m wide in a single flight line. Within this strip, a very high spatial sampling density of up to 0.01 × 0.5 m can be achieved at a flight speed of 2 m/s, which is particularly advantageous for near-surface applications.
The array is rigidly mounted to the drone’s landing gear, allowing its position to be controlled much more precisely than that of suspended magnetometer systems. In archeological surveying and ordnance detection, this combination of high survey efficiency, spatial resolution, and positional accuracy represents a decisive practical advantage.
The three-axis sensors of the R4 record the magnetic field along three perpendicular axes, from which the total field intensity (F) is calculated during post-processing [32]. After filtering in the SENSYS MagDrone DataTool (Version 03.03-02/00) software, where a frequency-based smoothing filter was combined with a constant median filter for Theilenhofen data, the geocoded total field anomaly measurements, expressed in nanotesla (nT), were interpolated into raster datasets using QGIS (Version 3.44.12) to generate magnetograms comparable to those derived from conventional g-b total-field magnetometer surveys [13]. For the visualization of magnetometer survey data in magnetograms, we preferentially use greyscale representations, as the human eye exhibits a higher resolution limit for achromatic patterns [33].
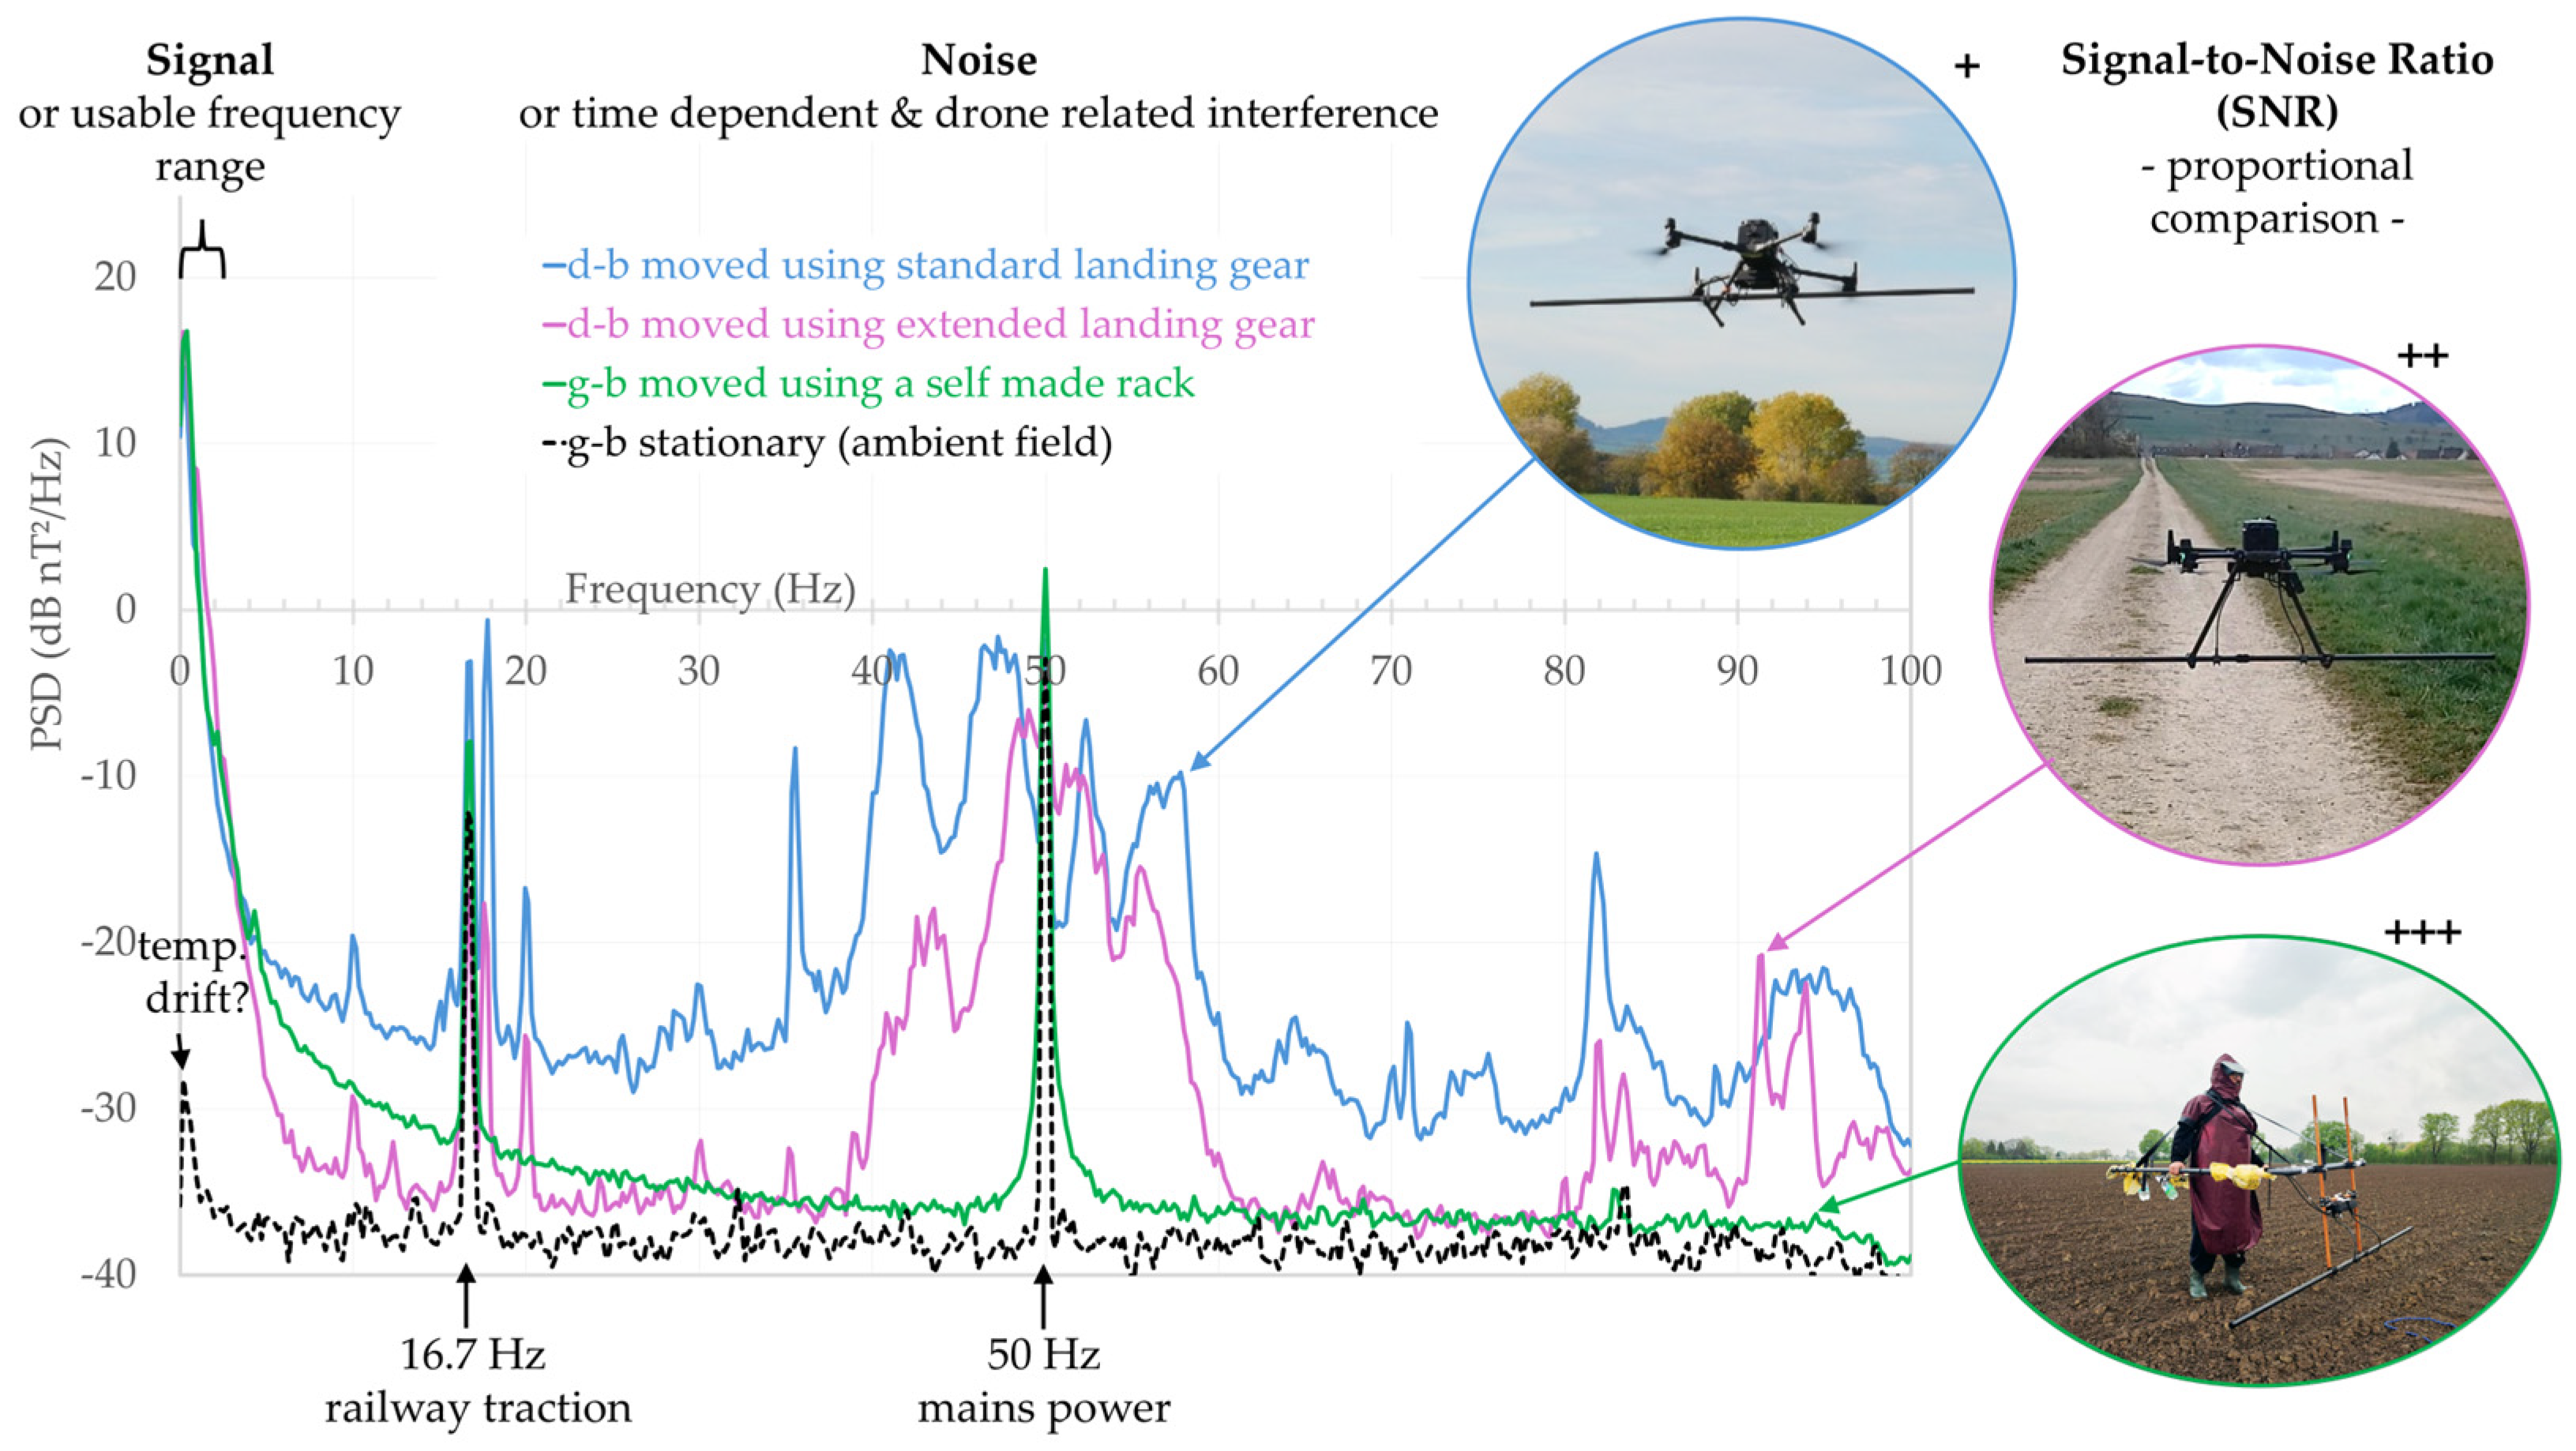
Compared with sensor systems suspended several meters below the UAV on ropes or other flexible mounts, rigid platform–sensor configurations such as the R4 exhibit higher noise levels due to the shorter distance between the magnetometers and the aircraft. However, they offer improved performance in terms of operational handling, stability, and survey efficiency [24,34]. It has previously been demonstrated that a simple extension of the landing gear, effectively doubling the distance between the magnetometer array and the UAV platform, can result in a significant reduction in noise levels [35] (Figure 3). Consequently, while the findings presented here are broadly relevant to UAV magnetometry, they are particularly applicable to rigid platform–sensor systems.

2.3. Data Processing

To identify and characterize signal components, interference frequencies, and other spectral contributions, frequency-domain analyses are performed using Fourier-transform-based methods [20]. Power spectral density (PSD) estimates are calculated from raw and filtered magnetometer data using Welch’s method [36]. For this, the time series is divided into overlapping segments, each of which is detrended and tapered using a von Hann window. A discrete Fourier transform is computed for each segment, and the resulting spectra are normalized by sampling frequency and window energy before being averaged. The PSD is finally expressed on a logarithmic scale (10·log10) as a function of frequency up to the Nyquist limit (1/2 of the sampling frequency). Note that the data acquired during dynamic measurements, in which the magnetometers are operated in motion, include partially overlapping trajectories, while turning maneuvers are excluded.
In addition, the resulting magnetograms are also evaluated comparatively in QGIS. To ensure comparability and facilitate quantitative comparison, for example, by calculating difference raster grids, all magnetograms are generated using identical processing parameters, particularly with respect to spatial resolution and trend filtering.
For the velocity tests, the Fourier transforms, which exclusively represent the frequency components of the signal, are complemented by continuous wavelet transforms (CWT). The resulting wavelet scalograms (time–frequency matrices) enable improved localization of transient features associated with archeological objects or EO targets by preserving temporal information and introducing an additional physically interpretable dimension. The applied CWT is based on the Morlet wavelet [37]. The CWT was adapted to represent the usable frequency range. This frequency range was isolated and enhanced using a bandpass filter with defined low- (0.05 Hz) and high-cut (5 Hz) frequencies. Subsequently, the complete Nyquist frequency spectrum was calculated and plotted over the frequency range from 0.1 to 5 Hz. Prior to the transformation, the data were corrected for offsets through mean removal and detrended to reduce drift effects and isolate the relevant signals. Logarithmic frequency scaling was applied to improve the visibility of spectral features.

3. Results

3.1. Characteristic PSD Components

Before presenting and discussing the resulting power spectra of the magnetometer measurements, a note on the sensitivity of the PSD estimations should be made. In this context, the key question is at what difference in spectral energy in power can be regarded as significant. Back-calculations indicate that a difference of 1 dB corresponds approximately to a magnetic field intensity difference of a factor of 1.122. Given the pronounced magnetic susceptibility contrasts and the resulting archeological anomalies of up to ±80 nT observed at the Theilenhofen test site, the PSD approach can be considered sufficiently sensitive for the intended analyses.
Figure 3 shows mean PSDs derived from stacked raw R4 data recorded by all five sensors in Theilenhofen using three different platform–sensor configurations along several identical survey profiles. For comparison, a PSD of a stationary drift measurement was included (dashed black line), representing the ambient field and instrument-related noise. Latter reveals a minor peak of approximately 5 dB in the frequency range between 0 and 0.5 Hz (Figure 3), which is potentially related to temperature-dependent instrument drift. Consequently, robust statements can only be made for R4 spectral power levels exceeding this 5 dB threshold. The fundamental conclusion of the comparison of the platforms is that the R4 system, when operated without a UAV (green curve), exhibits a substantially higher signal-to-noise ratio (SNR) in the same frequency ranges as when mounted on a drone. Comparing the two UAV-based measurements with (purple) and without extended landing gear (blue curve), it becomes evident that by increasing the distance between the magnetometer system and the drone significantly improves the SNR.
Spikes and peaks indicate the frequencies and frequency bands at which periodic oscillations occur within the recorded magnetic signal. For all moving platform configurations, spectral contributions exceeding 0 dB are concentrated in a frequency range from approximately 0 to 3 Hz, corresponding to the DC and ultra-low-frequency domains, which are dominated by static and quasi-static magnetic fields. In this band, the spectral curves and power values of all three platforms are broadly similar, as they were acquired over the same area of the site, hence the same range of archeological features. Since the small contribution of the platform/UAV to the static field is compensated for in the plot of the mean PSDs, it is no longer visible in Figure 3. This frequency range is therefore interpreted as containing signals that are relevant for the detection and characterization of anomalous subsurface objects, henceforth referred to as usable frequency or signal range.

3.2. Sources of Noise and Filtering Strategies

Within the frequency range between 3 and 100 Hz, the two d-b platforms exhibit substantially higher noise levels compared with the g-b measurements (Figure 3). The g-b data shows distinctive spectral spikes at two prominent frequencies: 16.7 Hz, corresponding to the railway traction current, and 50 Hz, corresponding to the mains power frequency. In the d-b derived PSDs, numerous additional spectral peaks and spikes are present, many of them occurring in the vicinity of the spikes. This indicates the existence of platform-related or platform-amplified sources of interference that are largely absent during conventional ground-based surveys.
Survey design and area layouts are planned according to the shape and characteristics of the targeted area. In g-b surveys, survey design is typically constrained by surface conditions. For example, survey lines are commonly oriented parallel rather than perpendicular to plow furrows to avoid vibrations that may adversely affect both data quality and operator performance. In UAV-based magnetic prospection, by contrast, while the geometry of the survey area remains an important consideration, surface conditions exert only a minor influence on survey planning, so that flight trajectories can generally be designed independently of ground roughness and other surface obstacles. In contrast to g-b surveys (see, for example, [38]), and despite the internal heading compensation of modern three-axis sensors, the orientation of the sensor relative to the geomagnetic field direction remains important for obtaining accurate measurements [39].
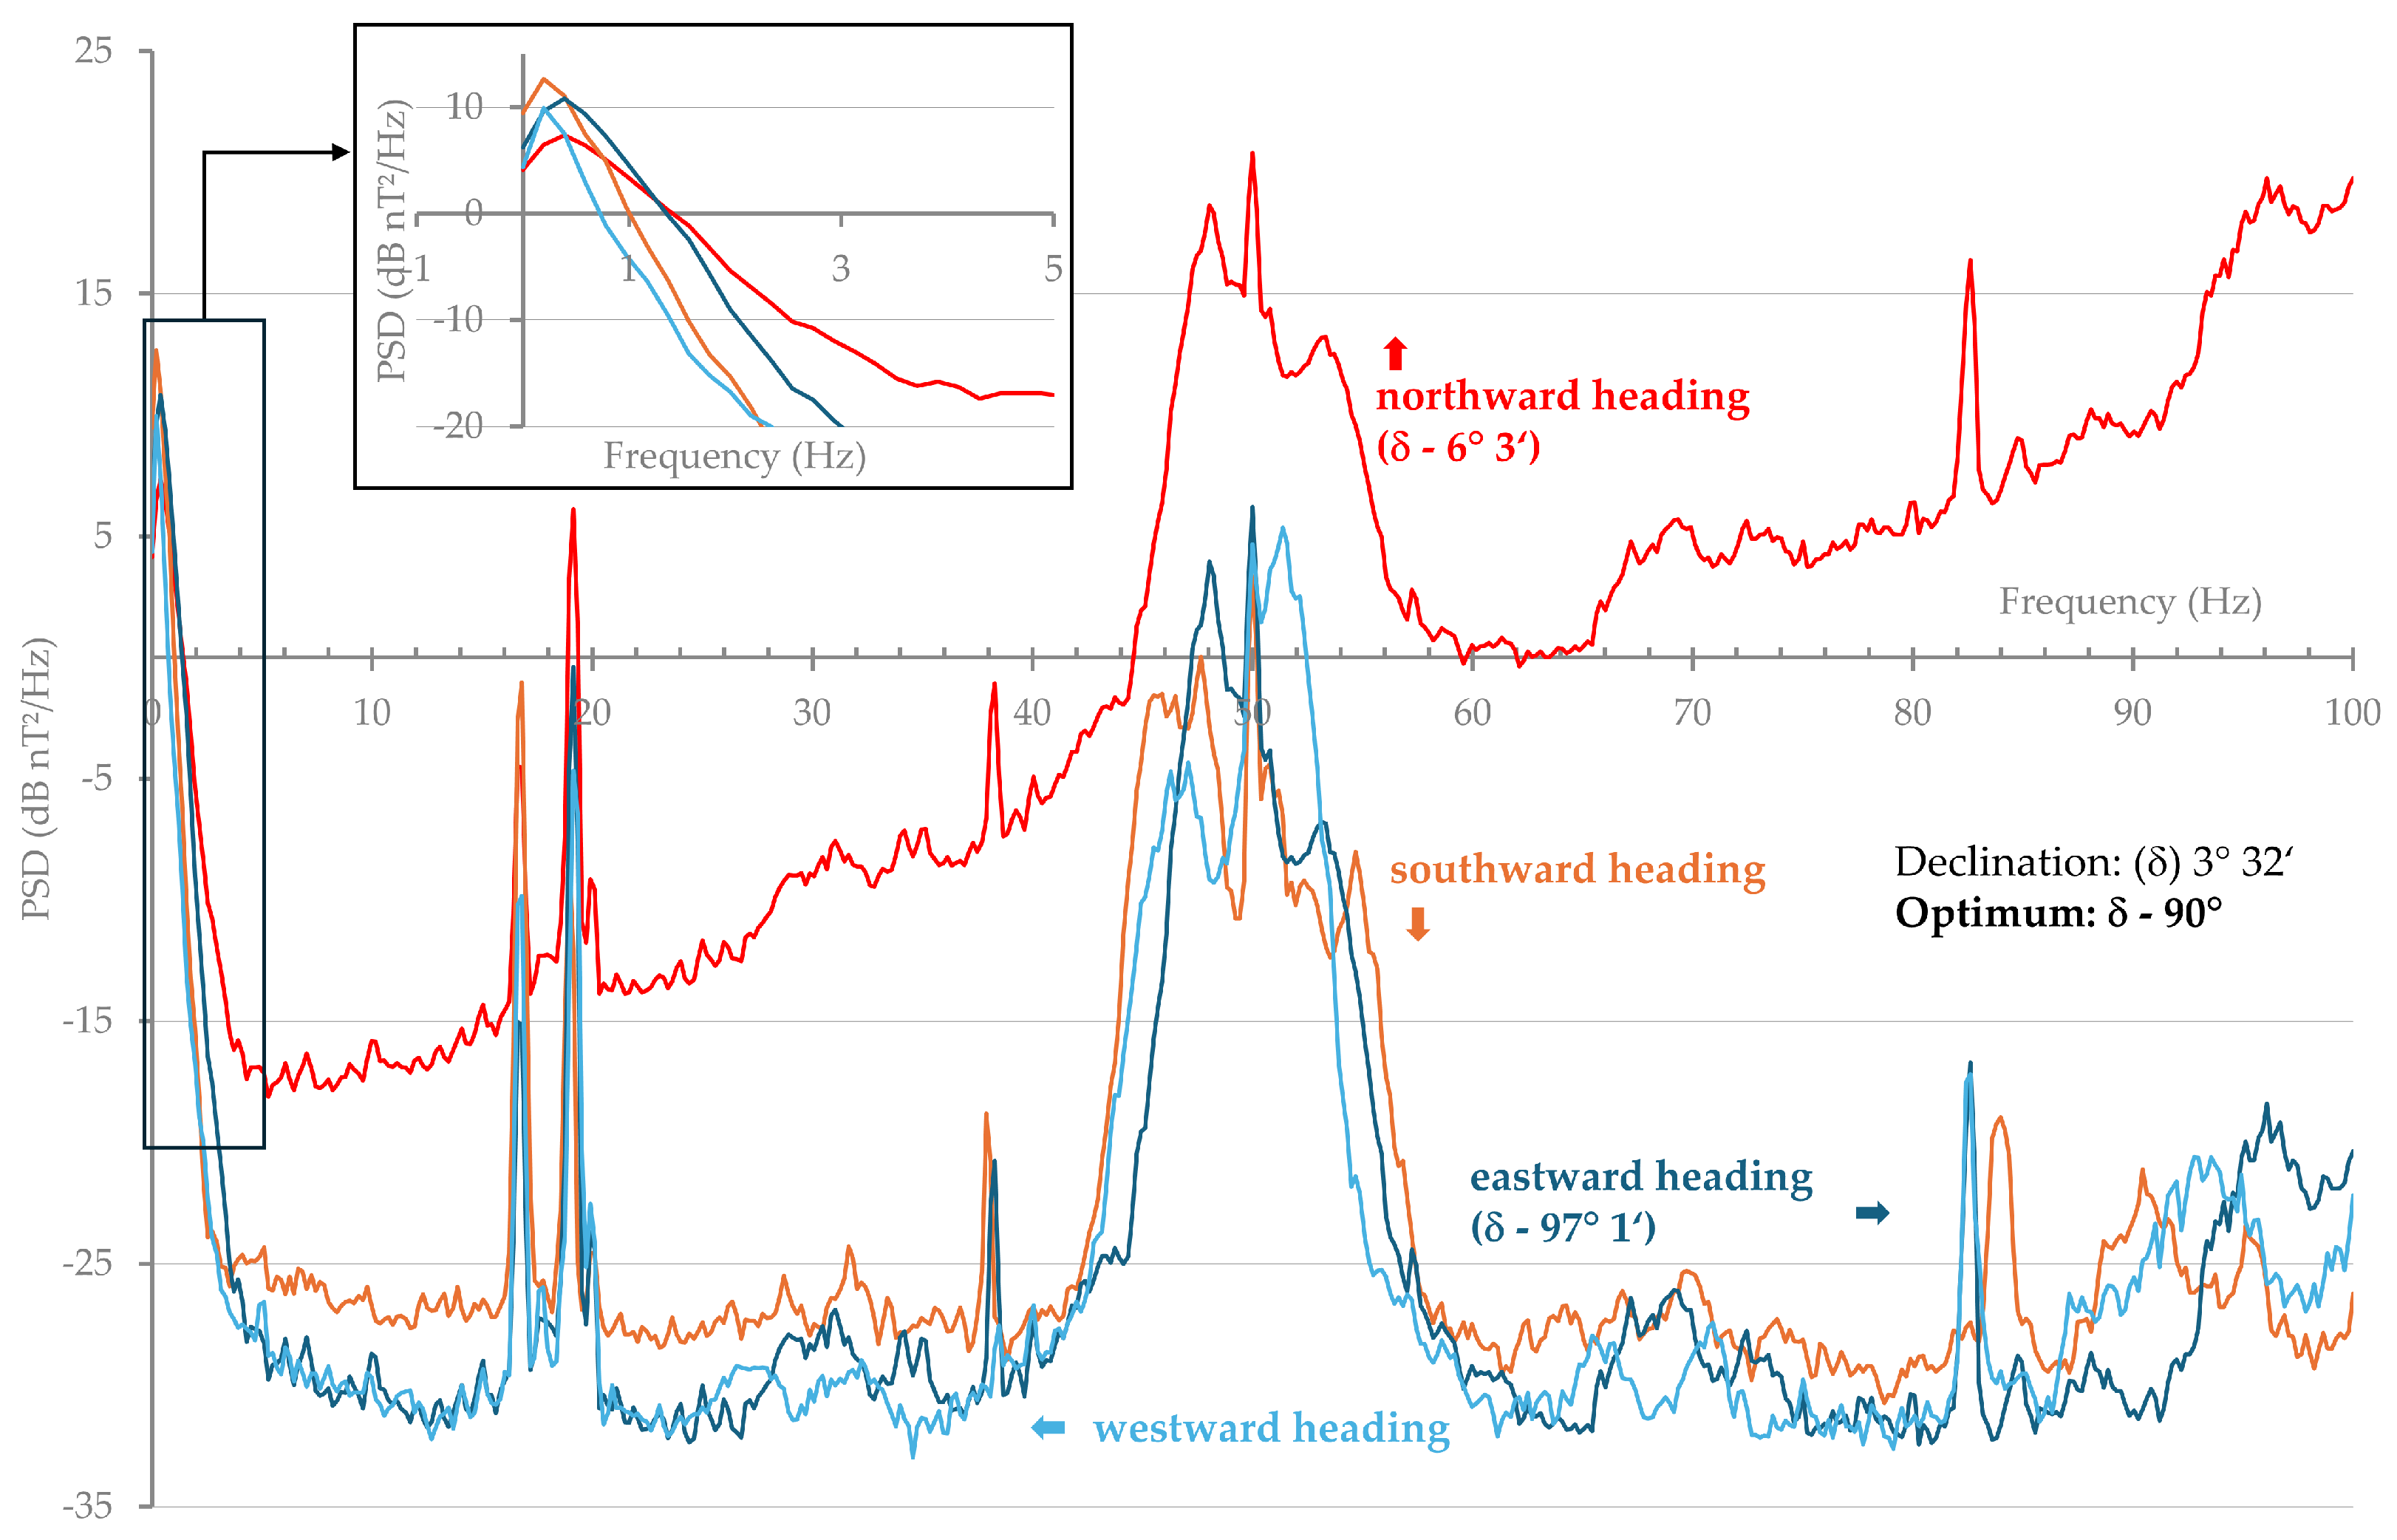
To investigate the influence of sensor orientation and flight direction on magnetometer noise levels, a series of test flights was conducted in Theilenhofen along approximately east–west and north–south trajectories. Figure 4 presents the corresponding PSDs for the four cardinal directions. The results indicate that the two east–west flight directions, approximately orthogonal to the prevailing geomagnetic field vector in Central Europe, yield nearly identical PSDs. Although the southward flight direction produces a comparable spectral pattern, noise levels are moderately elevated between 3 and 50 Hz. The northward flight direction, however, exhibits markedly higher spectral power across virtually the entire frequency range above 3 Hz and is accompanied by a slight reduction in spectral power within the usable frequency range (see inset in Figure 4). Heading-dependent noise effects have also been reported for terrestrial magnetometer systems, although typically with considerably lower amplitudes than those observed in the UAV-based measurements. The asymmetry between northward and southward headings suggests interaction between the UAV platform and the ambient geomagnetic field, resulting in heading-dependent platform noise or the amplification of existing disturbances. This interpretation is further supported by the observation that the lowest noise levels occur when the sensor array is oriented approximately perpendicular to the direction of the regional geomagnetic field.
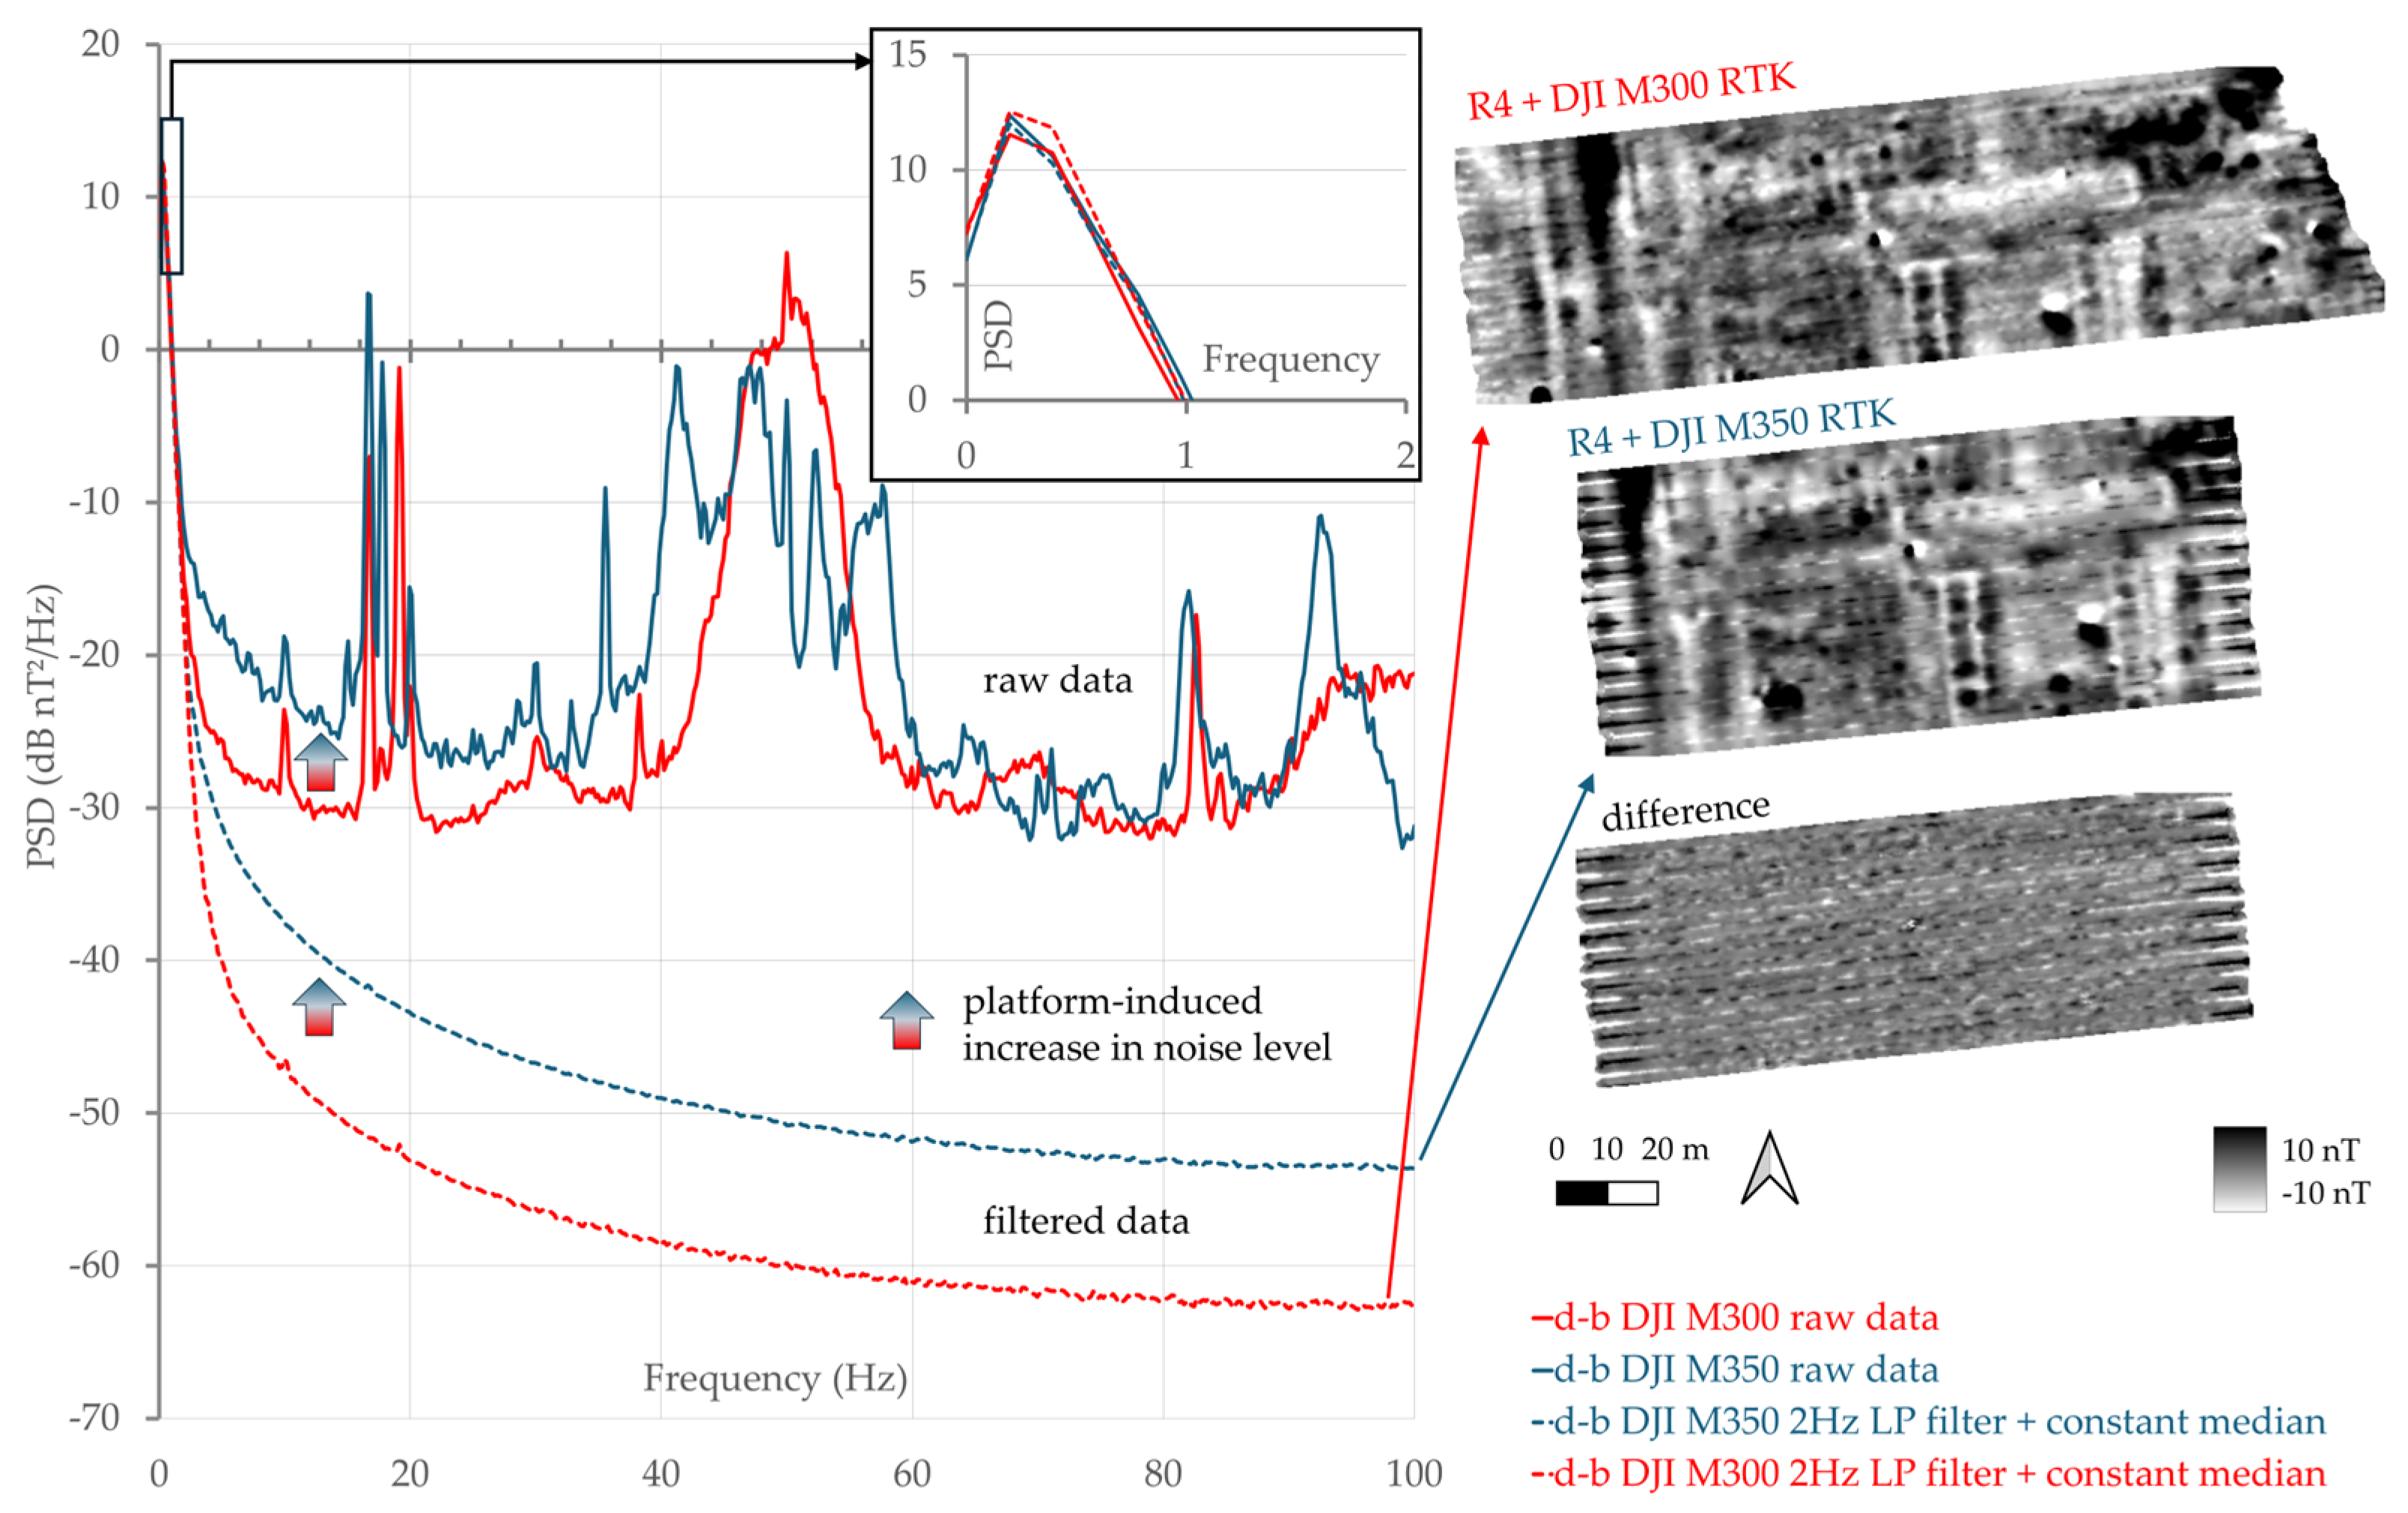
Due to the involvement of different project partners, two UAV platforms were used during the test campaigns. While earlier data were acquired with the DJI M300 RTK (M300), more recent test measurements were conducted using its successor, the DJI M350 RTK (M350). Despite identical setup and flight parameters (the same flight altitude, velocity, and heading), the two UAV platforms exhibited noticeably different interference behaviors.
Figure 5 shows the comparison of two test flights conducted with both UAV platforms in Theilenhofen. The M350 exhibits substantially higher noise levels than the M300, as evident in both the raw and filtered datasets. The application of a Hodrick–Prescott low-pass filter with a cutoff frequency of 2 Hz [41] largely compensates for the noise increase, which reaches up to 8 dB in the unfiltered data. Nevertheless, residual interferences remain within the usable frequency range below 2 Hz and appear as a slight, though not significant, reduction in spectral power in the M350 spectrum (Figure 5, inset). The elevated noise level of the M350 is also visible in the resulting magnetograms, where it manifests as striping artifacts. These artifacts are particularly pronounced along the track of the third sensor and become most apparent at flight-line transitions. However, they are also present throughout the dataset and can be clearly identified in the corresponding difference raster grid.
In addition to the filter combinations presented here, all available filtering options provided by the SENSYS MagDrone DataTool were evaluated [41]; however, none produced improved PSD results or magnetograms. Consequently, all subsequent datasets presented in this study were processed using the Hodrick–Prescott cutoff and constant median filter combination described above. However, our experience shows that a constant median is effective only in low-noise ambient fields. In most cases, the constant median filter must be replaced with a moving median filter. Although the moving median filter generally provides more effective spatial trend filtering, inappropriate parameterization, in particular short window lengths, can suppress signal contributions and thereby reduce anomaly intensities of the usable signal (see also [13]).

3.3. Influence of the Flight Altitude

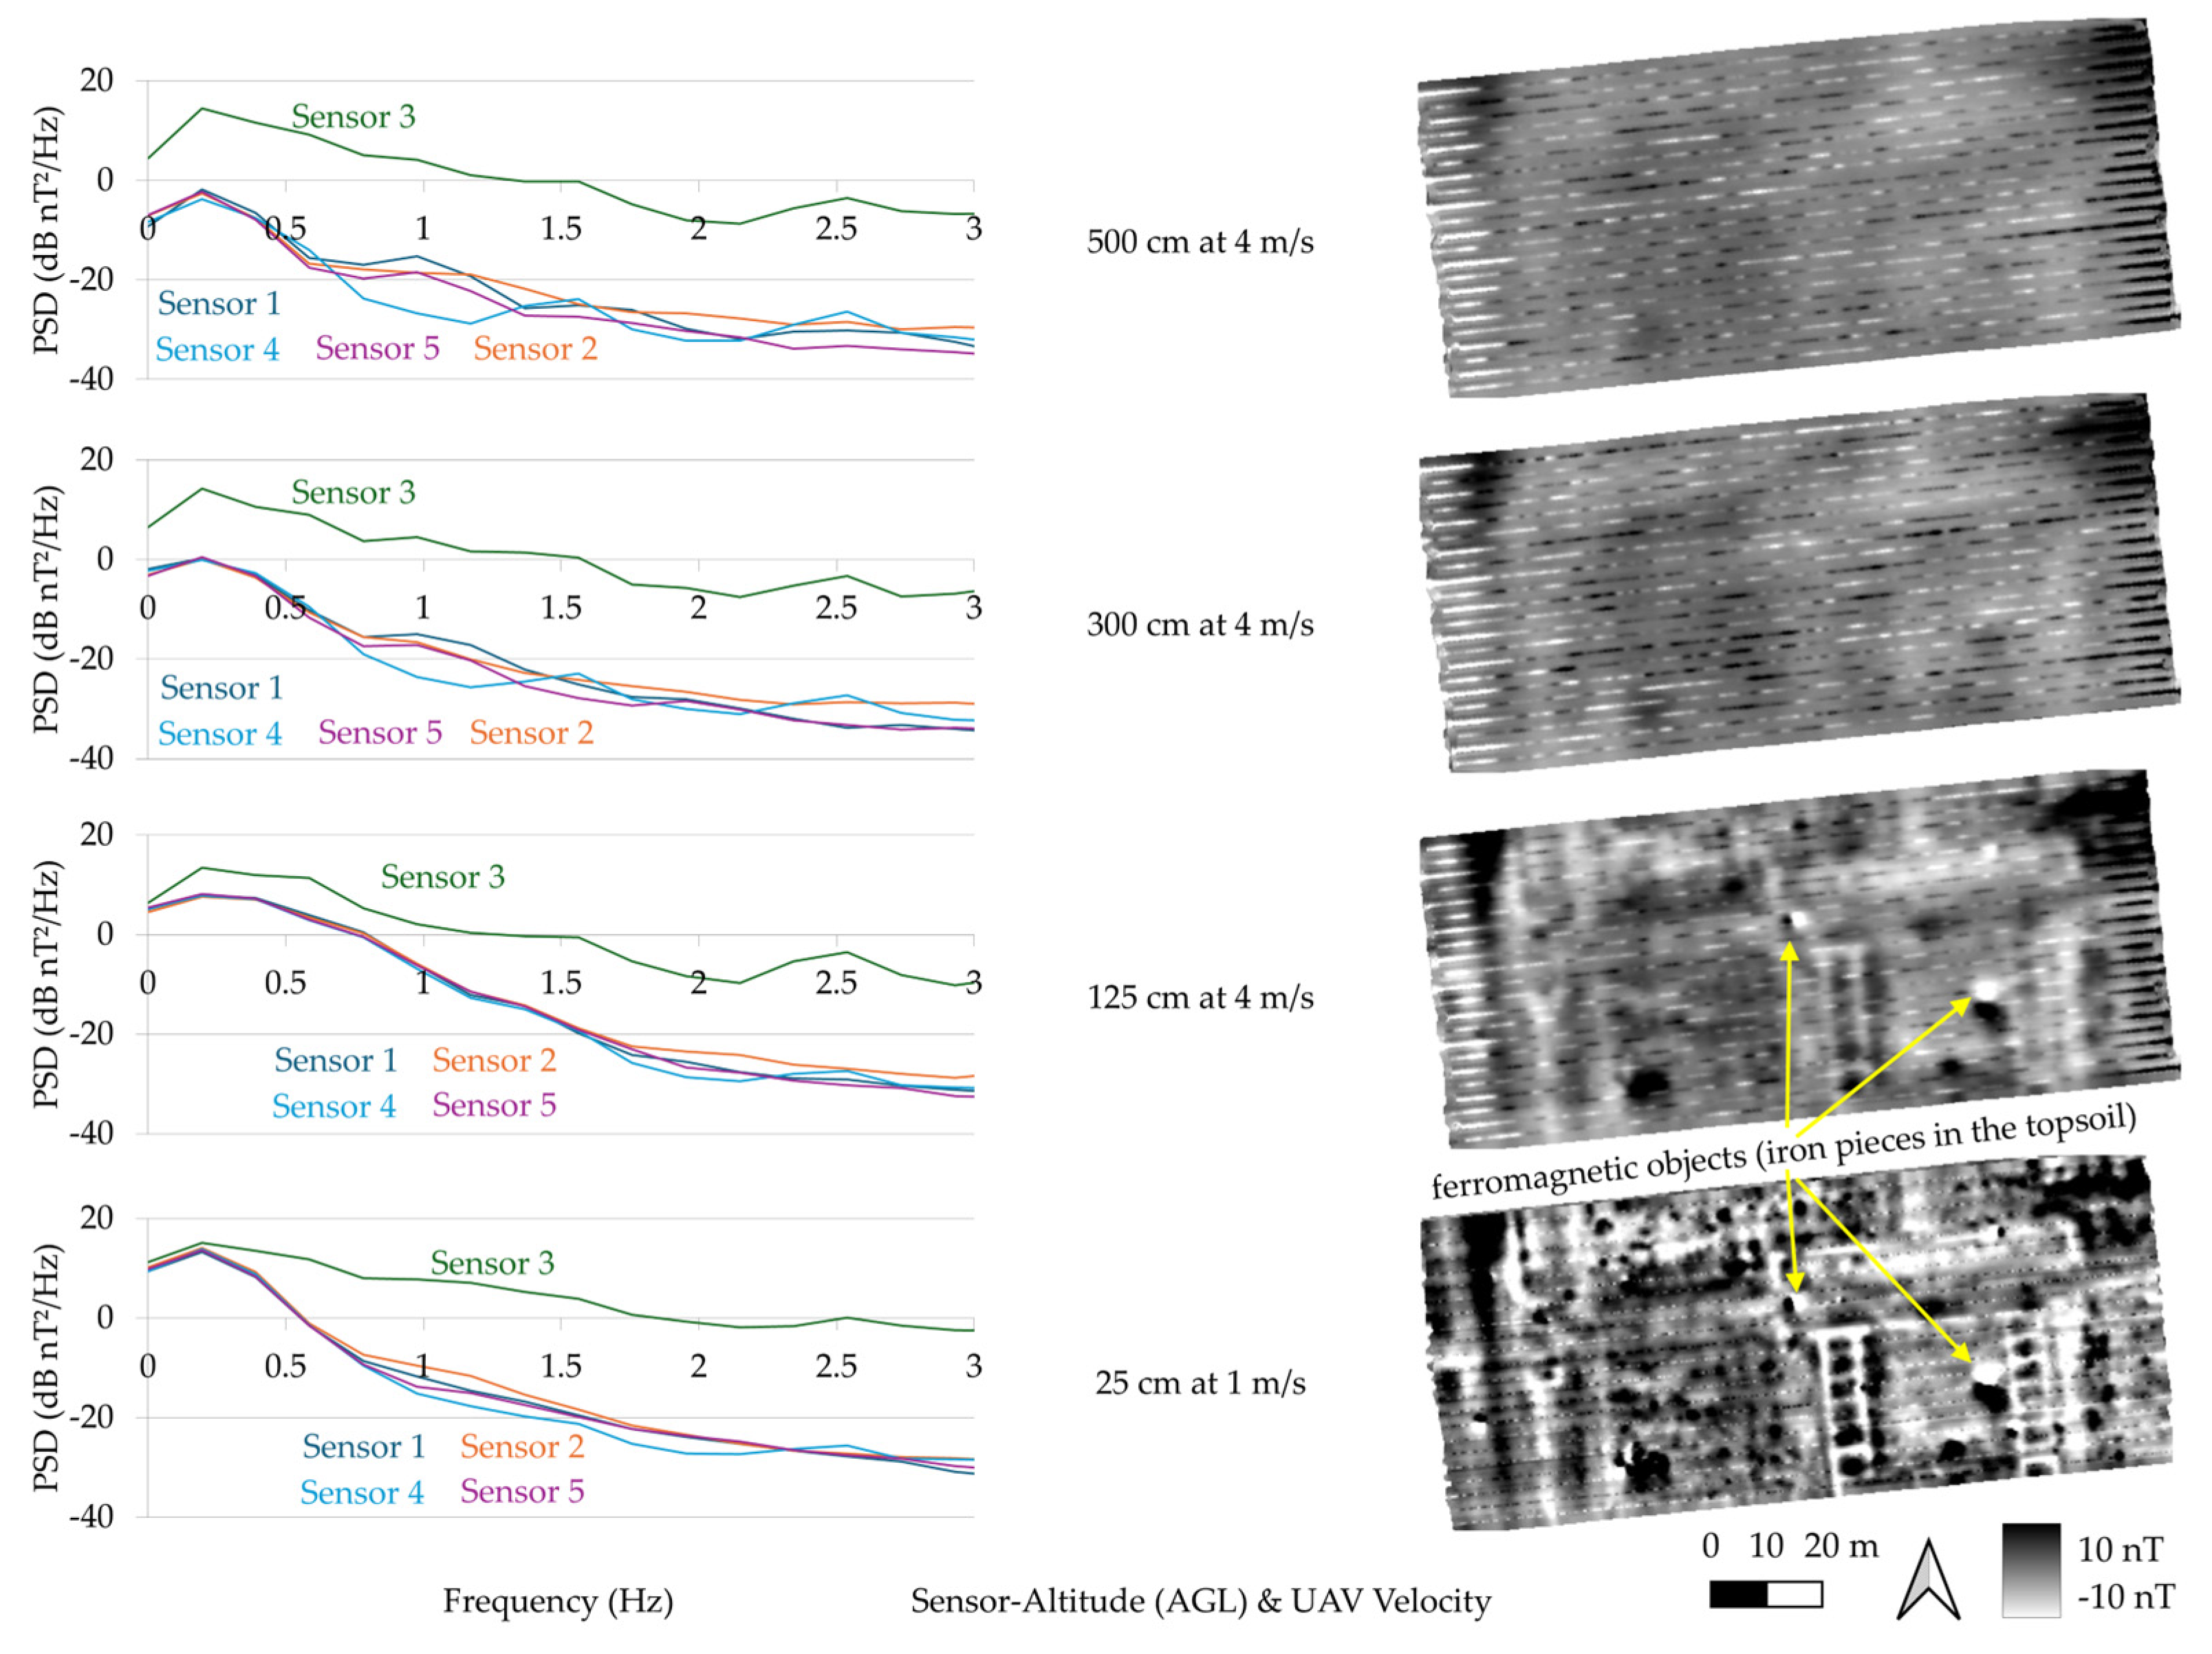
The influence of sensor–target distance on magnetic anomaly intensity has been recognized in the early stage of the development of the magnetic prospection method. As the distance between a target and the sensor increases, the associated magnetic signal attenuates, and the anomaly intensity decreases rapidly, resulting in an inherently limited depth resolution of magnetometer measurements [42]. In g-b surveys, the sensor height above the terrain is usually more or less fixed at clearly below 0.5 m above ground level (AGL). The situation is quite different for the d-b surveys presented. The operator can select different flight/sensor heights as required, and the prescribed flight altitude is automatically regulated by the R4’s Nanoradar with an approximately ±10 cm deviation. Because the instrument can be operated more efficiently and safely at higher altitudes, users tend to fly at increasingly greater heights. To quantify the concurrent decrease in anomaly intensities and detection capability with increasing flight altitude, we conducted a dedicated altitude–signal strength test.
Figure 6 presents PSDs and the corresponding magnetograms for selected flight altitudes. The results demonstrate a pronounced attenuation of target-related signal components with increasing sensor height. Archeological structures, clearly visible at sensor heights of 25 and 75 cm AGL, already begin to lose intensity at 125 cm AGL. At 300 cm AGL, only anomalies of large-scale archeological features remain discernible. At 500 cm AGL, even these structures are largely obscured by noise. For the detection of ferromagnetic objects, such as EOs, it is also noteworthy that dipolar anomalies are no longer identifiable as such at a sensor height of 300 cm AGL.
In contrast to the previous PSD representations, in which the records of all sensors were stacked into mean values, Figure 6 shows the spectra of the five sensors separately. The PSDs of sensor 3 exhibit, as expected, an amplification of power contributions resulting from the sensor’s proximity to the UAV, i.e., the “amplifier”. Since sensors 1, 2, 4, and 5 are positioned farther from the UAV, their PSDs show a clearer representation of both the signal strength and the frequency range within the usable band where power associated with archeological and ferromagnetic objects can be observed. The power spectra of these targets range from 0 to approximately 15 dB, all occurring at frequencies below 1 Hz. The results from the 500 cm sensor height suggest a practical detection threshold: once the power drops below 0 dB, small-scale targets can no longer be resolved reliably. Only large-scale outlines of archeological structures are detectable, which, when considered in isolation, are no longer archeologically interpretable.

3.4. Influence of the Velocity

The efficiency advantage of UAV-based magnetometry over conventional ground-based surveys is primarily due to the increased data-acquisition speed. Thanks to the relatively low kinetic energy demand of the UAV and the high sampling rate of the R4 system, higher flight speeds are theoretically possible. However, in near-surface magnetometry, the low flight altitudes limit operational velocities to around 5 m/s.
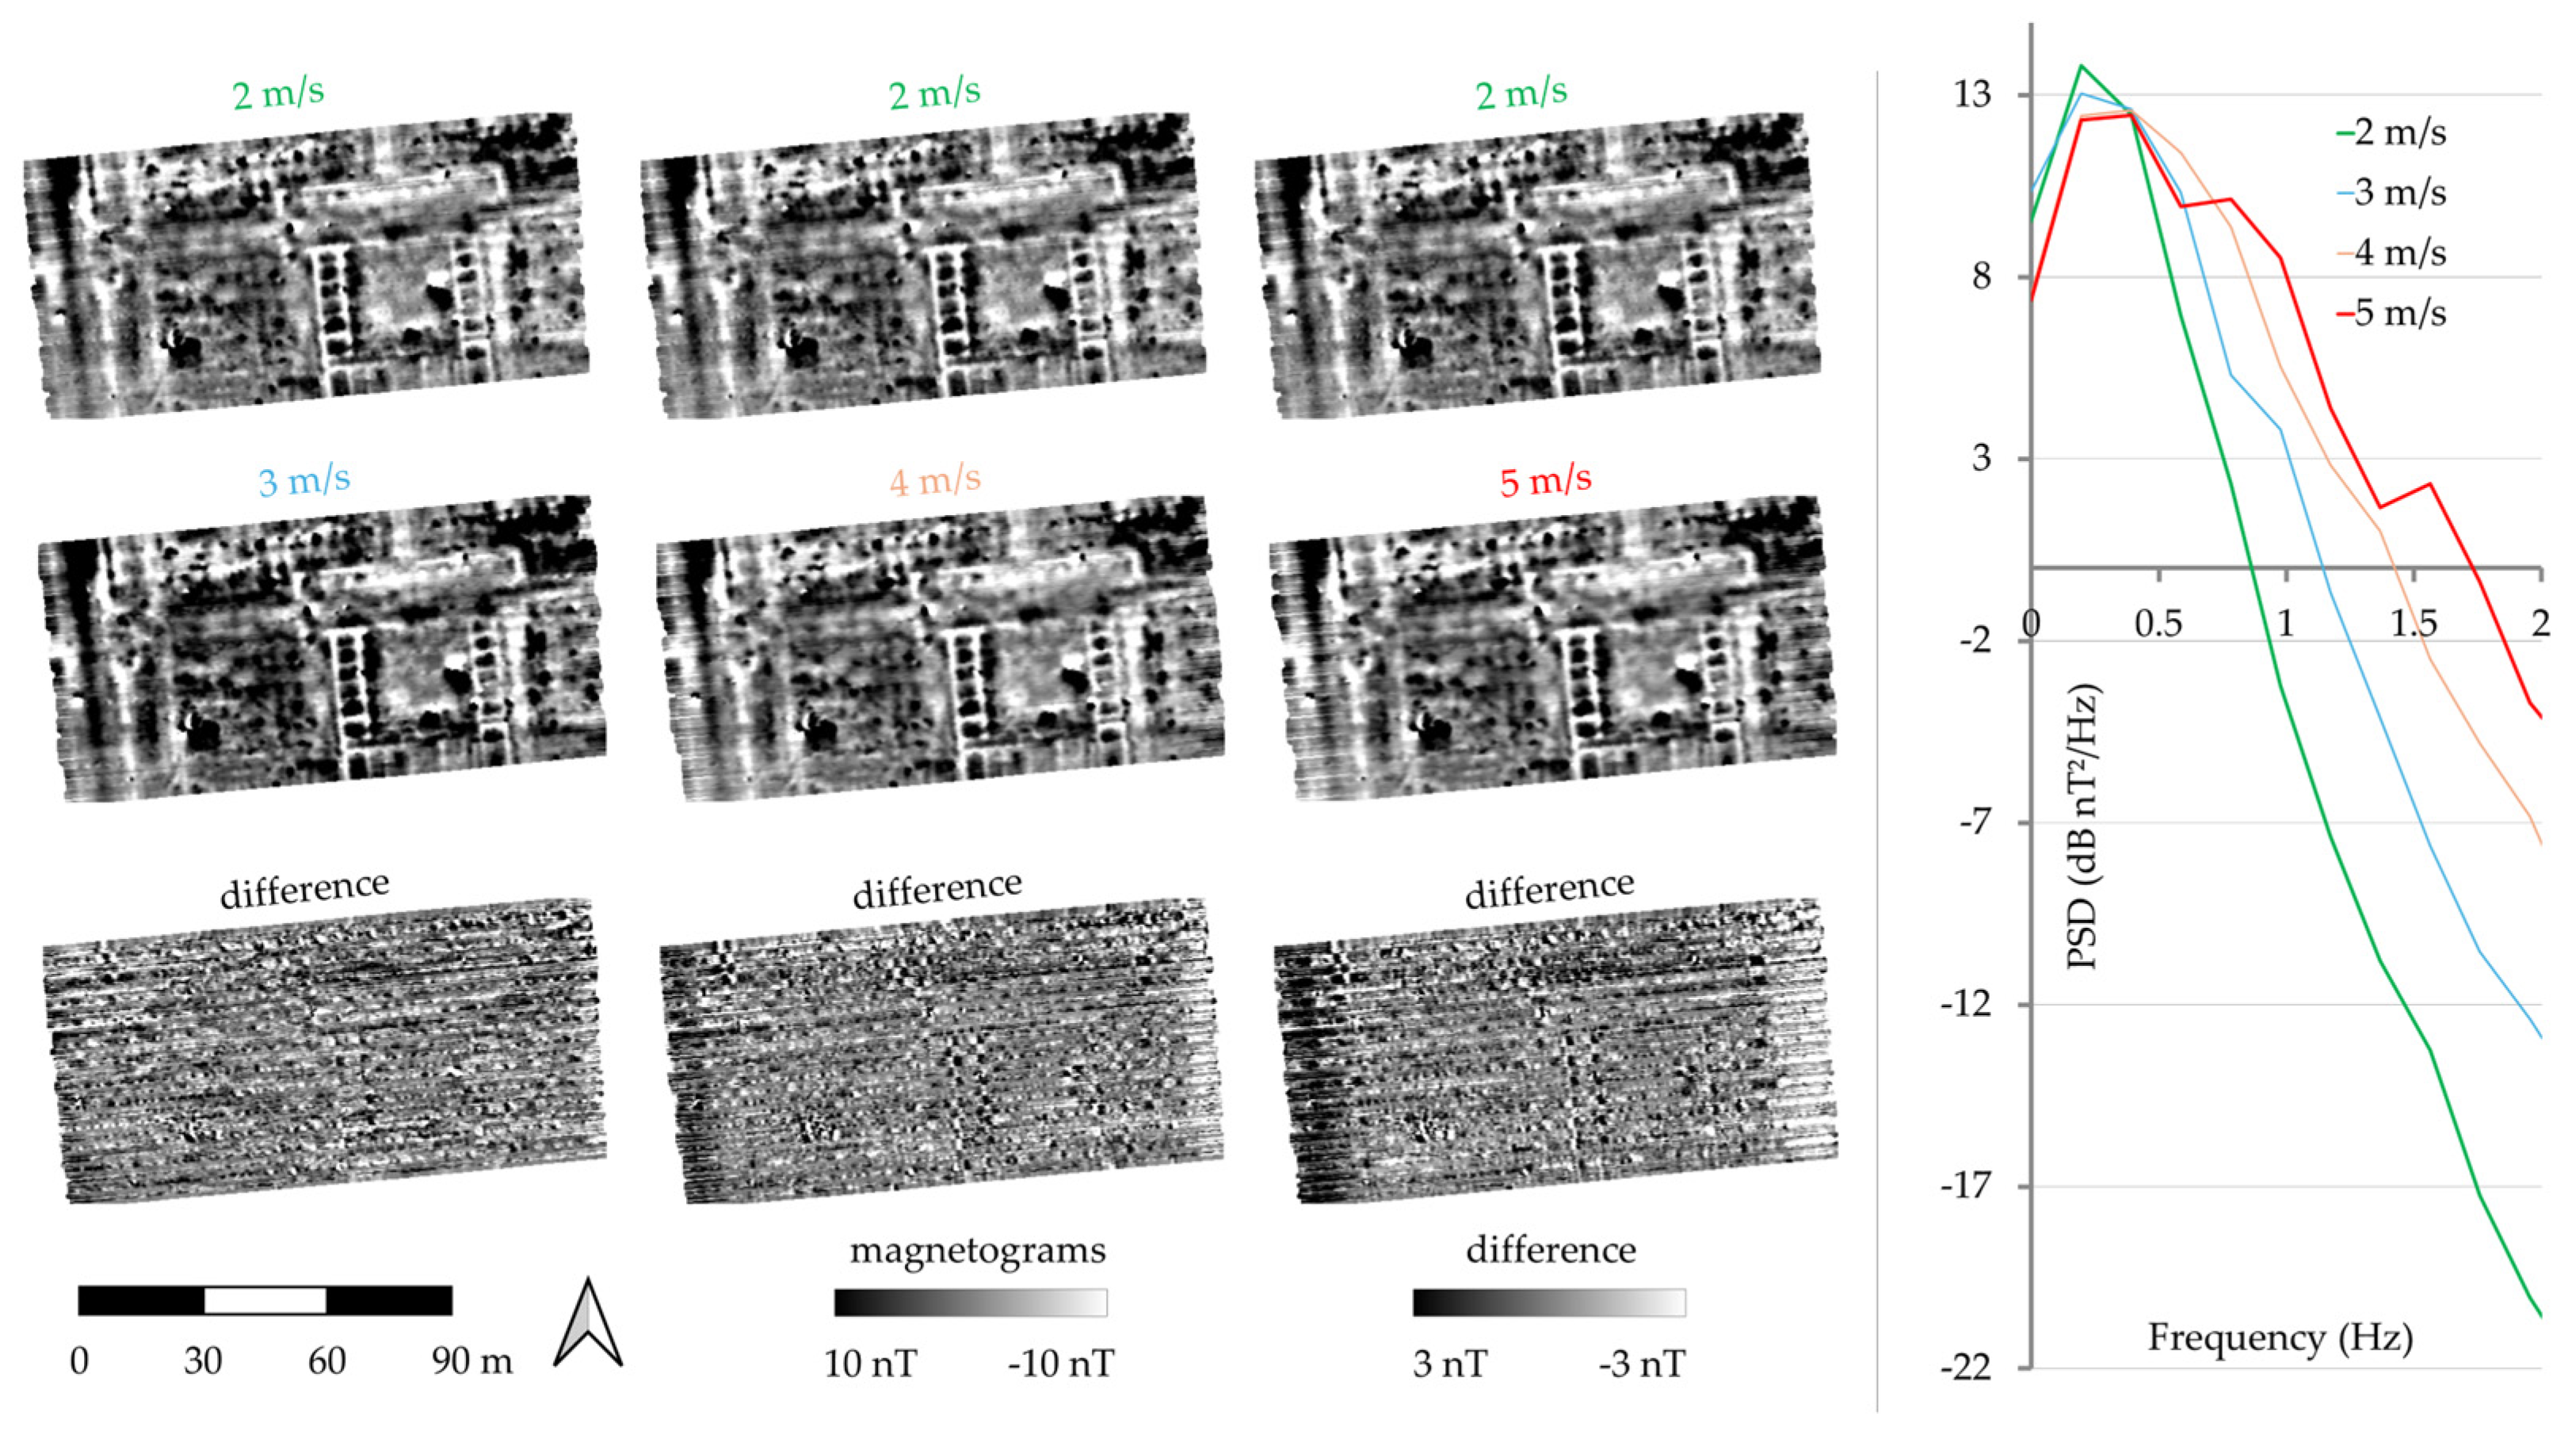
The favorable conditions at the Theilenhofen test site allowed systematic velocity experiments between 1 and 5 m/s in increments of 1 m/s. Selected results of these tests are shown in Figure 7. Since 1 m/s corresponds to a slow walking speed and is only practical for UAV-based surveys in very challenging terrain or when exceptionally high data quality is required, it is considered the optimum here but is not considered further from an efficiency perspective.
The results clearly show that noise increases with higher flight velocity. This trend is evident in both the PSD plots and the corresponding magnetograms. At 5 m/s, the power spectrum intersects the 0 dB threshold at approximately 1.75 Hz (red curve in Figure 7, right) and exhibits several plateaus, indicating interference contributions (cf. sensor 3 in Figure 6). In contrast, the 2 m/s flight (green curve in Figure 7, right) crosses the 0 dB threshold well below 1 Hz and shows only minor interference contributions, but a pronounced peak in the quasi-static field range at around 0.2 Hz. These PSD characteristics are also reflected in the magnetograms, which show a noticeable decrease in data quality at higher velocities. This lower data quality is reflected in the increased striping observed in magnetograms generated from data acquired at higher flight velocities.
The difference raster grids further indicate the spatial location of velocity-related interference contributions (Figure 7, left). Noise is generated particularly during flight-line transition maneuvers parallel to the main path at a constant heading, and manifests as striping artifacts in the magnetograms along the margins of the survey area. The intensity of these artifacts increases with higher flight speed. However, the associated noise is not confined to the flight-line transition zone but also propagates into the central parts of the survey area. This is indicated by noticeably larger variations in the intensity within archeological anomalies, for example, those representing the western wing of the principia.
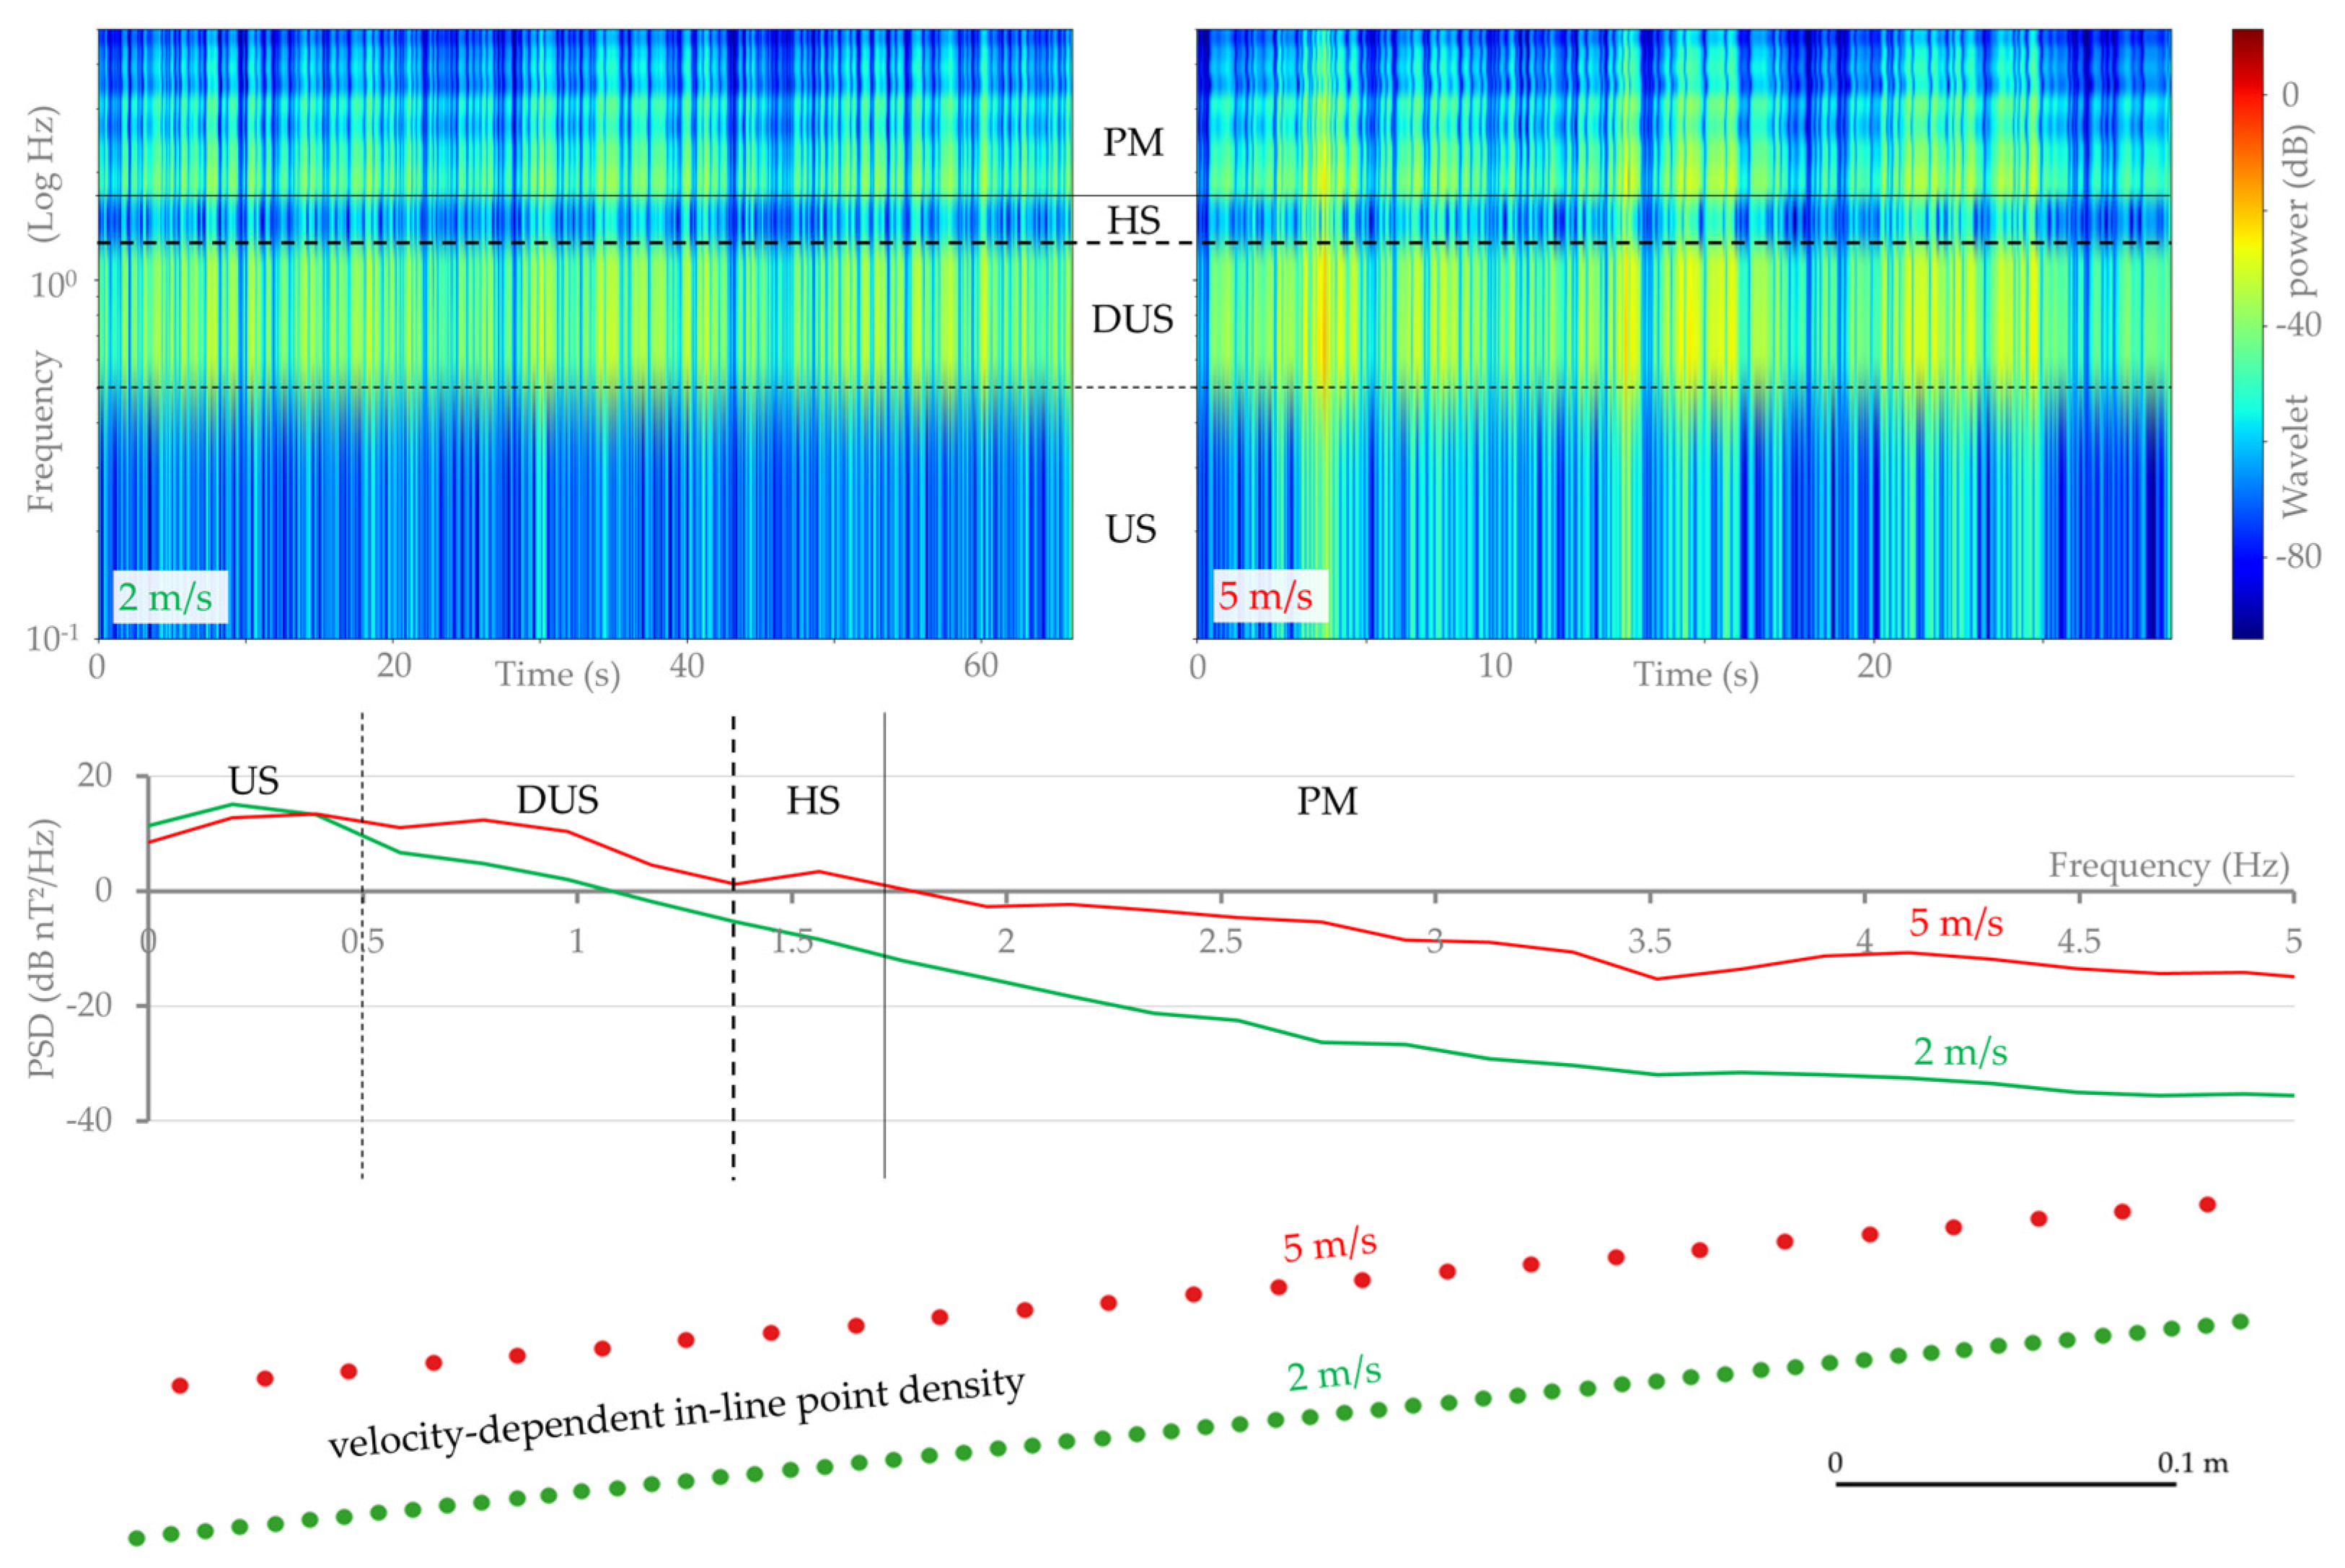
The influence of platform velocity on magnetometer performance (exemplarily for 2 and 5 m/s) within the spatial–temporal–frequency domain is illustrated by the CWT shown in Figure 8 (upper panel). Both CWTs exhibit a series of distinct frequency bands that, based on visual inspection of the individual datasets, can be provisionally classified as follows: harmonic frequency bands that can be subdivided into the underlying structure (US, 0.1 to ~0.5 Hz), the dominant underlying structure (DUS, ~0.5 to ~1.3 Hz), the harmonic structure (HS, ~1.3 to ~1.7 Hz), and the periodic modulation (PM, ~1.7 to 5 Hz). The most notable difference between the two datasets is the substantially more homogeneous energy distribution observed at 2 m/s. Whereas, the 5 m/s data are characterized by stronger modulation patterns and localized concentrations of spectral energy. These effects are particularly pronounced within the PM range, where the 5 m/s dataset exhibits frequency shifts and overlapping zones of elevated spectral power. This effect continues into the HS band, reflecting the platform-related resonances described above. Importantly, these UAV- or ambient field resonances propagate into the critical DUS and US bands, which contain most of the archeologically relevant signals. Consequently, the energy distribution within the respective frequency bands no longer remains homogeneous. Relative to the 2 m/s dataset, the spectral power of the 5 m/s dataset is amplified within the DUS and the US range. This inhomogeneous distribution of spectral power occurs simultaneously with a substantially lower in-line point density (Figure 8, lower section), which further increases the power dynamics within the usable frequency range and ultimately contributes to the observed decrease in data quality.

4. Discussion

4.1. UAV as a Source and Amplifier of Noise

With respect to the frequency components observed in UAV-based magnetometer measurements, our tests and experiences indicate that the signals present in the resulting power spectra are strongly influenced by site-specific factors, including the general noise level of the ambient magnetic field as well as the presence, geometry, and spatial distribution of magnetized subsurface objects.
The spectral spikes at 16.7 Hz and 50 Hz are anthropogenic interferences (see Section 3.2) that are commonly detected in magnetometer surveys conducted at sampling rates of ≥100 Hz in Germany, with spectral power amplitudes varying with distance from their respective sources. Peaks and additional spikes occurring around these interferences are observed exclusively in the drone-based datasets, additionally implicating that the UAV platform itself resonates to these external sources. Bondar [17] proposed that such disturbances originate from the drone motors moving relative to an ambient magnetic field. At present, the available evidence only allows us to conclude that these resonances are likely caused by drone-induced interference. In this context, Walter [16] reported that the trend toward increasing numbers of stator windings and permanent magnet pairs in modern UAV motor designs is associated with a corresponding increase in magnetic interference. Further testing and complementary analytical approaches are required to distinguish the individual contributions of the rotors, the power system, and the on-board electronics of a given UAV to the observed magnetic interference.
As the individual motors of a multirotor UAV do not operate uniformly but independently, the individual rotor frequencies can vary from near-zero to several hundred Hertz. Additionally, this UAV-generated aperiodic electromagnetic interference, as well as the anthropogenic interference, is (differently) amplified by the orientation and positioning of the sensor-platform configuration relative to the local geomagnetic field (see Section 3.1). Consequently, both the position and amplitude of the original distinct spectral peaks are smeared/shifted across a broader frequency band as resonance frequencies shift/vary unpredictably and continually. Additional peaks and spikes within the Nyquist noise range (~5–100 Hz, Figure 3) originate from the UAV itself and get shifted by a similar effect and superposition with the time-dependent interference frequencies. These effects are particularly pronounced when the flight direction of the UAV is parallel to the local geomagnetic field direction (corresponding to a northward flight heading in Theilenhofen; see Figure 4).
A plausible explanation is that (additional) secondary currents, generated in the UAV electronics and rotors, distort and amplify in this heading, especially in the unfavorable ambient field in the immediate vicinity of the magnetometers, leading to pronounced fluctuations in measured intensity and spectral power. The magnitude of this effect increases with the noise generated by the drone and when the magnetometer heading is oriented northwards, while it decreases with greater sensor-platform separation. More recent drone models, such as the M350, are expected to have a greater impact on the frequency spectrum due to increased noise levels than older models, such as the M300. Likewise, substantially lower noise levels are observed for east–west flight headings. As the flight direction can be easily adjusted during flight planning, it is generally recommended to fly orthogonally to the direction of the geomagnetic field vector, i.e., perpendicular to declination at the survey area. Numerous online tools are available to operators for calculating geomagnetic declination at any location worldwide, from which the orthogonal angle or optimal heading direction can be derived (e.g., ISDC IGRF Declination Calculator [40]).
This heading-dependent noise is superimposed on velocity-induced noise during d-b data acquisition, with the latter being considerably more complex and more difficult to mitigate. At higher flight speeds, the rotors operate at correspondingly higher rotational speeds, thereby generating elevated noise levels. The particularly enhanced noise observed during flight-line transition maneuvers is likely related to the highly non-stationary rotor dynamics in these segments. During acceleration phases, the motors rapidly increase rotational speed to maintain the predetermined flight velocity, whereas deceleration phases occur more gradually. In addition to the generally higher rotor speeds, these transient acceleration and deceleration processes likely contribute significantly to the generation of variable secondary currents and observed noise amplification. At lower flight speeds, by contrast, the motors operate within a more stable rotational regime, resulting in reduced dynamic variability and consequently lower noise levels. Accordingly, within the constraints of the present setup, the only viable measure to minimize velocity-dependent noise is to operate the R4 system at lower flight speeds.
Flight velocity is, in fact, the key factor for the efficiency of drone-based magnetometry. As the R4 System can operate at sampling rates up to 1000 Hz, substantially higher survey velocities are achievable over large areas without significant losses in data density. At present, this is less a limitation of the magnetometer system or the drone performance and more a consequence of constraints imposed by hub-based solutions. While the present combination of SkyHub and Nanoradar employed in this study is robust and cost-effective, it remains prone to errors: The Nanoradar system only controls the flight altitude, while overall environmental awareness is handled by the drone’s onboard optical sensors. Consequently, the distance radar can misinterpret surface conditions, for example crop height and density. In addition, the lack of adaptive, active-sensor-based control (e.g., LiDAR-based Simultaneous Localization and Mapping or SLAM) of the surrounding environment further limits (operational) reliability and can result in crashes.
One factor considered during our analysis was the potential influence of mechanical noise, which was also observed under certain test conditions. For example, the outer sections of the magnetometer array, which are rigidly attached to the landing gear, exhibited slight vibrations during slower flights and under higher wind conditions. This platform-specific source of noise should be investigated independently of electromagnetic interference. In the present study, no direct effects of these vibrations on data quality or on the power spectral distribution were observed. However, this does not exclude the possibility that mechanical noise may affect the measurements under different operational conditions. Further investigation is therefore needed to better assess its potential impact.
In summary, while the magnetometer system itself appears to be relatively mature, there is still considerable room for improvement in its carrier UAV platform, making the choice of UAV setup crucial. For example, quadcopters are generally preferable to hexacopters due to their fewer rotors and a more favorable arrangement relative to the magnetometer array. However, our comparison in Figure 5 also demonstrates that different versions of quadcopters can differ significantly in their noise levels. More modern UAVs, for example, M350, appear to generate higher noise levels, likely due to more complex electronics or more powerful motors. As the UAV acts not only as a noise source but also as a strong amplifier of time-dependent noise, compact drone platforms should generally be preferred as carriers for magnetometer systems.
Simple modifications to the UAV platform can have a significant positive impact on data quality. As demonstrated by the example of the extended landing gear of the DJI M350, the general rule applies: the greater the distance between the magnetometer array and the drone’s electronics and rotors, the better the SNR.

4.2. Propagation of Noise into the Usable Signal Range

Within the Nyquist range between 0 and approximately 3 Hz, the signals observed by the presented three-axis fluxgate magnetometers arise primarily from sensor motion through spatially varying magnetic fields. This usable signal range represents static and quasi-static field contributions associated with induced or remanent magnetized archeological features, as well as other magnetic sources such as EO. In addition to target-related signals, this range also contains contributions caused by very slow temporal variations or drift processes, such as temperature-related effects or instrument drift (Figure 3). Reducing noise sources in this frequency band is therefore crucial for the reliable detection of subsurface features in near-surface magnetic surveys.
At first glance, the occurrence of spectral power above this frequency range may appear inconsistent with the static or quasi-static nature of magnetic fields generated by magnetized and magnetizable subsurface objects. Higher frequency contributions are evident in the PSDs, especially in trajectories aligned with the main geomagnetic field direction (Figure 4), as well as during higher-velocity flights (Figure 7). This indicates that ambient field and UAV-borne noise propagate into the usable signal range. At corresponding bands, dynamic amplification and attenuation effects were observed. Although these effects cannot be classified as statistically significant within this study, they are nonetheless clearly detectable in the PSDs and CWTs (Figure 8). This becomes particularly apparent in datasets acquired under higher dynamic conditions, where both drone-induced and ambient-field noise become more pronounced than in surveys conducted at more uniform flight velocities. Consequently, the resulting magnetograms exhibit substantially higher noise levels.
The combined contribution of all described factors and effects to the measured magnetic signal demonstrates that a clear separation between spatially and temporally dependent sources, as well as between target and noise, is difficult to achieve—particularly in complex ambient magnetic fields affected by nearby infrastructure such as railroads, roads, or settlements. This is consistent with the nature of magnetometry as a passive geophysical/sensing method, which records the superposition of target-related magnetic anomalies, the geomagnetic field, and external interference sources.
The widely held assumption in active geophysics (e.g., seismics) that signal and noise can be separated effectively using cutoff filtering (see, e.g., [43]) does not appear to hold for magnetic data, even for datasets acquired at higher sampling rates. This should be carefully considered by users applying frequency-based filters to magnetic data. Despite apparently favorable SNRs, portions of the noise spectrum may be concentrated at low frequencies, where it overlaps with the usable signal. Finally, and in general, it must be assumed that these overlaps cannot be fully separated (see also [3]).
An inherent contradiction lies in the fact that, in magnetic surveying, we actively seek to detect certain sources of disturbance, namely anomalies caused by targets of interest, while attempting to avoid others. The distinction between spatial and temporal sources of interference is not straightforward, as both can overlap, and temporal disturbances may be aliased into the frequency ranges of spatial signals in the usable frequency range. A well-considered data acquisition strategy may not eliminate noise entirely, but it can substantially reduce its impact on the recorded data. Such a reduction would benefit not only surveys in archeological contexts, where weak anomalies may otherwise be obscured by noise, but also magnetograms in EO contexts, from which more reliable predictions and characterization of ferromagnetic objects can be derived compared to noisy datasets.
Regarding the goal of maximizing the SNR in UAV-based magnetic prospection, the most effective approach currently available is the systematic avoidance or minimization of the noise sources identified and described in this study. Accordingly, a well-designed and carefully planned data acquisition strategy that accounts for all known noise sources is essential. Building on the main objective of this study, the following chapter outlines recommendations for achieving low-noise data acquisition with UAV-mounted three-axis, multi-channel magnetometer systems. We would like to emphasize that the following recommendations currently apply only to d-b three-axis magnetometers. Other magnetometer technologies, such as optically pumped magnetometers (OPMs), may require stricter criteria regarding platform-induced noise, motion-induced noise, and frequency overlap.

4.3. Recommendations for Data Acquisition

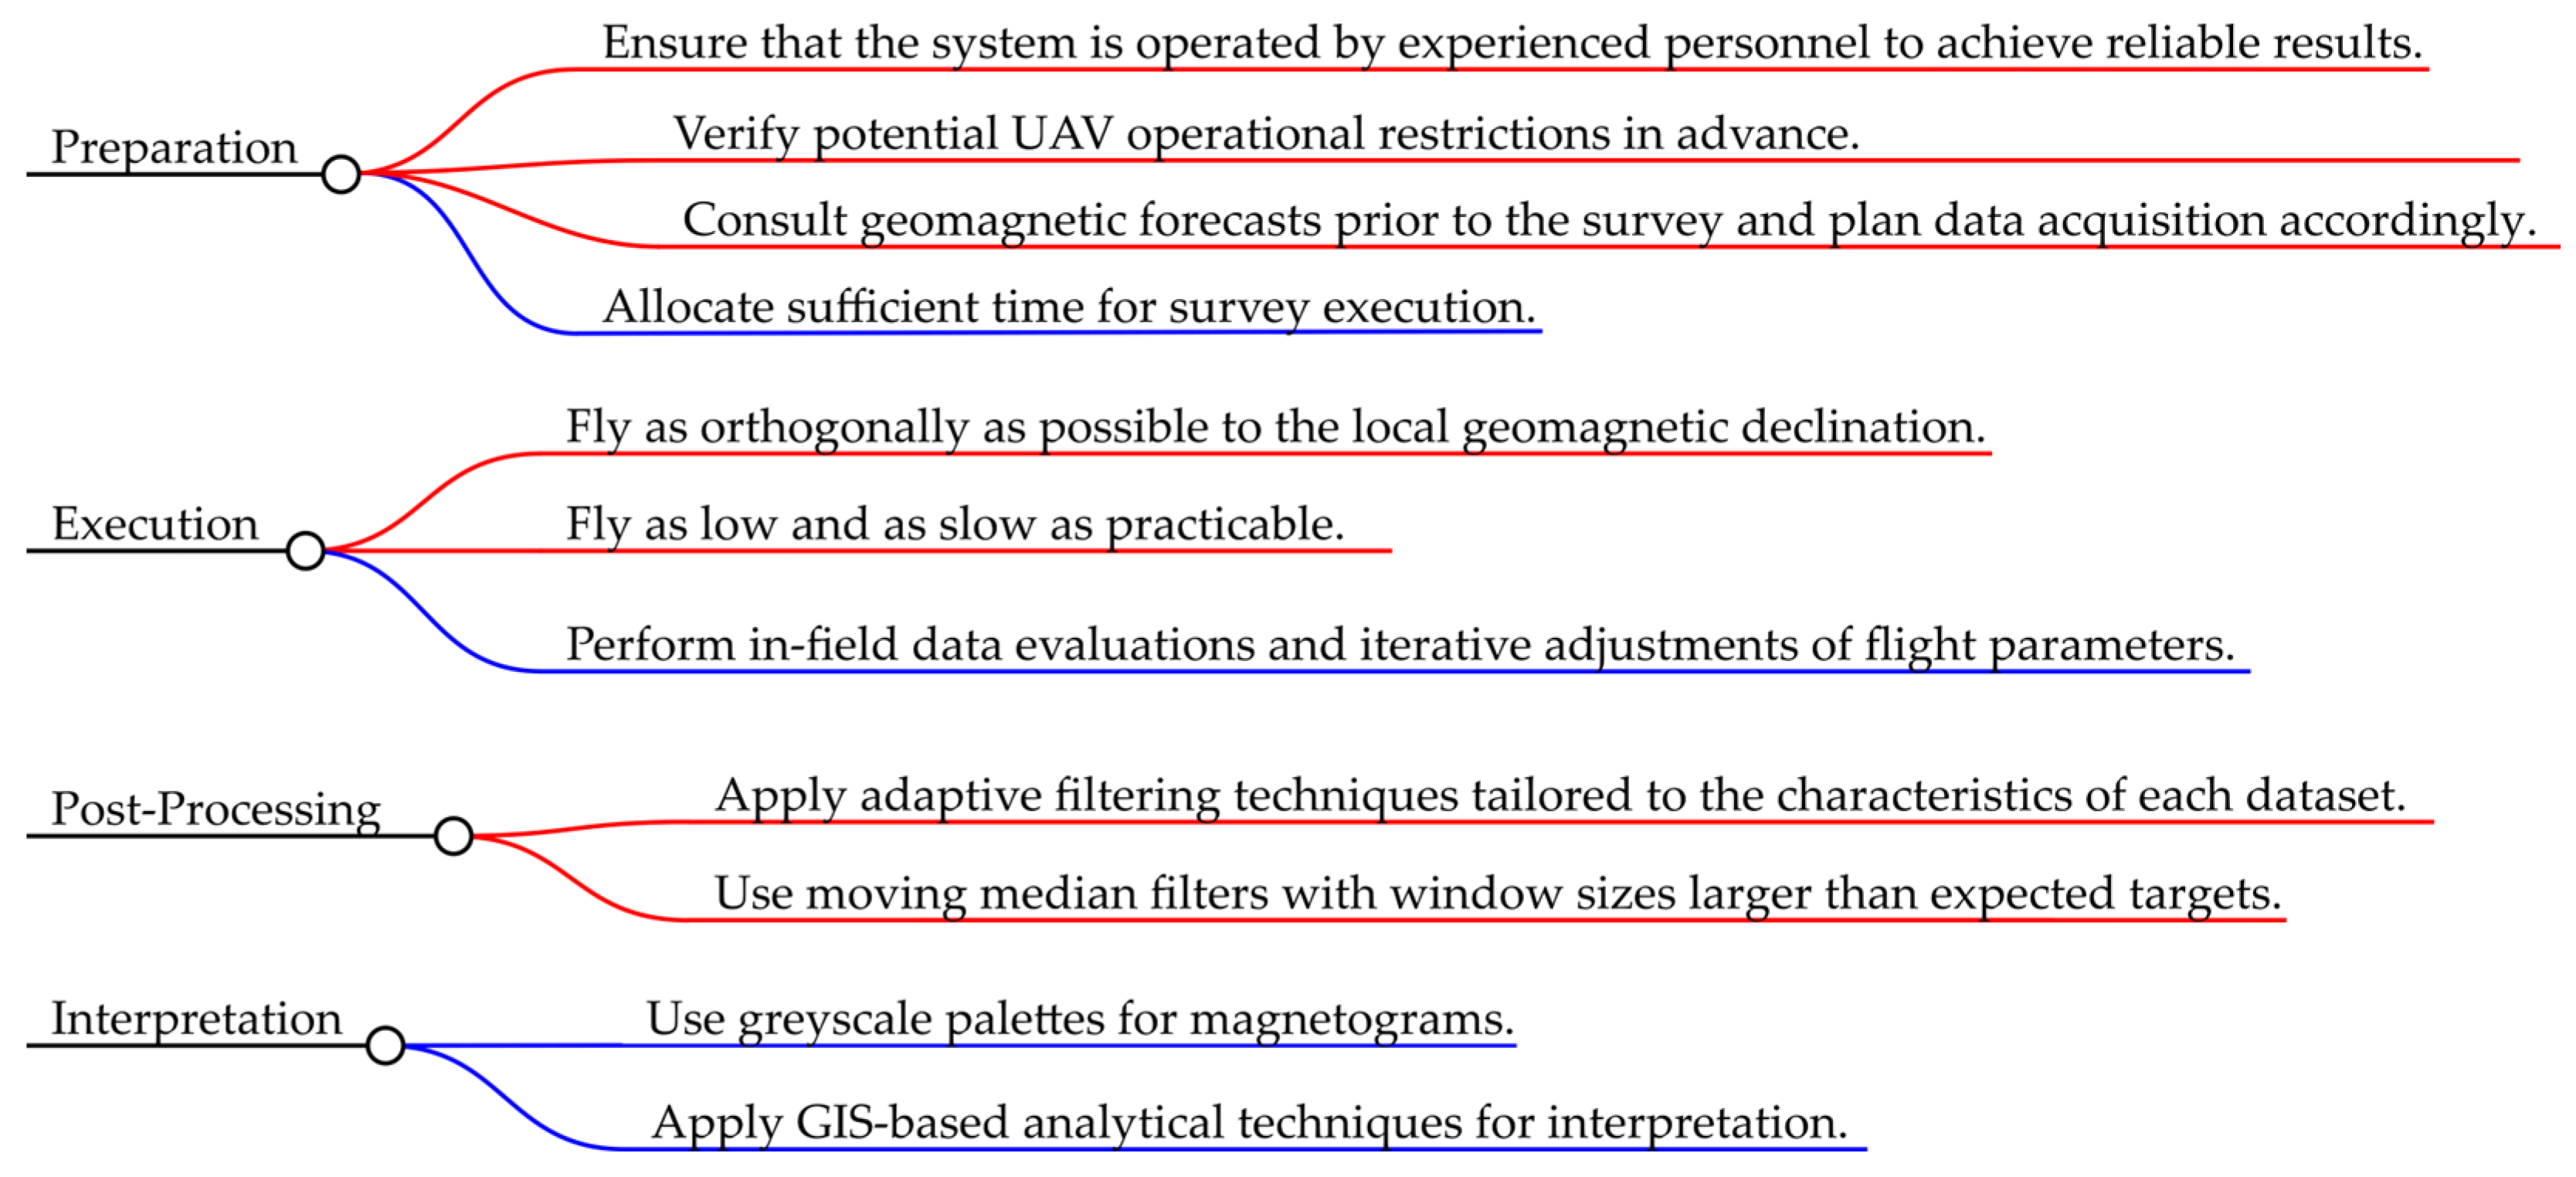
To provide a concise overview of the findings and recommendations derived from this study, a simplified mind map was developed that summarizes the main factors affecting data quality in UAV-based magnetic surveys (Figure 9). Although it is primarily intended for surveyors working in near-surface applications, like archeological and EO prospecting, several aspects—particularly those related to preparation and post-processing—may also be relevant to geological high-altitude surveys.
One remark regarding the influence of the temporal variations in the local geomagnetic field on data acquisition: The measurement of the three orthogonal magnetic field components of the three-axis fluxgate sensors allows the calculation of the relative value of the magnitude of the ambient magnetic field. The main contributor to the ambient field is the geomagnetic field. It experiences variations throughout the day, so-called diurnal variation, in a few tens of nT, which is in the range of sought-after anomalies. One possibility is to correct the diurnal variation by accompanying base station measurements. This has multiple advantages: Readings of the three-axis magnetometer can be cross-checked and calibrated; absolute and corrected total field measurements can be derived by subtracting the diurnal variation recorded by the base station, and even short-term fluctuations caused by increased geomagnetic activity (i.e., geomagnetic storms) can be compensated. However, when a base station is used, it should operate at the same sampling rate as the survey magnetometers; otherwise, compensation becomes ineffective, as the instruments sample different frequency spectra. Therefore, as for conventional OPM magnetometry, we recommend consulting Kp index forecasts (cf. [44]) one day prior to the planned survey and, in the event of a predicted geomagnetic storm, rescheduling the prospection to a period of geomagnetically quiet conditions. Future investigations will need to assess to what extent elevated geomagnetic activity also interacts with or amplifies UAV-induced noise components, thereby affecting the overall quality of UAV-based magnetic measurements.
At low geomagnetic activity and given the short survey duration of a UAV flight, statistical compensation, e.g., by subtracting a constant median or moving median, is generally sufficient to generate total field data usually used in archeological and EO survey contexts. If a constant orientation of the three-axis fluxgate sensors relative to a cardinal direction (preferably east or west) is maintained throughout the survey and the UAV is operated approximately perpendicular to the local geomagnetic field direction (see Section 3.2 and Figure 4), heading-dependent effects can be minimized substantially. Under such conditions, additional heading compensation procedures, such as the determination and application of a figure of merit (cf. [34,45]), may be unnecessary or of only limited practical benefit. The omission of both a magnetic base station and heading-compensation measurements can significantly reduce field effort and thereby further increase the efficiency and operational simplicity of UAV-based magnetic surveys.
Based on the results presented in this study, we make following recommendations for d-b survey to achieve high-quality data:
  • Fly at the lowest feasible altitude. Whenever operationally possible, the magnetometer array should be maintained well below 1 m AGL to maximize anomaly intensity and signal-to-noise ratio.
  • Orient survey lines approximately perpendicular to the local geomagnetic field direction (i.e., orthogonal to the magnetic declination) to minimize heading-dependent noise.
  • Limit flight velocity to approximately 2–3 m/s. At higher velocities, increased platform-induced noise, particularly during flight-line transition maneuvers, is to be expected.
  • Conduct preliminary test flights and evaluate the acquired data directly on-site. Early quality assessment enables flight parameters, such as altitude, velocity, and survey orientation, to be adjusted before the main survey is carried out, to further reduce noise.
All these aspects can be critical for both the quality of the resulting magnetograms and the reliability of their interpretation. If, despite the recommendations above, the data remains noisy, we advise systematically testing different combinations of frequency-based filters with constant or moving median filters. Data filtering must always be adapted to each individual dataset and does not allow for a standardized procedure. When applying moving median filters, window lengths smaller than the expected target dimensions should be strictly avoided, as they may attenuate the intensity of archeological features (see also [13]).
If it is already evident in advance that the ambient field of a site is influenced by multiple sources of interference, sufficient time should be allocated for repeated test flights and subsequent data analysis to ensure an optimal prospection outcome. This, in turn, highlights the continued importance of experienced operators in the field and reinforces the key conclusion of the Near-Surface Geophysics Inter-Society Committee on UAV Geophysics Guidelines [23]: UAV magnetometer systems are not regarded as plug-and-play instruments. Despite their apparent autonomy and efficiency, they represent a fundamentally new and complex class of measurement systems whose successful application depends on informed survey design, careful data acquisition, and critical data evaluation.

5. Conclusions

This study demonstrates that UAV-based magnetic prospection is a highly efficient, but inherently noise-sensitive survey method. Across all investigated datasets, the UAV platform proved to be not merely a carrier system but also as a significant source and amplifier of noise. These disturbances can propagate into the frequency range containing geophysically relevant signals, thereby complicating the separation of signal and interference. In particular, heading-dependent effects, velocity-dependent dynamics, and platform-generated electromagnetic interference substantially influence the recorded spectra and must be explicitly considered during survey planning.
The results further demonstrate that the commonly assumed strict separability of signal and noise—an assumption often implicitly adopted from active geophysical methods—does not apply to high-resolution, near-surface magnetic data. Spatially and temporally varying ambient magnetic field contributions overlap within the usable frequency range, while UAV-induced amplification of ambient-field disturbances can propagate into frequency bands that contain relevant signals. Consequently, signal and interference cannot always be separated using linear filtering.
Despite these limitations, the results show that high-quality prospection results can be achieved through a carefully designed survey strategy. Low flight altitudes, survey headings oriented approximately perpendicular to the local geomagnetic field, moderate flight velocities, and maximum sensor-to-platform separation all contribute substantially to improving the signal-to-noise ratio. Additional improvements in data quality can be achieved through iterative test flights, in-field quality assessment, and the adaptive optimization of acquisition parameters.
In the near future, UAV magnetometry is unlikely to replace conventional ground-based survey methods. Instead, it is expected to establish itself as a complementary technology for large-scale near-surface prospection, where it can be integrated into top-down survey strategies alongside conventional methods, particularly in areas that are inaccessible, difficult to traverse, or hazardous for ground-based operations.
Overall, UAV magnetometry should be regarded as a flexible but technically demanding survey method whose performance depends strongly on both survey design and operator expertise. Rather than representing a plug-and-play technology, it requires informed survey planning and iterative optimization to balance operational efficiency with data quality and to maximize the signal-to-noise ratio in near-surface applications.

Author Contributions

Conceptualization, A.S. and R.L.; methodology, A.S., C.S. and G.H.; validation, S.E.H. and A.S.; formal analysis, A.S. and S.E.H.; investigation, A.S. and S.E.H.; resources, G.H., A.S. and R.L.; data curation, A.S. and C.S.; writing—original draft preparation, A.S.; writing—review and editing, A.S., S.E.H. and R.L.; visualization, A.S.; supervision, A.S.; project administration, A.S. All authors have read and agreed to the published version of the manuscript.

Funding

This research received no external funding.

Data Availability Statement

The data presented in this study are subject to restricted-access provisions under the internal data policy of the Bavarian State Department for Monuments and Sites. Access is granted to qualified academic users upon submission of a signed data-use agreement available on request.

Acknowledgments

We would like to thank Leon Kaub from the Institut Pierre-Gilles de Gennes (IPGG), Institut Curie, Paris, France, for his commitment to implementing PSD analyses into our analysis workflow and for the valuable scientific exchange. We also gratefully acknowledge the professional support and advice provided by Jörg W.E. Fassbinder from the Ludwig-Maximilians-University of Munich, Munich, Germany. Furthermore, we thank André Fahl and the company Nolte Geoservices GmbH from Nottuln, Germany, for conducting the data acquisition for the flight-altitude test. Finally, we would like to sincerely thank the four anonymous reviewers for dedicating their time and expertise to the evaluation of our manuscript. Their valuable comments and suggestions have contributed significantly to improving the revised version of our work. Generative AI tools were used in a limited and supportive capacity during the preparation of this manuscript. GPT-4- and GPT-5-based large language models BayernKI (Version 0.9.0) and ChatGPT (GPT-4 and GPT-5) were employed as assistance for the development of Microsoft Excel macros used in the PSD analyses and Python (Version 3.14.5) scripts used for the CWT. All outputs were independently verified using conventional statistical software and alternative scripting approaches. In addition, BayernKI and ChatGPT were used to improve spelling, grammar, and syntax in selected sections of the manuscript. No generative AI tools were used for the development of the scientific concepts, data analysis, results, or interpretations presented in this study. All AI-generated suggestions were carefully reviewed, verified, and substantially revised by the authors prior to incorporation into the manuscript. The authors take full responsibility for the content of the final manuscript.

Conflicts of Interest

Author Christian Seisenbacher and Georg Häussler was employed by the company ArchaeoTask. The remaining authors declare that the research was conducted in the absence of any commercial or financial relationships that could be construed as a potential conflict of interest.

Abbreviations

The following abbreviations are used in this manuscript:
UAVUnmanned aerial vehicle
EOExplosive ordnance
UXOUnexploded ordnance
d-bDrone-based
g-bGround-based
HzHertz (SI derived unit of frequency)
LiDARLight detection and ranging
QGISQuantum geoinformation system
nTNanotesla (SI unit of magnetic flux density)
PSDPower spectral density
CWTContinuous wavelet transforms
dBDecibel (logarithmic unit; describes the relationship between two physical quantities)
SNRSignal-to-noise ratio
DCDirect current (one-directional flow of electromagnetic charge)
RTKReal-time kinematic
AGLAbove ground level
USUnderlying (time vs. frequency) structure
DUSDominant underlying (time vs. frequency) structure
HMHarmonic (time vs. frequency) structure
PMPeriodic modulation

References

  1. Kaub, L.; Gilder, S.A.; Fu, R.R.; Maher, B.A.; Maxemin, G.; Kuan, A.T.; Büttner, A.; Milz, S.; Schmitz, C. Magnetic dipole imaging of magnetite nanoparticles in brain tissue. RSC Adv. 2026, 16, 983–994. [Google Scholar] [CrossRef] [Scilit] [PubMed]
  2. Deans, C.; Valenzuela, T.; Bason, M.G. Quantum magnetometry for space. In Proceedings of the International Conference on Space Optics—ICSO 2022, Dubrovnik, Croatia, 3–7 October 2022; Volume 12777, p. 248. [Google Scholar] [CrossRef] [Scilit]
  3. Scollar, I.; Tabbagh, A.; Hesse, A.; Herzog, I. Archaeological Prospecting and Remote Sensing; Cambridge University Press: Cambridge, UK, 1990. [Google Scholar]
  4. Fassbinder, J.W.E. Seeing beneath the farmland, steppe and desert soil: Magnetic prospecting and soil magnetism. J. Archaeol. Sci. 2015, 56, 85–95. [Google Scholar] [CrossRef] [Scilit]
  5. Munschy, M.; Boulanger, D.; Ulrich, P.; Bouiflane, M. Magnetic mapping for the detection and characterization of UXO: Use of multi-sensor fluxgate 3-axis magnetometers and methods of interpretation. J. Appl. Geophys. 2006, 61, 168–183. [Google Scholar] [CrossRef] [Scilit]
  6. Lesur, V.; Hamoudi, M.; Choi, Y.; Dyment, J.; Thébault, E. Building the second version of the World Digital Magnetic Anomaly Map (WDMAM). Earth Planets Space 2016, 68, 27. [Google Scholar] [CrossRef] [Scilit]
  7. Betts, P.G.; Moore, D.; Aitken, A.; Blaikie, T.; Jessell, M.; Ailleres, L.; Armit, R.; McLean, M.; Munukutla, R.; Chukwu, C. Geology from aeromagnetic data. Earth-Sci. Rev. 2024, 258, 104958. [Google Scholar] [CrossRef] [Scilit]
  8. Stele, A.; Linck, R.; Schikorra, M.; Fassbinder, J.W.E. UAV magnetometer survey in low-level flight for archaeology: Case study of a Second World War airfield at Ganacker (Lower Bavaria, Germany). Archaeol. Prospect. 2022, 29, 645–650. [Google Scholar] [CrossRef] [Scilit]
  9. Kolster, M.E.; Wigh, M.D.; Da Silva, E.L.S.; Vilhelmsen, T.B.; Døssing, A. High-Speed magnetic surveying for unexploded ordnance using UAV systems. Remote Sens. 2022, 14, 1134. [Google Scholar] [CrossRef] [Scilit]
  10. Ugarte-Goicuría, I.; Guerrero-Sevilla, D.; Carrasco-Garcia, P.; Carrasco-Garcia, J.; Gonzalez-Aguilera, D. Aerial drone magnetometry for the Detection of Subsurface Unexploded Ordnance (UXO) in the San Gregorio Experimental Site (Zaragoza, Spain). Drones 2026, 10, 88. [Google Scholar] [CrossRef] [Scilit]
  11. Gavazzi, B.; Maire, P.L.; De Lépinay, J.M.; Calou, P.; Munschy, M. Fluxgate three-component magnetometers for cost-effective ground, UAV and airborne magnetic surveys for industrial and academic geoscience applications and comparison with current industrial standards through case studies. Geomech. Energy Environ. 2019, 20, 100117. [Google Scholar] [CrossRef] [Scilit]
  12. Schmidt, V.; Becken, M.; Schmalzl, J. A UAV-borne magnetic survey for archaeological prospection of a Celtic burial site. First Break 2020, 38, 61–66. [Google Scholar] [CrossRef] [Scilit]
  13. Stele, A.; Kaub, L.; Linck, R.; Schikorra, M.; Fassbinder, J.W.E. Drone-based magnetometer prospection for archaeology. J. Archaeol. Sci. 2023, 158, 105818. [Google Scholar] [CrossRef] [Scilit]
  14. Schmidt, V.; Coolen, J.; Fritsch, T.; Klingen, S. Towards drone-based magnetometer measurements for archaeological prospection in challenging terrain. Drone Syst. Appl. 2024, 12, 1–15. [Google Scholar] [CrossRef] [Scilit]
  15. Poliachenko, I.; Kozak, V.; Bakhmutov, V.; Cherkes, S.; Varava, I. Preliminary results of UAV magnetic surveys for unexploded ordnance detection in Ukraine: Effectiveness and challenges. Geofiz. Zhurnal 2023, 45, 126–140. [Google Scholar] [CrossRef] [Scilit]
  16. Walter, C.; Braun, A.; Fotopoulos, G. Characterizing electromagnetic interference signals for unmanned aerial vehicle geophysical surveys. Geophysics 2021, 86, J21–J32. [Google Scholar] [CrossRef] [Scilit]
  17. Bondar, K.M.; Cherkes, S.; Poliachenko, I.; Kozak, V.; Kozlenko, R.; Sheiko, I. Roman Forts in the northern Black Sea area through the lens of Drone-Based Magnetometry. Archaeol. Prospect. 2025, 33, 275–287. [Google Scholar] [CrossRef] [Scilit]
  18. Stele, A.; Seisenbacher, C.; Kaub, L.; Häußler, G. Small change, big consequence: Extended landing gear provides high-quality drone-based magnetic data. In Recent Advances in Archaeological Geophysics 2024; NSGG: London, UK, 2024; pp. 24–27. [Google Scholar]
  19. Richter, K.; Poenicke, O.; Berndt, D. AutoDrone—Autonomer Bodennaher Drohnenflug für Hochgenaue Messdaten. 2025. Available online: https://www.ndt.net/article/dgzfp-drones_2025/papers/1655_Presentation.pdf (accessed on 29 July 2026).
  20. Scollar, I. Fourier transform methods for the evaluation of magnetic maps. Prospez. Archeol. 1970, 5, 9–41. [Google Scholar]
  21. Simms, J.E.; Larson, R.J.; Murphy, W.L.; Butler, D.K.; Geotechnical and Structures Laboratory; U.S. Army Engineer Research and Development Center; Alion Science and Technology Corporation. Guidelines for Planning Unexploded Ordnance (UXO) Detection Surveys; Report ERDC/GSL TR-04-8; U.S. Army Engineer Research and Development Center: Vicksburg, MS, USA, 2004. [Google Scholar]
  22. Schmidt, A.; Linford, P.; Linford, N.; David, A.; Gaffney, C. EAC Guidelines for the Use of Geophysics in Archaeology: Questions to Ask and Points to Consider. 2016. Available online: https://dev.archprospection.org/wp-content/uploads/files/EAC_Guidelines_2_Geophysics.pdf (accessed on 16 June 2026).
  23. Near-Surface Geophysics Inter-Society Committee on UAV Geophysics Guidelines. UAV Total and Vector Field Magnetics Surveying Guidelines (Version 1). 2022. Available online: https://irp.cdn-website.com/a8f5f39d/files/uploaded/Drone_Magnetic_Guidelines_Version1_13November2022-ea8dab8c.pdf (accessed on 28 April 2026).
  24. Accomando, F.; Vitale, A.; Bonfante, A.; Buonanno, M.; Florio, G. Performance of two different flight configurations for Drone-Borne magnetic data. Sensors 2021, 21, 5736. [Google Scholar] [CrossRef] [Scilit] [PubMed]
  25. Accomando, F.; Bonfante, A.; Buonanno, M.; Natale, J.; Vitale, S.; Florio, G. The drone-borne magnetic survey as the optimal strategy for high-resolution investigations in presence of extremely rough terrains: The case study of the Taverna San Felice quarry dike. J. Appl. Geophys. 2023, 217, 105186. [Google Scholar] [CrossRef] [Scilit]
  26. Ene, E. Optimization of High-Resolution Drone-Based Geophysical Prospection. Unpublished Master’s thesis, Ghent University, Ghent, Belgium, 2025. [Google Scholar]
  27. Eidam, H. Das kastell Theilenhofen. In Der Obergermanisch-Raetische Limes des Roemerreiches B VII Nr. 71a; Fabricius, E., Hettner, F., von Sarwey, O., Eds.; Verlag Otto Petters: Heidelberg, Germany, 1905. [Google Scholar]
  28. Reuter, M. Das Ende des Raetischen Limes im Jahr 254 n. Chr. Bayer. Vorgeschichtsblätter 2007, 72, 77–149. [Google Scholar]
  29. Fassbinder, J.W.E. Geophysical prospection of the frontiers of the Roman Empire in southern Germany, UNESCO World Heritage Site. Archaeol. Prospect. 2010, 17, 129–139. [Google Scholar] [CrossRef] [Scilit]
  30. Linck, R.; Kale, M.; Stele, A.; Schlechtriem, J. Testing the applicability of Drone-Based Ground-Penetrating Radar for archaeological prospection. Remote Sens. 2025, 17, 1498. [Google Scholar] [CrossRef] [Scilit]
  31. SENSYS. MagDroneR4—Reliable Magnetometer for Drones (UAV); SENSYS EN. Available online: https://sensysmagnetometer.com/products/magdrone-r4-magnetometer-for-drone/ (accessed on 28 April 2026).
  32. Chulliat, A.; Brown, W.; Nair, M.; Gomez Perez, N.; Young, L.-Y.; Watson, C.; Boneh, N.; Beggan, C.; Meyer, B.; Paniccia, M. The US/UK World Magnetic Model for 2015–2020; NERC Open Research Archive (Natural Environment Research Council); National Centers for Environmental Information, NOAA: Washington, DC, USA, 2015. [CrossRef] [Scilit]
  33. Ashraf, M.; Chapiro, A.; Mantiuk, R.K. Resolution limit of the eye—How many pixels can we see? Nat. Commun. 2025, 16, 9086. [Google Scholar] [CrossRef] [Scilit] [PubMed]
  34. Kaub, L.; Keller, G.; Bouligand, C.; Glen, J.M.G. Magnetic Surveys with Unmanned Aerial Systems: Software for assessing and comparing the accuracy of different sensor systems, suspension designs and compensation methods. Geochem. Geophys. Geosystems 2021, 22, e2021GC00974. [Google Scholar] [CrossRef] [Scilit]
  35. Stele, A.; Linck, R. Methodological Observations on Magnetic Prospecting at Two Hallstatt Period Enclosures in Bavaria. J. Multidiscip. Res. New Approaches Data 2024, 1, 19–33. [Google Scholar]
  36. Welch, P. The use of fast Fourier transform for the estimation of power spectra: A method based on time averaging over short, modified periodograms. IEEE Trans. Audio Electroacoust. 1967, 15, 70–73. [Google Scholar] [CrossRef] [Scilit]
  37. Priyadarshini, M.S.; Bajaj, M.; Prokop, L.; Berhanu, M. Perception of power quality disturbances using Fourier, Short-Time Fourier, continuous and discrete wavelet transforms. Sci. Rep. 2024, 14, 3443. [Google Scholar] [CrossRef] [Scilit] [PubMed]
  38. Oelsner, G.; Schultze, V.; IJsselsteijn, R.; Wittkämper, F.; Stolz, R. Sources of heading errors in optically pumped magnetometers operated in the Earth’s magnetic field. Phys. Rev. A 2019, 99, 013420. [Google Scholar] [CrossRef] [Scilit]
  39. Schultze, V.; Scholtes, T.; Wittkämper, F.; Stolz, R. Dead-Zone-Free optically pumped magnetometer with small heading error. IEEE Sens. J. 2025, 25, 28229–28237. [Google Scholar] [CrossRef] [Scilit]
  40. GFZ Declination Calculator—IGRF Declination Calculator. Available online: https://isdc.gfz.de/igrf-declination-calculator/ (accessed on 28 April 2026).
  41. SENSYS. Manual MagDroneR4, Version: 1.8. Available online: https://sensysmagnetometer.com/downloads-driver/ (accessed on 29 July 2026).
  42. Breiner, S. Applications Manual for Portable Magnetometers; The Digital Archeological Record (tDAR); Geometrics: Sunnyvale, CA, USA, 1999. [Google Scholar] [CrossRef]
  43. Kearey, P.; Brooks, M.; Hill, I. An Introduction to Geophysical Exploration; John Wiley & Sons: Hoboken, NJ, USA, 2002. [Google Scholar]
  44. The GFZ Helmholtz Centre for Geosciences. GFZ Kp Index—Geomagnetic Kp Index. Available online: https://kp.gfz.de/en/ (accessed on 28 April 2026).
  45. Stoll, J.B.; Kordes, T.; Noellenburg, R.; Jepsen, A. Multicopter-based Pentamag system proves out realistic performance metrics. Fast Times 2020, 25, 134–142. [Google Scholar]
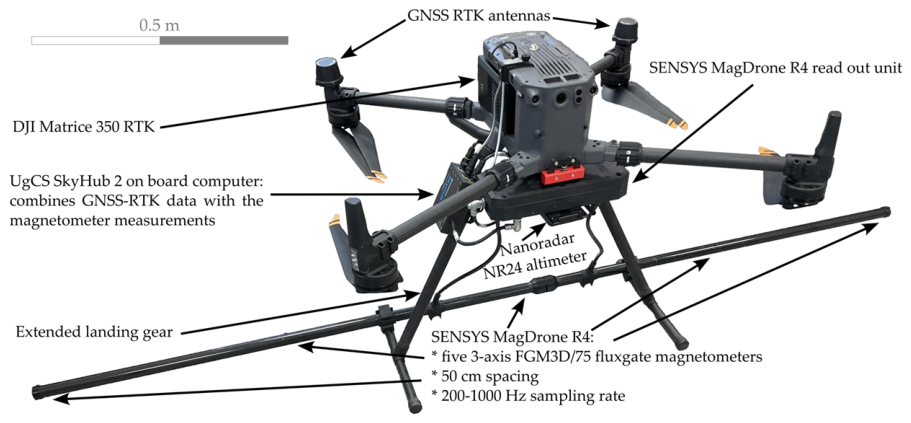
Figure 1. Currently widespread commercial configuration of the tested setup, consisting of a DJI M350 RTK carrier platform (Da-Jiang Innovations Science and Technology Co., Ltd., Shenzhen, China) equipped with extended landing gear and the SENSYS MagDrone R4 magnetometer array (SENSYS GmbH, Bad Saarow, Germany).
Remotesensing 18 02564 g001
Figure 2. The Location and a magnetogram of the Theilenhofen test site (middle Franconia, Germany) showing the older Roman timber-earth fort in the west and the younger Roman stone fort in the east. The magnetogram was processed from cesium (g-b) magnetometer data [29]. All drone-based (d-b) magnetometry test areas associated with the respective figures are located within the younger stone fortress. Geodata sources: © Bayerische Vermessungsverwaltung 2025—www.geodaten.bayern.de & © Bundesamt für Kartographie und Geodäsie, Frankfurt am Main, 2011, accessed on 29 July 2026.
Remotesensing 18 02564 g002
Figure 3. Mean PSDs derived from raw R4 data recorded by all five sensors using three different platform–sensor configurations along several identical survey profiles, together with a stationary drift measurement. Platforms: (top, blue) DJI M300 RTK with standard landing gear; (middle right, purple) DJI M350 RTK with extended landing gear; (bottom, green and black dashed) custom-built frame for terrestrial deployment (g-b) of the R4 magnetometer array. For stationary measurements, the first and last 10 s of each dataset are removed. Drone-based data acquired in the east–west direction comprise a combination of spectra derived from both westward and eastward. +++ indicates an excellent SNR, ++ a very good SNR, and + a good SNR.
Remotesensing 18 02564 g003
Figure 4. Mean PSDs calculated from R4 raw data of individual survey lines shown together with the respective flight direction. Upper-left inset: the same PSD graphs displayed within the usable frequency range. The declination for the test site at the time of measurement was calculated using the ISDC IGRF Declination Calculator [40]. UAV: DJI M300 RTK with standard landing gear.
Remotesensing 18 02564 g004
Figure 5. Comparison of two test flights conducted with the UAV platforms DJI M300 RTK (red) and DJI M350 RTK (blue). The left panel shows the corresponding PSDs, with solid lines representing spectra derived from raw data and dashed lines indicating the power spectra of the respective filtered datasets. The inset (upper middle) shows the same PSD graphs displayed within the usable frequency range. The right panel presents the filtered results as magnetograms.
Remotesensing 18 02564 g005
Figure 6. Selected flight altitudes of a flight altitude–signal strength test. The left panel shows the PSDs of the raw data from all sensors at their respective flight altitudes, while the right panel presents the corresponding magnetograms filtered using a 2 Hz low-pass filter combined with a constant median filter. UAV: DJI M350 RTK with standard landing gear.
Remotesensing 18 02564 g006
Figure 7. Selected velocity test data acquired at the same sensor altitude of 60 cm (+/− 10 cm) AGL. The left panel shows magnetograms generated from filtered data (2 Hz cut-off low-pass filter combined with a constant median filter) at the respective velocities (each time in comparison to a 2 m/s velocity regarded as an ideal solution), while the right panel presents the corresponding mean PSDs derived from raw data. UAV: DJI M350 RTK with extended landing gear.
Remotesensing 18 02564 g007
Figure 8. The upper panels show CWTs of the same survey line acquired at flight velocities of 2 and 5 m/s. The underlying structure (US), dominant underlying structure (DUS), harmonic structure (HS), and periodic modulation (PM) are clearly visible. The middle panels illustrate the individual structures within the PSDs of both measurements. The lower panel demonstrates the influence of flight velocity on in-line point density. UAV: DJI M350 RTK with extended landing gear.
Remotesensing 18 02564 g008
Figure 9. Strongly simplified mind map for the preparation, execution, post-processing, and interpretation of UAV-based magnetometry data in archeological and EO contexts. Aspects underlined in red may be critical for permissions, data quality, and interpretation, whereas aspects underlined in blue are optional in character.
Remotesensing 18 02564 g009
Disclaimer/Publisher’s Note: The statements, opinions and data contained in all publications are solely those of the individual author(s) and contributor(s) and not of MDPI and/or the editor(s). MDPI and/or the editor(s) disclaim responsibility for any injury to people or property resulting from any ideas, methods, instructions or products referred to in the content.