


Highlights
What are the main findings?
- An LSM framework constrained by InSAR-derived deformation was proposed by integrating SBAS-InSAR deformation analysis, multi-source geo-environmental data, and machine learning.
- An RF-BPNN combined model was used for susceptibility mapping, and Shapley value analysis identified slope, elevation, rainfall, and relief as the dominant factors controlling landslide susceptibility prediction.
What are the implications of the main findings?
- The KDE-PCC-based classification adjustment provides a quantitative way to incorporate observation-period deformation activity into susceptibility classification threshold optimization.
- The Xiangle and Namu landslide cases illustrate the adjustment effects of incorporating InSAR-derived deformation constraints into susceptibility classification.
Abstract
Landslide susceptibility mapping (LSM) is fundamental to disaster prevention and spatial risk management in mountainous regions. However, conventional LSM approaches that rely mainly on static landslide influencing factors and empirical classification thresholds may have limited temporal relevance and interpretability. In response to these limitations, this study proposed an LSM framework constrained by interferometric synthetic aperture radar (InSAR)-derived deformation information. Wangmo County, Guizhou Province, China, was selected as the study area. Multi-source data, including small baseline subset InSAR (SBAS-InSAR) deformation results, optical remote sensing imagery, geo-environmental factors, and field investigation data, were used to construct and validate four machine learning models: logistic regression (LR), random forest (RF), support vector machine (SVM), and back-propagation neural network (BPNN). The validation results showed that the RF and BPNN models performed better than the LR and SVM models in terms of AUC, accuracy, precision, recall, and F1-score. Accordingly, an RF–BPNN combined model was constructed using an equal-weight averaging strategy. Shapley value analysis indicated that terrain- and rainfall-related factors made dominant contributions to landslide susceptibility prediction, a finding consistent with the landslide development characteristics in the study area. InSAR-derived deformation information was extracted from 31 Sentinel-1A images using SBAS-InSAR. A classification adjustment strategy based on kernel density estimation (KDE) and the Pearson correlation coefficient (PCC) was then used to identify the susceptibility classification scheme with relatively high spatial consistency with deformation activity during the observation period. The optimized classification scheme achieved a PCC value of 0.65, compared with 0.61 for the natural breaks classification, indicating a modest improvement in the spatial consistency between susceptibility zoning and deformation activity. The Xiangle and Namu landslides were used as representative cases to illustrate the adjustment effects of the deformation-constrained classification scheme. The proposed framework provides a practical approach for incorporating observation-period InSAR-derived deformation information into regional LSM and can support landslide monitoring and decision-making in complex terrains.
1. Introduction
Landslide susceptibility mapping (LSM) has emerged as a crucial component of geohazard research, particularly as the frequency and intensity of landslide events increase due to factors such as climate change and urbanization [1,2]. The assessment of landslide susceptibility is vital for effective land use planning, disaster risk reduction, and resource management [3,4]. Over the years, significant advancements have been made in methodologies, data acquisition techniques, and application domains, demonstrating the increasing complexity of landslide processes [5,6,7].
Current research in landslide susceptibility analysis encompasses a wide range of approaches. The methods applied to predict landslide susceptibility can be classified into three categories: experience-driven, physical-driven, and data-driven methods [7]. Experience-driven methods mainly rely on expert knowledge or expert scoring, such as the analytic hierarchy process (AHP) and fuzzy logic methods (FLM), but they are susceptible to subjective judgment [8,9]. Physically based models, such as SHALSTAB, SINMAP, and TRIGRS, are developed based on the physical mechanisms of slope failure [10,11,12]. However, these methods usually require high-precision hydrological, geotechnical, and mechanical parameters, which limits their application at regional scales. In contrast, data-driven methods are more suitable for regional-scale LSM. Conventional statistical methods, such as frequency ratio (FR), information value (IV), and certainty factor (CF), have been widely used in landslide susceptibility assessment [13,14,15], but they still have limitations in dealing with complex nonlinear relationships controlled by multiple factors. Machine learning methods, such as logistic regression (LR), support vector machine (SVM), random forest (RF), and back-propagation neural network (BPNN), can better characterize the nonlinear relationships between landslide development and geo-environmental factors, and have therefore become important methods in current LSM research [16,17,18].
Although machine learning-based LSM has shown promising performance, several issues still need further improvement. First, the reliability of model prediction results largely depends on the quality of training samples, especially the selection of non-landslide samples. Improper selection of non-landslide samples may affect the reliability of model training and prediction results [19]. Second, although machine learning models have strong nonlinear fitting capabilities, some models exhibit “black-box” characteristics, making their prediction results difficult to interpret directly [20]. This limitation hinders understanding of the contributions and geological significance of different geo-environmental factors to landslide susceptibility. Third, conventional LSM is mainly based on relatively static geo-environmental factors, such as topography, geology, and hydrology, and usually reflects the spatial tendency of landslide occurrence under certain geo-environmental conditions. Due to the lack of temporal constraints such as InSAR-derived deformation during the observation period, landslide susceptibility classification often relies on statistical classification methods or expert judgment, which may not fully reflect recent slope activity [21,22]. Therefore, it is necessary to improve the existing LSM framework in terms of sample construction, model interpretation, and classification optimization.
In terms of sample construction, commonly used methods for selecting or optimizing non-landslide samples include random sampling, susceptibility-zoning sampling, slope-threshold sampling, self-organizing map-based sampling, and similarity-based sampling [23,24,25,26,27]. Random sampling usually selects non-landslide samples from areas without mapped landslides or from buffer zones away from known landslides, but it may still misclassify potentially unstable slopes as non-landslide samples. Susceptibility-zoning sampling usually selects non-landslide samples from low-susceptibility areas derived from empirical or statistical analysis, but it may not fully represent the complete characteristics of non-landslide areas. Slope-threshold sampling mainly selects non-landslide samples based on a specific slope range, ignoring the combined influence of multiple geo-environmental factors. Self-organizing map-based sampling and similarity-based sampling can improve sample selection to some extent, but they involve relatively complex computations and rely on sample feature selection. Moreover, this optimization is solely derived from algorithm-level computations and may not accurately represent real-world conditions. Random sampling and susceptibility-zoning sampling are commonly used for selecting non-landslide samples, but both overlook the reliability of non-landslide samples and the possibility of misclassifying potential landslides as non-landslide samples [5]. Therefore, how to select more reliable non-landslide samples remains an important issue in machine learning-based LSM.
In terms of model interpretation, relying only on model accuracy evaluation is insufficient to fully explain the geological meaning of machine learning prediction results [28,29]. Machine learning models can extract information related to landslide development from multi-source geo-environmental factors, but different models may respond differently to these factors and assign them different levels of contribution. Without an explanation of the model’s prediction process and the main factors controlling landslide susceptibility prediction, the credibility and practical value of LSM results may be weakened. Therefore, it is necessary to introduce explainable analysis methods into landslide susceptibility modeling to quantitatively identify the contributions of different geo-environmental factors to model prediction results, thereby enhancing the interpretability and geological rationality of machine learning-based LSM.
In terms of classification optimization, recent advances in small baseline subset interferometric synthetic aperture radar (SBAS-InSAR) and persistent scatterer interferometric synthetic aperture radar (PS-InSAR) technologies have made it possible to incorporate observation-period deformation information into LSM [30,31]. These techniques can obtain deformation information over specific observation periods and provide important evidence for identifying active or potentially unstable slopes [32,33,34]. Integrating InSAR-derived deformation information with machine learning-based LSM can help improve the temporal relevance of landslide susceptibility assessment. Existing studies have commonly combined LSM results with deformation information using matrix overlay or correction matrix methods [35,36]. Although these methods can enhance the dynamic representation of LSM to some extent, they are still limited by the difficulty of objectively determining the weights or correction rules used to integrate susceptibility zoning results with InSAR-derived deformation information. In addition, in areas with complex terrain or dense vegetation cover, InSAR-derived deformation data may contain gaps or missing values [37]. If deformation data are directly overlaid with the LSM results, the final map may contain discontinuities or blank areas. Therefore, it is necessary to explore an integration strategy that uses InSAR-derived deformation information to constrain LSM while maintaining the spatial continuity of the susceptibility map.
In response to these limitations, this study proposes a landslide susceptibility mapping framework constrained by InSAR-derived deformation information, integrating machine learning, SBAS-InSAR, optical remote sensing interpretation, geo-environmental factors, and field investigations. The framework first improves the reliability of training samples. Based on historical landslide records, optical remote sensing interpretation, and field investigation, relatively stable non-landslide samples were selected by considering slope structure stability and buffer constraints around known landslides, thereby reducing the possibility of misclassifying potentially unstable slopes as non-landslide samples. In terms of model construction, LR, RF, SVM, and BPNN models were used for landslide susceptibility modeling, and Shapley value analysis was introduced to quantify the contributions of different geo-environmental factors to model prediction results, thereby enhancing the interpretability and geological rationality of the machine learning models. In terms of susceptibility classification, InSAR-derived deformation activity during the observation period was used as an independent spatial reference, and a KDE-PCC-based classification adjustment strategy was constructed. In this strategy, kernel density estimation (KDE) was used to extract the spatial distribution patterns of deformation activity and candidate susceptibility zoning results, while the Pearson correlation coefficient (PCC) was used to evaluate their relative spatial consistency. The classification scheme with a relatively high PCC was selected to generate the final landslide susceptibility map constrained by observation-period deformation information. Compared with methods that directly overlay InSAR-derived deformation data with the LSM result, this strategy can use deformation information to constrain susceptibility classification thresholds while maintaining the spatial continuity of LSM. To illustrate the application of the proposed framework, the area from Bianrao to Wangmo Town in Wangmo County, Guizhou Province, China, was selected as the study area.
2. Study Area and Data Preparation
2.1. Study Area
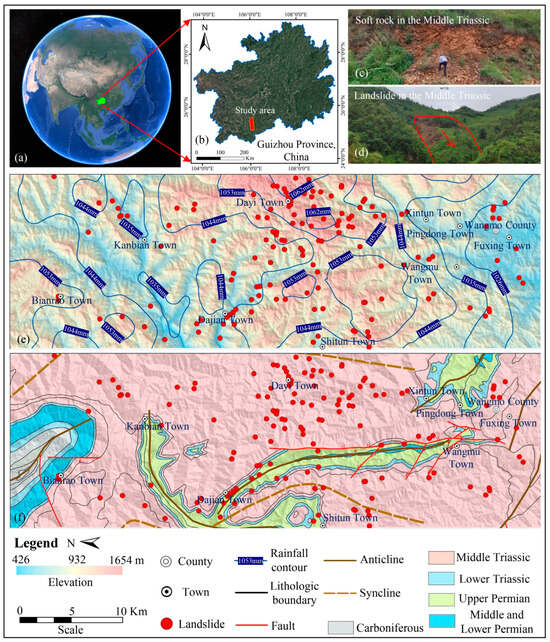
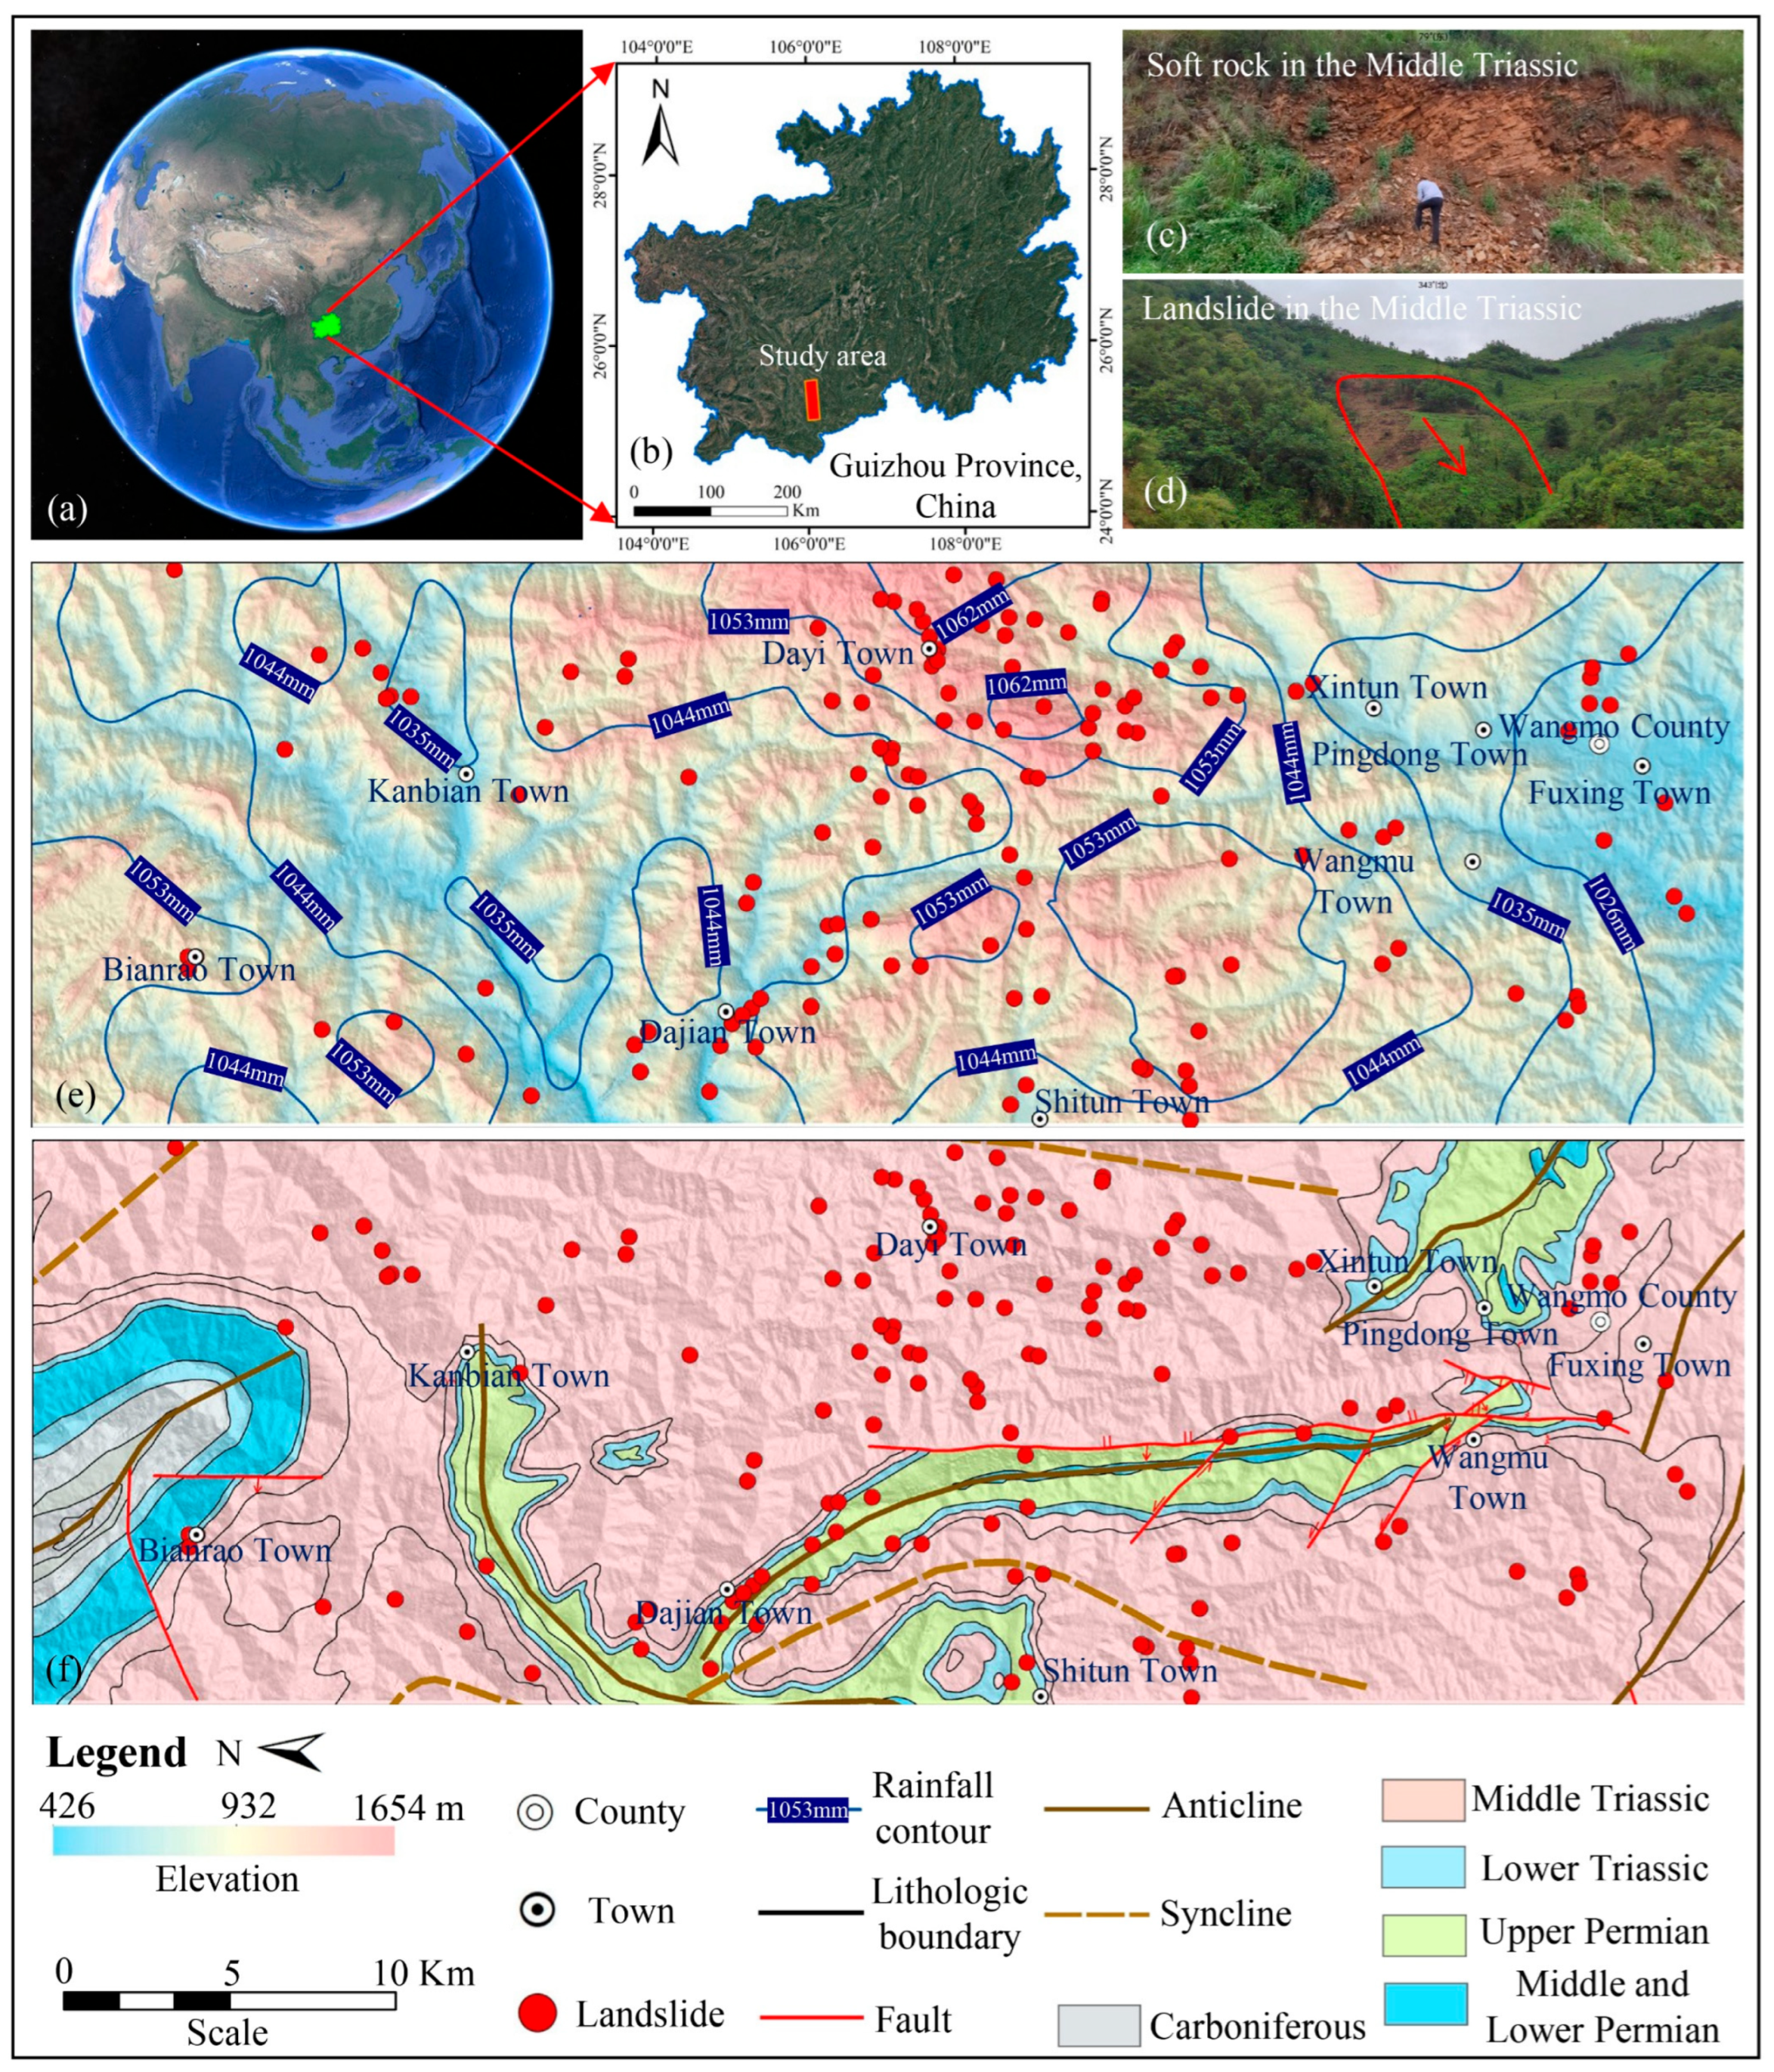
The study area is located in the northern part of Wangmo County, Guizhou Province, China (105°57′~106°09′E, 25°08′~25°36′N), with a total area of 785.36 km2, and is prone to geological hazards (Figure 1) [38]. The region is situated in the slope zone transitioning from the Yunnan–Guizhou Plateau to the Guangxi Hills. It is dominated by mountainous terrain, with elevations ranging from 426 to 1654 m. The terrain is relatively steep, with slopes generally between 25° and 35°. The average annual precipitation in the study area is 1233.8 mm, with the main rainfall occurring in the Dayi Township area.
Figure 1.
Location and geo-environment of the study area: (a,b) location; (c) soft rock; (d) typical soft rock landslide; (e) elevation and rainfall; (f) geology.
The study area lies in the transitional zone between the Yangtze Block and the Youjiang Orogenic Belt, where fault and folds are well developed. The geological structural features are characterized mainly by northwestward reverse faulting and multiple anticlinal structures. The exposed strata in the region consist primarily of soft rock layers from the Middle Triassic. These rock slopes are influenced by regional tectonic activity and long-term weathering, resulting in highly weathered and fractured surface rock masses, which are highly susceptible to landslides under the influence of rainfall.
2.2. Data Preparation
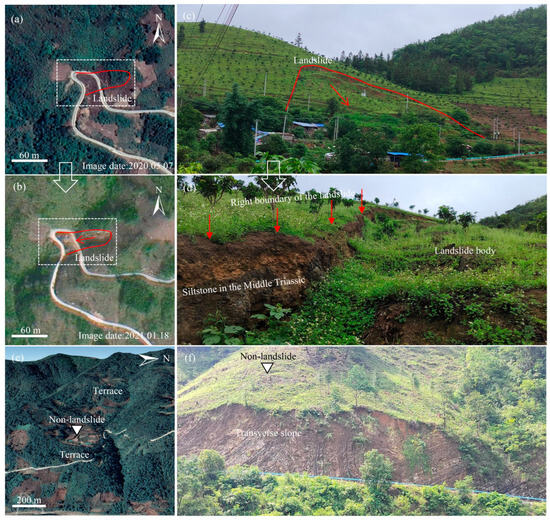
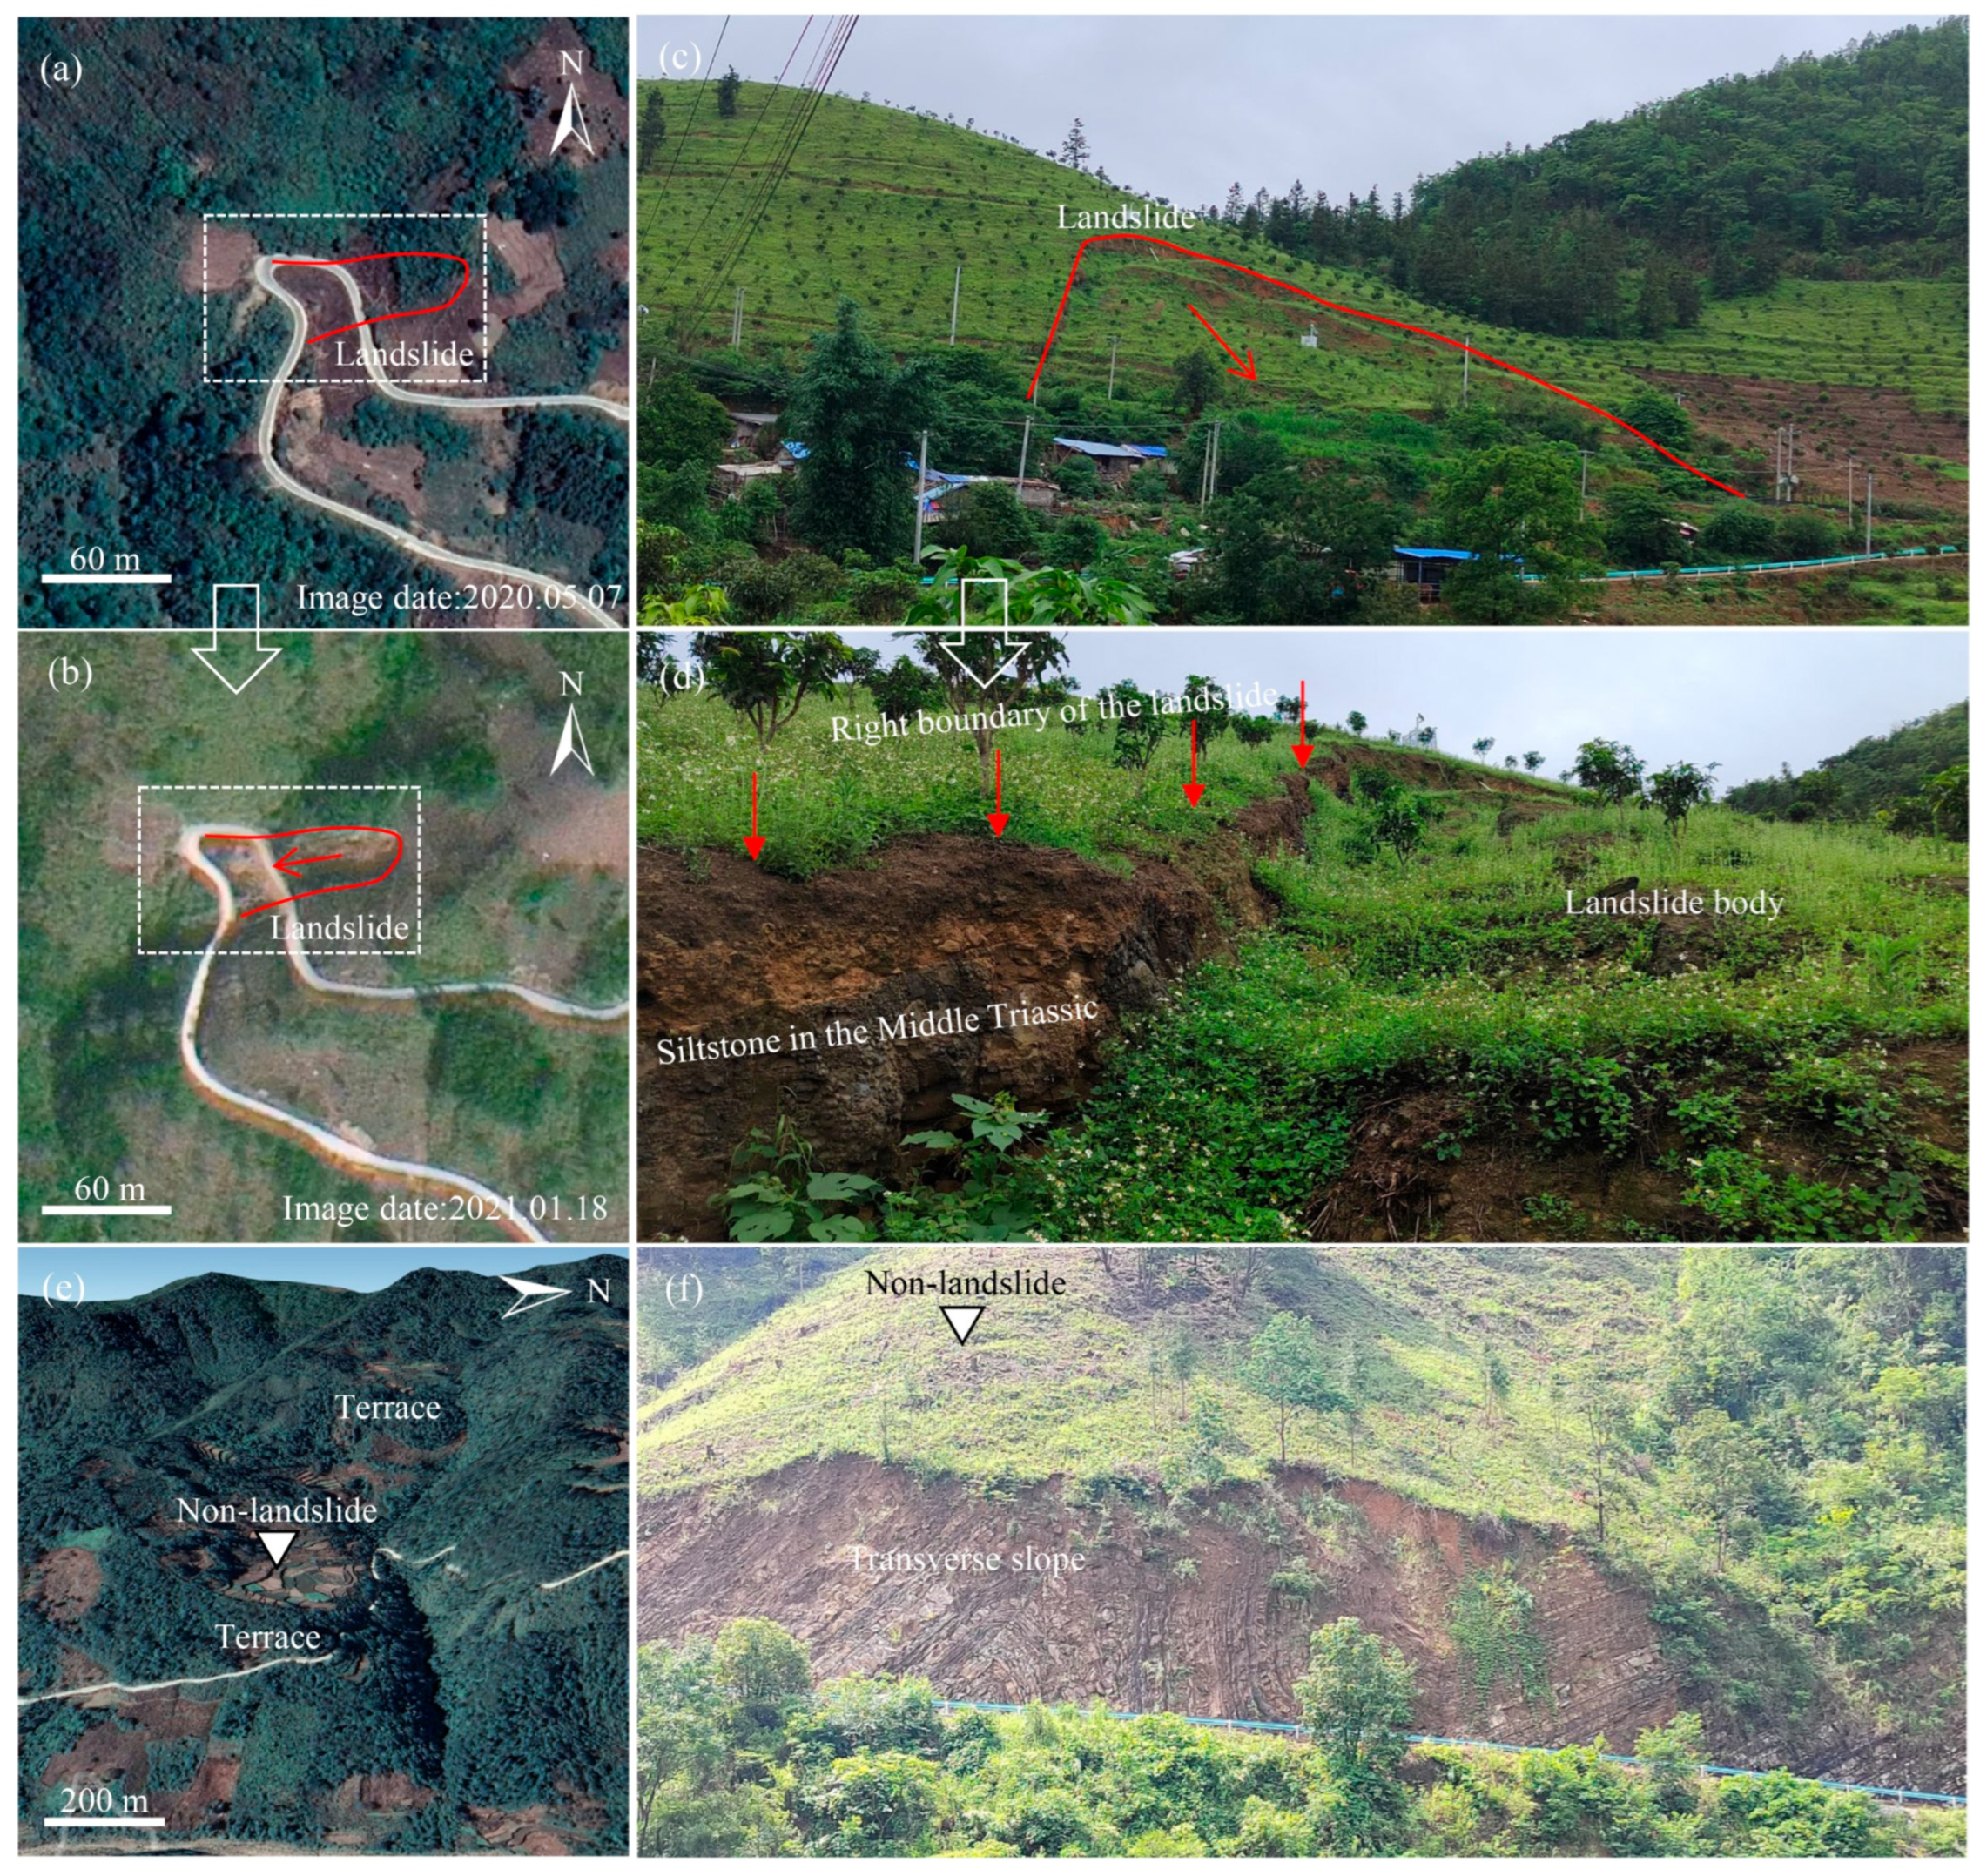
A landslide inventory map was developed by integrating geological hazard investigation data for Wangmo County, field geological investigation, and multi-temporal remote sensing interpretation based on Google Earth imagery (Figure 2). The landslide inventory was mainly compiled from the geological hazard investigation records of Wangmo County, which provided information on the locations, types, and development characteristics of geological hazards in the study area. On this basis, a 1:10,000 field geological investigation was carried out, and multi-temporal Google Earth imagery was used to verify and refine the locations, types, morphological characteristics, and boundaries of the landslides. Finally, a total of 142 landslides were identified in the study area. The identified landslides were mainly concentrated in areas with relatively high rainfall, such as Dayi Township, and were mostly distributed in higher-elevation zones of the study area. They were generally small to medium in scale and were mainly rock slides.
Figure 2.
Identification of landslide and non-landslide samples in the study area: (a,b) multi-temporal remote sensing interpretation; (c,d) field investigation; (e,f) selection of non-landslide samples.
To construct the sample set for machine learning, one representative landslide sample point was selected for each mapped landslide as a landslide sample (Figure 1). The representative point was selected from the main deformation area or source area of the landslide. The geo-environmental factor values at each representative point were then extracted as the attributes of the corresponding landslide sample. In addition, 142 non-landslide samples were selected for machine learning model development using a constrained random sampling strategy (Figure 2). Specifically, slope structures in the study area were first investigated in detail through remote sensing interpretation and field geological surveys. Random sampling was then conducted outside the mapped landslide areas. To improve the reliability of the non-landslide samples, a 1000 m buffer around the mapped landslides was excluded during the sampling process. Finally, 142 non-landslide samples were selected from areas with relatively stable slope structures and without obvious landslide-related geomorphic features. As a result, a balanced sample set consisting of 142 landslide samples and 142 non-landslide samples was constructed for machine learning model development. It should be noted that this design was mainly used to improve the model’s ability to identify the characteristics of landslide samples, rather than to represent the actual spatial proportions of landslide and non-landslide areas in the study area.
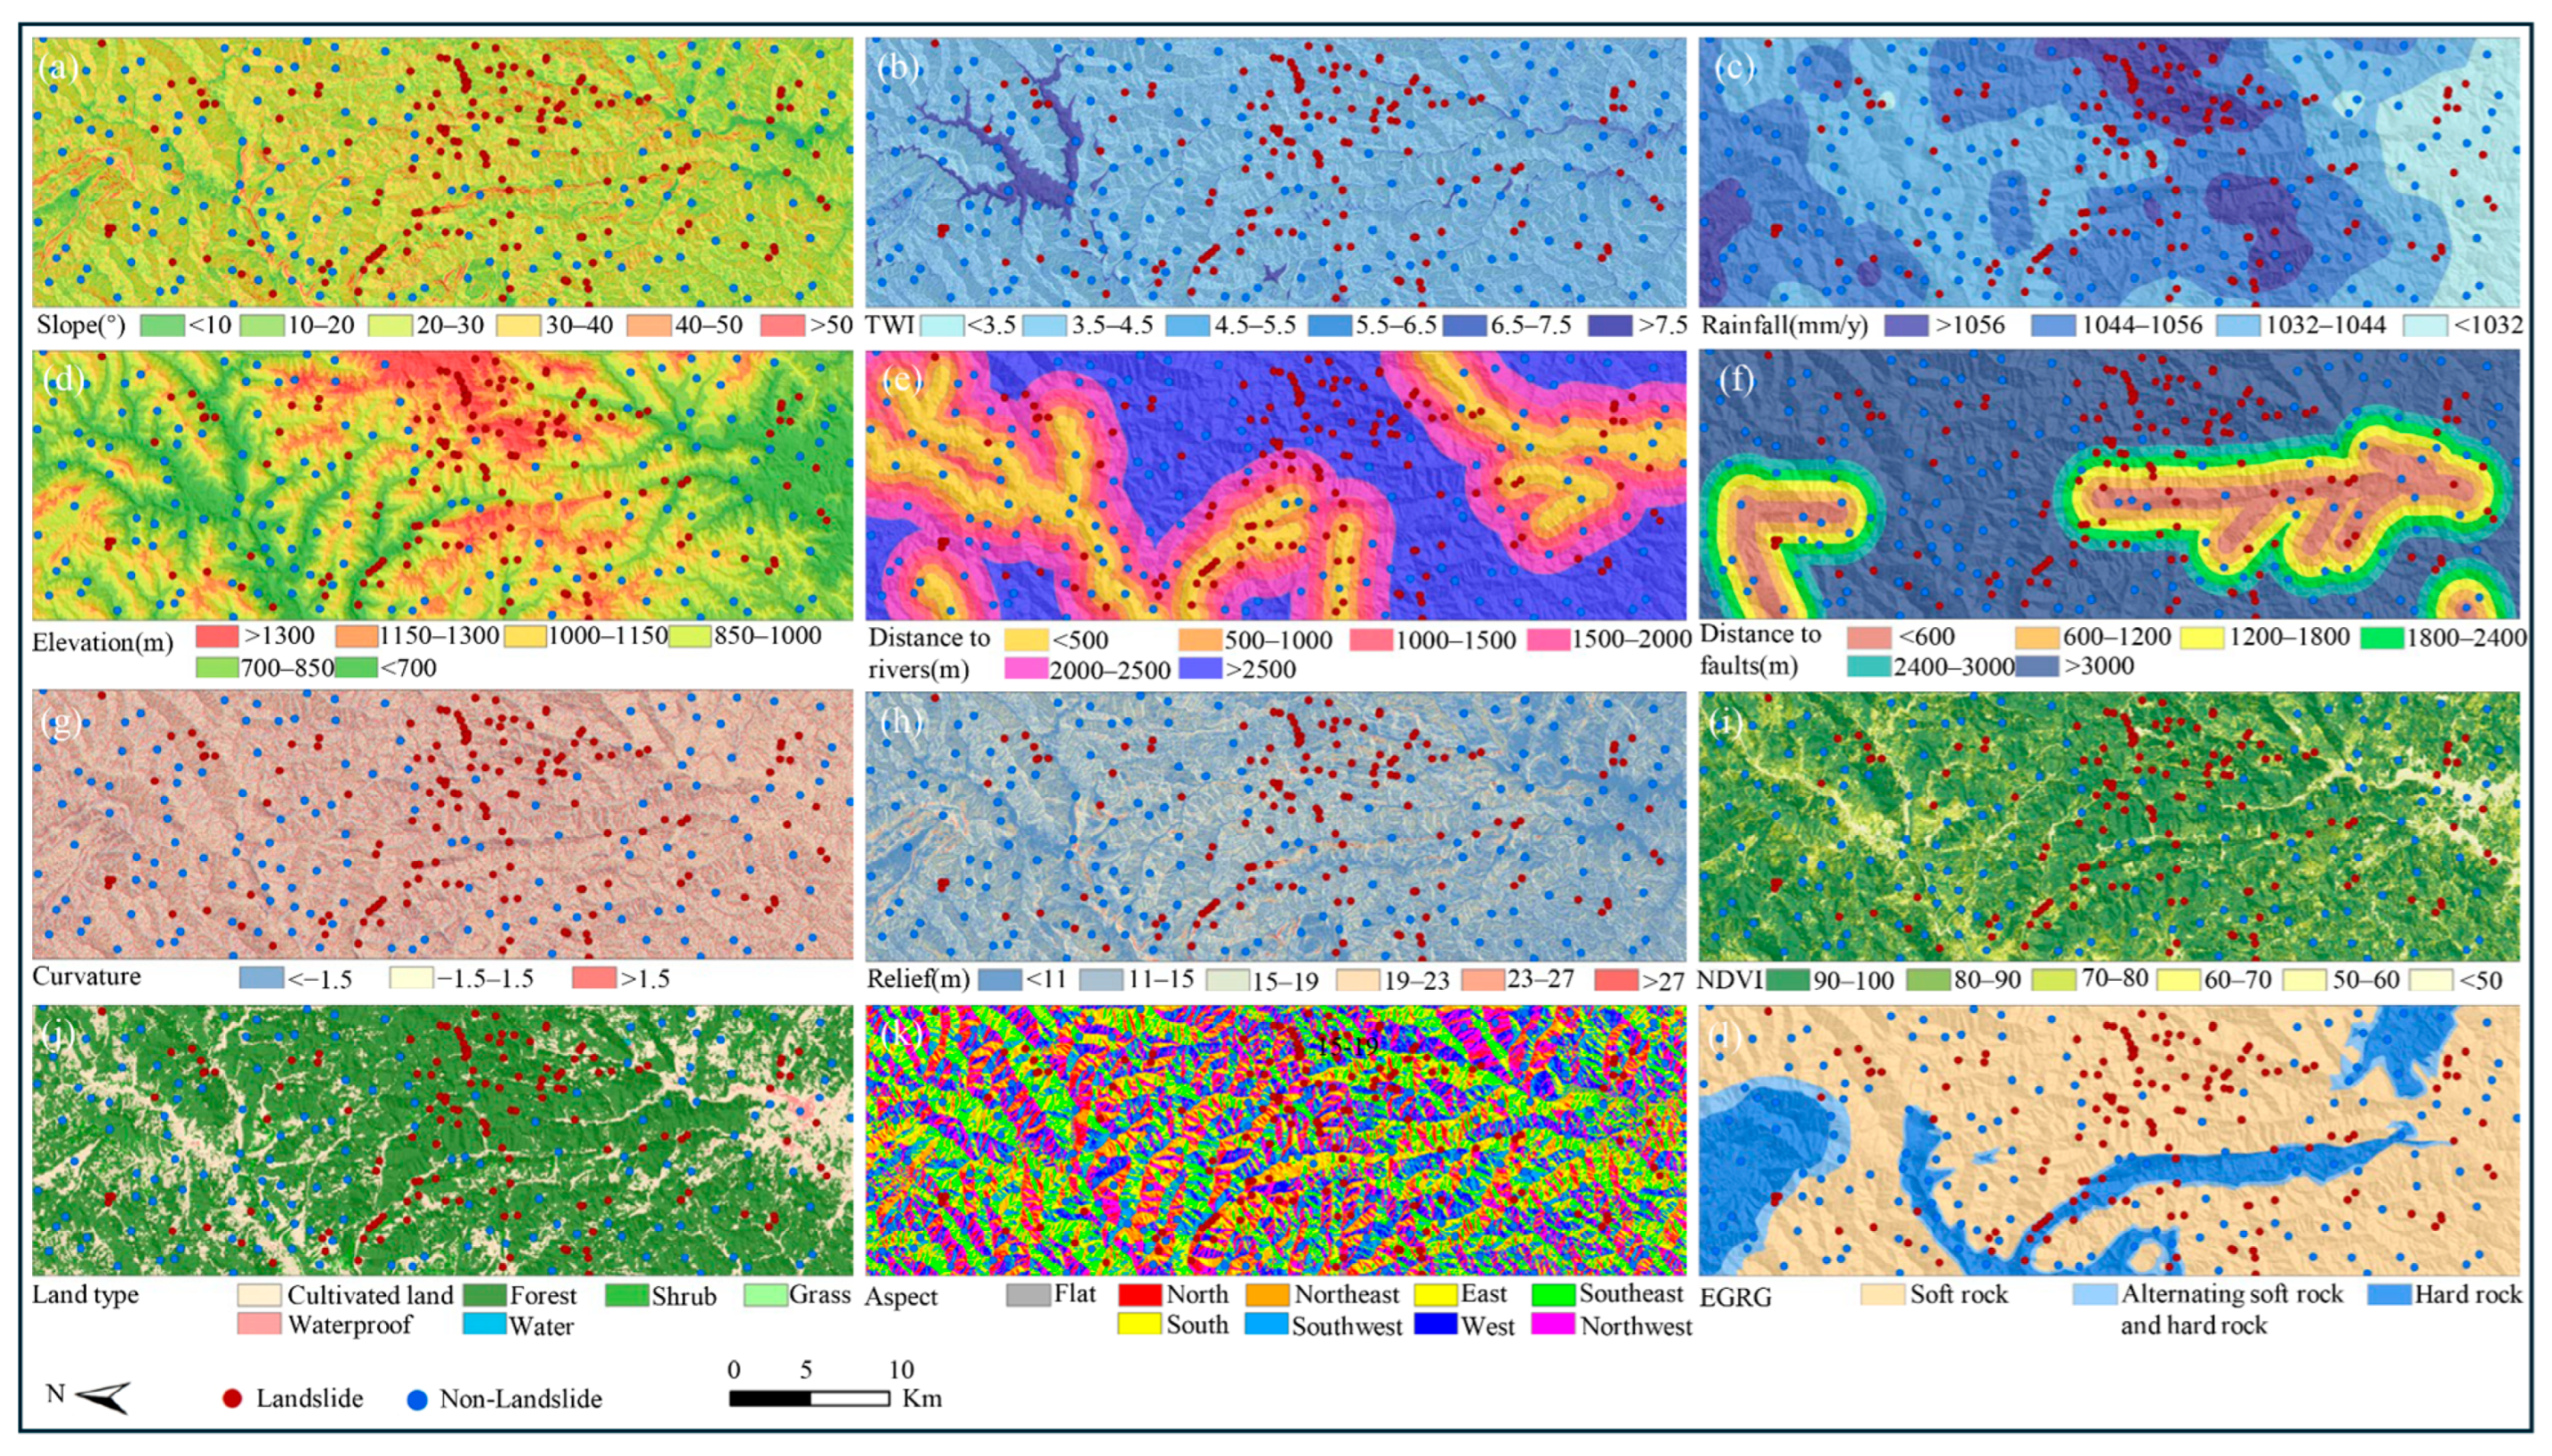
Based on previous studies and the characteristics of historical landslides in the study area, twelve influencing factors were selected for landslide susceptibility analysis, including elevation, slope, aspect, relief amplitude, engineering geological rock groups (EGRG), curvature, distance to rivers, distance to faults, normalized difference vegetation index (NDVI), land type, topographic wetness index (TWI), and rainfall (Figure 3). The landslide influencing factors used in this study were obtained from the data sources listed in Table 1. Before model construction, all factor datasets were preprocessed, projected to the same coordinate system, and resampled to a uniform 10 m × 10 m raster grid to ensure consistency in spatial extent, pixel size, and grid alignment among different data layers.
Figure 3.
Datasets of landslide influencing factors used for landslide susceptibility analysis: (a) slope; (b) TWI; (c) rainfall; (d) elevation; (e) distance to rivers; (f) distance to faults; (g) curvature; (h) relief; (i) NDVI; (j) land type; (k) aspect; (l) EGRG.
Table 1.
Data sources and factor descriptions used in this study.
The SBAS-InSAR technique, proposed by Berardino et al. (2002) [39], can reduce the effects of temporal and spatial decorrelation. It is widely used for regional deformation monitoring [40]. In this study, 31 C-band Sentinel-1A ascending-track images from 2022 to 2023 were obtained from the European Space Agency (ESA). The images have a ground resolution of 5 × 20 m and were processed using GAMMA software (GAMMA Remote Sensing AG, Gümligen, Switzerland, version 2025) for SBAS-InSAR deformation extraction. In addition, the DEM associated with the ALOS PALSAR product was used as the topographic reference.
3. Improved Landslide Susceptibility Analysis Framework
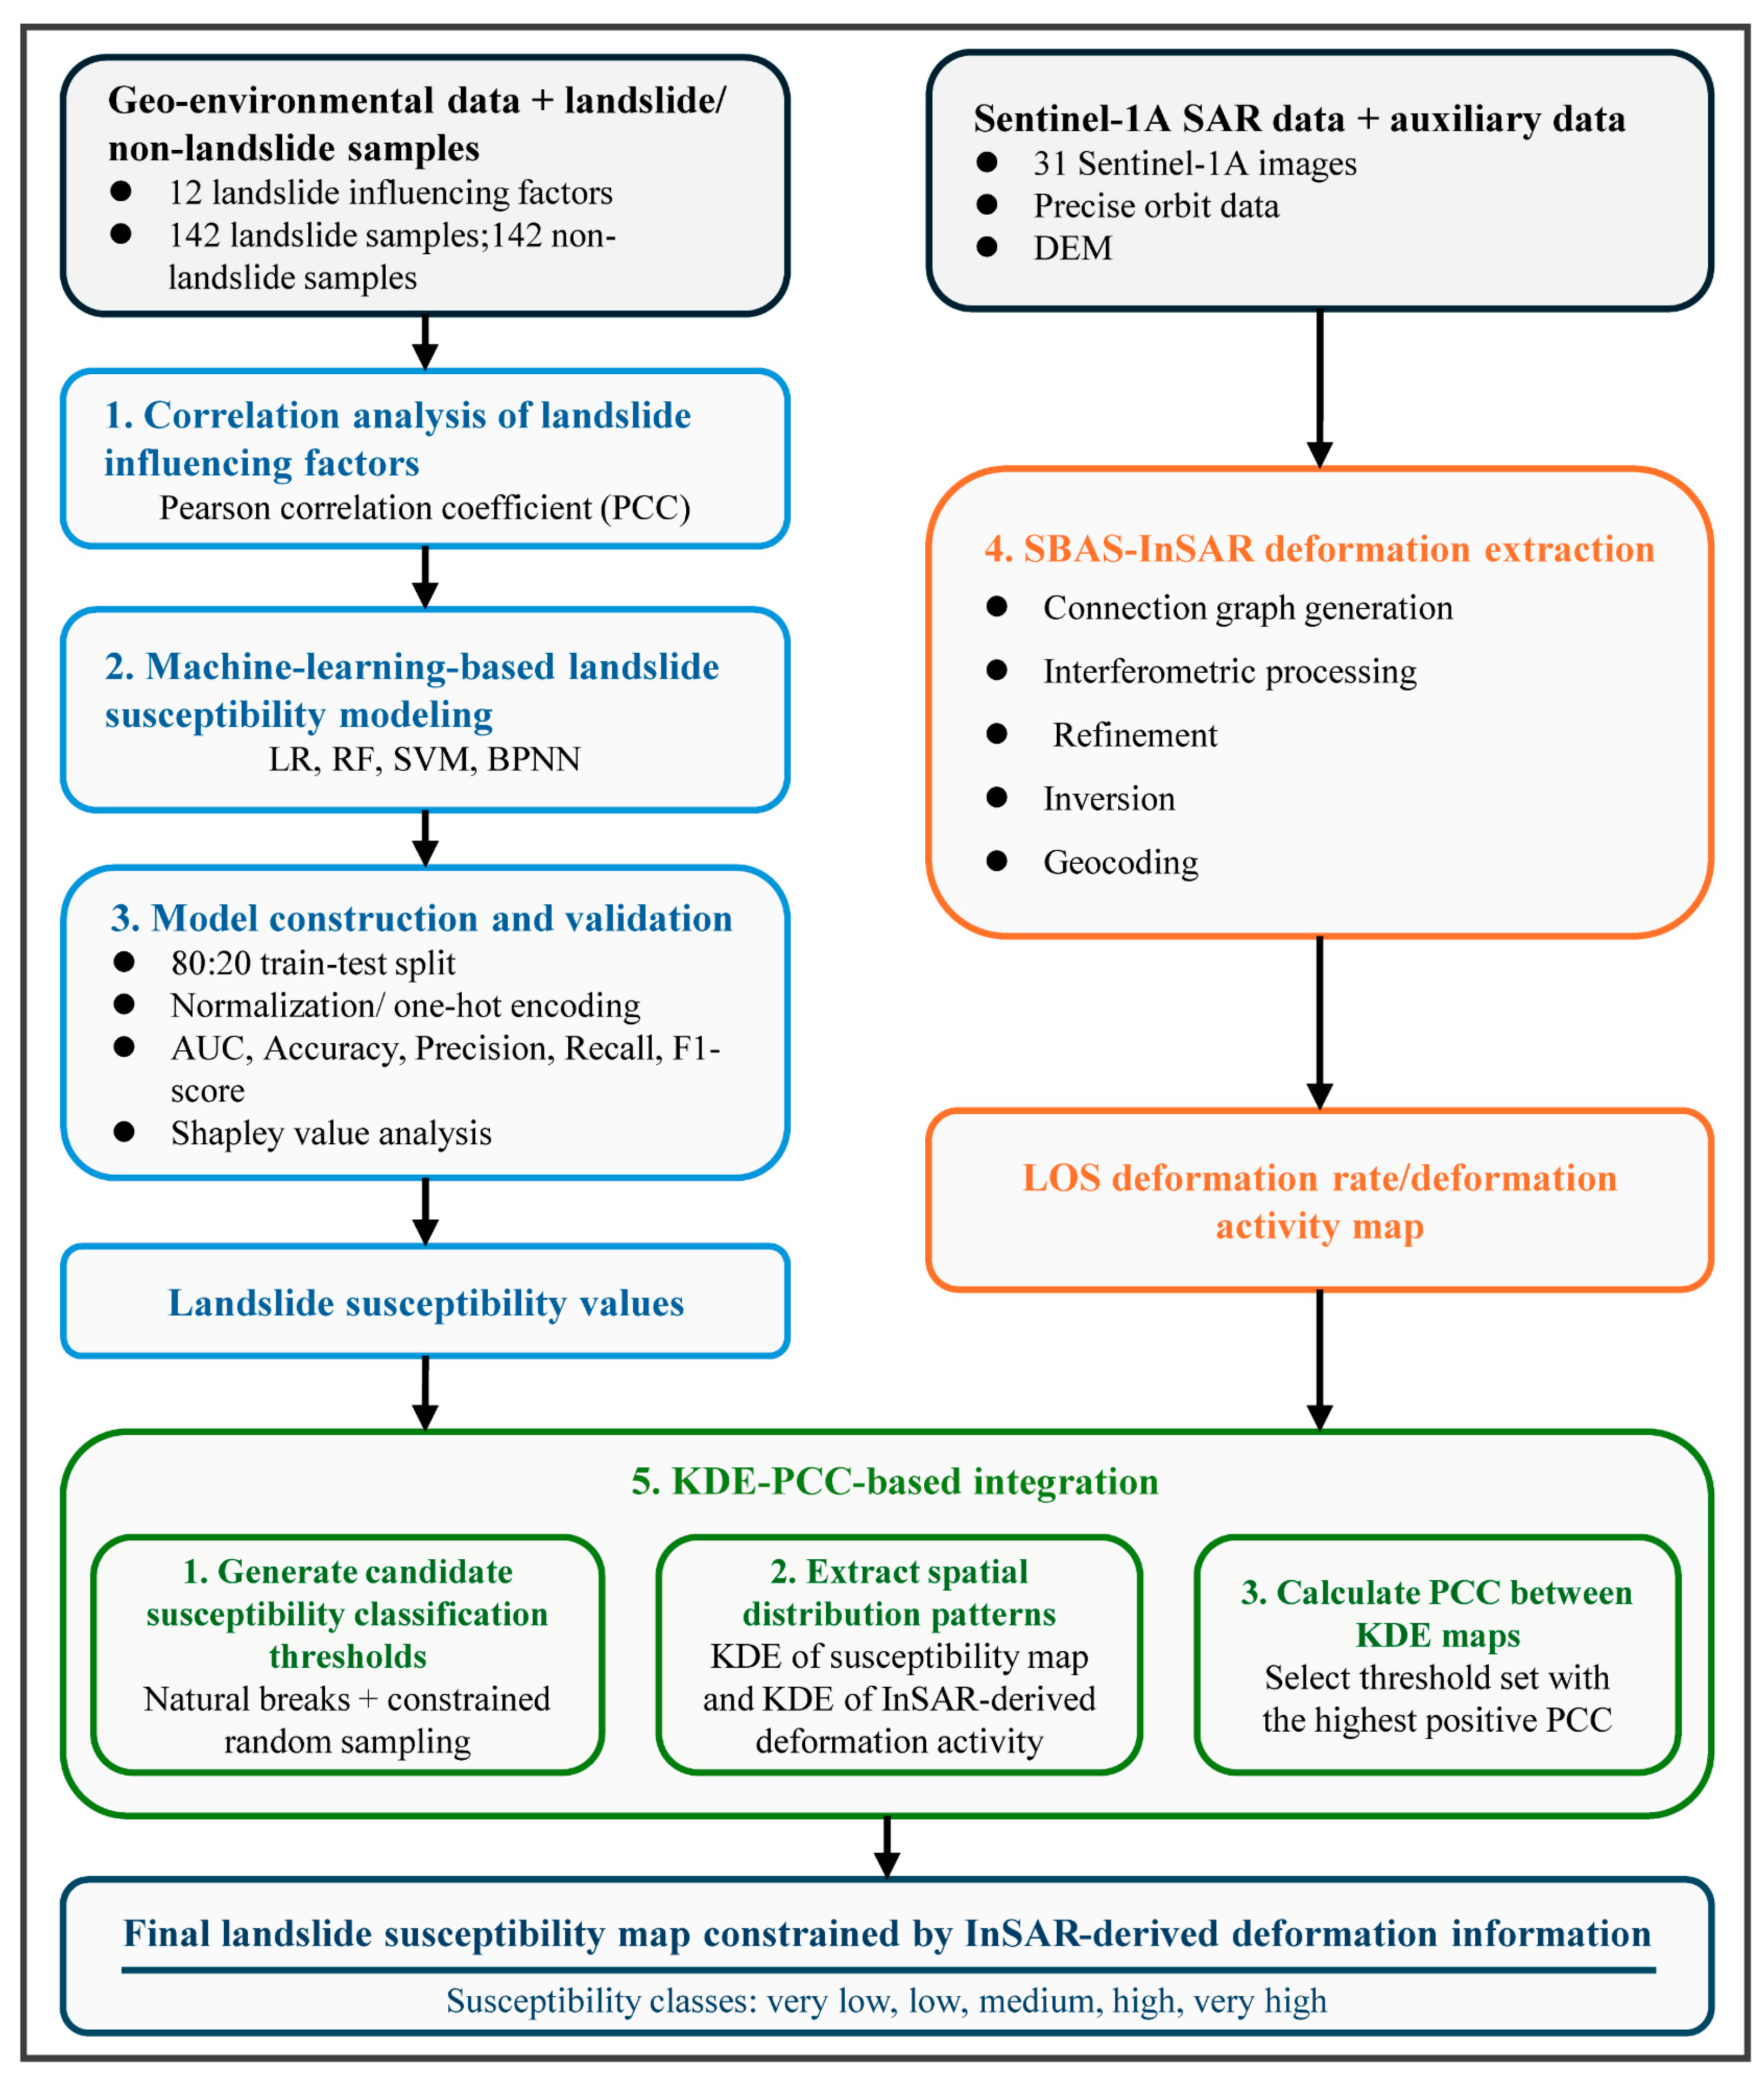
In this study, a landslide susceptibility mapping framework constrained by InSAR-derived deformation information was developed by integrating multi-source geo-environmental data, machine learning, and SBAS-InSAR deformation observations (Figure 4). The workflow was divided into five logically connected modules: (1) correlation analysis of landslide influencing factors; (2) machine learning-based landslide susceptibility modeling; (3) model construction and validation; (4) SBAS-InSAR deformation extraction; and (5) KDE-PCC-based spatial consistency analysis and landslide susceptibility mapping. In this framework, the machine learning module outputs the initial susceptibility values, whereas the SBAS-InSAR module provides observation-period deformation activity. The KDE-PCC module links the susceptibility output to the deformation activity information and determines the final susceptibility classification thresholds.
Figure 4.
Deformation-constrained landslide susceptibility analysis framework in this study.
3.1. Correlation Analysis of Landslide Influencing Factors
Correlations among landslide influencing factors may affect model performance, particularly for models that are sensitive to correlated predictors. Therefore, the relationships among landslide influencing factors should be examined before model construction. Many methods, such as the condition index (CI), variance inflation factor (VIF), tolerance (T), and Pearson correlation coefficient (PCC), are widely used to analyze correlations among factors [7,41,42,43,44]. In this study, the PCC method was used to analyze the pairwise correlations among landslide influencing factors and to evaluate whether strong correlations existed between the selected factors.
3.2. Machine Learning-Based Landslide Susceptibility Modeling
LR, RF, SVM, and BPNN are commonly used machine learning models for landslide susceptibility calculation. The LR model is a classic and simple classification algorithm suitable for many practical problems, especially binary classification problems [45,46]. Although named “regression”, logistic regression is actually a classification algorithm commonly used to predict the probability of a sample occurring. The RF model is an ensemble learning algorithm that constructs multiple decision trees using bootstrap samples randomly selected from the original dataset [47,48]. The prediction results of these trees are then aggregated, and the final classification is determined by majority voting. The SVM model classifies samples by identifying the optimal separating hyperplane in the feature space, thereby maximizing the margin between positive and negative samples [49,50]. The BPNN model is a multi-layer neural network that learns complex nonlinear relationships between input factors and output classes through forward propagation and error backpropagation, thereby enabling effective sample classification [16,51]. In this study, these four machine learning models were constructed using landslide and non-landslide samples from the study area for landslide susceptibility analysis.
Although machine learning models can produce classification results for landslide susceptibility assessment, model performance evaluation alone is insufficient to explain the geological significance of the predictions. Therefore, model interpretability is important for understanding how different geo-environmental factors influence the prediction process. To improve model interpretability, this study introduced the Shapley value algorithm based on the factor game model [52,53]. The Shapley values were used to quantify the contribution of each landslide influencing factor to the model predictions, thereby providing a clearer explanation of the prediction process.
3.3. Model Construction and Validation
A total of 284 samples were selected for model construction in this study, including 142 landslide samples and 142 non-landslide samples, with balanced sample classes. Considering the relatively limited sample size, the key parameters of each machine learning model were empirically configured to balance model complexity, generalization ability, and training stability. Specifically, the regularization parameter of the LR model was set to 1.0 to balance model fitting ability and generalization performance. The number of decision trees in the RF model was set to 100, and the minimum number of samples per leaf node was set to 5 to enhance model stability and limit the excessive growth of individual decision trees. The penalty coefficient of the SVM model was set to 1.0 to balance the penalty for misclassification and model generalization. The number of hidden-layer nodes in the BPNN model was set to 15 to balance nonlinear representation capability and overfitting control.
In terms of data preprocessing, continuous variables such as slope and elevation were normalized before model training to reduce the influence of differences in scale and value range among different landslide influencing factors. Categorical variables without an obvious ordinal relationship, such as EGRG and land type, were encoded using one-hot encoding to avoid introducing unreasonable ranking relationships through direct numerical assignment. During model training, all samples were divided into a training set and a held-out testing set at a ratio of 80:20 using a stratified random splitting method while maintaining a similar proportion of landslide and non-landslide samples in both sets. Meanwhile, to reduce the influence of spatial autocorrelation caused by local clustering of training samples, a minimum sample spacing constraint of 1000 m was applied during training sample selection.
To evaluate the predictive performance of different machine learning models, the area under the receiver operating characteristic curve (AUC), accuracy, precision, recall, and F1-score were used as model validation metrics in this study [54,55,56]. AUC reflects the overall discrimination ability of the model, with values closer to 1 indicating better predictive performance. Accuracy represents the proportion of correctly classified samples among all samples. Precision indicates the proportion of actual landslide samples among all samples predicted as landslides, while recall represents the proportion of actual landslide samples correctly identified by the model. The F1-score is the harmonic mean of precision and recall and can be used to comprehensively evaluate model performance.
In addition, Shapley value analysis was conducted to quantify the contribution of each landslide influencing factor to the model predictions. In the factor game model, each landslide influencing factor was regarded as a participant in a cooperative game, and the model prediction output was regarded as the payoff. For each trained machine learning model, the Shapley value of each factor was calculated for each sample to quantify its marginal contribution to the model output. The Shapley values of each factor were then accumulated over all samples and normalized by the total accumulated contribution of all factors so that the normalized values summed to 1. The normalized Shapley values were used to represent global feature importance and to compare the relative contributions of different factors within and across models.
3.4. SBAS-InSAR Deformation Extraction
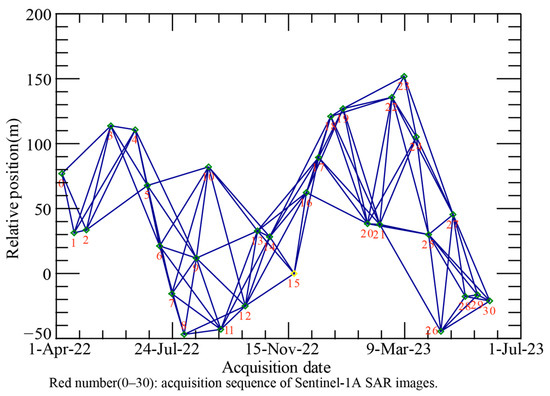
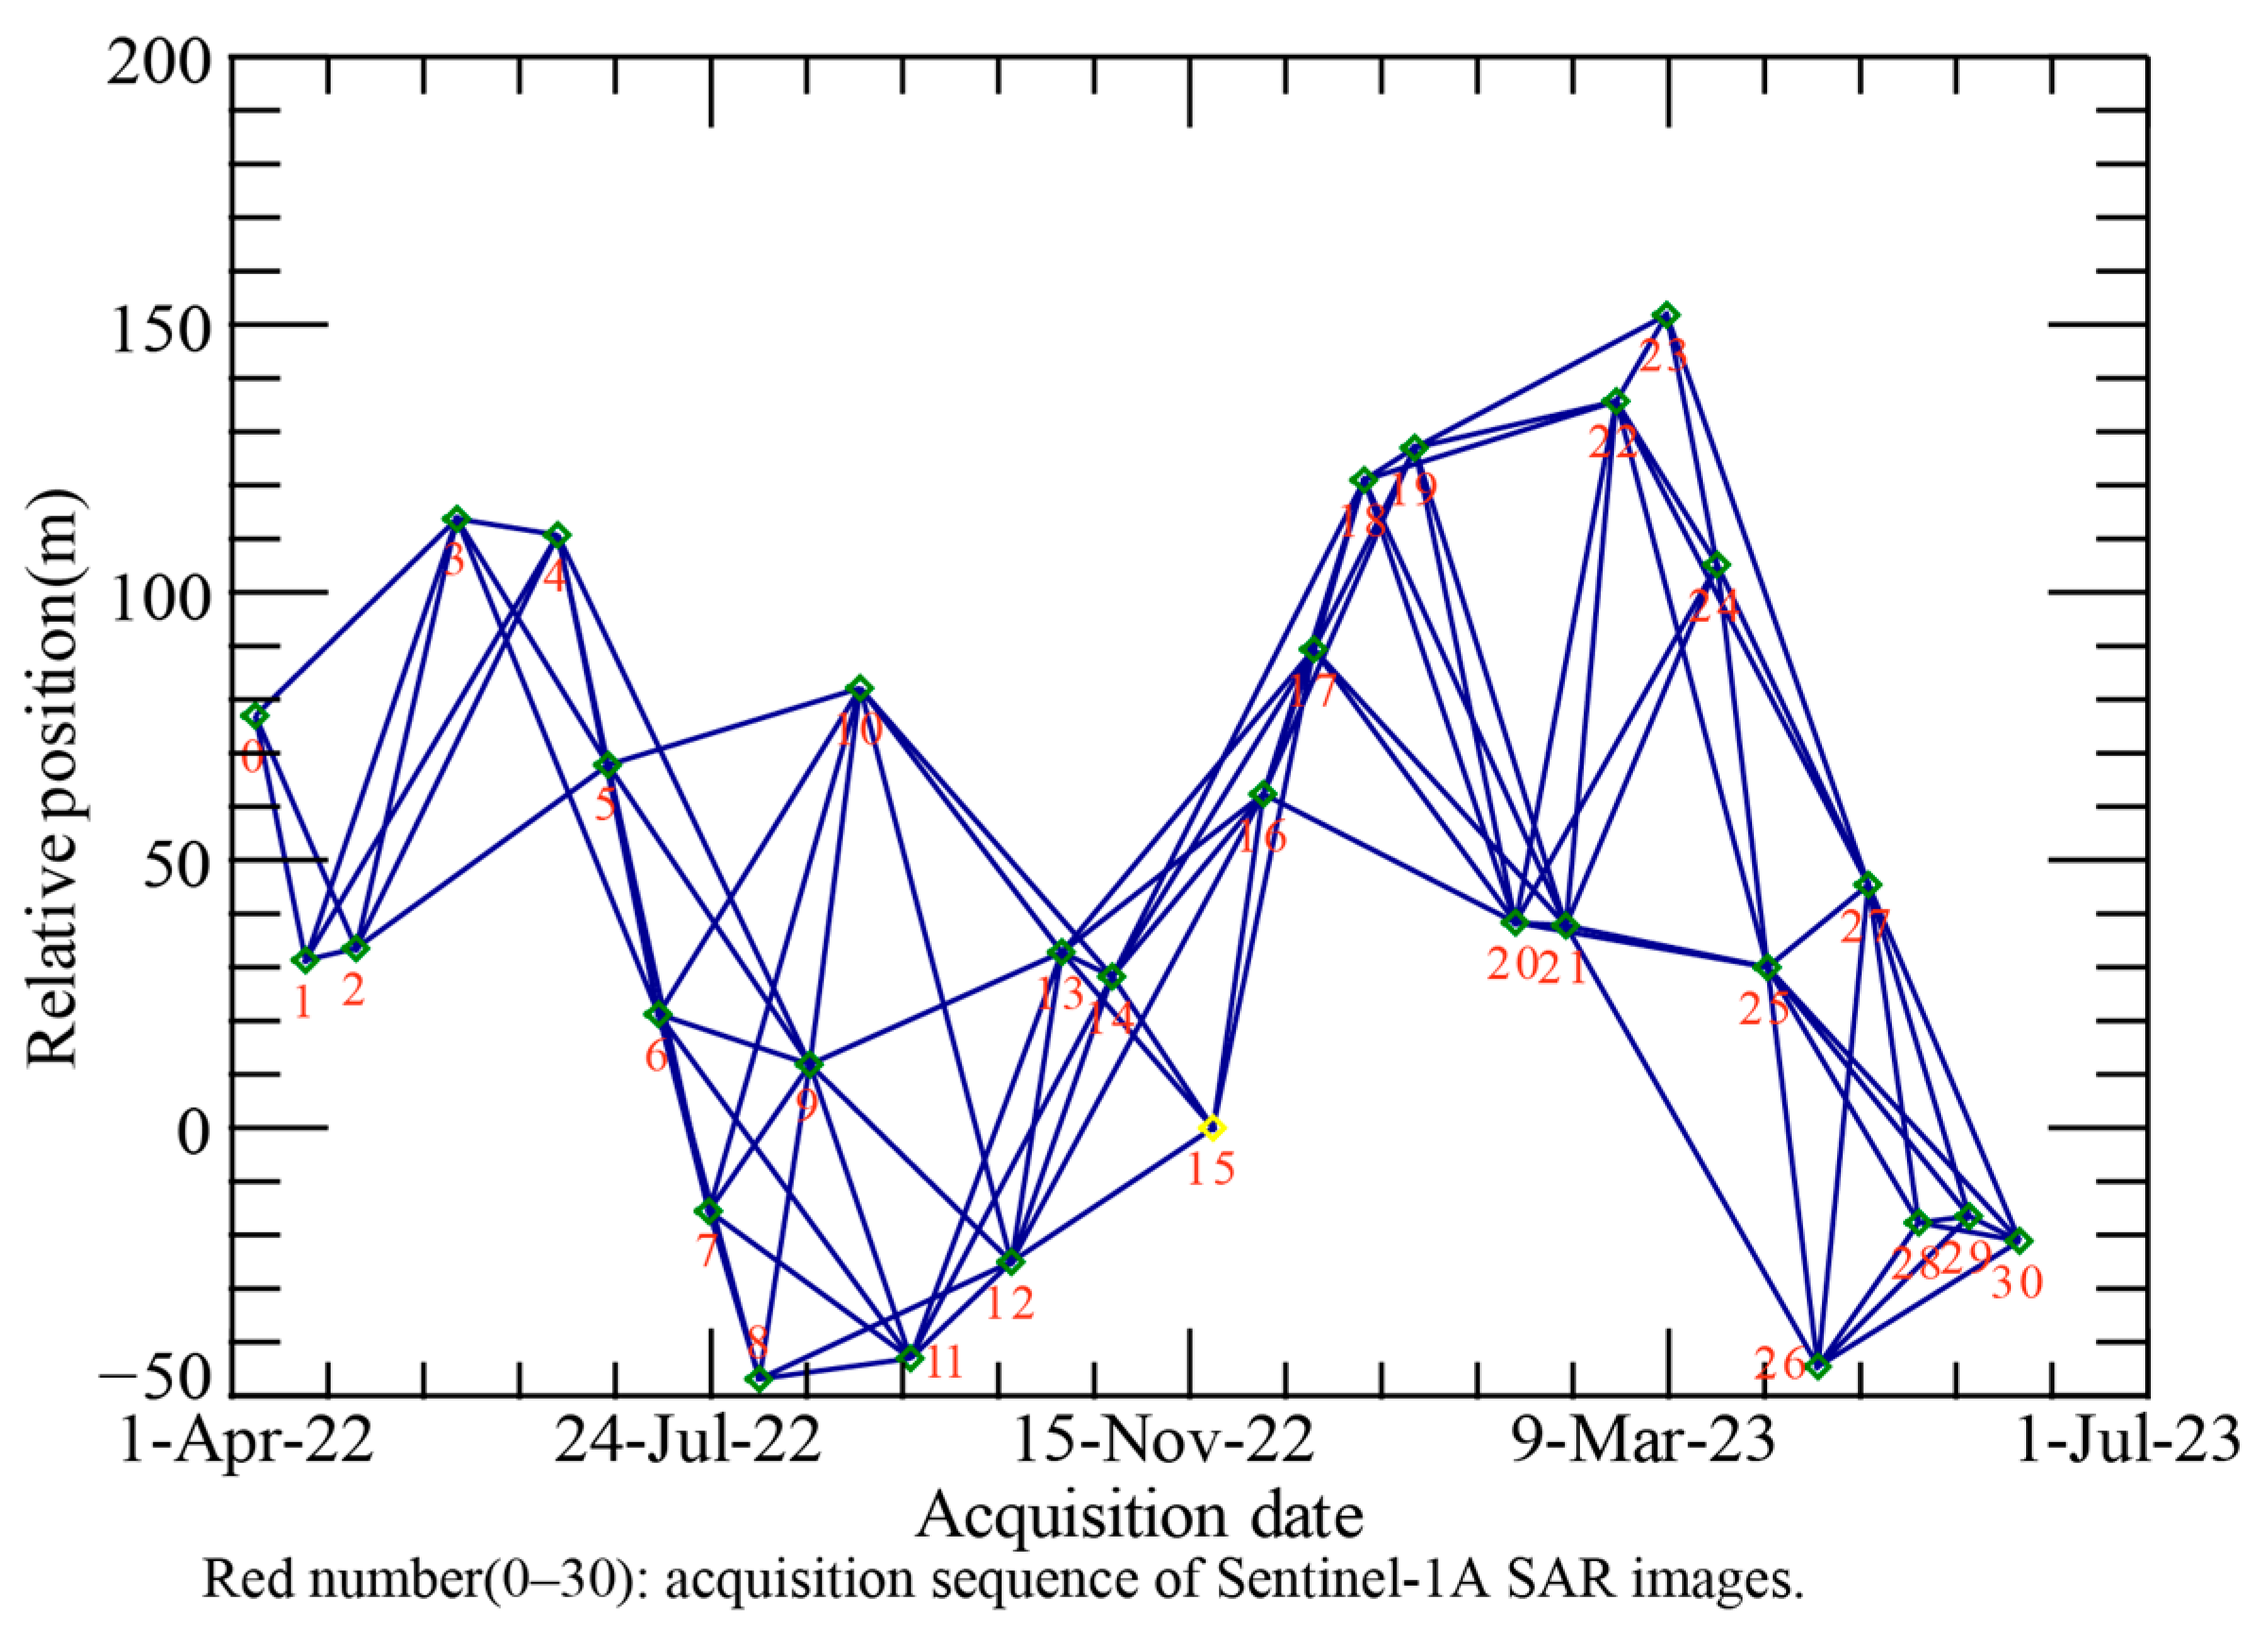
The SBAS-InSAR processing workflow for extracting surface deformation can be summarized into five main steps: connection graph generation, interferometric processing, refinement, inversion, and geocoding [7]. In this study, the maximum temporal baseline was set to 48 days, and the spatial baseline was set to 2% of the critical baseline, resulting in 83 interferometric pairs (Figure 5). Based on these interferometric pairs, 83 differential interferograms were generated. During interferometric processing, precise orbit ephemerides of the 31 Sentinel-1A images were used for orbital correction, and the DEM associated with the ALOS PALSAR product was used as the topographic reference to reduce DEM-related topographic phase errors.
Figure 5.
Temporal distribution of Sentinel-1A imagery.
Subsequently, the 83 differential interferograms were filtered using the classical Goldstein filtering method to suppress interferometric phase noise. In addition, a coherence threshold of 0.18 was adopted to exclude low-coherence pixels, thereby improving the reliability of the interferometric results. During the refinement process, ground control points (GCPs) were selected within the study area to further correct orbital errors and reduce the influence of residual topographic phase errors. The GCPs were chosen from relatively stable areas away from obvious deformation zones.
During the inversion process, the minimum cost flow (MCF) method was used for phase unwrapping to obtain continuous interferometric phase information. Singular value decomposition (SVD) was then applied to estimate the line-of-sight (LOS) deformation rate and displacement time series in the study area. Atmospheric delay effects were mitigated using a spatio-temporal filtering method. Finally, geocoding was performed to unify the geographical coordinates of the inversion results and project the LOS deformation and deformation rate onto the study area. LOS deformation rates have been successfully applied to landslide identification and monitoring in southwestern China [57,58]. In this study, the LOS deformation rate was adopted as an indicator of relative deformation activity in the study area.
3.5. KDE-PCC-Based Spatial Consistency Analysis and Landslide Susceptibility Mapping
To obtain an LSM constrained by InSAR-derived deformation information, the LSM classification thresholds were adjusted by incorporating InSAR-derived deformation information during the observation period. The procedure included three steps: generating candidate susceptibility classification thresholds, extracting the spatial distribution patterns of InSAR-derived deformation activity and landslide susceptibility, and calculating the PCC between the two KDE-derived spatial distribution maps. It should be noted that InSAR-derived deformation was used only as a relative spatial constraint for classification adjustment, rather than being regarded as equivalent to landslide susceptibility.
First, the initial landslide susceptibility classification thresholds were determined using the natural breaks method. To avoid unreasonable threshold shifts during the KDE-PCC optimization, the feasible search range of each threshold was constrained by considering both the natural-breaks result and the semantic meaning of the model-derived susceptibility values. These search ranges were designed to represent reasonable transition intervals between adjacent susceptibility classes, namely very low to low, low to medium, medium to high, and high to very high. Uniform random sampling was then performed within the predefined ranges to generate candidate threshold sets. These generated candidate threshold sets were then used for optimization analysis.
Second, the spatial distribution pattern of InSAR-derived deformation activity was extracted from the deformation results. The raster deformation map was first converted into point data, and KDE was then used to generate a deformation activity density map [59]. The KDE search radius was determined through preliminary analysis by testing different radius settings and comparing the spatial correspondence between the resulting InSAR-derived deformation activity distribution and the mapped landslide distribution. The same KDE parameter settings were used throughout the subsequent analysis to ensure comparability. In addition, to reduce boundary effects, KDE analysis was conducted in an expanded area slightly larger than the study area. The KDE results were then clipped to the study-area boundary, and only valid raster cells inside the study area were used for subsequent PCC calculation.
Third, for each candidate threshold set, the landslide susceptibility map was reclassified according to the corresponding classification thresholds, and KDE was applied to generate a susceptibility density map. To ensure spatial comparability in the subsequent PCC calculation, the KDE-derived susceptibility density map and deformation activity density map were resampled to the same spatial resolution and extent as the original landslide susceptibility map. Before PCC calculation, all KDE results were normalized to the range of 0–1 using min–max normalization. The PCC was then calculated based on the corresponding raster cell values of the two KDE-derived density maps to evaluate their relative spatial consistency. In this study, the candidate threshold set with a relatively high PCC value was selected as the optimized classification scheme. Based on the optimized thresholds, the final landslide susceptibility map constrained by InSAR-derived deformation information was generated.
4. Results
4.1. Correlation Between Landslide Influencing Factors
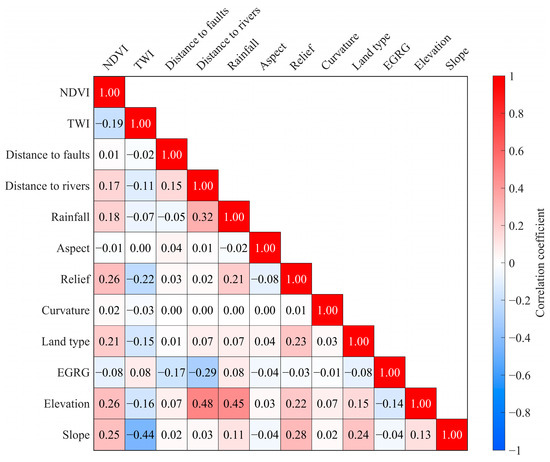
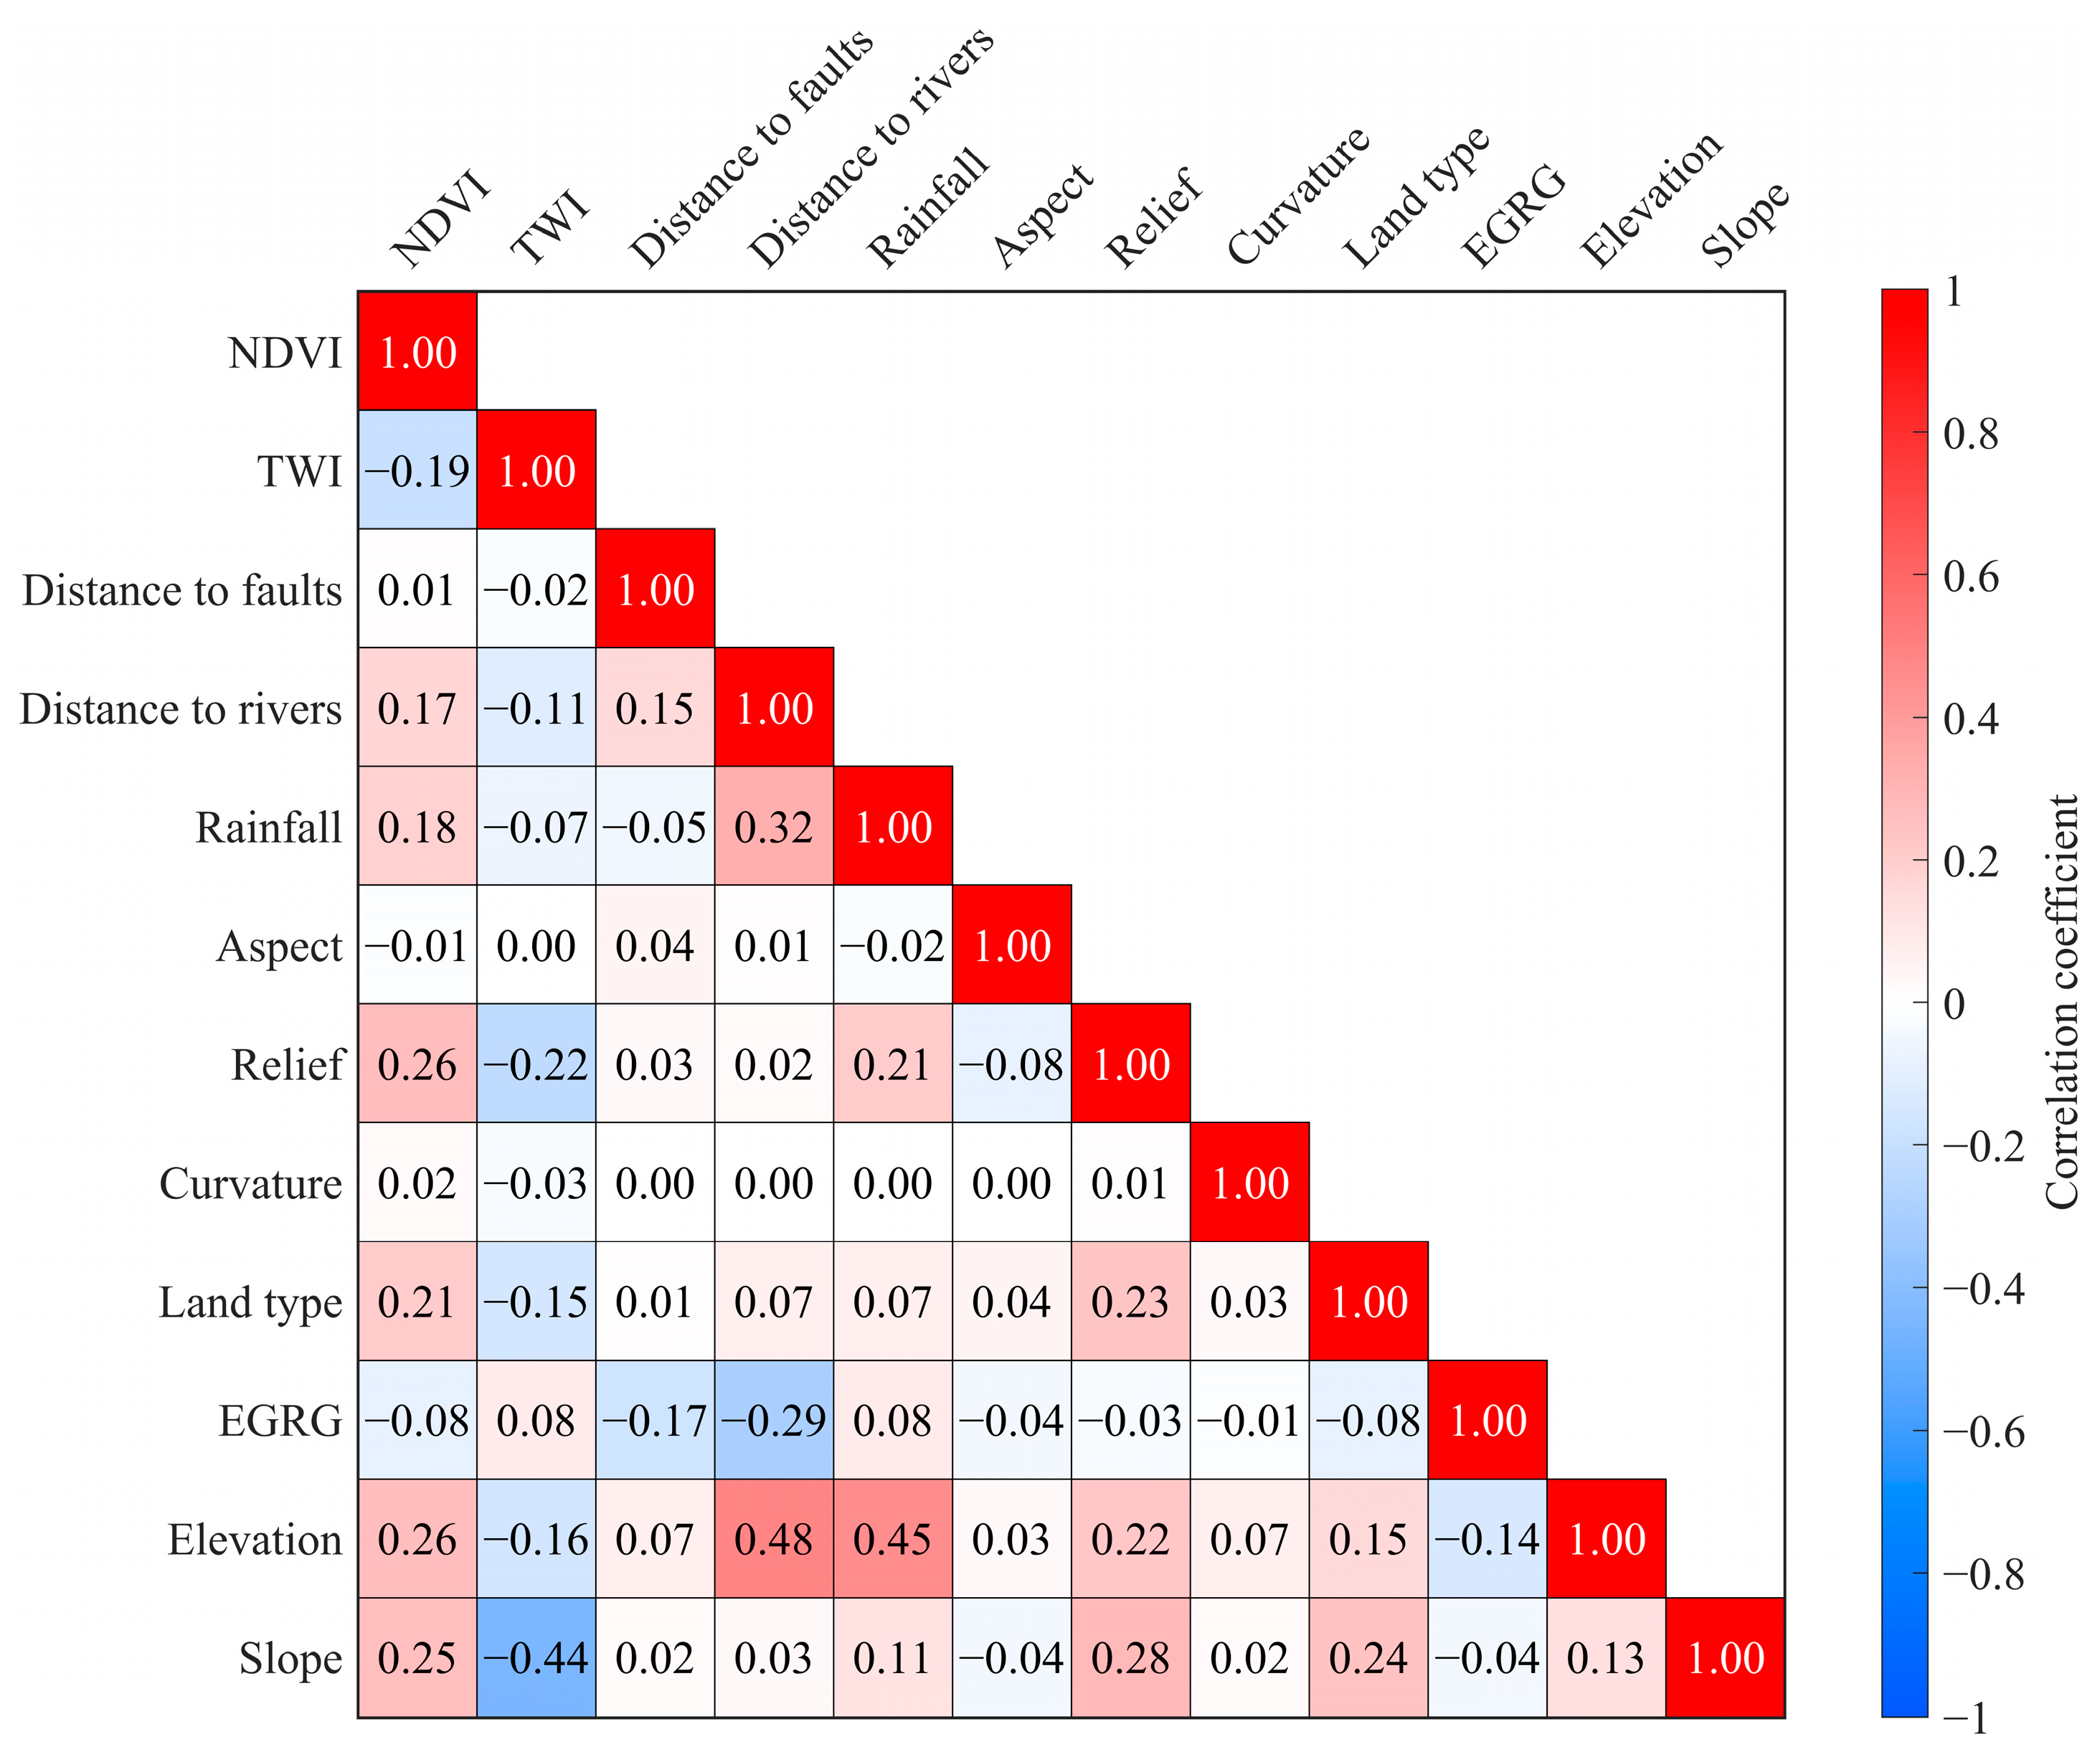
The PCC analysis results for the twelve landslide conditioning factors are shown in Figure 6. Overall, the pairwise correlation coefficients were relatively low, indicating that no strong correlations were observed among the selected factors. Relatively high positive correlations were found between elevation and distance to rivers, slope and relief, and elevation and rainfall, with correlation coefficients of 0.48, 0.48, and 0.45, respectively. In addition, slope and TWI showed a moderate negative correlation, with a correlation coefficient of −0.44. These relationships suggest that some topographic and hydrological factors are moderately interrelated, which is consistent with the geomorphological and hydrological characteristics of the study area. However, these moderately correlated factors represent distinct geo-environmental meanings. For example, elevation reflects terrain differentiation and geomorphic background, rainfall represents an external triggering condition, slope characterizes slope steepness, and TWI indicates the potential for terrain-controlled water accumulation. Therefore, all twelve conditioning factors were retained for subsequent landslide susceptibility modeling.
Figure 6.
Pearson correlation coefficient heatmap of landslide influencing factors.
4.2. Optimal Selection of Machine Learning Models
The model validation results obtained from the held-out testing set showed that, among the four individual machine learning models, the RF and BPNN models yielded higher evaluation metrics than the LR and SVM models (Table 2). The AUC values of the RF and BPNN models were 0.93 and 0.91, respectively, and their accuracy values were 0.88 and 0.84, indicating good discrimination ability and classification performance. Their F1-scores were also relatively high, at 0.88 and 0.83, respectively. The RF model achieved the highest recall, suggesting a stronger ability to identify landslide samples and reduce missed detections, whereas the BPNN model showed higher precision, indicating greater reliability of the samples predicted as landslides. These results indicate that the RF and BPNN models provided complementary prediction information in terms of recall and precision under the current sample partition. Therefore, an equal-weight averaging strategy was used to integrate their predicted susceptibility values in the RF–BPNN combined model for subsequent susceptibility mapping.
Table 2.
Validation metrics of the LR, RF, SVM, and BPNN models.
Specifically, the landslide susceptibility values predicted by the RF and BPNN models were averaged to obtain the final landslide susceptibility value:
where and represent the landslide susceptibility values predicted by the RF and BPNN models, respectively, and represents the susceptibility value obtained from the RF–BPNN combined model. The final susceptibility values were used for landslide susceptibility mapping in the study area.
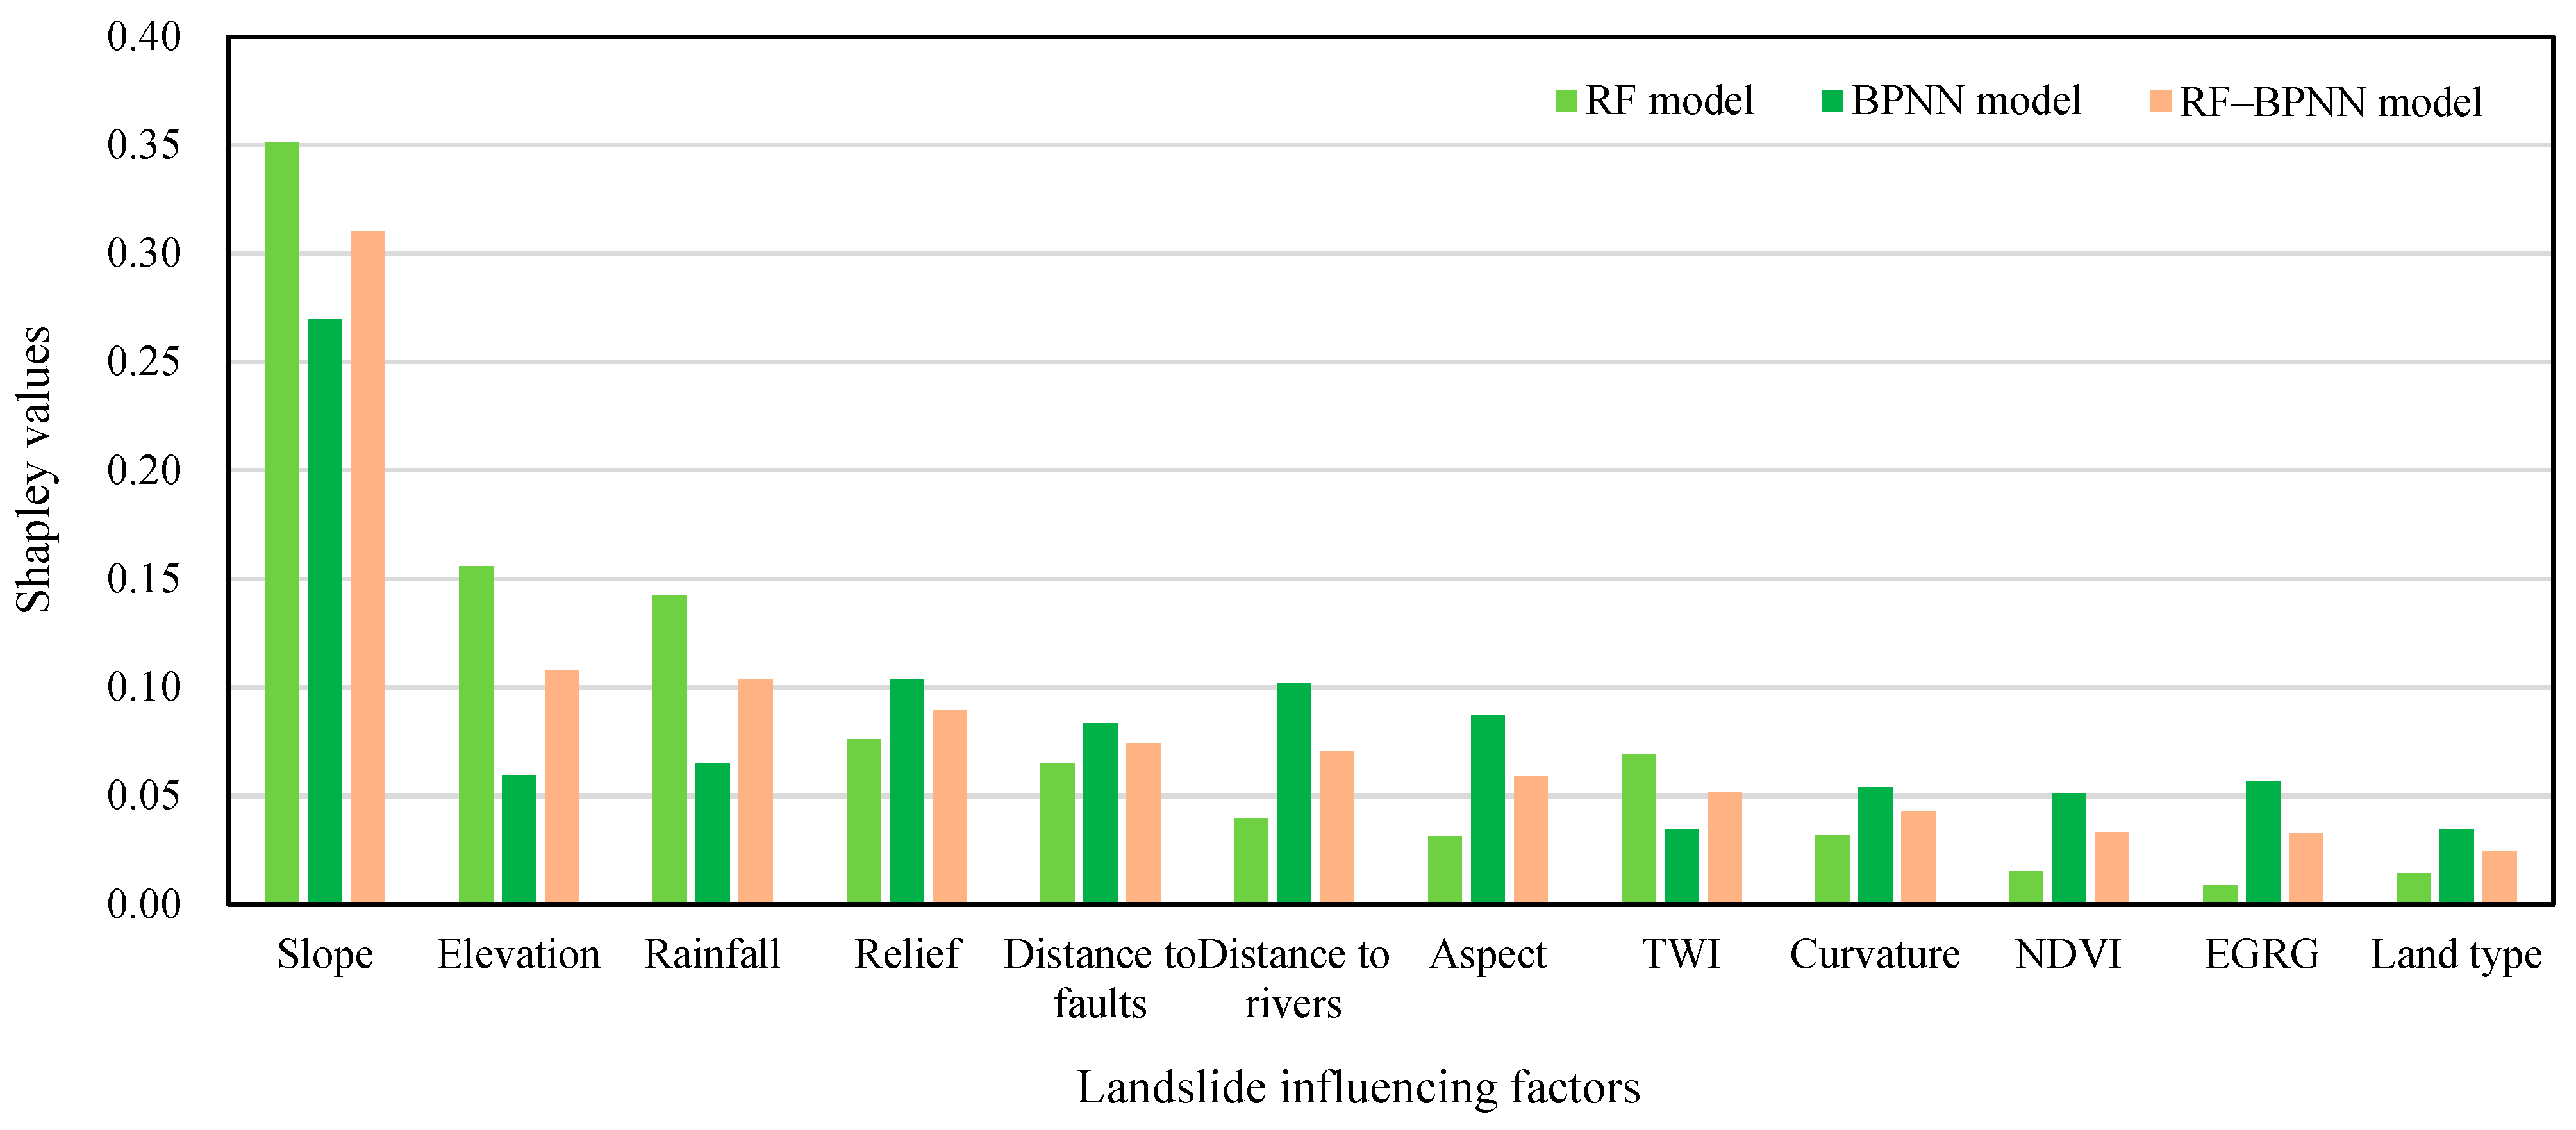
In addition, the Shapley values of the landslide influencing factors in the combined model were ranked as follows (Figure 7): slope (0.31) > elevation (0.11) > rainfall (0.10) > relief (0.09) > distance to faults (0.07) and distance to rivers (0.07) > aspect (0.06) > TWI (0.05) > curvature (0.04) > NDVI (0.03) and EGRG (0.03) > land type (0.02). The result indicates that terrain- and rainfall-related factors made the dominant contributions to landslide susceptibility prediction in the study area. This is consistent with the known characteristics of landslide development in the study area.
Figure 7.
Shapley values of landslide influencing factors in the RF, BPNN, and RF–BPNN models.
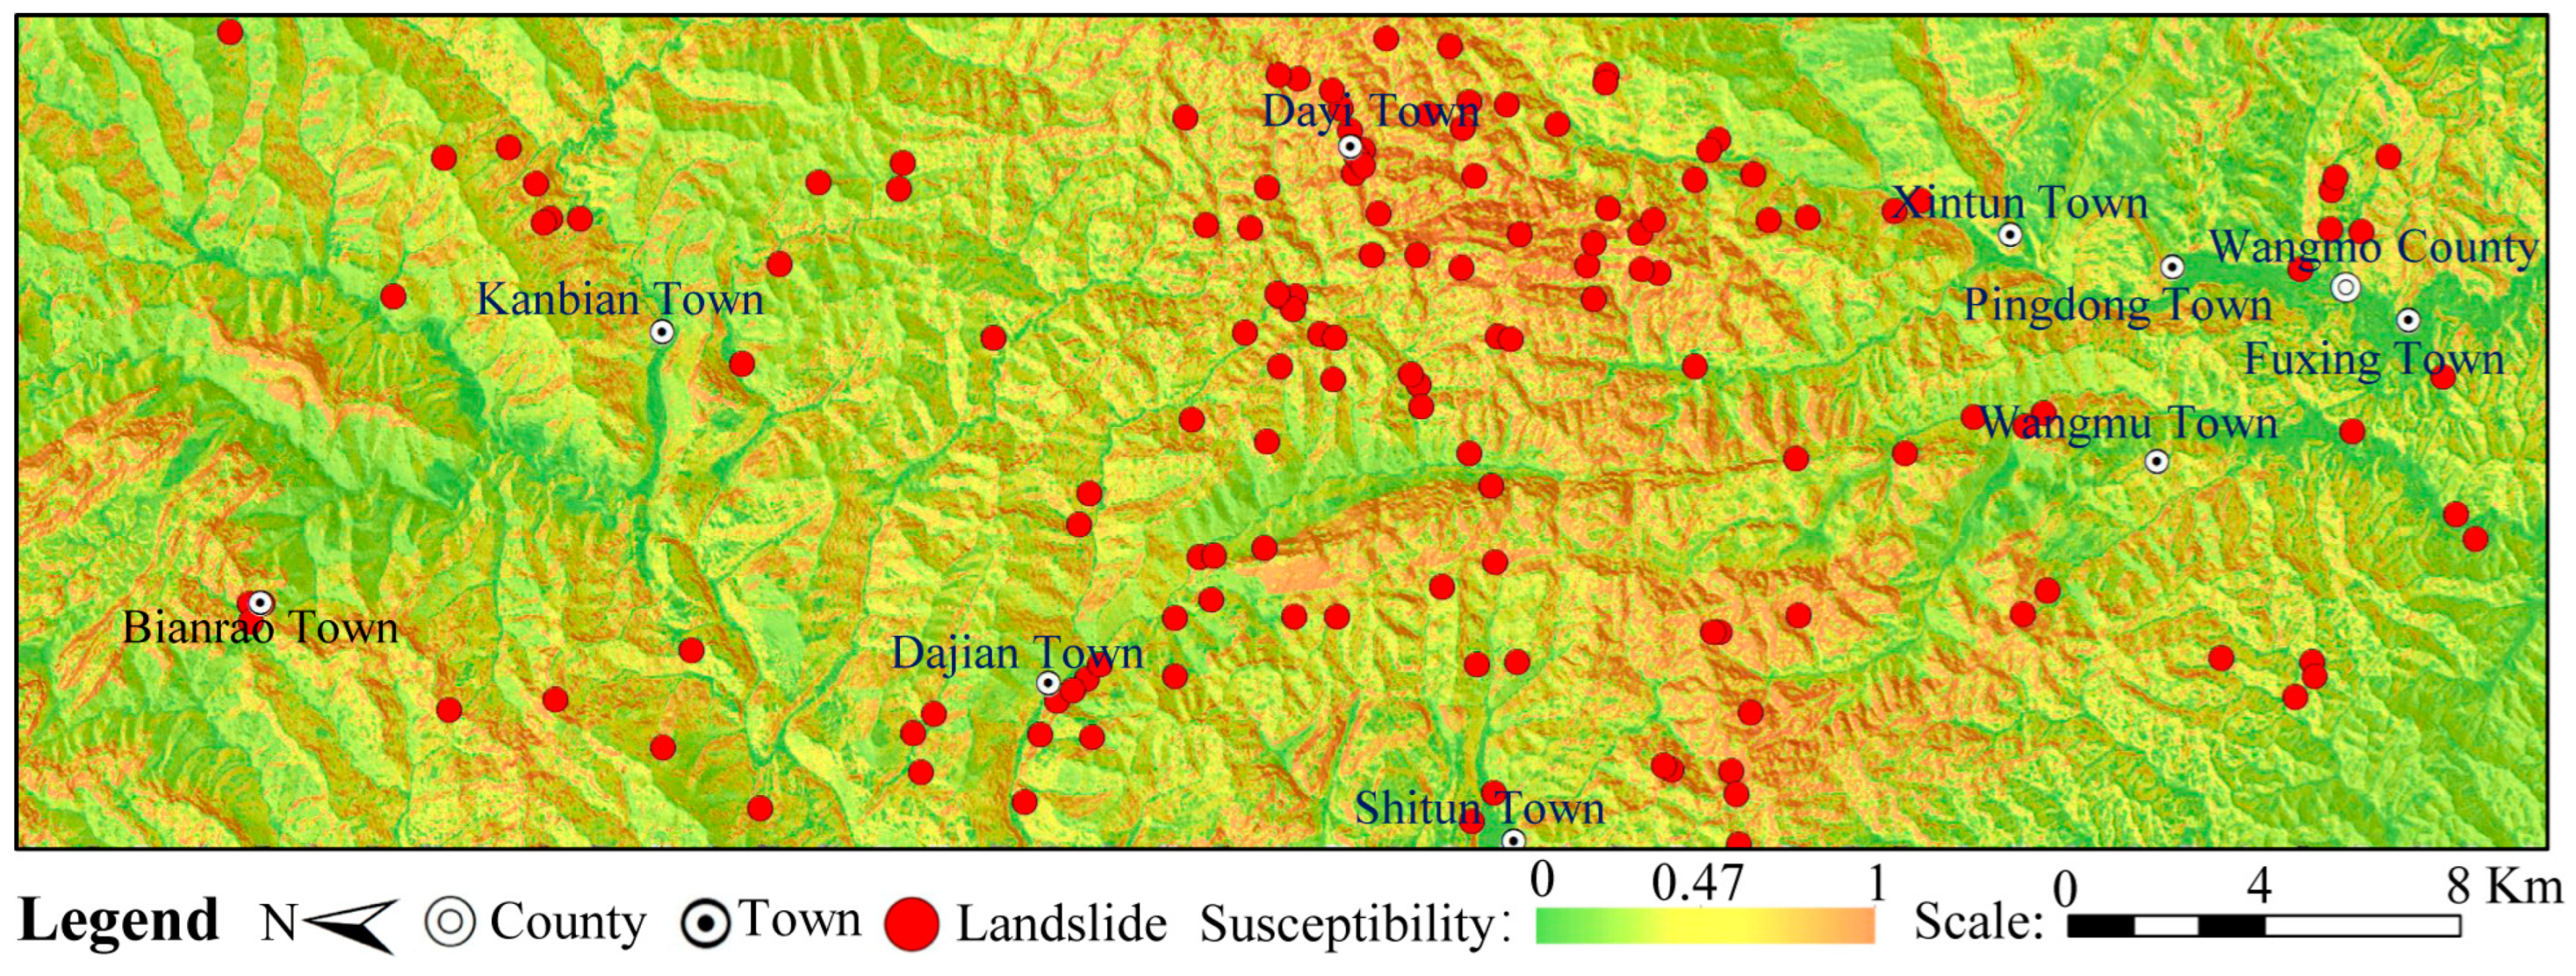
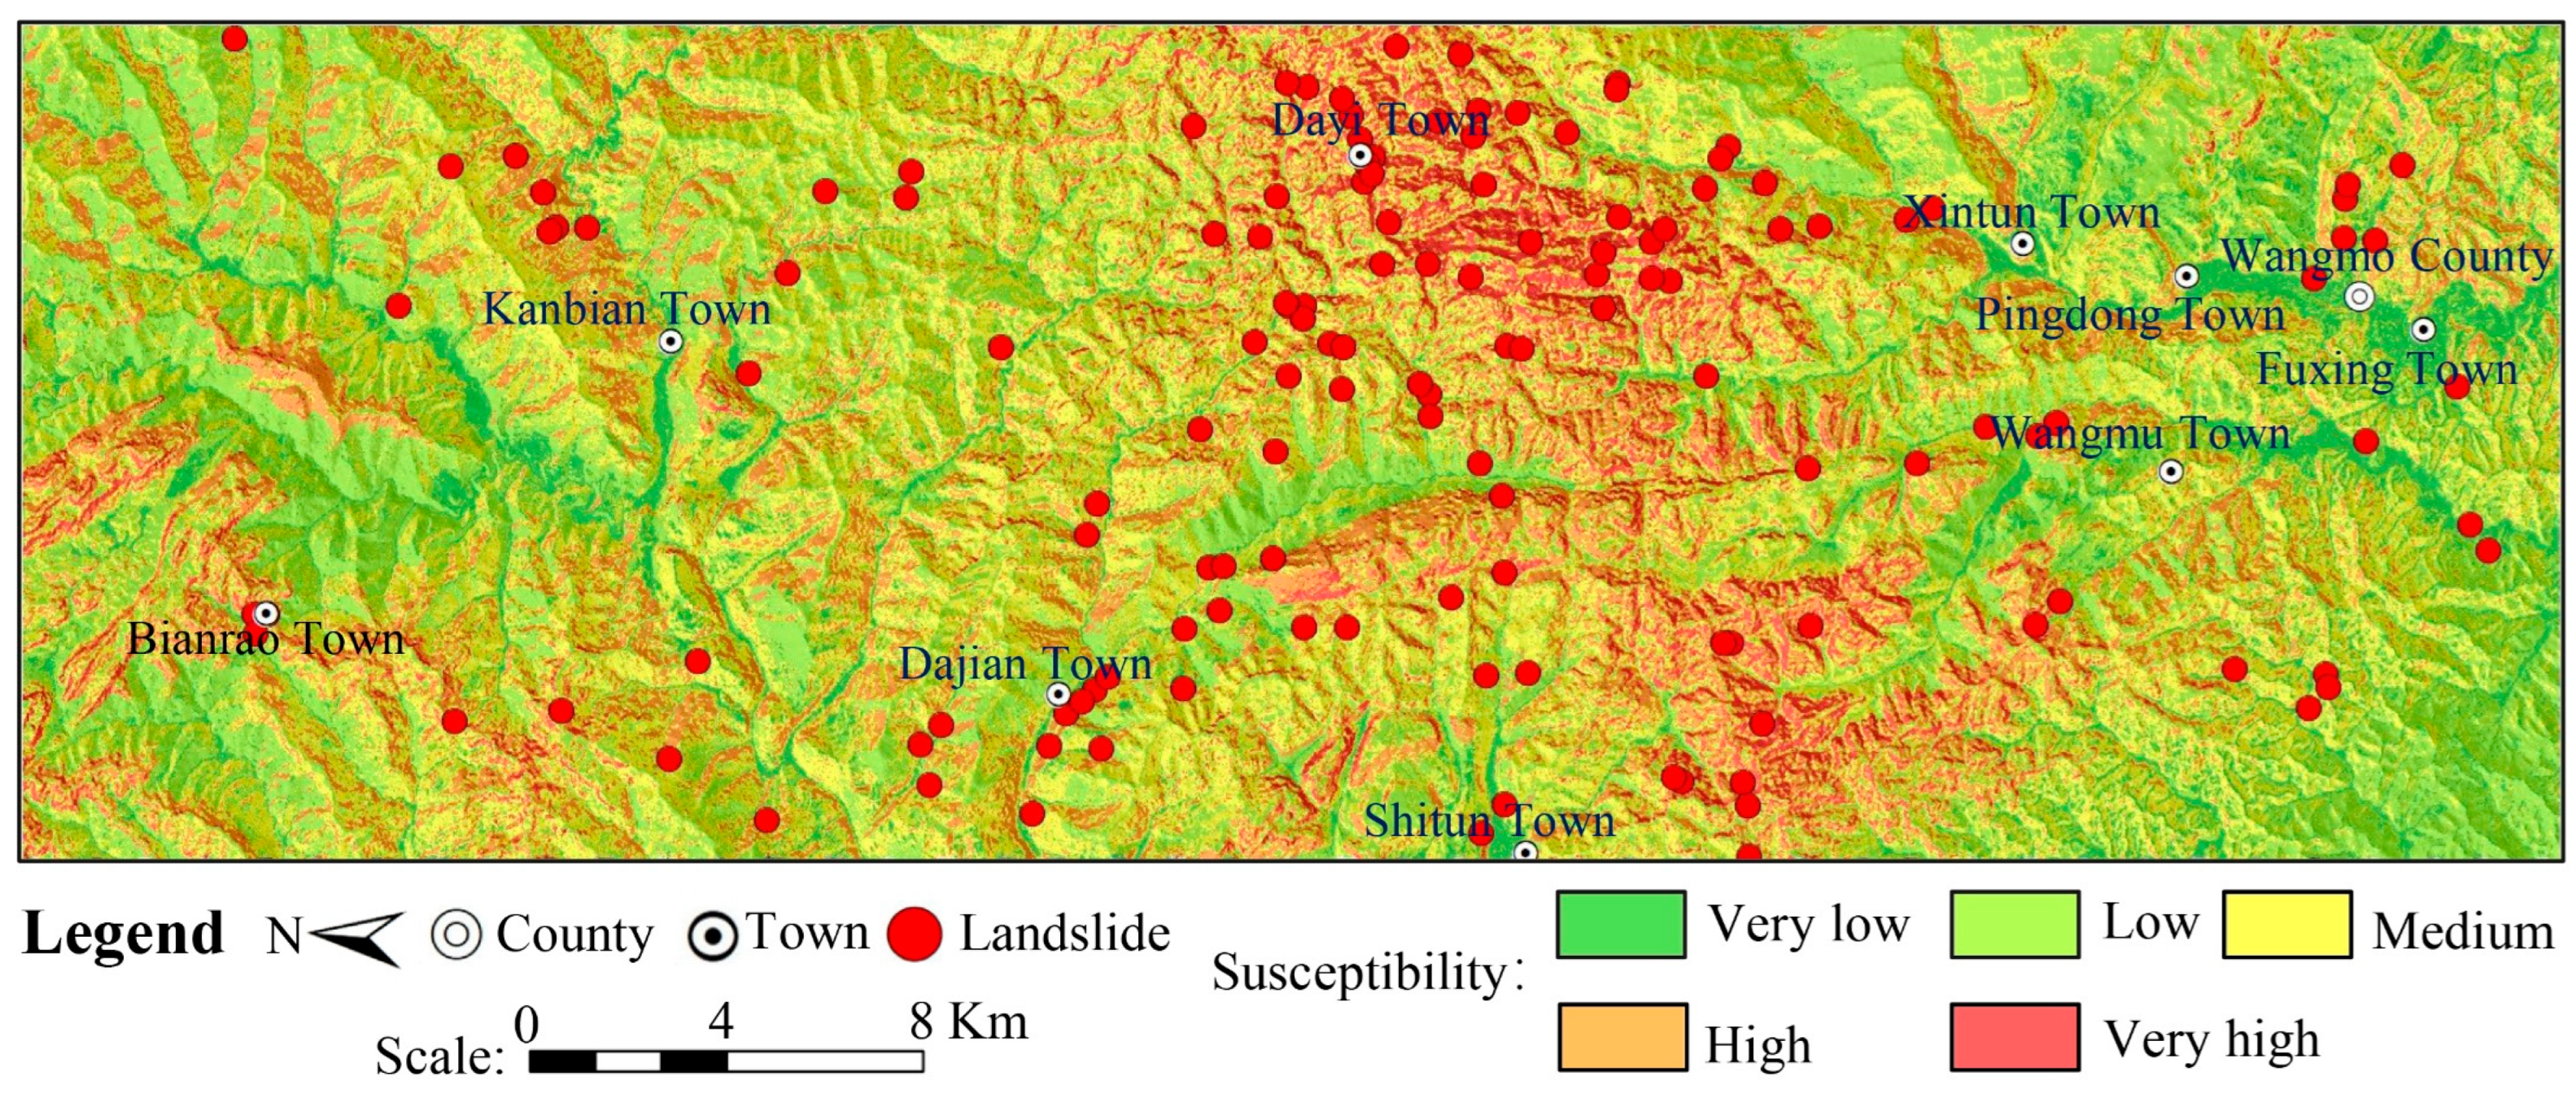
It is also worth noting that EGRG had a relatively low contribution. This may be related to the relatively uniform lithological conditions in the study area. According to the regional distribution of EGRG, soft rock accounts for approximately 77% of the study area, indicating limited lithological differentiation and thus a relatively weak influence on model predictions. Overall, the Shapley value results indicate that the RF–BPNN combined model reasonably captured the relative contributions of the landslide influencing factors in the study area. Therefore, the RF–BPNN combined model was used to calculate landslide susceptibility, and the resulting susceptibility map is shown in Figure 8.
Figure 8.
Landslide susceptibility calculated using the RF–BPNN model.
4.3. InSAR-Derived Deformation in the Study Area
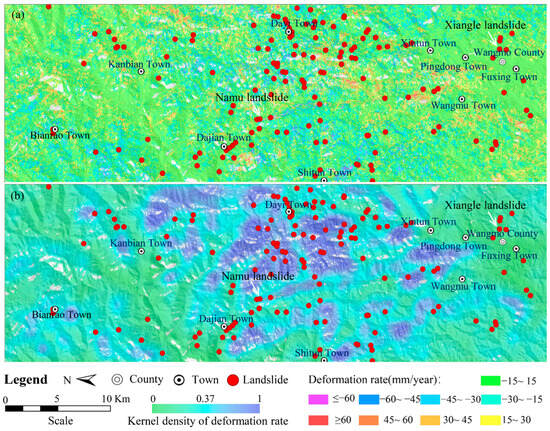
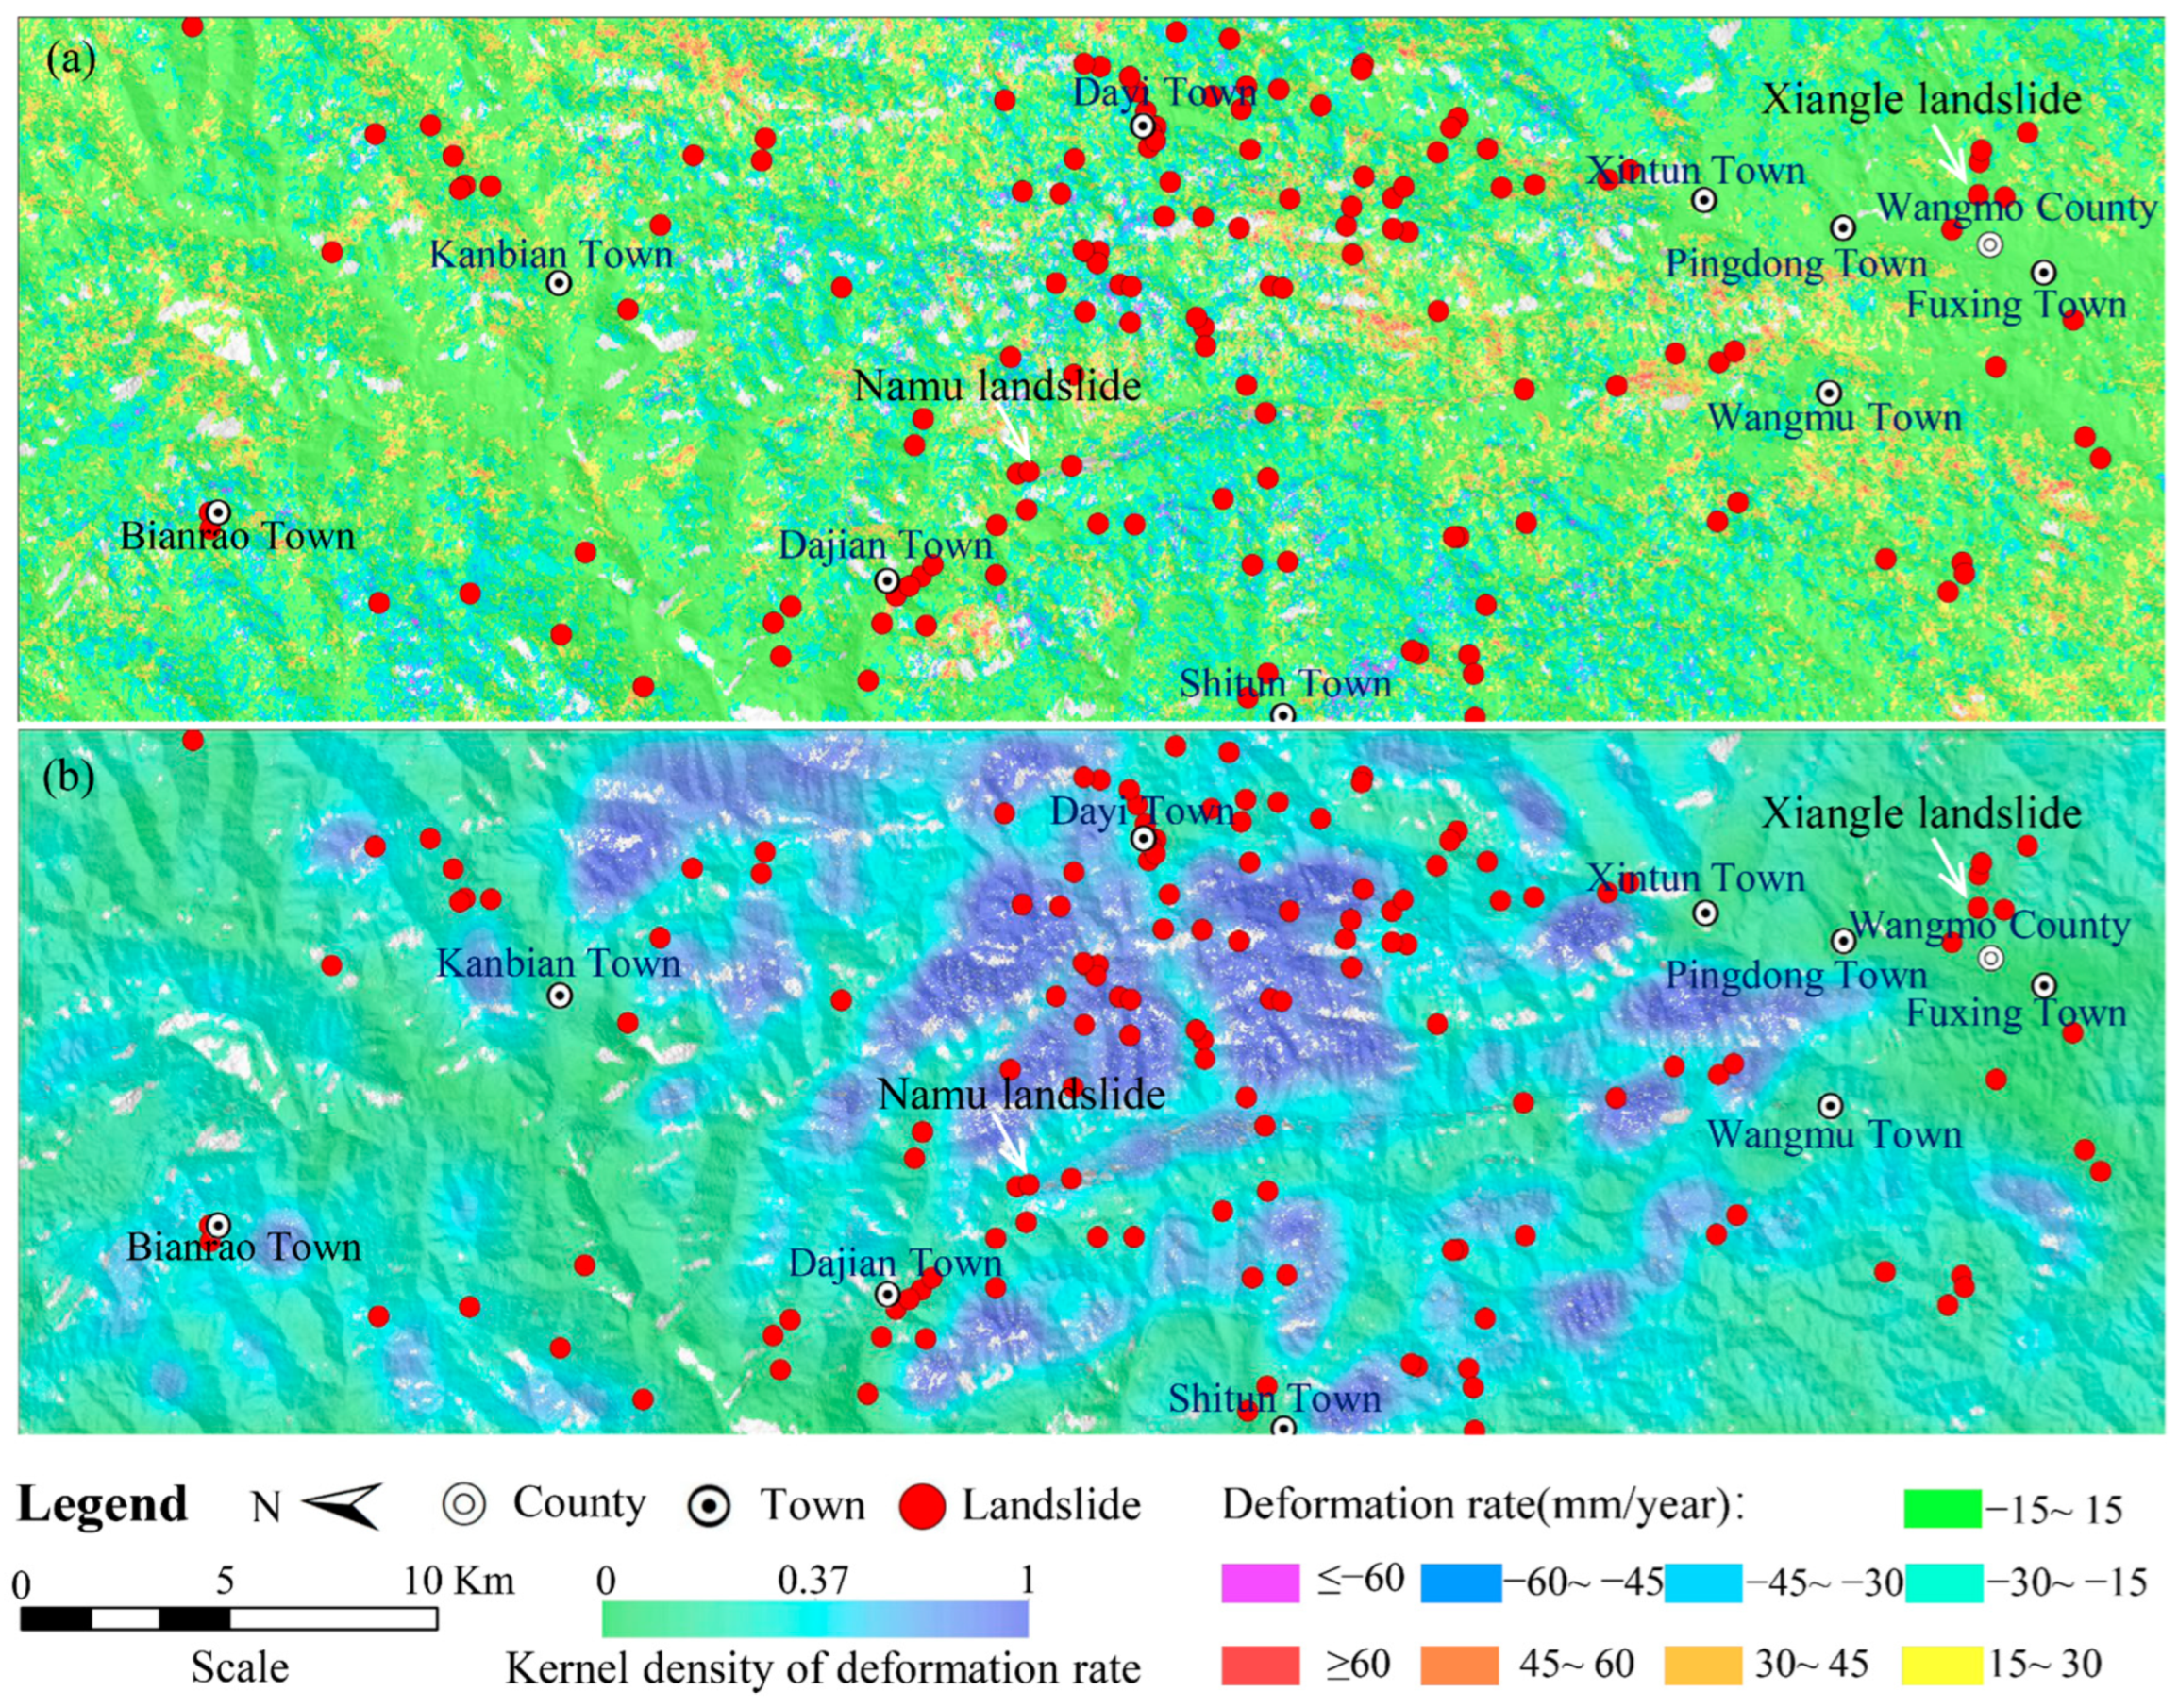
The LOS deformation rate in the study area derived using SBAS-InSAR technology is shown in Figure 9a. During the period from April 2022 to May 2023, the LOS deformation rate ranged from −79.57 mm/year to 83.41 mm/year, with an average deformation rate of −3.06 mm/year and a standard deviation of 16.87 mm/year. It should be noted that positive and negative LOS deformation rates represent changes in the distance between the ground target and the satellite along the radar LOS direction. They do not directly correspond to vertical uplift or subsidence, nor do they necessarily indicate the true movement direction of a landslide. Therefore, this study focused on the magnitude and spatial concentration of LOS deformation as a relative indicator of InSAR-derived deformation activity during the observation period. Considering the statistical distribution of LOS deformation rates, the regional deformation background, and the spatial distribution of mapped landslides, a 15 mm/year interval was empirically adopted as an operational classification criterion for this case study. The absolute LOS deformation rates were divided into five classes: <15 mm/year, 15–30 mm/year, 30–45 mm/year, 45–60 mm/year, and >60 mm/year. The <15 mm/year class represents relatively low deformation activity during the observation period. Based on this classification, the spatial distribution of InSAR-derived deformation activity was analyzed using KDE with a search radius of 1500 m, as shown in Figure 9b. The KDE result indicates that areas with relatively concentrated deformation activity generally correspond to the distribution of mapped landslides in the study area. This spatial correspondence suggests that InSAR-derived deformation can reasonably reflect landslide-related surface activity during the observation period.
Figure 9.
LOS deformation rate and kernel density: (a) LOS deformation rate from 2022 to 2023; (b) kernel density of deformation rate.
4.4. Deformation-Constrained Landslide Susceptibility Mapping
InSAR-derived deformation information was used to adjust the landslide susceptibility classification thresholds. The initial thresholds were determined using the natural breaks method, yielding four values of 0.21, 0.37, 0.53, and 0.71. Based on these initial thresholds and the semantic meaning of the model-derived susceptibility values, the candidate search ranges for the four thresholds were set to 0.10–0.25, 0.30–0.45, 0.50–0.65, and 0.70–0.90, respectively. These ranges correspond to the transition intervals between very low and low, low and medium, medium and high, and high and very high susceptibility classes. Uniform random sampling was then performed within the predefined ranges. A total of 300 candidate threshold sets and their corresponding landslide susceptibility classification maps were generated.
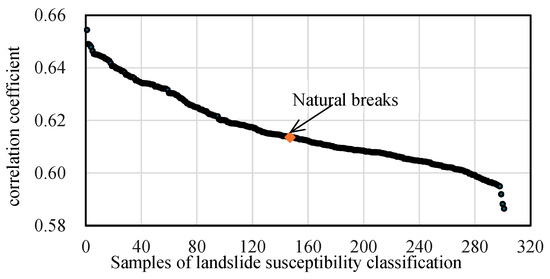
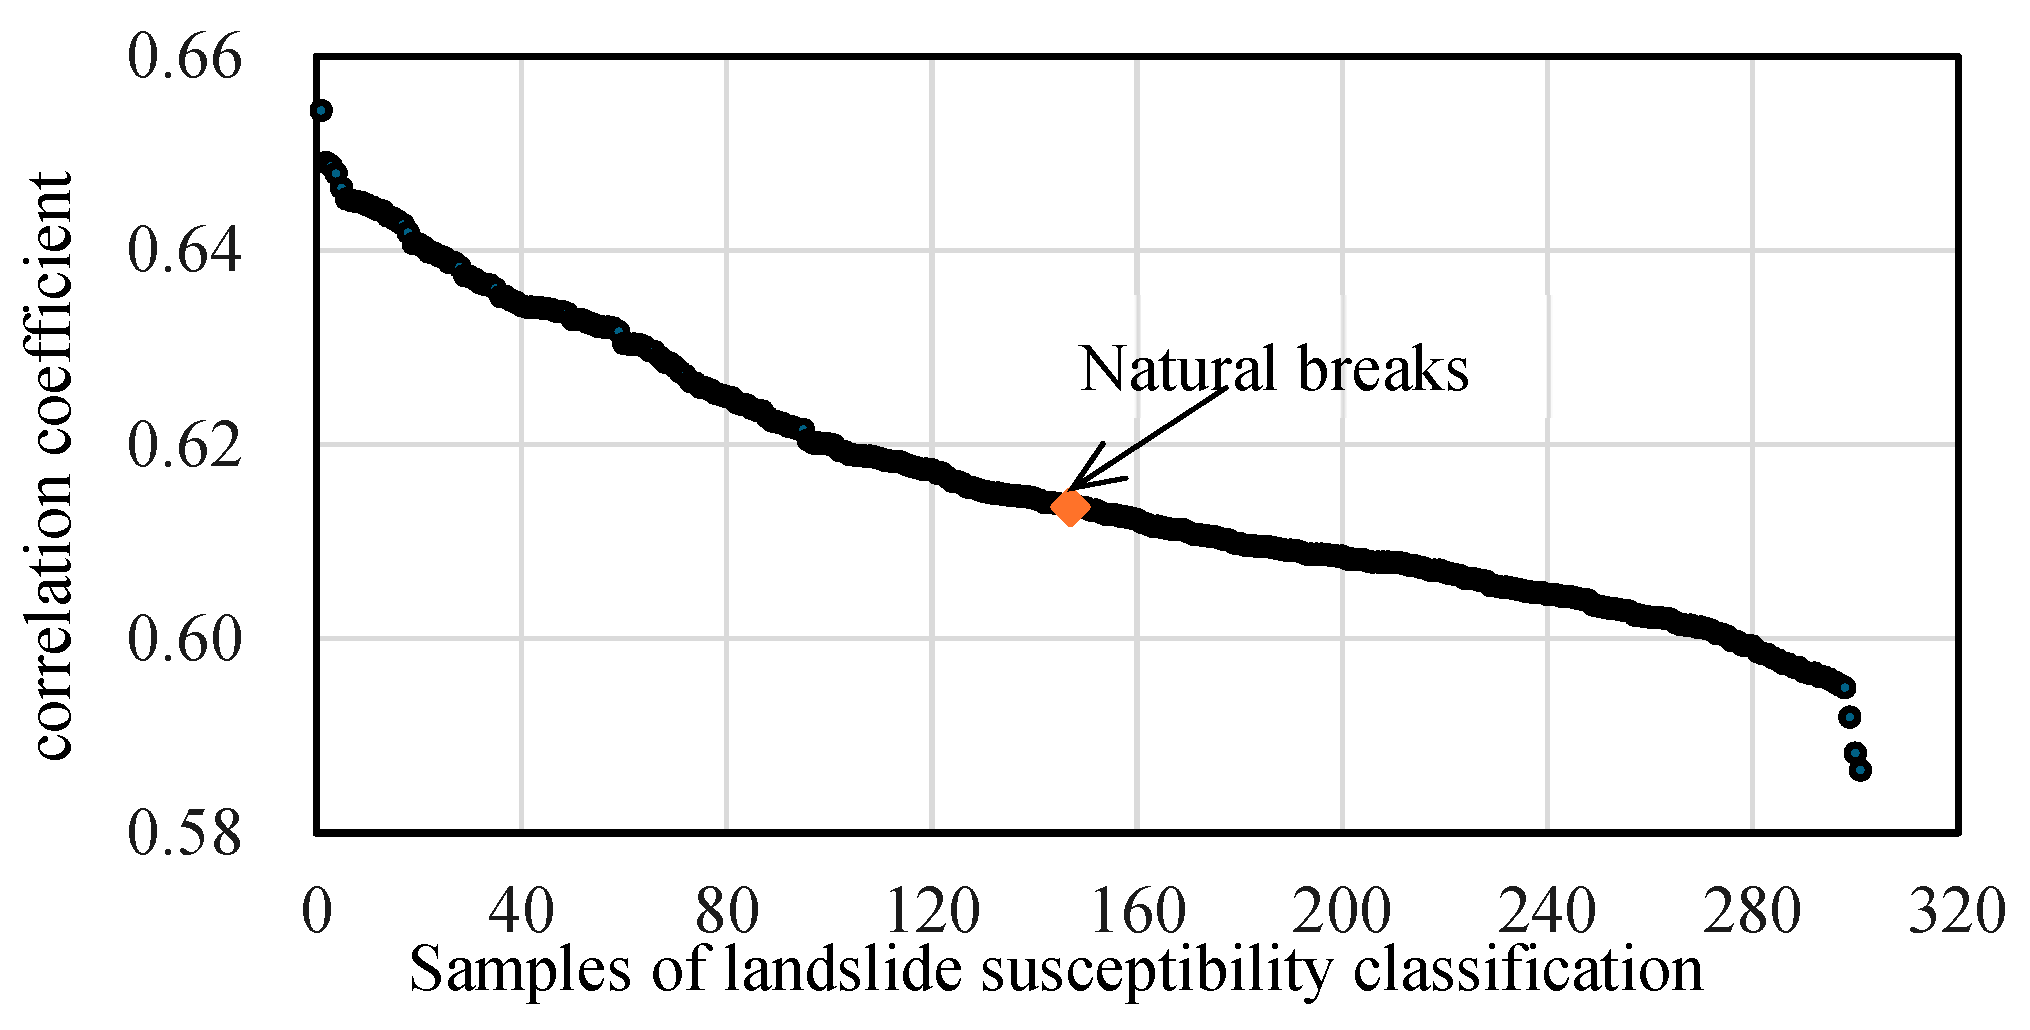
The KDE-derived spatial distribution pattern of InSAR-derived deformation activity was used as the reference map, as shown in Figure 9b. For each candidate landslide susceptibility classification map, KDE was used to extract its spatial distribution pattern. The PCC between the KDE-derived deformation activity pattern and the KDE-derived susceptibility pattern was then calculated to evaluate their relative spatial consistency. The PCC values of the 300 candidate classification schemes ranged from 0.59 to 0.65 (Figure 10). The optimized classification scheme achieved a relatively high PCC value of 0.65. The optimized susceptibility classification thresholds were 0.12, 0.31, 0.61, and 0.83, corresponding to very low (0–0.12), low (0.12–0.31), medium (0.31–0.61), high (0.61–0.83), and very high (0.83–1) susceptibility classes (Figure 11).
Figure 10.
PCC values between the KDE-derived susceptibility maps and the KDE-derived deformation activity map.
Figure 11.
Deformation-constrained LSM for the period of 2022–2023 in the study area.
5. Discussion
5.1. Criteria for Landslide Susceptibility Classification
In terms of landslide susceptibility classification, the natural breaks method is widely used to categorize landslide susceptibility values [60,61]. It is particularly suitable for data with clustered or non-uniform distribution characteristics. However, as a statistical classification method, it mainly depends on the internal distribution of susceptibility values, whereas observation-period deformation information is not directly incorporated in the classification process. Therefore, InSAR-derived deformation activity was introduced in this study as an additional spatial constraint to adjust the landslide susceptibility classification thresholds.
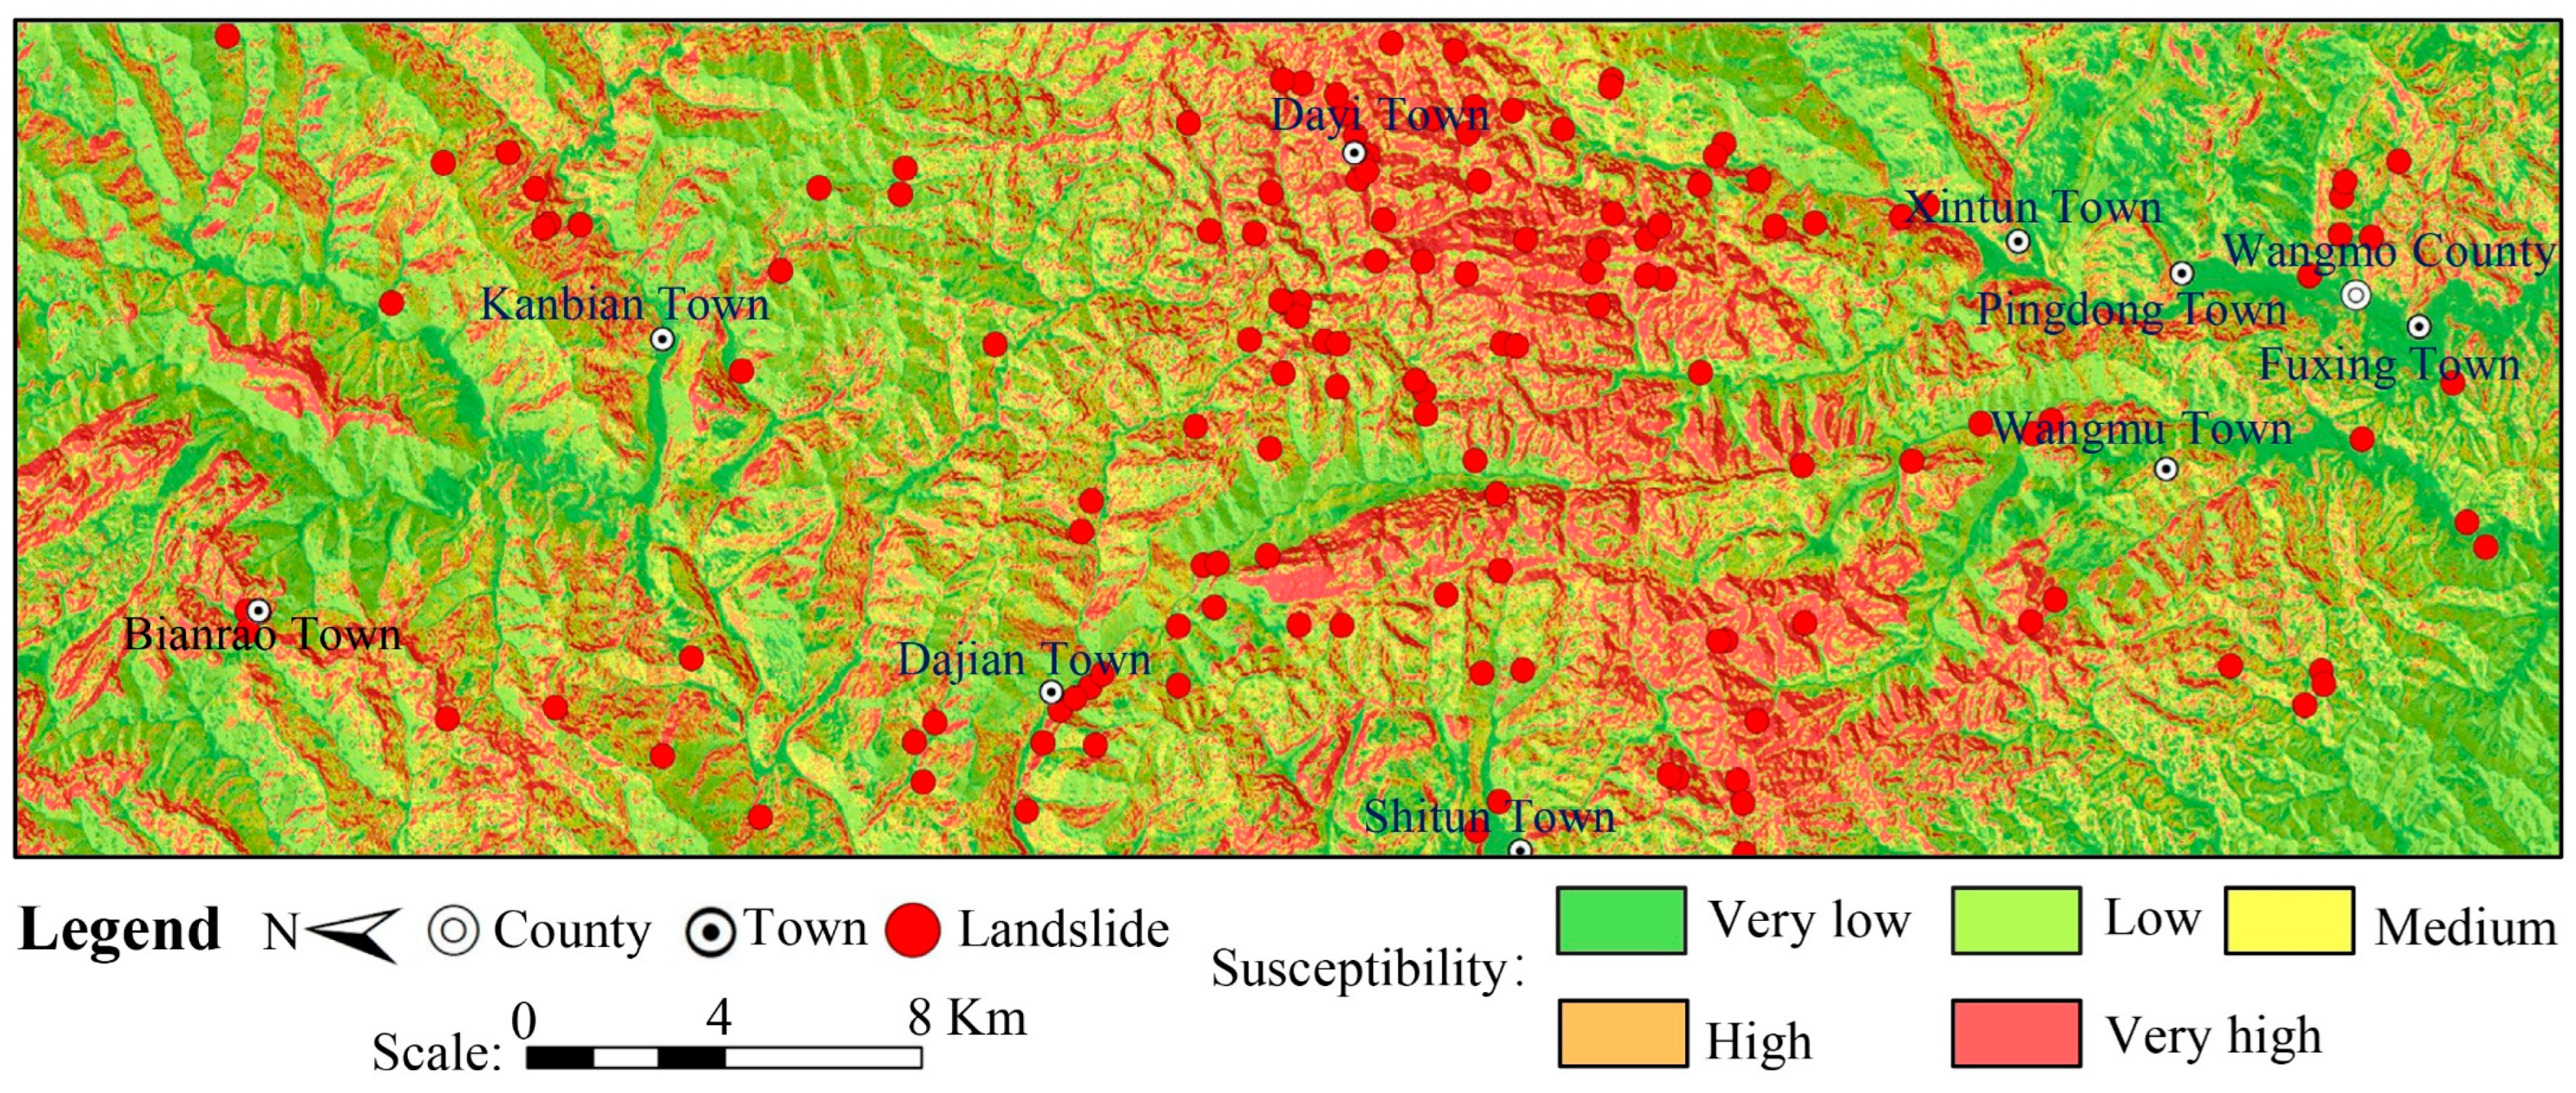
Figure 12 shows the LSM result in the study area based on the natural breaks method. The susceptibility values were classified as follows: very low (0–0.21), low (0.21–0.37), medium (0.37–0.53), high (0.53–0.71), and very high (0.71–1). The proportions of the five classes were 17.2%, 33.0%, 18.7%, 15.8%, and 15.3%, respectively. This classification mainly reflects the spatial distribution pattern of susceptibility values derived from the machine learning model and their internal statistical clustering.
Figure 12.
LSM based on the natural breaks method in the study area.
InSAR-derived deformation information can reflect recent surface activity associated with unstable slopes during the observation period to some extent. Therefore, it can be used as a reference for optimizing landslide susceptibility classification thresholds. LSM mainly represents the spatial tendency of landslide occurrence based on geo-environmental conditions, whereas InSAR-derived deformation reflects observation-period surface activity. Therefore, incorporating InSAR-derived deformation information can help improve the spatial consistency between susceptibility zoning and landslide-related deformation activity during the observation period.
In this study, the KDE-derived spatial distribution pattern of InSAR-derived deformation activity was used as the reference. The KDE-derived spatial distribution patterns of different landslide susceptibility classification schemes were compared with the deformation activity pattern using PCC. The PCC values ranged from 0.59 to 0.65, as shown in Figure 10. The classification scheme based on the natural breaks method yielded a PCC value of 0.61, whereas the optimized classification scheme achieved a PCC value of 0.65. The threshold values associated with the high PCC value were concentrated within the ranges of 0.12–0.14, 0.30–0.31, 0.60–0.64, and 0.80–0.83. Accordingly, the thresholds of 0.12, 0.31, 0.61, and 0.83 were selected for the final landslide susceptibility classification to generate the final landslide susceptibility map (Figure 11).
To examine the relationship between threshold variations and the KDE-PCC optimization results, correlation coefficients between the four classification thresholds and the PCC values were calculated based on the 300 candidate threshold sets. The correlation coefficients for the first, third, and fourth thresholds were 0.046, 0.119, and −0.114, respectively, indicating that no obvious linear relationships were observed between these thresholds and the PCC values within the predefined candidate ranges. In contrast, the second threshold showed a strong negative correlation with the PCC value, with a correlation coefficient of −0.921. This suggests that the PCC values were more sensitive to variations in the low-to-medium susceptibility boundary. The optimized second threshold was 0.31, located near the lower bound of the predefined low-to-medium transition range. This value represents the optimal threshold within the predefined feasible range, which was defined by considering both the semantic meaning of the model-derived susceptibility values and the general understanding of the transition from low to medium susceptibility.
The proportions of the optimized susceptibility classes were 7.2%, 31.6%, 37.0%, 19.7%, and 4.5%, respectively. Compared with the natural breaks classification, the proportion of the very high susceptibility class decreased from 15.3% to 4.5%, and the proportion of the very low susceptibility class decreased from 17.2% to 7.2%, resulting in a more concentrated distribution of the extreme susceptibility classes. This redistribution reflects a moderate adjustment of the class boundaries toward areas where susceptibility zoning and deformation activity exhibit higher spatial consistency.
5.2. Case Analysis of Deformation-Constrained LSM Classification Adjustment
In this study, the Xiangle landslide and the Namu landslide were selected as representative cases to illustrate the changes in susceptibility classes after incorporating InSAR-derived deformation constraints, and to evaluate the adjustment effects of the deformation-constrained classification method.
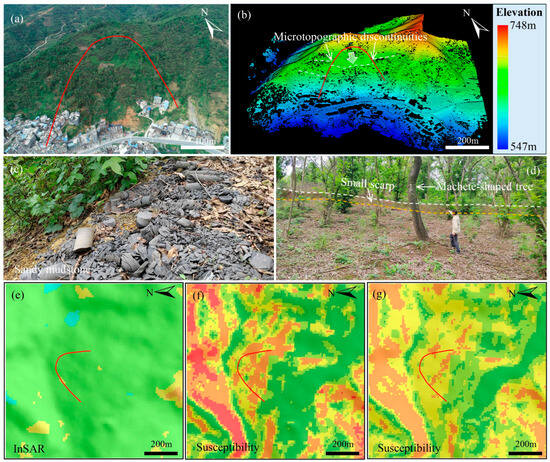
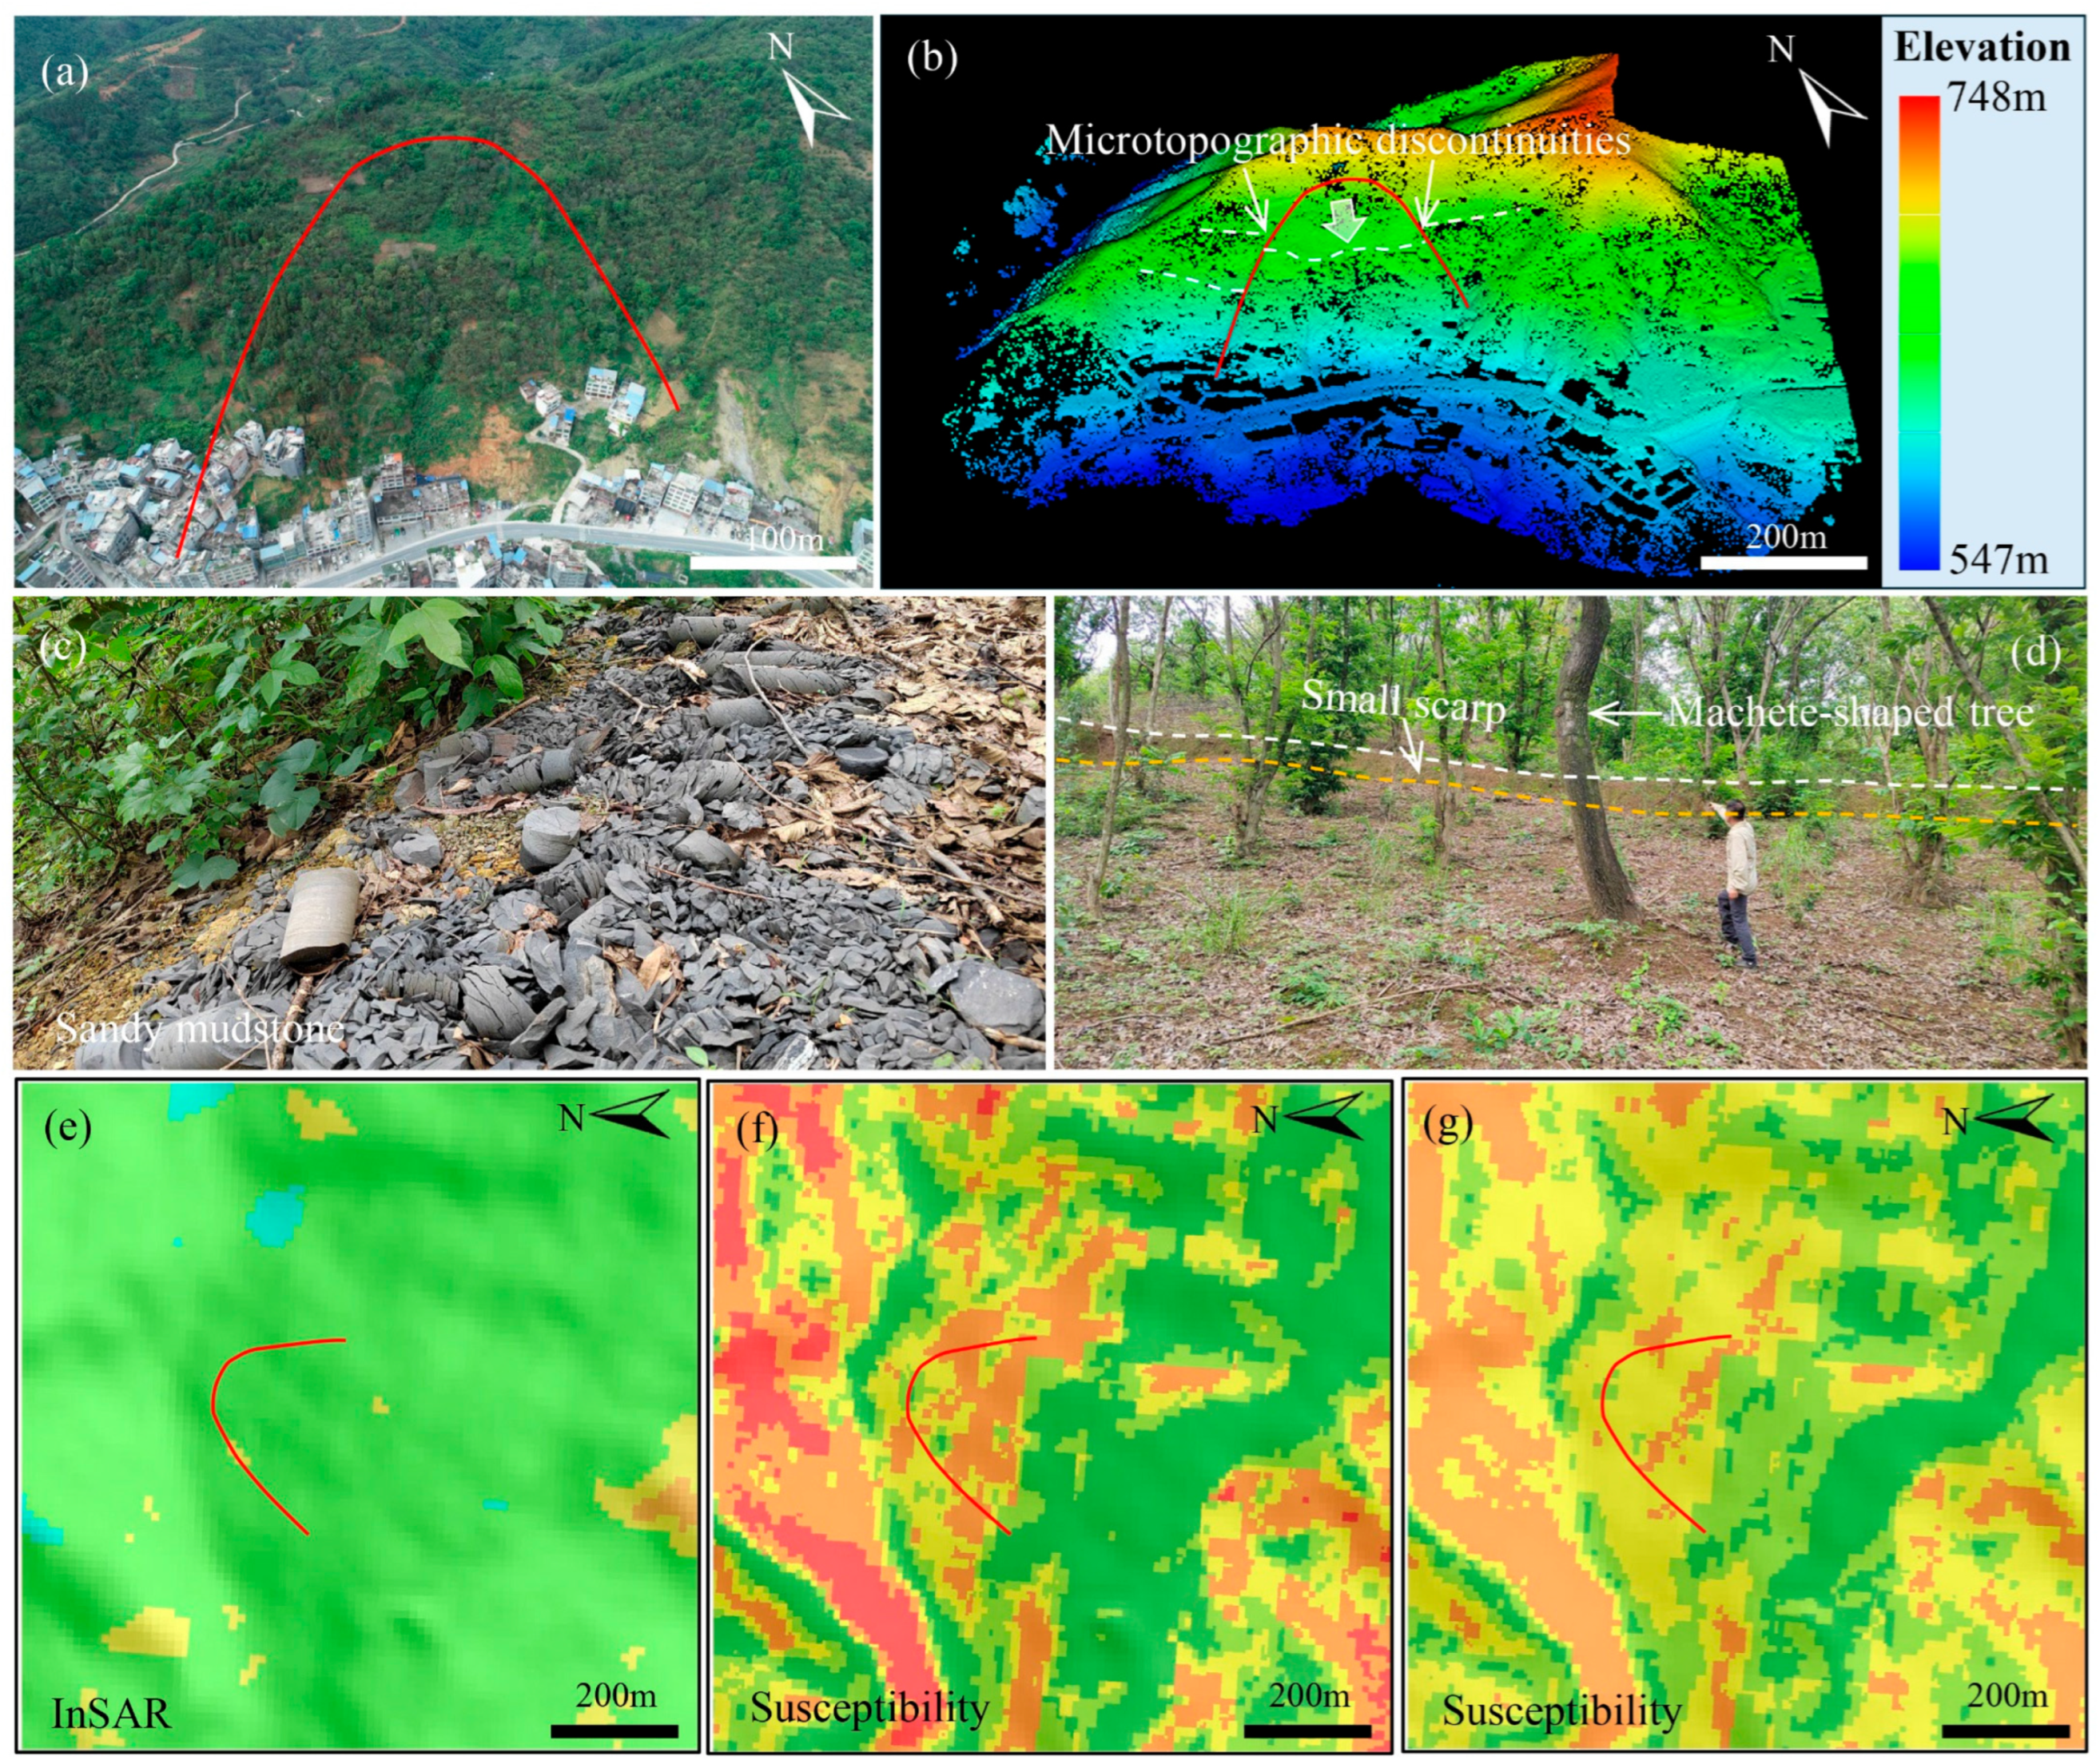
The Xiangle landslide is located in the eastern part of Wangmo County, Guizhou Province, China (106°6.4′E, 25°11.1′N), as shown in Figure 9 and Figure 13. The landslide is approximately 330 m long, with an average width of about 280 m, a slope angle of 30–35°, and a slope aspect of 205°. The average thickness is around 10 m, with an estimated volume of approximately 924,000 m3. The landslide material mainly consists of sandy mudstone from the Middle Triassic, with a bedding attitude of 205°∠35°. It was therefore classified as a medium-scale strongly weathered bedding rock landslide. LiDAR technology was employed to measure and extract the surface topography of the Xiangle landslide. The results showed a multi-level stepped micro-geomorphological terrain, indicating the presence of traction-type deformation in the past. Field surveys also identified small scarps and machete-shaped trees formed during previous deformation events. However, no obvious signs of recent deformation were observed, which is consistent with the InSAR interpretation results. These findings suggest that the Xiangle landslide has essentially entered a new state of mechanical equilibrium and is currently in a relatively stable stage. The LSM generated using the natural breaks method classified the Xiangle landslide area as highly susceptible, whereas the deformation-constrained LSM adjusted it to medium susceptibility. This adjustment is more consistent with the field-based understanding that the landslide did not show obvious recent activity during the observation period.
Figure 13.
Geological environment, deformation, and LSM of the Xiangle landslide: (a) panoramic view; (b) surface topography extracted by LiDAR; (c) soft rock; (d) historical deformation markers; (e) InSAR-derived deformation; (f) LSM based on the natural breaks method; (g) deformation-constrained LSM.
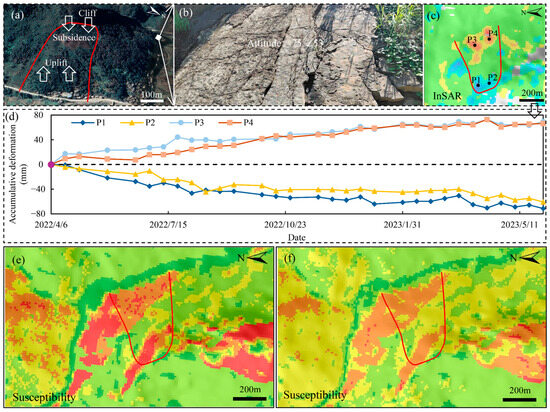
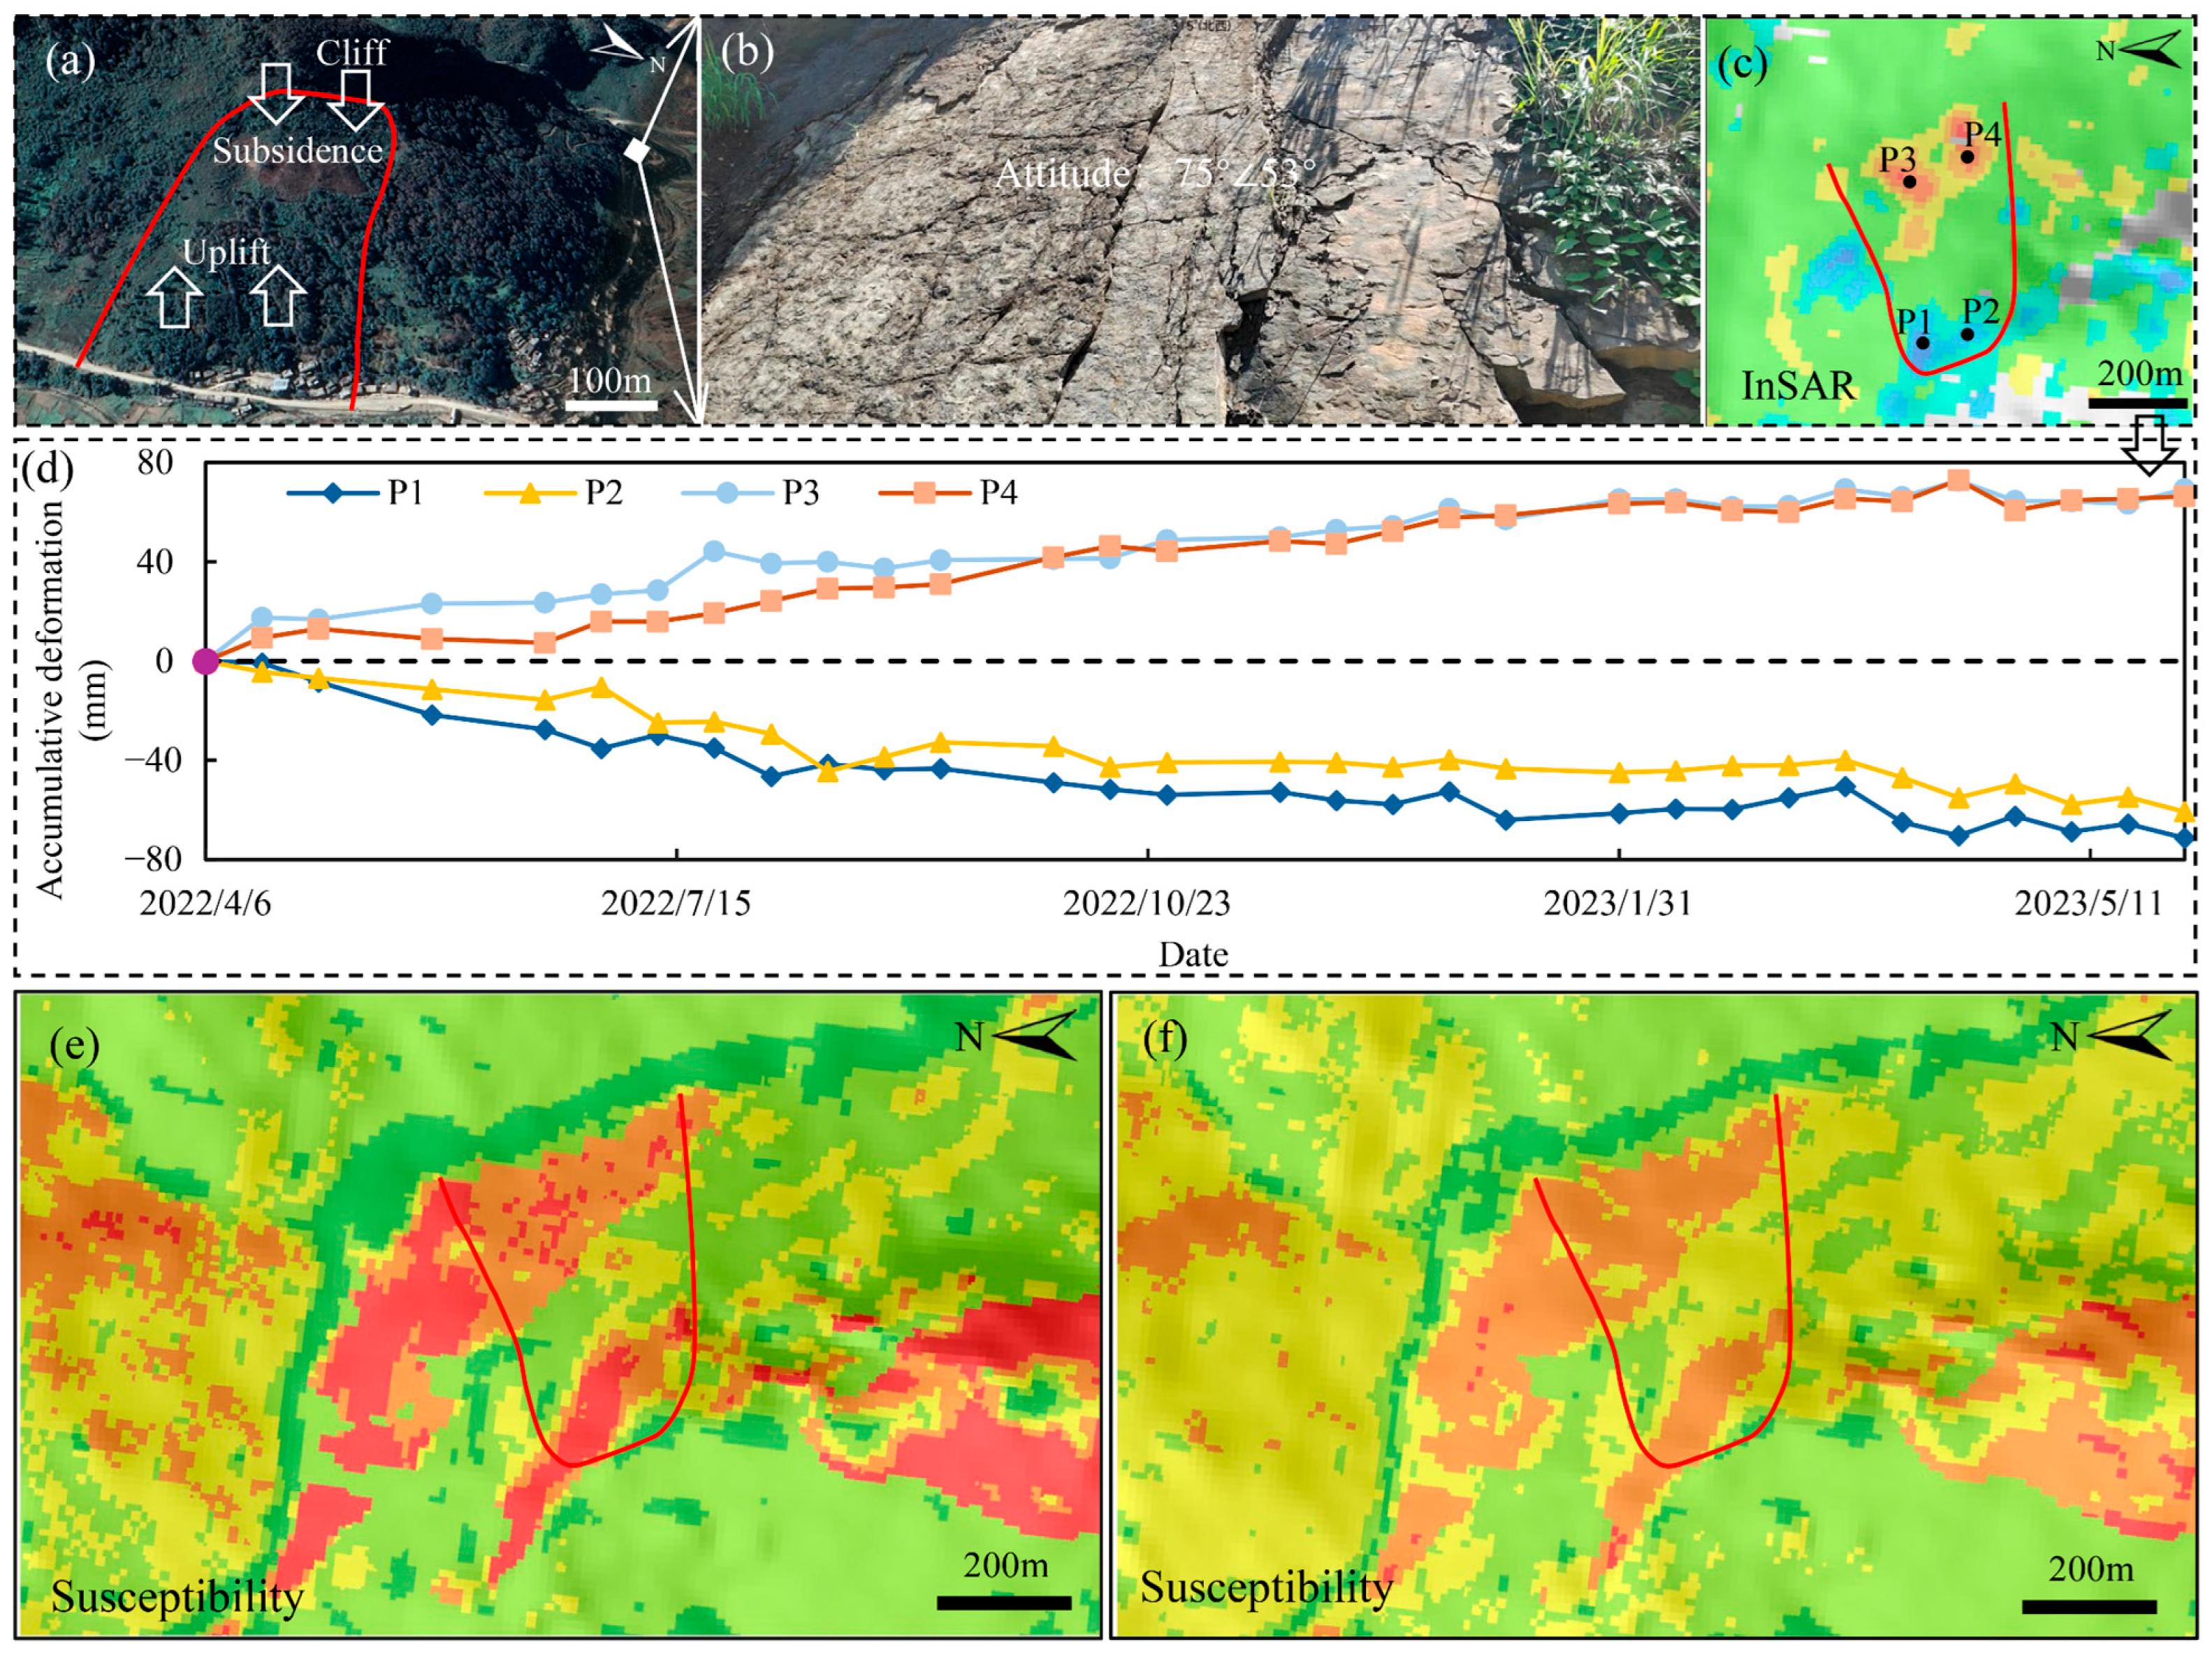
The Namu landslide is located near Dayi Town, Wangmo County, Guizhou Province, China (106°1.8′E, 25°22.9′N), as shown in Figure 9 and Figure 14. In the satellite remote sensing image, there is a clear cliff at the top of the slope where the Namu landslide is located, with an exposure height of about 88 m. The slope where the Namu landslide is located may be an old landslide body. The Namu landslide has a height difference of about 260 m, a length of about 466 m, an average width of approximately 220 m, a slope angle of about 33.8°, and a slope aspect of 58°. The average thickness is approximately 8 m, and the estimated volume is about 82.0 × 10⁴ m3. The landslide material mainly consists of sandy mudstone from the Middle Triassic, with a bedding attitude of 75°∠53°. Overall, the Namu landslide can be classified as a medium-scale strongly weathered rock landslide. Field investigations found that a small number of cracks had developed in the walls of residential buildings at the front edge of the Namu landslide. In recent years, no obvious rapid deformation has occurred in the landslide as a whole. It mainly exhibits slow creep deformation characteristics, which is consistent with the InSAR interpretation results. The LSM produced by the natural breaks method categorized the Namu landslide area as mainly ranging from high to very high susceptibility. In contrast, the deformation-constrained LSM adjusted it to medium to high susceptibility. This adjustment better reflects the slow deformation characteristics of the Namu landslide during the study period.
Figure 14.
Geological environment, deformation, and LSM of the Namu landslide: (a) panoramic view; (b) soft rock bedding plane; (c,d) InSAR-derived deformation; (e) LSM based on the natural breaks method; (f) deformation-constrained LSM.
In summary, the Xiangle and Namu landslides illustrate the effect of incorporating InSAR-derived deformation information into landslide susceptibility classification. The two cases show that the deformation-constrained classification adjustment can reflect observation-period deformation activity to some extent. For landslides with no obvious recent deformation, the susceptibility class may be adjusted downward, whereas for landslides with slow creep deformation, the adjusted classification can better represent their current activity state.
5.3. Limitations of the Approach
Compared with conventional LSM, deformation-constrained LSM introduces observation-period InSAR-derived deformation information as an additional spatial reference for susceptibility classification. This approach retains the role of geo-environmental conditions in controlling landslide susceptibility while incorporating recent deformation activity to constrain the classification thresholds. As a result, the susceptibility classification may better reflect the spatial relationship between landslide-prone areas and observation-period deformation activity. However, the proposed deformation-constrained LSM framework still has certain limitations.
First, model validation was based on a single stratified 80:20 train–test split. The sample size was limited, and some landslide samples exhibited spatial clustering. Repeated validation, cross-validation, and spatially independent validation were not conducted. Therefore, the reported AUC, accuracy, precision, recall, and F1-score values represent model performance only under the current held-out sample partition and may vary under different random or spatial partitions.
Second, the reliability and spatial completeness of InSAR-derived deformation information are affected by SAR data quality and terrain conditions. In rugged and densely vegetated areas, layover, shadowing, temporal decorrelation, and spatial decorrelation may result in invalid or unavailable deformation measurements. In this study, pixels without valid deformation values were treated as no-data areas and excluded from the KDE analysis and PCC calculation. Therefore, the classification-threshold optimization was primarily constrained by areas with valid InSAR observations. The proportion and spatial distribution of no-data areas should be carefully considered when applying the framework elsewhere.
The deformation results may also be affected by the quantity, temporal coverage, and spatial coverage of the available SAR images. Residual atmospheric delays, DEM errors, phase-unwrapping uncertainty, and decorrelation effects may introduce additional uncertainty. Furthermore, InSAR measures only the projection of three-dimensional ground displacement along the radar LOS direction. The measured deformation is therefore influenced by slope aspect, movement direction, and satellite viewing geometry. When the landslide movement direction is poorly aligned with the LOS direction, the actual displacement may be underestimated or partly undetected.
Third, the treatment of LOS deformation rates involves two case-specific assumptions. The approximately ±15 mm/year interval was empirically selected by considering the statistical distribution of LOS deformation rates, the regional deformation background, and the spatial distribution of mapped landslides. It should therefore be regarded as an operational criterion for this case study rather than a general stability threshold directly transferable to other regions. In addition, the use of absolute LOS deformation rates assigns equal importance to positive and negative values. Although the LOS sign does not directly represent three-dimensional slope movement, negative rates may be more closely associated with downward slope displacement under certain geometric conditions. Consequently, the absolute-value treatment may reduce the directional information contained in the LOS measurements and include deformation signals that are not related to landslide activity. This represents a technical limitation of the current approach.
Fourth, several methodological parameters may influence the optimization results. In particular, the KDE search radius controls the degree of spatial smoothing in the density maps, whereas the predefined candidate threshold ranges determine the feasible search space for susceptibility classification. Different parameter settings may produce different PCC values and classification thresholds. These parameters should therefore be carefully selected according to the spatial scale, terrain characteristics, and data quality of the study area.
Finally, the deformation-constrained LSM framework is more suitable for areas where land-slide susceptibility is closely related to detectable surface deformation. However, in other regions, high landslide susceptibility may not necessarily correspond to obvious InSAR-detectable deformation. For example, some potential landslide areas may not show clear deformation signals before failure. In such cases, the deformation-constrained framework may underestimate the susceptibility levels of these areas. Moreover, the framework has currently been tested only in the present study area. Differences in geomorphology, climate, vegetation, and land-cover conditions, lithology, and InSAR observation geometry may affect its performance. Its transferability to other regions therefore remains to be evaluated through additional case studies.
6. Conclusions
This study proposed an LSM framework constrained by InSAR-derived deformation information by integrating SBAS-InSAR deformation with machine learning-based evaluation of geo-environmental factors. Through the fusion of multi-source data, including remote sensing imagery, InSAR observations, geo-environmental factors, and field investigations, the proposed framework provides a practical way to incorporate observation-period deformation information into regional LSM while maintaining the spatial continuity of the susceptibility map.
Shapley value analysis improved the interpretability of susceptibility prediction by quantifying the relative contributions of landslide influencing factors. Slope, elevation, rainfall, and relief were identified as the dominant contributors to landslide susceptibility in the study area, a finding generally consistent with the landslide development characteristics of soft-rock slopes under terrain and rainfall controls. Based on model performance and interpretability, the RF-BPNN combined model was constructed using an equal-weight averaging strategy and was used for susceptibility calculation.
A KDE-PCC-based classification adjustment strategy was developed by comparing the KDE-derived spatial distribution patterns of candidate susceptibility classification schemes with the pattern of InSAR-derived deformation activity. The optimized classification scheme achieved a PCC value of 0.65, compared with 0.61 for the natural breaks classification, representing a modest improvement in the spatial consistency between susceptibility zoning and deformation activity. The Xiangle and Namu landslides were used as representative cases to illustrate the effects of the classification adjustment. Compared with the natural breaks classification, the deformation-constrained LSM provided susceptibility classes that were more consistent with the field-based understanding of their recent activity states.
Nevertheless, the proposed framework still has certain limitations. SAR observations in rugged terrain or densely vegetated areas may be affected by layover, shadowing, and decorrelation, resulting in missing or unreliable deformation information. The reliability of the deformation-constrained classification also depends on the quality, temporal coverage, and spatial coverage of the available SAR data. In addition, parameters such as the KDE search radius and candidate threshold ranges may influence the PCC results and the final classification scheme. Therefore, these parameters should be carefully determined according to the characteristics of the study area. The applicability of this framework in areas with different geomorphology, climate, vegetation, and land-cover conditions, lithology, and In-SAR observation geometry still requires further evaluation.
Overall, incorporating InSAR-derived deformation information into machine learning-based LSM can improve the temporal relevance of susceptibility classification and provide a more targeted spatial reference for field verification and landslide monitoring under suitable conditions. The proposed framework is most applicable to areas with good InSAR observation quality, a relatively high proportion of slowly deforming landslides, and reliable landslide activity verification data. It should be regarded as a complementary approach for regional landslide susceptibility assessment rather than a substitute for detailed landslide hazard or risk evaluation.
Author Contributions
X.H. and W.S. organized the data and wrote the paper; C.C. and Y.B. supervised and reviewed the work; W.S. and S.P. processed the data; X.H. developed the LSM framework constrained by InSAR-derived deformation; X.H., W.S. and S.P. conducted field investigations related to this work. All authors have read and agreed to the published version of the manuscript.
Funding
This work was supported by the Geological Survey Program of China Geological Survey (Nos. DD20221813 and DD202606101204) and the National Natural Science Foundation of China (No. 42207229).
Data Availability Statement
The Sentinel-1A datasets and precise orbit data were provided by the European Space Agency. Data on landslides were provided by the project that supported this article. Data are available upon request by e-mail to the authors.
Acknowledgments
We would also like to thank the Geological Hazard Technical Service Center of Guizhou Province for providing data support.
Conflicts of Interest
The authors declare no conflict of interest.
References
- Yu, L.; Wang, Y.; Pradhan, B. Enhancing landslide susceptibility mapping incorporating landslide typology via stacking ensemble machine learning in Three Gorges Reservoir, China. Geosci. Front. 2024, 15, 101802. [Google Scholar] [CrossRef] [Scilit]
- Sheng, Y.; Xu, G.; Jin, B.; Zhou, C.; Li, Y.; Chen, W. Data-driven landslide spatial prediction and deformation monitoring: A case study of Shiyan city, China. Remote Sens. 2023, 15, 5256. [Google Scholar] [CrossRef] [Scilit]
- Youssef, A.M.; Pourghasemi, H.R. Landslide susceptibility mapping using machine learning algorithms and comparison of their performance at Abha Basin, Asir Region, Saudi Arabia. Geosci. Front. 2021, 12, 639–655. [Google Scholar] [CrossRef] [Scilit]
- Huang, F.; Cao, Z.; Guo, J.; Jiang, S.-H.; Li, S.; Guo, Z. Comparisons of heuristic, general statistical and machine learning models for landslide susceptibility prediction and mapping. Catena 2020, 191, 104580. [Google Scholar] [CrossRef] [Scilit]
- Lu, Y.; Xu, H.; Wang, C.; Yan, G.; Huo, Z.; Peng, Z.; Liu, B.; Xu, C. A Novel Strategy Coupling Optimised Sampling with Heterogeneous Ensemble Machine-Learning to Predict Landslide Susceptibility. Remote Sens. 2024, 16, 3663. [Google Scholar] [CrossRef] [Scilit]
- Yan, L.; Xiong, Q.; Li, D.; Cheon, E.; She, X.; Yang, S. InSAR-Driven Dynamic Landslide Hazard Mapping in Highly Vegetated Area. Remote Sens. 2024, 16, 3229. [Google Scholar] [CrossRef] [Scilit]
- Cao, C.; Zhu, K.; Xu, P.; Shan, B.; Yang, G.; Song, S. Refined landslide susceptibility analysis based on InSAR technology and UAV multi-source data. J. Clean. Prod. 2022, 368, 133146. [Google Scholar] [CrossRef] [Scilit]
- Guo, R.; Li, S.; Chen, Y.; Li, X.; Yuan, L. Identification and monitoring landslides in Longitudinal Range-Gorge Region with InSAR fusion integrated visibility analysis. Landslides 2021, 18, 551–568. [Google Scholar]
- Shahabi, H.; Hashim, M.; Bin Ahmad, B. Remote sensing and GIS-based landslide susceptibility mapping using frequency ratio, logistic regression, and fuzzy logic methods at the central Zab basin. Iran. Environ. Earth Sci. 2015, 73, 8647–8668. [Google Scholar] [CrossRef] [Scilit]
- Moresi, F.V.; Maesano, M.; di Cristofaro, M.; Scarascia Mugnozza, G.; Brunori, E. Evaluating Shallow Landslide Prediction Mapping by Using Two Different GIS-Based Models: 4SLIDE and SHALSTAB. ISPRS Int. J. Geo-Inf. 2025, 14, 144. [Google Scholar] [CrossRef] [Scilit]
- Ciurleo, M.; Ferlisi, S.; Foresta, V.; Mandaglio, M.C.; Moraci, N. Landslide Susceptibility Analysis by Applying TRIGRS to a Reliable Geotechnical Slope Model. Geosciences 2022, 12, 18. [Google Scholar]
- Lin, W.; Yin, K.L.; Wang, N.T.; Xu, Y.; Guo, Z.Z.; Li, Y.Y. Landslide hazard assessment of rainfall-induced landslide based on the CF-SINMAP model: A case study from Wuling Mountain in Hunan Province, China. Nat. Hazards 2021, 106, 679–700. [Google Scholar] [CrossRef] [Scilit]
- Ding, D.; Wu, Y.; Wu, T.; Gong, C. Landslide susceptibility assessment in Tongguan District Anhui China using information value and certainty factor models. Sci. Rep. 2025, 15, 12275. [Google Scholar] [CrossRef] [Scilit] [PubMed]
- Yang, Y.; Zhang, R.; Wang, T.; Liu, A.; He, Y.; Lv, J.; He, X.; Mao, W.; Xiang, W.; Zhang, B. An information quantity and machine learning integrated model for landslide susceptibility mapping in Jiuzhaigou, China. Nat. Hazards 2024, 120, 10185–10217. [Google Scholar] [CrossRef] [Scilit]
- Youssef, B.; Bouskri, I.; Brahim, B.; Kader, S.; Brahim, I.; Abdelkrim, B.; Spalevic, V. The contribution of the frequency ratio model and the prediction rate for the analysis of landslide risk in the Tizi N’tichka area on the national road (RN9) linking Marrakech and Ouarzazate. Catena 2023, 232, 107464. [Google Scholar] [CrossRef] [Scilit]
- Liu, S.; Jiang, X.; He, X.; Qiu, H.; Yang, Y.; Zhao, R.; Hu, H. A novel landslide susceptibility mapping method based on a backpropagation neural network algorithm with optimized non-landslide samples and hyperparameters. Eng. Appl. Artif. Intell. 2025, 155, 111052. [Google Scholar] [CrossRef] [Scilit]
- Sun, D.; Xu, J.; Wen, H.; Wang, D. Assessment of landslide susceptibility mapping based on Bayesian hyperparameter optimization: A comparison between logistic regression and random forest. Eng. Geol. 2021, 281, 105972. [Google Scholar] [CrossRef] [Scilit]
- Xie, Z.; Chen, G.; Meng, X.; Zhang, Y.; Qiao, L.; Tan, L. A comparative study of landslide susceptibility mapping using weight of evidence, logistic regression and support vector machine and evaluated by SBAS-InSAR monitoring: Zhouqu to Wudu segment in Bailong River Basin, China. Environ. Earth Sci. 2017, 76, 313. [Google Scholar] [CrossRef] [Scilit]
- Dou, H.; He, J.; Huang, S.; Jian, W.; Guo, C. Influences of non-landslide sample selection strategies on landslide susceptibility mapping by machine learning. Geomat. Nat. Hazards Risk 2023, 14, 2285719. [Google Scholar] [CrossRef] [Scilit]
- Lundberg, S.M.; Lee, S.I. A unified approach to interpreting model predictions. In Proceedings of the 31st International Conference on Neural Information Processing Systems, Long Beach, CA, USA, 4–9 December 2017; pp. 4768–4777. [Google Scholar]
- Yang, Z.; Jiang, X.; Zheng, M.; Guo, Q. Effects of SBAS-InSAR Deformation Integration Methods and Machine Learning Model Selection on Landslide Susceptibility Mapping. IEEE Access 2025, 13, 98622–98638. [Google Scholar] [CrossRef] [Scilit]
- Wu, X.; Qi, X.; Peng, B.; Wang, J. Optimized Landslide Susceptibility Mapping and Modelling Using the SBAS-InSAR Coupling Model. Remote Sens. 2024, 16, 2873. [Google Scholar] [CrossRef] [Scilit]
- Xu, S.; Song, Y.; Lu, P.; Mu, G.; Yang, K.; Wang, S. An optimized non-landslide sampling method for Landslide susceptibility evaluation using machine learning models. Nat. Hazards 2025, 121, 5873–5900. [Google Scholar] [CrossRef] [Scilit]
- Wang, J.; Wang, Y.; Li, M.; Qi, Z.; Li, C.; Qi, H.; Zhang, X. Improved landslide susceptibility assessment: A new negative sample collection strategy and a comparative analysis of zoning methods. Ecol. Indic. 2024, 169, 112948. [Google Scholar] [CrossRef] [Scilit]
- Fu, Z.; Wang, F.; Dou, J.; Nam, K.; Ma, H. Enhanced absence sampling technique for data-driven landslide susceptibility mapping: A case study in Songyang County, China. Remote Sens. 2023, 15, 3345. [Google Scholar] [CrossRef] [Scilit]
- Ye, C.M.; Tang, R.; Wei, R.L.; Guo, Z.X.; Zhang, H.J. Generating accurate negative samples for landslide susceptibility mapping: A combined self-organizing-map and one-class SVM method. Front. Earth Sci. 2023, 10, 1054027. [Google Scholar] [CrossRef] [Scilit]
- Xi, C.J.; Han, M.; Hu, X.W.; Liu, B.; He, K.; Luo, G.; Cao, X.C. Effectiveness of Newmark-based sampling strategy for coseismic landslide susceptibility mapping using deep learning, support vector machine, and logistic regression. Bull. Eng. Geol. Environ. 2022, 81, 174. [Google Scholar] [CrossRef] [Scilit]
- Pradhan, B.; Dikshit, A.; Lee, S.; Kim, H. An explainable AI (XAI) model for landslide susceptibility modeling. Appl. Soft Comput. 2023, 142, 110324. [Google Scholar] [CrossRef] [Scilit]
- Wang, N.; Zhang, H.; Dahal, A.; Cheng, W.; Zhao, M.; Lombardo, L. On the use of explainable AI for susceptibility modeling: Examining the spatial pattern of SHAP values. Geosci. Front. 2024, 15, 101800. [Google Scholar] [CrossRef] [Scilit]
- Li, Y.; Feng, X.; Li, Y.; Jiang, W.; Yu, W. Detection and Analysis of Potential Landslides Based on SBAS-InSAR Technology in Alpine Canyon Region. Environ. Sci. Pollut. Res. 2024, 31, 6492–6510. [Google Scholar]
- Yazici, B.V.; Tunc Gormus, E. Investigating Persistent Scatterer InSAR (PSInSAR) Technique Efficiency for Landslides Mapping: A Case Study in Artvin Dam Area, in Turkey. Geocarto Int. 2022, 37, 2293–2311. [Google Scholar]
- Zhou, C.; Cao, Y.; Gan, L.; Wang, Y.; Motagh, M.; Roessner, S.; Hu, X.; Yin, K. A Novel Framework for Landslide Displacement Prediction Using MT-InSAR and Machine Learning Techniques. Eng. Geol. 2024, 334, 107497. [Google Scholar] [CrossRef] [Scilit]
- van Natijne, A.L.; Bogaard, T.A.; van Leijen, F.J.; Hanssen, R.F.; Lindenbergh, R.C. World-Wide InSAR Sensitivity Index for Landslide Deformation Tracking. Int. J. Appl. Earth Obs. Geoinf. 2022, 111, 102829. [Google Scholar] [CrossRef] [Scilit]
- Zhou, C.; Cao, Y.; Hu, X.; Yin, K.; Wang, Y.; Catani, F. Enhanced Dynamic Landslide Hazard Mapping Using MT-InSAR Method in the Three Gorges Reservoir Area. Landslides 2022, 19, 1585–1597. [Google Scholar] [CrossRef] [Scilit]
- Devara, M.; Tiwari, A.; Dwivedi, R. Landslide susceptibility mapping using MT-InSAR and AHP enabled GIS-based multi-criteria decision analysis. Geomat. Nat. Hazards Risk 2021, 12, 675–693. [Google Scholar] [CrossRef] [Scilit]
- Kulsoom, I.; Hua, W.; Hussain, S.; Chen, Q.; Khan, G.; Shihao, D. SBAS-InSAR based validated landslide susceptibility mapping along the Karakoram Highway: A case study of Gilgit-Baltistan, Pakistan. Sci. Rep. 2023, 13, 3344. [Google Scholar] [CrossRef] [Scilit] [PubMed]
- Cheng, Y.; Pang, H.; Li, Y.; Fan, L.; Wei, S.; Yuan, Z.; Fang, Y. Applications and Advancements of Spaceborne InSAR in Landslide Monitoring and Susceptibility Mapping: A Systematic Review. Remote Sens. 2025, 17, 999. [Google Scholar] [CrossRef] [Scilit]
- Zhao, D.; Han, J.; Liu, X.; Zuo, Z.; Zheng, K. Exploration of the Application of Fine Reconstruction of Unmanned Aerial Vehicles in Landslide Disaster Investigation and Management. In Hydropower and Renewable Energies (IHDC 2024); Springer Nature: Singapore, 2025; Volume 487, pp. 489–502. [Google Scholar] [CrossRef] [Scilit]
- Berardino, P.; Fornaro, G.; Lanari, R.; Sansosti, E. A new algorithm for surface deformation monitoring based on small baseline differential SAR interferograms. IEEE Trans. Geosci. Remote Sens. 2002, 40, 2375–2383. [Google Scholar] [CrossRef] [Scilit]
- Chen, G.; Zhang, Y.; Zeng, R.; Yang, Z.; Chen, X.; Zhao, F.; Meng, X. Detection of land subsidence associated with land creation and Rapid urbanization in the Chinese loess plateau using time series InSAR: A case study of Lanzhou new District. Remote Sens. 2018, 10, 270. [Google Scholar] [CrossRef] [Scilit]
- Wang, H.; Jiang, Z.; Xu, W.; Wang, R.; Xie, W. Physical model test on deformation and failure mechanism of deposit landslide under gradient rainfall. Bull. Eng. Geol. Environ. 2022, 81, 02913. [Google Scholar] [CrossRef] [Scilit]
- Pourghasemi, H.R.; Gayen, A.; Edalat, M.; Zarafshar, M.; Tiefenbacher, J.P. Is multi-hazard mapping effective in assessing natural hazards and integrated watershed management? Geosci. Front. 2020, 11, 1203–1217. [Google Scholar] [CrossRef] [Scilit]
- Chen, W.; Zhang, S.; Li, R.; Shahabi, H. Performance evaluation of the GIS-based data mining techniques of best-first decision tree, random forest, and naive Bayes tree for landslide susceptibility modeling. Sci. Total Environ. 2018, 644, 1006–1018. [Google Scholar] [CrossRef] [Scilit] [PubMed]
- Hussain, M.A.; Chen, Z.; Zhou, Y.; Meena, S.R.; Ali, N.; Shah, S.U. Landslide susceptibility mapping using artificial intelligence models: A case study in the Himalayas. Landslides 2025, 22, 2089–2103. [Google Scholar] [CrossRef] [Scilit]
- Shang, H.; Su, L.; Chen, W.; Tsangaratos, P.; Ilia, I.; Liu, S.; Cui, S.; Duan, Z. Spatial Prediction of Landslide Susceptibility Using Logistic Regression (LR), Functional Trees (FTs), and Random Subspace Functional Trees (RSFTs) for Pengyang County, China. Remote Sens. 2023, 15, 4952. [Google Scholar] [CrossRef] [Scilit]
- Sujatha, E.R.; Sridhar, V. Landslide Susceptibility Analysis: A Logistic Regression Model Case Study in Coonoor, India. Hydrology 2021, 8, 41. [Google Scholar] [CrossRef] [Scilit]
- Zhang, W.; He, Y.; Wang, L.; Liu, S.; Meng, X. Landslide Susceptibility mapping using random forest and extreme gradient boosting: A case study of Fengjie, Chongqing. Geol. J. 2023, 58, 2372–2387. [Google Scholar] [CrossRef] [Scilit]
- Sun, D.; Shi, S.; Wen, H.; Xu, J.; Zhou, X.; Wu, J. A hybrid optimization method of factor screening predicated on GeoDetector and Random Forest for Landslide Susceptibility Mapping. Geomorphology 2021, 379, 107623. [Google Scholar] [CrossRef] [Scilit]
- He, Q.; Wu, S.; Zhao, X.; Hui, Z.; Wang, Z.; Tsangaratos, P.; Ilia, I.; Chen, W.; Chen, Y.; Hao, Y. Evaluation of landslide susceptibility of mountain highway based on RF and SVM models. Sci. Rep. 2025, 15, 24991. [Google Scholar] [CrossRef] [Scilit] [PubMed]
- Zhao, S.; Zhao, Z. A Comparative Study of Landslide Susceptibility Mapping Using SVM and PSO-SVM Models Based on Grid and Slope Units. Math. Probl. Eng. 2021, 2021, 8854606. [Google Scholar] [CrossRef] [Scilit]
- Xue, Z.; Feng, W.; Li, B.; Zhou, Y.; Yi, X.; Wu, M. Landslide susceptibility mapping based on the coupling of two correlation methods and the BP neural network model: A case study of the Baihetan Reservoir area, China. Front. Environ. Sci. 2022, 10, 1039985. [Google Scholar] [CrossRef] [Scilit]
- Chen, J.; Guo, Q.; Yang, J.; Luo, J.; Wang, L. Seismic landslide susceptibility assessment based on game theory combination weighting and information volume model: A case study of Luding earthquake high-intensity area. Sādhanā 2025, 50, 6. [Google Scholar] [CrossRef] [Scilit]
- He, Y.; Bin, Z.; Xu, X.; Yu, H.; Zhang, Y.; Li, N.; Li, M. Landslide Risk Assessment Along Railway Lines Using Multi-Source Data: A Game Theory-Based Integrated Weighting Approach for Sustainable Infrastructure Planning. Sustainability 2025, 17, 5522. [Google Scholar] [CrossRef] [Scilit]
- Zhang, Z.; Sun, J. Regional Landslide Susceptibility Assessment and Model Adaptability Research. Remote Sens. 2024, 16, 2305. [Google Scholar] [CrossRef] [Scilit]
- Sun, X.H.; Chen, J.P.; Han, X.D.; Bao, Y.D.; Zhan, J.W.; Peng, W. Application of a GIS-based slope unit method for landslide susceptibility mapping along the rapidly uplifting section of the upper Jinsha River, South-Western China. Bull. Eng. Geol. Environ. 2020, 79, 533–549. [Google Scholar] [CrossRef] [Scilit]
- Hanley, J.A.; McNeil, B.J. A Method of Comparing the Areas under Receiver Operating Characteristic Curves Derived from the Same Cases. Radiology 1983, 148, 839–843. [Google Scholar] [CrossRef] [Scilit] [PubMed]
- Xu, Q.; Guo, C.; Dong, X.; Li, W.; Lu, H.; Fu, H.; Liu, X. Mapping and characterizing displacements of landslides with InSAR and airborne LiDAR Technologies: A case study of Danba county, southwest China. Remote Sens. 2021, 13, 4234. [Google Scholar] [CrossRef] [Scilit]
- Zhang, L.; Dai, K.; Deng, J.; Ge, D.; Liang, R.; Li, W.; Xu, Q. Identifying potential landslides by stacking-InSAR in southwestern China and its performance comparison with SBAS-InSAR. Remote Sens. 2021, 13, 3662. [Google Scholar] [CrossRef] [Scilit]
- Li, Y.; Lei, Y.; Chen, B.; Chen, J. Evaluation of geological hazard susceptibility based on the multi-kernel density information method. Sci. Rep. 2025, 15, 7892. [Google Scholar] [CrossRef] [Scilit] [PubMed]
- Jin, J.; Chen, G.; Meng, X.; Zhang, Y.; Shi, W.; Li, Y.; Yang, Y.; Jiang, W. Prediction of River Damming Susceptibility by Landslides Based on a Logistic Regression Model and InSAR Techniques: A Case Study of the Bailong River Basin, China. Eng. Geol. 2022, 299, 106562. [Google Scholar] [CrossRef] [Scilit]
- Liu, Y.; Xu, P.; Cao, C.; Shan, B.; Zhu, K.; Ma, Q.; Zhang, Z.; Yin, H. A comparative evaluation of machine learning algorithms and an improved optimal model for landslide susceptibility: A case study. Geomat. Nat. Hazards Risk 2021, 12, 1973–2001. [Google Scholar] [CrossRef] [Scilit]

Disclaimer/Publisher’s Note: The statements, opinions and data contained in all publications are solely those of the individual author(s) and contributor(s) and not of MDPI and/or the editor(s). MDPI and/or the editor(s) disclaim responsibility for any injury to people or property resulting from any ideas, methods, instructions or products referred to in the content. |
© 2026 by the authors. Licensee MDPI, Basel, Switzerland. This article is an open access article distributed under the terms and conditions of the Creative Commons Attribution (CC BY) license.