


Highlights
What are the main findings?
- The analysis of three decades of multi-mission DInSAR time series at Campi Flegrei reveals that ground deformation is dominated by a stable spatial geometry with time-varying amplitude.
- A secondary constant-velocity deformation component mainly affects the south-eastern sector of the caldera.
What are the implications of the main findings?
- The results support the persistence of a stable deformation source at 3–4 km depth, whose temporal evolution is primarily governed by changes in source strength rather than geometry.
- The proposed decomposition framework enhances the interpretation of the seemingly complex Campi Flegrei geodetic time series and provides a robust basis for detecting changes relevant to monitoring and hazard assessment.
Abstract
Understanding the spatio-temporal structure of ground deformation in caldera systems remains a major challenge because multiple processes may coexist and interact across different spatial and temporal scales. The Campi Flegrei caldera provides an exceptional natural laboratory to investigate these dynamics through long-term geodetic observations. Here, we integrate three decades of multi-mission Differential Interferometric Synthetic Aperture Radar (DInSAR) data to retrieve the spatio-temporal evolution of the ground displacement field. We analyse the resulting dataset using a kinematic decomposition in which the deformation field is expressed as the sum of (i) a time-invariant spatial pattern modulated by a time-dependent amplitude and (ii) a spatially variable constant-velocity component. Our results show that the observed deformation is largely governed by a dominant spatial pattern that remains remarkably stable through time, while its temporal amplitude reproduces both subsidence and uplift phases. In addition, a secondary constant-velocity component, with amplitudes of only a few mm yr−1, is required to account for residual spatial variability, particularly in the south-eastern sector of the caldera. A transition in deformation behaviour around 2012–2013 is associated with a south-westward expansion of the dominant deformation pattern. The inferred dominant spatial patterns are consistent with a persistent deformation source located at a depth of approximately 3–4 km, whereas the secondary spatially variable constant-velocity field is compatible with a deeper expansion process. These findings indicate that long-term caldera deformation can be effectively represented within a low-dimensional kinematic framework. This approach provides a robust basis for the interpretation of geodetic time series and for the identification of changes in deformation regime in restless caldera systems.
1. Introduction
Ground deformation is one of the primary observables used to investigate the dynamics of active volcanic and caldera systems because it reflects pressure and mass redistribution within the subsurface. However, interpreting deformation signals remains challenging, as multiple magmatic, hydrothermal, and tectonic processes may coexist and interact across multiple spatial and temporal scales. Distinguishing the relative contribution of these processes is particularly difficult in long-lived restless calderas, where deformation may persist for decades and exhibit transitions between subsidence and uplift phases.
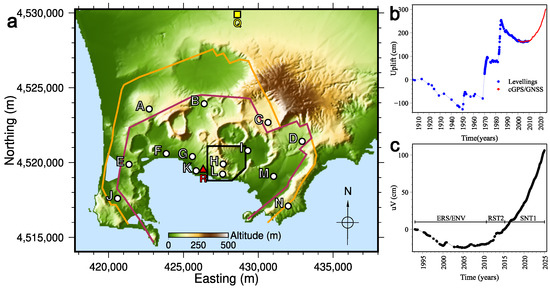
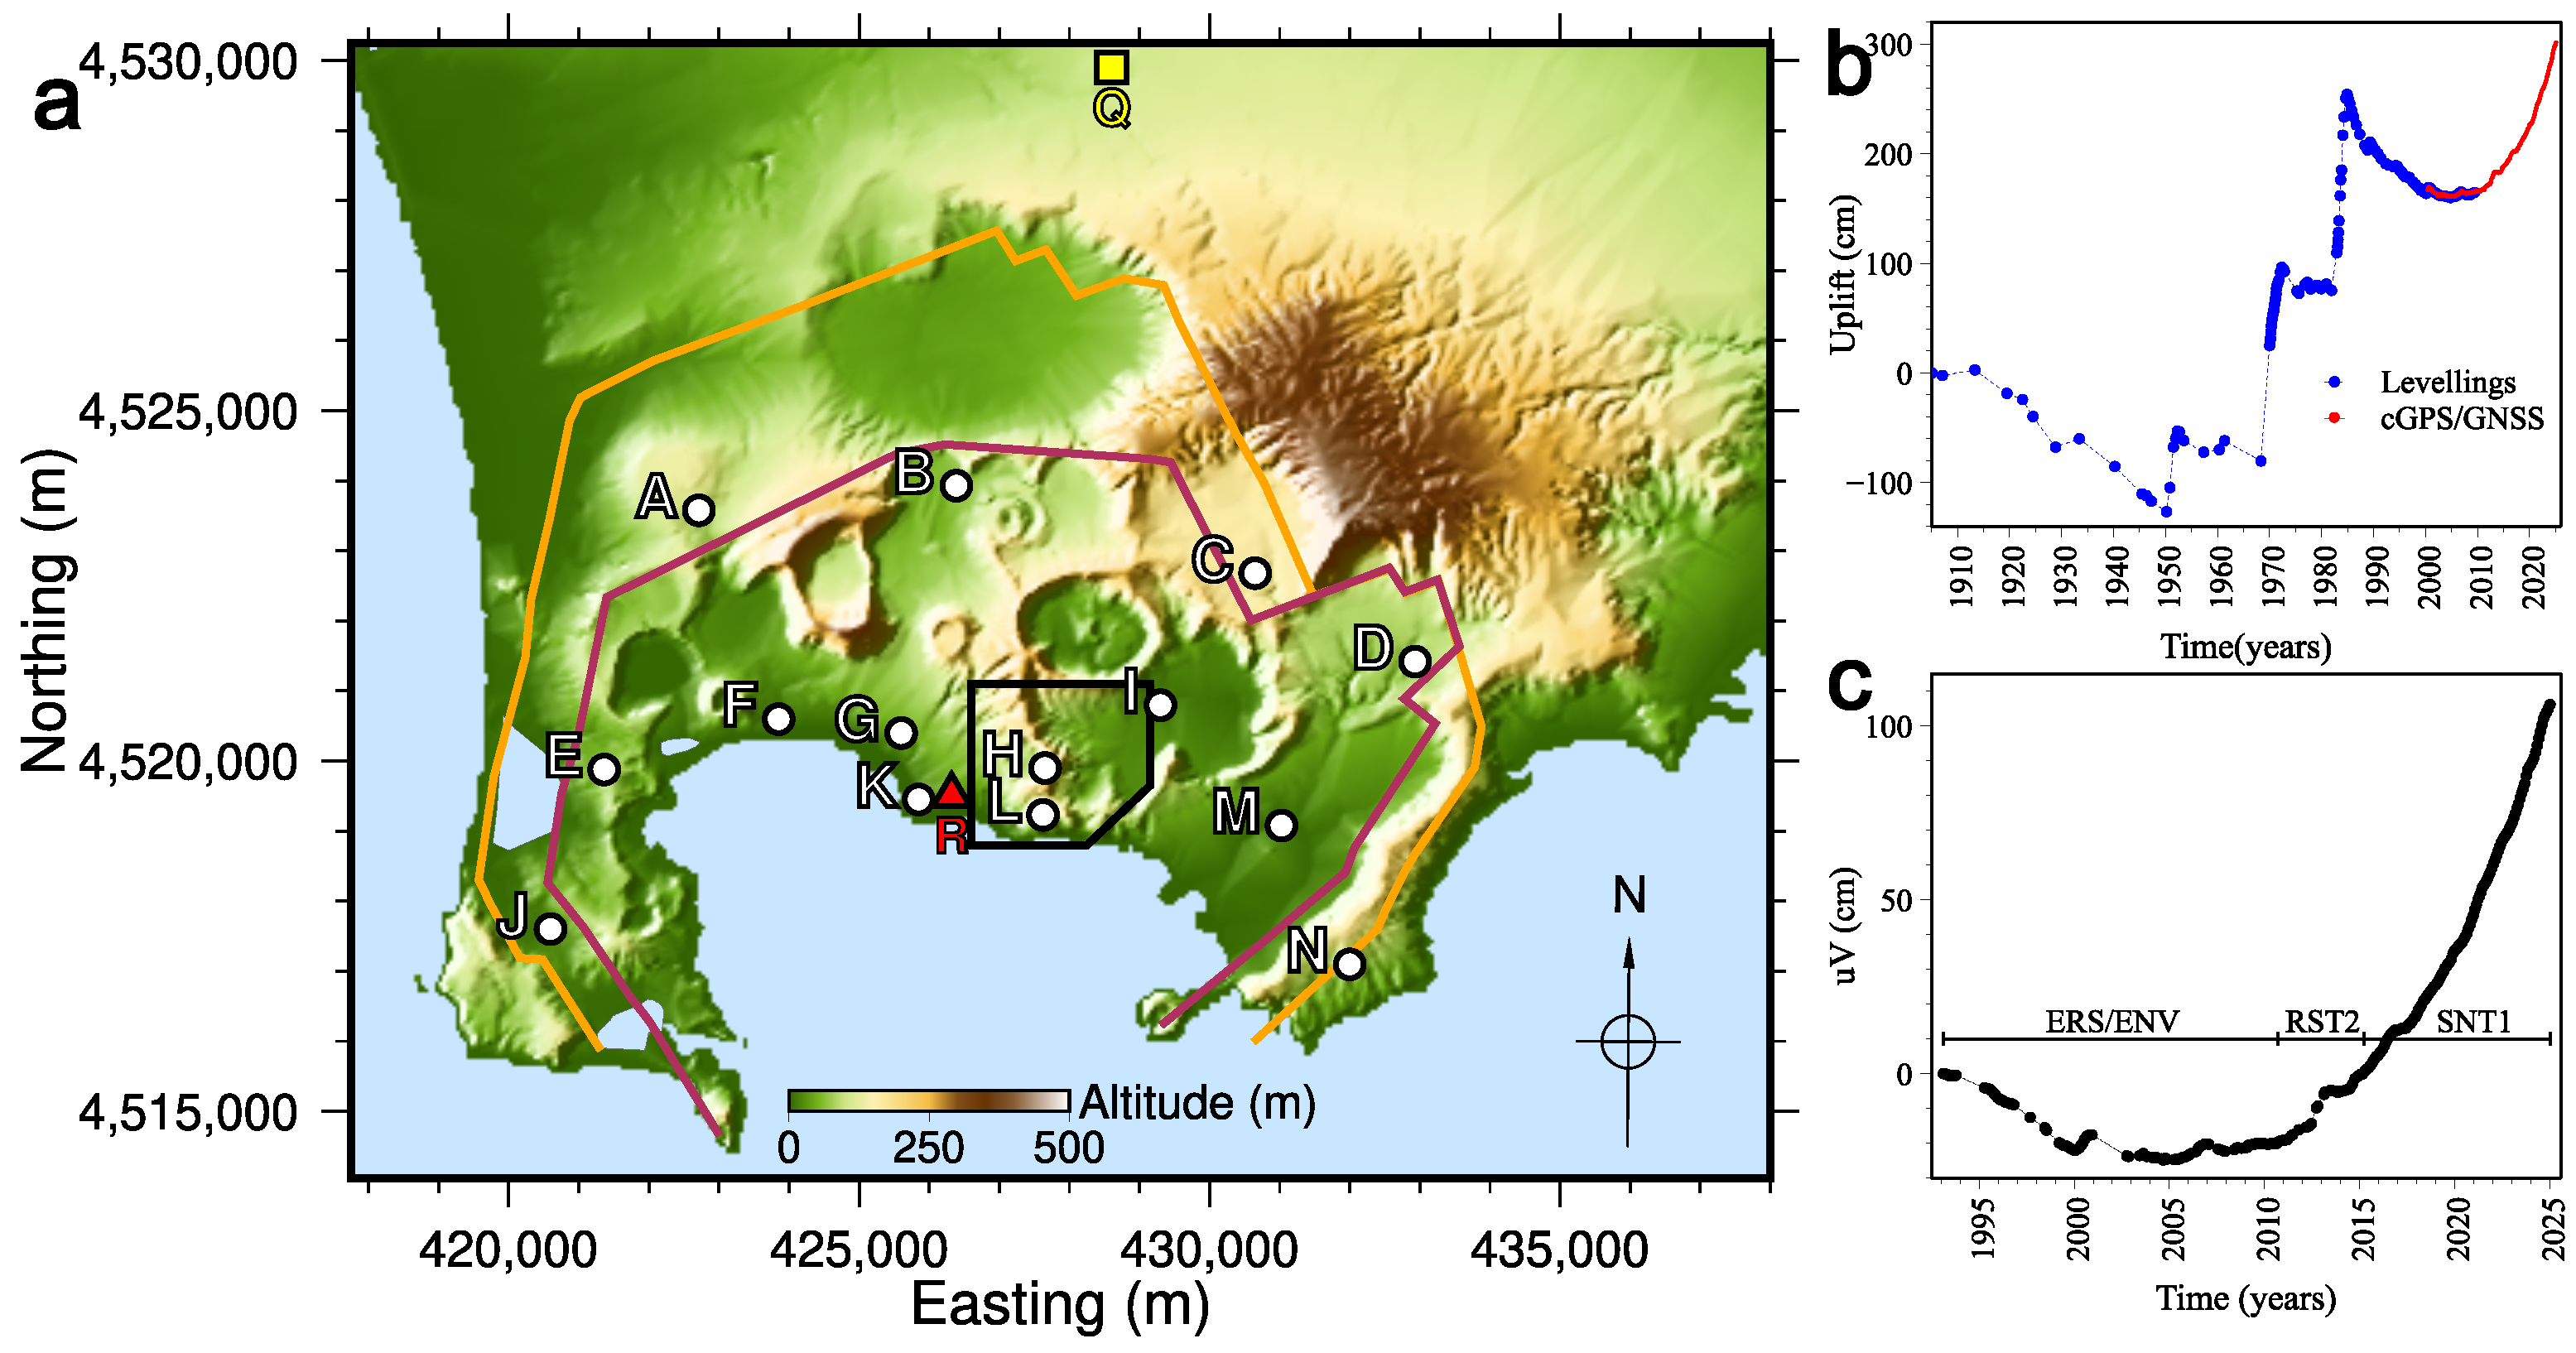
The Campi Flegrei caldera, located west of Naples (Italy), represents one of the most intensively monitored restless calderas worldwide (Figure 1a). Since the mid-twentieth century, the area has experienced recurrent unrest episodes characterised by alternating phases of uplift and subsidence, accompanied by seismicity and variations in hydrothermal activity (Figure 1b). The current unrest phase, which began in 2005, follows the major 1982–1984 crisis and has produced more than 1.5 m of cumulative uplift (Figure 1c). The Major Risk Commission raised the Alert Level from green to yellow in 2012.
Figure 1.
(a) Map of the Campi Flegrei area in UTM coordinates (WGS84, zone 33N). Colours indicate elevation [1]. White-labelled points A–N identify fourteen representative sites capturing the main features of the deformation field. The red triangle labelled R marks the location of the RITE GNSS station [2], within Rione Terra, in the area of maximum vertical displacement at Campi Flegrei. The yellow square labelled Q marks Qualiano, the reference point for all DInSAR-derived displacements. The black polygon includes Solfatara-Pisciarelli and Mt Olibano. Orange and magenta curves delineate the rims of the Campi Flegrei caldera collapses associated with the Campanian Ignimbrite (ca. 39 ka) and Neapolitan Yellow Tuff (ca. 15 ka) eruptions, respectively, [3]. (b) Ground-level changes at Rione Terra from 1905 to 2025. Blue points denote levelling data [4], whereas red points denote GNSS-derived vertical displacements [5,6]. (c) Black points denote temporal evolution of the quasi-vertical displacement at R during the study period, derived from SAR data.
Campi Flegrei provides a unique opportunity to investigate long-term deformation dynamics owing to the exceptional availability of geodetic observations. Since 1905, ground deformation has been monitored through levelling surveys [4], while modern observations include continuous Global Navigation Satellite System (GNSS) measurements [2] and multi-mission Differential Interferometric Synthetic Aperture Radar (DInSAR). These observations are complemented by extensive seismic, geochemical, petrological, and geological datasets collected primarily by the Istituto Nazionale di Geofisica e Vulcanologia–Osservatorio Vesuviano.
Previous studies have interpreted the unrest at Campi Flegrei in terms of magmatic, hydrothermal, or hybrid processes acting at different crustal depths. Geodetic inversions generally explain the large-scale deformation through inflation or deflation of sill-like sources located at depths of approximately 3–4 km beneath Rione Terra (e.g., [7,8,9,10,11,12]), while seismic and geochemical observations indicate interactions with deeper magmatic reservoirs and the hydrothermal system (e.g., [13,14,15,16]). Additional complexity arises from strong lateral heterogeneity within the caldera structure, including distinct volcano-tectonic sectors, fault systems, and permeability contrasts (e.g., [3,17,18,19]). Despite extensive investigations, substantial uncertainty remains regarding the dominant driving mechanisms of unrest and their temporal evolution (e.g., [7,8,9,20,21,22,23,24,25,26,27]).
Inversion of geodetic observations is inherently non-unique and depends strongly on assumptions regarding source geometry, rheology, and model complexity. Most previous studies have focused either on short-term transient deformation or on source inversions based on predefined source models. In contrast, comparatively little attention has been devoted to the intrinsic kinematic organisation of the deformation field itself. Yet, deformation time series observed across different sectors of the caldera exhibit strong spatial correlations, suggesting that a substantial fraction of the observed dynamics may be governed by a limited number of coherent deformation modes. This behaviour raises the possibility that, despite the physical complexity of the volcanic system, long-term deformation may admit a low-dimensional representation in which the dominant spatial patterns remain stable through time while their amplitudes evolve.
In this study, we investigate the spatio-temporal structure of ground deformation at Campi Flegrei using three decades of multi-mission DInSAR observations. Rather than modelling short-term displacement transients, we focus on identifying coherent spatial and temporal components within the deformation field. To this end, we retrieve the temporal evolution of a unified 2D displacement field and analyse it using a kinematic decomposition in which deformation is represented as the superposition of (i) a time-invariant spatial pattern modulated by a temporal amplitude and (ii) a spatially variable constant-velocity component. This formulation enables isolation of the dominant deformation mode and quantification of deviations from it.
The objectives of this work are threefold: (i) to characterise the long-term spatio-temporal organisation of ground deformation at Campi Flegrei using a unified geodetic dataset; (ii) to assess the extent to which the deformation field can be represented within a low-dimensional kinematic framework; and (iii) to evaluate whether the inferred deformation components are compatible with simplified physical source models.
2. Materials and Methods
2.1. Datasets
SAR Observations and Processing
In this study, ground-displacement time series derived from Synthetic Aperture Radar (SAR) data acquired by multiple satellite missions are employed: ERS (European Remote-Sensing Satellite, https://earth.esa.int/eogateway/missions/ers/description, accessed on 14 April 2026), ENVISAT (ENVironmental SATellite, https://www.esa.int/Applications/Observing_the_Earth/Envisat, accessed on 14 April 2026), RADARSAT-2 (https://www.asc-csa.gc.ca/eng/satellites/radarsat2/, accessed on 14 April 2026), and Sentinel-1 (https://www.esa.int/Applications/Observing_the_Earth/Copernicus/Sentinel-1, accessed on 14 April 2026). All these missions employ C-band SAR systems.
ERS-1/2 and ENVISAT enable long-term continuity of observations from 1992 to 2011, although minor frequency differences limit direct interferometric interoperability [28]. The line-of-sight (LOS) displacement time series used in this work were generated following the methodology described in [28]. These time series have been partially utilised in previous investigations of Campi Flegrei deformation [11,29,30,31,32].
RADARSAT-2, launched in 2007, is still operational. This study uses an enhanced version of the 2010–2015 LOS displacement time series developed by [33] and compared therein with GNSS measurements, based on 31 ascending and 32 descending acquisitions.
Sentinel-1A and -1B were launched in 2014 and 2016, respectively. Following an anomaly at the end of 2021, Sentinel-1B is no longer operational. The LOS displacement time series used here were published by [12] and are freely available online [34]. Plots comparing these time series with GNSS measurements are shown in [35].
As a first approximation, the accuracy of the LOS displacement time series at the one-standard-deviation level is approximately 5 mm (e.g., [12,36]). For datasets comprising tens of SAR images, the accuracy of LOS velocities is approximately 1–2 mm yr−1 (e.g., [36,37,38]).
2.2. Methods Framework
2.2.1. Multi-Mission DInSAR Data Integration
Ground-displacement time series derived from ERS/ENVISAT, RADARSAT-2, and Sentinel-1 datasets are integrated within a unified framework. Due to the inherent spatial heterogeneity of measurement points across the constituent datasets, the LOS displacement time series are resampled onto a regular 150 m × 150 m grid defined within the UTM WGS84 Zone 33N coordinate reference system. Resampling is accomplished by computing the arithmetic mean of all displacement values falling within each populated grid cell, thereby ensuring spatial consistency across the multi-sensor dataset and facilitating systematic inter-dataset comparison. All DInSAR-derived displacement measurements are referenced to the locality of Qualiano, situated approximately 11 km north of the zone of maximum vertical deformation (Figure 1a). This reference site was selected on the basis of its sustained urban character over several decades, which provides a stable and temporally consistent geodetic reference throughout the observation period.
The LOS geometries of RADARSAT-2 and Sentinel-1 are comparable over the Campi Flegrei region (incidence angles ∼35°), whereas ERS/ENVISAT data exhibit significantly lower incidence angles (∼22.5°). Consequently, a 2D displacement field—comprising a quasi-eastward horizontal component () and a quasi-vertical component ()—is computed in the LOS plane for each dataset following [39]. Due to the differing incidence angles, the accuracy of is approximately 1.5 times lower than that of for RADARSAT-2 and Sentinel-1, and 2.5 times lower for ERS/ENVISAT.
In principle, time series acquired along ascending and descending orbital passes should share identical acquisition dates to enable the computation of 2D displacement fields. In practice, exact temporal coincidence is never achieved. However, ground deformation at Campi Flegrei is characterized by relatively slow temporal evolution, which mitigates the impact of short temporal offsets between acquisitions. For the ERS and ENVISAT missions, the satellite revisit interval is 35 days, with ascending-pass acquisitions occurring six days after the corresponding descending-pass acquisitions. Moreover, the ascending and descending time series exhibit non-coincident data gaps. To ensure temporal consistency, only displacement measurements derived from paired ascending and descending images are retained. Specifically, 98 acquisition pairs from February 1993 to September 2010 are considered, each separated by a six-day interval. For RADARSAT-2, a total of 31 ascending–descending pairs acquired between September 2010 and April 2015 are used. Within each pair, the ascending-pass acquisition precedes the descending-pass acquisition by approximately 12 h. For Sentinel-1, 437 ascending–descending pairs acquired between March 2015 and January 2025 are analysed. The descending-pass acquisition precedes the ascending-pass acquisition by approximately 12 h.
The azimuthal orientation of varies slightly across the study area and between datasets: for ERS/ENVISAT it ranges from 89.8° (easternmost boundary) to 90.3° (westernmost boundary), for RADARSAT-2 from 90.3° to 90.7°, and for Sentinel-1 from 89.7° to 90.0°. The inclination of relative to the vertical is approximately 5° for ERS/ENVISAT, 7.4° for RADARSAT-2, and 7.2° for Sentinel-1. To a satisfactory approximation, can be considered consistently oriented eastwards, while is inclined by approximately 6° from the vertical, with a minor southward horizontal component. This approximation enables the coherent integration of the 2D displacement fields across the different datasets.
We use GNSS measurements [5] as an independent benchmark to validate the 2D DInSAR-derived displacements and to assess the stability of the DInSAR reference point. The GNSS data presented in [5] are expressed in a local reference frame defined using six stations from the RING (Rete Integrata Nazionale GNSS) network [40]. This reference frame was constructed by removing the mean horizontal velocity of the selected stations—17.1 mm yr−1 northward and 21.5 mm yr−1 eastward—from the GNSS time series. No correction was applied to the vertical velocities, as those of the reference RING stations are very small, on the order of 1 mm yr−1 [2].
Supplementary Information Figures S1 and S2 demonstrate a close correspondence between the DInSAR and GNSS displacement time series. Agreement between the two datasets is further improved when a constant velocity of approximately 1.6 mm yr−1 is added to the quasi-vertical DInSAR component (green dots in Supplementary Information Figure S1). The necessity of such a correction suggests that the DInSAR reference site (Qualiano) may be considered effectively stable; however, it appears to exhibit a small positive residual velocity in with respect to the local GNSS reference frame. Notwithstanding this discrepancy, the DInSAR observations indicate that the region surrounding the Campi Flegrei caldera—conventionally assumed to be unaffected by caldera-related deformation—remains essentially stationary when Qualiano is adopted as the reference point. Conversely, applying the velocity offset derived from the GNSS comparison would imply a spatially extensive and nearly uniform surface uplift of approximately 1–2 mm yr−1 across the surrounding region. Such a deformation pattern is inconsistent with the expected surface displacement field associated with Campi Flegrei volcanic unrest and is more likely attributable to a secondary contribution from large-scale regional crustal deformation. On this basis, no velocity correction was applied to the quasi-vertical DInSAR displacement time series. The offset of to the GNSS eastward velocities is negligible (∼ mm yr−1). Quantitative statistical metrics evaluating the agreement between the DInSAR-derived quasi-vertical (green dots in Supplementary Information Figure S1) and eastward (blue dots in Supplementary Information Figure S2) displacement components and their corresponding GNSS-derived projections are presented in Supplementary Information Tables S1 and S2, respectively.
2.2.2. Estimation of Constant-Velocity Fields and Time-Invariant Deformation Patterns
Preliminary inspection of the quasi-vertical displacement time series at several selected sites distributed across Campi Flegrei, together with scatter plots of the corresponding quasi-vertical displacements versus measured at site R (Figure 1a,c), indicates that the eastern sector of Campi Flegrei undergoes moderate uplift even during subsidence phases recorded at the reference site. Furthermore, introducing a pixel-dependent constant-velocity term collapses the subsidence and uplift branches of the scatter plots onto a single linear relationship between quasi-vertical displacement and measured at site R (see Section 3.1 for details). These observations suggest that much of the apparent temporal complexity of the raw time series can be reconciled within a unified kinematic framework.
Motivated by these considerations, we investigate whether the observed deformation field can be decomposed into two contributions: (i) a spatially variable constant-velocity component and (ii) a time-invariant spatial pattern modulated by a temporal amplitude. Residual contributions include atmospheric artefacts and any processes not captured by the model.
This assumption implies that the quasi-vertical component of ground displacement, denoted at pixel j and epoch , can be expressed as
where represents a constant-velocity field, a reference epoch, is a time-invariant spatial deformation pattern, and is its temporal amplitude. The residual term accounts for measurement noise and unmodelled variability.
Rearranging Equation (2) yields
Substituting into Equation (1) gives
where includes propagated residual terms.
Defining
the optimal least-squares estimates of and are obtained by minimising
where is a pixel-dependent intercept and N the number of epochs.
Reliable separation of the spatial pattern from the linear trend requires that and be mutually uncorrelated. Over the full 1993–2024 time interval, the squared sample correlation coefficient between these two quantities reaches values as high as 0.6, possibly yielding ill-conditioned parameter estimates. To mitigate this high correlation, the analysis is restricted to the 1995–2013 subinterval, during which the displacement time series at the reference site R exhibits an approximately symmetric alternation of subsidence and uplift episodes (Figure 1b,c). Within this subinterval, the squared correlation coefficient is reduced to 0.03, thereby ensuring the numerical stability of the inversion. The optimization procedure is therefore carried out over this time window, and the resulting velocity field is subsequently extrapolated to the full 1993–2024 time span.
The minimisation uniquely determines the normalised spatial pattern . However, the velocity field remains non-unique, being resolvable only up to an additive component proportional to the spatial pattern.
An analogous parametric formulation is adopted for the eastward displacement component :
where denotes the spatially varying constant-velocity field, is a time-invariant spatial pattern characterizing the eastward deformation, and represents the residual term accounting for unmodeled signals and measurement noise. The temporal amplitude is assumed to be identical to that appearing in the corresponding expression for the quasi-vertical component, thereby imposing a shared temporal evolution on both displacement components. This implies a common driving process whose spatial manifestation differs between components but evolves coherently in time.
3. Results
3.1. Spatio-Temporal Behaviour of 2D Displacement Fields
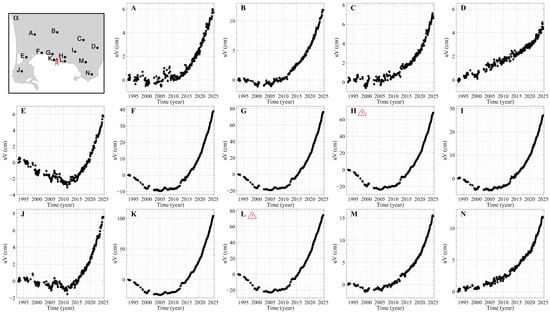
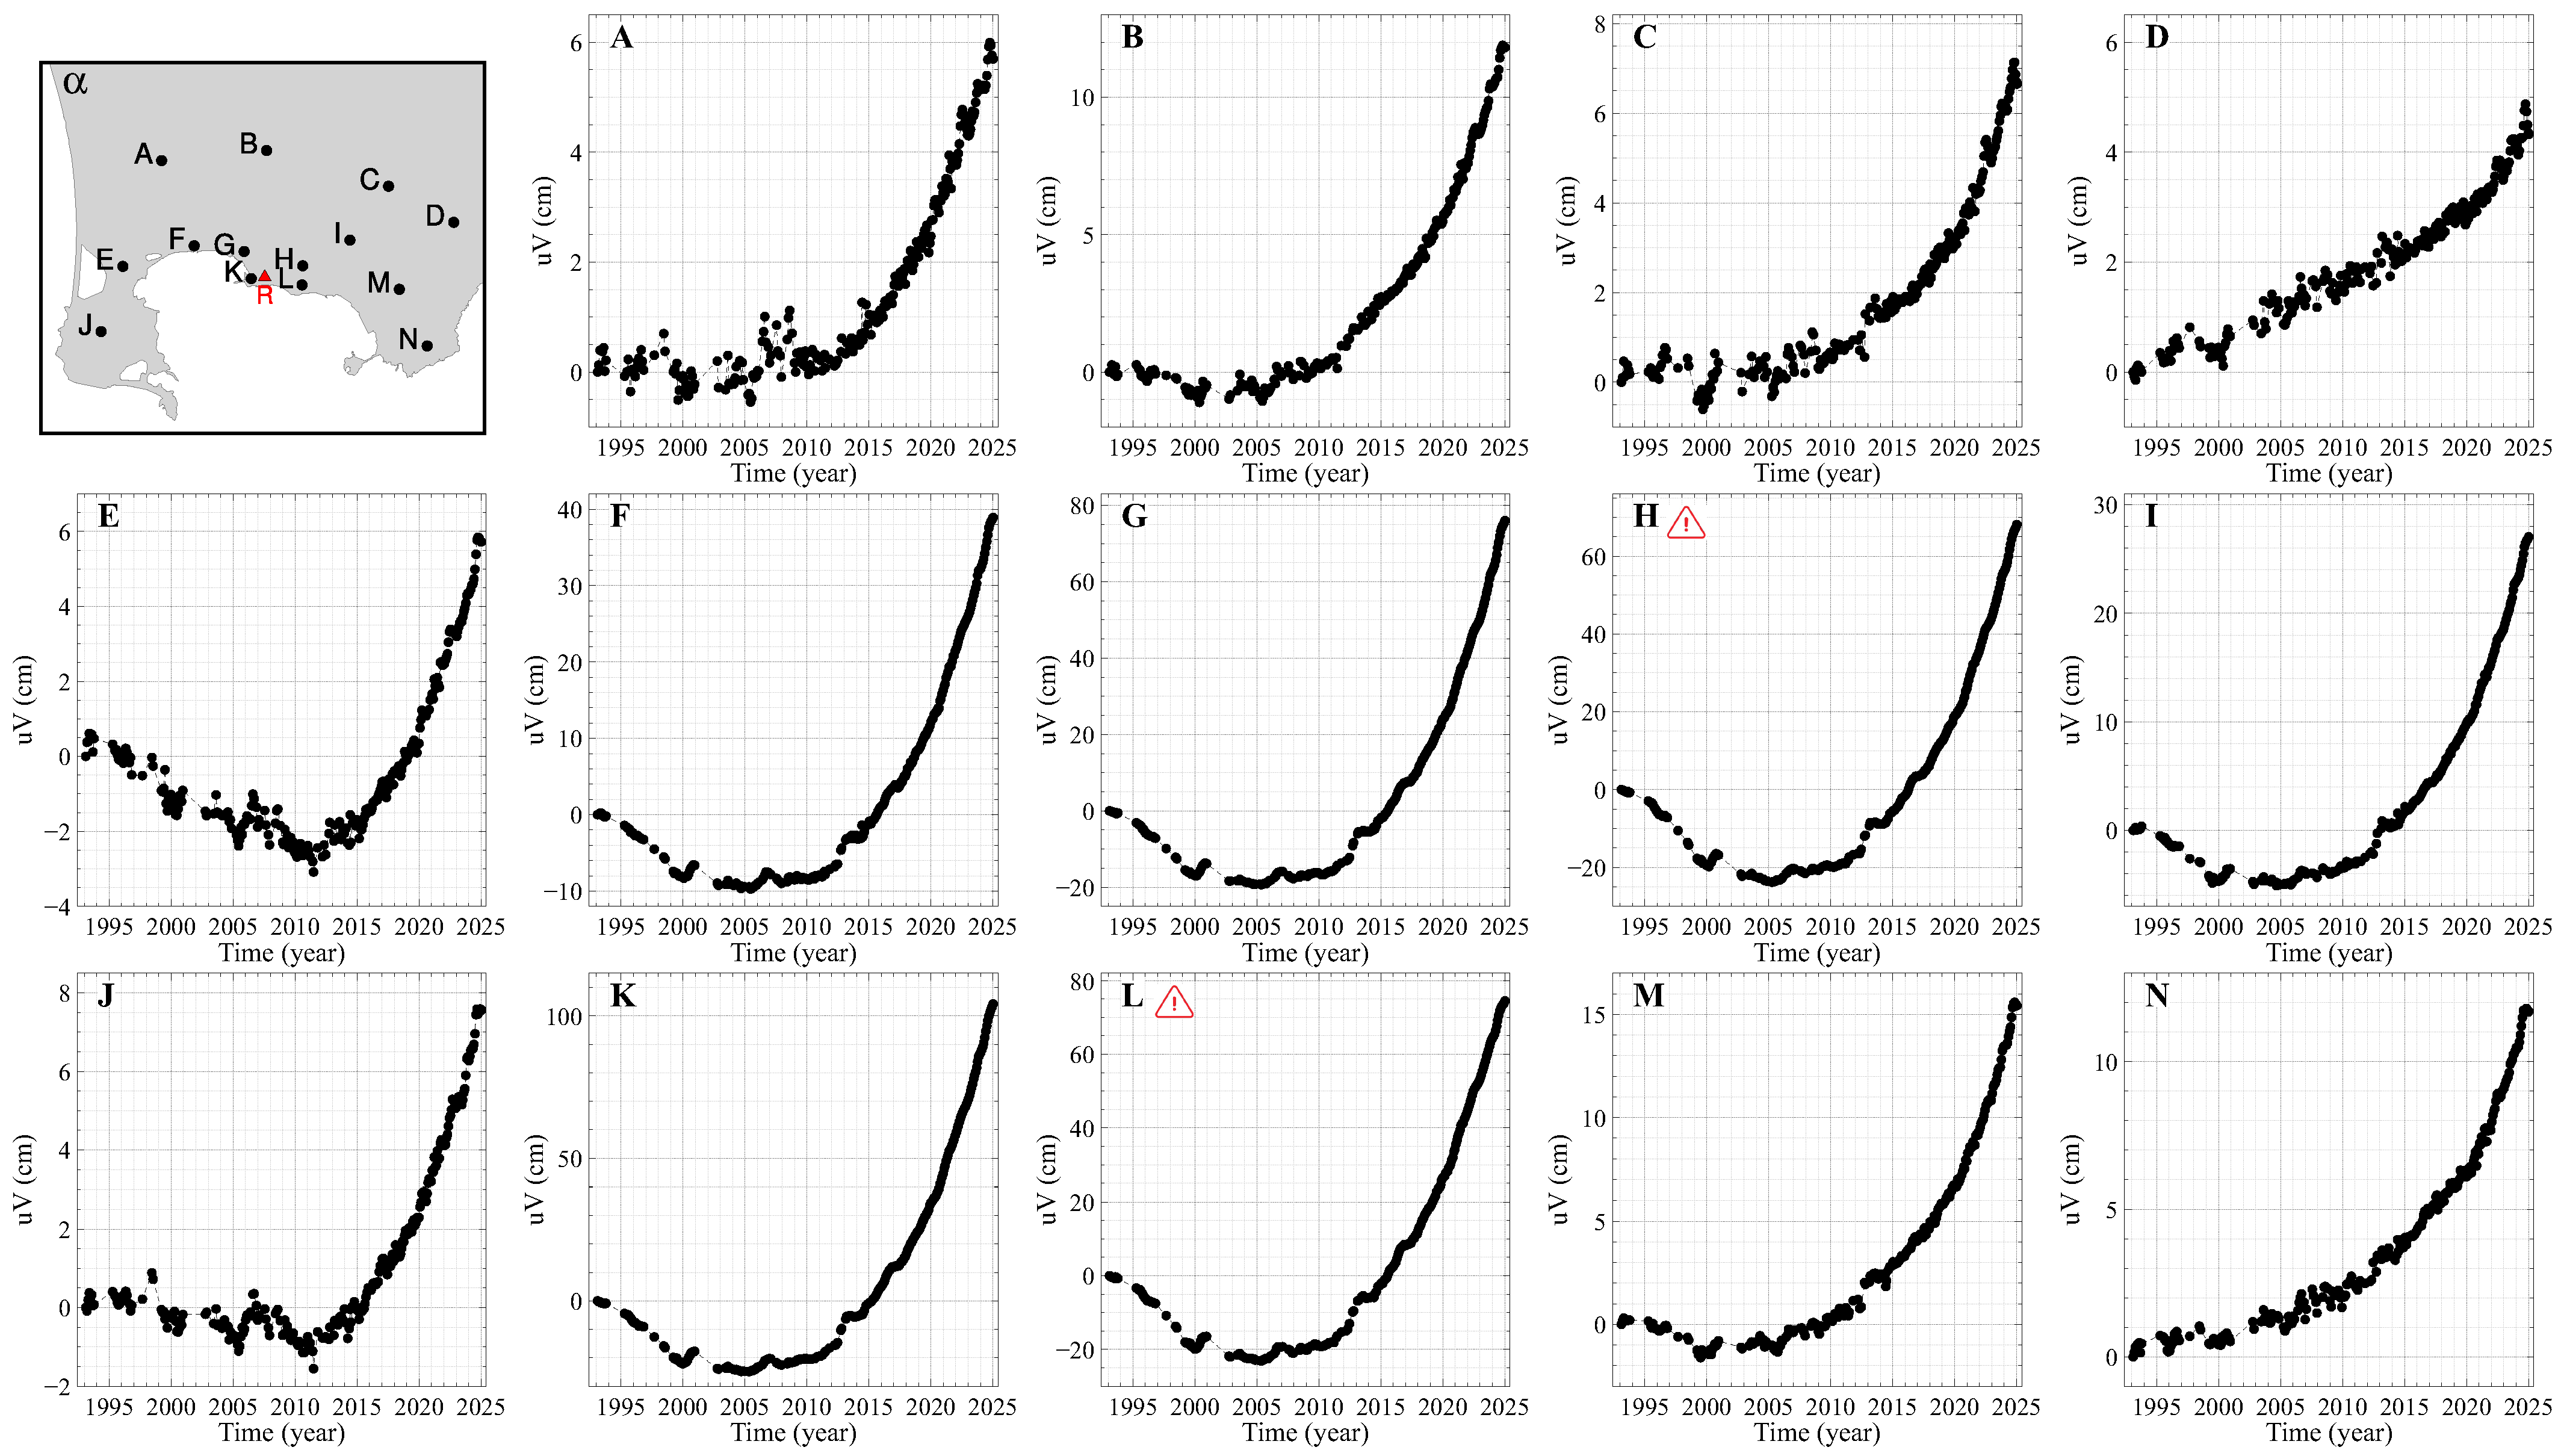
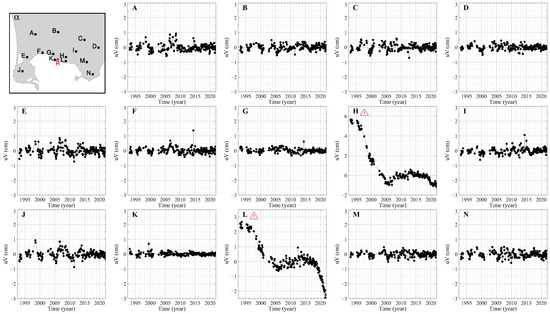
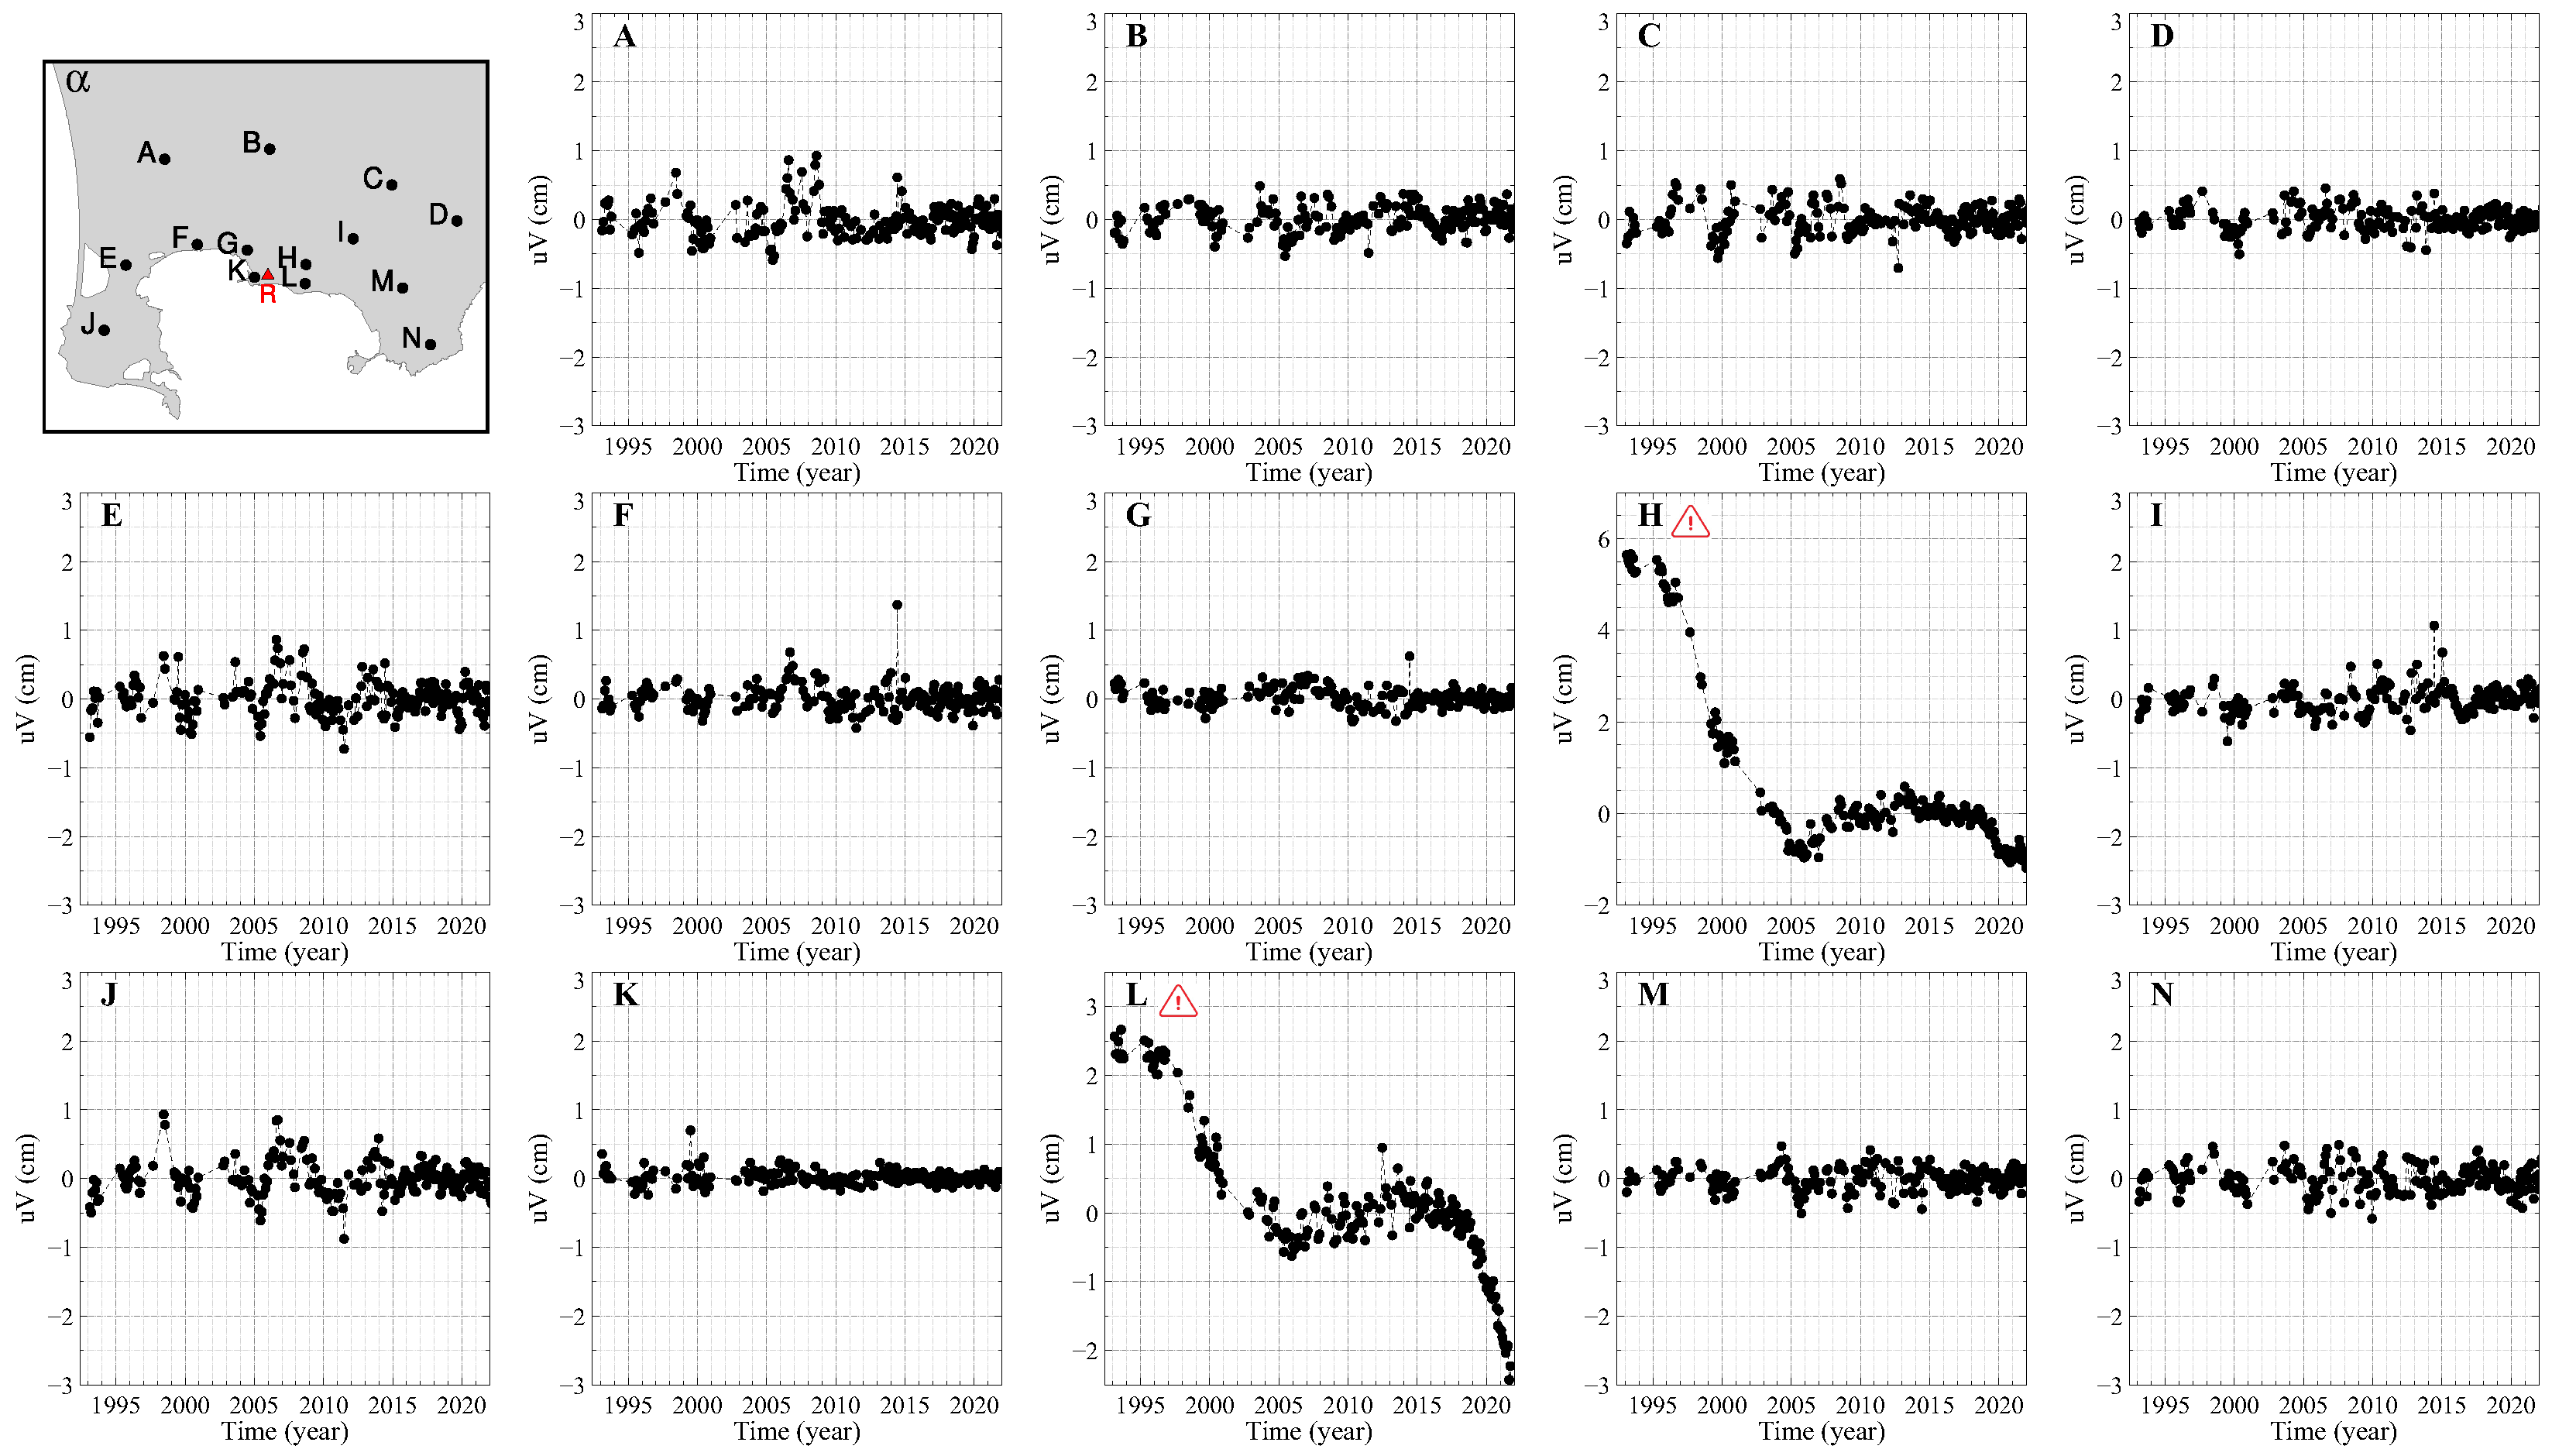
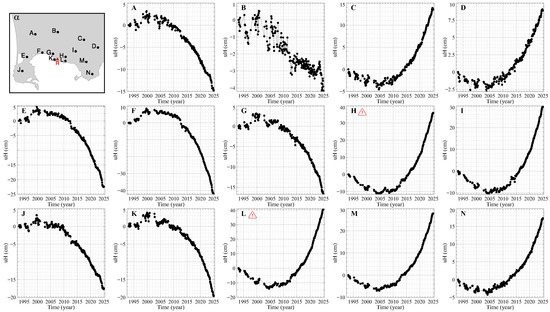
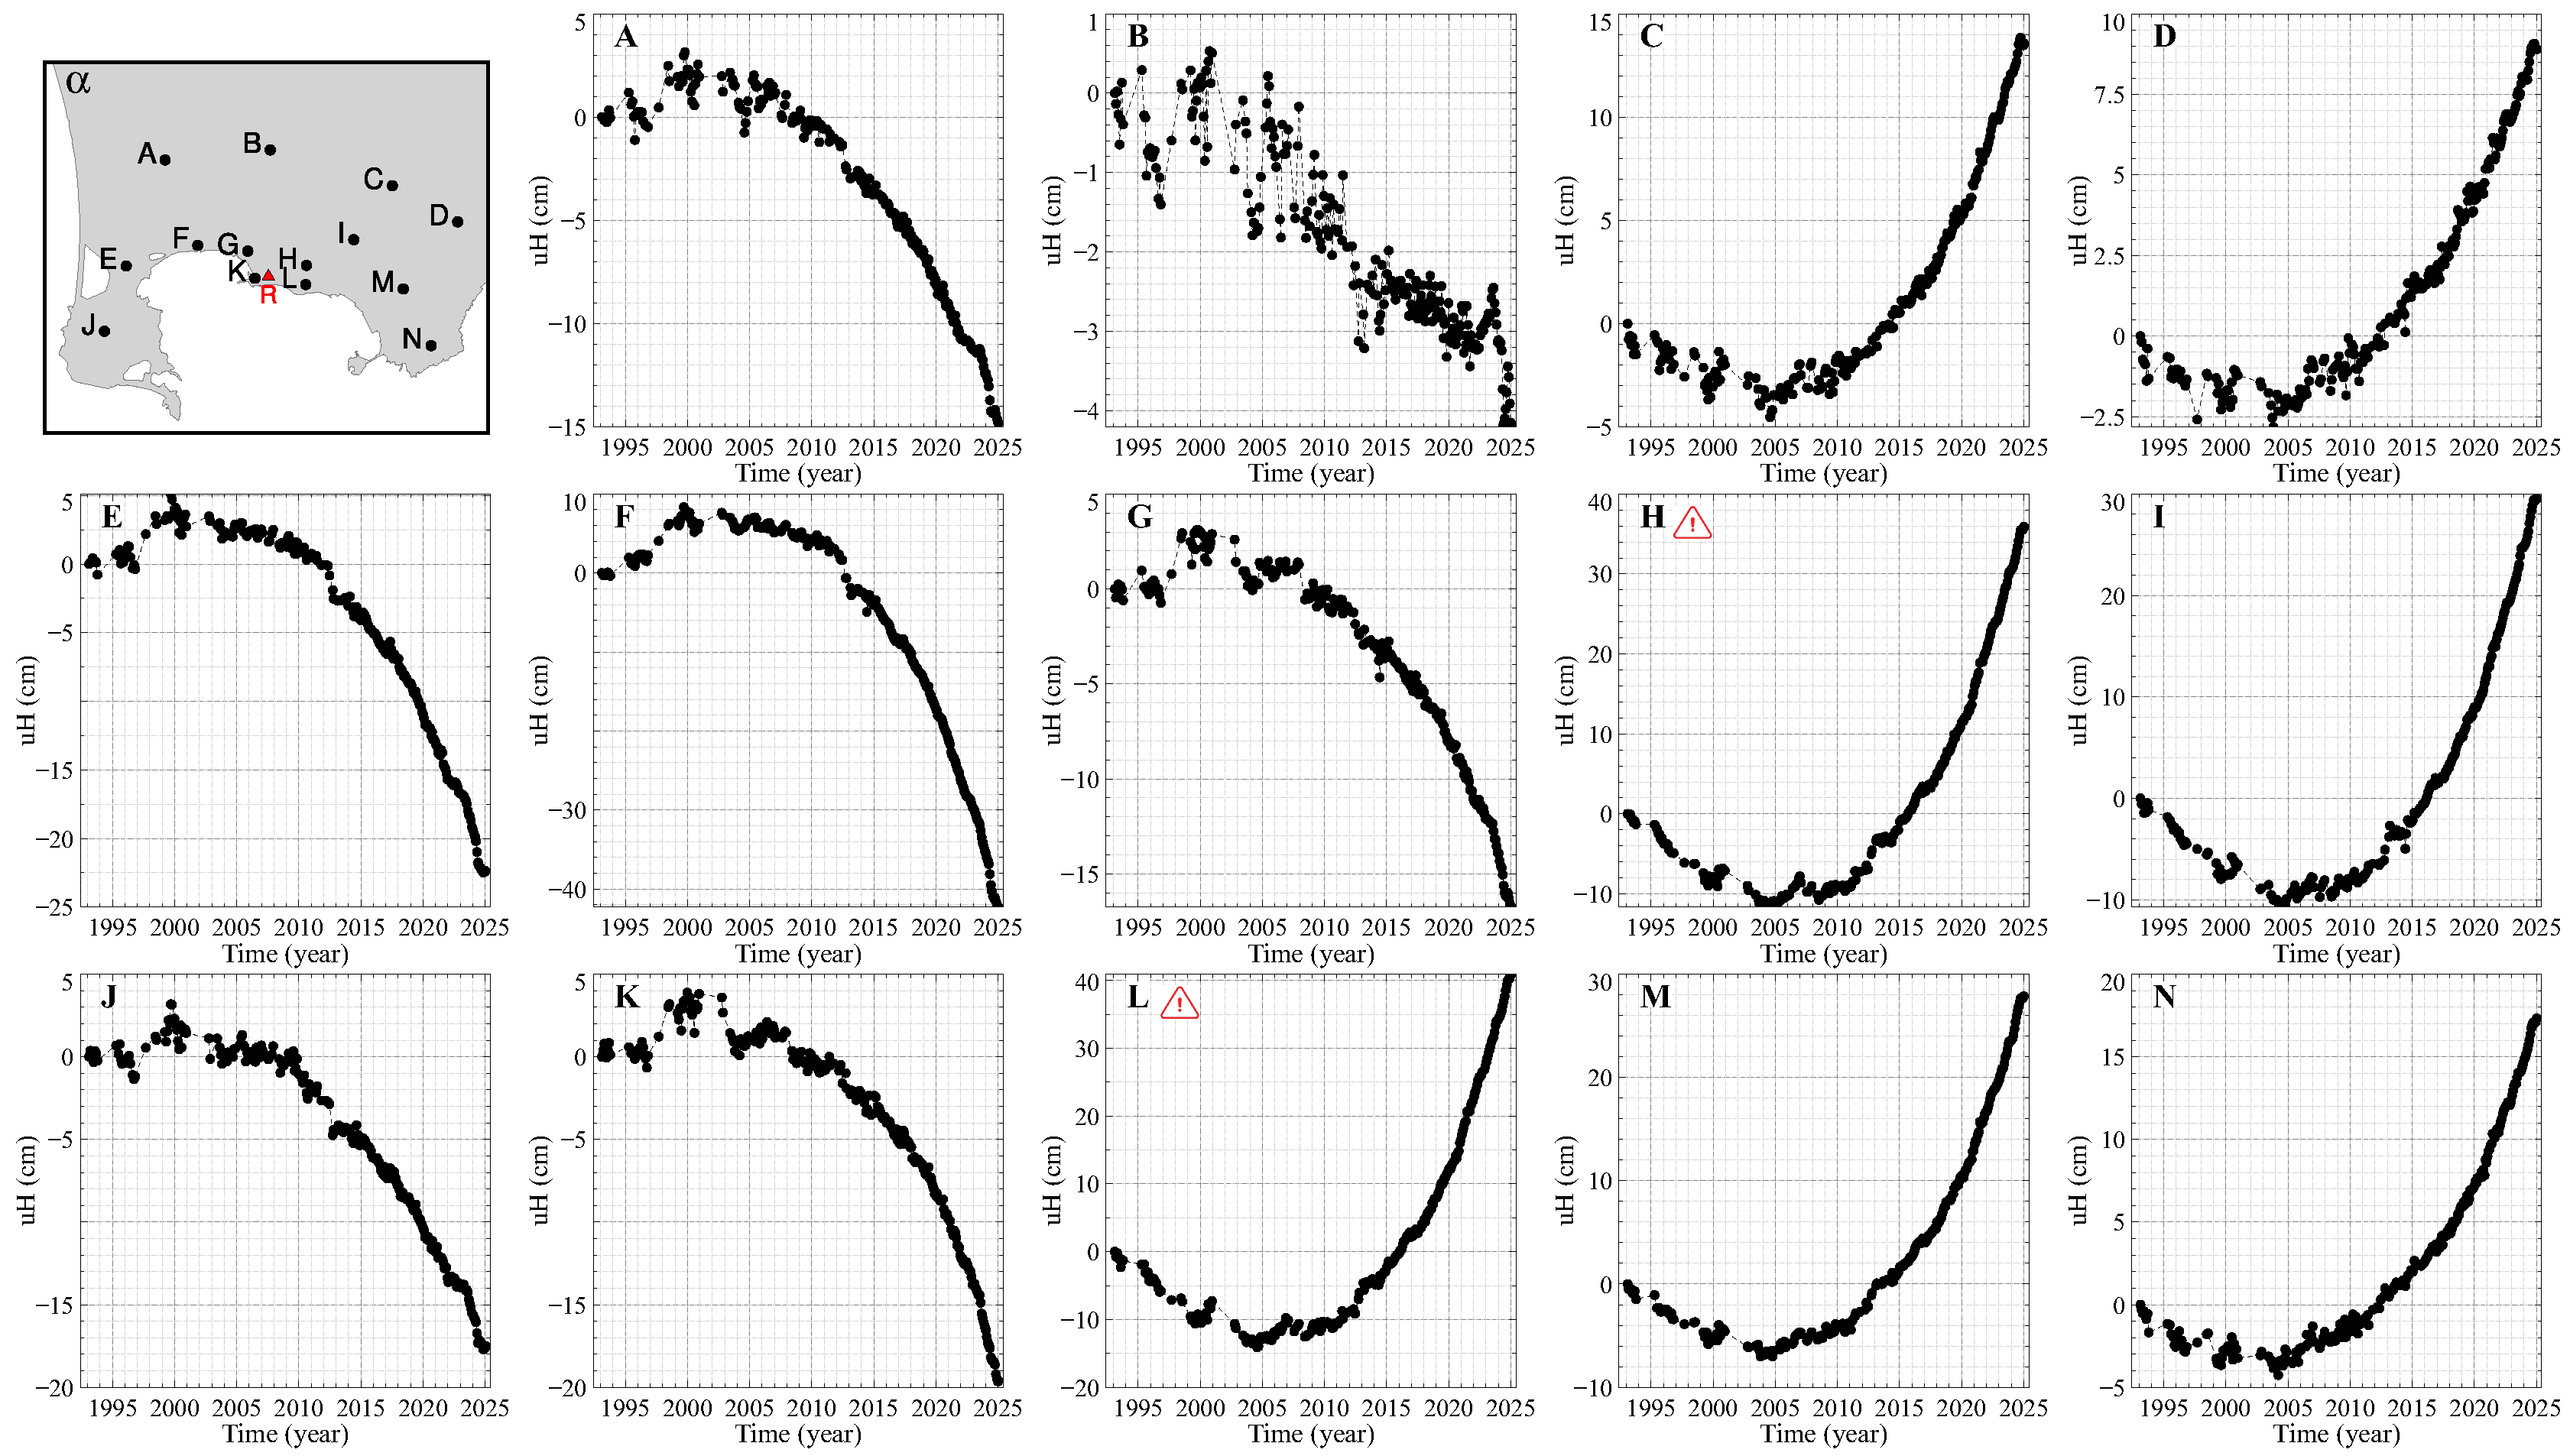
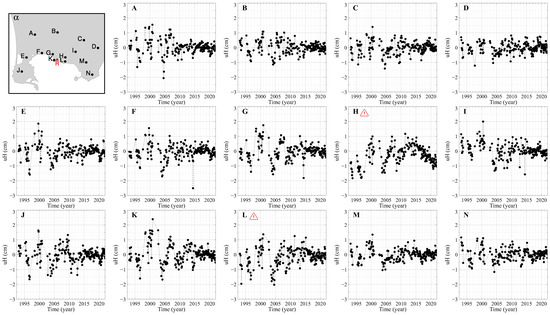
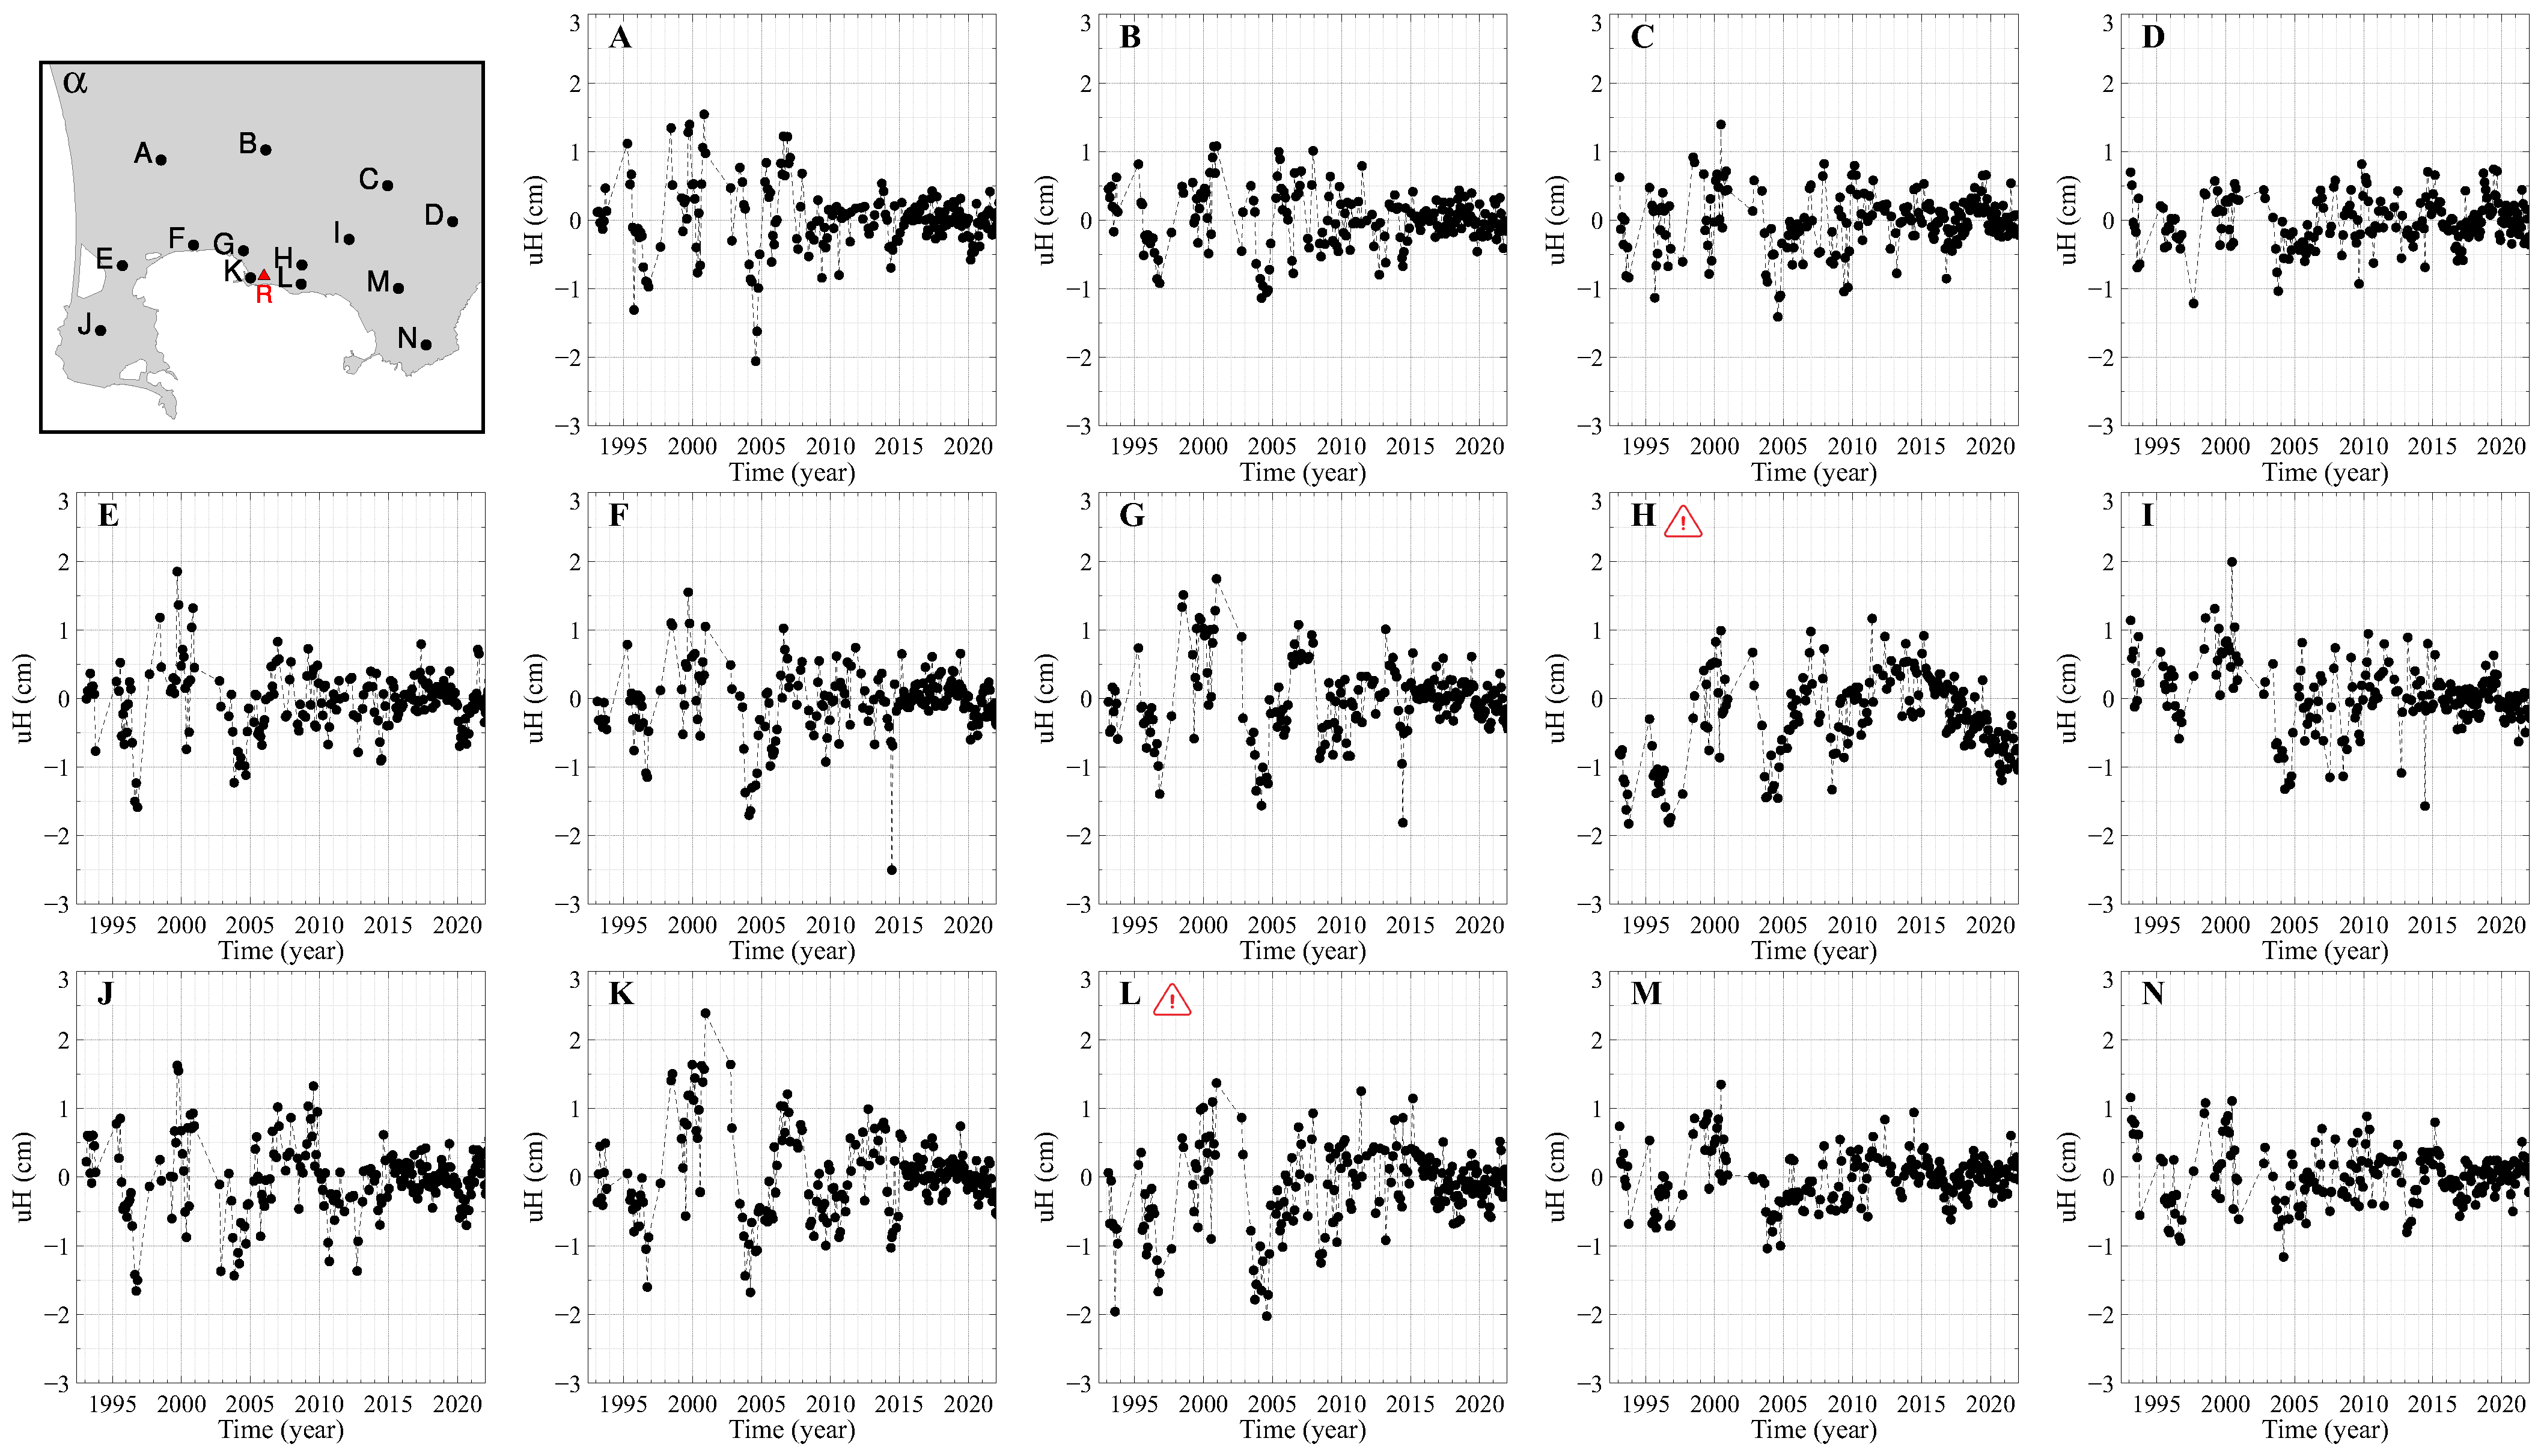
The methodological framework described above is first applied to characterise the spatio-temporal behaviour of the displacement field, before proceeding to its formal decomposition. Figure 2 shows averaged quasi-vertical () DInSAR displacements computed within circular areas of 200 m radius centred on fourteen representative sites (white dots in Figure 1a and black dots in Figure 2) capturing the main features of the deformation field at Campi Flegrei.
Figure 2.
Quasi-vertical displacements () at fourteen representative sites. () Location of the selected sites and the reference site R (see also Figure 1a). (A–N) Time series of ; each panel corresponds to the equivalently labelled black dot shown in panel (). Panels (H,L) are marked with a red alert symbol, as they correspond to the Solfatara-Pisciarelli and Mt Olibano areas, respectively, where localised deformation anomalies have been previously documented.
The following features emerge:
- In the central sector, the DInSAR time series closely follow the history at site R (Figure 1c);
- In the south-western sector, a marked change in behaviour becomes apparent around 2012–2013;
- In the south-eastern sector, positive velocities are observed during 1993–2000 despite subsidence at site R.
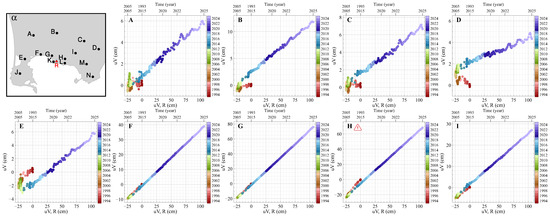
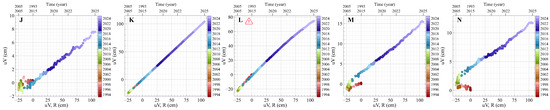
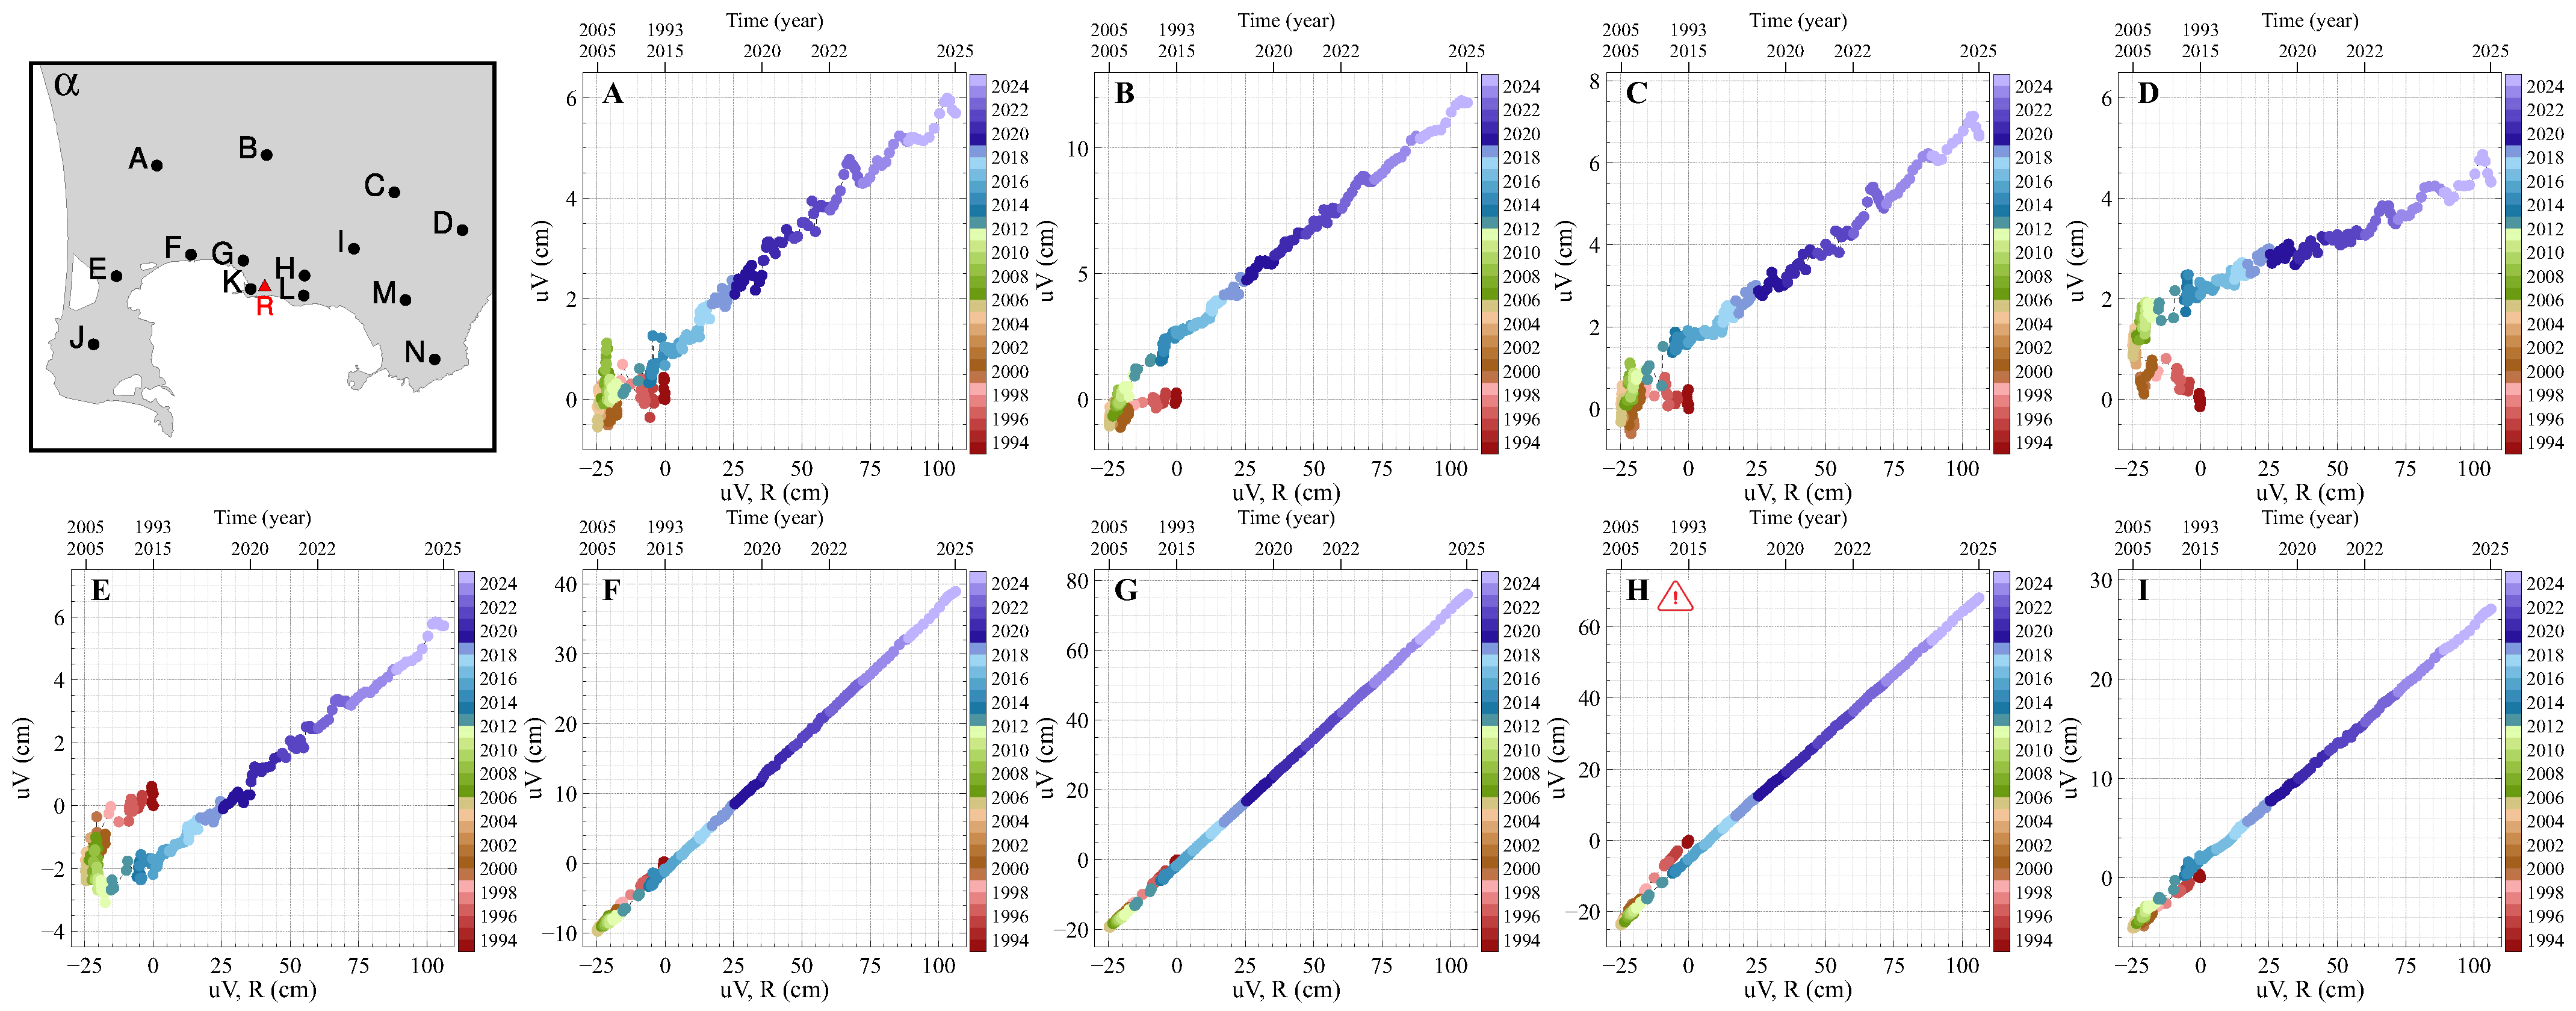
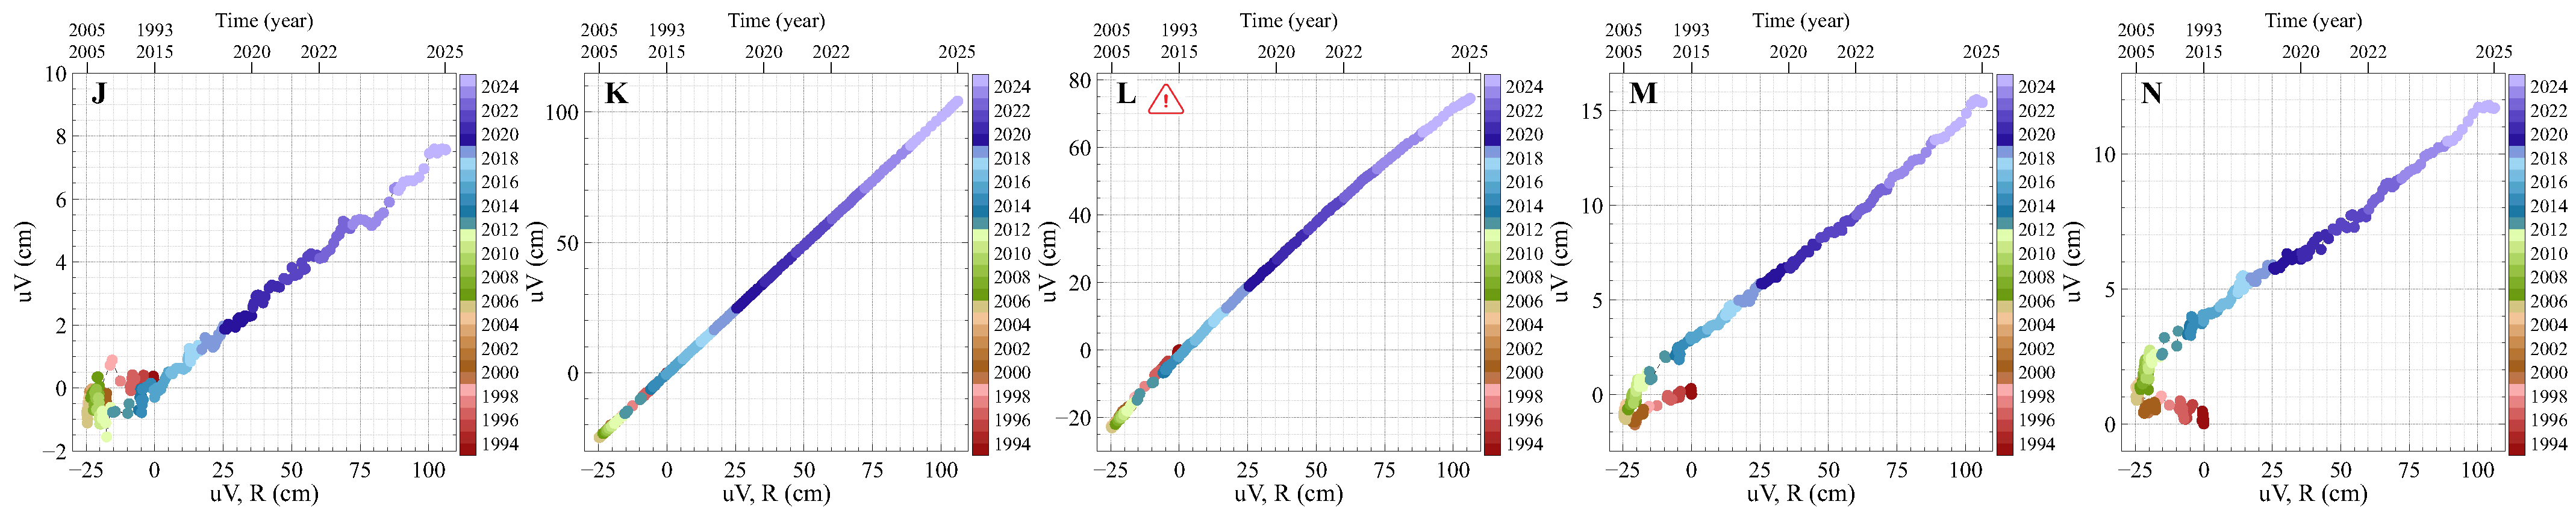
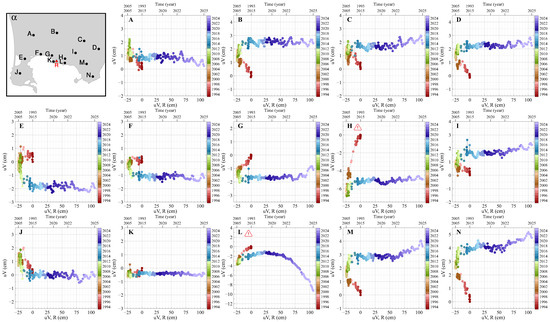
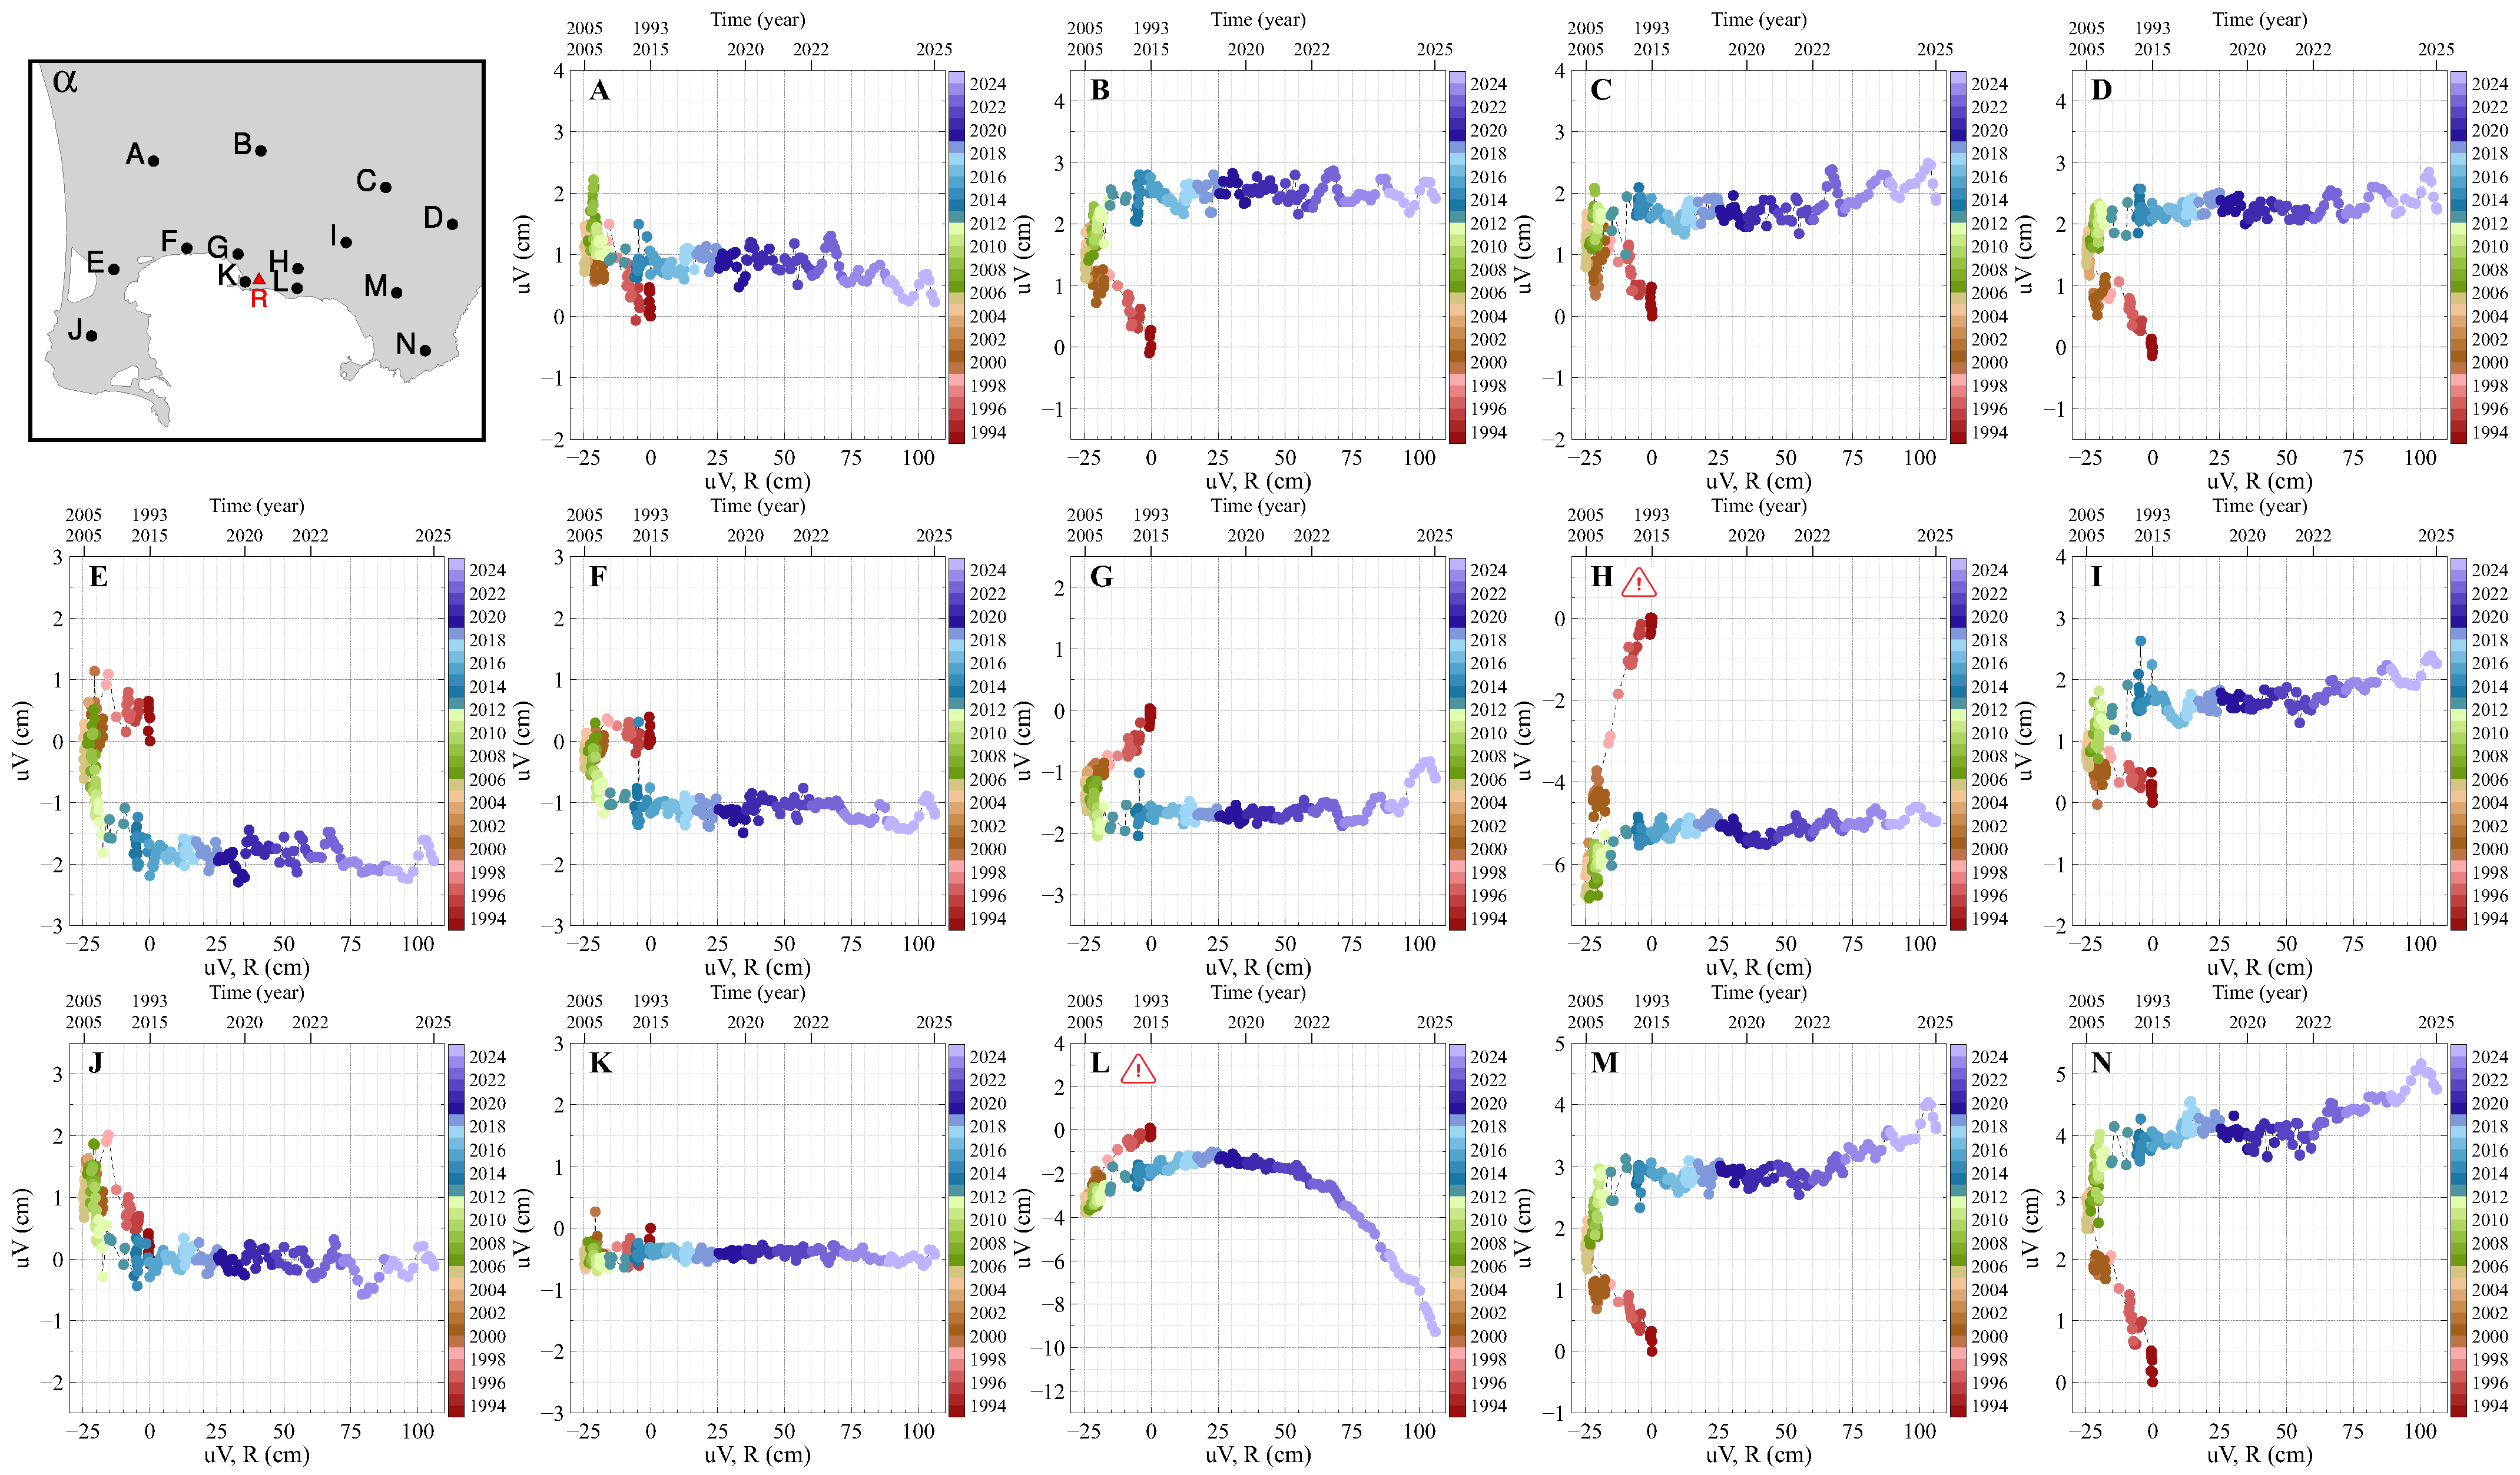
Scatter plots (Figure 3) show a strong linear relationship with at site R everywhere over 2014–2021. After 2021, linearity persists, albeit with an increased slope in the eastern sector. In the central area, linearity extends over the entire 1993–2024 period, whereas outside this area, subsidence and uplift phases follow different trends.
Figure 3.
Scatter plots of quasi-vertical displacement at fourteen representative sites versus measured at site R. () Location of the selected sites and the reference site R (see also Figure 1a). (A–N) Scatter plots of for each site against at site R; each panel corresponds to the equivalently labelled black dot shown in panel (). Panels (H,L) are marked with a red alert symbol, as they correspond to the Solfatara-Pisciarelli and Mt Olibano areas, respectively, where localised deformation anomalies have been previously documented.
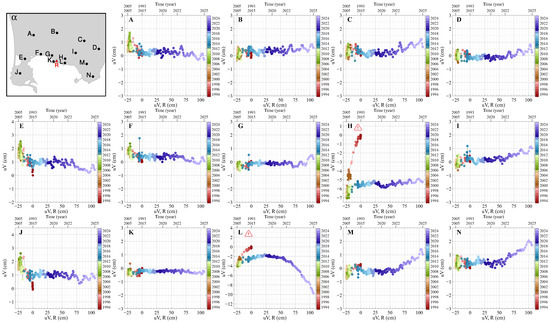
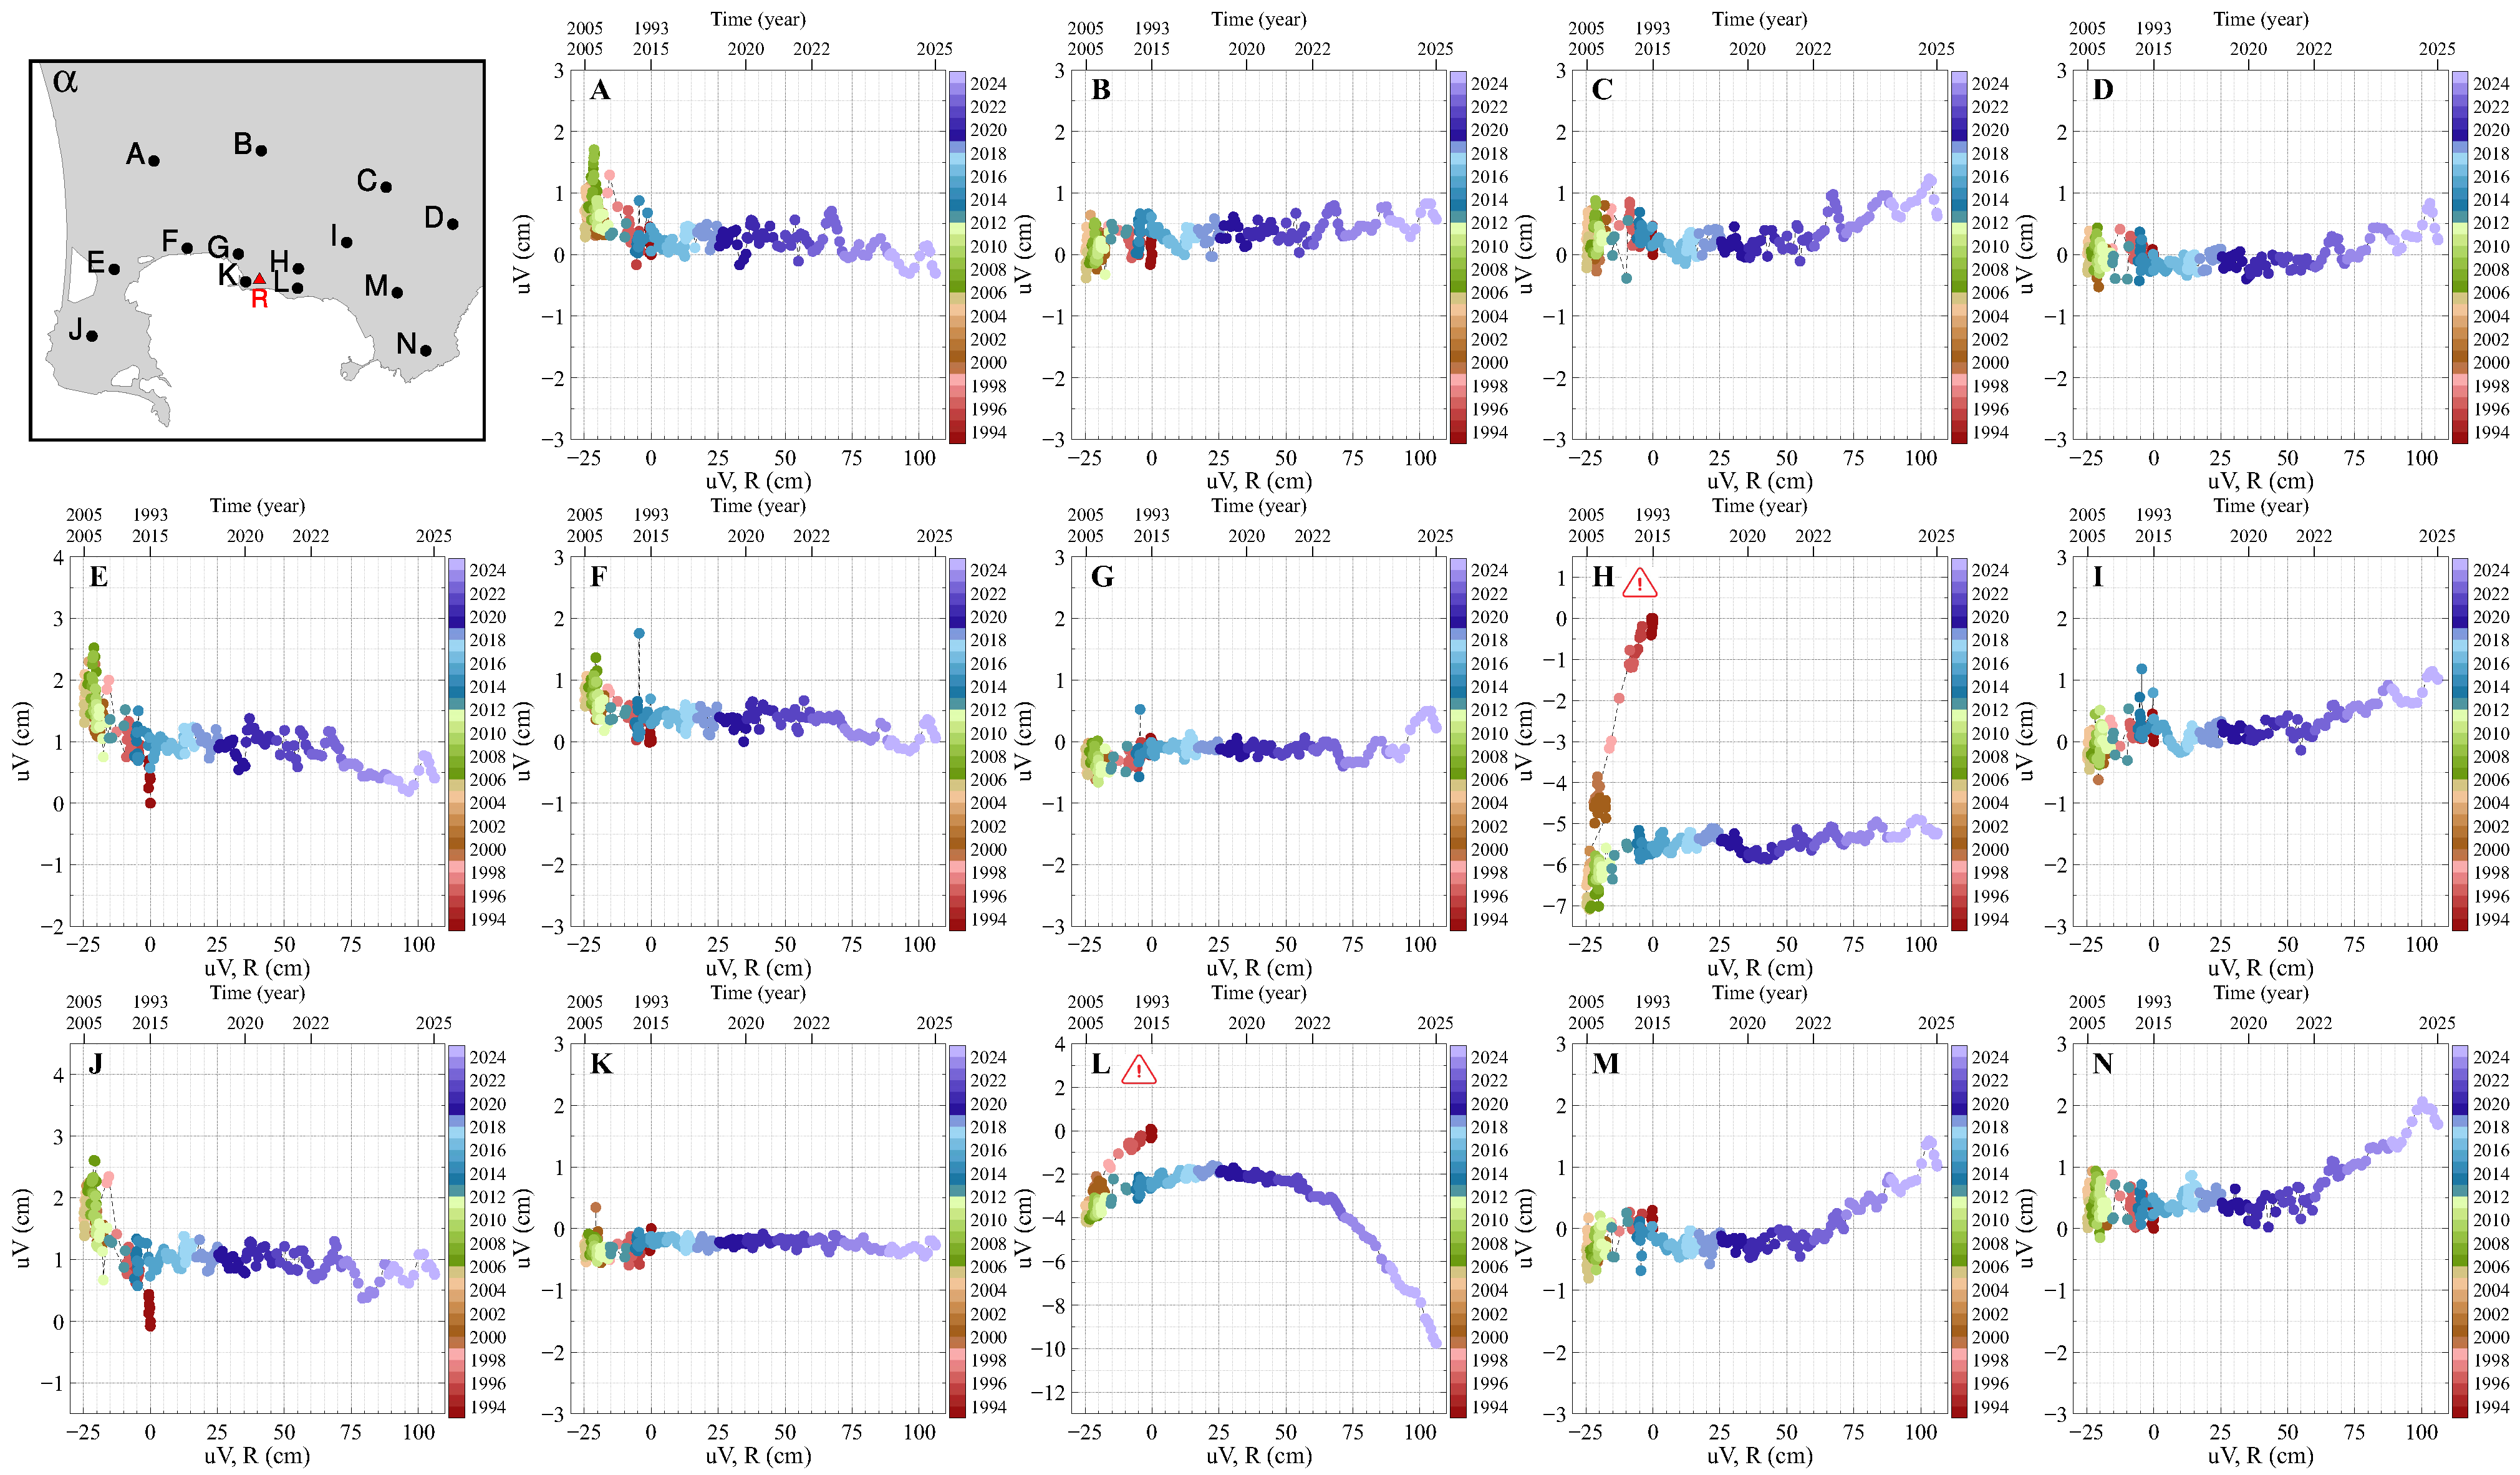
These features become more evident after removal, from time series, of the linear trend against at site R, fitted over the 2014–2021 interval, as shown by the scatter plots in Figure 4. The corresponding residual time series are reported in Supplementary Information Figure S3.
Figure 4.
Scatter plots of residual quasi-vertical displacement at fourteen representative sites versus at site R. Residuals were obtained by subtracting the regression lines fitted to the original displacement data over the 2014–2021 interval. () Location of the selected sites and the reference site R (see also Figure 1a). (A–N) Scatter plots of residual values; each panel corresponds to the equivalently labelled black dot shown in panel (). Panels (H,L) are marked with a red alert symbol, as they correspond to the Solfatara-Pisciarelli and Mt Olibano areas, respectively, where localised deformation anomalies have been previously documented.
The investigation into describing the temporal evolution of the strain field was conducted in two steps.
3.1.1. Step 1
Given that the eastern sector exhibits uplift even during subsidence phases recorded at site R (Figure 2), we investigated whether the contrasting trends observed in the correlation plots during subsidence and uplift episodes at R could be attributed to the presence of a spatially varying constant-velocity component (Equation (1)). To this end, the decomposition described in Section 2.2.2 was applied to the quasi-vertical displacement time series , defined for each pixel j and epoch over the 1995–2013 interval, in order to estimate the best-fitting spatial field . In the Solfatara–Pisciarelli and Mt. Olibano areas, which are known to exhibit anomalous deformation behaviour distinct from the broader caldera dynamics [11,12,31,41], the corresponding values of were not directly retrieved from the DInSAR observations. Instead, they were estimated within the region delineated by the black polygon in Figure 1a by means of bicubic spline interpolation from the values obtained at the surrounding pixels. The contribution associated with , namely , was then subtracted from the full 1993–2024 time series for each pixel. The resulting series are hereafter referred to as the step-1 time series.
Next, the linear trend relating the step-1 time series to at site R, fitted over the 2014–2021 interval, was removed, and scatter plots of the corresponding residuals versus at R were generated (Figure 5). The subsidence- and uplift-related branches now collapse onto a common trend. In the western sector, a non-zero slope remains evident until approximately 2012–2013, whereas in the eastern sector, a marked slope change emerges from around 2021–2022 onward, consistently with the behaviour previously highlighted in Figure 4.
Figure 5.
Scatter plots of residual quasi-vertical step-1 time series (see Section 3.1.1) at fourteen representative sites versus at site R. Residuals were obtained by subtracting the best-fitting linear relationships between the step-1 time series and at site R over the 2014–2021 interval. () Location of the selected sites and the reference site R (see also Figure 1a). (A–N) Scatter plots of residual values; each panel corresponds to the equivalently labelled black dot shown in panel (). Panels (H,L) are marked with a red alert symbol, as they correspond to the Solfatara-Pisciarelli and Mt Olibano areas, respectively, where localised deformation anomalies have been previously documented.
These results indicate that introducing a pixel-dependent constant-velocity term reconciles the subsidence and uplift branches into a single linear relationship, supporting the two-component decomposition expressed by Equation (1). Accordingly, a stable linear correlation is observed across most of the study area over 1993–2021, except in the western sector, where an abrupt change in slope emerges around 2012–2013. Conversely, over the 2014–2024 interval, the same linear behaviour persists across most of the area, except in the eastern sector, where a distinct change in slope becomes apparent from around 2021–2022.
3.1.2. Step 2
Given the identification of the two key dates, 2014 and 2022, we calculated the slopes of the regression lines obtained from scatter plots of the step-1 time series versus at site R separately for the periods 1993–2013 and 2014–2021. Analysis of the post-2021 period, characterized by excessive uplift in the eastern sector, is beyond the scope of this work.
Since deformation anomalies are known to have occurred within the Solfatara-Pisciarelli and Mt. Olibano area, delimited by the black curve in Figure 1a, throughout the subsidence phase of Campi Flegrei and possibly for a few years beyond, as well as since 2019, regression lines within this region were instead calculated over the 2007–2018 interval and subsequently applied to the entire 1993–2021 period.
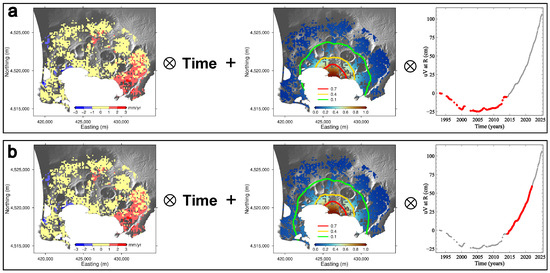
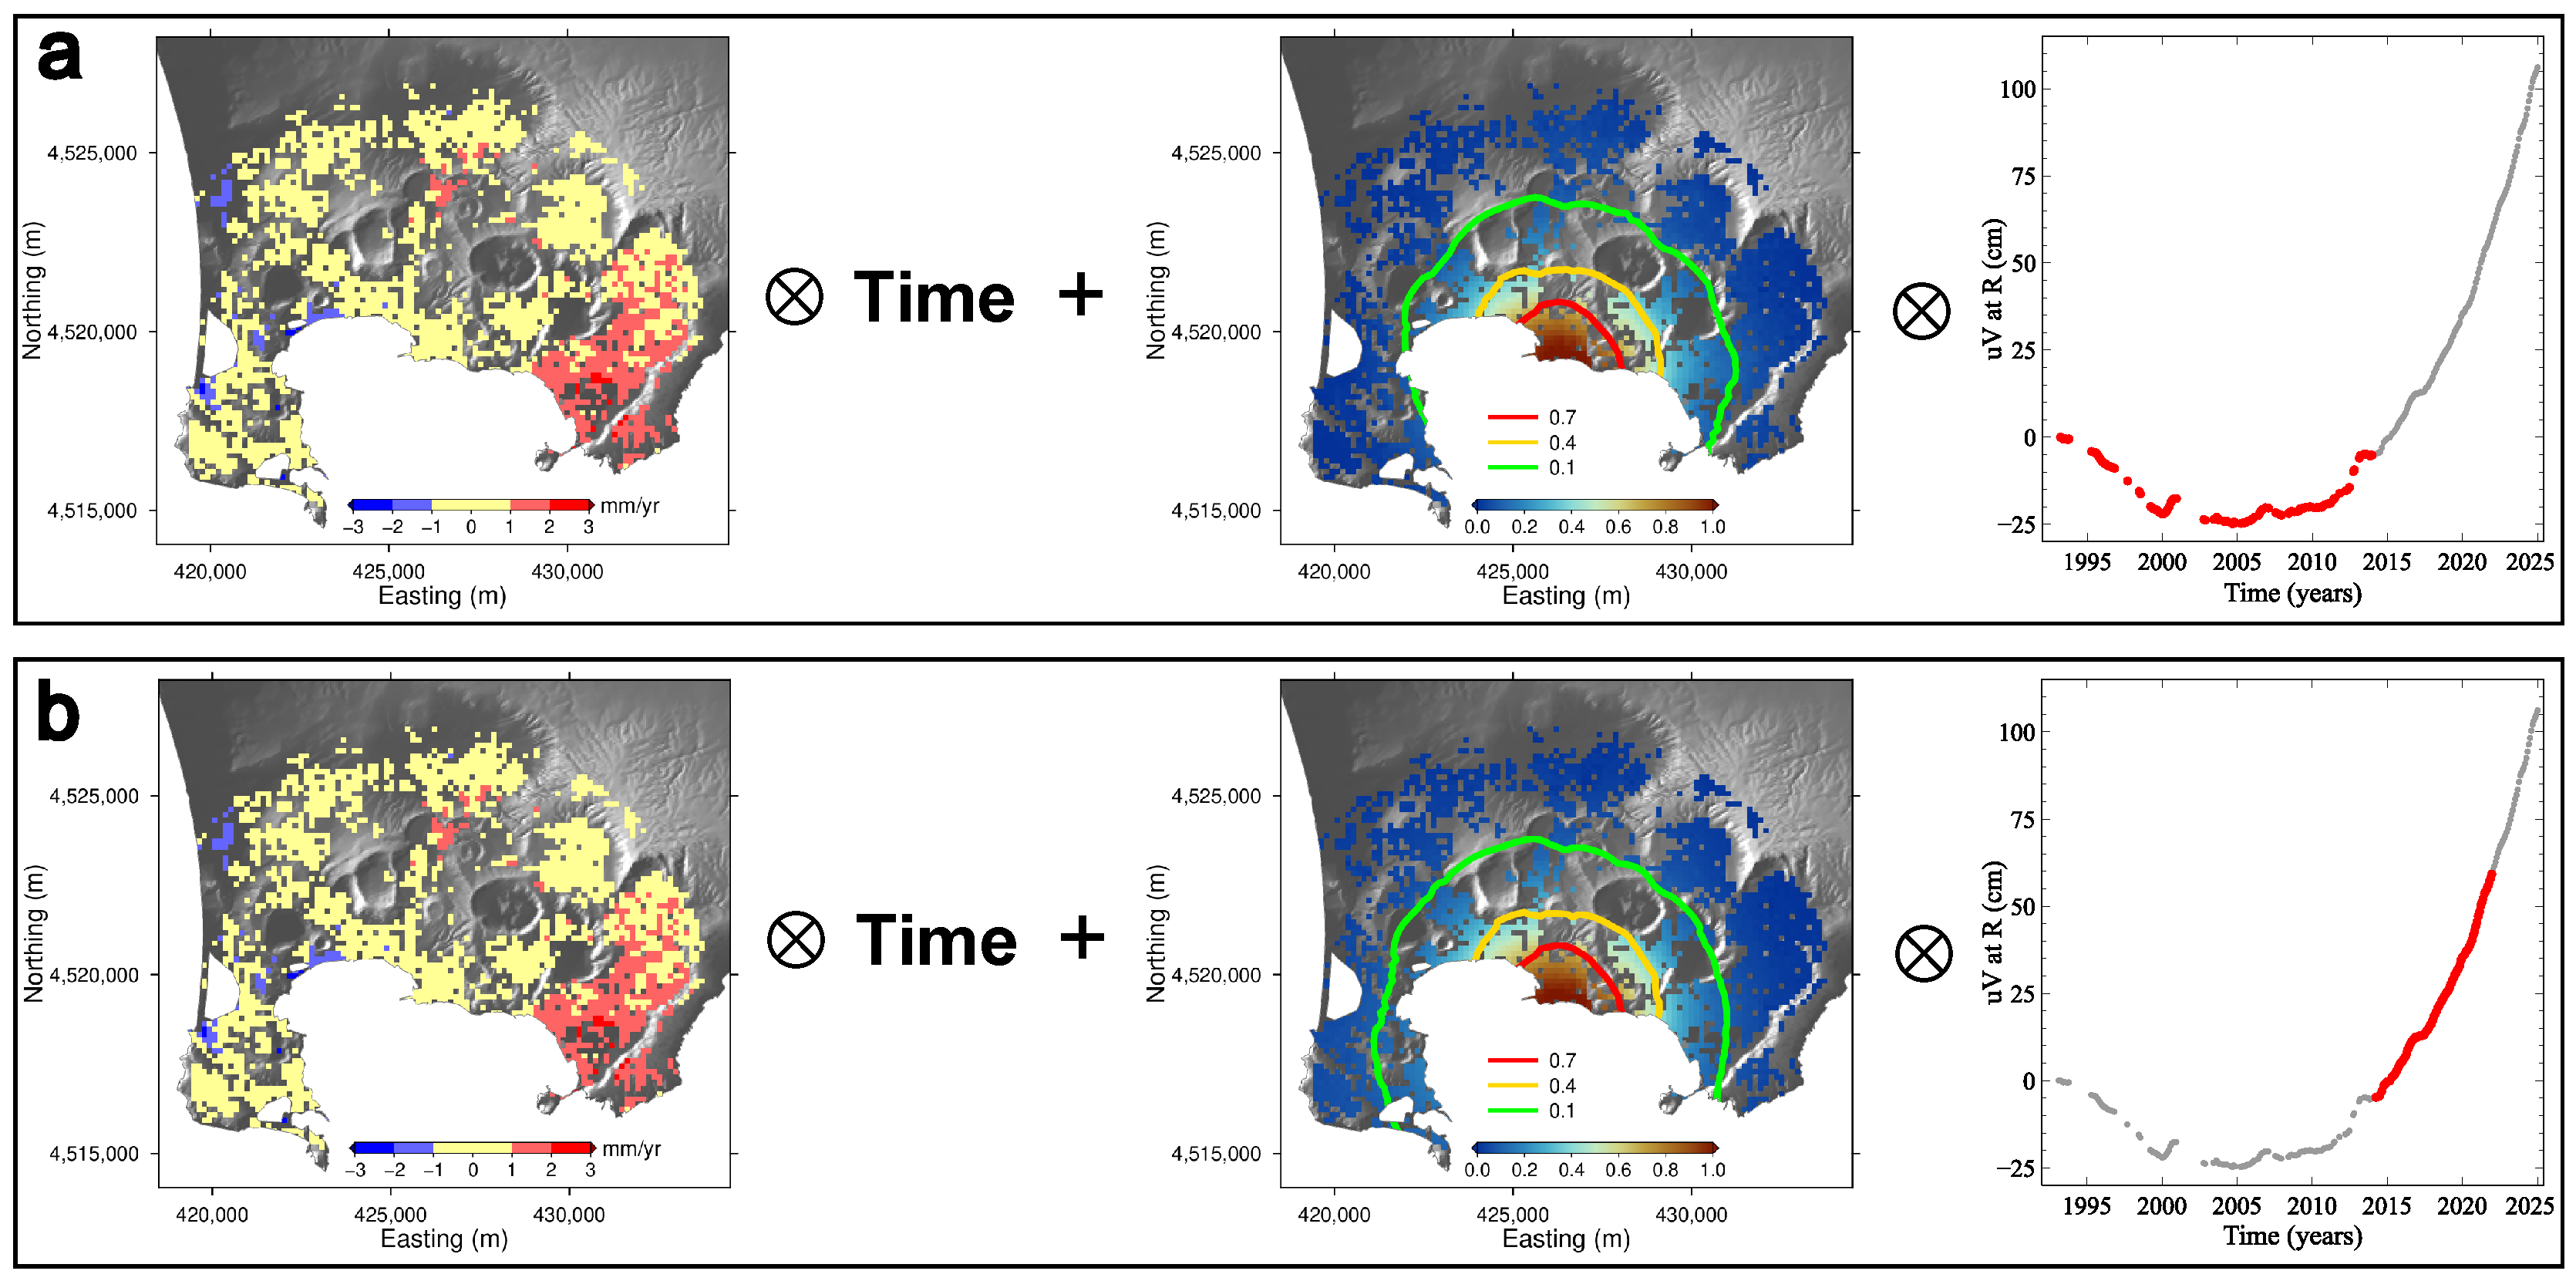
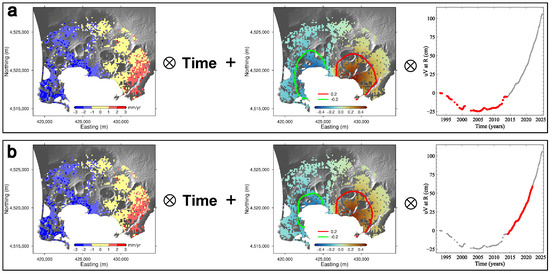
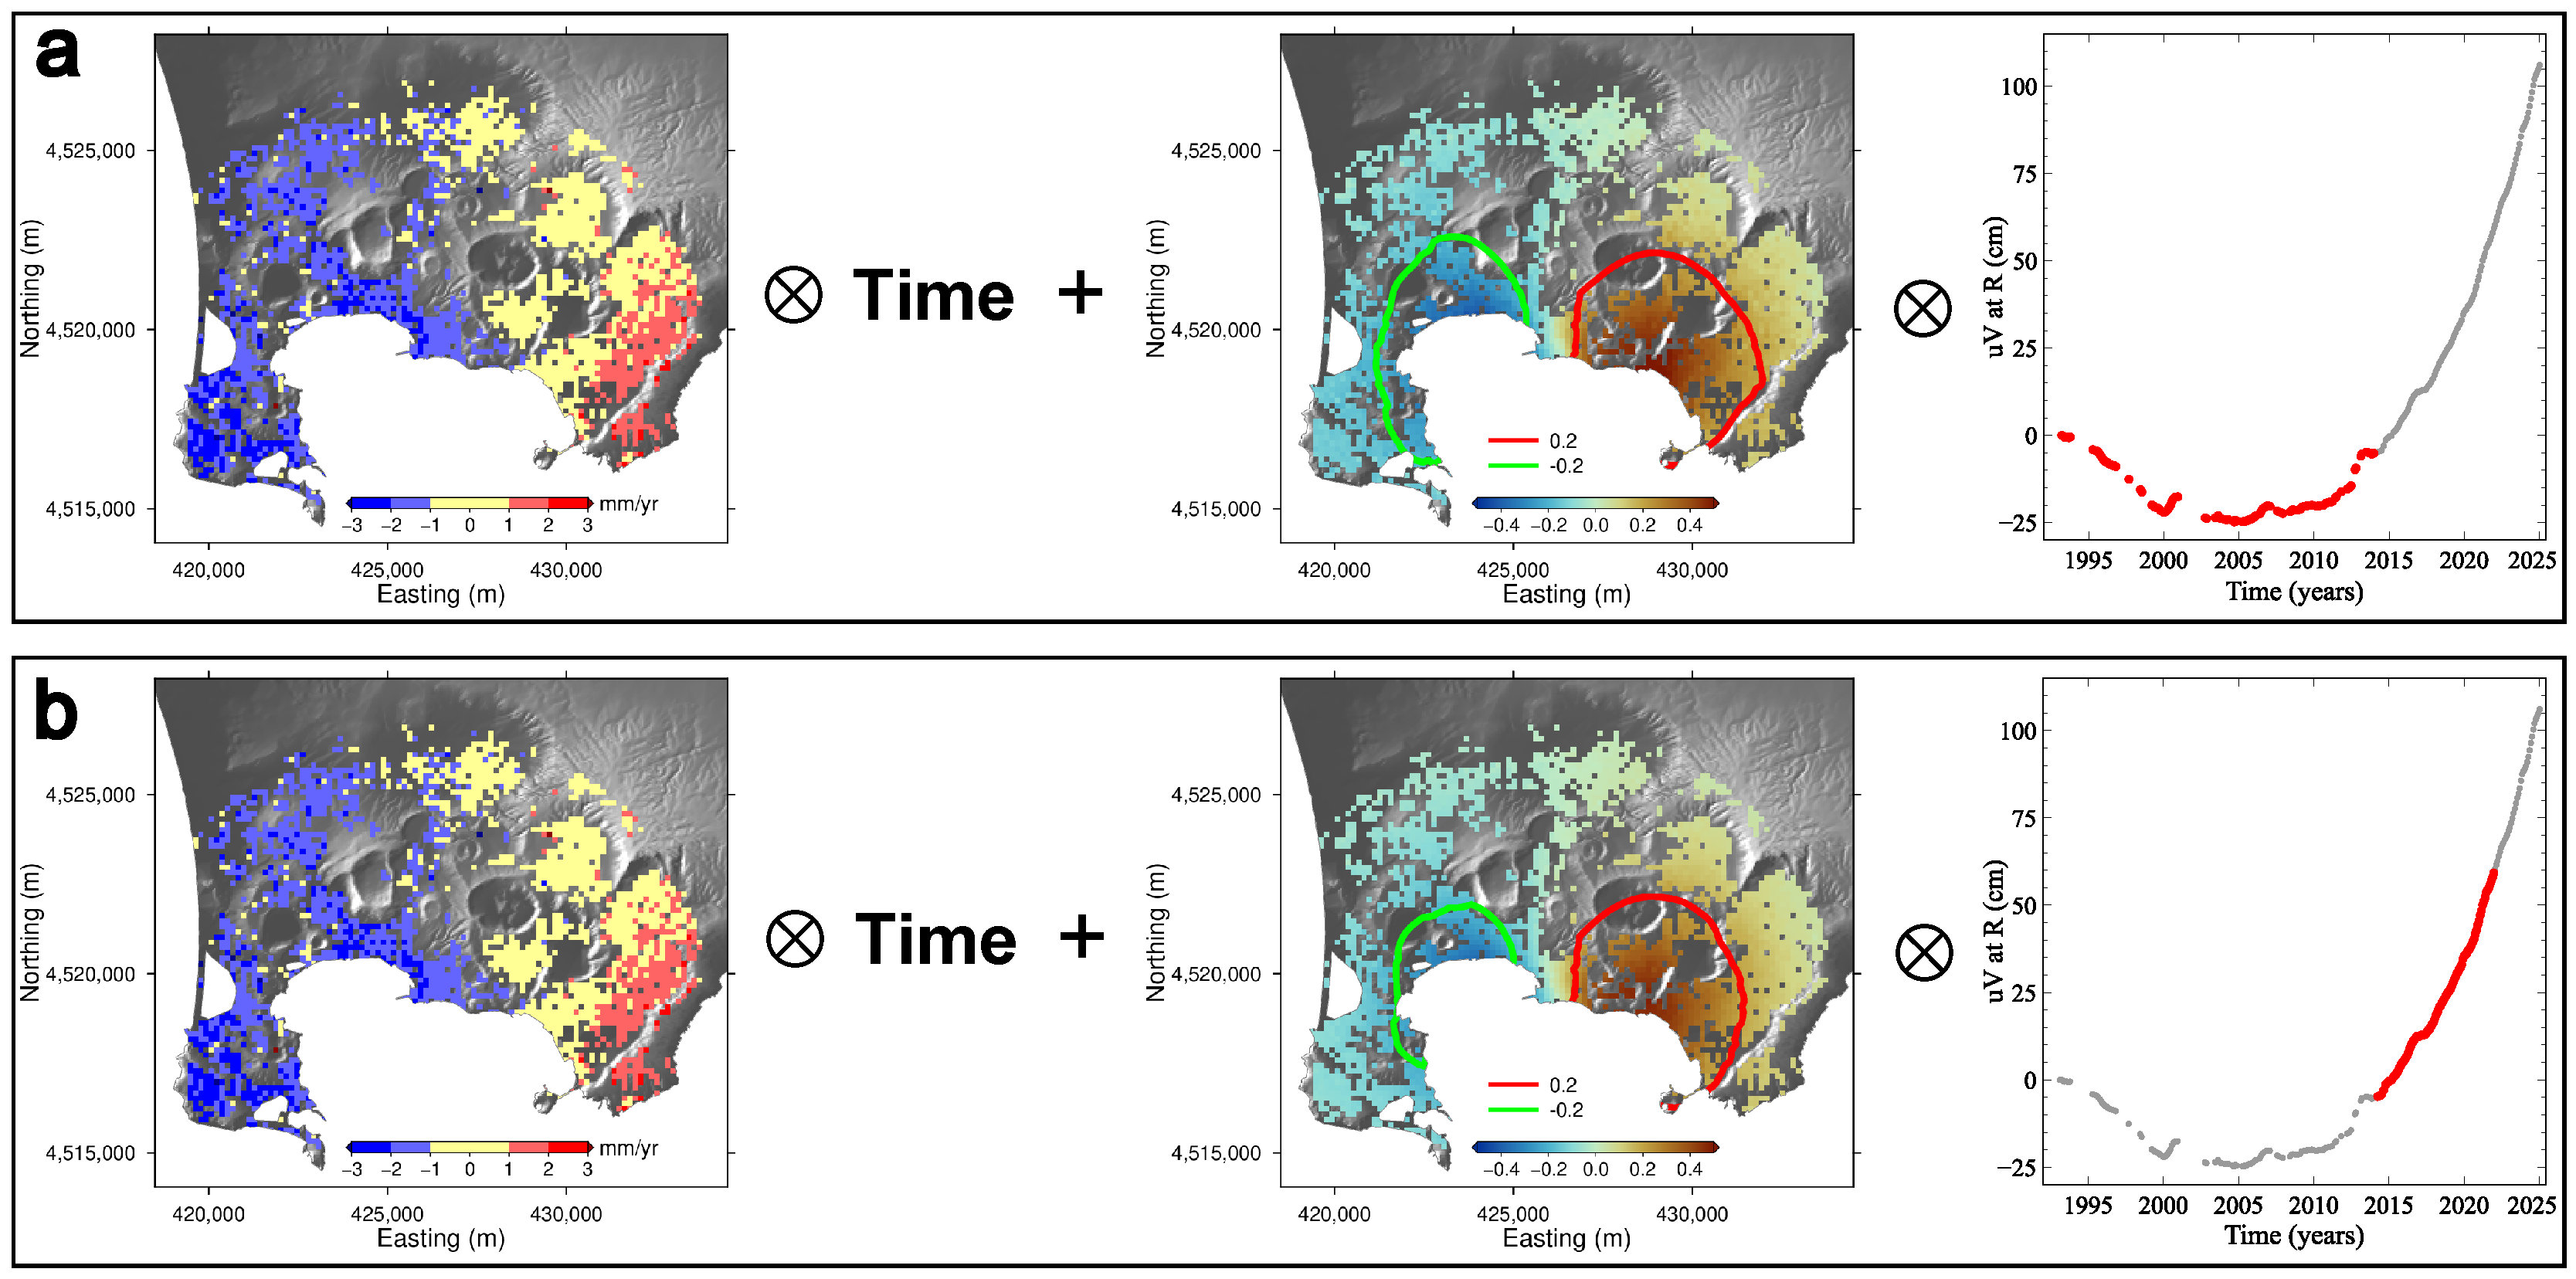
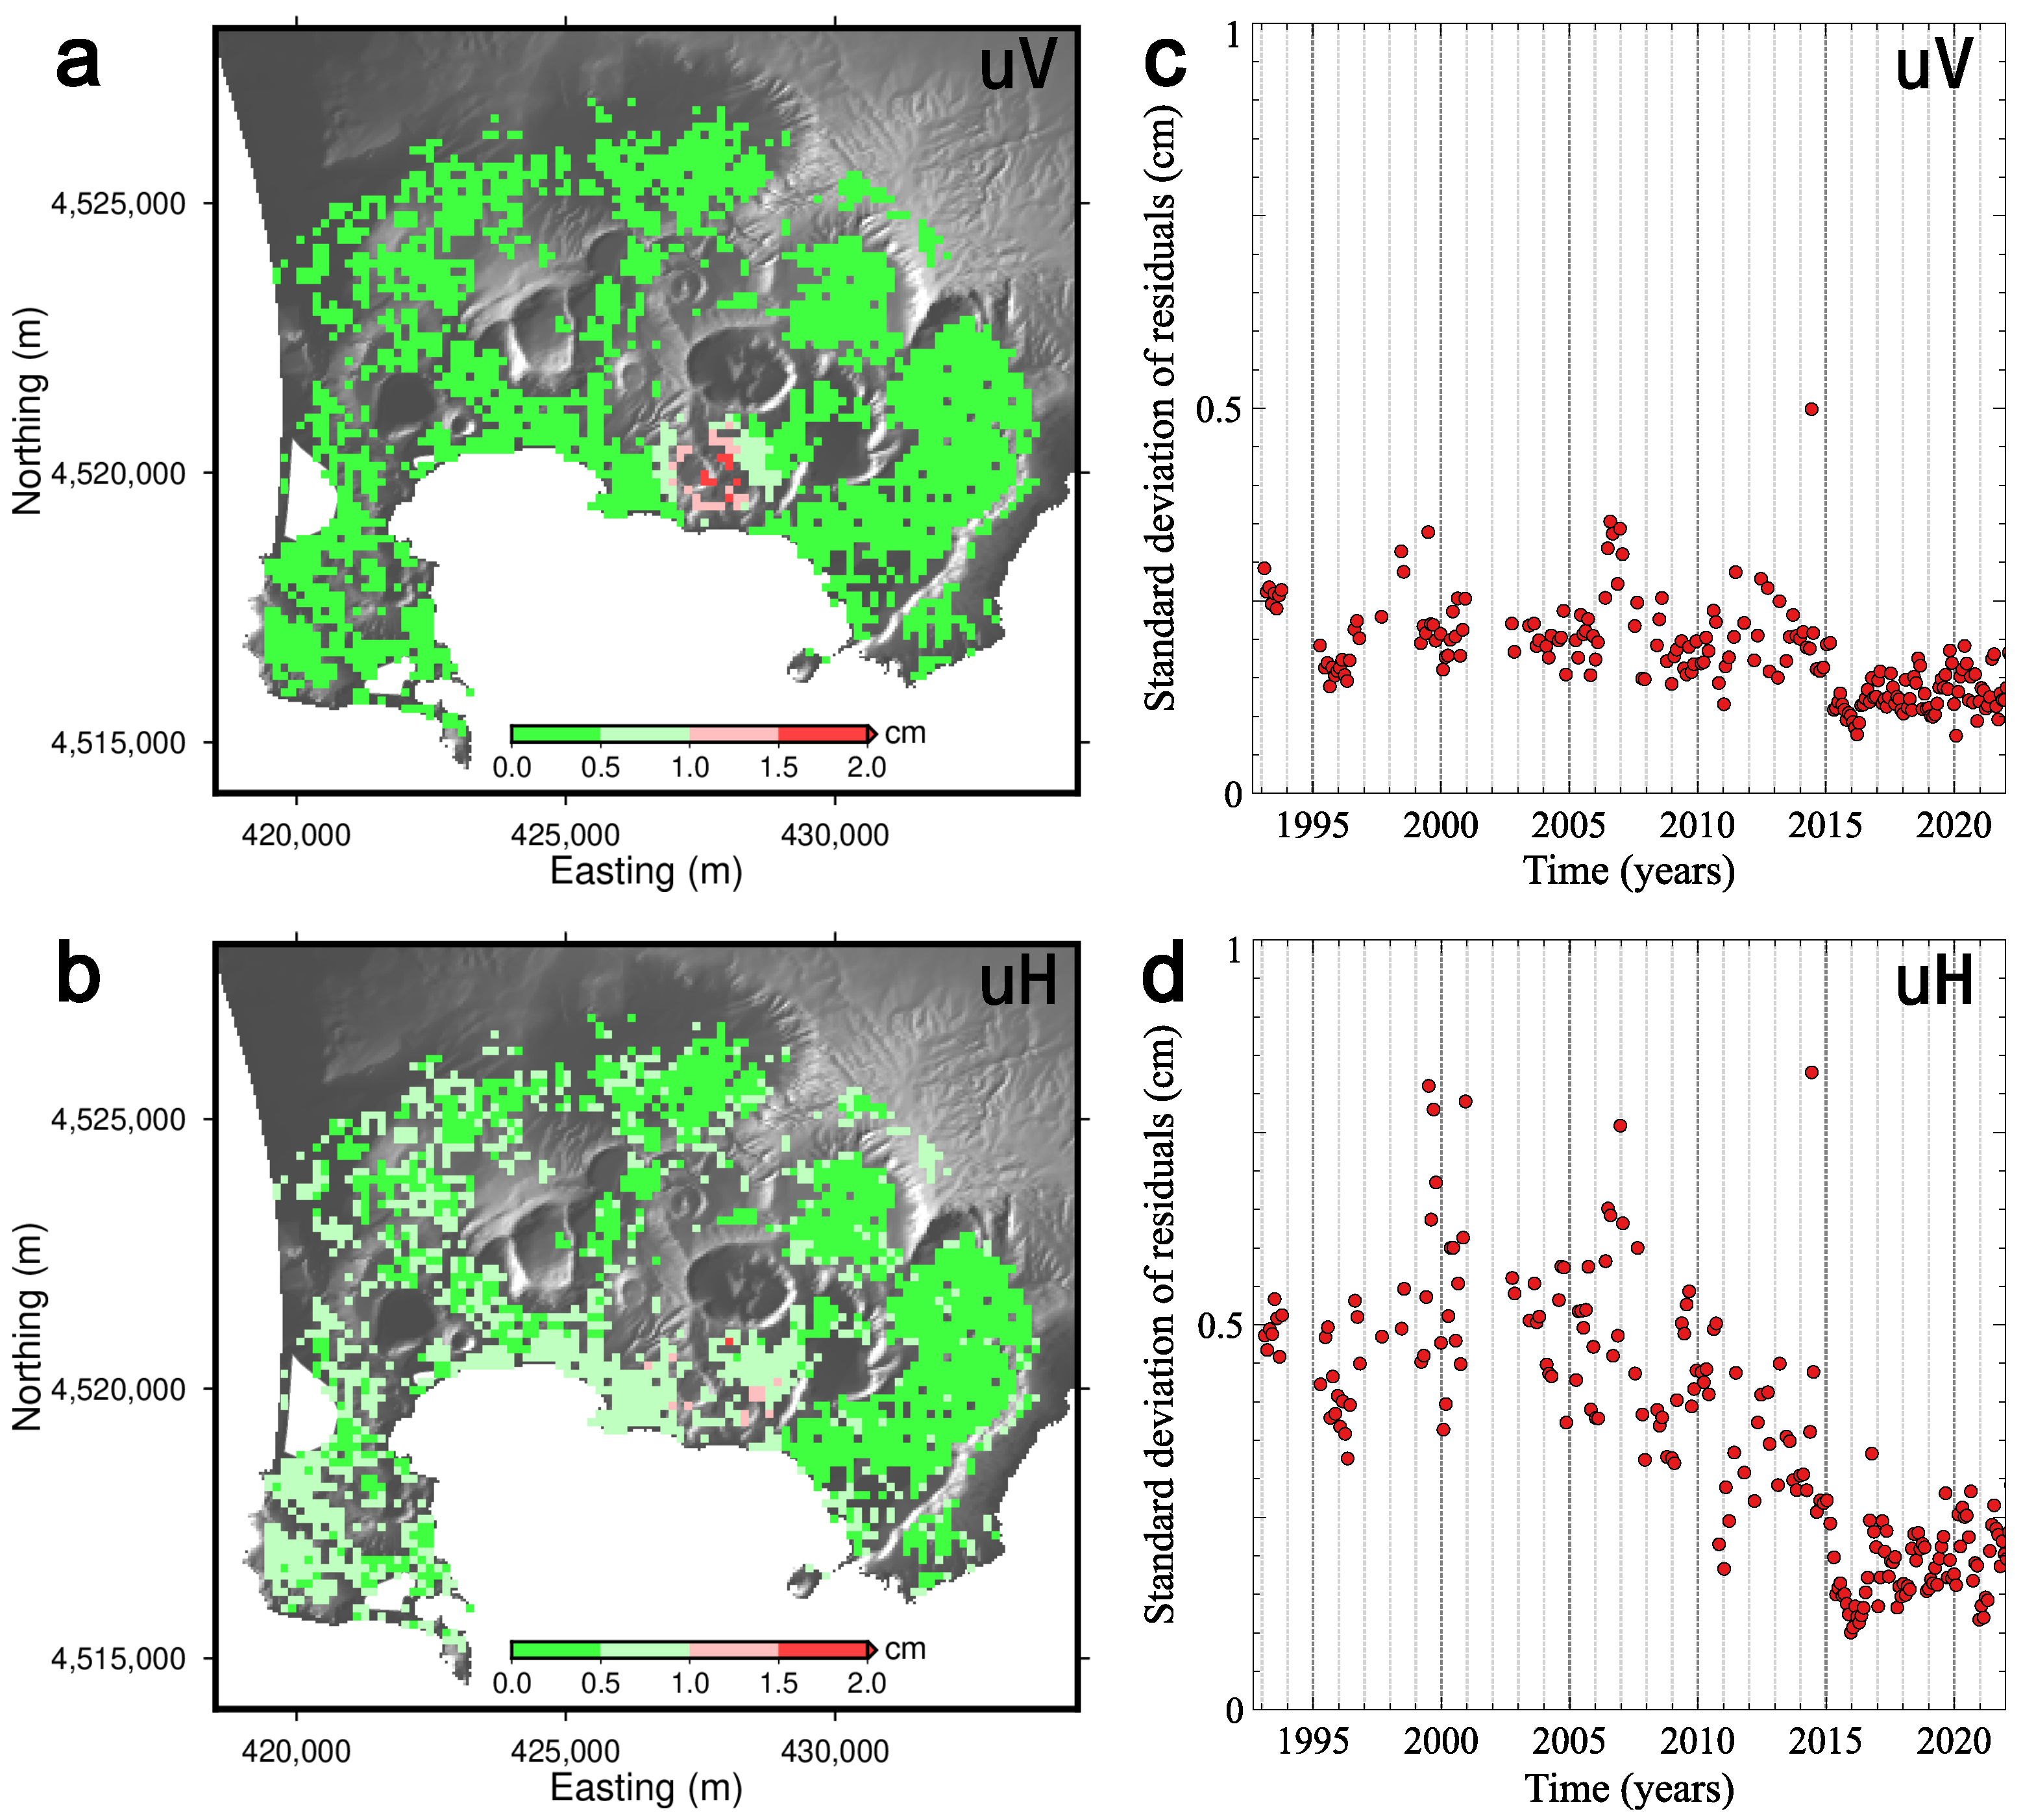
We then computed the theoretical displacement series for each pixel by combining the displacement term with the product of the regression-line slopes and at site R for the periods 1993–2013 and 2014–2021, as schematized in Figure 6. Table 1 reports the physical meaning, units and descriptive statistics of the estimated parameter fields. To provide a quantitative reference, a unit value in the normalised spatial pattern corresponds to a mean velocity of approximately 3 cm yr−1 for the 1993–2013 interval and approximately 8 cm yr−1 for the 2014–2021 interval, based on cumulative deformation over these periods. The theoretical series were subsequently subtracted from the displacement data to obtain the model residuals. Residuals at the fourteen representative sites are shown in Figure 7. They remain below 1 cm, corresponding to twice the one-standard-deviation uncertainty (0.5 cm), except at sites H and L, where they highlight the pre-2005 anomaly in the Solfatara-Pisciarelli area and the initial phase of the post-2019 anomaly at Mt. Olibano.
Figure 6.
Conceptual representation of the two-component kinematic model for quasi-vertical displacements (Equations (4)–(7)). (a) Modelled temporal evolution of the quasi-vertical displacement for each pixel over the 1993–2013 interval, expressed as the sum of (i) the pixel-wise tensor product ⊗ between the field and the epoch array ; and (ii) the pixel-wise tensor product ⊗ between the normalised stationary-field amplitude and the quasi-vertical displacement time series at the reference site R. Red dots indicate the epochs used in the tensor product, whereas grey dots denote epochs not included in the corresponding computation. Contour lines in the maps of the normalised stationary-field amplitudes were derived by applying a Gaussian filter (standard deviation of 2 pixels) to the raw maps, followed by bi-cubic spline interpolation to fill low-coherence areas. (b) Same as panel (a), but for the 2014–2021 interval.
Table 1.
Physical meaning, units and descriptive statistics of the estimated parameter fields.
Figure 7.
Residual quasi-vertical step-1 time series at fourteen representative sites after subtraction of the displacement components derived from the linear regressions fitted between the step-1 time series and at site R over the 1993–2013 and 2014–2021 intervals separately. () Location of the selected sites and the reference site R (see also Figure 1a). (A–N) Residual time series; each panel corresponds to the equivalently labelled black dot shown in panel (). Panels (H,L) are marked with a red alert symbol, as they correspond to the Solfatara-Pisciarelli and Mt Olibano areas, respectively, where localised deformation anomalies have been previously documented.
A consistent behaviour is observed for (Figure 8), whose corresponding correlation plots are provided in Supplementary Information Figures S4 and S5. Figure 9 illustrates the conceptual model adopted to calculate theoretical eastward displacements using Equation (10), Table 1 reports descriptive statistics of the estimated parameter fields, while Figure 10 shows the corresponding model residuals at the fourteen representative sites.
Figure 8.
Eastward displacements () at fourteen representative sites. () Location of the selected sites and the reference site R (see also Figure 1a). (A–N) Time series of ; each panel corresponds to the equivalently labelled black dot shown in panel (). Panels (H,L) are marked with a red alert symbol, as they correspond to the Solfatara-Pisciarelli and Mt Olibano areas, respectively, where localised deformation anomalies have been previously documented.
Figure 9.
Conceptual representation of the two-component kinematic model for eastward displacements (Equations (10)–(12)). (a) Modelled temporal evolution of the eastward displacement for each pixel over the 1993–2013 interval, expressed as the sum of (i) the pixel-wise tensor product ⊗ between the field and the epoch array ; and (ii) the pixel-wise tensor product ⊗ between the normalised stationary-field amplitude and the quasi-vertical displacement time series at the reference site R. Red dots indicate the epochs used in the tensor product, whereas grey dots denote epochs not included in the corresponding computation. Contour lines in the maps of the normalised stationary-field amplitudes were derived by applying a Gaussian filter (standard deviation of 2 pixels) to the raw maps, followed by bicubic spline interpolation to fill low-coherence areas. (b) Same as panel (a), but for the 2014–2021 interval.
Figure 10.
Residual eastward step-1 time series at fourteen representative sites after subtraction of the displacement components derived from the linear regressions fitted between the step-1 time series and at site R over the 1993–2013 and 2014–2021 intervals separately. () Location of the selected sites and the reference site R (see also Figure 1a). (A–N) Residual time series; each panel corresponds to the equivalently labelled black dot shown in panel (). Panels (H,L) are marked with a red alert symbol, as they correspond to the Solfatara-Pisciarelli and Mt Olibano areas, respectively, where localised deformation anomalies have been previously documented.
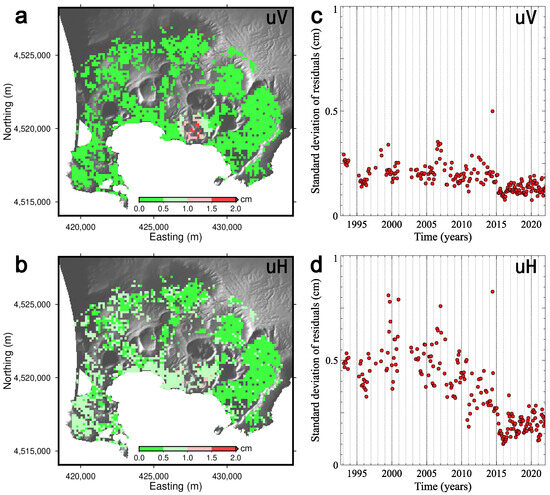
These observations indicate that, despite local deviations, the displacement field exhibits a high degree of spatio-temporal coherence, thereby supporting the decomposition approach introduced in Section 2.2.2. The overall performance of the approach is further supported by:
- The spatial distributions of the residual standard deviation (Figure 11a,b);
- The temporal evolution of the residual standard deviation outside the Solfatara-Pisciarelli and Mt. Olibano area (Figure 11c,d).
Figure 11.
Performance of the decomposition approach. (a,b) Spatial distributions of the residual standard deviation for and , respectively. (c,d) Temporal evolution of the residual standard deviation for and , respectively, outside the Solfatara-Pisciarelli and Mt. Olibano areas.
Both metrics confirm that the approach effectively captures the large-scale deformation signal over the analysed 1993–2021 period.
3.2. Spatial Pattern of the Constant-Velocity Fields
Building on the spatio-temporal relationships identified above, the displacement field can be decomposed into the sum of a separable pixel-dependent linear temporal trend and a time-invariant spatial pattern (Figure 6 and Figure 9). The pixel-dependent linear temporal trend is associated with a constant-velocity field that is intrinsically non-unique because of the identifiability limitation discussed in Section 2.2.2.
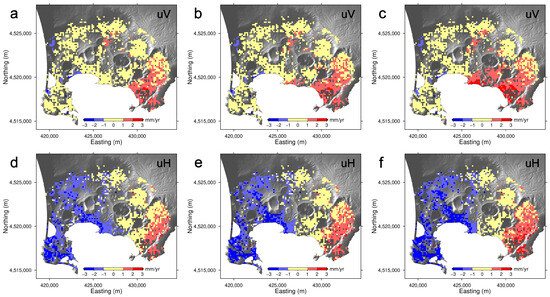
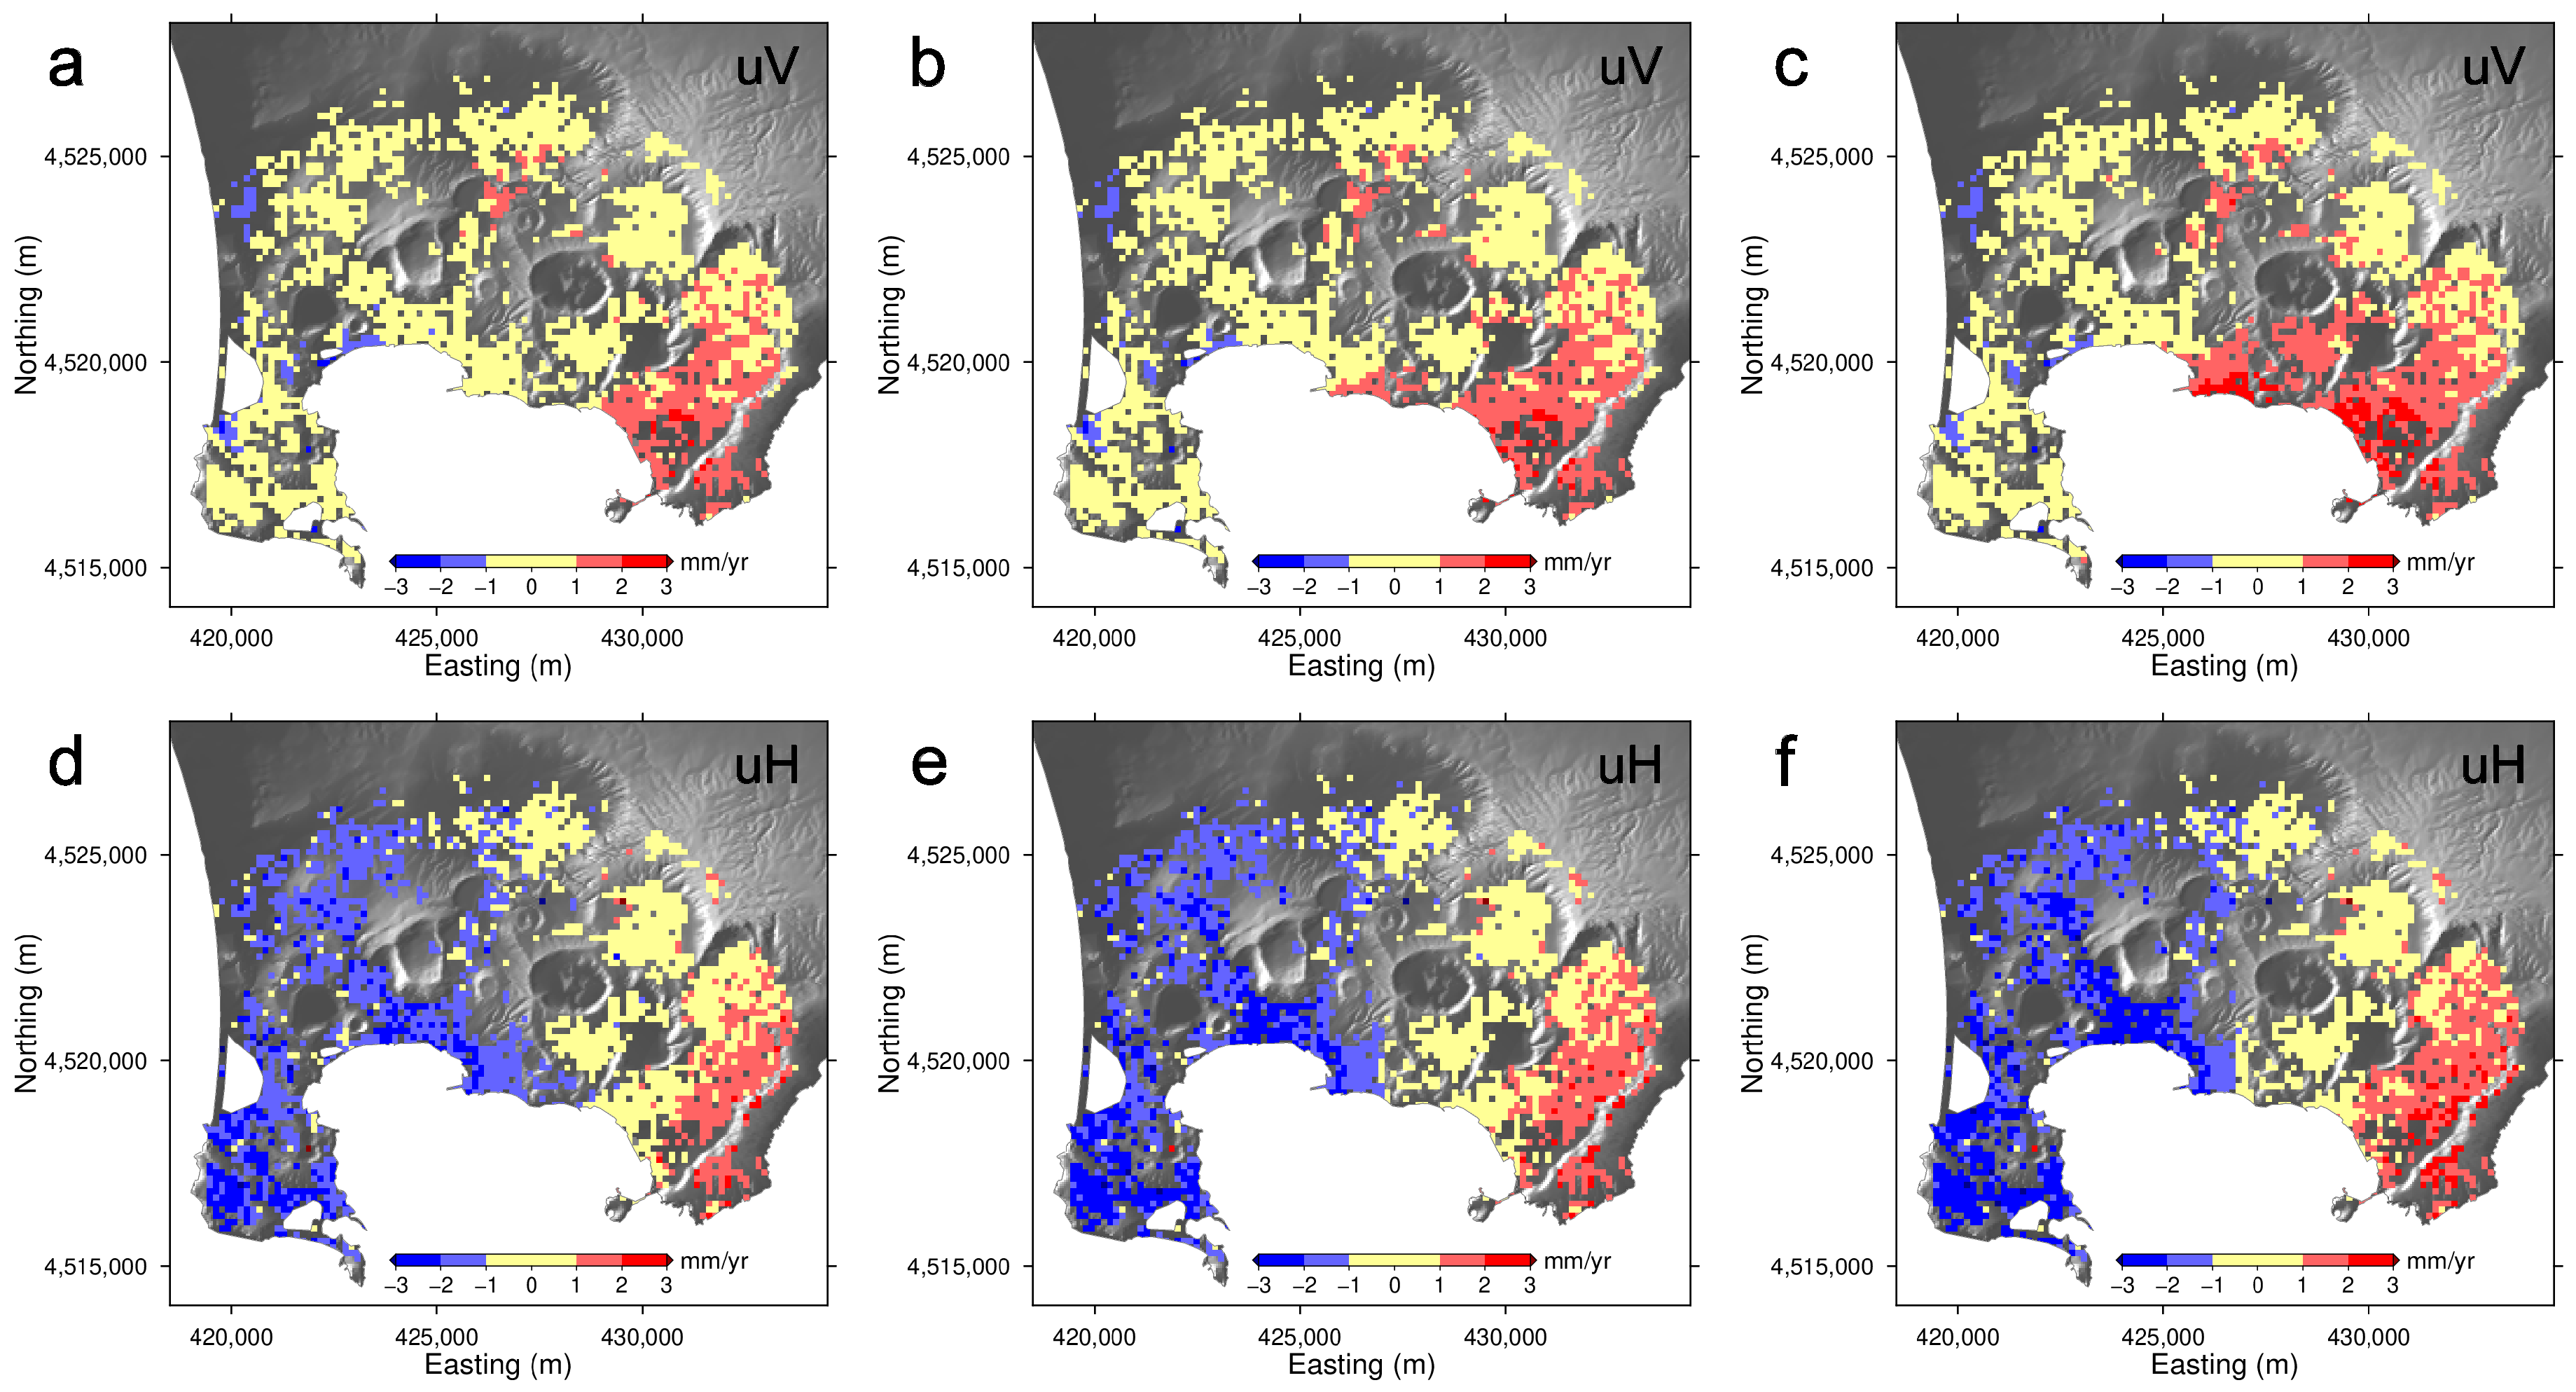
For , the constant-velocity field can be obtained by rearranging Equation (6). Figure 12a shows the limiting case in which the constant velocity at site R () is set to zero, yielding . Figure 12b and Figure 12c show alternative realisations obtained by prescribing values of 1 and 2 mm yr−1 for , respectively. Despite this non-uniqueness, all solutions indicate steady uplift in the south-eastern sector. Consistent results are obtained for (Figure 12d–f).
Figure 12.
Quasi-vertical and eastward constant-velocity fields. (a) Map of the field (Equation (6) and Figure 6). (b,c) Maps of the quasi-vertical constant-velocity field , obtained assuming a quasi-vertical constant velocity at reference site R of 1 mm yr−1 and 2 mm yr−1, respectively. (d) Map of the field (Equation (12) and Figure 9). (e,f) Maps of the eastward constant-velocity field , obtained assuming a quasi-vertical constant velocity at reference site R of 1 mm yr−1 and 2 mm yr−1, respectively.
4. Discussion
The discussion is structured as follows: we first interpret the kinematic decomposition, then discuss the assumptions and limitations of the proposed methodology.
The raw time series (Figure 2) display distinct behaviours across three sectors of the caldera (western, central, and eastern). Their spatial distribution broadly overlaps with, though does not exactly coincide with, the subdivision of the caldera into three volcano-tectonic domains (north-eastern, western, and central sectors), previously identified on the basis of eruption frequency and composition, fault-system architecture, and the spatial distribution of vents associated with post-15 ka eruptions (e.g., [18]).
Our results indicate that ground deformation at Campi Flegrei can be satisfactorily described by the superposition of two distinct kinematic components: (i) a spatially variable, approximately linear trend, and (ii) a dominant deformation field characterised by a time-invariant spatial pattern modulated by a time-dependent amplitude. Departures from this otherwise coherent behaviour are mainly associated with the change observed in the south-western sector around 2012–2013 and with the onset of accelerated uplift in the eastern sector after 2021.
The robustness of the proposed decomposition is supported by several independent observations. First, after removal of a pixel-dependent velocity term, deformation data from both subsidence and uplift phases collapse onto a common linear relationship with the quasi-vertical displacement at reference site R. This result indicates that much of the apparent temporal complexity of the raw time series can be reconciled within a unified kinematic framework. Second, the persistence of linear correlations with the reference displacement across different sectors and time intervals provides a consistent empirical basis for the adopted decomposition. Third, the agreement between quasi-vertical and eastward displacement components suggests that the inferred behaviour is not an artefact arising from projection effects or component-specific noise.
This study extends the concept of geometric stationarity of the dominant deformation field, previously identified—within measurement uncertainties—over relatively short intervals (1995–2000 [31]; 2011–2014 [33]; and 2015–2021 [11]), to an approximately 30-year period spanning 1993 to the end of 2021. We further show that the small differences among these intervals can be interpreted as the effect of a persistent constant-velocity field superimposed upon the dominant deformation pattern.
Although deformation data prior to 1993 are limited to levelling and precise traversing surveys, and are therefore spatially sparse, the similarities observed between the deformation patterns of 1969–1972 and 1982–1984 [42], as well as among several shorter intervals between 1970 and 1994 [43] and between 1980 and 2000 [31], suggest that geometric stationarity may persist over timescales of several decades.
Within this framework, the time-invariant spatial pattern may be interpreted as the surface expression of a deformation source with stable geometry whose intensity evolves through time. The observed temporal modulation is therefore more consistent with variations in source strength than with major changes in source configuration.
The expansion of the quasi-vertical deformation pattern towards the south-west around 2012–2013 indicates a modification of the source influence area, possibly reflecting lateral expansion of the source and/or changes in the mechanical coupling between the source and the surrounding medium. This interpretation is consistent with both the DInSAR eastward displacement at site R and the GNSS eastward displacement at station RITE (Supplementary Information Figure S2), which is co-located with site R; both datasets show a transition from negative to positive values around 2013. Although the eastward deformation pattern appears to contract in the south-western sector around 2012–2013, this feature should be interpreted with caution because the ERS/ENVISAT acquisition geometry leads to relatively large uncertainties in the horizontal displacement estimates. We therefore do not consider this feature to be robust. Considered together with the concurrent evolution of seismicity and fumarolic activity, the steep uplift phase of 2012–2013 (Figure 1c) may therefore represent a turning point in the ongoing unrest [14]. In addition, until 2014, earthquakes were relatively infrequent and occurred mainly as swarms of low-magnitude events. After 2014, seismicity became progressively more frequent, accompanied by increases in released seismic energy and background seismicity [44].
Because the primary objective of this study is to identify the intrinsic simplicity underlying the apparently complex spatio-temporal evolution of deformation at Campi Flegrei, a detailed investigation of the physical source responsible for the observed deformation lies beyond the scope of the present work. Nevertheless, by applying the geodetic inversion approach of [31,45] and validating the results through three-dimensional finite-element simulations (COMSOL Multiphysics®, version 5.2), we find that the steady-state deformation fields for the periods 1993–2013 and 2014–2021 can both be reproduced, to first order, by a pressurised ellipsoidal source located at a depth of approximately 3–4 km. The stability of the inferred source depth across the two analysed periods supports the existence of a long-lived deformation source within the shallow crust, consistently identified through inversion of deformation data from different periods (e.g., [7,8,9,11,12,31]).
The spatially variable constant-velocity field, particularly evident in the south-eastern sector, indicates the presence of an additional deformation component that cannot be explained solely by temporal modulation of a single source. Although the absolute magnitude and westward extension of this component is affected by the intrinsic non-uniqueness of the decomposition, most of its spatial distribution remains robust across all admissible solutions, suggesting that it reflects a genuine geophysical signal rather than a modelling artefact. Both the and constant-velocity fields exhibit amplitudes of only a few mm yr−1 (Figure 12), only slightly larger than the associated uncertainties. Supplementary Information Figure S6 shows the results of a comprehensive analysis which includes uncertainties derived from the least-squares covariance matrix and Monte Carlo simulations accounting for perturbations in both the quasi-vertical displacement time series and the mean displacement velocities. The uncertainty is dominated by the propagation of errors in the mean displacement velocities, whereas the contributions from individual displacement measurements and from the least-squares covariance matrix are negligible.
Systematic sensitivity tests performed over alternative time windows with respect to 1995–2013 demonstrate that the estimated field (Equation (6)) remains robust over a broad range of fitting intervals spanning a wide range of squared correlations between elapsed time and the temporal evolution of the reference displacement (Supplementary Information Figure S7). In particular, the south-eastern velocity anomaly is consistently recovered across these tests, and consequently the corresponding field preserves the same deformation geometry. Only for fitting windows where the squared correlation approaches unity (0.96 in Supplementary Figure S7f) does the inversion become ill-conditioned, leading to unstable estimates of , as expected from the theoretical considerations discussed in Section 2.2.2. These results confirm that the choice of the 1995–2013 interval is not arbitrary but provides a robust compromise, avoiding the near-degenerate case while yielding results that are representative of a broad range of alternative fitting windows. Taken together with the independent uncertainty analysis described above, the persistence of this anomaly across both approaches supports its interpretation as a genuine, albeit low-amplitude, component of the deformation field, rather than as an artefact of the fitting window or of measurement noise.
The large spatial wavelength of the retrieved constant-velocity field suggests a deep source. This interpretation is consistent with independent geophysical evidence for a partially molten layer at ≈8 km depth beneath the caldera [46] and, more specifically for the south-eastern sector, a vertically elongated low-velocity body at ≈10 km depth [47]. Several mechanisms could account for such a linear deformation component, including steady intrusion, thermal expansion, long-term viscoelastic relaxation, steady fluid migration, or deep-seated tectonic processes, although additional constraints are required to discriminate among competing interpretations. We emphasize, however, that the present analysis is purely kinematic and does not constitute a formal geodetic source inversion.
Anomalous uplift in the south-eastern sector had already been suggested by [31] through extrapolation of the 1995–2000 deformation field, reversed in sign, to the period 2005–2010. Similar anomalies also emerged from the second component of a joint Empirical Orthogonal Function analysis of the 1995–2000 and 2015–2021 deformation datasets [11]. The recurrence of this feature across independent analytical approaches and time periods further strengthens its interpretation as a genuine component of the deformation field.
The constant-velocity assumption adopted here should be regarded as a zeroth-order approximation, motivated by the small amplitudes of the inferred velocities. In this context, the excess uplift observed in the eastern sector after 2021 (Figure 4 and Figure 5) may reflect an abrupt change in the process responsible for the long-term linear-trend component. Given the limited temporal coverage of the DInSAR time series for this phase, a detailed characterisation of this behaviour remains beyond the scope of the present study. Its spatial coherence, however, suggests that it is unlikely to result from local noise or processing artefacts.
Interestingly, several geochemical indicators also exhibit marked changes during the same period. Air CO2, total CO2 output, and tremor amplitude at Pisciarelli show abrupt increases beginning around 2018 [24]. Elevated H2S emissions since 2018 [48], together with the occurrence of crystalline boric acid (sassolite, H3BO3) since 2019 [49], further suggest changes in the physico-chemical state of the hydrothermal system. Because these geochemical changes precede by two to three years the onset of accelerated uplift identified in our deformation dataset, they may represent early indicators of the same evolving process, possibly reflecting precursory changes in the system that preceded the subsequent acceleration of surface deformation.
As demonstrated by the residual analysis, our kinematic decomposition reproduces the spatio-temporal evolution of ground deformation at Campi Flegrei over the 1993–2021 period within the observational uncertainties at virtually all locations, with the only significant exceptions being the well-known anomalous areas of Solfatara-Pisciarelli and Mt Olibano. This agreement is achieved using only two kinematic components, without invoking multiple deformation sources or highly parameterised evolutionary models that could readily accommodate the observations at the expense of physical interpretability and with an increased risk of overfitting.
That said, the interpretation of ground deformation data is inherently non-unique, and alternative physical models cannot be excluded. For example, one may envisage models in which distinct deformation sources dominate during the subsidence and uplift phases. Ground deformation data alone do not provide sufficient evidence to discriminate uniquely between these competing interpretations.
An entirely different issue concerns the apparent temporal variability of deformation geometry during the uplift phase itself. Velocity fields estimated over short time intervals may display different spatial patterns even if the underlying deformation geometry remains unchanged, because the uncertainty in the estimated velocities generally increases proportionally to , where T is the duration of the observation interval [50]. Consequently, apparent changes inferred from short-term velocity fields should be interpreted with caution, as they may partly reflect the increasing uncertainty of the velocity estimates rather than genuine changes in the deformation process.
More importantly, the assumption of a geometrically stationary dominant deformation field is not imposed a priori by the proposed methodology. Instead, it is the simplest interpretation of the observations after accounting for the spatially variable constant-velocity component. Specifically, the corrected displacement time series exhibit nearly linear relationships with the reference displacement over almost three decades. Had substantial changes in the dominant deformation geometry occurred during this interval, these linear relationships would have systematically deteriorated, producing residuals well above the measurement uncertainties.
Instead, the residual analysis demonstrates that, apart from the recognised changes in the south-western part of Campi Flegrei around 2012–2013, the stationary-pattern approximation provides an excellent description of the observations up to end 2021. The persistence of the dominant deformation geometry should therefore be regarded as an empirical result supported by the data rather than as a constraint imposed by the model. This conclusion should not be interpreted as implying that no additional changes occurred within the subsurface beyond those inferred around 2012–2013 and after 2021. Rather, it indicates that any such changes did not produce a statistically resolvable modification of the large-scale deformation geometry. Their effects may have been masked by structural heterogeneities, such as the mechanically rigid caprock or the caldera-bounding fault system, or may have generated deformation signals that partially compensated one another, thereby remaining undetectable in the surface displacement field.
The proposed decomposition is intentionally kinematic and phenomenological. Its objective is to identify the dominant characteristics of the observed deformation field rather than to provide a unique physical description of the underlying volcanic processes. Consequently, departures from the stationary-pattern approximation should not necessarily be regarded as shortcomings of the model; instead, they may constitute valuable indicators of changes in the evolving state of the volcanic system. In this respect, the deviations identified around 2012–2013 and after 2021 are likely to represent genuine modifications of the underlying geophysical processes rather than failures of the decomposition itself.
A second methodological limitation concerns the estimation of the constant-velocity component. Although the least-squares inversion uniquely determines the normalised deformation pattern, the associated constant-velocity field is intrinsically non-unique because it is resolved only up to an additive component proportional to the dominant spatial pattern. Consequently, the absolute amplitude and western extent of the inferred velocity field depend on the adopted reference conditions and should not be over-interpreted. By contrast, the principal features of its spatial distribution remain stable across all admissible solutions and therefore provide robust information on the location and relative importance of additional deformation processes.
The methodology also requires a sufficiently weak correlation between elapsed time and the temporal evolution of the reference displacement. For this reason, the estimation of the constant-velocity component was restricted to the 1995–2013 interval, during which subsidence and uplift approximately balance one another, resulting in a well-conditioned least-squares problem. Even though, for Campi Flegrei, the constant-velocity field remain stable over a broad range of fitting intervals spanning a wide range of squared correlation values, the application of the proposed approach to other volcanic systems may require either the selection of an appropriate analysis window or the adoption of alternative inversion strategies to mitigate parameter trade-offs.
More generally, the proposed approach is expected to be most effective in volcanic systems where deformation is dominated by a long-lived source with approximately stable geometry and where secondary deformation processes evolve gradually through time. By contrast, volcanic unrest characterised by rapid changes in deformation geometry, abrupt source migration, or multiple deformation sources of comparable magnitude would probably require more general spatio-temporal models capable of representing evolving spatial patterns.
Despite these limitations, the identification of a stable dominant deformation geometry provides a valuable framework for interpreting the long-term evolution of unrest at Campi Flegrei. Separating this dominant component from weaker long-term trends and local anomalies enhances the detectability of significant departures from the background deformation regime, thereby offering a simple and objective framework for identifying transitions in volcanic behaviour.
Future work should investigate whether the remarkable persistence of the dominant deformation geometry is primarily controlled by structural factors, including the caldera ring fault system, the mechanically rigid caprock, and/or the underlying weak layer, as described, for example, by [3,22,51,52]. More generally, integrating this kinematic framework with independent geophysical and geochemical observations may improve the physical interpretation of deformation signals and ultimately contribute to more reliable monitoring and early-warning strategies for caldera unrest. These considerations are synthesised in the following conclusions.
5. Conclusions
In this study, we analysed three decades of ground deformation at Campi Flegrei by integrating multi-mission DInSAR observations within a unified kinematic framework. Our results show that the deformation field can be effectively described as the superposition of two components: (i) a time-invariant spatial pattern modulated by a time-dependent amplitude and (ii) a spatially variable constant-velocity component.
The identification of a time-invariant spatial pattern across multiple time intervals indicates the persistence of a deformation source with stable geometry, whose temporal evolution is controlled primarily by variations in source strength rather than configuration. The expansion of this pattern towards the south-west around 2012–2013 suggests a significant modification in the spatial influence of the source, potentially reflecting lateral source expansion and/or changes in the mechanical coupling between the source and the surrounding medium. To first order, the inferred deformation patterns are consistent with a pressurised source located at a depth of approximately 3–4 km. Importantly, bridging the temporal gap between ERS/ENVISAT and Sentinel-1 observations using RADARSAT-2 data proved essential for identifying the long-term persistence of this deformation geometry.
The presence of a secondary constant-velocity component, particularly evident in the south-eastern sector, reveals an additional contribution to ground deformation that is not captured by the dominant pattern alone. Although the absolute magnitude of this component is affected by the intrinsic non-uniqueness of the decomposition, its spatial distribution is robust and suggests the action of a distinct, possibly deeper and/or more distributed process.
Overall, the proposed decomposition provides a compact and physically meaningful representation of long-term deformation at Campi Flegrei, enabling the separation of the dominant deformation field from secondary trends and local anomalies. This framework improves the interpretability of complex geodetic time series and enhances the detection of possible changes in deformation regime, which is of primary importance for volcanic monitoring and hazard assessment.
Future research will prioritise the extension of the present analysis to encompass the most recent phase of accelerated uplift, through the integration of complementary geophysical and geochemical observations and the development of more sophisticated source models capable of reproducing the observed spatial variability in surface deformation. Further investigation will examine whether the persistent spatial geometry of the dominant deformation patterns identified over the periods 1993–2013 and 2014–2021 is governed by structural controls, including the caldera ring fault system, the mechanically rigid caprock, and/or the underlying weak layer. From a DInSAR processing perspective, planned methodological improvements include the reprocessing of the ERS/ENVISAT time series through the joint application of the Small BAseline Subset approach and the multi-temporal interferogram filtering technique introduced by [53], consistent with the processing strategy routinely employed for the retrieval of Sentinel-1 displacement time series [54]. In addition, a systematic densification of the RADARSAT-2 time series is envisaged.
Supplementary Materials
The following supporting information can be downloaded at https://www.mdpi.com/article/10.3390/rs18152476/s1.
Author Contributions
Conceptualization, A.A. and L.C.; methodology, A.A. and L.C.; software, A.A., L.C., F.C. and R.L.; validation, A.A. and L.C.; formal analysis, A.A. and L.C.; investigation, A.A. and L.C.; resources, A.A., L.C., F.C. and R.L.; data curation, F.C. and R.L.; writing—original draft preparation, A.A. and L.C.; writing—review and editing, A.A., L.C., F.C. and R.L.; visualization, A.A. and L.C.; supervision, A.A. and L.C.; project administration, L.C. All authors have read and agreed to the published version of the manuscript.
Funding
This research received no external funding.
Data Availability Statement
The ERS/ENVISAT LOS displacement time series used in this study are provided in the Supplementary Material. The additional ground displacement datasets employed in this study are publicly available from the following sources: RADARSAT-2 time series (https://www.mdpi.com/article/10.3390/rs17193268/s1, accessed on 4 July 2026); Sentinel-1 time series (https://zenodo.org/records/10781496, accessed on 4 July 2026); and continuous GNSS weekly position time series (https://zenodo.org/records/10082466, accessed on 4 July 2026). Further information may be obtained from the corresponding author.
Acknowledgments
We thank the European Space Agency for making the RADARSAT-2 SAR images available to us in the framework of project PP0094512, entitled “Campi Flegrei caldera evolution in between ERS/ENVISAT and Sentinel-1 missions”. We also thank the authors and maintainers of the open-source software used for this study, including GNU Octave v. 8.4.0 (https://octave.org/, accessed on 3 June 2026), GMT v. 6.5.0 (https://www.generic-mapping-tools.org/, accessed on 3 June 2026), Veusz v. 3.6.2 (https://veusz.github.io/, accessed on 3 June 2026), LibreOffice v. 24.2.7.2 (https://libreoffice.org, accessed on 3 June 2026), and Inkscape v. 1.2.2 (https://inkscape.org/, accessed on 3 June 2026). The authors have reviewed and edited the output and take full responsibility for the content of this publication.
Conflicts of Interest
The authors declare no conflicts of interest.
Abbreviations
The following abbreviations are used in this manuscript:
| DInSAR | Differential Interferometric Synthetic Aperture Radar |
| GNSS | Global Navigation Satellite System |
| LOS | line of sight |
References
- Tarquini, S.; Isola, I.; Favalli, M.; Mazzarini, F.; Bisson, M.; Pareschi, M.T.; Boschi, E. TINITALY/01: A new triangular irregular network of Italy. Ann. Geophys. 2007, 50, 407–425. [Google Scholar] [CrossRef] [Scilit]
- De Martino, P.; Dolce, M.; Brandi, G.; Scarpato, G.; Tammaro, U. The Ground Deformation History of the Neapolitan Volcanic Area (Campi Flegrei Caldera, Somma–Vesuvius Volcano, and Ischia Island) from 20 Years of Continuous GPS Observations (2000–2019). Remote Sens. 2021, 13, 2725. [Google Scholar] [CrossRef] [Scilit]
- Vitale, S.; Isaia, R. Fractures and faults in volcanic rocks (Campi Flegrei, southern Italy): Insight into volcano-tectonic processes. Int. J. Earth Sci. 2014, 103, 801–819. [Google Scholar] [CrossRef] [Scilit]
- Del Gaudio, C.; Aquino, I.; Ricciardi, G.; Ricco, C.; Scandone, R. Unrest episodes at Campi Flegrei: A reconstruction of vertical ground movements during 1905–2009. J. Volcanol. Geotherm. Res. 2010, 185, 48–56. [Google Scholar] [CrossRef] [Scilit]
- De Martino, P.; Dolce, M.; Brandi, G.; Scarpato, G. Campi Flegrei cGPS Weekly Positions Time Series. 2023. Available online: https://zenodo.org/records/10082466 (accessed on 3 June 2026).
- INGV-Sezione di Napoli OSSERVATORIO VESUVIANO. Bollettino di Sorveglianza-CAMPI FLEGREI-MARZO 2026. 2026. Available online: https://www.ov.ingv.it/index.php/monitoraggio-e-infrastrutture/bollettini-tutti/mensili-dei-vulcani-della-campania/flegrei/ (accessed on 13 April 2026).
- Amoruso, A.; Crescentini, L.; Berrino, G. Simultaneous inversion of deformation and gravity changes in a horizontally layered half-space: Evidences for magma intrusion during the 1982–1984 unrest at Campi Flegrei caldera (Italy). Earth Planet. Sci. Lett. 2008, 272, 181–188. [Google Scholar] [CrossRef] [Scilit]
- Woo, J.Y.L.; Kilburn, C.R.J. Intrusion and deformation at Campi Flegrei, southern Italy: Sills, dikes, and regional extension. J. Geophys. Res. 2010, 115, B12210. [Google Scholar] [CrossRef] [Scilit]
- D’Auria, L.; Pepe, S.; Castaldo, R.; Giudicepietro, F.; Macedonio, G.; Ricciolino, P.; Tizzani, P.; Casu, F.; Lanari, R.; Manzo, M.; et al. Magma injection beneath the urban area of Naples: A new mechanism for the 2012–2013 volcanic unrest at Campi Flegrei caldera. Sci. Rep. 2015, 5, 13100. [Google Scholar] [CrossRef] [Scilit] [PubMed]
- Castaldo, R.; Tizzani, P.; Solaro, G. Inflating Source Imaging and Stress/Strain Field Analysis at Campi Flegrei Caldera: The 2009–2013 Unrest Episode. Remote Sens. 2021, 13, 2298. [Google Scholar] [CrossRef] [Scilit]
- Amoruso, A.; Crescentini, L. Clues of Ongoing Deep Magma Inflation at Campi Flegrei Caldera (Italy) from Empirical Orthogonal Function Analysis of SAR Data. Remote Sens. 2022, 14, 5698. [Google Scholar] [CrossRef] [Scilit]
- Giudicepietro, F.; Casu, F.; Bonano, M.; De Luca, C.; De Martino, P.; Di Traglia, F.; Di Vito, M.; Macedonio, G.; Manunta, M.; Monterroso, F.; et al. First evidence of a geodetic anomaly in the Campi Flegrei caldera (Italy) ground deformation pattern revealed by DInSAR and GNSS measurements during the 2021–2023 escalating unrest phase. Int. J. Appl. Earth Obs. Geoinf. 2024, 132, 104060. [Google Scholar] [CrossRef] [Scilit]
- De Siena, L.; Del Pezzo, E.; Bianco, F. Seismic attenuation imaging of Campi Flegrei: Evidence of gas reservoirs, hydrothermal basins, and feeding systems. J. Geophys. Res. 2010, 115, B09312. [Google Scholar] [CrossRef] [Scilit]
- Chiodini, G.; Caliro, S.; Avino, R.; Bagnato, E.; Capecchiacci, F.; Carandente, A.; Cardellini, C.; Minopoli, C.; Tamburello, G.; Tripaldi, S.; et al. The Hydrothermal System of the Campi Flegrei Caldera, Italy. In Campi Flegrei: A Restless Caldera in a Densely Populated Area; Orsi, G., D’Antonio, M., Civetta, L., Eds.; Springer: Berlin/Heidelberg, Germany, 2022. [Google Scholar] [CrossRef] [Scilit]
- Buono, G.; Paonita, A.; Pappalardo, L.; Caliro, S.; Tramelli, A.; Chiodini, G. New insights into the recent magma dynamics under Campi Flegrei caldera (Italy) from petrological and geochemical evidence. J. Geophys. Res. Solid Earth 2022, 127, e2021JB023773. [Google Scholar] [CrossRef] [Scilit]
- Giacomuzzi, G.; Fonzetti, R.; Govoni, A.; De Gori, P.; Chiarabba, C. Causal processes of shallow and deep seismicity at Campi Flegrei caldera. Commun. Earth Environ. 2025, 6, 70. [Google Scholar] [CrossRef] [Scilit]
- Carlino, S.; Piochi, M.; Tramelli, A.; Mormone, A.; Montanaro, C.; Scheu, B.; Klaus, M. Field-scale permeability and temperature of volcanic crust from borehole data: Campi Flegrei, southern Italy. J. Volcanol. Geotherm. Res. 2018, 357, 276–286. [Google Scholar] [CrossRef] [Scilit]
- Amstutz, F.M.; Stock, M.J.; Smith, V.C.; Isaia, R.; Vitale, S.; Carter, E.J.; Natale, J. Volcano-Tectonic Controls on Magmatic Evolution at Campi Flegrei, Italy: Insights from Thermodynamic Modelling. J. Petrol. 2025, 66, egaf068. [Google Scholar] [CrossRef] [Scilit]
- Isaia, R.; Troiano, A.; Di Giuseppe, M.G.; De Paola, C.; Gottsmann, J.; Pagliara, F.; Smith, V.C.; Stock, M.J. 3D magnetotelluric imaging of a transcrustal magma system beneath the Campi Flegrei caldera, southern Italy. Commun. Earth Environ. 2025, 6, 213. [Google Scholar] [CrossRef] [Scilit]
- Battaglia, M.; Troise, C.; Obrizzo, F.; Pingue, F.; De Natale, G. Evidence for fluid migration as the source of deformation at Campi Flegrei caldera (Italy). Geophys. Res. Lett. 2006, 33, L01307. [Google Scholar] [CrossRef] [Scilit]
- Gottsmann, J.; Folch, A.; Rymer, H. Unrest at Campi Flegrei: A contribution to the magmatic versus hydrothermal debate from inverse and finite element modeling. J. Geophys. Res. Solid Earth 2006, 111, B07203. [Google Scholar] [CrossRef] [Scilit]
- Vanorio, T.; Kanitpanyacharoen, W. Rock physics of fibrous rocks akin to Roman concrete explains uplifts at Campi Flegrei Caldera. Science 2015, 349, 617–621. [Google Scholar] [CrossRef] [Scilit] [PubMed]
- Moretti, R.; De Natale, G.; Troise, C. Hydrothermal versus magmatic: Geochemical views and clues into the unrest dilemma at Campi Flegrei. In Vesuvius, Campi Flegrei, and Campanian Volcanism; De Vivo, B., Belkin, H.E., Rolandi, G., Eds.; Elsevier: Amsterdam, The Netherlands, 2020. [Google Scholar] [CrossRef] [Scilit]
- Chiodini, G.; Caliro, S.; Avino, R.; Bini, G.; Giudicepietro, F.; De Cesare, W.; Ricciolino, P.; Aiuppa, A.; Cardellini, C.; Petrillo, Z.; et al. Hydrothermal pressure-temperature control on CO2 emissions and seismicity at Campi Flegrei (Italy). J. Volcanol. Geotherm. Res. 2021, 414, 107245. [Google Scholar] [CrossRef] [Scilit]
- Giacomuzzi, G.; Chiarabba, C.; Bianco, F.; De Gori, P.; Piana Agostinetti, N. Tracking transient changes in the plumbing system at Campi Flegrei Caldera. Earth Planet. Sci. Lett. 2024, 637, 118744. [Google Scholar] [CrossRef] [Scilit]
- Tizzani, P.; Fernández, J.; Vitale, A.; Escayo, J.; Barone, A.; Castaldo, R.; Pepe, S.; De Novellis, V.; Solaro, G.; Pepe, A.; et al. 4D imaging of the volcano feeding system beneath the urban area of the Campi Flegrei caldera. Remote Sens. Environ. 2024, 315, 114480. [Google Scholar] [CrossRef] [Scilit]
- Carlino, S. The contradictions and debates around Bradyseism at Campi Flegrei caldera. Bull. Volcanol. 2026, 88, 58. [Google Scholar] [CrossRef] [Scilit]
- Pepe, A.; Sansosti, E.; Berardino, P.; Lanari, R. On the generation of ERS/ENVISAT DInSAR time-series via the SBAS technique. IEEE Geosci. Remote Sens. Lett. 2005, 2, 265–269. [Google Scholar] [CrossRef] [Scilit]
- Manconi, A.; Walter, T.R.; Manzo, M.; Zeni, G.; Tizzani, P.; Sansosti, E.; Lanari, R. On the effects of 3-D mechanical heterogeneities at Campi Flegrei caldera, southern Italy. J. Geophys. Res. Solid Earth 2010, 115, B08405. [Google Scholar] [CrossRef] [Scilit]
- D’Auria, L.; Giudicepietro, F.; Martini, M.; Lanari, R. The 4D imaging of the source of ground deformation at Campi Flegrei caldera (southern Italy). J. Geophys. Res. Solid Earth 2012, 117, B08209. [Google Scholar] [CrossRef] [Scilit]
- Amoruso, A.; Crescentini, L.; Sabbetta, I. Paired deformation sources of the Campi Flegrei caldera (Italy) required by recent (1980–2010) deformation history. J. Geophys. Res. Solid Earth 2014, 119, 858–879. [Google Scholar] [CrossRef] [Scilit]
- Amoruso, A.; Crescentini, L. DInSAR Data Reveal an Intriguing Contemporaneous Onset of Deep Deflation below Vesuvio and the Ongoing Campi Flegrei Uplift. Remote Sens. 2023, 15, 3038. [Google Scholar] [CrossRef] [Scilit]
- Amoruso, A.; Salicone, G.; Crescentini, L. Campi Flegrei and Vesuvio, Italy: Ground Deformation Between ERS/ENVISAT and Sentinel-1 Missions from RADARSAT-2 Imagery. Remote Sens. 2025, 17, 3268. [Google Scholar] [CrossRef] [Scilit]
- Giudicepietro, F.; Casu, F.; Bonano, M.; De Luca, C.; De Martino, P.; Di Traglia, F.; Di Vito, M.; Macedonio, G.; Manunta, M.; Monterroso, F.; et al. Geodetic Anomaly Detection and Analysis in the Campi Flegrei Caldera (Italy) Deformation Pattern of the 2021–2023 Escalating Unrest Phase. 2024. Available online: https://zenodo.org/records/10781496 (accessed on 3 June 2026).
- Amoruso, A.; Marzocchi, W.; Crescentini, L. Inaccurate DInSAR Time Series Underlie the Purported Evidence of a Recent, Rapid Ascent of a Magmatic Body in the Campi Flegrei Caldera (Italy). Remote Sens. 2025, 17, 3777. [Google Scholar] [CrossRef] [Scilit]
- Casu, F.; Manzo, M.; Lanari, R. A quantitative assessment of the SBAS algorithm performance for surface deformation retrieval from DInSAR data. Remote Sens. Environ. 2006, 102, 195–210. [Google Scholar] [CrossRef] [Scilit]
- Pepe, A.; Calò, F. A Review of Interferometric Synthetic Aperture RADAR (InSAR) Multi-Track Approaches for the Retrieval of Earth’s Surface Displacements. Appl. Sci. 2017, 7, 1264. [Google Scholar] [CrossRef] [Scilit]
- Ou, Q.; Daout, S.; Weiss, J.R.; Shen, L.; Lazecký, M.; Wright, T.J.; Parsons, B.E. Large-scale interseismic strain mapping of the NE Tibetan plateau from Sentinel-1 interferometry. J. Geophys. Res. Solid Earth 2022, 127, e2022JB024176. [Google Scholar] [CrossRef] [Scilit]
- Amoruso, A.; Gualandi, A.; Crescentini, L. On the Initial Phase of the Ongoing Unrest at Campi Flegrei and Its Relation with Subsidence at Vesuvio (Italy). Remote Sens. 2024, 16, 1717. [Google Scholar] [CrossRef] [Scilit]
- INGV RING Working Group. Rete Integrata Nazionale GPS (RING); Istituto Nazionale di Geofisica e Vulcanologia: Rome, Italy, 2016. [Google Scholar] [CrossRef] [Scilit]
- Giudicepietro, F.; Avino, R.; Bellucci Sessa, E.; Bevilacqua, A.; Bonano, M.; Caliro, S.; Casu, F.; De Cesare, W.; De Luca, C.; De Martino, P.; et al. Burst-like swarms in the Campi Flegrei caldera accelerating unrest from 2021 to 2024. Nat. Commun. 2025, 16, 1548. [Google Scholar] [CrossRef] [Scilit] [PubMed]
- Bianchi, R.; Coradini, A.; Federico, C.; Giberti, G.; Lanciano, P.; Pozzi, J.P.; Sartoris, G.; Scandone, R. Modeling of surface deformation in volcanic areas: The 1970–1972 and 1982–1984 crises of Campi Flegrei, Italy. J. Geophys. Res. Solid Earth 1987, 92, 14139–14150. [Google Scholar] [CrossRef] [Scilit]
- De Natale, G.; Troise, C.; Pingue, F. A mechanical fluid-dynamical model for ground movements at Campi Flegrei caldera. J. Geodyn. 2001, 32, 487–517. [Google Scholar] [CrossRef] [Scilit]
- Giudicepietro, F.; Ricciolino, P.; Bianco, F.; Caliro, S.; Cubellis, E.; D’Auria, L.; De Cesare, W.; De Martino, P.; Esposito, A.M.; Galluzzo, D.; et al. Campi Flegrei, Vesuvius and Ischia Seismicity in the Context of the Neapolitan Volcanic Area. Front. Earth Sci. 2021, 9, 662113. [Google Scholar] [CrossRef] [Scilit]
- Amoruso, A.; Crescentini, L. Modelling deformation due to a pressurized ellipsoidal cavity, with reference to the Campi Flegrei caldera, Italy. Geophys. Res. Lett. 2011, 38, L01303. [Google Scholar] [CrossRef] [Scilit]
- Zollo, A.; Maercklin, N.; Vassallo, M.; Dello Iacono, D.; Virieux, J.; Gasparini, P. Seismic reflections reveal a massive melt layer feeding Campi Flegrei caldera. Geophys. Res. Lett. 2008, 35, L12306. [Google Scholar] [CrossRef] [Scilit]
- Ortega-Ramos, V.; D’Auria, L.; Granja-Bruña, J.L.; Cabrera-Pérez, I.; Pappalardo, L.; Buono, G.; Pérez, N.M. Magma storage depths and crustal-upper mantle structure of Campi Flegrei caldera (Southern Italy) unveiled through receiver functions analysis. Sci. Rep. 2026, in press. [Google Scholar] [CrossRef] [Scilit] [PubMed]
- Caliro, S.; Chiodini, G.; Avino, R.; Carandente, A.; Cuoco, E.; Di Vito, M.A.; Minopoli, C.; Rufino, F.; Santi, A.; Lages, J.; et al. Escalation of caldera unrest indicated by increasing emission of isotopically light sulfur. Nat. Geosci. 2025, 18, 167–174. [Google Scholar] [CrossRef] [Scilit]
- Piochi, M.; Mormone, A.; Solomita, G.; Moretti, R. Sassolite precipitation at the restless Campi Flegrei volcano in Italy points to hydrothermal flashing by deep boron-rich brines. J. Geophys. Res. Solid Earth 2025, 130, e2025JB032197. [Google Scholar] [CrossRef] [Scilit]
- Zhang, J.; Bock, Y.; Johnson, H.; Fang, P.; Williams, S.; Genrich, J.; Wdowinski, S.; Behr, J. Southern California permanent GPS geodetic array: Error analysis of daily position estimates and site velocities. J. Geophys. Res. Solid Earth 1997, 102, 18035–18055. [Google Scholar] [CrossRef] [Scilit]
- De Landro, G.; Vanorio, T.; Virieux, J.; Zollo, A. 3D structure and dynamics of Campi Flegrei enhance multi-hazard assessment. Nat. Commun. 2025, 16, 481412. [Google Scholar] [CrossRef] [Scilit] [PubMed]
- Buono, G.; Maccaferri, F.; Pappalardo, L.; Tramelli, A.; Caliro, S.; Chiodini, G.; Pinel, V.; Rivalta, E.; Spagnuolo, E.; Trasatti, E.; et al. Weak crust owing past magmatic intrusions beneath Campi Flegrei identified: The engine for bradyseismic movements? AGU Adv. 2025, 6, e2024AV001611. [Google Scholar] [CrossRef] [Scilit]
- Pepe, A.; Yang, Y.; Manzo, M.; Lanari, R. Improved EMCF-SBAS processing chain based on advanced techniques for the noise-filtering and selection of small baseline multi-look DInSAR interferograms. IEEE Trans. Geosci. Remote Sens. 2015, 53, 4394–4417. [Google Scholar] [CrossRef] [Scilit]
- Manunta, M.; De Luca, C.; Zinno, I.; Casu, F.; Manzo, M.; Bonano, M.; Fusco, A.; Pepe, A.; Onorato, G.; Berardino, P.; et al. The Parallel SBAS Approach for Sentinel-1 Interferometric Wide Swath Deformation Time-Series Generation: Algorithm Description and Products Quality Assessment. IEEE Trans. Geosci. Remote Sens. 2019, 57, 6259–6281. [Google Scholar] [CrossRef] [Scilit]

Disclaimer/Publisher’s Note: The statements, opinions and data contained in all publications are solely those of the individual author(s) and contributor(s) and not of MDPI and/or the editor(s). MDPI and/or the editor(s) disclaim responsibility for any injury to people or property resulting from any ideas, methods, instructions or products referred to in the content. |
© 2026 by the authors. Licensee MDPI, Basel, Switzerland. This article is an open access article distributed under the terms and conditions of the Creative Commons Attribution (CC BY) license.