1. Introduction
Due to their high maneuverability, ease of deployment, and low operational cost, UAVs have recently become an important platform for acquiring geospatial information. The rapid advancement of UAV technology has extended geospatial data collection beyond traditional ground surveying and satellite remote sensing to high-frequency, low-altitude observations in near-surface environments, thereby significantly enriching the spatial and temporal dimensions of geospatial information acquisition [
1]. Owing to these advantages, UAVs have been widely employed in a variety of applications, including mapping and surveying, disaster response, ecological monitoring, and military reconnaissance [
2,
3], where they play an increasingly indispensable role.
However, with the diversification of UAV missions and the growing complexity of operating environments, the reliability of geo-localization and navigation has become a critical factor affecting both system performance and mission success. Currently, most UAV geo-localization systems heavily rely on Global Navigation Satellite System (GNSS) measurements for position estimation. However, in practical applications, the availability and integrity of GNSS signals cannot always be guaranteed. Complex terrain, dense urban infrastructure, and harsh electromagnetic environments often degrade signal quality through blocking, interference, or spoofing, thereby reducing geo-localization accuracy and even causing geo-localization failure.
Spurred by continuous advancements in onboard sensors and deep learning algorithms, a multitude of UAV geo-localization methods have been proposed for GNSS-denied environments [
4,
5], among which visual geo-localization has emerged as a prominent solution for geo-localization and navigation [
6,
7,
8]. Visual geo-localization technology is gaining increasing attention, primarily due to the numerous advantages of visual sensors, such as small size, low power consumption, and rich information content. Unlike traditional navigation sensors, cameras can directly observe scene structure and surface features, thereby extracting geometric, textural, and semantic information from the environment. This information can be used to establish a reliable correspondence between observed and reference data, thus supporting precise geo-localization and navigation. With their powerful environmental perception capabilities, visual geo-localization systems have demonstrated remarkable effectiveness across a range of complex application scenarios.
Feature-based matching is currently the mainstream method for visual geo-localization. This method achieves absolute geo-localization of UAVs by extracting and matching features from real-time aerial images and pre-stored satellite images [
9]. Specifically, this method establishes affine transformation relationships between heterogeneous images to determine a UAV’s pixel coordinates on a satellite base map. Subsequently, these coordinates are converted into absolute latitude and longitude using the pre-registered geographic information in the satellite images. Traditional representative feature matching algorithms, such as ORB [
10], SIFT [
11], and SURF [
12], have been widely used in UAV geo-localization frameworks, including Simultaneous Localization and Mapping (SLAM) and visual odometry. In recent years, deep learning-based matching methods have also been widely used. Compared with traditional manual techniques, deep learning methods (such as SuperPoint [
13], SuperGlue [
14], and LoFTR [
15]) show significantly stronger capabilities in deep feature extraction and robust representation.
However, single-modal sensors have inherent limitations in environmental perception, especially for UAV applications that require nighttime operations. In low- and no-light conditions, visible-light cameras cannot provide comprehensive situational awareness, thereby limiting the UAV’s ability to achieve accurate geo-localization across various scenarios. To establish robust all-weather autonomous geo-localization, this paper proposes a multi-modal fusion framework that integrates visible light and thermal infrared sensors, aiming to significantly improve geo-localization accuracy in environments with degraded lighting.
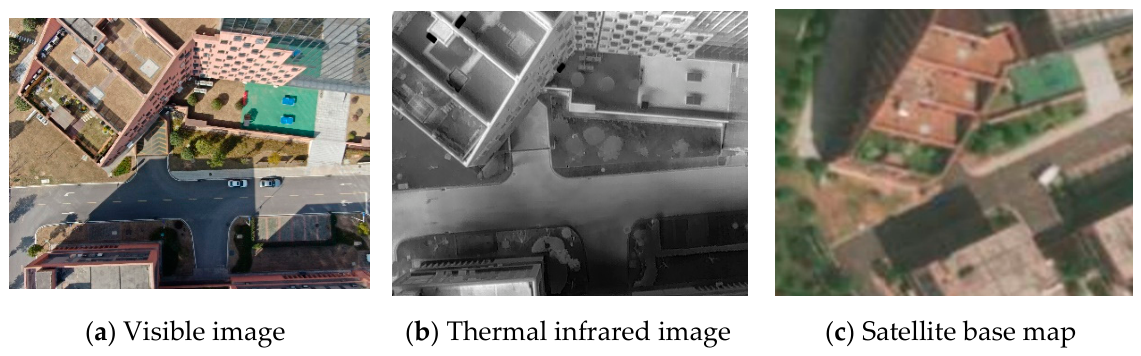
Despite its potential, fusing visible light and thermal infrared modes to achieve all-weather autonomous geo-localization poses several significant challenges. First, there are significant modal differences between visible light and thermal infrared images, manifested in considerable differences in color, texture, and brightness. Taking the UAV-captured images shown in
Figure 1 as an example,
Figure 1a and
Figure 1b show the visible light and thermal infrared images acquired by the UAV, respectively, while
Figure 1c shows the satellite base map corresponding to the survey area. Clearly, the visible-light image reveals rich background details, while the thermal infrared image presents clearer geometric structure and boundaries, making its overall semantic content relatively simple. Furthermore, visible light images are highly susceptible to changes in lighting conditions, often resulting in large areas of shadow. In contrast, thermal infrared images are almost unaffected by such shadow-induced image-quality degradation. However, due to their unique radiation characteristics, infrared sensors typically perform poorly in vegetation imaging.
Another key issue with thermal infrared imagery is its relatively low spatial resolution. Taking the sensor payload integrated into the DJI M300 UAV platform (SZ DJI Technology Co., Ltd., Shenzhen, China) as an example, at the same field of view, a visible light camera can achieve a high imaging resolution of 4970 × 3727 pixels. In contrast, a thermal infrared camera achieves only 640 × 512 pixels. Furthermore, although the satellite base map shown in
Figure 1c has a fine ground sampling distance of 0.3 m, its structural details still differ significantly from those of the low-altitude UAV image. Given such significant scale variations and resolution differences, even deep learning methods struggle to establish robust cross-modal correspondences, thus failing to meet the stringent accuracy requirements of visual geo-localization.
In summary, existing vision-based geo-localization methods still face significant limitations in meeting the geo-localization requirements of autonomous UAVs under low- and no-light conditions. Firstly, visible light images suffer severe visual degradation at night or in low-light conditions, rendering them unable to provide robust, reliable feature representations. Secondly, thermal infrared images and satellite optical base maps exhibit significant modal differences in their imaging mechanisms, radiometric responses, and texture representations. These fundamental differences hinder direct matching of cross-modal features. Furthermore, the inherently low spatial resolution of thermal infrared sensors severely limits matching accuracy and overall geo-localization robustness. To overcome these challenges, we proposed a cross-modal super-resolution matching and geo-localization method based on geographic consistency constraints to enhance the high-precision visual geo-localization capabilities of UAVs in low-light environments. Unlike conventional pipelines that treat image translation, super-resolution, and matching as independent preprocessing steps, the proposed framework is explicitly designed for cross-modal UAV geo-localization under low-light conditions. The core challenge is not only to improve image appearance, but also to preserve geospatial structures that are critical for reliable correspondence estimation and final position inference. To address this issue, we jointly optimize geographic consistency preservation, thermal detail enhancement, and dense matching in a unified geo-localization framework. The main contributions of this paper are summarized below:
- (1)
A geo-localization-oriented geographic consistency-constrained normalization module for cross-modal UAV geo-localization is proposed. Unlike conventional style transfer methods that primarily aim for visual realism, the proposed module explicitly preserves spatial layout, semantic categories, and geometric structure during satellite-to-thermal translation. This design reduces cross-modal appearance discrepancies while preserving geospatial information that is essential for reliable matching.
- (2)
A thermal infrared super-resolution enhancement module to improve matching discriminability, rather than visual quality alone, was developed. By recovering fine-grained edges and local structures in low-resolution thermal images, the proposed module increases the number and stability of matchable features, especially in weak-texture and low-light scenes where conventional matching methods often fail.
- (3)
An end-to-end cross-modal dense matching and geo-localization framework was designed. This unified architecture integrates image normalization, super-resolution enhancement, and a coarse-to-fine dense matching strategy to achieve high-precision image registration and pose estimation between thermal infrared and satellite images. Extensive experiments on a custom dataset and real-world flight scenarios comprehensively validate the efficacy and robustness of the proposed method.
2. Related Work
Feature point matching models are a core component of visual geo-localization frameworks. Numerous mature research results have been produced in this area. Most visual geo-localization systems based on feature point matching leverage existing models to improve scene adaptation, enabling migration across application scenarios.
Currently, feature matching algorithms can be broadly classified into two categories. The first category is traditional image matching methods based on handcrafted features, which typically rely on corner and blob extractors. The concept of corner features is defined as the intersection of two structural edges, which can be detected by evaluating local gradients, pixel intensity, and curvature. The Harris operator [
16] is a typical gradient-based feature detection method. It uses a second-order moment matrix to identify the direction corresponding to the maximum and minimum values of the intensity change rate. The FAST [
17] detector is based directly on pixel intensity comparisons and offers significant advantages in computational efficiency and algorithmic robustness. Based on these foundations, the ORB [
10] algorithm combines the FAST [
17] detector with the BRIEF [
18] descriptor. As a strength-based binary descriptor, BRIEF exhibits excellent robustness; this strategic integration ultimately endows the ORB algorithm with key characteristics, including rotation invariance and real-time processing capabilities.
Blob features typically correspond to local regions in an image with similar intensity distributions. Currently, second-order partial derivatives and image segmentation are the two main methods for extracting blob features. SIFT [
11] and SURF [
12] are basic algorithms built on second-order partial derivatives. As one of the most widely used image matching techniques, SIFT exhibits strong scale and rotation invariance and maintains high geometric accuracy across various scenarios. SURF, as an accelerated version of SIFT, improves computational efficiency, making it well-suited for real-time vision systems. The maximum stable extremum region [
19] is a typical region-based method that extracts stable blob features by identifying regions that remain stable across a wide range of intensity thresholds. It is very robust to viewpoint changes and geometric transformations. These traditional handcrafted methods are based on rigorous theoretical foundations and exhibit excellent performance in standard matching scenarios. However, due to significant differences in image quality, structural gradients, pixel intensities, and viewpoints between UAV imagery and satellite base maps, handcrafted descriptors extracted from these heterogeneous data sources exhibit inconsistent features. Therefore, traditional image matching algorithms often fail to establish reliable correspondences, making them difficult to apply in robust cross-modal visual geo-localization.
By extracting high-level representations with CNNs, deep learning-based image matching algorithms can capture robust semantic features, making them the mainstream paradigm for modern visual geo-localization frameworks. Existing deep learning-based matching methods can be broadly divided into two categories: feature-point-based methods and end-to-end dense matching methods. Feature point detection-based methods first extract significant local features from the input image to form discrete feature points. A common extraction strategy in this process is to select local maxima on different feature dimensions. Yi et al. [
20] implemented feature point extraction based on deep learning, which significantly improved performance compared to traditional manual methods. DeTone et al. [
13] proposed SuperPoint, a self-supervised framework for joint interest point detection and descriptor learning, which achieved excellent matching performance. Subsequently, a large number of self-supervised keypoint extraction architectures emerged rapidly [
21,
22,
23,
24]. In contrast, end-to-end image matching methods bypass explicit keypoint extraction and directly output dense correspondences from the extracted feature maps. Liu et al. [
25] proposed an end-to-end SIFT Flow method that uses local SIFT descriptors to achieve dense image matching. Subsequently, Choy et al. [
26] designed a deep learning-based feature matching architecture, using nearest-neighbor search as a post-processing step to establish dense feature correspondences. However, this nearest-neighbor matching paradigm often lacks sufficient robustness in complex scenarios. To solve this problem, Rocco et al. [
27] proposed NCNet, a fully end-to-end framework that explicitly integrates a consensus matching module. This model seamlessly unifies feature extraction and correlation estimation, significantly improving the overall matching performance. However, the computational efficiency of NCNet remains suboptimal. Therefore, DRC-Net [
28] introduced a coarse-to-fine matching strategy that effectively improves computational efficiency while strictly maintaining high matching accuracy.
The Transformer architecture [
29] has achieved success in the field of computer vision, and Transformer-based methods have become the main research direction in the feature matching domain. Sarlin et al. [
14] proposed a local feature matching method, SuperGlue. SuperGlue adopts a keypoint-based architecture, takes two sets of keypoints and their corresponding descriptors as input, and uses graph neural networks (GNNs) to learn correspondences, thereby improving feature matching performance. Subsequently, Sun et al. [
15] focused on integrating the Transformer architecture into the end-to-end image matching paradigm and proposed the famous LoFTR model. LoFTR utilizes the inherent self-attention and cross-attention mechanisms of Transformer to significantly enhance feature representations and achieve excellent performance across multiple benchmark datasets. In addition, given the Transformer model’s excellent feature extraction capabilities, MatchFormer [
30] was proposed to directly apply Transformer to dense correspondence estimation, thereby further optimizing the model’s computational efficiency.
As visual geo-localization tasks have gradually expanded from daytime scenes to low-light environments such as night and dusk, robust matching and geo-localization under low-light conditions have attracted increasing attention from researchers. Existing research can be broadly divided into three main directions: image enhancement, cross-modal perception, and multi-source information fusion.
The first category of methods aims to improve the visual quality of low-light images through image enhancement techniques, including illumination enhancement, denoising, deblurring, and image restoration [
31]. These methods improve image visibility, which is helpful for subsequent feature extraction and matching processes. However, most enhancement-based methods primarily focus on improving visual appearance and often struggle to simultaneously preserve structural information, edge details, and topological relationships among ground objects. Therefore, feature distortion and unstable correspondence estimation may still occur in practical geo-localization applications.
The second category of methods uses infrared, thermal infrared, or other non-visible spectral sensors to directly perceive the environment under low-light conditions, thereby avoiding the inherent dependence of visible light imaging on ambient light [
9]. Due to their all-weather sensing capabilities, these methods show great potential for nighttime geo-localization. However, infrared images and satellite optical images still differ significantly in imaging mechanisms, texture distribution, radiation characteristics, and appearance statistics. These modal differences make direct feature alignment particularly difficult, thereby limiting matching accuracy and robustness in geo-localization.
The third type of approach aims to improve geo-localization performance in low-light environments by fusing complementary information from multiple sensing modalities, such as visible and infrared images [
5]. By leveraging the advantages of different sensors, multi-modal fusion methods generally achieve more reliable environmental perception than single-modal methods. However, these methods typically require additional sensing hardware, precise sensor calibration, and complex registration procedures, thus increasing system cost and deployment complexity.
Although visual matching provides an effective means of geo-localization, GNSS remains the fundamental source of absolute geo-localization for UAV navigation. The final accuracy of GNSS-based geo-localization is highly dependent on the quality of satellite orbit and clock products used in the solution process. Compared with broadcast ephemeris, precise orbit and clock products generated by analysis centers and distributed through the International GNSS Service (IGS) can significantly reduce range modeling errors and improve geo-localization accuracy [
32]. In addition, State Space Representation (SSR) corrections have become increasingly important in real-time applications because they can provide compact orbit, clock, and related auxiliary corrections with low latency, thereby supporting high-precision navigation under dynamic flight conditions [
33]. For advanced GNSS geo-localization frameworks such as PPP, RTK, and PPP-RTK, the continuity, timeliness, and reliability of these products directly determine the quality of the final solution [
34]. Therefore, high-quality GNSS products are particularly critical for UAV applications, where rapid motion, limited satellite visibility, and frequent signal disturbances can amplify orbit- and clock-related errors. Recent studies have thus emphasized the use of precise GNSS products to enhance the robustness and accuracy of UAV geo-localization in challenging environments [
35].
In summary, despite significant progress in visual geo-localization in low-light environments, several common challenges remain. First, visible light images suffer severe feature degradation under low-light conditions, fundamentally weakening matching stability. Second, significant cross-modal differences exist between thermal infrared images and satellite optical base maps, making direct feature matching extremely difficult. Third, thermal infrared sensors inherently have low spatial resolution and insufficient local detail, making it difficult to support high-precision geo-localization. Especially when performing cross-modal matching between thermal infrared images acquired by UAVs and satellite optical base maps, effectively bridging modal differences and enhancing detail representation while strictly maintaining geographical structural consistency remains a critical challenge to be addressed.
3. Methodology
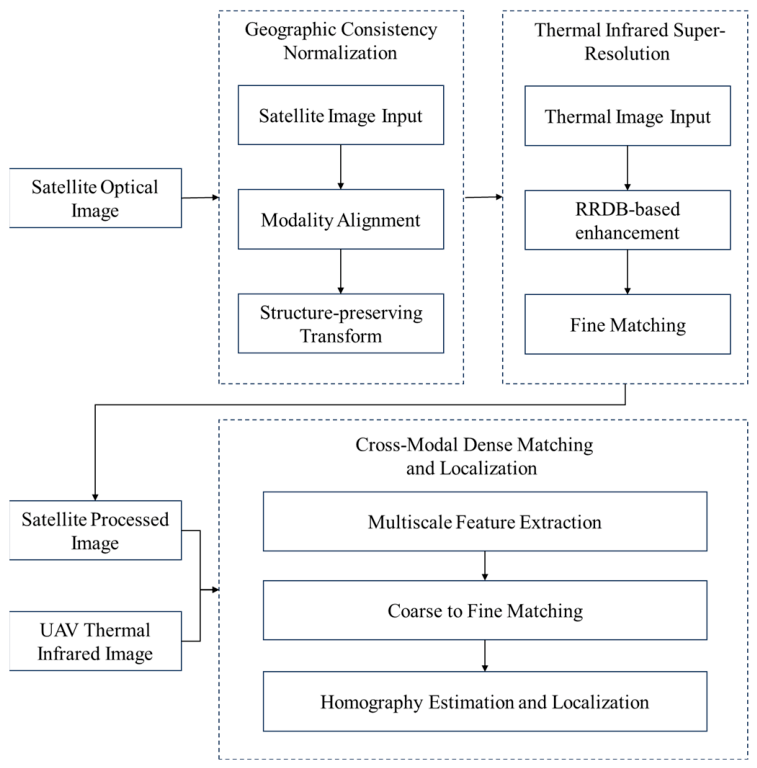
As a result of profound disparities between UAV-captured thermal infrared imagery and satellite optical base maps in terms of imaging mechanisms, spatial resolutions, texture patterns, and radiometric distributions, direct cross-modal feature matching often yields sparse correspondences, high mismatch rates, and unstable geo-localization performance. To circumvent these critical bottlenecks, this paper constructs a novel three-stage geo-localization framework; the workflow is depicted in
Figure 2. Specifically, the workflow proceeds as follows: First, a style-transfer-based translation mechanism is employed to map the satellite optical imagery into a unified representation space. This transformation closely approximates the statistical distribution of the thermal infrared data whilst strictly preserving inherent terrain structures and geometric relationships. Subsequently, super-resolution enhancement is applied to the UAV thermal infrared imagery to substantially augment its spatial details and edge discriminability. Finally, precise image registration is executed between the normalized satellite base maps and the enhanced thermal infrared images, from which the final geographic position is derived via robust geometric estimation. It should be emphasized that the proposed framework is not a simple cascade of image translation, super-resolution, and matching modules. Instead, each component is specifically designed to solve a distinct bottleneck in cross-modal UAV geo-localization. The normalization module reduces modality discrepancy while preserving geographic layout, the super-resolution module restores missing thermal details to improve feature discriminability, and the dense matching module leverages these refined representations to produce more reliable correspondences and more accurate pose estimation.
3.1. Geographic Consistency-Constrained Satellite Image Normalization Module
In cross-modal UAV geo-localization, the normalization module is expected not only to generate thermal-like images but also to preserve the geospatial structures that are essential for geo-localization. Due to significant discrepancies between UAV-acquired thermal infrared imagery and satellite optical imagery in terms of imaging mechanisms, radiometric distributions, texture representations, and appearance statistics, direct cross-modal matching often leads to inconsistent feature responses, sparse correspondences, and a high mismatch rate. To mitigate the impact of cross-modal discrepancies on geo-localization performance, a geographic consistency-constrained satellite image normalization module is proposed. Concurrently, this module aims to project satellite optical imagery into a representation space that is more consistent with the statistical distribution of thermal infrared imagery—such as road networks, building footprints, and parcel boundaries—thereby guaranteeing that the fundamental geographic layout remains invariant during the modality translation process. The key novelty of this module lies in its geo-localization-oriented design: instead of merely transferring style, it preserves the geographic structures—such as roads, building outlines, and parcel boundaries—that are crucial for downstream matching and position estimation.
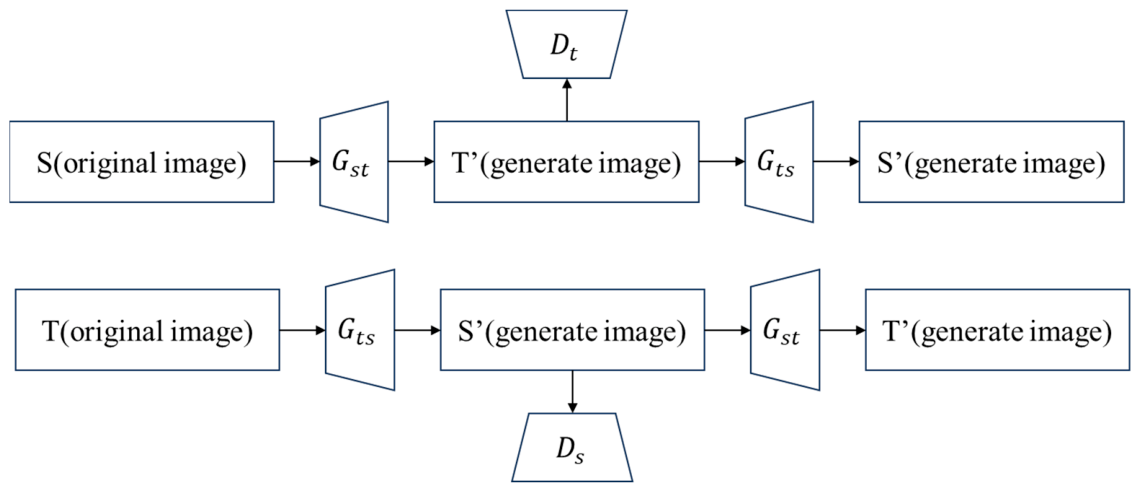
To make the notion of geographic consistency explicit, we formulate it as a structure-preserving regularization problem. The purpose of this module is not only to reduce the modality gap between satellite optical images and UAV thermal infrared observations, but also to preserve the spatial arrangement of geospatial objects that are critical for geo-localization. Therefore, the translated representation is constrained to maintain edge structures, semantic layouts, and deep feature patterns that encode scene topology and are beneficial for downstream matching. To reduce cross-modal discrepancies, an unpaired image-to-image translation strategy is first adopted to map satellite visible light imagery into the thermal infrared style domain, thereby improving its compatibility with UAV-acquired thermal infrared imagery for subsequent matching. Let the satellite optical domain be denoted as
, and the UAV thermal infrared domain be denoted as
. Two generators are defined as follows:
Specifically, the forward generator
translates satellite optical images into thermal-like images, while the reverse generator
maps thermal infrared images back to the satellite domain. Meanwhile, two discriminator networks,
and
, are introduced to distinguish between real and synthesized images in the thermal and satellite domains, respectively. During training, the normalization module first utilizes
to translate satellite optical images into the thermal-like domain. Subsequently, the translated thermal-like images are mapped back to the satellite domain using
, forming a cycle-consistent reconstruction process. The thermal discriminator
evaluates the authenticity of the generated thermal-like images, while the satellite discriminator
distinguishes real satellite images from synthesized ones. A similar adversarial learning process is applied symmetrically to the visible light images. The overall framework of the proposed module is illustrated in
Figure 3.
In contrast to conventional image style transfer methods, the proposed approach does not merely prioritize visual resemblance to the thermal infrared domain. Crucially, it also emphasizes the preservation of spatial structures that are necessary for accurate geo-localization. Consequently, we explicitly incorporate three complementary constraints—gradient consistency, semantic consistency, and feature consistency—into the image generation process. These constraints are designed to prevent boundary blurring and topological distortion induced by cross-modal translation.
Specifically, the gradient consistency term is formulated to retain high-frequency structural details, including road networks, building footprints, and parcel boundaries. Let
and
denote the original satellite image and the normalized output image, respectively. This process can be formulated as follows,
where
denotes the satellite image normalization generator.
An adversarial loss is introduced to encourage the translated images to match the distribution of real thermal infrared images. The corresponding adversarial objective can be formulated as follows:
where
denotes the discriminator of the normalized domain.
A gradient consistency loss is introduced to preserve high-frequency spatial structures, including road networks, building boundaries, and parcel edges. The corresponding gradient consistency loss is defined as
where
denotes the image gradient operator.
A semantic consistency loss is introduced to ensure that the semantic layout of land-cover categories remains consistent before and after translation.
where
denotes a pre-trained semantic feature extraction network.
A feature consistency loss is further introduced to preserve the spatial layout and deep structural representations of the same geographic region before and after translation.
where
denotes the intermediate feature representation extracted by the shared encoder.
By integrating the aforementioned constraints, the overall objective function of the normalization module can be formulated as
Through the proposed module, satellite imagery is transformed to exhibit thermal-like appearance characteristics while preserving the underlying geographic structure. This provides a robust foundation for subsequent super-resolution enhancement and dense cross-modal matching.
3.2. Thermal Infrared Image Super-Resolution Enhancement Module
Although the satellite base maps and thermal infrared images achieve greater visual resemblance following the style translation process, a significant spatial resolution discrepancy persists between the low-resolution thermal infrared images and the high-resolution satellite crops. This resolution gap inherently leads to a deficiency in local textures and edge details, thereby fundamentally constraining the ultimate matching accuracy. To systematically address this limitation, a single-image super-resolution approach is further employed to elevate the spatial resolution and detail representation capabilities of the thermal infrared imagery. Unlike general super-resolution methods that focus on perceptual quality, this module is specifically optimized to enhance fine structures and edge details most useful for cross-modal matching, thereby improving correspondence stability in weak-texture areas.
Specifically, this module leverages a generator based on the Residual-in-Residual Dense Block (RRDB) [
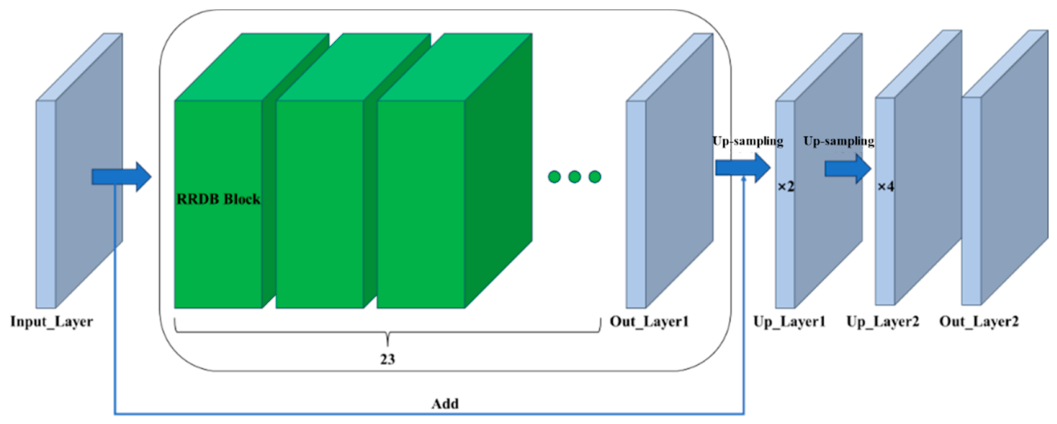
36] architecture, a separate discriminator for adversarial training, and a pre-trained VGG19 network for perceptual feature extraction. The RRDBNet architecture integrates residual learning and dense connectivity, enabling effective hierarchical feature fusion through stacked residual blocks and dense feature interactions. This design significantly enhances the network’s ability to learn and represent fine-grained image details. Furthermore, RRDBNet incorporates deconvolutional layers to progressively upsample low-resolution feature maps into high-resolution outputs, thereby actualizing the desired super-resolution effect. This architectural design enables RRDBNet to optimally preserve fine-grained structural information, substantially improving overall image quality and perceptual clarity. Owing to its exceptional generative performance, RRDBNet has been widely deployed in image processing, yielding remarkable results across diverse super-resolution tasks. The detailed architecture of this super-resolution model is illustrated in
Figure 4.
The model input is a three-channel image, which is first processed by an input convolutional layer (Input_Layer) consisting of 64 convolutional filters with a kernel size of (3 × 3). The extracted feature maps are then fed into the RRDBs for deep feature representation learning. An intermediate convolutional layer (Out_Layer1), also composed of 64 filters with a kernel size of (3 × 3), is employed to further refine the extracted features. The resulting feature maps are subsequently upsampled to generate super-resolved images at multiple scales. In this study, a (×4) spatial resolution enhancement is adopted along both the height and width dimensions, resulting in a total (×16) super-resolution output. Two successive upsampling layers (Up_Layer) are utilized for this purpose, each consisting of (3 × 3) convolutional kernels with 64 feature channels. Finally, an output convolutional layer (Out_Layer2) is used to reconstruct the feature representation into a three-channel RGB super-resolved image.
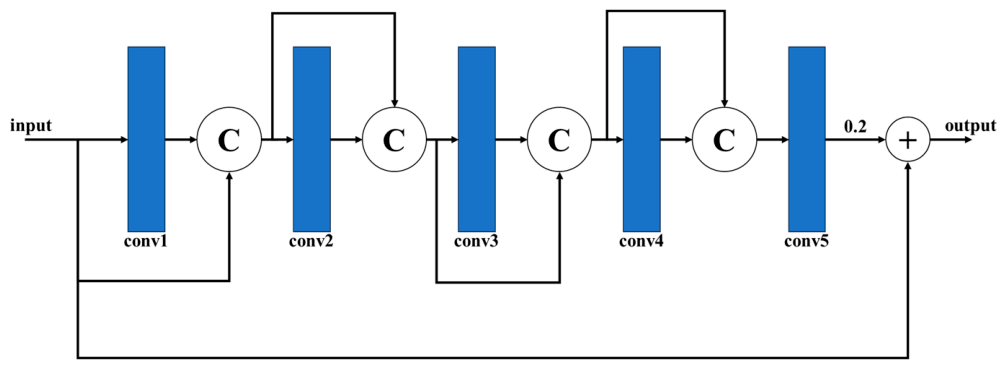
The RRDB module consists of 23 stacked RRDB modules. The RRDB module integrates residual learning and dense connections to achieve efficient hierarchical feature aggregation for image super-resolution. In the RRDB network, each module fully utilizes residual learning via multiple residual connections, with skip connections used to directly connect the input and output features. This design facilitates the learning of residual maps, alleviates the vanishing gradient problem in deep networks, and enhances the model’s ability to represent fine-grained image details. Furthermore, the RRDB structure introduces dense connections, in which the input of each layer is connected to the outputs of all previous layers along the channel dimension, thereby forming dense feature interactions. Compared to purely residual-based architectures, dense connections enable more comprehensive feature reuse, enhance feature propagation, and improve computational efficiency by reducing redundant parameters. The detailed structure of the RRDB module is shown in
Figure 5. Each RRDB unit consists of five convolutional layers with a kernel size of (3 × 3). The channel dimensions for intermediate feature expansion are set to [64, 96, 128, 160, 192], with corresponding output channels of [32, 32, 32, 32, 64]. The symbol “C” in
Figure 5 represents channel concatenation in the dense connections used for feature fusion. Given an input feature map of size ([B, 64, H, W]), the first convolutional layer (Conv1) generates features of size ([B, 32, H, W]). These features are then concatenated with the original input along the channel dimensions to obtain a tensor of size ([B, 96, H, W]), which serves as the input to the next convolutional layer (Conv2). This process is repeated across subsequent layers, progressively increasing feature dimensions while enhancing feature interactions. Each RRDB module consists of three tightly connected residual structures arranged in a concatenated manner.
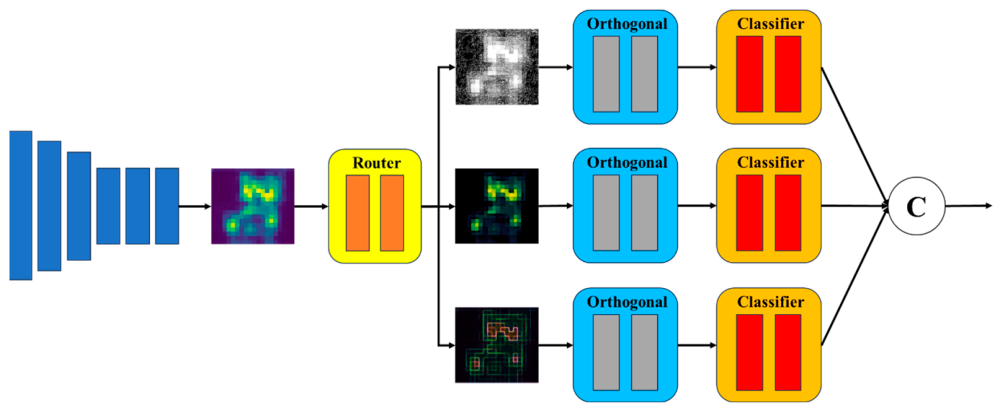
In adversarial learning-based super-resolution frameworks, a dedicated discriminator is typically used for binary real/fake classification, while a pre-trained VGG-based network is commonly employed for perceptual feature extraction. However, this architecture has a significant limitation: real-world image distributions are highly complex, with significant intra-class differences. Therefore, a single discriminator is often insufficient to effectively model the diversity of real-world data distributions, limiting its ability to accurately distinguish between real and synthetic samples under different visual modes. This problem can lead to a decline in discriminative performance. To address this issue, this paper proposes a thermal infrared image super-resolution enhancement module employing a multi-constraint joint optimization strategy. In this framework, multiple discriminators are introduced to improve the robustness of adversarial training. Unlike relying on a single global discriminator, this framework decomposes the complex data distribution into multiple sub-distributions based on image content and assigns each discriminator a specific subset of data to process. The overall architecture of this multi-discriminator training framework is shown in
Figure 6.
As illustrated in
Figure 6, the complex distribution of natural images is decomposed into multiple sub-distributions, enabling the model to more effectively capture the specific image features and contextual information inherent to each subset. Correspondingly, each subset is assigned a dedicated discriminator, which is independently trained to assess the authenticity of images from its specific distribution. The synergistic use of multiple discriminators substantially improves overall classification accuracy between real and synthesized samples. Specifically, deep features are initially extracted from the high-resolution imagery via a CNN, yielding the initial feature map, denoted as
. Subsequently, a dedicated routing network (denoted as the Router) is employed to partition these initial features into
N distinct sub-feature representations. For the sake of visual simplicity,
N is set to 3 in the schematic diagram. The formulation of the routing network can be expressed as follows:
where
denotes the Gumbel-SoftMax function, and
represents the impulse function. Specifically, the routing decision is discretized such that
= 1 only when
. After obtaining the routing masks
, the initial feature map
is element-wise multiplied with each
to generate a set of sub-features corresponding to different data partitions. Subsequently, each sub-feature is fed into an independent discriminator for real–fake classification. Finally, the outputs of all discriminators are aggregated to obtain the final adversarial prediction, which can be formulated as follows,
where
denotes the sub-feature obtained from the routing network.
and
represent the classifier and the orthogonal convolution operator of the
i-th branch, respectively. The orthogonal convolution is introduced to enhance the decorrelation among different sub-features, thereby improving the diversity of feature representations and the generalization capability of the model.
The thermal infrared super-resolution enhancement module improves the spatial resolution and detail representation of thermal infrared images, thereby strengthening feature discriminability in low-texture regions.
3.3. Feature Matching Module
Traditional keypoint-based methods often suffer from problems such as insufficient extraction of interest points in sparse texture regions, poor matching stability, and high mismatch rates. To enhance the robustness of cross-modal geo-localization, this paper adopts an end-to-end dense matching framework. This framework does not rely on sparse keypoint detection but directly estimates pixel-level correspondences from feature representations and employs a coarse-to-fine matching strategy to achieve high-precision geo-localization. The main advantage of this matching module is that it is designed to work on the enhanced cross-modal representations produced by the previous two modules, enabling dense correspondence estimation under large modality gaps and improving robustness in scenes where keypoint-based methods are unstable.
Let
and
denote the super-resolved thermal infrared image and the normalized satellite candidate image, respectively. Initially, multi-scale feature representations are extracted via collaborative encoder networks.
where
and
represent the feature encoders dedicated to the thermal infrared branch and the satellite branch, respectively. Following feature extraction, a coarse matching phase is first executed within the low-resolution feature space to robustly establish initial region-level correspondences. Subsequently, a fine-matching phase is conducted in the high-resolution feature space to strictly refine matching errors and systematically elevate geo-localization accuracy to sub-pixel levels.
To robustly mitigate the adverse impacts of low-texture regions and anomalous feature responses on the final geometric estimation, this paper further integrates a confidence or uncertainty estimation mechanism for each established correspondence. Let the final set of matched point pairs be denoted as
where
and
denote the spatial coordinates of the corresponding points within the query image and the satellite base map, respectively, while
signifies the associated matching confidence. To incorporate this confidence metric into the optimization process, it is explicitly converted into a weighting factor
, mathematically defined as
where
indicates the estimated matching uncertainty. Ultimately, grounded in the weighted least squares criterion, the geometric transformation matrix H between the query image and the satellite candidate patch can be robustly estimated by minimizing the weighted geometric error:
Finally, a RANSAC mechanism is introduced to iteratively remove outliers, further enhancing the robustness of geometric estimation. Since satellite imagery already contains georeferenced metadata and specific map projection information, the final position estimate of the UAV can be obtained by converting latitude and longitude. Compared to traditional keypoint-based matching methods, this end-to-end dense matching framework more comprehensively leverages continuous spatial context, maintaining high matching stability and geo-localization accuracy even in challenging scenarios such as sparse textures, shadow interference, and significant cross-modal differences.
3.4. Training Strategy of the Proposed Framework
To ensure stable convergence and fully exploit the complementary roles of the proposed modules, the whole framework is trained in a staged manner rather than optimized from scratch in a single end-to-end process. Specifically, the training procedure consists of four successive steps.
First, the geographic consistency-constrained normalization module is trained using unpaired satellite optical images and thermal infrared images. In this stage, the generator and discriminator are optimized to minimize adversarial loss, cycle-consistency loss, gradient consistency loss, semantic consistency loss, and feature consistency loss. The module is trained for 150 epochs with an initial learning rate of 2 × 10⁻⁴ until the generated satellite images visually resemble thermal infrared imagery while preserving geographic structures.
Second, the thermal infrared super-resolution module is trained independently on the DIV2K dataset [
34] and then fine-tuned on thermal infrared imagery. This stage aims to recover high-frequency details and improve local discriminability in low-resolution thermal images. The super-resolution network is trained for 100 epochs on DIV2K with an initial learning rate of 1 × 10
−4, followed by 30 epochs of fine-tuning on thermal infrared data with the learning rate reduced to 5 × 10
−5. After training, the super-resolution module is fixed and used as a preprocessing component for the matching stage.
Third, the cross-modal dense matching module is trained on the MegaDepth dataset [
35] for feature correspondence learning. The encoders are initialized from pre-trained weights and optimized to learn robust coarse-to-fine dense correspondences. The matching module is trained for 30 epochs with an initial learning rate of 1 × 10
−4. During this stage, the outputs of the normalization and super-resolution modules are used as inputs, enabling the matching network to adapt to the enhanced cross-modal representation.
Finally, the complete framework is fine-tuned jointly on the constructed UAV thermal infrared and satellite dataset. In this stage, the normalization module, super-resolution module, and dense matching module are connected into a unified pipeline. The first two modules are frozen for the initial 10 epochs and then fine-tuned with a lower learning rate, while the matching module is updated alongside the main optimization objective. The final joint fine-tuning lasts for 20 epochs with an initial learning rate of 1 × 10⁻⁵ and is used to further improve geo-localization accuracy and robustness.
This staged training strategy allows each module to learn its corresponding subtask first and then adapt to the final geo-localization objective, thereby improving convergence stability and preventing error accumulation across modules.
4. Experiments
4.1. Dataset Construction
Since there are few publicly available datasets for matching geolocation drone thermal infrared images with satellite optical images, this paper collects corresponding satellite images from publicly available thermal infrared UAV datasets, and it prepares the heterogeneous image dataset required for the experiment. The main UAV thermal infrared data come from the MTV dataset [
37], a publicly available benchmark designed specifically for UAV cross-modal visual geo-localization. It provides natively paired visible light and thermal infrared image sequences. The data acquisition platform for this benchmark dataset is a DJI M300 UAV (SZ DJI Technology Co., Ltd., Shenzhen, China). Visible light images were acquired using a PSDK 102S camera (SZ DJI Technology Co., Ltd., Shenzhen, China) with a spatial resolution of 4970 × 3727 pixels, and thermal infrared images were obtained using a DJI Zenmuse H20T camera (SZ DJI Technology Co., Ltd., Shenzhen, China) with an imaging resolution of 640 × 512 pixels.
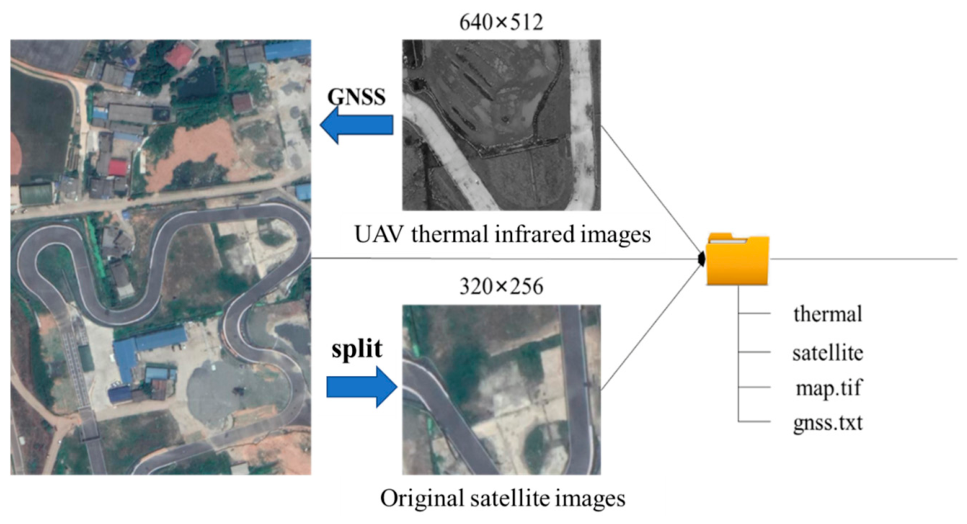
The dataset contains multiple scenes, including urban roads, parks, racetracks, and rural areas, with flight altitudes ranging from 100 m to 150 m. However, due to delays in updating historical Google satellite images corresponding to urban road scenes, there is serious spatiotemporal and content inconsistency with actual UAV flights. To ensure data integrity and experimental validity, this study only used imagery from the remaining three environments (park, racetrack, and rural areas) and manually segmented satellite images based on their GNSS coordinates.
Figure 7 illustrates the complete workflow for preparing this dataset.
Based on the GNSS coordinates embedded in the UAV imagery, the corresponding regions in the satellite base map were segmented. To ensure that the satellite imagery and the UAV thermal infrared data have similar image content, the satellite base map was cropped to a fixed size of 320 × 256 pixels. Finally, all images and GNSS coordinates were saved to form a dataset. Since the UAV flight path constitutes a continuous trajectory, to ensure the objectivity of the experiment, this paper uses park and rural data for training and racetrack data for testing and verification. The final dataset contains 229 pairs of images from park scenes, 143 pairs from rural scenes, and 60 pairs from racetrack scenes.
For the thermal infrared super-resolution enhancement module, the network was trained on the DIV2K dataset [
38]. To achieve ideal real-world super-resolution results, the model was trained on wild data from the dataset.
The end-to-end feature matching module is trained on the MegaDepth dataset [
39]. There are three reasons for using MegaDepth for pre-training. First, the MegaDepth dataset contains a large number of images, allowing for the training of more robust pre-trained models. Second, current drone and satellite image matching datasets are limited and lack corresponding ground-truth labels, making it difficult to train end-to-end matching models. Third, as the architectural depth of deep learning networks increases, the extracted feature representations progressively transition from low-level geometric primitives into high-level semantic abstractions; given the shared semantic consensus between UAV low-altitude imagery and satellite high-altitude base maps, cross-modal model transferability is highly feasible.
4.2. Evaluation Metrics
To quantitatively evaluate the visual geo-localization performance of the proposed framework under challenging low-light environments, localization error was adopted as the primary evaluation metric. Concurrently, a comprehensive multi-faceted analysis was conducted by integrating the average localization error, maximum localization error, standard deviation, 95% confidence interval, and localization success rate. For each query UAV image, the geometric transformation relationship between it and the satellite base map was first estimated based on the dense matching results. The center pixel of the UAV image was then projected onto the satellite coordinate system to obtain the predicted spatial position, denoted as
. Let
represent the corresponding ground-truth position. The geo-localization error
for the
i-th sample is defined via the Euclidean distance,
where (
,
) and (
,
) denote the coordinates of the predicted and ground-truth positions in a 2D plane coordinate system, respectively. In this study, geodetic coordinates (latitude and longitude) are explicitly converted into a planar coordinate system to calculate the physical displacement in meters.
On this basis, the average geo-localization error and standard deviation can be formulated as
where
N represents the total number of test samples. To evaluate performance bounds, the maximum geo-localization error is defined as follows:
To further evaluate the statistical reliability of the geo-localization results, a uncertainty-related metric is introduced, namely the 95% confidence interval (95% CI). This metric provides an estimated range within which the true mean geo-localization error is expected to fall with 95% confidence. A narrower confidence interval indicates a more stable and reliable estimation of the average geo-localization performance. The 95% confidence interval of the mean localization error is defined as
where
denotes the mean geo-localization error,
represents the standard deviation of geo-localization errors, and
N is the number of test samples. The coefficient 1.96 corresponds to the critical value of the standard normal distribution at the 95% confidence level.
To measure the robustness of the algorithm in complex scenarios, this paper considers samples that output valid matching results and can successfully estimate the geometric transformation matrix as having successfully located the data. If the number of matching points for a test sample is less than a set threshold, the sample is considered to have failed to locate. Therefore, the geo-localization success rate can be defined as
where
denotes the number of successfully localized samples.
In summary, this paper evaluates the geo-localization performance of different methods across three metrics: average error, maximum error, standard deviation, 95% confidence interval, and success rate. The average error reflects the overall geo-localization accuracy of the algorithm, the maximum error characterizes the algorithm’s stability under extreme conditions, the standard deviation and 95% confidence interval reflects the algorithm’s statistical reliability, and the success rate measures the algorithm’s robustness and usability in complex low-light scenarios.
4.3. Comparison Methods and Experimental Settings
To comprehensively evaluate the effectiveness and robustness of the proposed framework, we selected several competitive algorithms in the fields of image matching and visual geo-localization as baseline methods. These baseline methods include the keypoint-based deep learning matching framework SP + SG (using SuperPoint [
13] to extract feature points and SuperGlue [
14] for matching), as well as well-known end-to-end matching methods: LoFTR [
15], Patch2Pix [
22], and XoFTR [
40]. These methods are representative high-performance approaches in the field of image matching and visual geo-localization over the past few years, spanning mainstream technical approaches from sparse feature matching to end-to-end dense matching. Specifically:
SP + SG (SuperPoint + SuperGlue): This method first uses SuperPoint to extract feature points and their corresponding descriptors and then uses the GNN architecture in SuperGlue to model intra-image and inter-image relationships. It exhibits strong robustness and cross-domain generalization ability in traditional sparse feature matching tasks.
LoFTR: LoFTR utilizes a detector-free Transformer architecture to directly predict dense pixel-level correspondences through global context modeling, overcoming the limitations of discrete keypoint detection. It represents an advanced level in fine-grained end-to-end matching methods.
Patch2Pix: This method further combines epipolar constraints and pixel-level regression mechanisms. By progressively refining from image patch-level matching to precise pixel coordinates, it demonstrates superior performance in maximizing geometric matching accuracy.
XoFTR: This method further enhances transformer-based feature matching by introducing stronger cross-modal correspondence reasoning and global context aggregation. By jointly modeling local details and long-range dependencies, it improves matching robustness under large appearance variations, weak-texture regions, and cross-modal domain shifts, leading to more stable geo-localization results.
Overall, these methods serve as strong baselines for image matching and geo-localization tasks, demonstrating high representativeness and comparability. Therefore, this paper uses them as baseline methods to comprehensively validate the effectiveness and robustness of the proposed methods.
The proposed method mainly comprises a geographic consistency normalization module, a thermal infrared super-resolution enhancement module, and a cross-modal dense matching geo-localization module. During the training phase, each module is optimized using a combination of phased training and joint inference to fully leverage the synergistic effects of different modules. For data preprocessing, all input images were uniformly resized to a common resolution and normalized before being fed into the network to reduce the impact of scale differences on model training. The geographic consistency normalization module reduces modal differences between satellite optical and thermal infrared images; the thermal infrared super-resolution enhancement module improves image spatial resolution and detail representation; and the cross-modal matching module completes cross-modal feature alignment and dense correspondence estimation. In the matching phase, a coarse-to-fine strategy was used to estimate geometric relationships, combined with the RANSAC algorithm to remove outlier matching points. To ensure stable matching results, the RANSAC inlier threshold was set to 10 pixels. During the staged training process, Adam/AdamW was used for module-wise pre-training, while SGD with a learning rate of 1 × 10⁻⁵ and a batch size of 8 was used for the final joint fine-tuning stage. All experiments in this chapter were conducted on a workstation configured with an NVIDIA (NVIDIA Corporation, Santa Clara, CA, USA) GeForce RTX 4090 GPU and 24 GB of RAM.
Since the proposed framework was evaluated on a relatively limited UAV thermal–satellite dataset, special attention was paid to overfitting prevention during training. First, the dataset was split into training, validation, and testing subsets in a scene-disjoint manner, ensuring that the test scenes did not overlap with the training areas. This setting allows a more reliable assessment of generalization performance on unseen environments. Second, extensive data augmentation was applied, including random cropping, horizontal flipping, color jittering, rotation, and scale perturbation, to increase appearance diversity and reduce the risk of memorization.
In addition, the proposed framework adopts a staged training strategy rather than end-to-end optimization from scratch. Such a strategy helps each module learn its specific subtask before being jointly fine-tuned, which improves convergence stability and reduces the probability of overfitting on the small dataset. During training, early stopping was employed according to the validation geo-localization error, and the best-performing checkpoint on the validation set was selected for final testing. Weight decay and learning-rate decay were also used to further regularize the optimization process. These settings collectively improve the robustness and generalization ability of the proposed method.
4.4. Visual Geo-Localization Experiments
4.4.1. Self-Made Dataset Experiments
To evaluate the feasibility and practical efficacy of the proposed framework, a comparative assessment of various geo-localization methodologies was conducted using the self-constructed heterogeneous dataset. Specifically, a UAV image was first matched with the reference satellite image, and the homography matrix was calculated based on the matching point pairs. The experiment uses the RANSAC algorithm for estimation, and the threshold was set to 10 pixels. Then, the pixel coordinates of the center pixel of the UAV image on the satellite reference image are calculated by the homography matrix, and the latitude and longitude coordinates of the UAV are obtained by the geographic coordinates stored in the satellite map. Finally, the comparison with the ground truth in the dataset was verified.
For SP + SG, the error statistics were computed only for the 45 successfully matched samples, as failed cases do not yield valid geo-localization errors. To address statistical uncertainty, we report the mean geo-localization error, standard deviation, and 95% confidence interval computed from per-sample errors. The proposed method achieves the lowest mean error and the tightest confidence interval, indicating both higher accuracy and greater stability in cross-modal geo-localization.
As clearly demonstrated by the quantitative results in
Table 1, the proposed method exhibits the best geo-localization performance among the evaluated approaches. It achieves an average geo-localization error of only 1.31 m and a maximum error of 4.21 m, substantially outperforming the four baseline paradigms. In contrast, LoFTR, Patch2Pix, and XoFTR obtain average errors of 5.83 m, 5.62 m, and 3.76 m, respectively, while SP + SG performs the worst among the compared methods and fails to produce valid correspondences for 15 test queries. These results indicate that the proposed framework is not only more accurate but also more robust under challenging cross-modal conditions. Specifically, a test case is considered a geo-localization failure if the algorithm produces fewer than 10 matched correspondences. This criterion was introduced because, under such conditions, the algorithm cannot reliably estimate the UAV’s position.
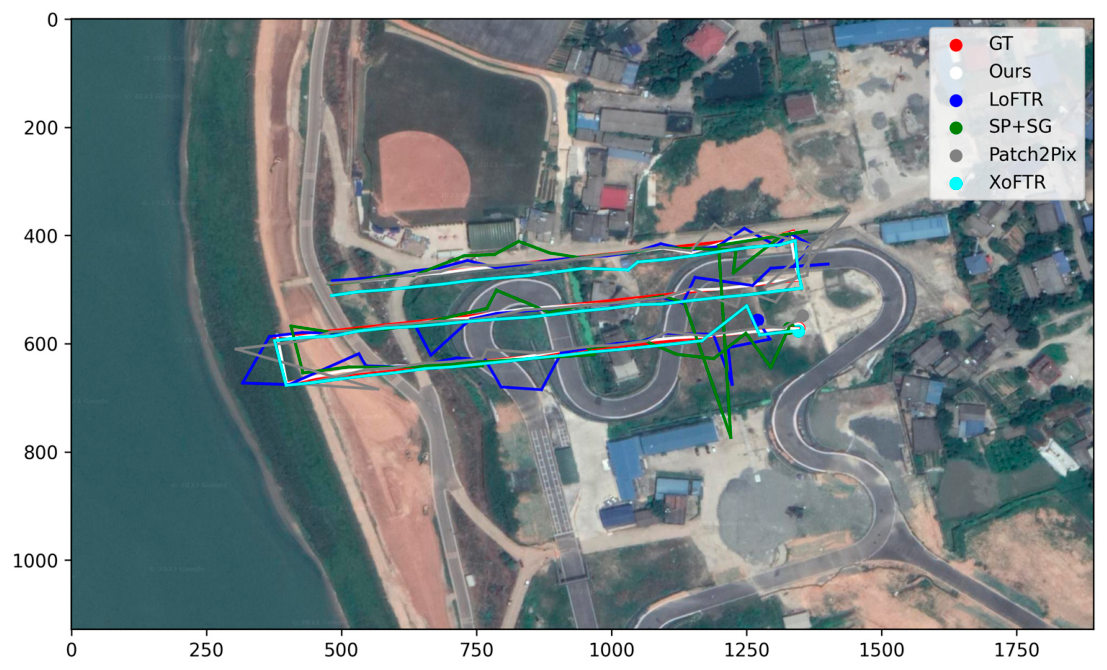
A qualitative visualization of the visual geo-localization results is illustrated in
Figure 8. In this graphical representation, the red line denotes the ground-truth GNSS reference trajectory. The trajectories estimated by SP + SG, LoFTR, Patch2Pix, XoFTR, and our proposed framework are explicitly color-coded in green, blue, gray, cyan, and white, respectively.
As shown in
Figure 8, apart from the method proposed in this paper, all other methods exhibit significant location drift, further validating the effectiveness of the proposed visual geo-localization algorithm. Furthermore, the SP + SG matching algorithm demonstrates even greater location drift. The main reason is the relatively weak texture in this region; apart from the racetrack, which provides stable texture features, other areas lack image texture. This makes it difficult for the SP + SG method to obtain robust feature points, thus reducing the accuracy of matching and geo-localization. For regions with weak texture, feature-point-based matching methods face significant challenges, requiring more robust feature extraction and matching strategies to address location drift and ensure the robustness and effectiveness of the visual geo-localization system.
4.4.2. Public Dataset Experiments
To further evaluate the robustness and scene generalization capability of the proposed method, we conducted additional experiments on the public Thermal-UAV dataset [
41]. This dataset was collected using a DJI Matrice 4T UAV at different altitudes ranging from 300 m to 350 m, covering multiple time periods during both daytime and nighttime, and includes complex urban scenes. The experimental task on this dataset is consistent with the primary task considered in this study: matching UAV-acquired thermal infrared images with corresponding georeferenced satellite optical images for geo-localization. Compared with the self-constructed dataset, the Thermal-UAV dataset provides additional urban scenes, different flight conditions, broader illumination variations, and more complex spatial structures. These expanded scenes introduce larger cross-modal appearance differences, viewpoint changes, thermal variations, and structural ambiguities, thereby providing a more challenging evaluation environment for the proposed method.
According to the quantitative results in
Table 2, the proposed method achieves the best overall performance among all compared approaches. Specifically, ours attains an average geo-localization error of only 8.04 m, outperforming XoFTR (8.86 m), SP + SG (11.53 m), Patch2Pix (13.00 m), and LoFTR (14.68 m). This demonstrates that the proposed framework still maintains stronger geometric alignment capability and geo-localization accuracy on the more challenging cross-modal Thermal-UAV benchmark. Compared with the strongest baseline, XoFTR, the proposed method further reduces the average error and remains superior in overall accuracy.
Meanwhile, the proposed method also achieves the lowest standard deviation of 6.62 m and the tightest 95% confidence interval of [7.61, 8.48] m, indicating not only higher accuracy but also greater stability. In contrast, XoFTR, LoFTR, SP + SG, and Patch2Pix yield standard deviations of 9.93 m, 14.80 m, 11.31 m, and 13.04 m, respectively, suggesting greater variation across test samples and relatively weaker robustness. In particular, the maximum errors of Patch2Pix and LoFTR reach 99.88 m and 97.23 m, respectively, indicating severe mismatching and geo-localization failures in complex thermal scenes; by comparison, the proposed method limits the maximum error to 47.78 m, substantially reducing the impact of extreme failure cases.
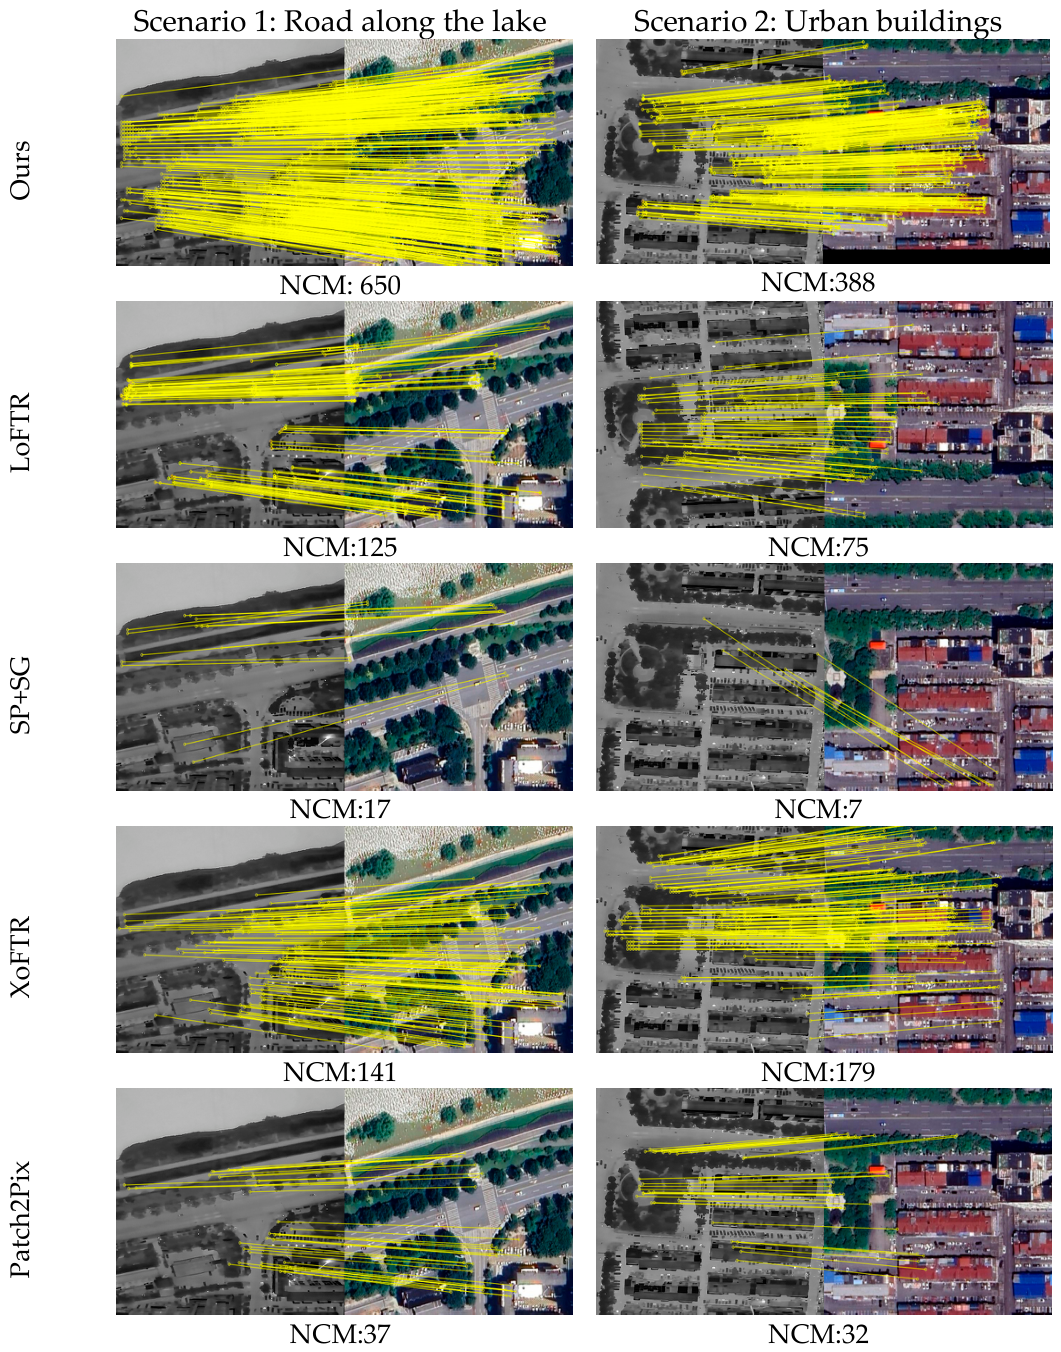
To further verify the robustness of the proposed method in challenging cross-modal scenarios, we present qualitative matching results for two representative scenes from the Thermal-UAV dataset, namely “Road along the lake” and “Urban buildings.” As shown in
Figure 9, the proposed method consistently produces the densest and most reliable correspondences in both scenes, with 650 matched points in the first scene and 388 matched points in the second. In contrast, LoFTR obtains only 125 and 75 matches, SP + SG yields merely 17 and 7 matches, XoFTR produces 141 and 179 matches, and Patch2Pix returns 37 and 32 matches, respectively.
These results indicate that the proposed framework can establish substantially more stable cross-modal correspondences under large appearance changes, texture ambiguity, and complex urban structures. In particular, although LoFTR and XoFTR can still produce some matches, many are distributed less densely or less spatially consistently than those of our method. SP + SG and Patch2Pix, on the other hand, suffer from a severe reduction in the number of valid correspondences, especially in visually challenging areas. Overall, the visualization demonstrates that the proposed method not only improves the quantity of matched points but also maintains stronger matching coherence and robustness across different scene types.
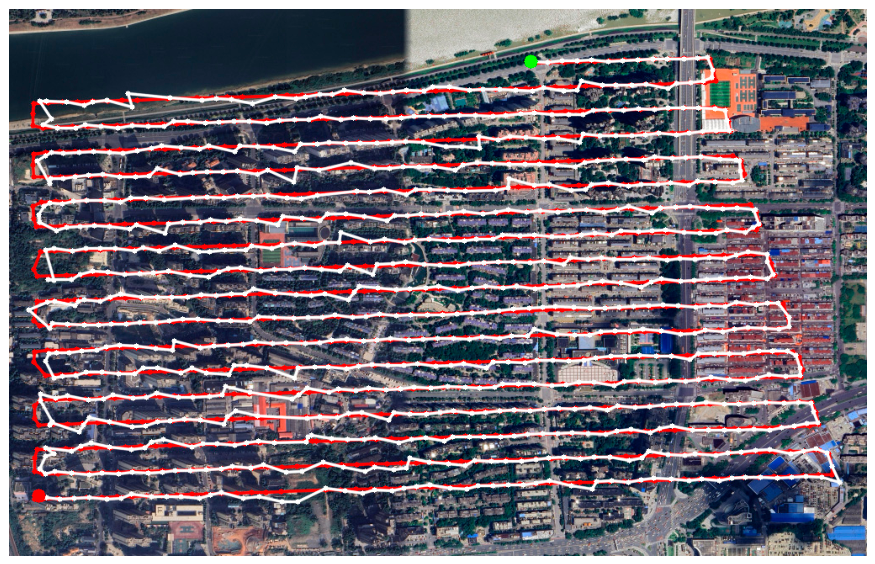
Since the trajectories produced by different methods largely overlap in this scene, overlaying all trajectories in a single visualization would make the figure overly cluttered and hinder the assessment of trajectory continuity and geo-localization deviation. Therefore, we only present the trajectory of the proposed method in
Figure 10 to clearly demonstrate its global geo-localization accuracy and trajectory consistency.
4.4.3. Runtime Comparison
In addition to accuracy, computational efficiency is also an important factor for practical UAV geo-localization applications. Therefore, we evaluated the inference time of all methods on an NVIDIA Jetson Xavier NX platform under the same input and testing settings. As shown in
Table 3, SP + SG achieves the fastest inference speed at 0.80 s per image pair, followed by the proposed method at 1.66 s. LoFTR and XoFTR require 1.84 s and 2.05 s, respectively, while Patch2Pix is the slowest at 2.20 s. These results indicate that the proposed method offers a favorable trade-off between accuracy and efficiency.
For clarity, the reported runtime of 1.66 s per image pair corresponds exclusively to the online onboard geo-localization stage, including cross-modal feature matching, geometric transformation estimation, and RANSAC-based outlier rejection. It does not include the offline preprocessing of the reference satellite database. Before deployment, the geographic consistency-constrained normalization module is first applied to the reference satellite images, and the resulting normalized images are subsequently processed by the super-resolution module. The enhanced reference images, together with their corresponding geographic metadata, are then stored in the onboard database. During flight, each incoming UAV thermal infrared image is directly matched with the preprocessed reference images for geo-localization. Therefore, the reported runtime reflects the online matching and pose-estimation cost, while the computational time required for reference-image normalization and super-resolution preprocessing is excluded from the onboard inference statistics.
4.5. Real-World Experiments
To fully verify the performance of the visual geo-localization system, we collected drone images at different times, altitudes, and weather conditions.
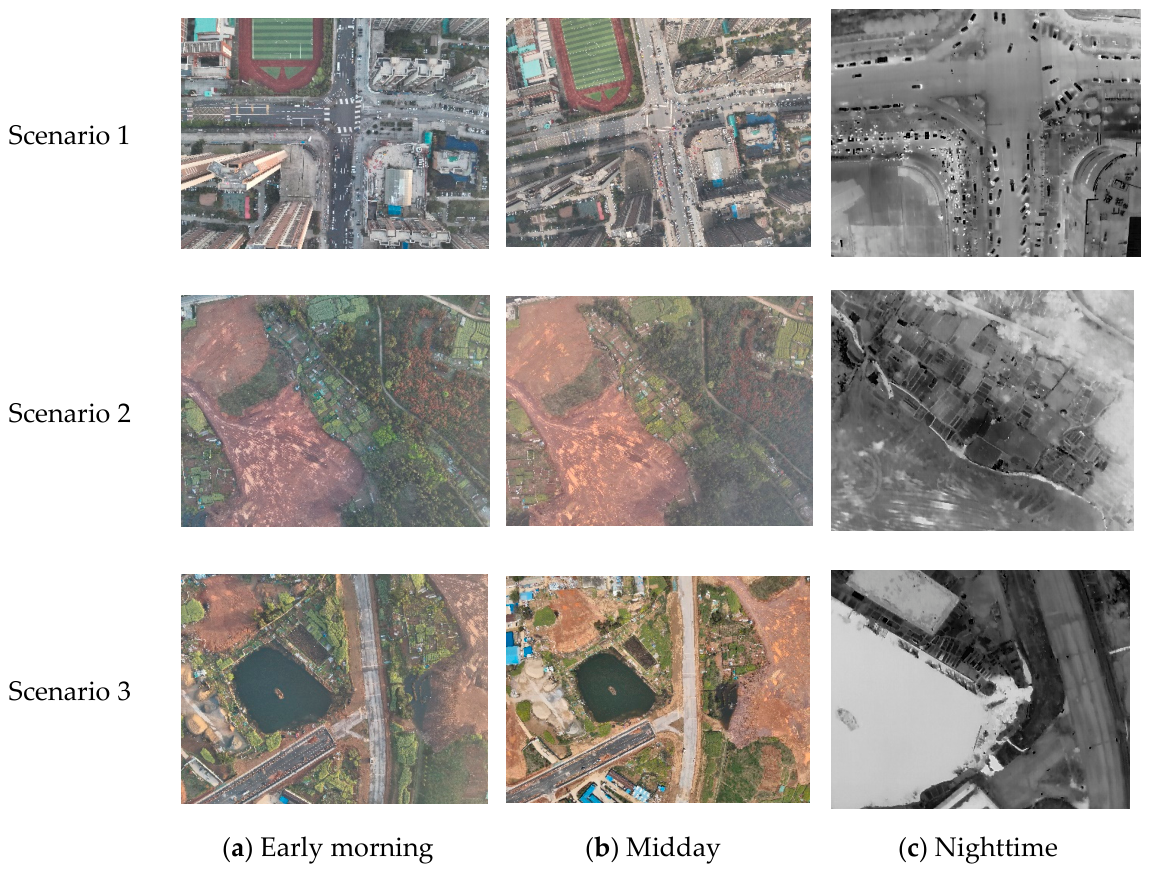
Data was collected at 6:30 a.m., 12:30 p.m., and 9:30 p.m. at four different altitudes: 150 m, 200 m, 250 m, and 300 m. Thermal infrared sensors were used for data collection at altitudes of 150 m and 200 m, while visible light sensors were used for data collection at altitudes of 250 m and 300 m. Each row in
Figure 11 represents UAV data collected in the same area at different time periods. Column (a) shows UAV data collected at 6:30 AM at 250 m. This time period included morning fog, which resulted in no shadows affecting ground targets but some image blurring. Column (b) shows UAV imagery collected at 12:30 p.m. at 300 m. This time period provided clearer images, but shadows still interfered with them in urban areas. Column (c) shows the UAV imagery taken at 21:30 at night at a height of 150 m. Compared to visible light imagery, thermal infrared imagery has lower image quality. At the same time, due to the UAV’s low flight altitude, the number of salient targets for feature matching and geo-localization within the field of view is greatly reduced, posing a significant challenge to the accuracy and robustness of visual geo-localization.
Regarding real-world scenarios, we compared our proposed method with the LoFTR model.
Table 4 shows the geo-localization errors for Scenario 1. The data in the table reveal that our method maintains good geo-localization accuracy under most conditions, with a maximum error not exceeding 4.5 m and an average geo-localization error as low as 1.30 m under favorable data conditions, indicating relatively high geo-localization accuracy. However, the effects of fog and nighttime are still significant. In the absence of clear light in the early morning, the accuracy loss in visual geo-localization exceeds 1 m. The accuracy loss is even more pronounced at night, with the worst geo-localization error of 22.64 m occurring at a drone flight altitude of 150 m. This makes it difficult to support drone flight missions. For LoFTR, this accuracy loss is even more severe. Although it achieves matching and geo-localization across all images, the overall accuracy is unsatisfactory, and robust visual geo-localization cannot be achieved at night. These results indicate that there is still considerable room for improvement in the accuracy of thermal infrared visual geo-localization, and the impact of real-world no-light environments on the algorithm is more severe than anticipated.
Table 5 shows the results of the visual geo-localization experiment for Scenario 2. It can be observed that the geo-localization accuracy in the wilderness area, lacking significant texture features, is similar to that in Scenario 1. Notably, at 6:30, both the average and maximum errors in Scenario 2 are better than those in Scenario 1, demonstrating the robustness of the proposed algorithm and its ability to maintain good matching accuracy in weakly textured scenes. However, due to the lack of light at night, the area’s texture is further lost, leading to a slight decrease in the accuracy of the proposed algorithm. Overall, the proposed model maintains high geo-localization accuracy at different times, meeting the geo-localization needs of actual UAV flight. In contrast, LoFTR exhibits poor geo-localization robustness. Furthermore, affected by fog, the maximum geo-localization error of LoFTR exceeds 100 m.
Scenario 3 contains more complex land cover structures and exhibits significant content discrepancies between heterogeneous image sources. The visual geo-localization results for Scenario 3 are summarized in
Table 6.
The data in
Table 6 reveal that both the proposed model and LoFTR achieve significantly lower geo-localization accuracy in Scenario 3 than in the previous two scenarios, with maximum errors reaching substantial values, indicating a lack of high-precision, real-time geo-localization coverage. The primary reason is the significant differences in image content across heterogeneous sources. These differences severely impact the image matching algorithm’s capabilities, making it difficult to identify and match key points with similar features. Even with manual observation, it is challenging to accurately determine whether some images in this scenario belong to UAVs or satellites from the same geographic location, making the establishment of precise matching-point associations extremely challenging.
4.6. Parameter Sensitivity Analysis
As shown in
Table 7, we further examined the sensitivity of the proposed method to several key hyperparameters. Within the tested range, the model achieves the best performance when the three loss weights are set to 1.0. Under this setting, the model attains the lowest average error and maximum error, suggesting that the three consistency losses contribute in a well-balanced manner and that equal weighting provides a stable optimization objective.
For the RANSAC threshold, a value of 10 pixels yields the best results. A smaller threshold may reject too many valid correspondences, whereas a larger threshold may admit more outliers, both of which can degrade geo-localization accuracy. Similarly, the super-resolution scale factor of ×4 achieves the best trade-off between detail enhancement and artifact suppression. Regarding the confidence threshold, the best performance is obtained at 0.5, indicating that a moderate filtering criterion is preferable for balancing the quantity and quality of matches.
Overall, the sensitivity analysis confirms that the proposed framework is robust within a reasonable range of parameter settings and does not rely on overly specific hyperparameter choices.
4.7. Ablation Study
To evaluate the contribution of each component in the proposed framework, we conducted ablation experiments on the geographic consistency normalization module, the thermal infrared super-resolution module, and the feature matching module, together with sensitivity analyses on key hyperparameters. All results were measured in terms of average geo-localization error, maximum geo-localization error, and successful geo-localization.
4.7.1. Overall Ablation Analysis
To evaluate the effectiveness of the proposed geographic consistency normalization and image super-resolution module, an ablation study was conducted. Representative experimental data are shown in
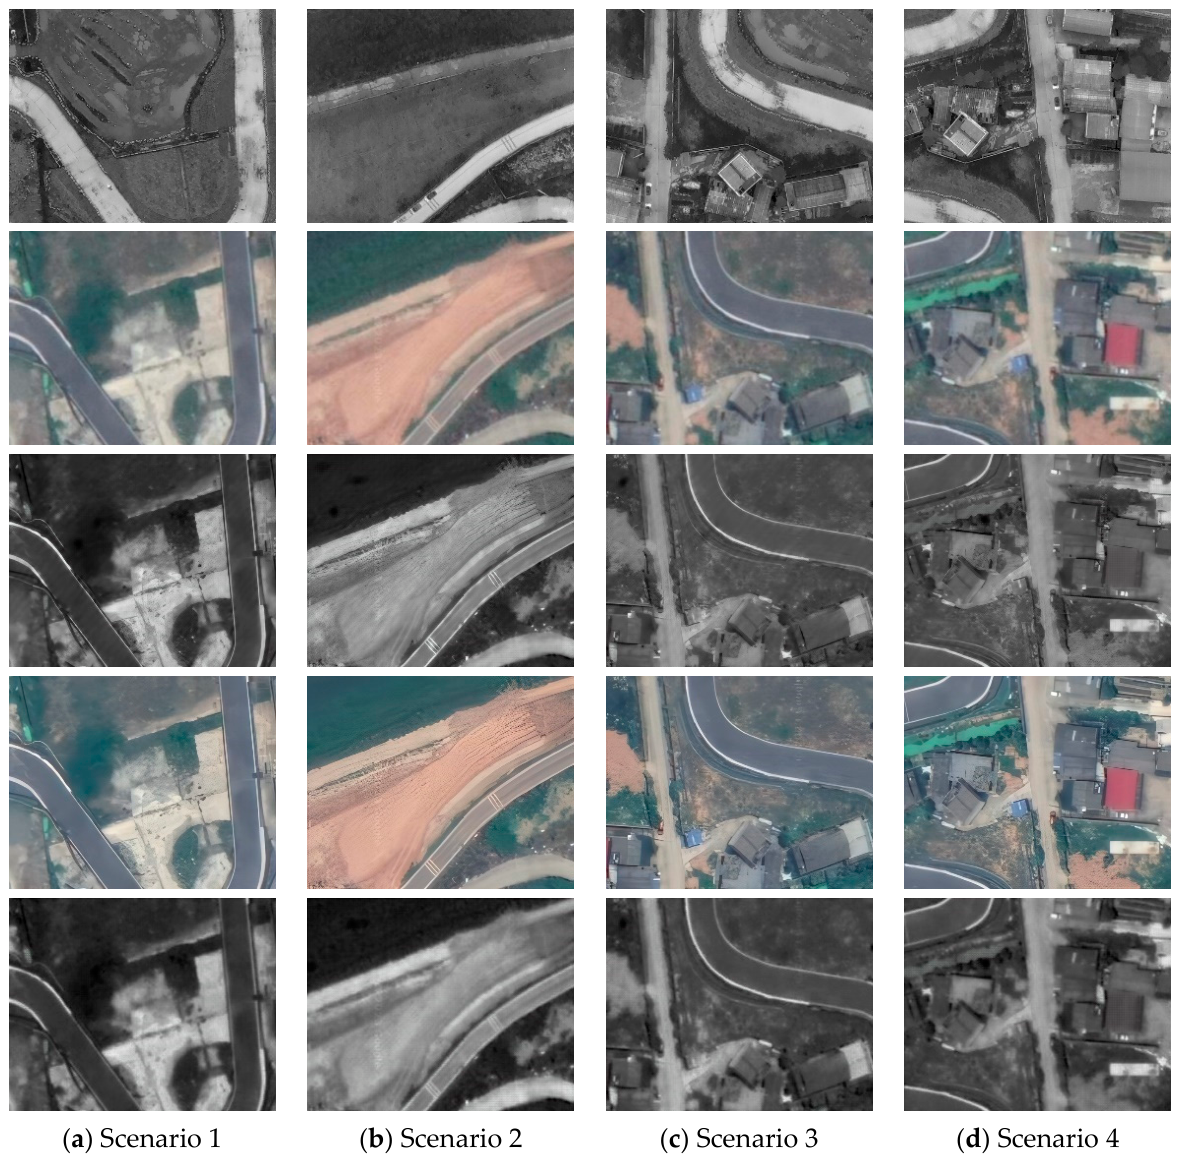
Figure 12.
Each column in
Figure 12 corresponds to a set of data from the same geographic region. The first row presents UAV thermal infrared images, i.e., the target images for geo-localization, with a resolution of 640 × 512. The second row shows the original satellite images segmented based on UAV observations, with a resolution of 320 × 256. It can be observed that significant cross-modal discrepancies exist between the heterogeneous image sources. The third row shows the results generated by the proposed method at an output resolution of 640 × 512. These results provide more discriminative representations, enabling improved geo-localization performance. The fourth row presents satellite images generated using only the super-resolution module, with a × 4 upsampling factor and a resolution of 1280 × 1024. The fifth row shows satellite images generated using only the geographic consistency normalization module, with a resolution of 320 × 256.
To further evaluate the contribution of each component, ablation experiments were conducted using three settings: raw data, super-resolution-only data, and geographic consistency normalization data. Four representative matching algorithms were applied and evaluated. For fair comparison, all images were resized to 640 × 512 using bilinear interpolation. The corresponding quantitative results are reported in
Table 8.
The results reported in
Table 8 clearly demonstrate that both the geographic consistency normalization module and the image super-resolution module significantly reduce geo-localization errors compared with raw image-based matching. This indicates that the proposed geographic consistency normalization of satellite imagery and the thermal infrared super-resolution enhancement module play an essential role in improving the accuracy of visual geo-localization. In particular, both SP + SG and Patch2Pix show substantial improvements in mean and maximum geo-localization accuracy after applying the proposed enhancement modules. Notably, Patch2Pix fails to localize all test samples when using raw data; however, after image quality enhancement, its matching accuracy and robustness are significantly improved, enabling successful geo-localization across all test cases. A comprehensive comparison across the four evaluated methods further confirms that integrating the proposed modules results in more stable geo-localization performance, especially for algorithms that originally exhibit poor performance on raw cross-modal data. Furthermore, the experimental results demonstrate that the algorithm proposed in this paper exhibits ideal robustness and accuracy, achieving good geo-localization across various image modalities and scenes. The ablation results indicate that the two preprocessing modules contribute to different aspects of the geo-localization pipeline: geographic consistency normalization mainly reduces cross-modal appearance ambiguity, while thermal infrared super-resolution mainly improves local feature discriminability. Their combined use yields the best performance, demonstrating that the proposed framework is a coordinated design rather than a simple stacking of off-the-shelf modules.
4.7.2. Module Ablation Analysis
As reported in
Table 9, the full model achieves the best overall performance, with an average error of 1.31 m and a maximum error of 4.21 m, successfully localizing all 60 test cases (60/60). This result confirms the effectiveness of the proposed full pipeline and demonstrates its robustness in cross-modal geo-localization.
When any of the three consistency losses is removed, the performance degrades consistently. Specifically, removing the gradient loss increases the average error to 2.37 m and the maximum error to 6.08 m, indicating that gradient constraints are essential for preserving boundary and contour information. Removing the semantic loss yields an average error of 2.21 m and a maximum error of 5.74 m, suggesting that semantic alignment helps reduce cross-modal feature ambiguity. More importantly, removing the feature loss leads to the most pronounced degradation among the three, with the average error increasing to 2.48 m and the maximum error to 6.32 m. This confirms that feature consistency plays a critical role in preserving spatial relationships and improving geo-localization accuracy.
In the super-resolution module, replacing the proposed multi-discriminator routing strategy with a single discriminator also results in a noticeable performance drop, with the average error increasing to 2.06 m and the maximum error to 5.41 m. This indicates that the routing-based design is more effective at modeling the heterogeneous distributions present in thermal infrared imagery and producing higher-quality enhanced representations.
In the matching stage, disabling uncertainty weighting increases the average error to 2.14 m and the maximum error to 5.89 m, showing that confidence-aware correspondence aggregation effectively suppresses unreliable matches. Furthermore, removing RANSAC results in a substantial increase in the maximum error to 7.26 m, despite only a slight reduction in the number of successful matches. This suggests that RANSAC is crucial for eliminating outliers and improving robustness, especially in challenging cases where erroneous correspondences may otherwise dominate the estimation process.
Overall, the ablation study demonstrates that each module contributes meaningfully to the final performance and that the proposed gradient, semantic, and feature constraints are complementary. The multi-discriminator routing mechanism, uncertainty weighting, and RANSAC further enhance the robustness and reliability of the geo-localization pipeline.
5. Discussion
Traditional feature matching algorithms and deep learning-based models can handle most UAV visual geo-localization tasks, as demonstrated in recent studies [
9,
22] and numerous earlier works. However, challenging scenarios such as low-light and no-light conditions may significantly degrade their performance, often resulting in geo-localization failure.
To improve the all-day autonomous geo-localization capability of UAVs, the proposed method addresses the challenges of direct matching in complex cross-modal, low-light, and no-light environments, where visible light imagery suffers from unclear feature representation and substantial modality discrepancies exist between thermal infrared imagery and satellite optical imagery. The experimental results demonstrate several notable advantages of the proposed framework.
- (1)
The proposed method significantly outperforms existing approaches in geo-localization accuracy.
Compared with LoFTR, SP + SG, Patch2Pix, and XoFTR, the proposed method achieves a mean geo-localization error of 1.31 m and 8.04 m on self-built dataset and public dataset, respectively. These results demonstrate the effectiveness of the proposed geospatial consistency constraint and super-resolution enhancement strategy in improving the accuracy of cross-modal matching-based geo-localization.
- (2)
The proposed method exhibits strong cross-scene robustness and generalization capability.
By fully exploiting the stable imaging characteristics of UAV thermal infrared imagery under low-light conditions, the proposed framework constructs a unified feature representation space that makes thermal infrared imagery and satellite imagery more compatible for matching. Therefore, the proposed method maintains stable positioning performance in scenarios including parks, rural areas, and racetracks, and under different lighting conditions such as morning, noon, and night. These results demonstrate the strong adaptability of the proposed method to complex environmental changes.
- (3)
The proposed method effectively alleviates the geo-localization failure problem in low-light environments.
Even in challenging scenarios such as nighttime, low-texture areas, and significant differences in content between heterogeneous image sources, the proposed method maintains high matching stability and geo-localization accuracy. These experimental results further demonstrate the effectiveness and versatility of the proposed framework for visual geo-localization under low-light conditions, providing a feasible solution for all-weather autonomous UAV geo-localization in GNSS-constrained environments.
Although the proposed method improves cross-modal matching accuracy while preserving spatial consistency, its generalization ability remains constrained by the limited scale and diversity of the current dataset. The experiments were mainly conducted using park, rural, and racetrack scenes, which validates the method only within these representative low-light UAV geo-localization environments. In more challenging scenes, such as mountainous terrain, coastal environments, forests, and regions with repetitive structures, stronger cross-modal ambiguity, occlusion, geometric distortion, and thermal variation may arise. In addition, land cover changes, degraded satellite image quality, and the intrinsic limitations of thermal imaging under harsh conditions may further affect correspondence estimation and geo-localization accuracy. The method also introduces additional computational overhead, and performance may decline in highly complex terrain environments. Therefore, broader validation on more heterogeneous datasets, together with lightweight and efficient deployment strategies, will be important directions for future work.