Article

Near-Real-Time Flood Disaster Monitoring Based on Moonlight and Multi-Source Remote Sensing: A Case Study of Zhengzhou Rainstorm


1
College of Geography and Remote Sensing Sciences, Xinjiang University, Urumqi 830046, China
2
Xinjiang Field Scientific Observation and Research Station for the Oasisization Process in the Hinterland of the Taklamakan Desert, Hetian 848400, China
3
Xinjiang Key Laboratory of Oasis Ecology, Xinjiang University, Urumqi 830046, China
4
Xinjiang Key Laboratory of Intelligent Computing and Smart Applications, School of Software, Xinjiang University, Urumqi 830046, China
5
Laboratory Biodiversity and Ecosystems, Division Anthropic and Climate Change Impacts, Italian National Agency for New Technologies, Energy and Sustainable Economic Development (ENEA), Strada Per Crescentino, Saluggia, 13040 Vercelli, Italy
*
Author to whom correspondence should be addressed.
Remote Sens. 2026, 18(15), 2435; https://doi.org/10.3390/rs18152435
Submission received: 24 April 2026 / Revised: 16 June 2026 / Accepted: 27 June 2026 / Published: 23 July 2026
(This article belongs to the Section Earth Observation for Emergency Management)

Highlights

What are the main findings?
  • A novel moonlight-assisted multi-source remote sensing framework was developed for near-real-time flood monitoring.
  • The VIIRS/DNB moonlight observations enabled inundation mapping and dynamic assessment of power outage and recovery after extreme rainfall events.
What are the implications of the main findings?
  • By incorporating moonlight observations, the effective disaster data acquisition cycle is reduced to approximately one day, overcoming the temporal bottlenecks of traditional optical satellites (limited by clouds/night) and SAR satellites (limited by revisit periods).
  • This multi-source fusion framework enhances near-real-time situational awareness, providing a scientific basis for rapid emergency response, infrastructure damage assessment, and post-disaster reconstruction strategies.

Abstract

The increasing frequency of natural disasters such as floods has led to severe casualties and substantial economic losses. Consequently, near-real-time flood disaster monitoring has become critical for effective disaster response and accurate damage assessment. However, traditional approaches relying on daytime optical imagery and SAR data often suffer from long satellite revisit cycles and data acquisition latency, while nighttime Earth observation remains limited by the absence of adequate illumination. This study proposes an innovative framework that integrates moonlight Earth observation to enable near-real-time flood monitoring and loss assessment and is applied to the 7.20 Zhengzhou rainstorm event. Compared to conventional disaster monitoring techniques, integrating moonlight observations shortens the effective data acquisition period to approximately one day, significantly improving temporal responsiveness compared with conventional techniques. The innovative framework identifies a flood-affected area of 722.93 km2 and estimated economic losses of 107.96 billion yuan in the disaster-affected region. The results indicate that the moonlight data source has significant capacity for near-real-time disaster monitoring and disaster loss assessment and highlight the potential broad impact of this study in relevant fields.

1. Introduction

Extreme rainstorms are severe precipitation events characterized by heavy rainfall and prolonged duration, causing significant damage to the natural environment and socioeconomic systems. Global warming has contributed to a rising occurrence of extreme weather events, particularly extreme rainstorms [1,2]. Global warming often triggers floods, geological hazards, transportation disruptions, power outages, and other damage, posing serious threats to infrastructures, livelihoods, and personal safety [3,4]. If the disaster monitoring cycle is excessively long, it can lead to rushed government responses, thereby exacerbating the disaster situation, undermining residents’ livelihoods, and exerting profound negative impacts on public safety and well-being. Therefore, near-real-time monitoring of severe rainstorm events is of great importance [3]: first, enabling efficient assessment of disaster severity and extent to support rescue and relief operations; second, protecting public life and property and reducing socioeconomic impacts; and third, providing data and information for future research and the development of disaster prevention strategies [5].
Remote sensing enables large-scale, timely, and effective data acquisition, making it widely used for monitoring sudden natural disasters such as floods. Owing to the richness of spectral information, optical remote sensing observations are commonly used for detecting changes in surface water changes [6,7,8]. However, optical sensors often fail to capture usable data during floods due to cloud cover and illumination conditions [9]. In contrast, Synthetic Aperture Radar (SAR) provides imaging capabilities independent of weather and illumination conditions, making it a powerful tool for rapid flood detection [10]. However, the radar backscatter from smooth water surfaces is significantly lower than that from other land cover types, a consequence of specular reflection [11]. As a result, temporal changes in SAR backscatter can be effectively used to identify flooded areas [3,12].
The near-real-time monitoring of heavy rainstorms presents a significant challenge, despite the widespread use of SAR imagery in related disaster monitoring. Currently, global research on monitoring rainstorm and flood disasters commonly employs SAR imagery, such as Sentinel-1, and optical imagery, including Landsat series and Sentinel series. The Sentinel-1 satellite constellation provides a nominal 6-day revisit cycle (12 days for a single satellite), while Gaofen-3 has a minimum revisit time of four days. Such revisit intervals place considerable constraints on the ability to conduct near-real-time flood surveillance [13,14]. Given the sudden nature of natural disasters, increasing the frequency of satellite observations is essential for effective disaster prevention and mitigation [15]. However, timely access to remote sensing data is often constrained. Open access data sources frequently lack real-time coverage of disaster-affected areas, particularly under cloudy conditions, when optical imagery is unavailable and only radar data can be utilized. This limitation severely hampers prompt disaster monitoring, accurate loss assessment, and efficient emergency management [16].
The combination of multiple data sources can significantly improve the temporal resolution of Earth observation. Nevertheless, current data fusion approaches typically rely only on daytime optical and SAR data, overlooking the potential of nighttime observations—such as moonlight remote sensing—for continuous monitoring [3,10,17]. Nighttime satellite sensors such as VIIRS/DNB offer daily global coverage, potentially enhancing the temporal resolution of Earth observation. However, traditional nighttime remote sensing primarily focuses on artificial light emissions from urban areas, overlooking the potential of moonlight as a natural illumination source [14,18,19]. Recently, studies have shown that moonlight can serve as a reliable external light source, enabling the detection of non-emissive surfaces—including water bodies, snow, and forest cover—during cloud-free nights. This advances the use of moonlight illumination for nighttime Earth observation and expands its applicability beyond urban lighting monitoring [20,21,22].
The “7·20” extreme rainstorm in Zhengzhou, Henan Province, shows the impacts of rapidly occurring natural disasters, having caused significant casualties and substantial economic losses. Timely and accurate disaster monitoring, along with prompt assessment of infrastructure damage, is critical not only for minimizing human and economic losses but also for supporting effective emergency response and recovery efforts. It aims to facilitate rapid response, accurate assessment, and the protection of public safety and property by enabling faster acquisition of disaster severity and impact extent.
To bridge these observational and methodological gaps, this study develops a novel, near-real-time disaster monitoring and economic loss assessment framework. By synergistically integrating daytime optical and SAR observations with moonlight remote sensing data, the proposed model effectively eliminates the traditional nighttime “blind spot” in Earth observation, providing uninterrupted, 24 h situational awareness during rapidly evolving extreme weather events. The robust capabilities of this framework are empirically validated using the catastrophic 20 July 2021 Zhengzhou rainstorm in Henan Province as a representative case study.
Specifically, the core research objectives of this study are threefold:
  • Evaluate the Diagnostic Capability of Moonlight Remote Sensing: Investigate the potential of moonlight radiance as a natural nocturnal illumination source to track both physical flood inundation boundaries and its cascading socioeconomic impacts—most notably, the spatiotemporal mapping of power outage perimeters and power grid recovery trajectories during hours of complete darkness.
  • Investigate Multi-Sensor Synergy for Enhanced Disaster Response: Explore how the integration of multi-source remote sensing data (encompassing optical, SAR, and moonlight imagery) improves the temporal resolution and comprehensiveness of Earth observation, thereby accelerating the speed and effectiveness of emergency situational awareness.
  • Quantify Target Socioeconomic Losses with Localized Metrics: Establish a refined direct economic loss assessment protocol by coupling land cover datasets with extracted flood extents. This objective focuses specifically on assessing damage to critical vulnerable assets—namely cropland and buildings—leveraging real-time crop prices and local property valuation to provide actionable guidance for post-disaster reconstruction.

2. Materials and Methods

2.1. Study Area

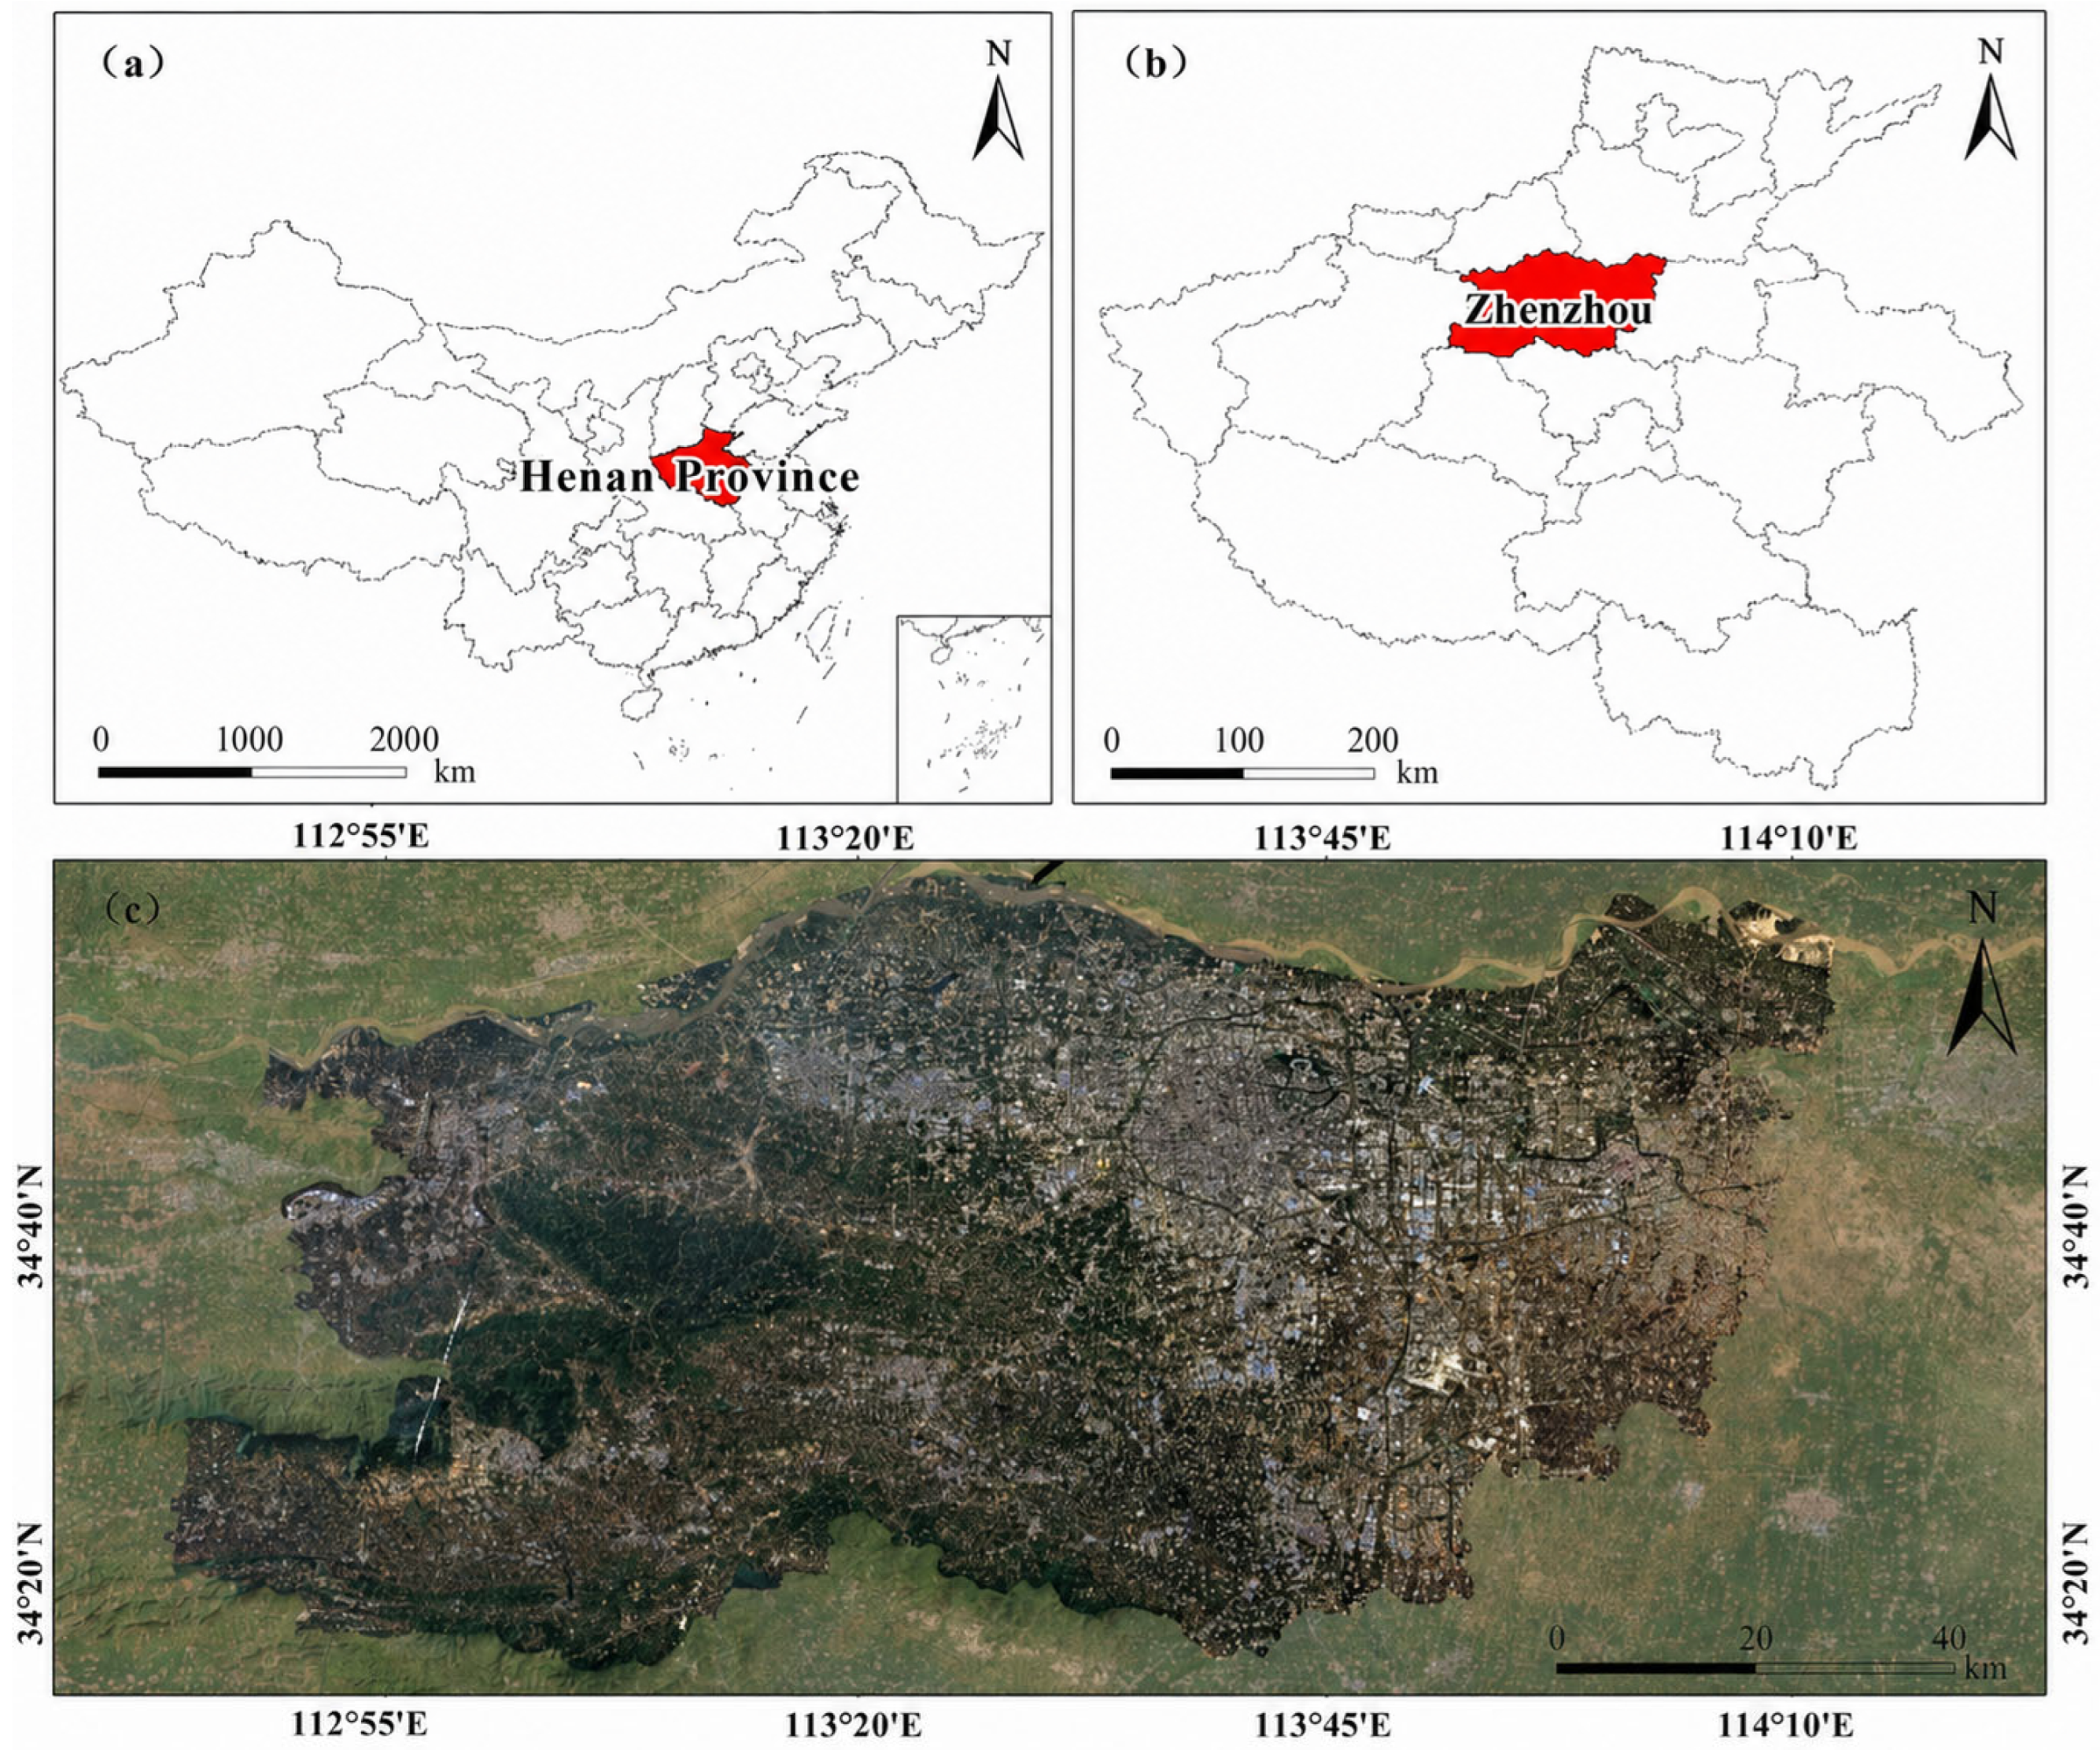
Henan Province (110°21′–116°39′E, 31°23′–36°22′N) is situated in central China, encompassing the middle and lower stretches of the Yellow River (Figure 1), and has a geographic area of approximately 167,000 km2. To ensure spatial consistency in data integration and analysis, all remote sensing datasets were projected into the WGS 84 coordinate system. The region exhibits a west-to-east decreasing topography, transitioning gradually from mountainous and hilly landscapes in the western part to the Huang-Huai-Hai Plain in the east. The province features diverse and complex landforms, characterized by typical step-like topographic features, situated at the junction of multiple geomorphological units. Based on the Seventh National Population Census, Henan Province has a resident population of 99.365 million [23], reflecting a substantial population base. Henan is in a transitional climate zone, where the warm temperate region meets the northern subtropical monsoon climate regions. Influenced by the monsoon climate, short-duration heavy rainfall events frequently occur in the region. The inability to promptly and effectively drain large volumes of rainwater leads to significant flood risks. Furthermore, the high population density increases the difficulty of disaster response. Therefore, implementing timely and accurate disaster monitoring and effective response measures is particularly crucial.

2.2. Zhengzhou “7·20” Extreme Rainstorm

Henan Province experienced a historically rare extreme rainstorm that triggered severe flooding from 17 to 23 July 2021. Zhengzhou, the provincial capital, was one of the most severely affected cities, with 380 fatalities and missing persons reported in the city alone, and direct economic losses reaching 40.9 billion yuan [24]. By 12:00 on 29 July, the disaster had affected about 13.91 million people across 150 counties and 1616 towns, resulting in 99 deaths and 5 missing persons. Approximately 1048.5 thousand hectares of cropland were damaged, and 18,000 houses (57,600 rooms) collapsed.
Due to the distinctive characteristics of the Zhengzhou rainstorm—including its prolonged duration, extensive coverage, and exceptionally intense short-term rainfall—we selected this event to investigate the potential of moonlight observation for near-real-time disaster monitoring and economic loss assessment.

2.3. Datasets and Processing

The main datasets include SAR data, moonlight remote sensing data, DEM and landcover data for Henan Province, and vector data of rural administrative boundaries in Henan. Rural administrative boundaries are officially designated geographical lines that define the jurisdictional areas of different levels of local government in the countryside.

2.3.1. SAR Dataset and Processing

SAR remote sensing supports reliable, all-weather, and round-the-clock monitoring of the Earth’s surface. This study utilized three scenes of Sentinel-1 (S1) radar data acquired on 8 July 2021 and seven scenes of Gaofen-3 radar data acquired on 15 and 22 July 2021, as shown in Table 1.
  • Sentinel-1 data and processing
The Sentinel-1 satellite delivers high-resolution radar imagery capable of all-weather, day-and-night observation, with a spatial resolution reaching up to 5 m. For the Sentinel-1 SAR data, we applied a batch processing procedure that was like the one used for the GF-3 data, utilizing the SNAP software (version 13.0.0) platform to perform a comprehensive preprocessing chain. The preprocessing chain encompassed precise orbit correction, mitigation of thermal noise, radiometric calibration, multi-looking operations, topographic normalization, and Lee Sigma speckle filtering [25].
  • GaoFen-3 data and processing
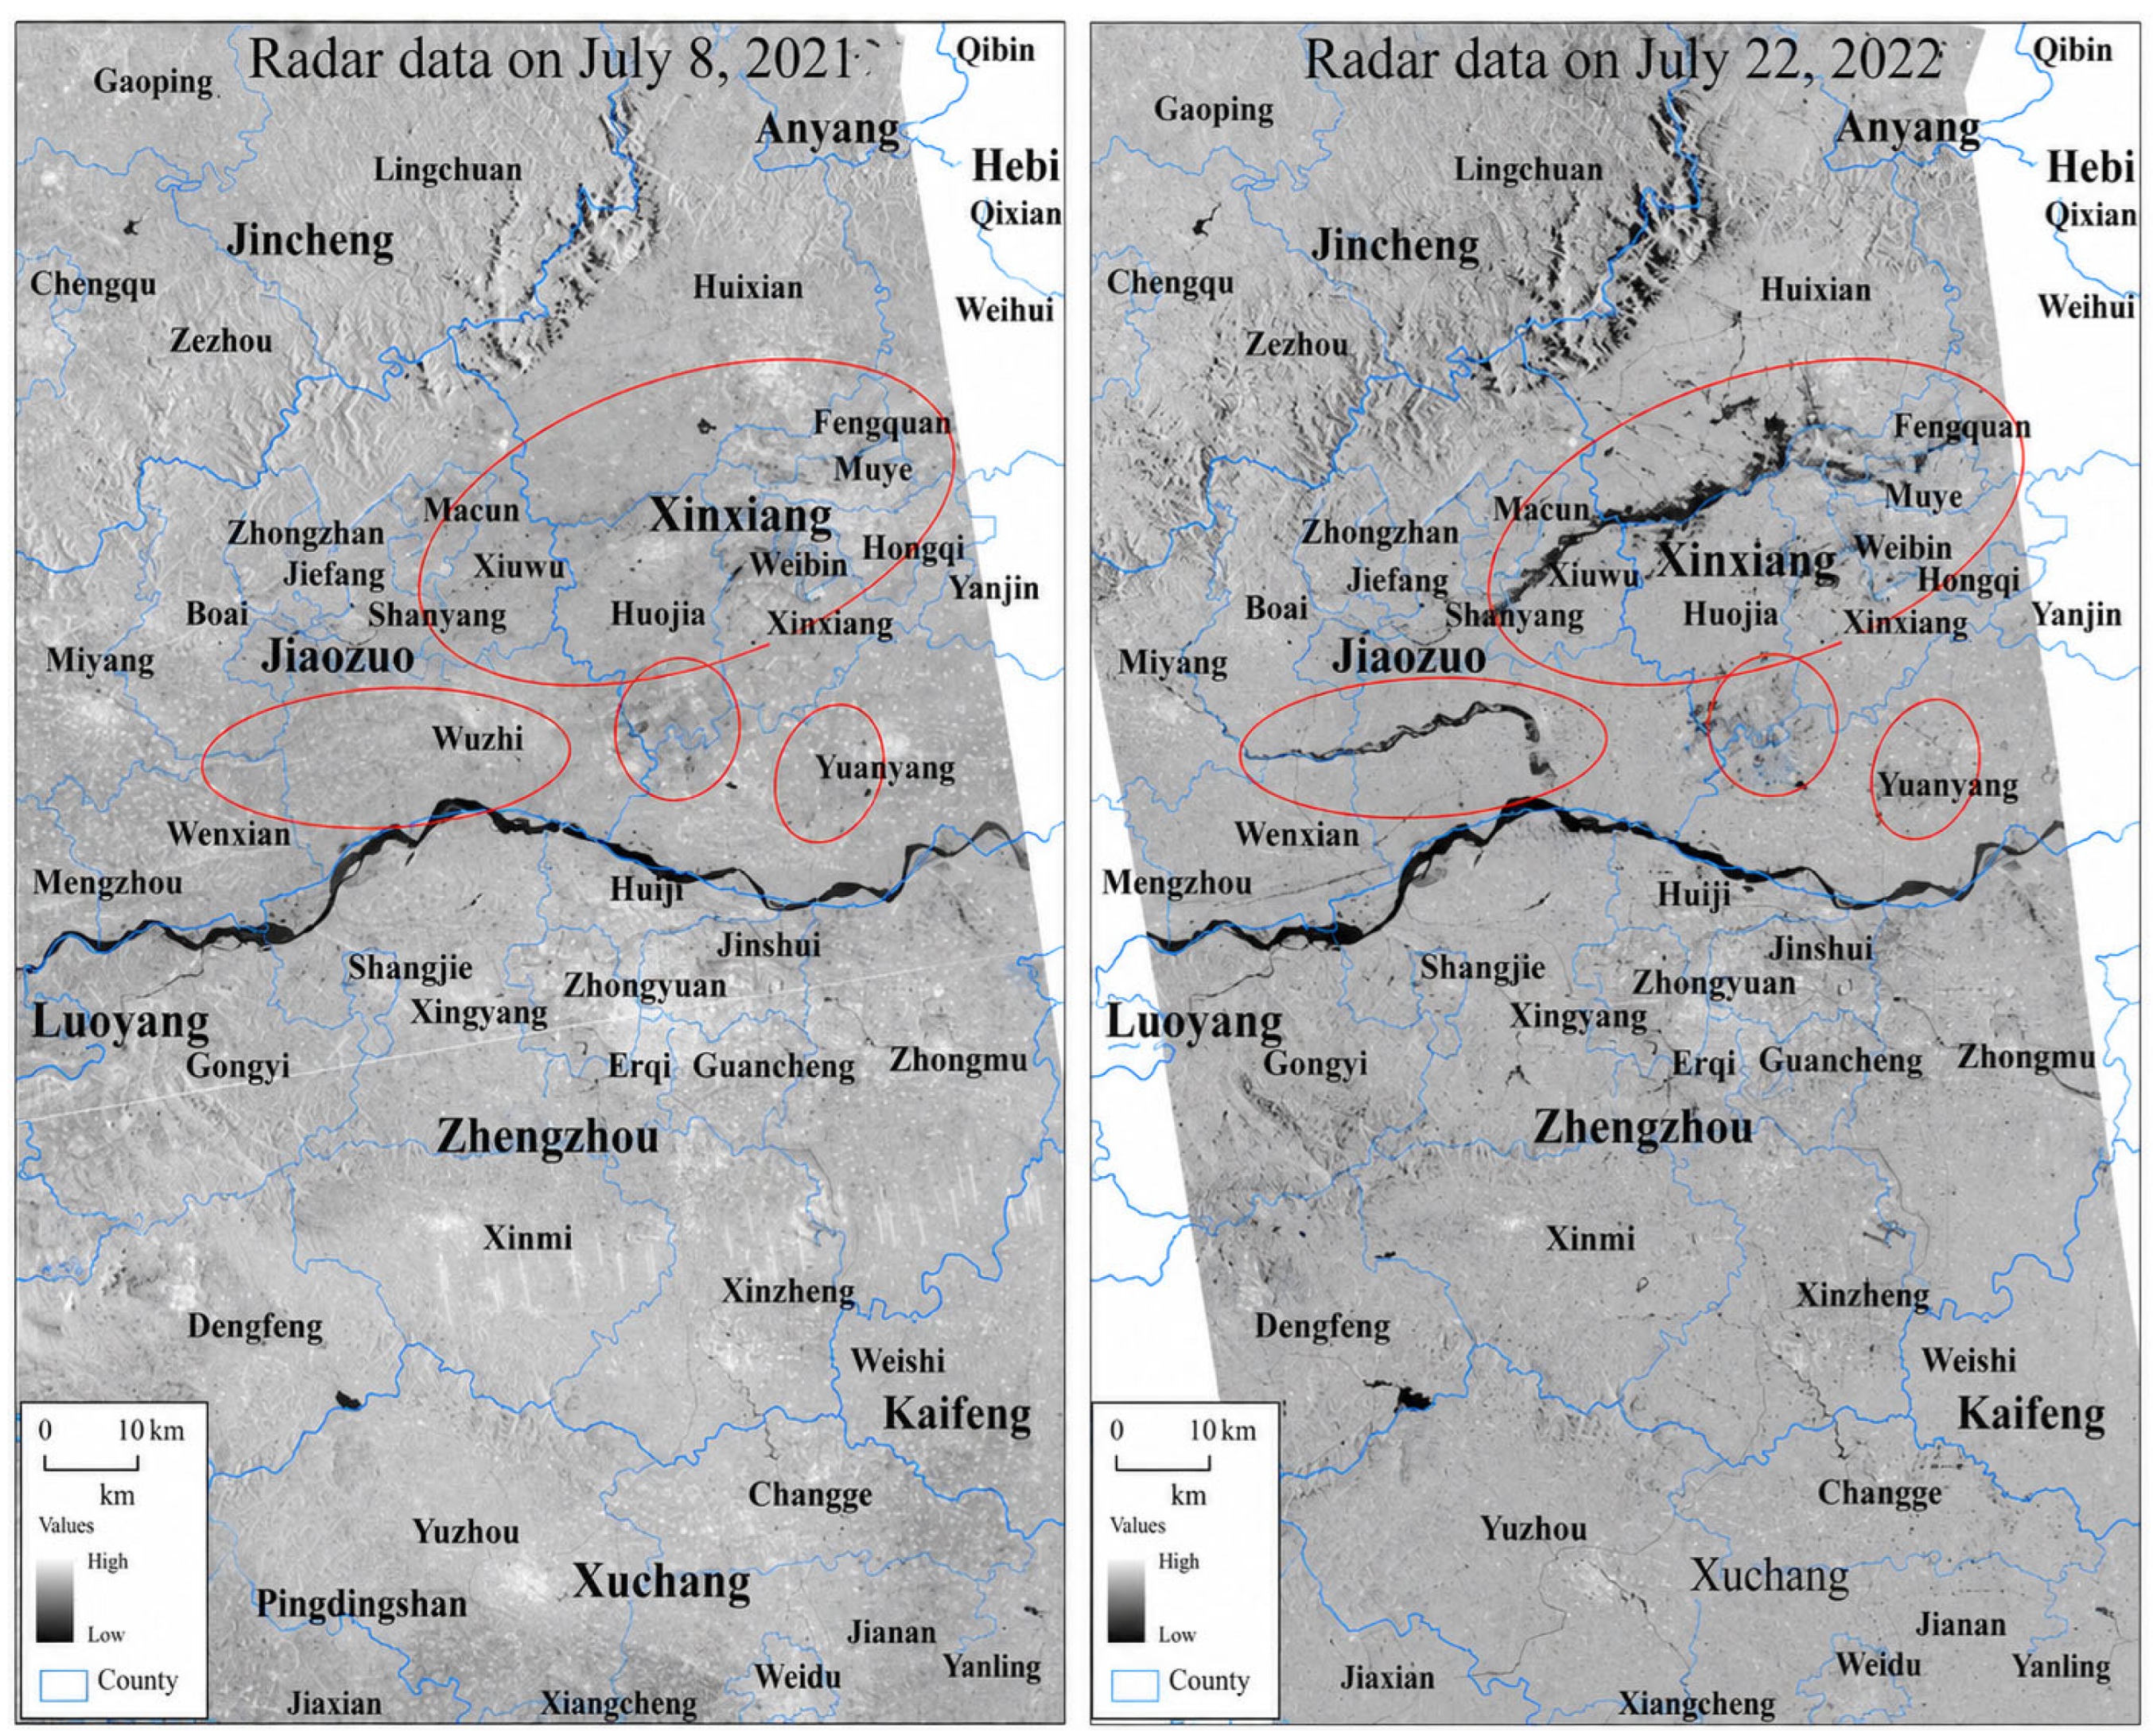
Gaofen-3 (GF-3), the first Chinese C-band SAR satellite capable of multi-polarization observation, generates high-resolution imagery with a finest spatial resolution of one meter (Figure 2). For the GF-3 data, we used PIE-SAR to carry out data extraction, multi-look processing, Frost filtering for speckle noise reduction, terrain correction, and geocoding. Multi-look processing addresses the issue of coherent superposition of radar echoes within a single pixel, which causes significant speckle noise in the intensity image. This technique reduces noise by averaging multiple independent observations (or “looks”) in the azimuth and/or range directions, resulting in multi-looked intensity data. The number of looks is determined based on the slant-range and azimuth resolutions, as well as the incidence angle, to achieve uniform ground resolution in both the azimuth and ground range directions. To avoid over-sampling during geocoding, it is recommended to maintain consistent spatial resolution between the multi-looking and geocoding stages. This relationship is expressed in Equation (1).
d r = s r s i n θ
where dr is the ground distance resolution, sr is the slant resolution, and θ is the angle of incidence.
Due to the random distribution of scattering units, the distances between these units and the radar antenna vary randomly. As a result, each unit reflects an echo with the same frequency but a different phase, leading to constructive or destructive interference. The coherent superposition of these reflected waves produces a speckle pattern, characterized by significant intensity fluctuations even among adjacent pixels. This granular noise degrades image quality, increases the difficulty of visual interpretation and automated analysis, and reduces the accuracy of image segmentation and feature classification. To mitigate speckle noise in the Gaofen-3 radar data, the Frost filter is applied. This adaptive filtering method utilizes local neighborhood statistics to weight pixel values within a defined window around each target pixel. The resulting filtering equation is given in Equation (2):
R ^ ( x , y ) = i j m ( x + i , y + j ) I ( x + i , y + j )
where (x,y) refer to the coordinates of the pixel subject to noise removal, i and j represent the offset within a window of a certain size. m ( x + i , y + j ) is the weighted value of the pixel value, which decreases with distance; therefore, the estimated value of a pixel is calculated as a weighted average of the pixel values within a defined neighborhood in the noisy image. The weight is calculated as follows (Equation (3)):
m ( x + i , y + j ) = K 2 α e a | t |
where α 2 = K · C I 2 , K is a constant, and C 1 = σ I I ¯ , where C I 2 is called the coefficient of variation of the window in the image domain, K 2 is the normalization constant, and t = i 2 + j 2 . Finally, the Frost filtering formula can be simplified to (Equation (4))
m ( x + i , y + j ) = K 1 α e K C I 2 ( t 0 ) | t |
where K 1 is the parameter when filtering, and K is the normalization constant. Finally, we perform topographic correction and geocoding processing on the data combined with the topographic data.

2.3.2. Moonlight Dataset and Processing

Moonlight remote sensing is a technique that utilizes moonlight—the only available natural light source at night in nature—to achieve passive optical Earth observation during nighttime [18,22]. It provides intuitive optical imagery at night and thus holds irreplaceable and unique value in fields such as polar research, environmental monitoring, and disaster prevention and mitigation [26,27]. It provides an important supplement to conventional daytime optical and radar remote sensing methods. In this study, the VNP46 dataset from NASA’s Black Marble nighttime lights product suite was employed. This dataset is produced and processed by NASA’s Science Investigator-led Processing System (SIPS) within the Land Science division and is designed for routine global-scale operations. It facilitates the estimation of daily nighttime light (NTL) as well as other inherent surface optical characteristics.
For the VNP46A1 product, a daily nighttime radiance dataset at the top of the atmosphere. This Level 3 product is derived from VIIRS Day/Night Band (DNB) observations and corrected for atmospheric, topographic, lunar illumination, bidirectional reflectance distribution function (BRDF), thermal, and stray light effects [28,29,30,31,32,33]. In the data preprocessing step, we performed mosaicking and cropped the data to the spatial extent of the study area, while excluding datasets with severe cloud contamination. This study utilized eight scenes of cloud-free moonlight remote sensing data as shown in Table 2.

2.3.3. Landcover Dataset

The 2020 land cover of Henan Province was characterized using the ESRI 10-m Land Cover dataset [34], which provides a global classification based on Sentinel-2 satellite imagery. To tailor the dataset for subsequent flood impact analysis, a series of preprocessing steps were undertaken. First, the global raster was clipped to the administrative boundary of Henan Province using a vector mask. Following the clipping, the data were resampled using the nearest-neighbor method to ensure perfect pixel alignment with other geospatial datasets used in this study. Finally, a manual inspection was conducted to identify and remove anomalies, such as isolated pixels or obvious misclassifications, to enhance the overall accuracy and consistency of the land cover classification. This refined land cover map (Table 3) served as the fundamental base for quantifying land use types within the flood-inundated areas.

2.3.4. Additional Data

The analysis integrates a 12.5 m resolution DEM obtained from the ALOS AW3D dataset with vectorized rural administrative boundaries of Henan Province sourced from the GADM database [35].

2.4. Methods

2.4.1. Overall Methodology of This Study

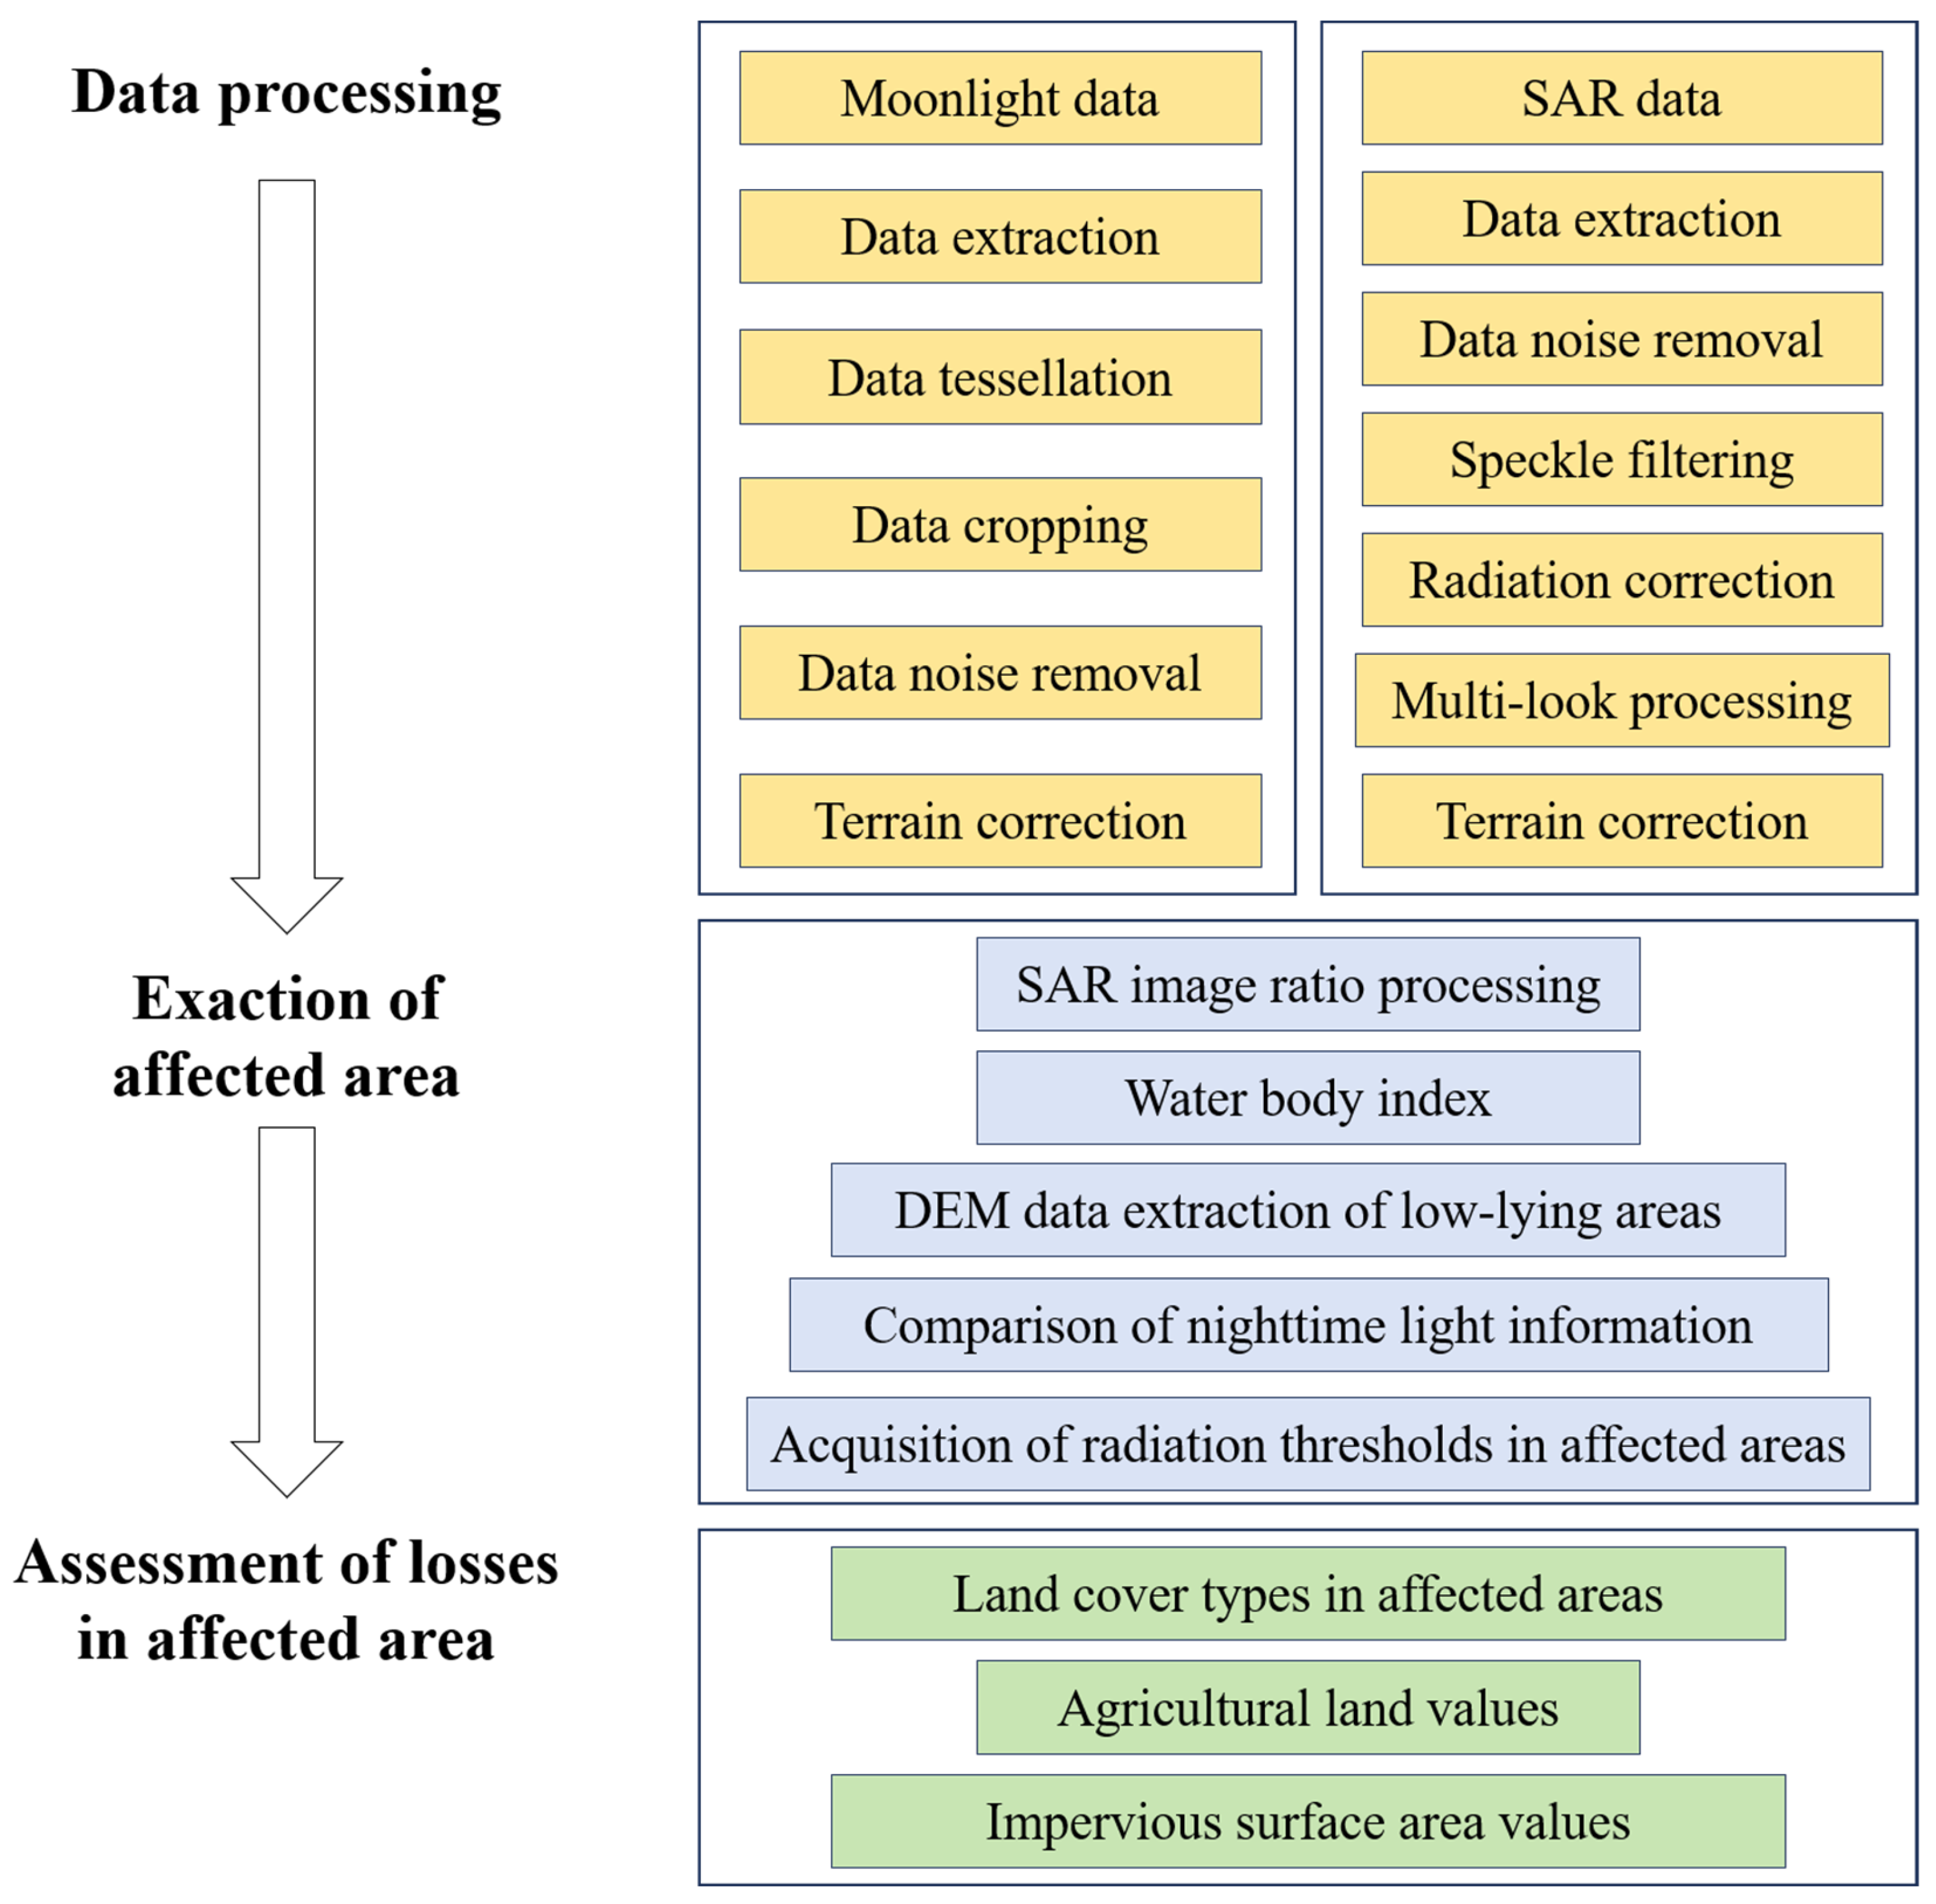
The method for assessing the economic losses caused by Zhengzhou’s catastrophic floods consists of three main steps. First, we preprocess the acquired radar remote sensing data (Gaofen-3 and Sentinel-1) and moonlight remote sensing data (VIIRS/DNB). Next, we extract the flood-affected areas by combining the threshold method with visual interpretation. Finally, we conduct a systematic evaluation of economic losses for each affected region by integrating topographic and administrative boundary data. The methodology of this study is illustrated in Figure 3.

2.4.2. Flood Information Extraction

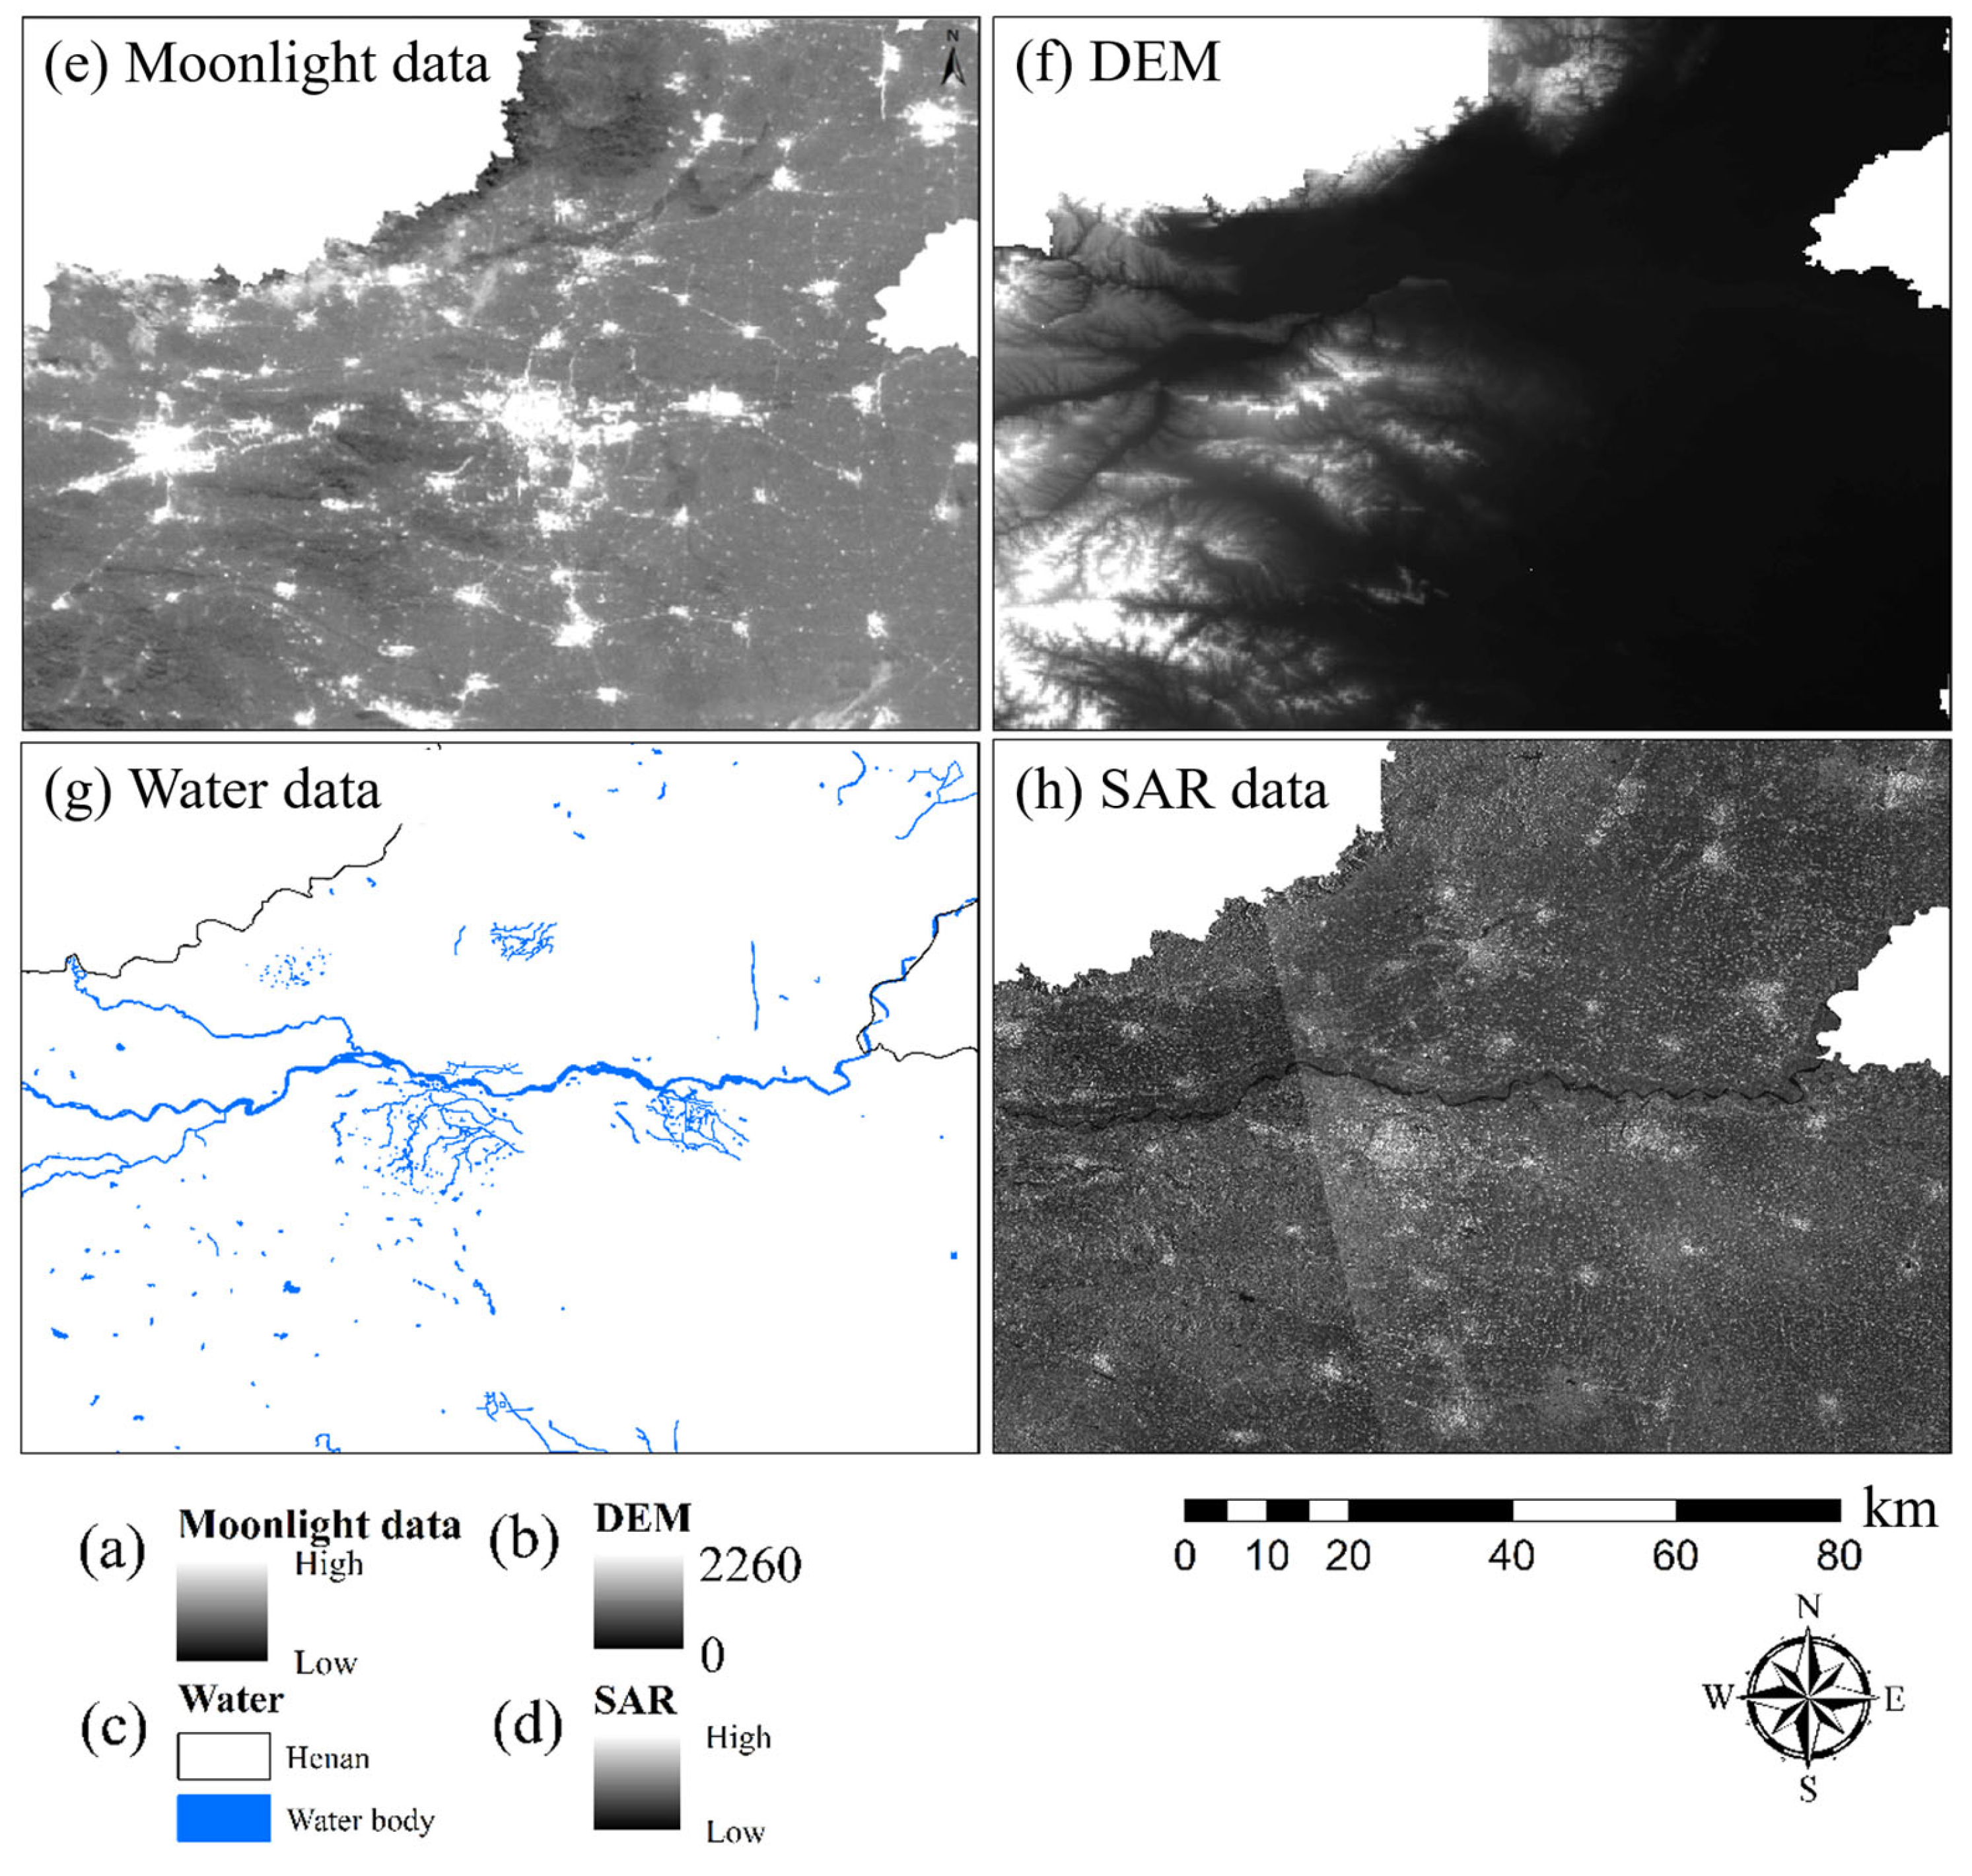
The backscatter coefficient of water box dies is lower compared to other land features, causing water bodies to appear darker in SAR imagery. We can utilize SAR images from before and after the flood disaster, enhancing the representation of water areas by performing ratio processing on the backscatter coefficients. By applying formulas such as water indices to process remote sensing images, we can obtain pre-disaster water body data for rivers and lakes. Analyzing DEM data helps us understand the elevation information of affected areas, through which we can identify potential regions impacted by flooding. Nighttime light data can show changes in lighting conditions in cities and rural areas before and after a flood disaster [36,37,38]; areas affected by the disaster often experience significant reductions or complete loss of light (Figure 4).
We used the partial flood extent derived from Gaofen-3 SAR data to determine a radiance threshold for identifying affected areas in the lunar illumination nighttime light data. In this study, pixels with values between 26 and 60 nW/cm2/sr were classified as potential flood-affected regions. Finally, the complete inundation map was generated by integrating pre-existing water body vector data and digital elevation model (DEM) data to refine the boundary and exclude false positives, as shown in Figure 5.

2.4.3. Loss Assessment Method

To quantify the severe socioeconomic impacts of the flood, this study specifically assessed the direct economic losses associated with cropland and buildings, which constitute the primary assets vulnerable to damage in the study area. By overlaying the 2020 land cover dataset of Henan Province with the extracted flood-affected extents, the spatial scales of inundated cropland and damaged buildings were determined. The total economic loss was then calculated using the following equation:
L T o t a l = ( A c r o p × P c r o p ) + ( A b u i l d × P b u i l d )
where LTotal represents the total direct economic loss; Acrop is the total inundated area of cropland (m2 or ha); Pcrop denotes the average crop price per unit area in Henan Province at the time of the disaster; Abuild signifies the damaged floor area of buildings (m2); and Pbuild refers to the local average property or construction price per unit area in the corresponding urban/local region.

3. Results

3.1. Spatial Distribution of Flood-Affected Areas

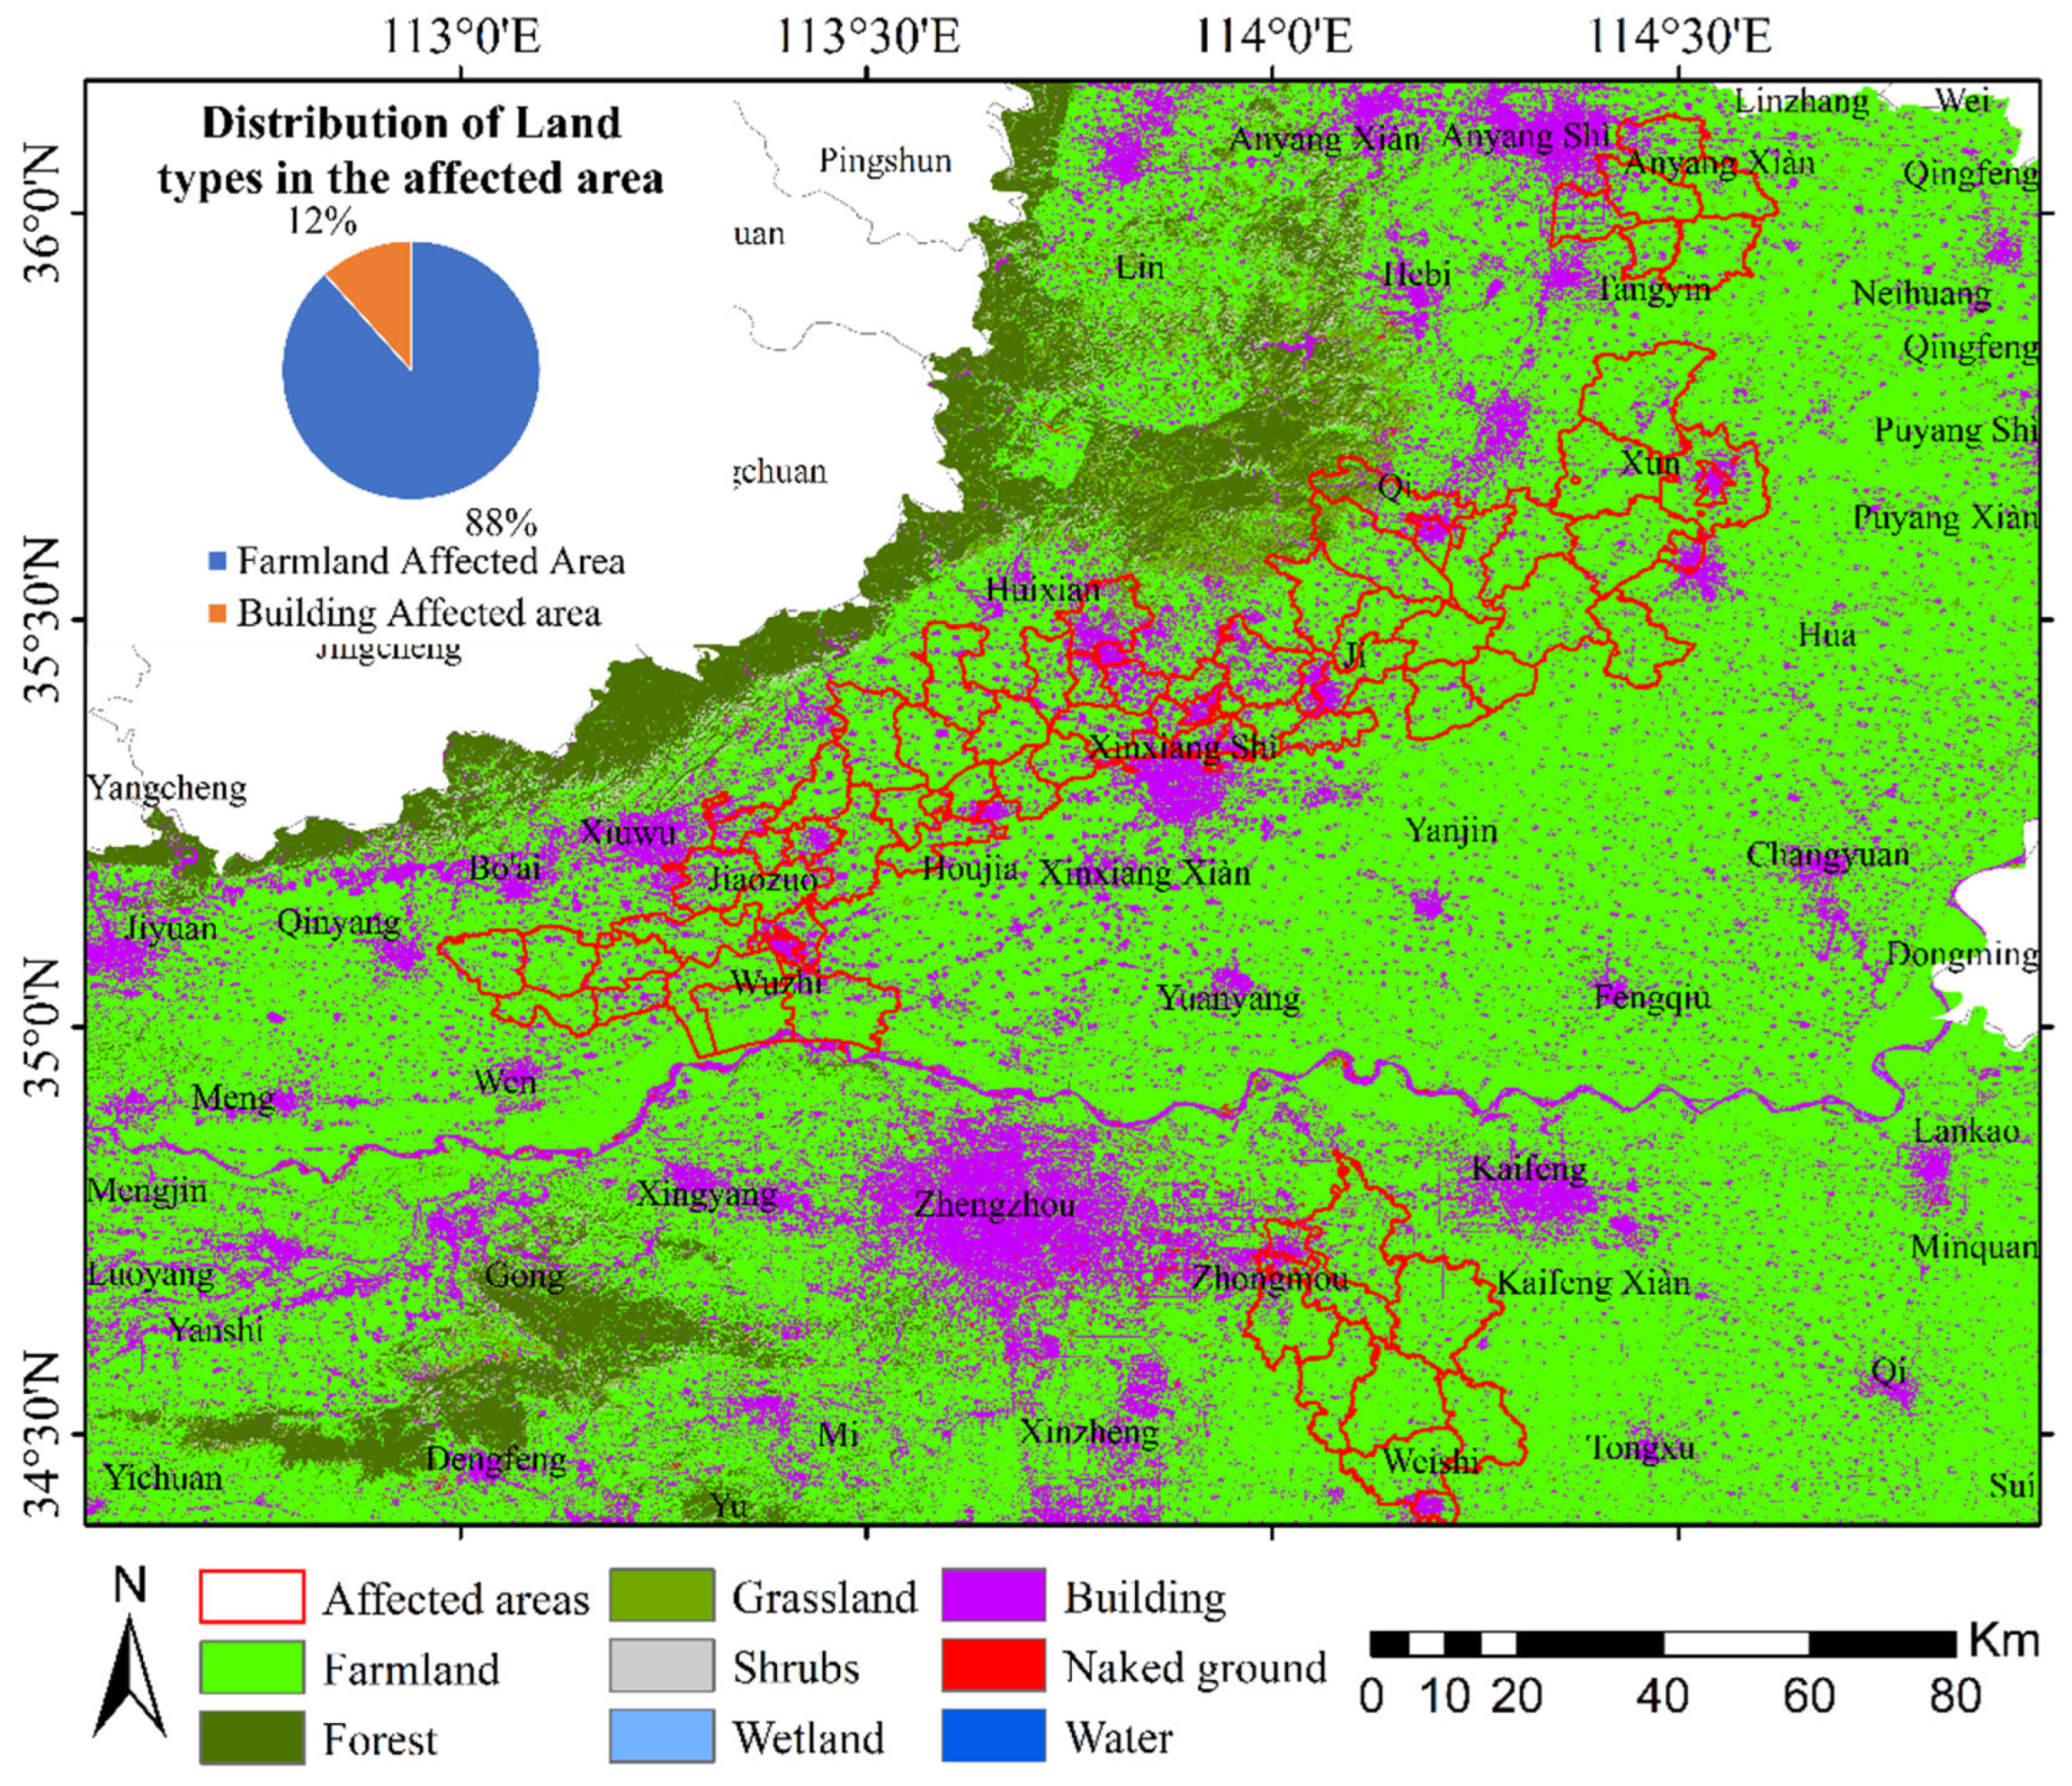
By integrating multi-source remote sensing data, we quickly delineated the flood-affected regions during the July 2021 extreme rainfall event in central Henan. As shown in Figure 6, the most severely impacted regions are located north of Zhengzhou, including Qixian and Xun counties (Hebi City), Fengquan, Muye, Weibin districts, and Huixian, Xinxiang, Huojia, and Yuanyang counties (Xinxiang City), as well as Shanyang and Xiuwu counties, Jiefang District, and Wuzhi County (Jiaozuo City). Additional flooding was observed further south and east, affecting parts of Xuchang and Kaifeng cities.
We further analyzed the flood-affected area by integrating the 2020 land cover classification data and rural administrative boundaries, as shown in Figure 6. The inundated areas were predominantly farmland and built-up regions. Among the affected cities, Xinxiang had the largest extent of flooded built-up areas.
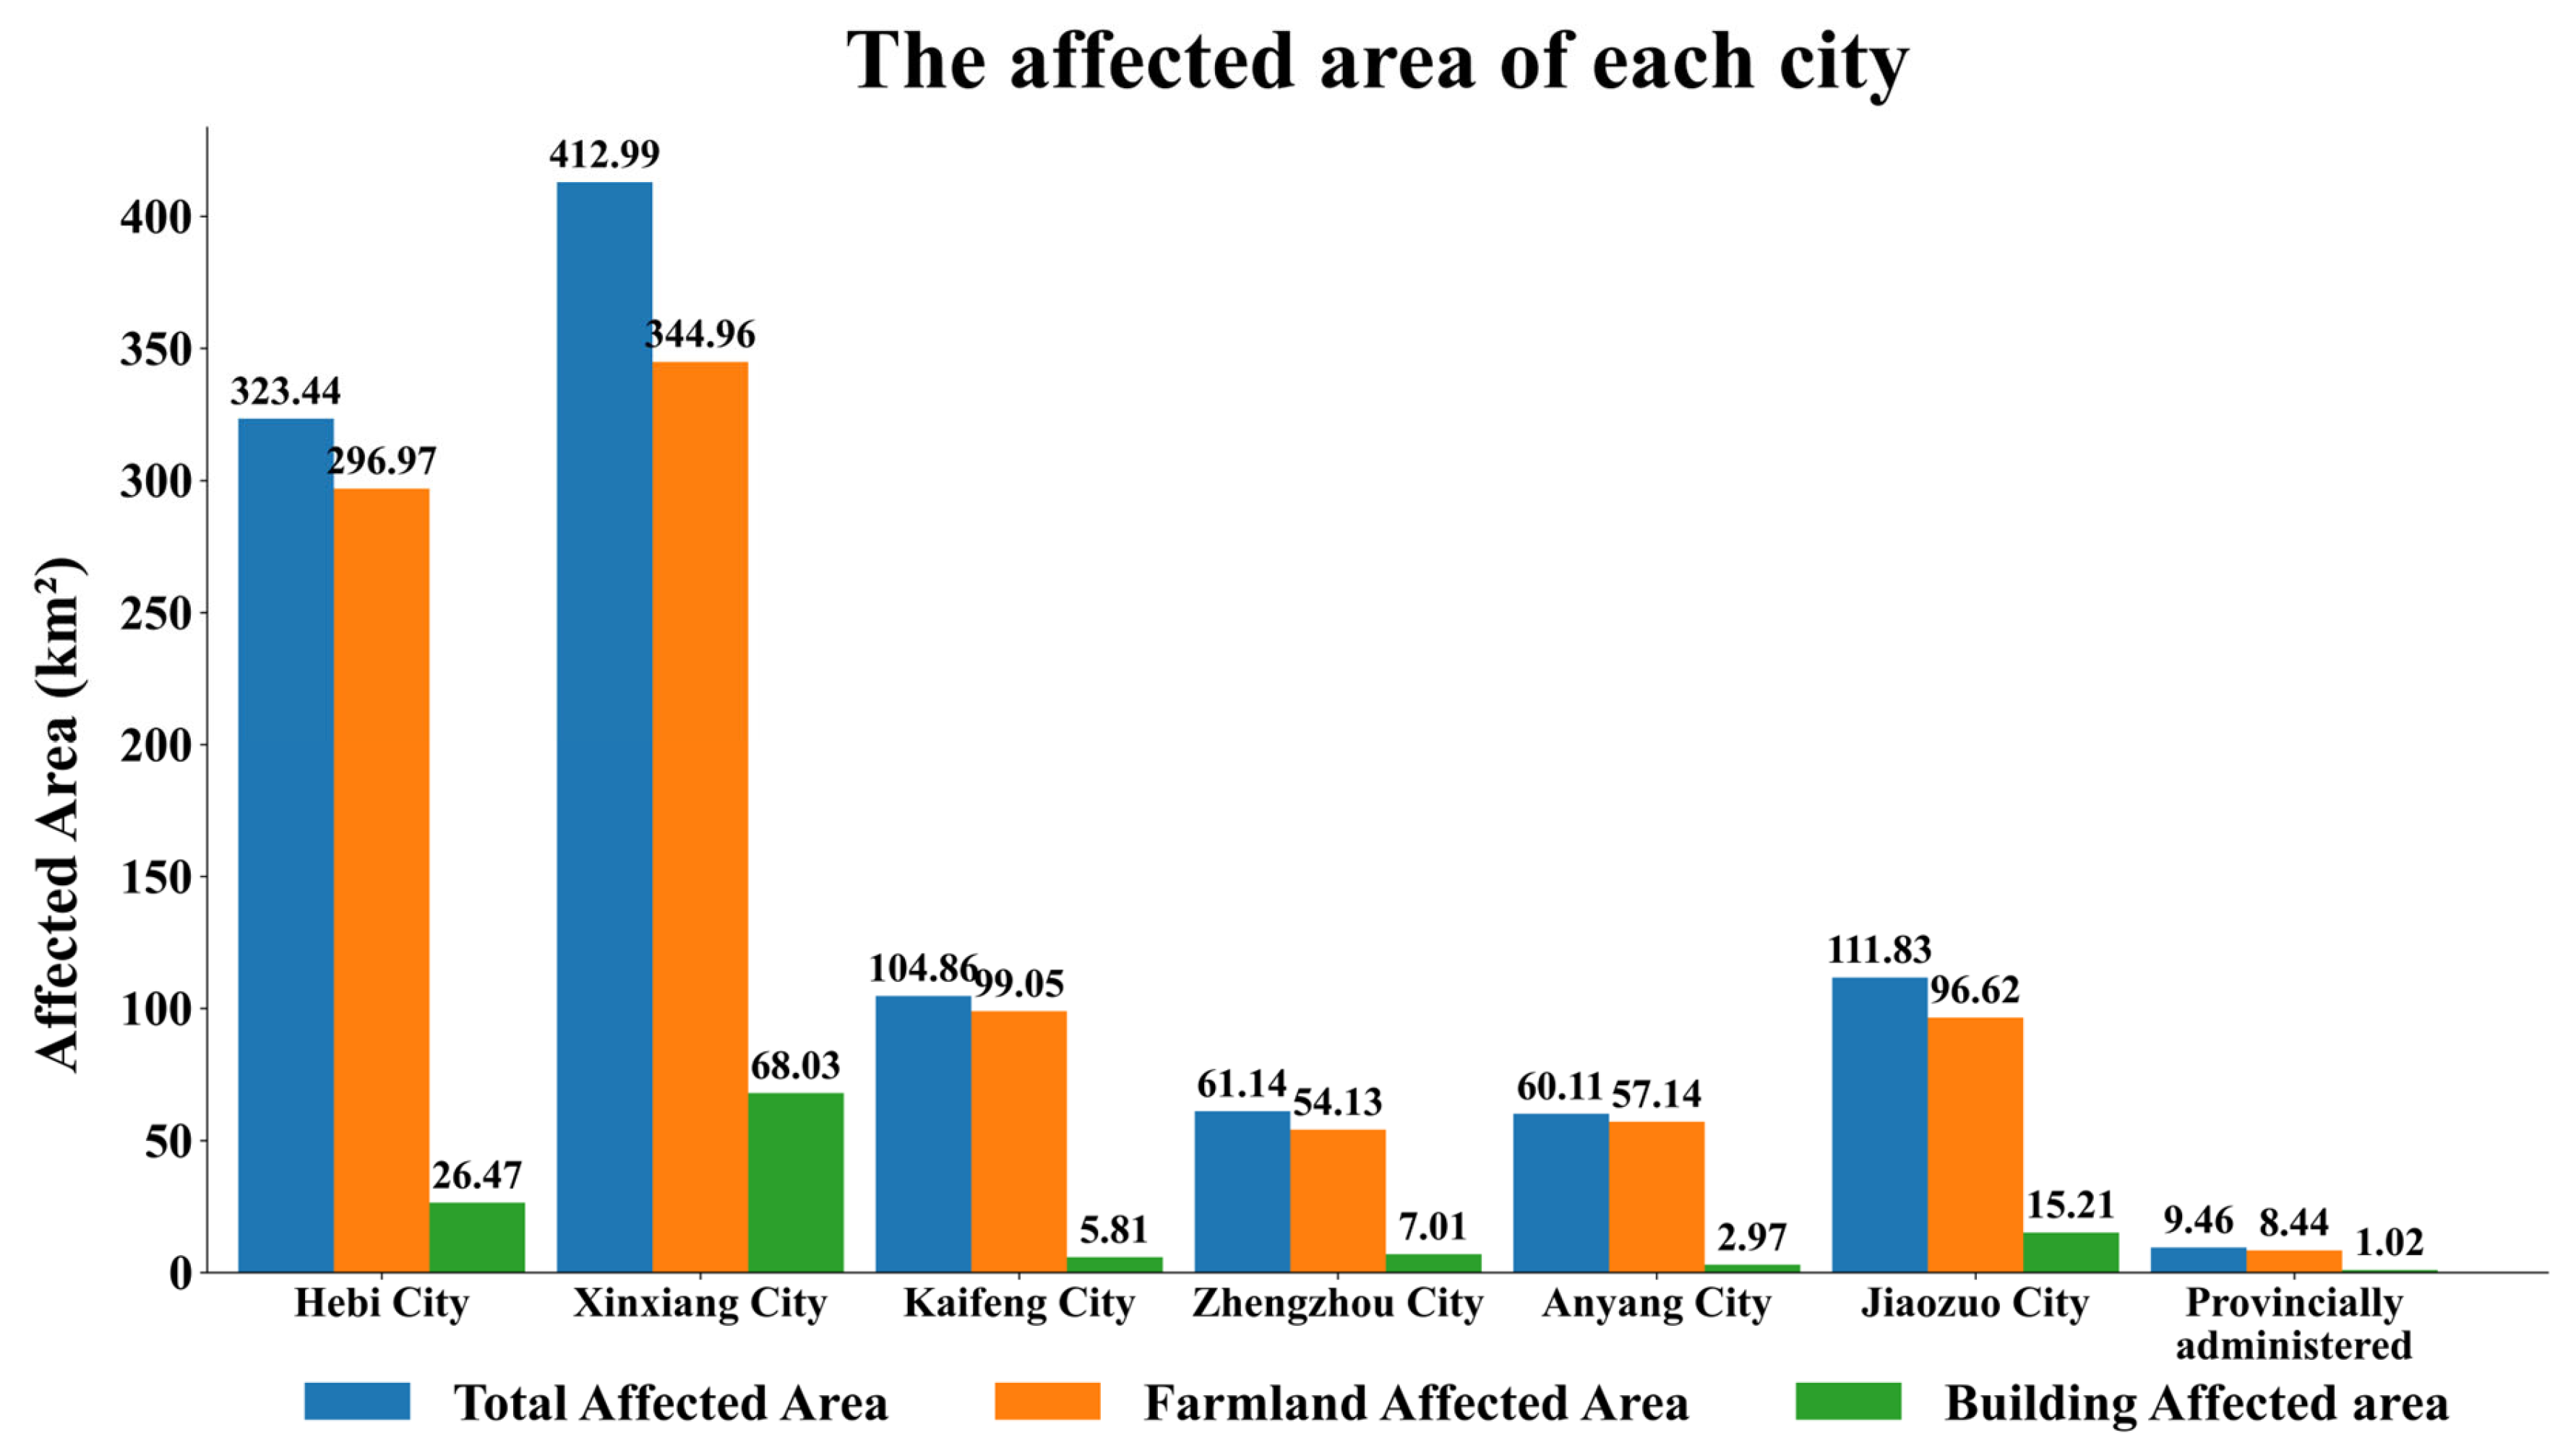
A detailed summary of the affected urban areas was compiled (Figure 7). The results indicate that Xinxiang City was the most severely affected, with a total inundation area of 412.99 km2, comprising 344.96 km2 of farmland and 68.03 km2 of built-up areas (including buildings and roads). Furthermore, the cities of Hebi, Kaifeng, and Zhengzhou also experienced significant affected areas.
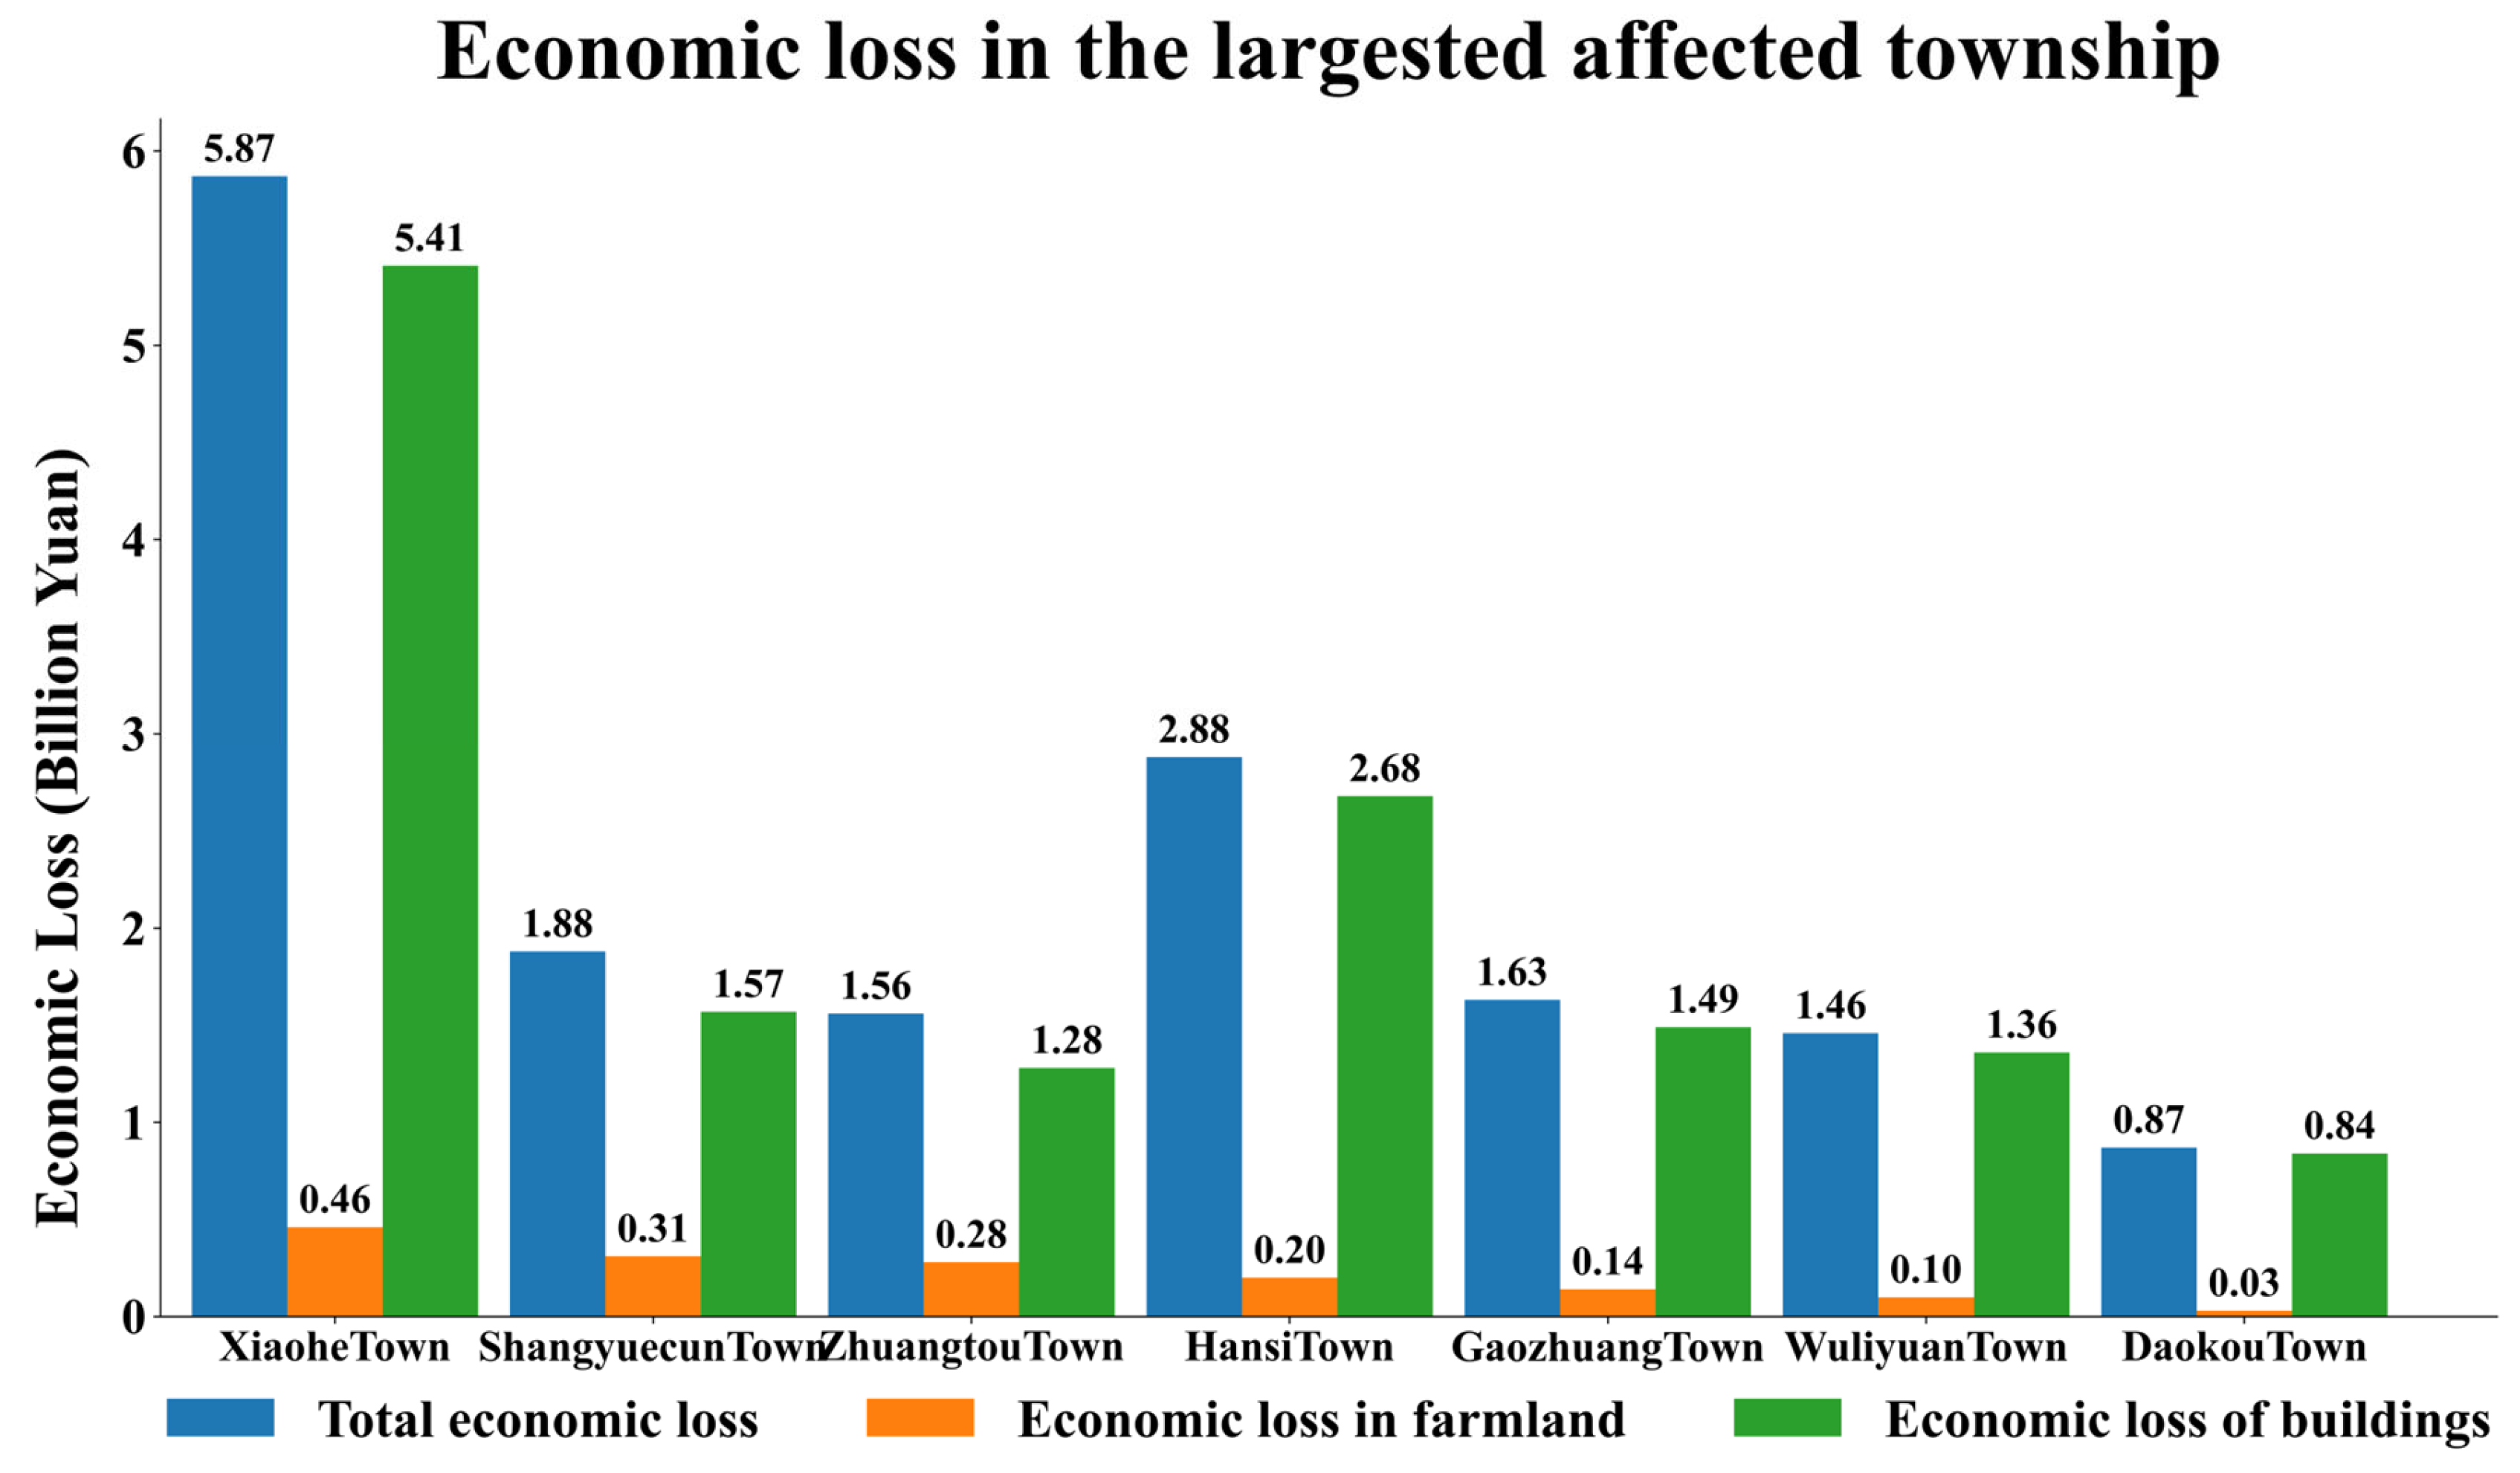
Then, a detailed summary of the affected townships was compiled (Figure 8). The results indicate that Xiaohe Town in Hebi City was the most severely impacted, with a total inundated area of 88.76 km2, of which 77.31 km2 was farmland and 6.45 km2 consisted of built-up areas (including buildings and roads). And the towns of Shangyuecun and Zhuangtou Township were also severely affected.

3.2. Loss Assessment

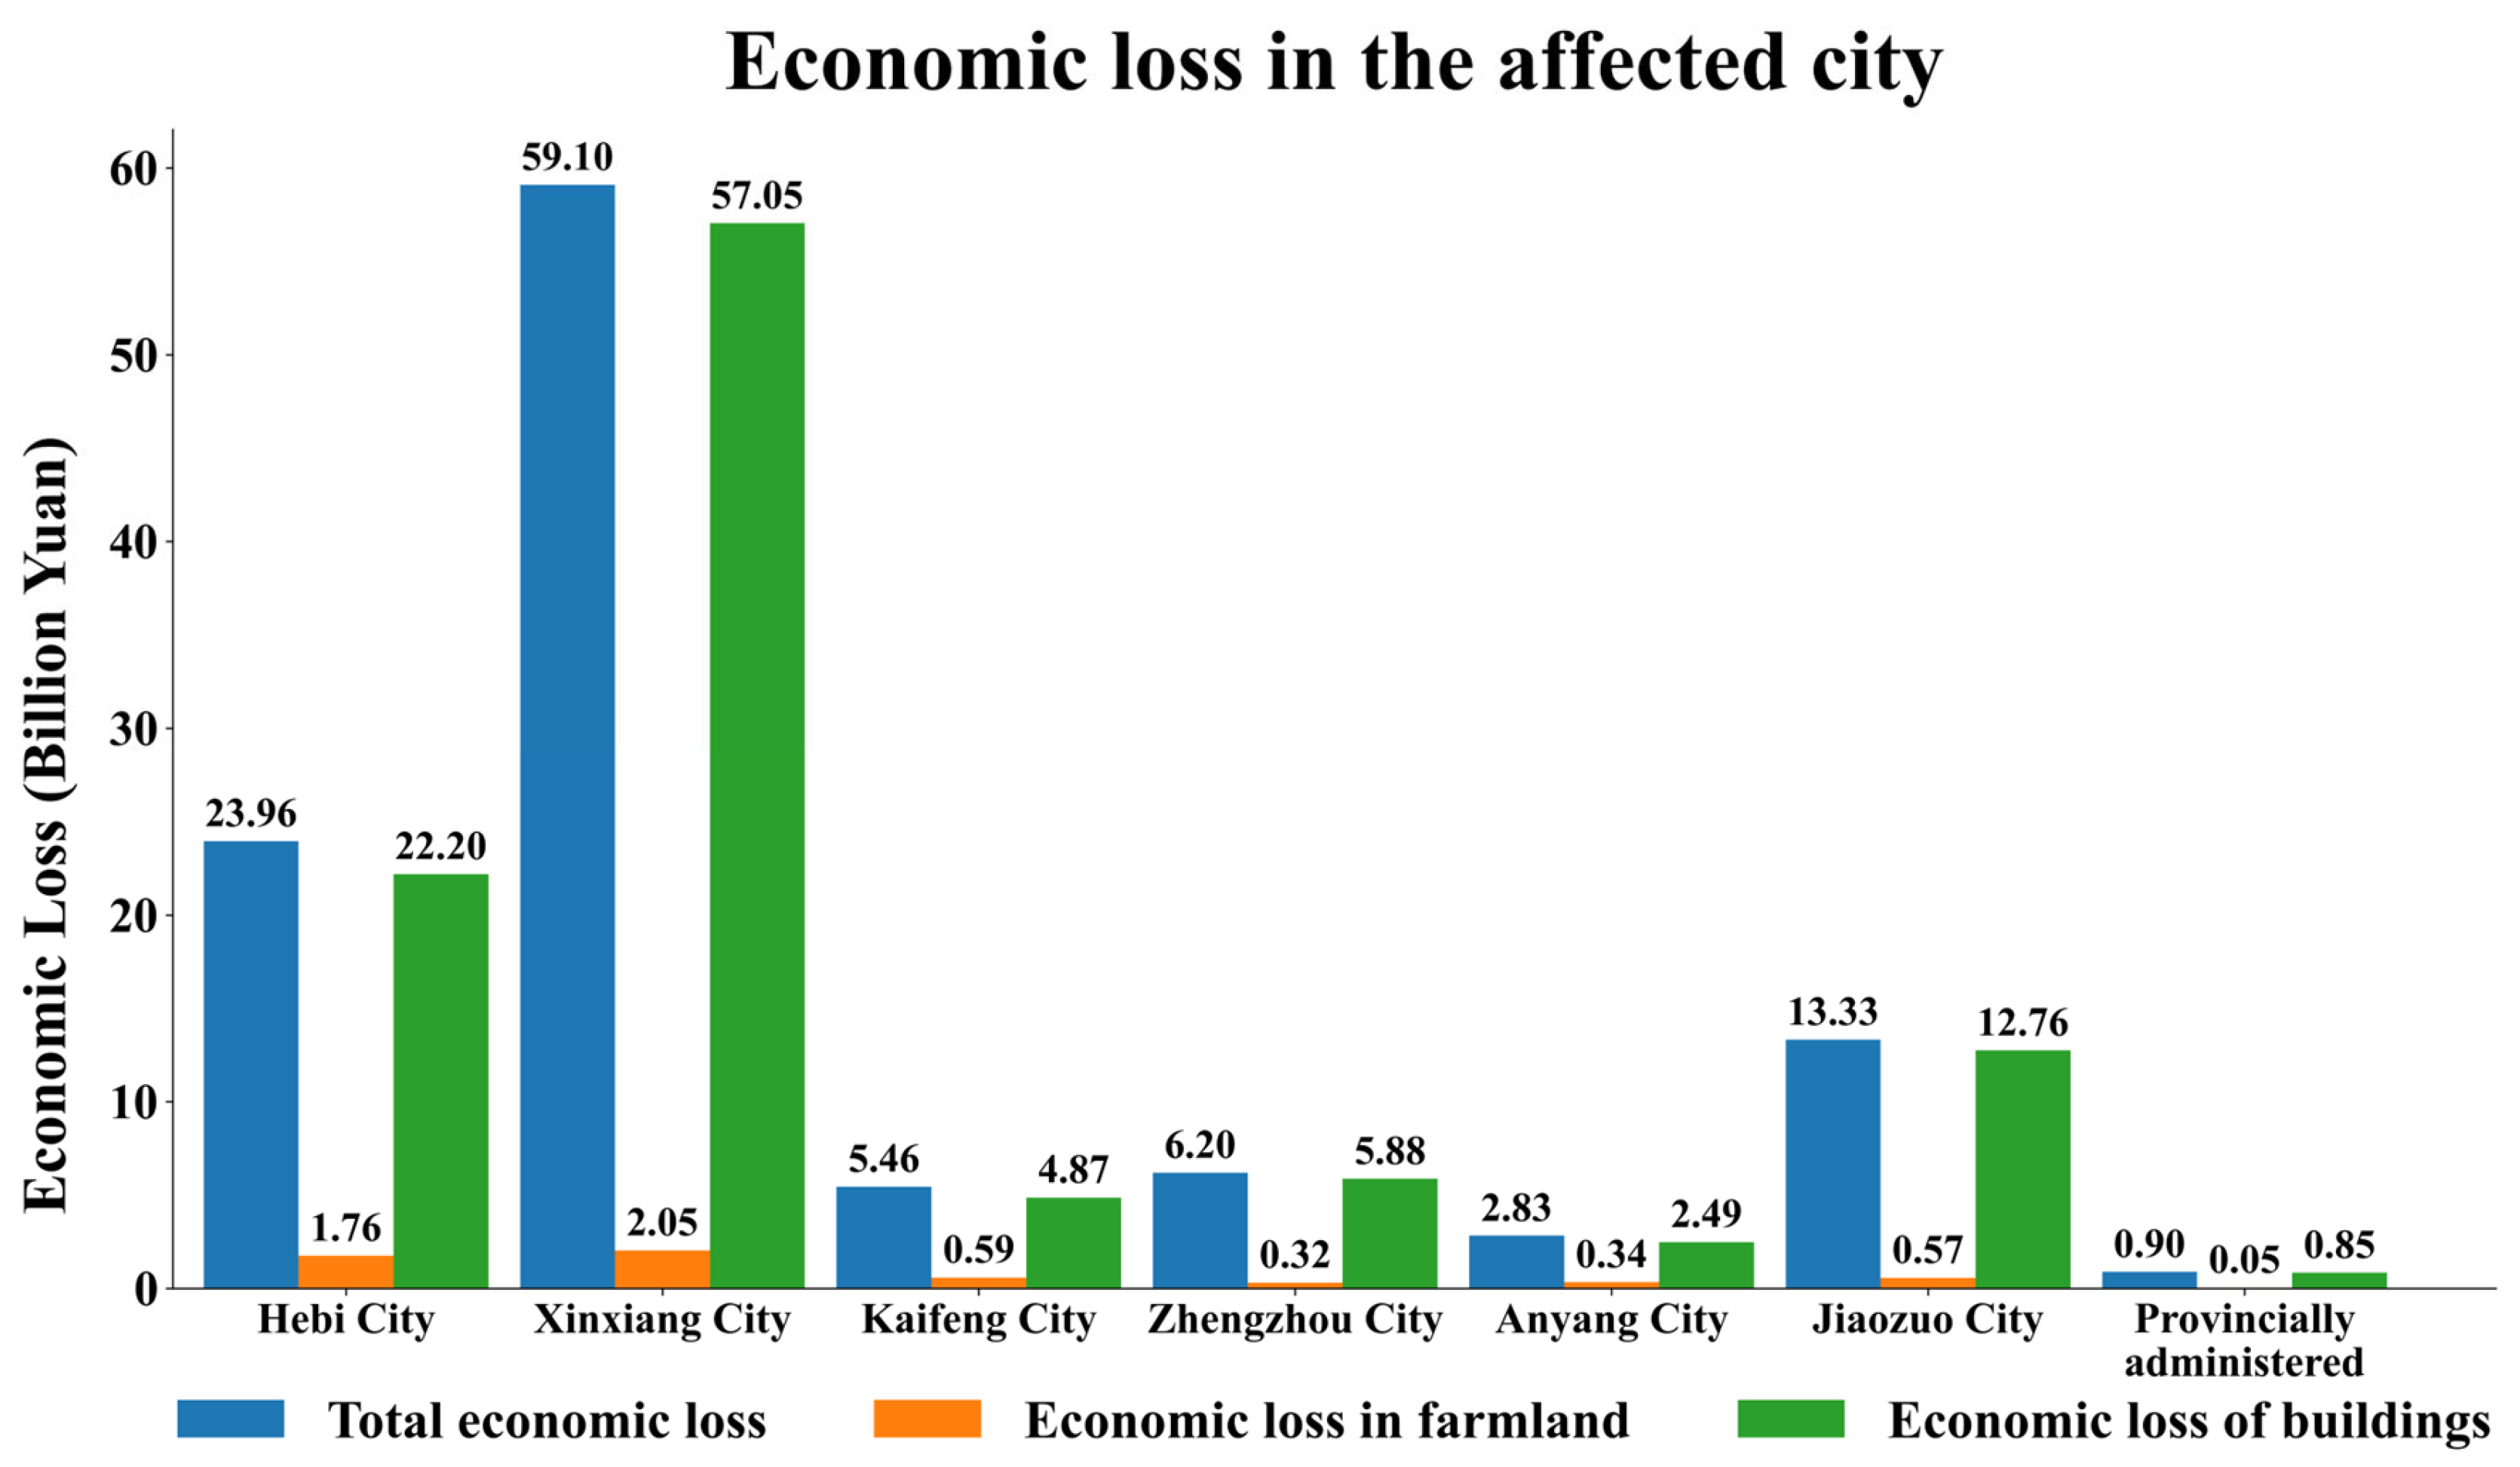
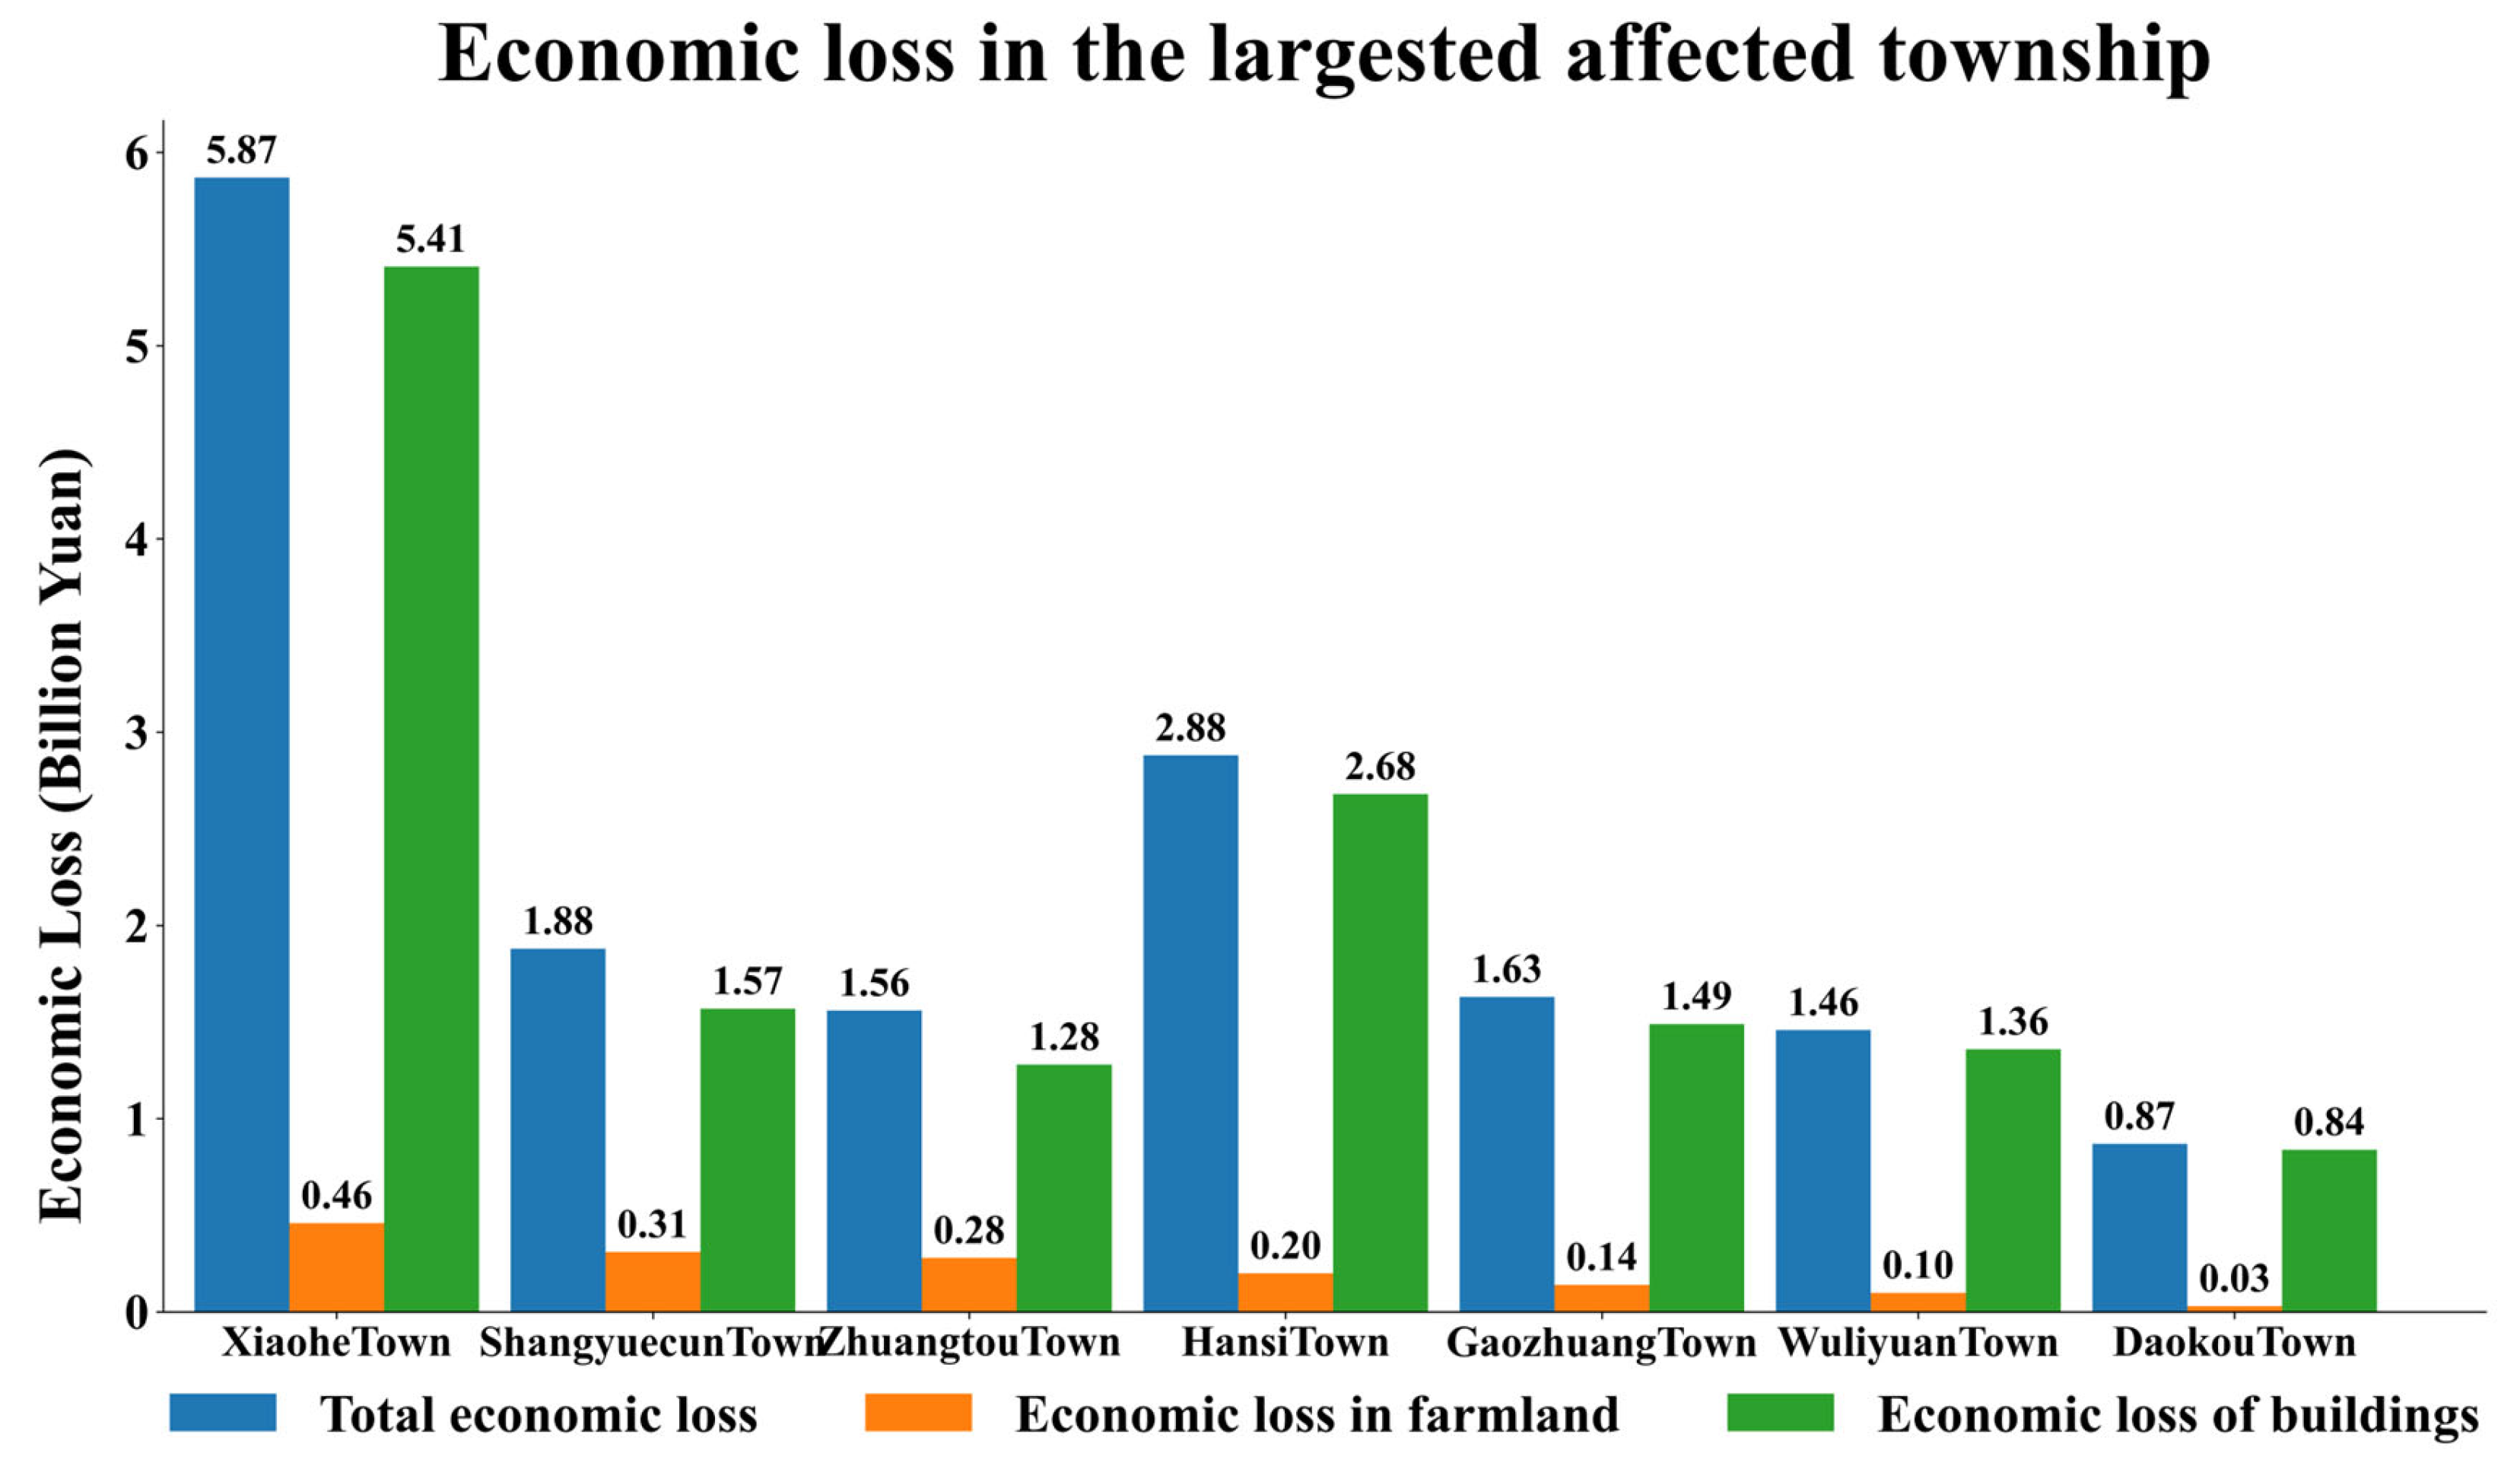
By querying the sowing area and the gross production value of grain as well as the average land price of construction in Henan Province over the years 2018, 2019, and 2020, we used the three-year average output value as the assessment standard for farmland loss, and the average land price of construction as the assessment standard for construction loss. According to the calculated loss results, we have produced a distribution map of economic losses in flood-stricken areas (Figure 9, Figure 10 and Figure 11).
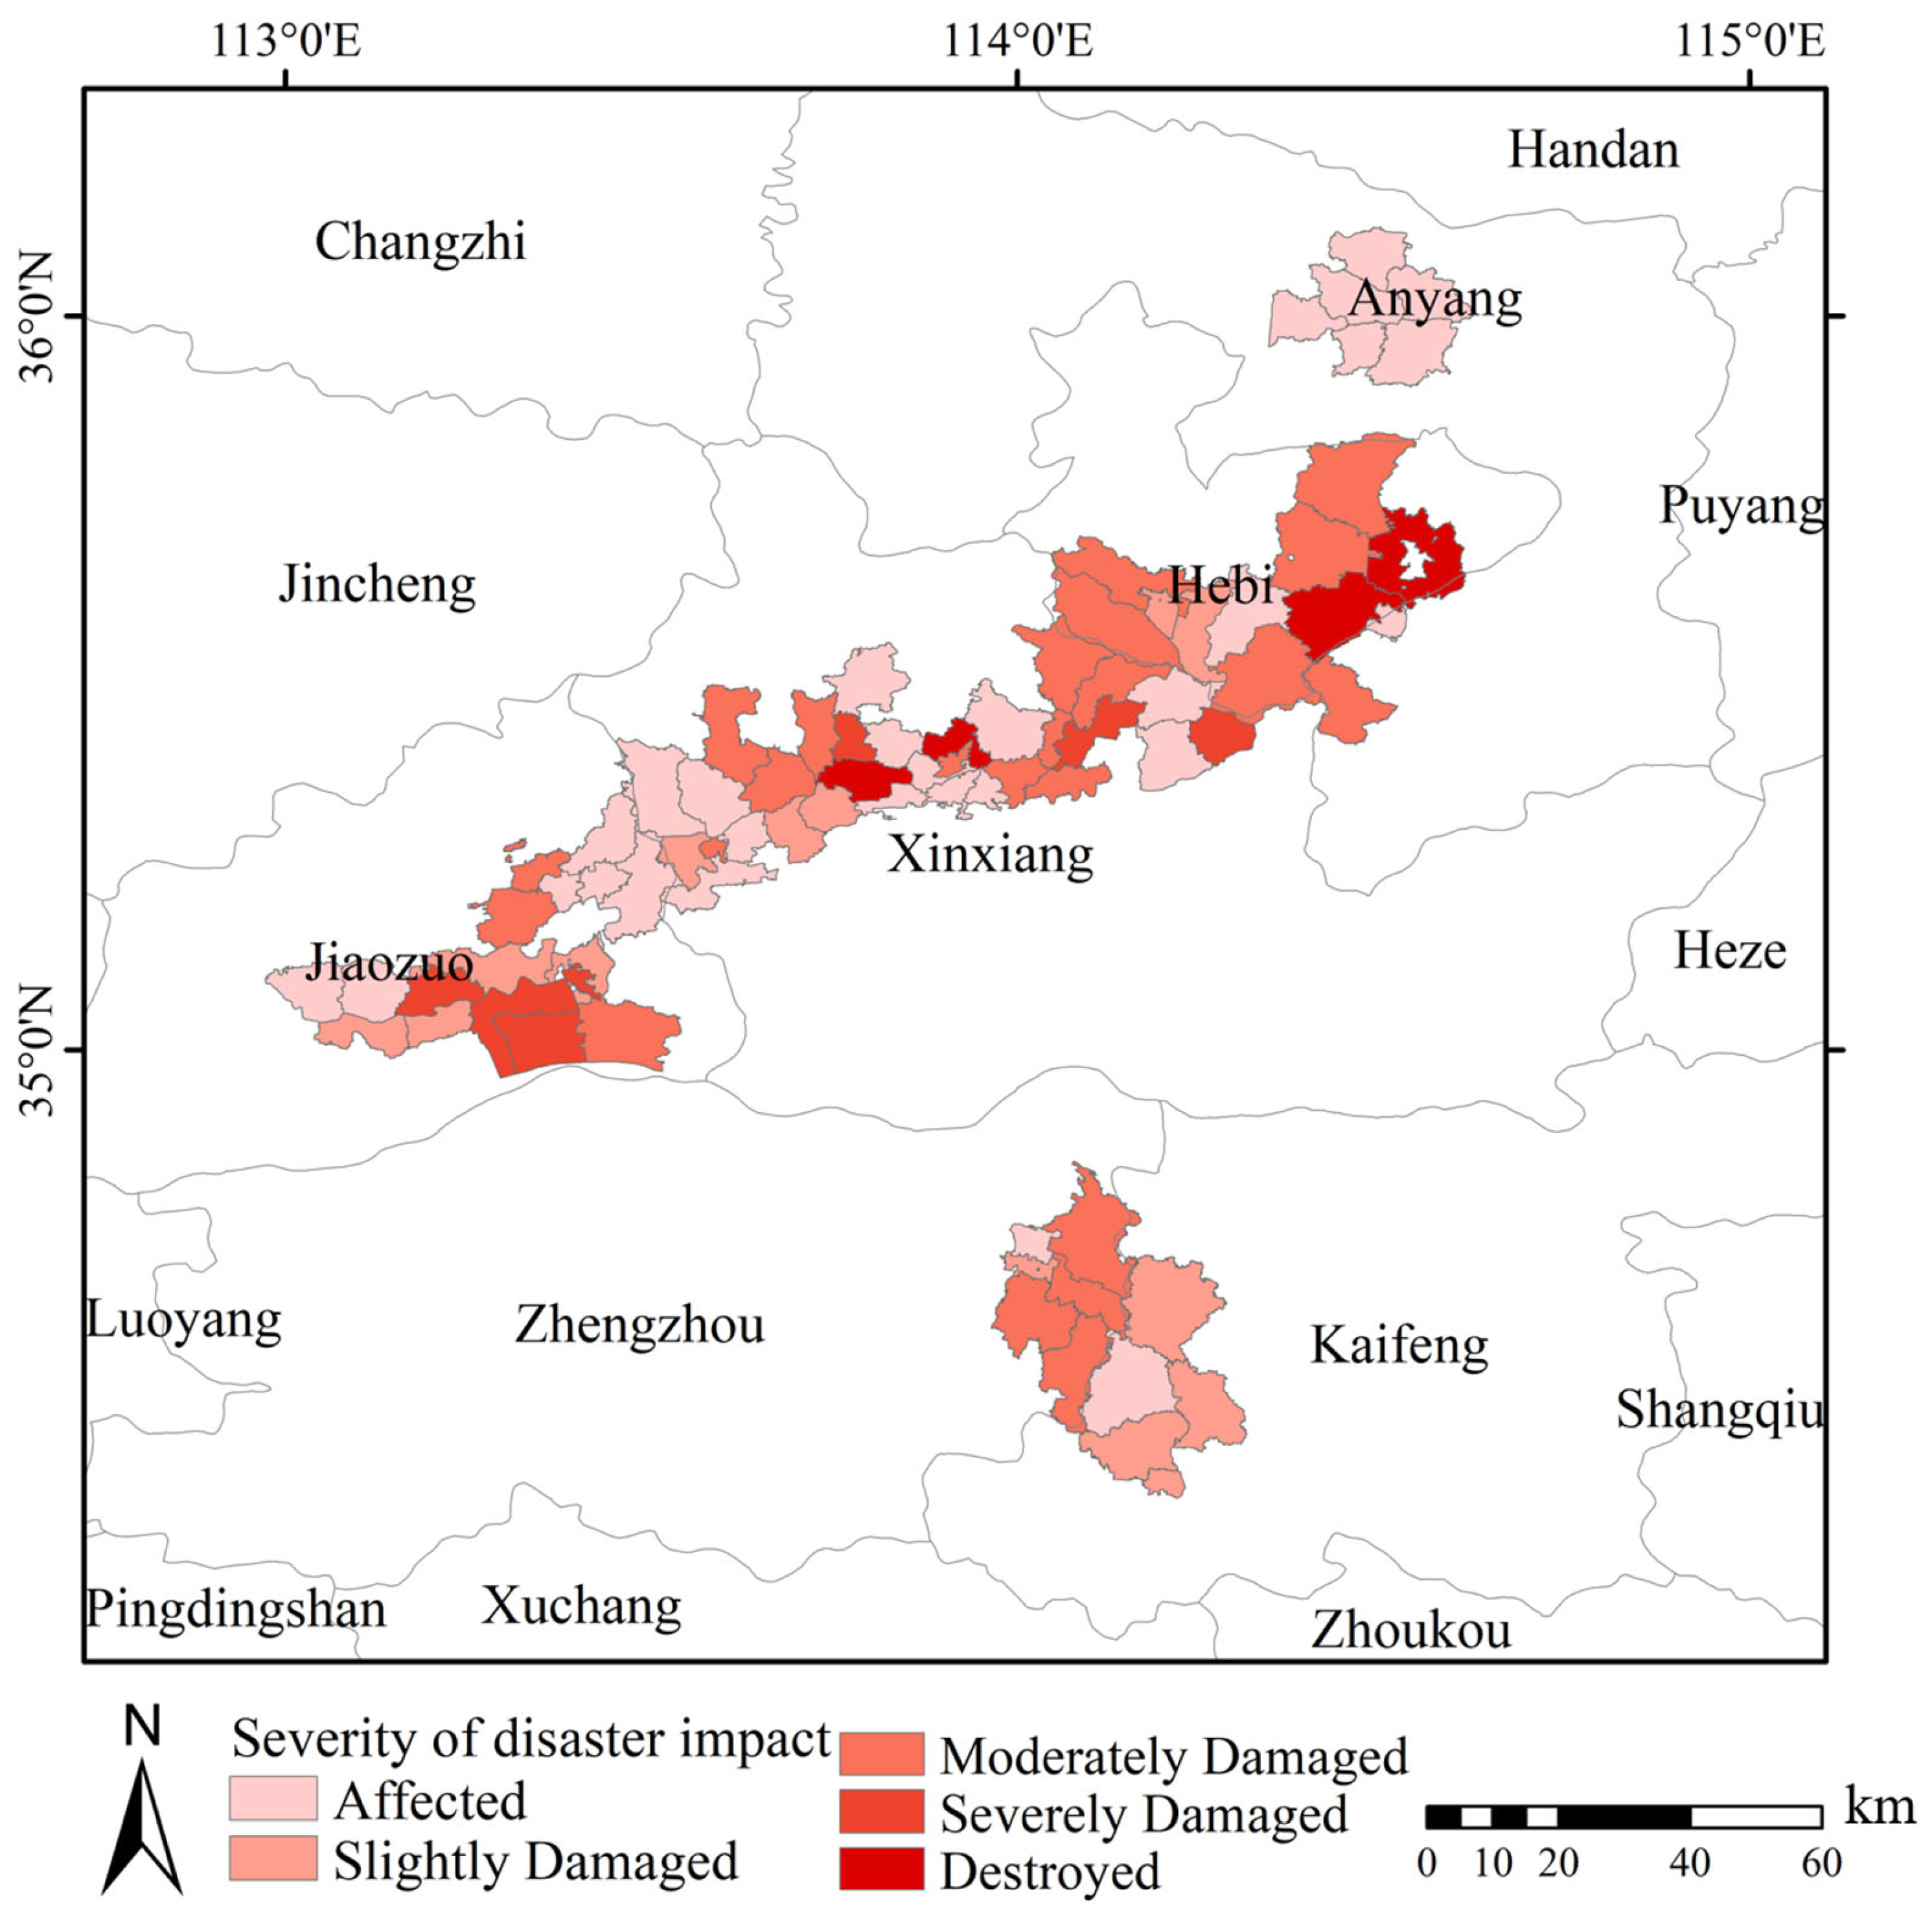
The economic loss is categorized into five damage levels based on the value range (in million yuan): Affected (0.17–171.41), Slightly Damaged (171.41–589.35), Moderately Damaged (589.35–1560.15), Severely Damaged (1560.15–2643.41), and Destroyed (2643.41–6841.07). According to the range of economic losses, we have created a distribution map of economic losses in the disaster-affected areas.

4. Discussion

Given the projected substantial increase in future fluvial flood risks across major urban agglomerations [38], moonlight remote sensing has rapidly evolved from a macro-indicator for static socioeconomic proxy estimation into a highly dynamic instrument for rapid disaster response and urban resilience assessment. While conventional daytime remote sensing effectively captures physical and structural surface alterations caused by flooding, time-series nocturnal observations—particularly those leveraging the high temporal resolution of the VIIRS Day/Night Band (DNB)—provide a unique functional perspective by continuously tracking power grid disruptions and post-disaster recovery trajectories. To bridge the gap between raw satellite observations and actionable emergency management, modern disaster evaluation paradigms increasingly emphasize the integration of multi-source data to conduct rapid infrastructure damage assessments and multi-sectoral asset vulnerability mapping [37]. Consequently, establishing an empirical framework that couples multi-temporal moonlight remote sensing fluctuations with precise socioeconomic loss metrics during catastrophic inundation events is essential for comprehensive situational awareness.
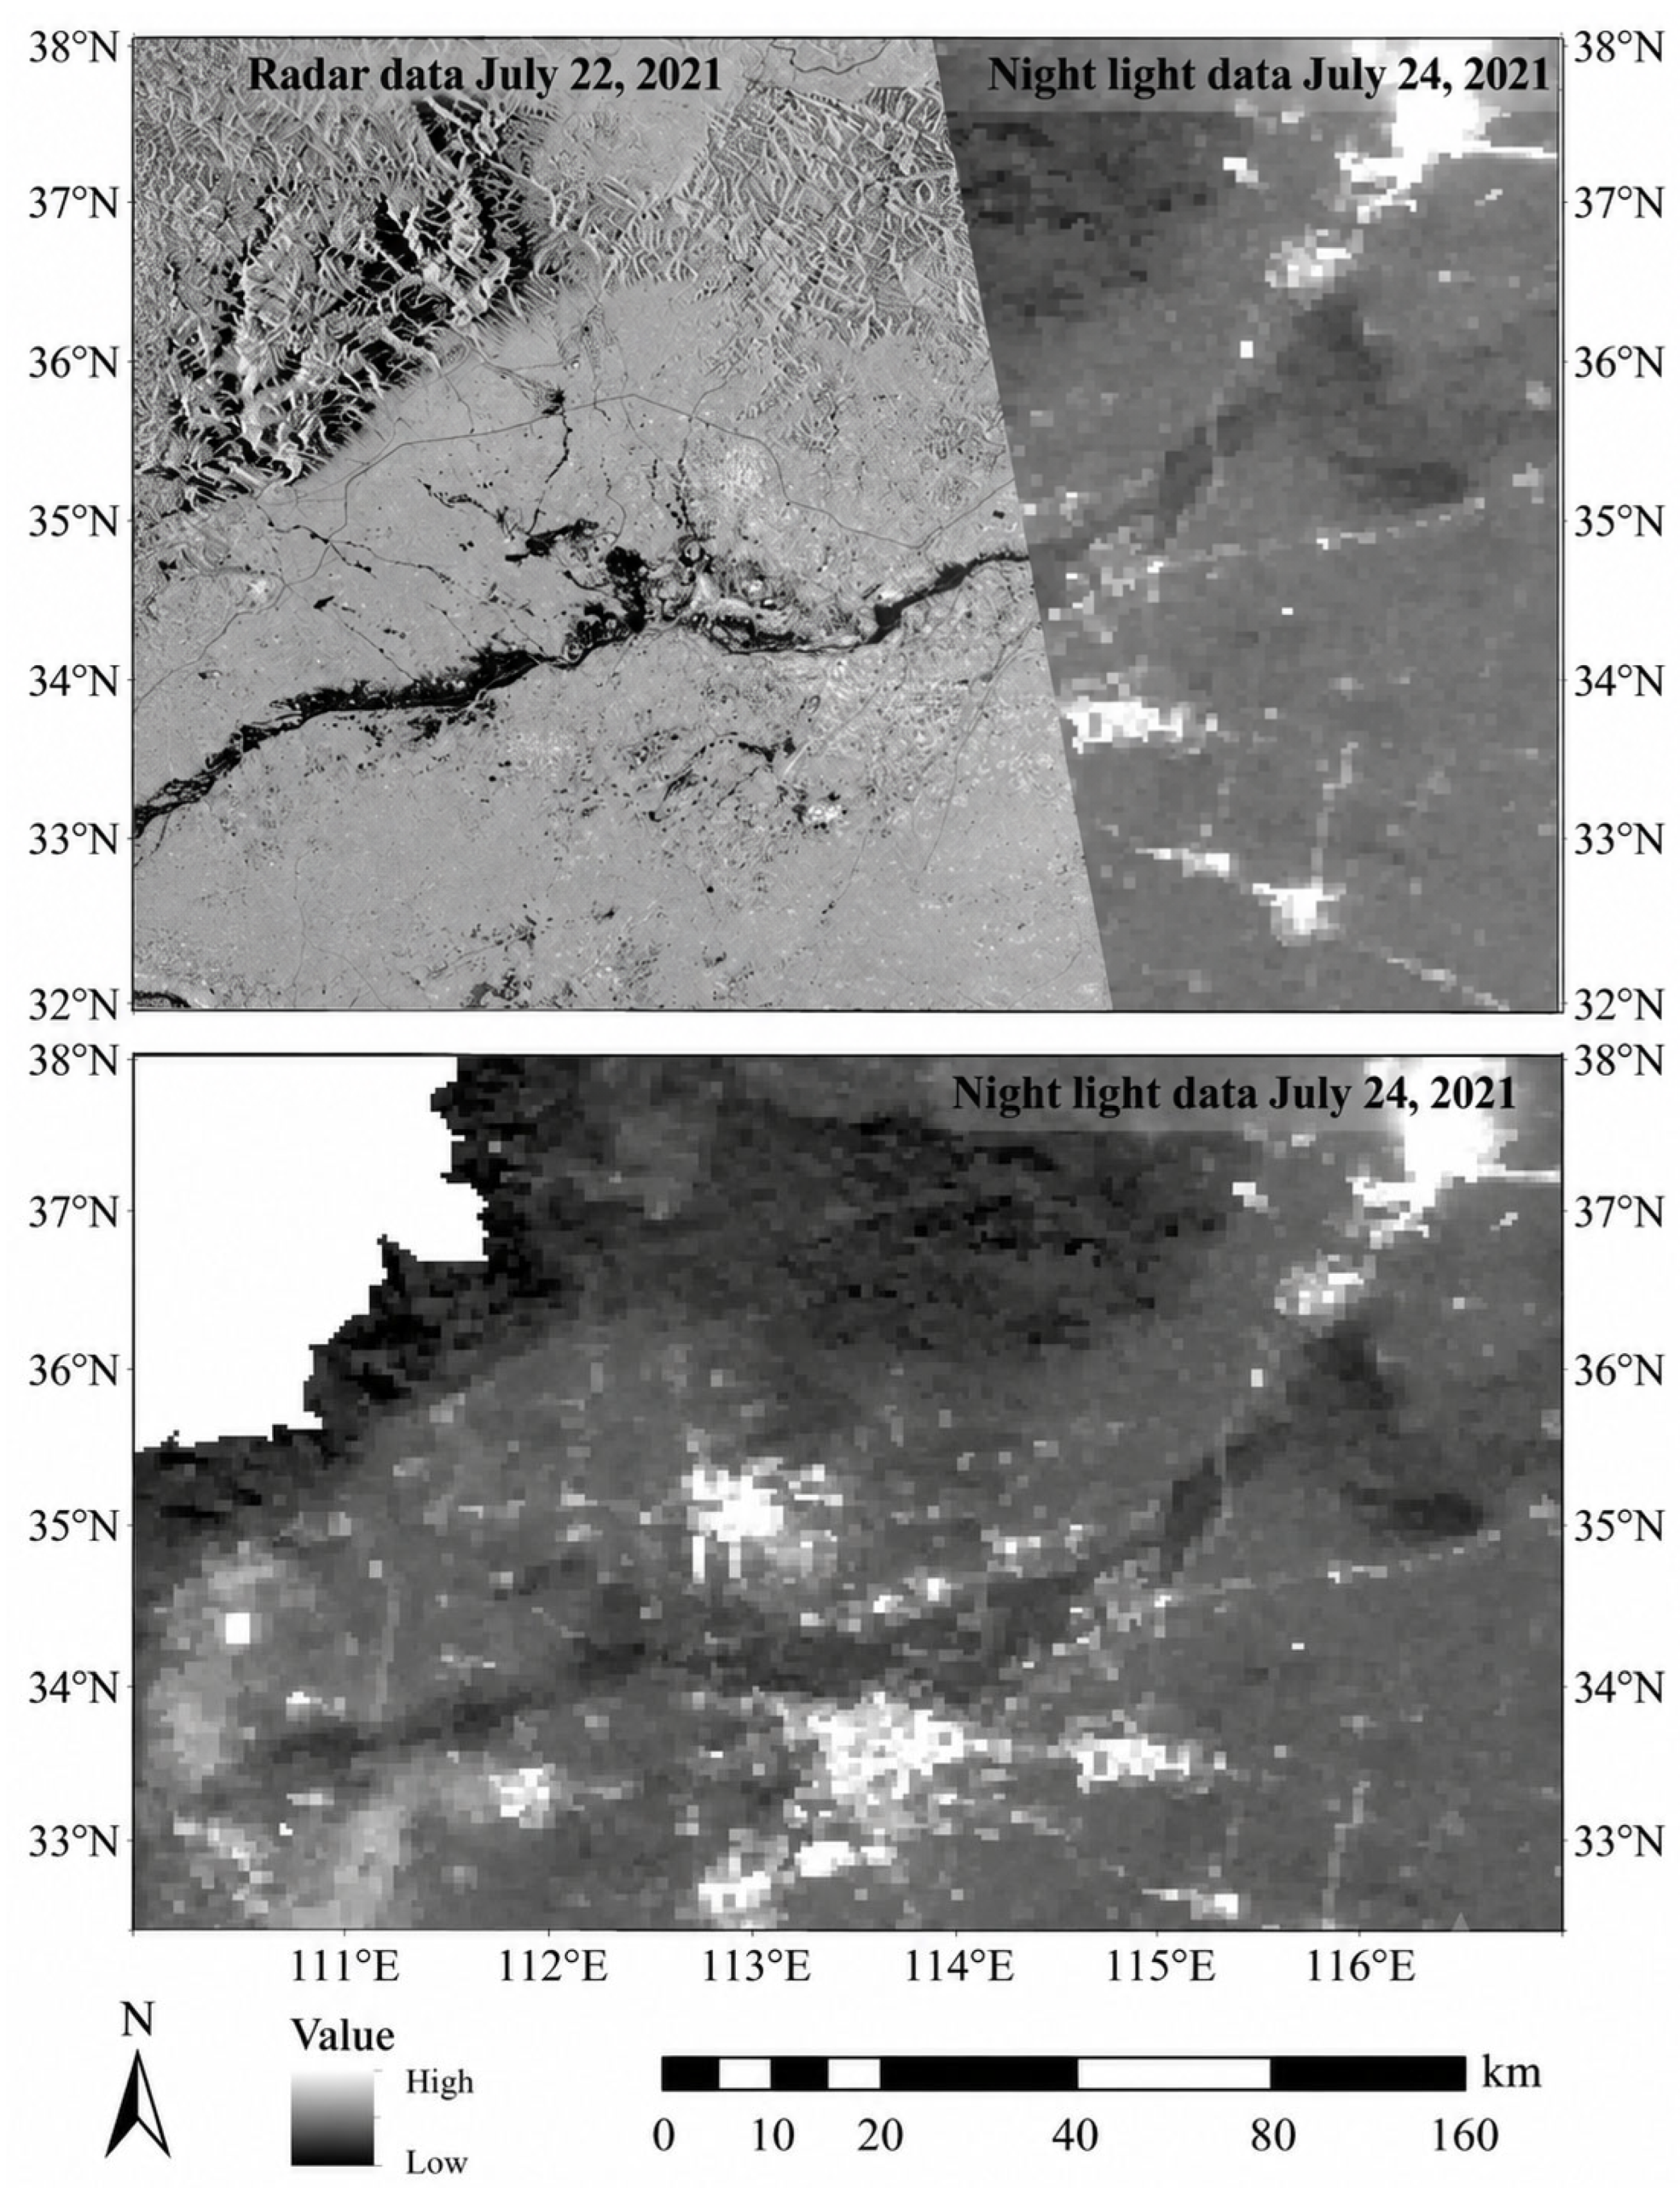
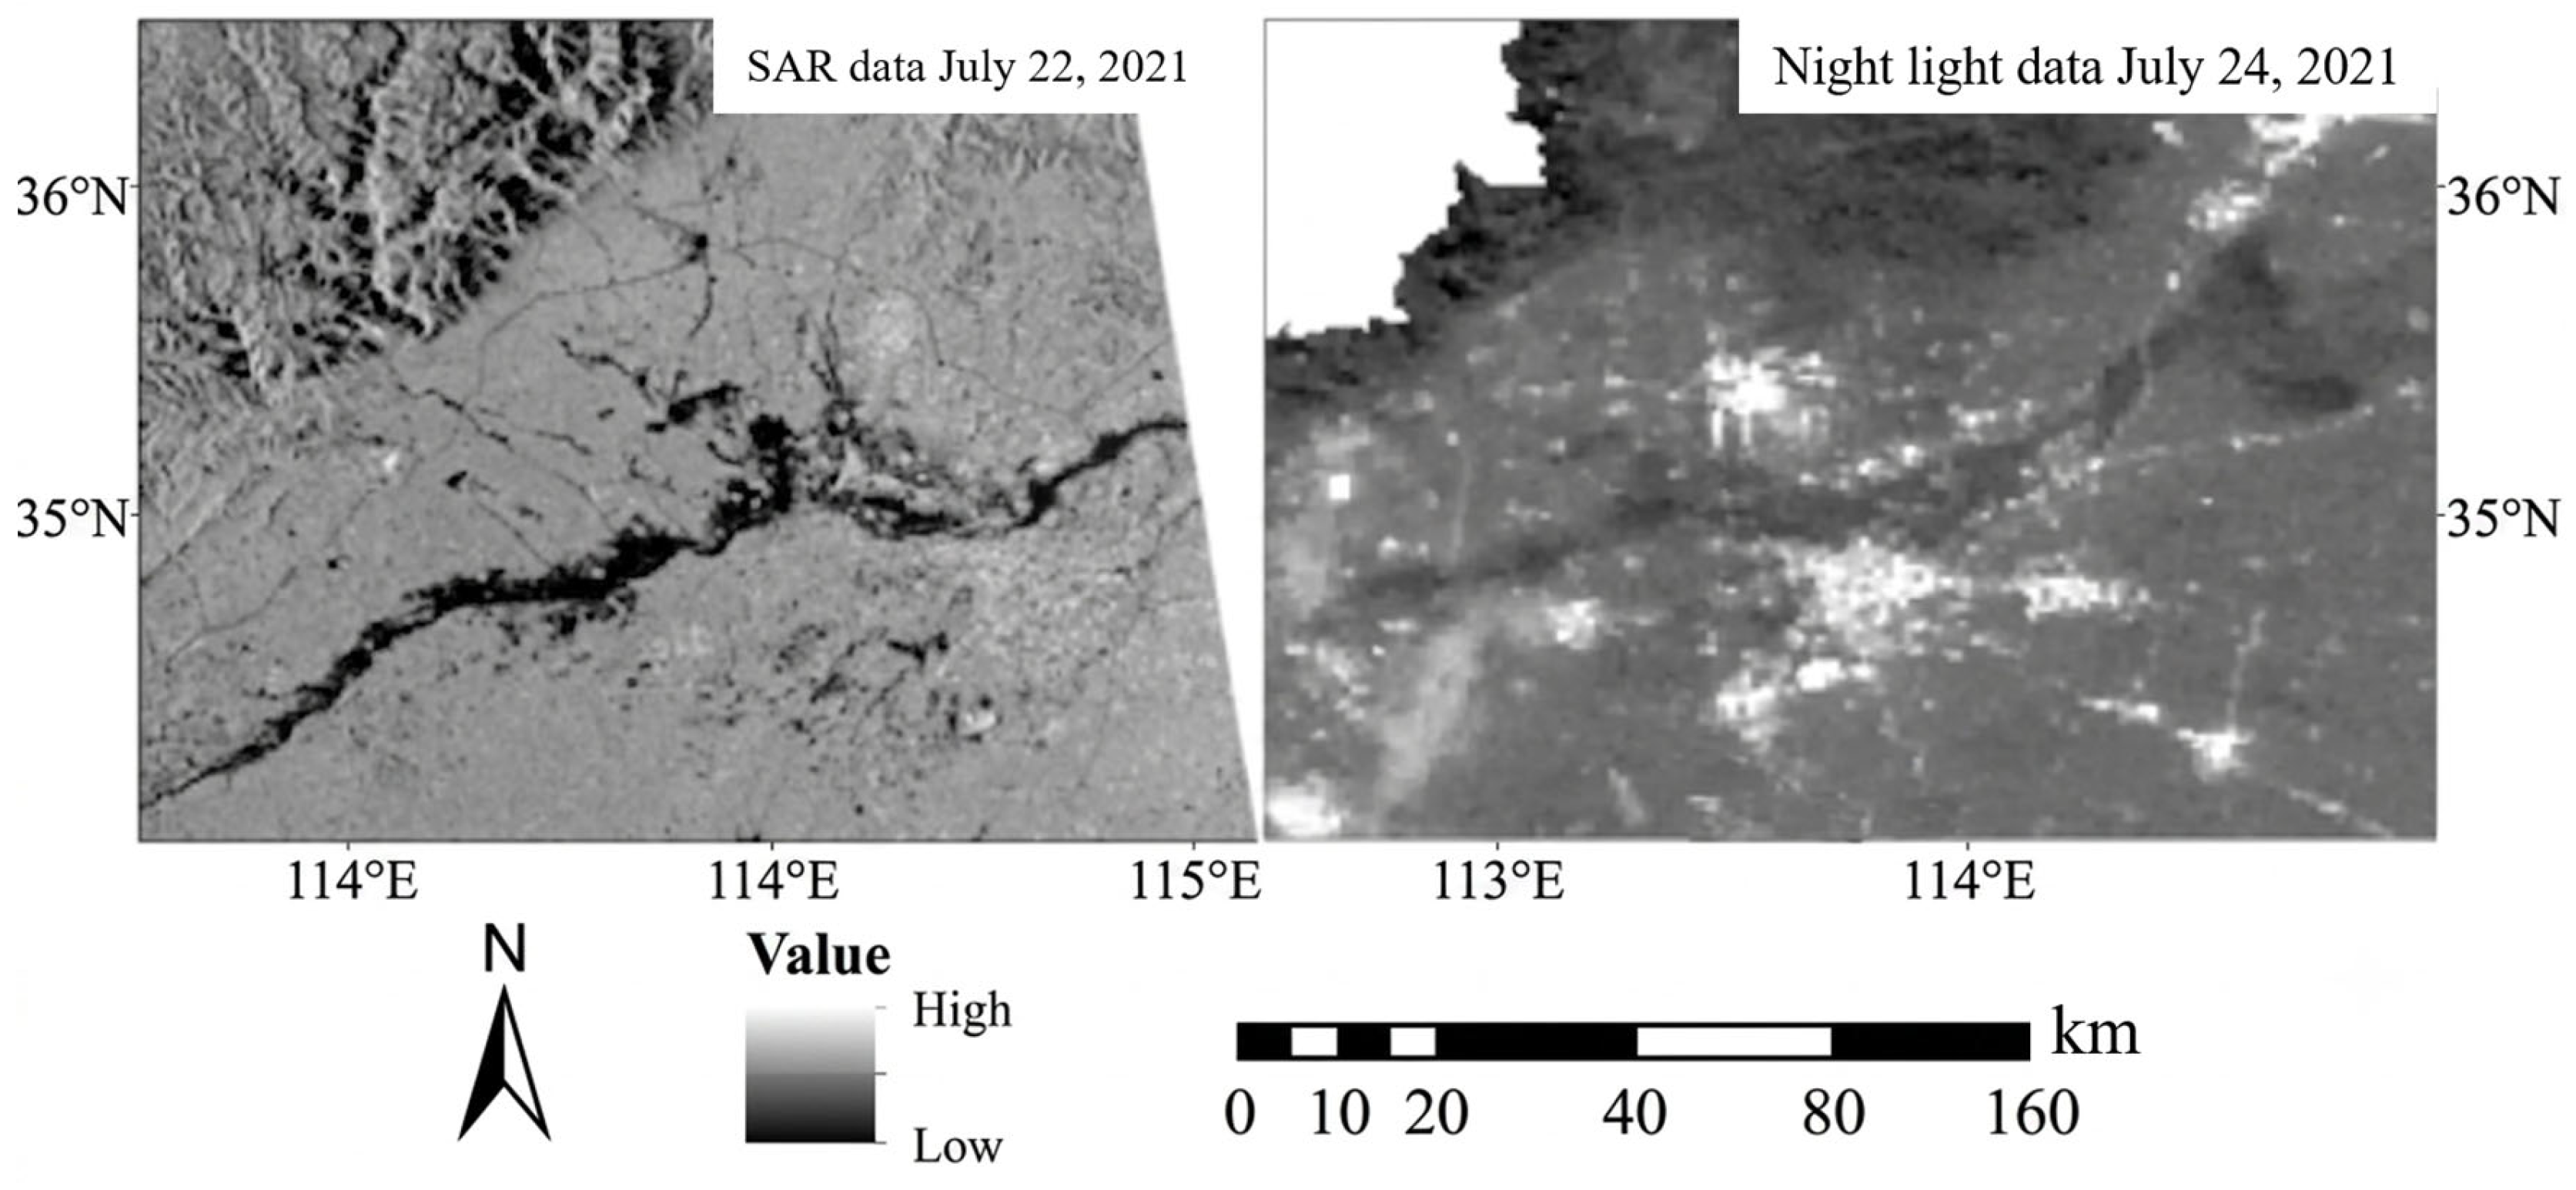
In this study, we demonstrate that nighttime light remote sensing data can not only serve as an indicator for monitoring power outages and recovery during severe rainstorms but also support the extraction and analysis of affected areas, as shown in Figure 12. From the VIIRS/DNB images on 9 July and 24 July, the spatial extent of nighttime lights in Xinxiang City progressively decreased, indicating widespread power disruptions. By 31 July, the illuminated area began to expand, suggesting ongoing restoration of the power supply. These temporal changes in nighttime radiance provide valuable insights into the dynamics of infrastructure resilience during and after extreme weather events. In this study, our preliminary estimate of economic losses amounts to 111.783 billion yuan, while the direct economic losses released by the Henan Provincial Government for this rainstorm event total 120.06 billion yuan. This discrepancy may stem from inherent variations in calculation methodologies between our evaluation framework and the official statistical approach. Furthermore, our current estimation primarily focuses on direct asset damage (i.e., cropland and buildings) and does not account for the indirect economic losses induced by business and production interruptions.
Compared to the Gaofen-3 SAR data, the nighttime light observations from VIIRS/DNB on 24 July (during a full moon) show significant radiance reduction in flood-affected areas, with spatial patterns consistent with inundation. This suggests that nighttime light data, particularly under favorable lunar illumination conditions, can serve as a supplementary source for monitoring power outages and inferring flood impacts during severe rainstorms [17].
Whereas radar provides all-weather capability, optical nighttime light sensing is compromised by clouds [5]. This limitation underscores the need for data fusion. Separately, moonlight acts as a natural illuminator; this enhancement is most pronounced during full moons, making the monitoring of disaster-induced power outages more reliable.
By integrating radar-derived flood maps, we further assessed the limitations of nighttime light remote sensing in monitoring the impacts of rain-induced flooding [5]. Although nighttime light data can indirectly reflect power outages in affected areas, several constraints exist, and the radiance observed in VIIRS/DNB data exhibits significant variation under different lunar phases [17]. We applied a radiance threshold of 24–60 nW/cm2/sr on 24 and 25 July to highlight low-light areas. Despite the short time interval, the background radiance in mountainous regions decreased on 25 July, likely due to reduced lunar illumination caused by changes in lunar geometry. Currently, standardized atmospheric correction models for lunar irradiance are still under development, making time-series observations using moonlight remote sensing challenging [25,26]. Additionally, factors such as cloud cover and topographic shadows further limit the direct application of nighttime light data in flood extent mapping [26].
Although currently available moonlight remote sensing data are susceptible to influences from single-band limitations, cloud and fog obstruction, and varying brightness under different lunar phases, we believe that quantitative characterization of the downward lunar radiation transfer process, along with the future availability of multispectral moonlight remote sensing data, will greatly alleviate these issues [5]. A quite accurate economic loss (107.96 billion RMB) was monitored by the framework proposed in this study; however, there is still a 10% difference between the estimated economic loss and the official direct economic loss (120.06 billion RMB) released by the Henan Province government. The possible reasons for this gap may relate to two aspects: The first is the differences in statistical methods; the government economic loss results were from residences’ and other reports, while our economic loss results were from the estimation results. The second may be due to the difference in the statistical scale; the government economic loss results include all kinds of properties that related to the disaster victims, while our results only involve the assets that could be monitored by remote sensing.
Leveraging moonlight remote sensing as a complementary data source, especially during periods of adequate moon illumination, shows significant potential for monitoring disaster dynamics and conducting impact assessments. By integrating these data with radar imagery and multi-satellite strategies, our work establishes a novel framework for near-real-time observation of natural disasters.

5. Conclusions

Driven by the increasing frequency of extreme weather events under global climate change, establishing robust disaster monitoring frameworks is of critical importance. Based on the integration of multi-source remote sensing data to analyze the 2021 Zhengzhou rainstorm, the main conclusions of this study are as follows:
  • Effective Multi-Source Integration: The synergistic use of optical, SAR, and moonlight remote sensing data provides a comprehensive approach for near-real-time disaster monitoring. This multi-sensor framework effectively extracts flood-inundated areas and evaluates infrastructure damage, significantly improving situational awareness for emergency management.
  • Extended Utility of Moonlight Remote Sensing: Beyond traditional land cover analysis, moonlight remote sensing data demonstrate unique value in post-disaster assessment. They serve as a vital tool not only for assisting in flood extent mapping but also for the continuous spatiotemporal monitoring of power outages and infrastructure recovery processes.
  • Limitations and Future Prospects: Despite the demonstrated potential, the accuracy of current moonlight remote sensing is constrained by single-band limitations, cloud cover, and lunar illumination variations. Future research will focus on refining lunar irradiance correction models and leveraging next-generation sensors to overcome these bottlenecks, paving the way for more precise and automated disaster response solutions.

Author Contributions

Conceptualization, F.X., Q.Y. and H.M.; methodology, F.X. and A.G.; software, A.G.; formal analysis, F.X. and A.G.; investigation, F.X. and A.G.; resources, F.X.; data curation, F.X.; writing—original draft preparation, F.X., and A.G.; writing—review and editing, F.X., Q.Y., H.M. and C.R.; supervision, F.X.; project administration, F.X.; funding acquisition, Q.Y. and H.M. All authors have read and agreed to the published version of the manuscript.

Funding

This research was funded by the Tianchi Talents—Young Doctor Program (5105250183m); and the Science and Technology Program of Xinjiang Uyghur Autonomous Region (2024B03028 and 2025B04051).

Data Availability Statement

Data available on request from the authors.

Acknowledgments

We would like to express our sincere gratitude to all those who have supported us throughout the course of this research.

Conflicts of Interest

The authors report there are no competing interests to declare.

References

  1. Calvo-Sancho, C.; Díaz-Fernández, J.; González-Alemán, J.J.; Halifa-Marín, A.; Miglietta, M.M.; Azorin-Molina, C.; Prein, A.F.; Montoro-Mendoza, A.; Bolgiani, P.; Morata, A.; et al. Human-induced climate change amplification on storm dynamics in Valencia’s 2024 catastrophic flash flood. Nat. Commun. 2026, 17, 1492. [Google Scholar] [CrossRef] [Scilit] [PubMed]
  2. Zhang, Z.; Lu, H.; Xu, N.; Ou, Y.; Yao, J.; Mo, F.; Gong, P. Comprehensive assessment of the recent dike breach at Dongting Lake. Innov. Geosci. 2024, 2, 100106. [Google Scholar] [CrossRef] [Scilit]
  3. Luo, N.; Lu, Z.; Ren, X.; Wu, X.; Wu, W.; Duan, R. Future changes in power grid exposure to urban flooding over eastern coastal China. Earths Future 2026, 14, e2025EF007502. [Google Scholar] [CrossRef] [Scilit]
  4. Schiermeier, Q. Increased flood risk linked to global warming. Nature 2011, 470, 316. [Google Scholar] [CrossRef] [Scilit] [PubMed]
  5. DeVries, B.; Huang, C.; Armston, J.; Huang, W.; Jones, J.W.; Lang, M.W. Rapid and robust monitoring of flood events using Sentinel-1 and Landsat data on the Google Earth Engine. Remote Sens. Environ. 2020, 240, 111664. [Google Scholar] [CrossRef] [Scilit]
  6. Cheng, S.; Li, H. Resilience Assessment of Flood Disasters in Zhengzhou Metropolitan Area Based on the PSR Model. Sustainability 2024, 16, 10243. [Google Scholar] [CrossRef] [Scilit]
  7. Samadzadegan, F.; Toosi, A.; Javan, F.D. A critical review on multi-sensor and multi-platform remote sensing data fusion approaches: Current status and prospects. Int. J. Remote Sens. 2025, 46, 1327–1402. [Google Scholar] [CrossRef] [Scilit]
  8. Du, Z.; Bin, L.; Ling, F.; Li, W.; Tian, W.; Wang, H.; Gui, Y.; Sun, B.; Zhang, X. Estimating surface water area changes using time-series Landsat data in the Qingjiang River Basin, China. J. Appl. Remote Sens. 2012, 6, 063609. [Google Scholar] [CrossRef] [Scilit]
  9. Rokni, K.; Ahmad, A.; Selamat, A.; Hazini, S. Water Feature Extraction and Change Detection Using Multitemporal Landsat Imagery. Remote Sens. 2014, 6, 4173–4189. [Google Scholar] [CrossRef] [Scilit]
  10. Xu, H. Modification of normalised difference water index (NDWI) to enhance open water features in remotely sensed imagery. Int. J. Remote Sens. 2006, 27, 3025–3033. [Google Scholar] [CrossRef] [Scilit]
  11. Mason, D.C.; Giustarini, L.; Garcia-Pintado, J.; Cloke, H.L. Detection of flooded urban areas in high resolution Synthetic Aperture Radar images using double scattering. Int. J. Appl. Earth Obs. Geoinf. 2014, 28, 150–159. [Google Scholar] [CrossRef] [Scilit]
  12. Martinis, S. Improving flood mapping in arid areas using SENTINEL-1 time series data. In Proceedings of the 2017 IEEE International Geoscience and Remote Sensing Symposium (IGARSS), Fort Worth, TX, USA, 23–28 July 2017; pp. 193–196. [Google Scholar] [CrossRef] [Scilit]
  13. Mason, D.C.; Speck, R.; Devereux, B.; Schumann, G.J.-P.; Neal, J.C.; Bates, P.D. Flood Detection in Urban Areas Using TerraSAR-X. IEEE Trans. Geosci. Remote Sens. 2010, 48, 882–894. [Google Scholar] [CrossRef] [Scilit]
  14. Gan, T.Y.; Zunic, F.; Kuo, C.-C.; Strobl, T. Flood mapping of Danube River at Romania using single and multi-date ERS2-SAR images. Int. J. Appl. Earth Obs. Geoinf. 2012, 18, 69–81. [Google Scholar] [CrossRef] [Scilit]
  15. Barentine, J.C.; Walczak, K.; Gyuk, G.; Tarr, C.; Longcore, T. A Case for a New Satellite Mission for Remote Sensing of Night Lights. Remote Sens. 2021, 13, 2294. [Google Scholar] [CrossRef] [Scilit]
  16. Zhang, Q.; Li, B.; Thau, D.; Moore, R. Building a Better Urban Picture: Combining Day and Night Remote Sensing Imagery. Remote Sens. 2015, 7, 11887–11913. [Google Scholar] [CrossRef] [Scilit]
  17. Higuchi, A. Toward More Integrated Utilizations of Geostationary Satellite Data for Disaster Management and Risk Mitigation. Remote Sens. 2021, 13, 1553. [Google Scholar] [CrossRef] [Scilit]
  18. Zheng, Q.; Seto, K.C.; Zhou, Y.; You, S.; Weng, Q. Nighttime light remote sensing for urban applications: Progress, challenges, and prospects. ISPRS J. Photogramm. Remote Sens. 2023, 202, 125–141. [Google Scholar] [CrossRef] [Scilit]
  19. Liu, D.; Zhang, Q.; Wang, J.; Wang, Y.; Shen, Y.; Shuai, Y. The Potential of Moonlight Remote Sensing: A Systematic Assessment with Multi-Source Nightlight Remote Sensing Data. Remote Sens. 2021, 13, 4639. [Google Scholar] [CrossRef] [Scilit]
  20. Mård, J.; Di Baldassarre, G.; Mazzoleni, M. Nighttime light data reveal how flood protection shapes human proximity to rivers. Sci. Adv. 2018, 4, eaar5779. [Google Scholar] [CrossRef] [Scilit] [PubMed]
  21. Miller, S.D.; Turner, R.E. A Dynamic Lunar Spectral Irradiance Data Set for NPOESS/VIIRS Day/Night Band Nighttime Environmental Applications. IEEE Trans. Geosci. Remote Sens. 2009, 47, 2316–2329. [Google Scholar] [CrossRef] [Scilit]
  22. Aggarwal, E.; Gupta, S.; Whittaker, A.C.; Mason, P.J.; Sangwan, K.S.; Schlunegger, F. Monitoring the impact of the 2022 Indus River flood using NASA’s Black Marble Nighttime Lights. In Proceedings of the AGU Fall Meeting Abstracts, San Francisco, CA, USA, 11–15 December 2023; No. 2763. [Google Scholar]
  23. Henan Provincial Bureau of Statistics. Henan Provincial Statistical Communiqué on National Economic and Social Development. 2021. Available online: https://tjj.henan.gov.cn/2021/05-20/2148331.html (accessed on 20 May 2021).
  24. Ministry of Emergency Management of the People’s Republic of China. Henan Zhengzhou ‘7·20’ Extraordinary Heavy Rain Disaster Investigation Report. 2022. Available online: https://www.mem.gov.cn/xw/btyw/202201/t20220121_407085.shtml (accessed on 21 January 2022).
  25. Lovatt, A.; O’connor, J. Cities and the night-time economy. Plan. Pract. Res. 1995, 10, 127–134. [Google Scholar] [CrossRef] [Scilit]
  26. Miller, S.D.; Straka, W.; Mills, S.P.; Elvidge, C.D.; Lee, T.F.; Solbrig, J.; Walther, A.; Heidinger, A.K.; Weiss, S.C. Illuminating the Capabilities of the Suomi National Polar-Orbiting Partnership (NPP) Visible Infrared Imaging Radiometer Suite (VIIRS) Day/Night Band. Remote Sens. 2013, 5, 6717–6766. [Google Scholar] [CrossRef] [Scilit]
  27. Moreira, A.; Prats-Iraola, P.; Younis, M.; Krieger, G.; Hajnsek, I.; Papathanassiou, K.P. A tutorial on synthetic aperture radar. IEEE Geosci. Remote Sens. Mag. 2013, 1, 6–43. [Google Scholar] [CrossRef] [Scilit]
  28. Elvidge, C.D.; Baugh, K.E.; Zhizhin, M.N.; Hsu, F.-C. Why VIIRS data are superior to DMSP for mapping nighttime lights. Proc. Asia-Pac. Adv. Netw. 2013, 35, 62. [Google Scholar] [CrossRef] [Scilit]
  29. Levin, N.; Zhang, Q. A global analysis of factors controlling VIIRS nighttime light levels from densely populated areas. Remote Sens. Environ. 2017, 190, 366–382. [Google Scholar] [CrossRef] [Scilit]
  30. Román, M.O.; Wang, Z.; Sun, Q.; Kalb, V.; Miller, S.D.; Molthan, A.; Schultz, L.; Bell, J.; Stokes, E.C.; Pandey, B.; et al. NASA’s Black Marble nighttime lights product suite. Remote Sens. Environ. 2018, 210, 113–143. [Google Scholar] [CrossRef] [Scilit]
  31. Li, X.; Li, D. Can night-time light images play a role in evaluating the Syrian Crisis? Int. J. Remote Sens. 2014, 35, 6648–6661. [Google Scholar] [CrossRef] [Scilit]
  32. European Space Agency. SNAP Toolboxes. 2023. Available online: https://step.esa.int/main/toolboxes/snap/ (accessed on 26 October 2024).
  33. Global Administrative Areas. Database of Global Administrative Areas (Version 4.1). 2023. Available online: https://gadm.org/ (accessed on 26 October 2023).
  34. Japan Aerospace Exploration Agency. ALOS World 3D-30m (AW3D30). 2023. Available online: https://www.eorc.jaxa.jp/ALOS/en/aw3d30/ (accessed on 26 October 2023).
  35. Beijing Piesat Information Technology Co., Ltd. PIE-SAR. Available online: https://www.piesat.cn/ (accessed on 25 January 2024).
  36. Cumming, I.G.; Wong, F.H. Synthetic Aperture Radar: Algorithms and Implementation; Artech House: Boston, MA, USA, 2005. [Google Scholar]
  37. Zhu, H.; Meng, J.; Yao, J.; Xu, N. Feasibility of emergency flood traffic road damage assessment by integrating remote sensing images and social media information. ISPRS Int. J. Geo-Inf. 2024, 13, 369. [Google Scholar] [CrossRef] [Scilit]
  38. Jiang, R.; Lu, H.; Yang, K.; Chen, D.; Zhou, J.; Yamazaki, D.; Pan, M.; Li, W.; Xu, N.; Yang, Y.; et al. Substantial increase in future fluvial flood risk projected in China’s major urban agglomerations. Commun. Earth Environ. 2023, 4, 389. [Google Scholar] [CrossRef] [Scilit]
Figure 1. Study area. (a) The location of Henan province within China. (b) Administrative division of Henan Province. (c) Remote sensing imagery of Zhengzhou city (with 10 m resolution, RGB true-color, sourced from the Tianditu satellite mapping platform acquired in 6 June 2021).
Remotesensing 18 02435 g001
Figure 2. The processed GF-3 SAR remote sensing image. (Significant changes in water bodies before and after the heavy rainfall can be clearly observed in the red circled area.).
Remotesensing 18 02435 g002
Figure 3. Workflow diagram for near-real-time assessment of the Zhengzhou extreme precipitation event based on multi-source remote sensing, incorporating moonlight observations.
Remotesensing 18 02435 g003
Figure 4. The preprocessed data map of the disaster area as examples. The moonlight data in (e) were acquired on 23 September 2021, the DEM in (f) was acquired from the ALOS AW3D dataset, the water body in (g) was extracted by authors using Sentinel-2 on 22 July 2021, and the SAR data in (h) were acquired on 21 March 2022.
Remotesensing 18 02435 g004
Figure 5. Combining SAR data and extracting the moonlight remote sensing brightness threshold of the disaster-affected area.
Remotesensing 18 02435 g005
Figure 6. Distribution map of land cover in the disaster-affected areas of each city and county.
Remotesensing 18 02435 g006
Figure 7. The area distribution of the affected city.
Remotesensing 18 02435 g007
Figure 8. The area distribution of the affected township.
Remotesensing 18 02435 g008
Figure 9. The economic loss distribution of the affected city.
Remotesensing 18 02435 g009
Figure 10. The economic loss distribution of the affected township.
Remotesensing 18 02435 g010
Figure 11. The distribution map of economic losses in affected areas.
Remotesensing 18 02435 g011
Figure 12. Comparison of SAR and night light remote sensing under full moon conditions.
Remotesensing 18 02435 g012
Table 1. Radar datasets in this study.
Data and IndicatorSpatial ResolutionQuantityTemporal Coverage
Sentinel-110 m × 10 m3 scenes1 January 2020–21 March 2020
10 m × 10 m23 September 2020–31 December 2021
GaoFen-31 m × 1 m7 scenes15 July 2021–22 July 2021
Table 2. Moonlight remote sensing data used in this study.
Data and IndicatorSpatial ResolutionTemporal Coverage
MYD29P1N1 km × 1 km23 September 2020–21 March 2021
23 September 2021–21 March 2022
MEaSUREs25 km × 25 km23 September 2020–21 March 2021
23 September 2021–21 March 2022
AMSR_U2_L325 km × 25 km23 September 2020–21 March 2021
23 September 2021–21 March 2022
NISE_SSMISF1825 km × 25 km23 September 2020–21 March 2021
23 September 2021–21 March 2022
Table 3. Land cover types included in the ESRI 10-m Land Cover data.
Class ValueRemapped ValueLand Cover Class
11Water
22Trees
43Flooded Vegetation
54Crops
75Built Area
86Bare Ground
97Snow/Ice
108Clouds
119Rangeland
Disclaimer/Publisher’s Note: The statements, opinions and data contained in all publications are solely those of the individual author(s) and contributor(s) and not of MDPI and/or the editor(s). MDPI and/or the editor(s) disclaim responsibility for any injury to people or property resulting from any ideas, methods, instructions or products referred to in the content.