1. Introduction
Mining-induced surface cracks are among the most direct manifestations of ground damage caused by underground coal extraction [
1,
2,
3,
4,
5]. Their development can disrupt surface continuity and land structural stability and may further trigger secondary environmental problems, including soil erosion, vegetation degradation, and localized ground instability. Accurate identification of mining-induced surface cracks and quantitative characterization of their geometric properties are therefore essential for hazard monitoring, ecological restoration, and surface stability assessment in mining areas [
1,
2].
Conventional crack investigation mainly relies on field surveys, tape measurements, total station observations, Global Navigation Satellite System (GNSS) measurements, and visual interpretation of remote sensing imagery. Although these methods can provide reliable crack information at local scales, they are generally labor-intensive, spatially discontinuous, and strongly dependent on human interpretation. In mining-affected areas with extensive crack networks and complex terrain, conventional approaches are often insufficient for large-scale, high-precision, and high-frequency monitoring [
2,
5].
Recent advances in UAV remote sensing and deep learning have substantially improved the automatic detection of mining-induced surface cracks [
6,
7,
8,
9]. Semantic segmentation methods based on high-resolution UAV orthomosaics enable pixel-level crack extraction and support the derivation of 2D geometric parameters, including crack length, width, area, density, and spatial distribution. However, most existing studies still treat cracks as 2D image objects, with results mainly represented by crack masks, skeletons, or planar geometric descriptors. In mining areas, surface deformation is commonly accompanied by subsidence basins, terrain undulations, and localized collapses. As a result, the actual propagation path of a crack may deviate from its planar projection. Measurements derived solely from UAV orthomosaics therefore cannot fully represent crack geometry under real topographic conditions, which limits further analysis of the relationship between crack development and mining-induced surface deformation.
Point-cloud data provide new opportunities for 3D crack characterization [
10,
11,
12,
13]. TLS and photogrammetric point clouds can capture detailed 3D coordinates and elevation information, enabling the representation of surface structures, terrain undulations, and micro-topographic variations. Nevertheless, direct extraction of mining-induced surface cracks from point clouds remains challenging [
12,
13]. Vegetation cover, shadows, loose surface materials, surface roughness, point-density variations, occlusions, and noise may lead to unstable representations of fine crack boundaries. Therefore, rather than replacing image-based crack detection with point-cloud-based extraction, a more feasible strategy is to integrate crack semantic information derived from UAV imagery with the geometric information provided by TLS point clouds. Such integration can extend crack representation from 2D image objects to 3D spatial objects [
10,
11].
Although multi-source remote sensing data fusion has received increasing attention, studies on mining-induced surface cracks have predominantly focused on 2D detection and planar parameter extraction. Research on constructing semantic 3D crack objects and quantifying crack geometric parameters under real topographic conditions remains limited [
11,
12]. Establishing a spatial linkage between crack semantic information and 3D terrain information is therefore critical for transforming crack analysis from 2D detection to 3D quantitative characterization.
To address these limitations, this study proposes a UAV–TLS fusion framework for 3D characterization of mining-induced surface cracks [
13,
14]. First, crack semantic information is extracted from UAV orthomosaics using DRA-UNet [
11,
12,
15,
16,
17]. Crack centerlines are then generated through connected-component analysis, skeleton extraction, and vectorization [
18]. Subsequently, KDTree-based neighborhood matching is employed to map 2D crack objects into 3D point cloud space, thereby constructing semantic crack point clouds [
19,
20]. Finally, 3D geometric parameters, including crack length and width, are estimated by integrating planar crack information with TLS-derived elevation information.
Different from previous studies that mainly focused on 2D crack detection, planar geometric parameter extraction, or direct crack extraction from point clouds, this study emphasizes the transformation of image-derived crack semantics into measurable 3D spatial objects. Specifically, UAV orthomosaics are used to provide reliable crack semantic boundaries and centerlines, while TLS point clouds provide elevation and terrain morphology information. By linking these two data sources through skeleton vectorization and KDTree-based spatial matching, the proposed framework enables the construction of semantic crack point clouds and the calculation of 3D crack geometric parameters under real topographic conditions.
The main contributions of this study are threefold. First, a UAV–TLS fusion framework is developed to extend the representation of mining-induced surface cracks from 2D image objects to 3D spatial objects. Second, a spatial association strategy between crack centerlines and TLS point clouds is established to construct semantic crack point clouds. Third, an automated workflow for estimating 3D crack length and width is developed to support quantitative geometric characterization under real topographic conditions.
3. Methodology
3.1. Overall Workflow
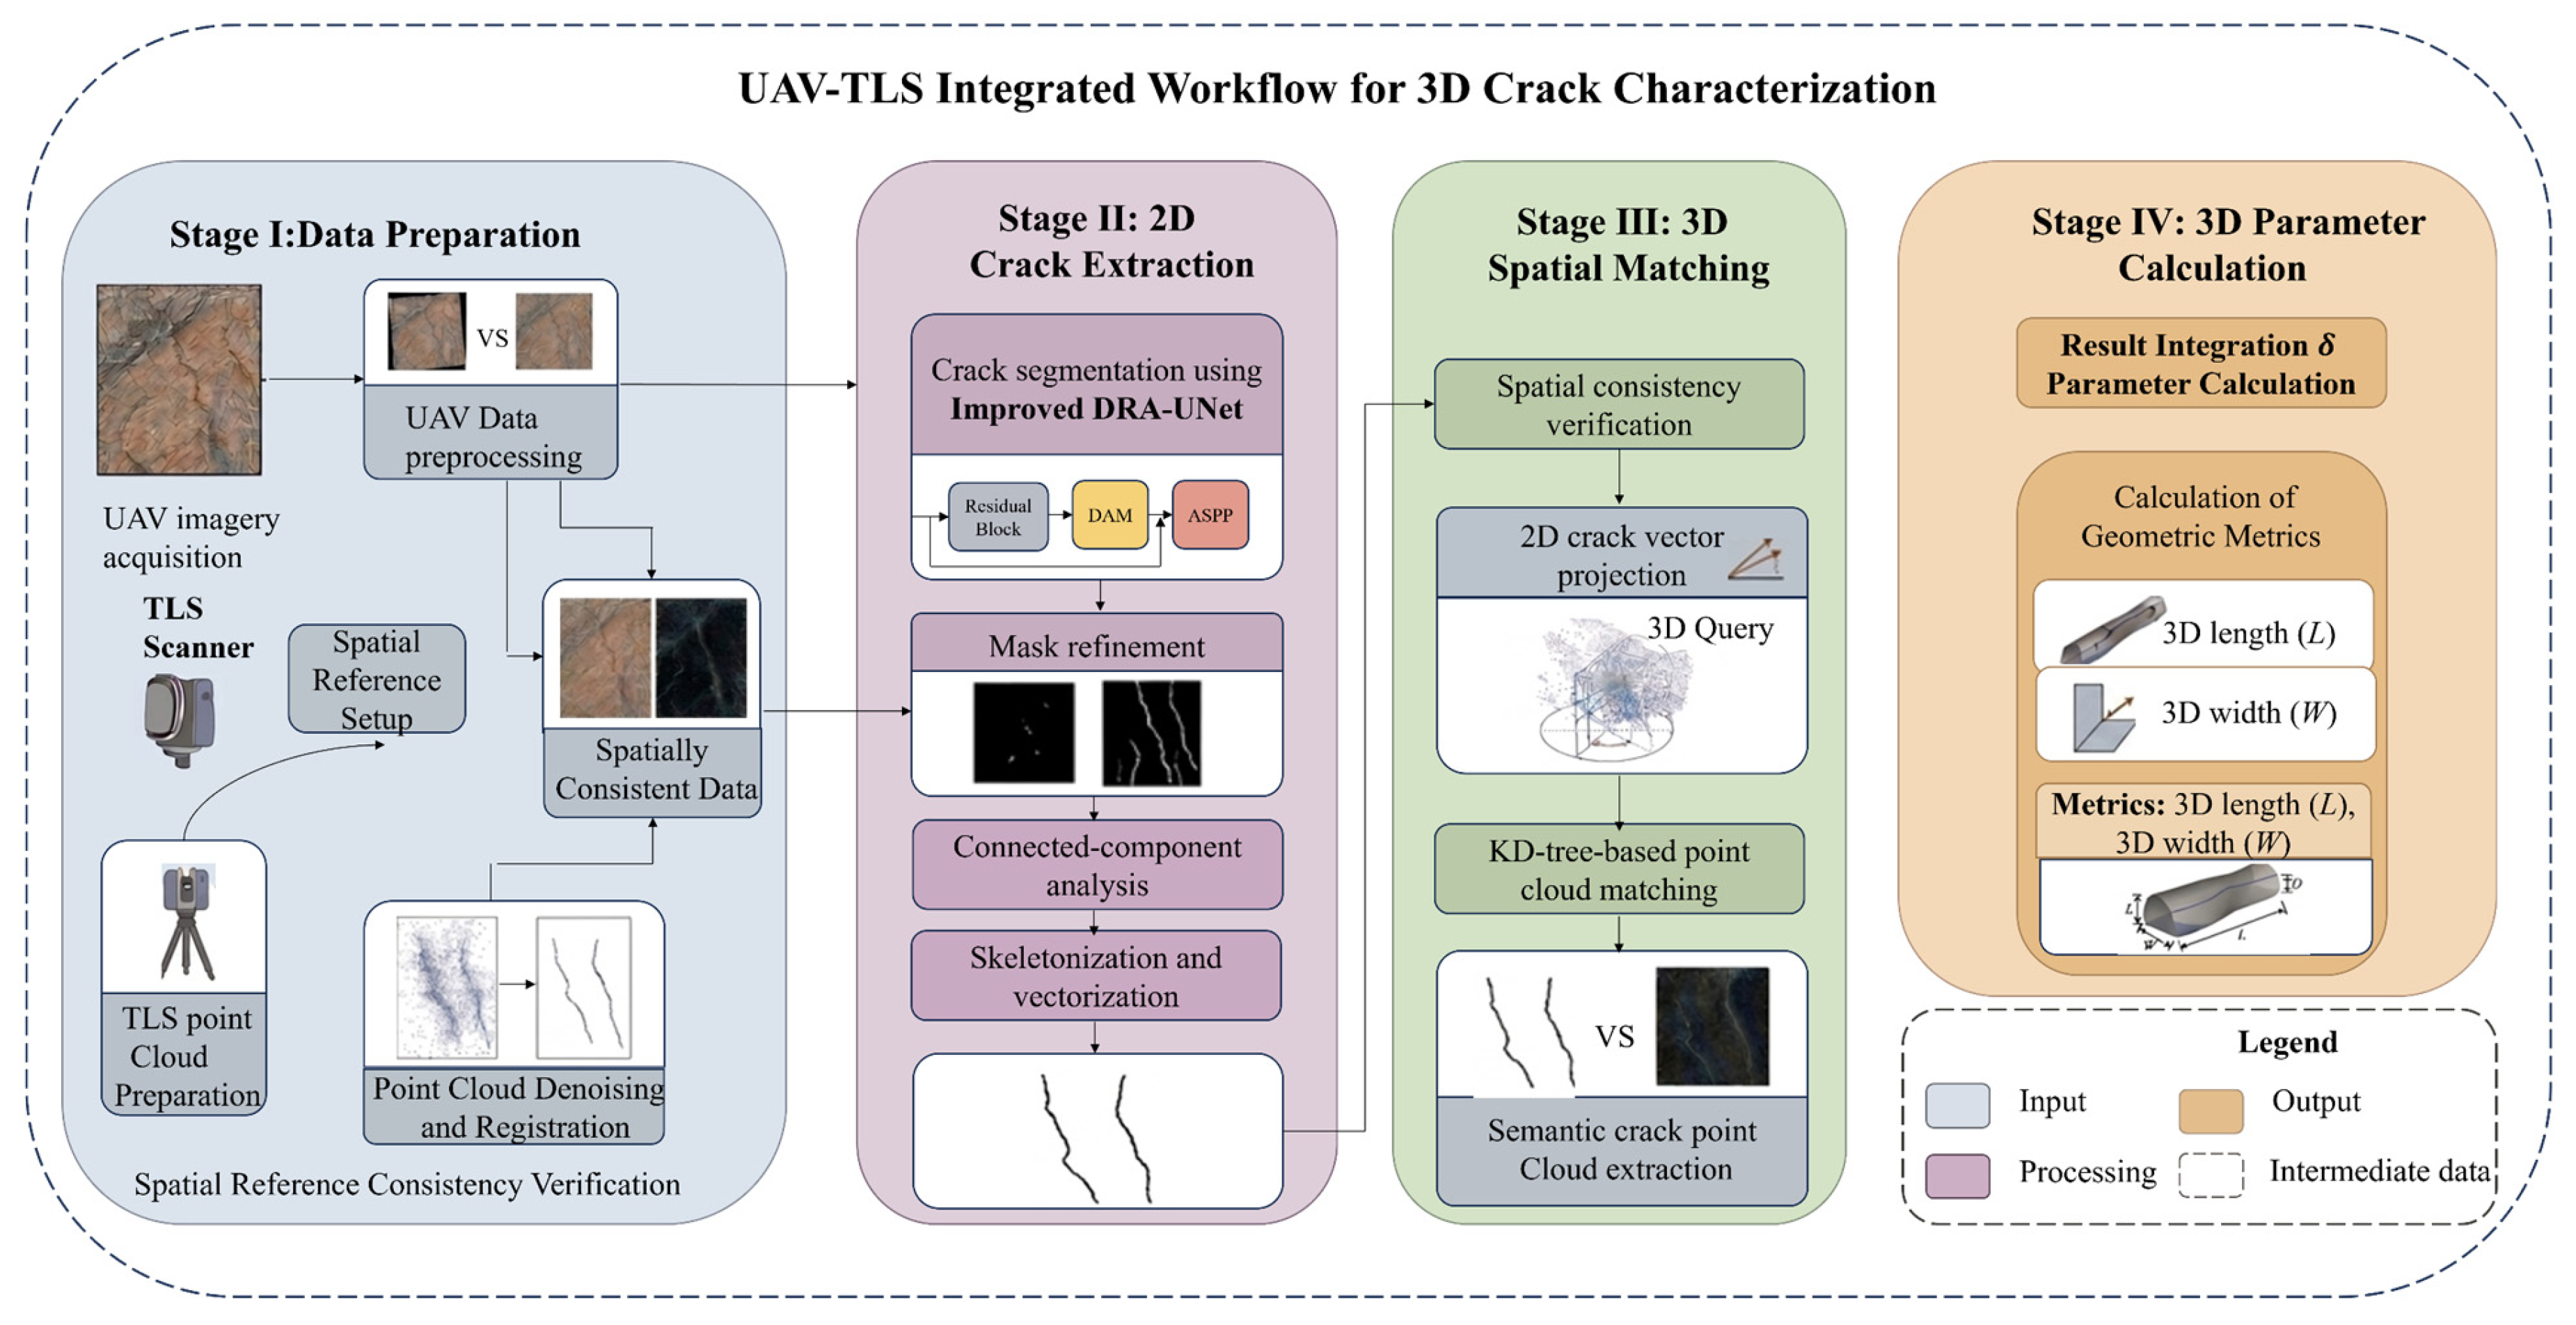
A UAV–TLS fusion framework was developed for the 2D detection and 3D characterization of mining-induced surface cracks. The framework integrates UAV orthomosaics and TLS point clouds to provide a complete workflow from crack extraction to 3D geometric parameter estimation. The workflow consists of four main stages: data preparation, 2D crack extraction, 3D spatial mapping, and geometric parameter estimation.
During the data-preparation stage, UAV orthomosaics and TLS point clouds are preprocessed to produce spatially consistent imagery and terrain point clouds within a unified coordinate reference system. Crack semantic information is then extracted from the UAV orthomosaics using a semantic segmentation model. The resulting binary crack masks are further processed through post-processing, connected-component analysis, skeleton extraction, and vectorization to generate crack centerlines with real-world coordinates.
In the 3D spatial-mapping stage, the spatial relationship between crack centerlines and TLS point clouds is established. A KDTree-based neighborhood search identifies point-cloud subsets corresponding to crack locations and assigns crack semantic attributes to the points. This process constructs semantic crack point clouds and extends crack representation from 2D image objects to 3D spatial objects.
Finally, geometric parameters are derived by integrating binary crack masks, crack centerlines, and semantic crack point clouds. 3D crack length and width are subsequently calculated, enabling quantitative characterization of crack geometry under real topographic conditions. The overall workflow of the proposed method is illustrated in
Figure 2.
3.2. Crack Semantic Segmentation Based on DRA-UNet
Mining-induced surface cracks are typically characterized by elongated geometries, discontinuous boundaries, large-scale variations, and strong background interference. These characteristics make accurate crack extraction challenging for conventional semantic segmentation models, which may produce missed detections of narrow cracks, blurred crack boundaries, and false segmentation in complex surface environments. To address these challenges, DRA-UNet, proposed in our previous study, was adopted for crack semantic segmentation in this work.
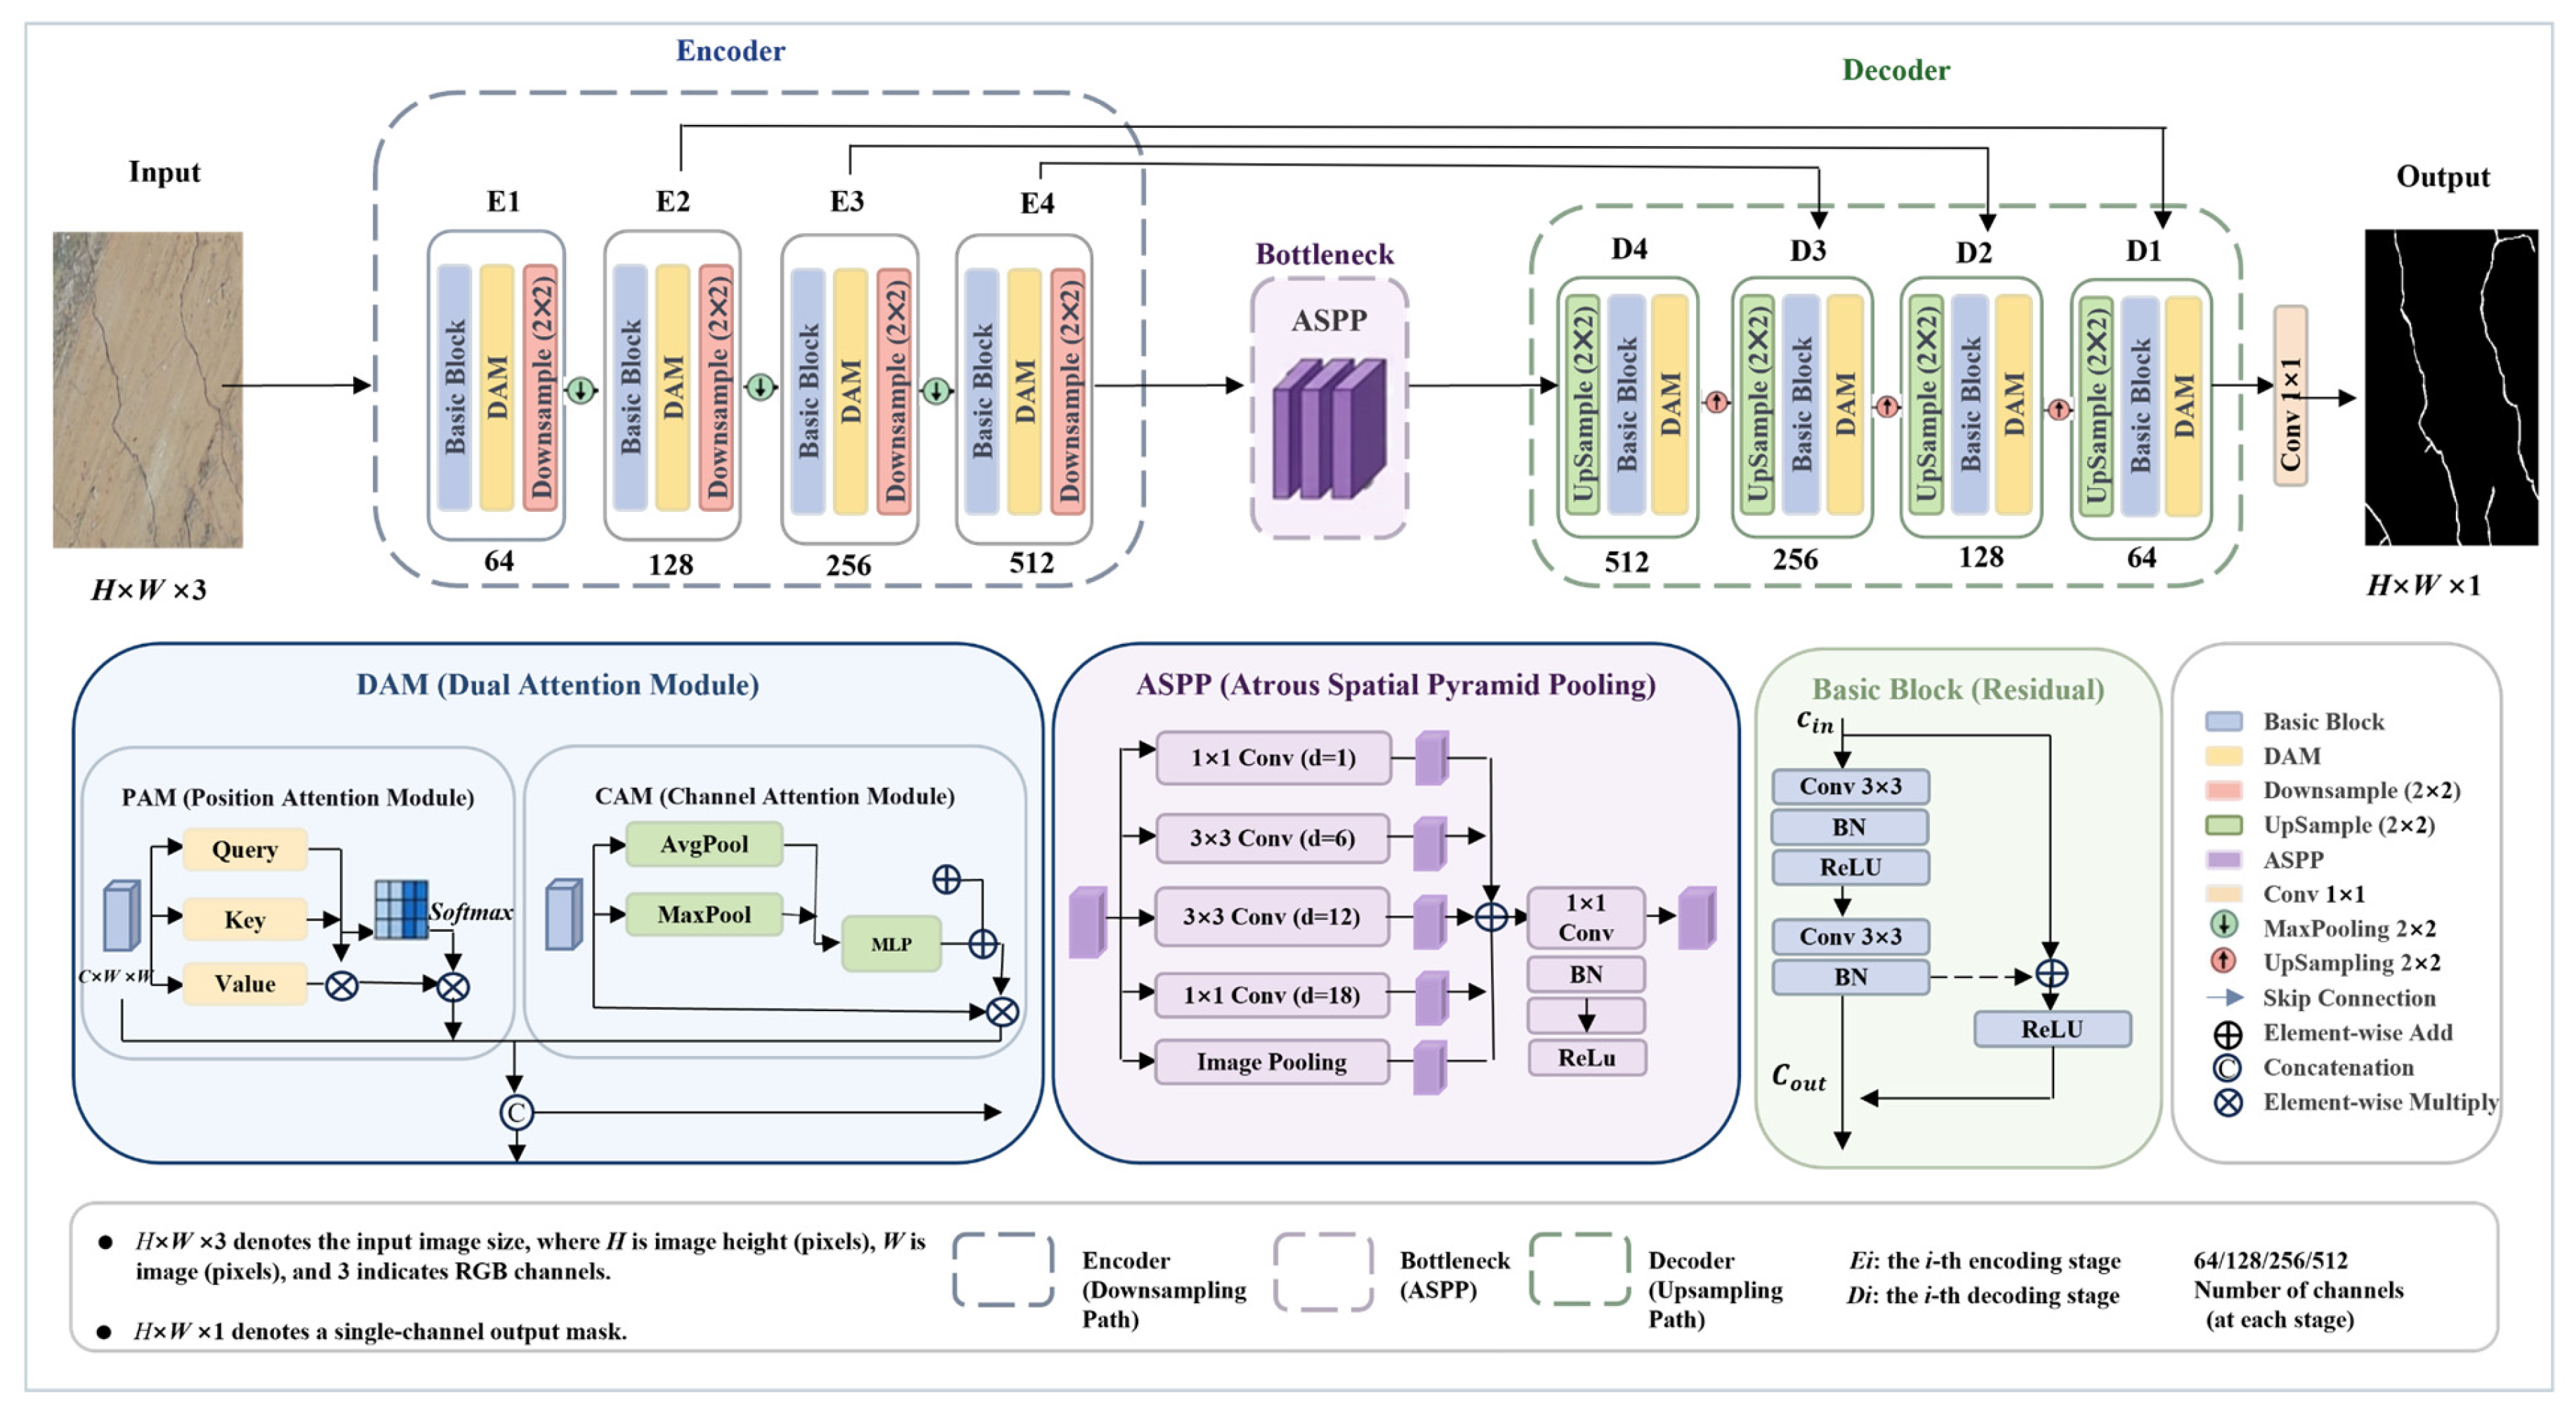
DRA-UNet is based on the encoder–decoder architecture of U-Net and integrates a residual network (RN), a dual attention module (DAM), and an atrous spatial pyramid pooling (ASPP) module [
24,
25,
26,
27]. In this study, DRA-UNet consistently refers to the U-Net-based encoder–decoder segmentation network enhanced by residual learning, dual attention, and ASPP-based multi-scale atrous convolution. The RN was introduced by embedding residual blocks with identity shortcut connections. These shortcut connections allow shallow feature representations to be propagated to deeper layers, which can mitigate network degradation and gradient attenuation during deep feature extraction, rather than guaranteeing lossless information transmission. The DAM was designed to assign adaptive weights to spatial and channel features so that crack-related responses could be emphasized while background responses could be relatively reduced. The ASPP module was used to aggregate multi-scale contextual information through parallel atrous convolutions with different dilation rates, thereby supporting the representation of cracks with varying widths and spatial patterns. These descriptions represent the design motivations of the modules, and their practical contribution was further evaluated through the ablation experiment presented in
Section 4.1.
By combining residual learning, attention mechanisms, and multi-scale feature aggregation, DRA-UNet was designed to improve the discrimination of crack features under complex mining-area conditions. It was also intended to support the extraction of fine crack structures and boundary details, thereby providing semantic information for subsequent skeleton extraction and 3D geometric characterization. The architecture of DRA-UNet is illustrated in
Figure 3. In the decoder, the ASPP output from the bottleneck layer serves as the primary input for progressive upsampling. The skip connections from the encoder are used as auxiliary high-resolution features to compensate for spatial detail loss during downsampling. At each decoder stage, the upsampled decoder feature map is fused with the corresponding encoder feature map at the same spatial resolution by channel-wise concatenation, followed by convolutional refinement. Therefore, the skip connections shown in
Figure 3 indicate scale-matched feature fusion rather than all-to-all routing from encoder stages to decoder stages.
RN blocks were embedded in both the encoder and decoder to facilitate information propagation between shallow texture features and deep semantic features, which may help alleviate gradient vanishing and network degradation during training. DAM was introduced to assign adaptive weights to spatial and channel features, with the aim of increasing the network’s attention to crack-related regions. In the encoding and decoding stages, DAM was designed to support crack-feature representation and high-resolution feature refinement under complex background conditions.
The ASPP module was incorporated into the bottleneck layer to aggregate multi-scale contextual information through parallel atrous convolutions with different dilation rates. This design was intended to support the representation of narrow cracks, wide cracks, and branched crack structures. The integration of RN, DAM, and ASPP was designed to support feature propagation, attention-based feature weighting, and multi-scale contextual representation under complex mining-area conditions.
3.3. Crack Skeleton Extraction and Vectorization
After crack semantic segmentation, connected-component analysis, skeleton extraction, and vectorization were performed on the binary crack masks. Skeletonization reduces crack regions with finite widths to single-pixel-wide centerlines while preserving their topological structure and spatial connectivity. It should be noted that skeletonization is used to extract centerline representations from binary crack masks, rather than to reconstruct crack boundaries. The crack boundaries used for width estimation are extracted separately from the binary masks. This process removes redundant boundary information and improves the efficiency of subsequent crack-length estimation and point-cloud spatial matching. The binary crack mask is defined as:
where
represents crack pixels and
represents background pixels. To avoid interference among adjacent crack regions, connected-component analysis was first used to separate and label individual crack objects. Independent crack units were identified using the eight-neighborhood connectivity criterion.
A topology-preserving skeletonization algorithm was then applied to each crack object. During this process, boundary pixels were iteratively removed while crack connectivity and the main topological structure were retained. The resulting single-pixel-wide crack skeleton can be expressed as:
where
denotes the set of crack skeleton pixels. The extracted skeleton retains the primary propagation direction and spatial structural characteristics of each crack, providing a compact representation of its centerline geometry. Therefore, it can be used to describe the crack centerline and serves as the basis for subsequent geometric analysis.
After skeleton extraction, crack centerlines were generated according to the neighborhood connectivity among skeleton pixels and converted into vector line objects. The vectorized centerlines preserve the principal propagation direction and topological relationships of crack structures while providing an efficient geometric representation for spatial analysis. More importantly, they serve as a geometric link between 2D crack semantic information and 3D point cloud space, enabling the subsequent construction of semantic crack point clouds and 3D geometric characterization.
3.4. Spatial Matching Between Crack Centerlines and Point Clouds
To extend crack representation from 2D image objects to 3D spatial objects, a spatial matching procedure was established between the vectorized crack centerlines and TLS point clouds. After transforming UAV orthomosaics, crack vector data, and TLS point clouds into the CGCS2000/3-degree Gauss–Kruger CM 111E projected coordinate system (EPSG:4546; units: m), neighborhood matching could be directly performed based on their spatial relationships. Let the set of crack centerline points be defined as:
where
denotes the i-th centerline point and n is the total number of centerline points. The TLS point cloud is represented as:
where
denotes the j-th point in the TLS point cloud, and m is the total number of points.
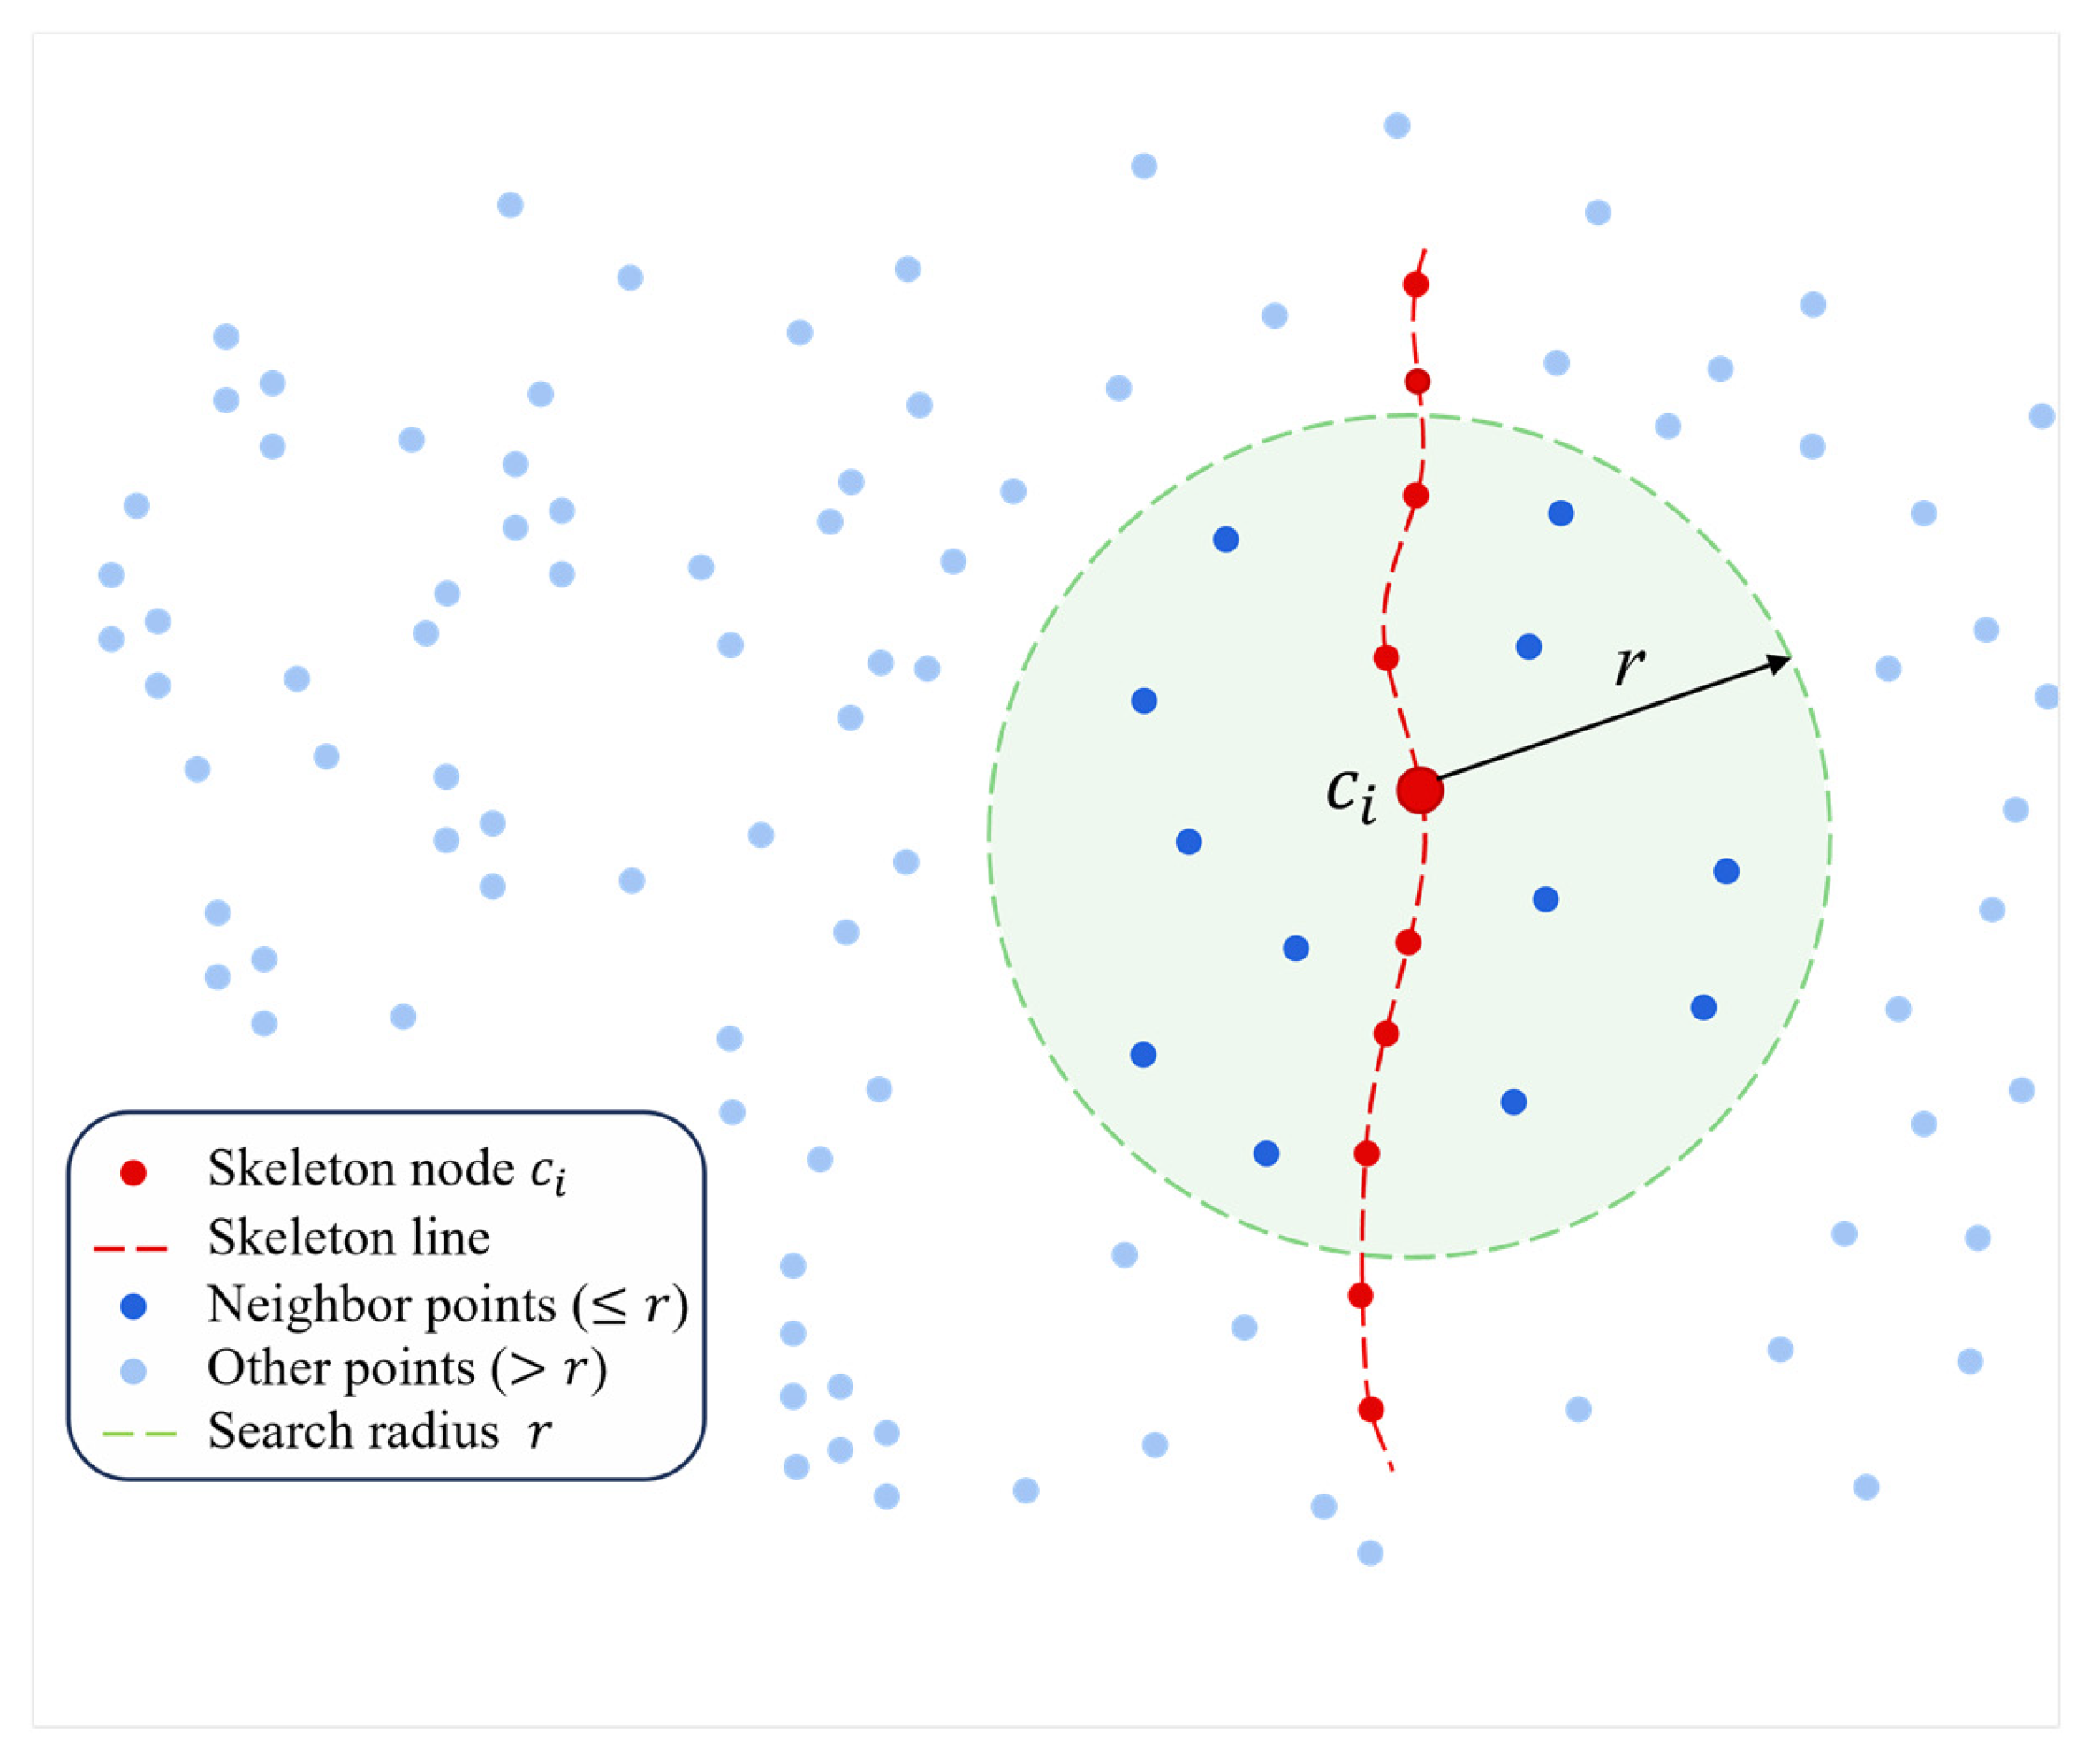
To improve the efficiency of spatial queries in large-scale point clouds, a KDTree structure was used to construct a spatial index for TLS points and facilitate neighborhood searches around crack centerline points, as illustrated in
Figure 4 [
28]. For each centerline point
, neighboring point-cloud points within a search radius r were identified according to:
where
denotes the neighborhood point-cloud set associated with the centerline point
, and
represents the horizontal Euclidean distance between the centerline point
and the TLS point
in the x-y plane. Specifically,
= [(
−
)
2 + (
−
)
2]
1/2, and
r denotes the search radius. Although each TLS point contains a three-dimensional coordinate
= (
,
,
), the elevation coordinate
was not used in the KDTree neighborhood search. This is because the purpose of this step is to establish the planar spatial association between image-derived crack centerlines and TLS points. The elevation coordinate
of the matched TLS points was retained and used in the subsequent 3D geometric parameter calculation. The KDTree search radius
r is a key parameter controlling the spatial association between crack centerline points and TLS point-cloud points. In this study,
r was set to 0.15 m by considering the UAV-TLS co-registration accuracy, UAV image ground sampling distance, TLS point density, and the typical crack-width scale in the study area. This radius is larger than the horizontal co-registration RMSE of 0.03 m and can tolerate minor spatial misalignment and local point-cloud sampling gaps, while limiting the inclusion of unrelated ground points around the crack. If
r is too small, semantic crack point clouds may become discontinuous because some crack-related TLS points cannot be matched. Conversely, if
r is too large, non-crack ground points may be included, which may reduce the geometric precision of subsequent crack length and width estimation. Therefore,
r = 0.15 m was adopted as a compromise between matching completeness and geometric reliability for semantic crack point-cloud construction.
Neighborhood queries were performed independently for all sampled centerline points. The semantic crack point cloud was constructed as the union of all matched TLS points. If the same TLS point was included in the neighborhoods of multiple adjacent centerline points, it was retained only once according to its point index to avoid duplicate counting. When point-level association was required, the TLS point was assigned to the nearest centerline point based on the minimum horizontal distance dxy. Therefore, the matching procedure can be regarded as a point-wise approximation of a buffer search along the continuous crack centerline. The matched TLS points were then assigned the corresponding crack ID, producing a subset of the TLS point cloud with crack semantic attributes, referred to as the semantic crack point cloud.
3.5. 3D Geometric Parameter Calculation
After skeleton extraction and point cloud matching, 3D crack objects with spatial semantic attributes can be constructed for quantitative analysis of crack geometry. Compared with conventional 2D plane-projection methods, this approach integrates crack centerlines, boundary structures, and point cloud elevation data to produce a realistic 3D representation of crack morphology, capturing curvature, branching, and topographic variations more accurately.
3.5.1. 3D Length Calculation
To construct the 3D skeleton of a crack, each 2D skeleton point is assigned an elevation value. To reduce the influence of local outliers and point cloud noise, the median elevation of neighboring point cloud points is used for each skeleton point:
where
denotes the elevation of skeleton point
, and
represents the elevations of neighboring point cloud points. Using the median rather than a single nearest neighbor mitigates the effect of local anomalies and scanning noise, enhancing the stability and reliability of 3D skeleton construction.
Combining the planar coordinates of skeleton points with the assigned elevations yields the 3D skeleton point set:
where
denotes the 3D coordinates of the
-th skeleton point, and
is the total number of skeleton points.
Cracks typically exhibit curvature, branching, and irregular skeleton point distributions. Directly connecting skeleton points in sequence may introduce local jump errors, especially when skeleton points are unordered or locally discontinuous. Therefore, a minimum spanning tree (MST) is constructed to establish spatial connections between skeleton points. Compared with sequential point connection, MST provides a distance-based graph structure for connecting skeleton points without requiring a predefined point order, thereby reducing artificial long-distance jumps caused by unordered point sequences and improving the stability of length calculation for complex crack skeletons. The sum of all edge lengths in the MST defines the 3D crack length:
where
represents the edge set of the MST, and
and
denote the 3D coordinates of adjacent skeleton points.
is the resulting 3D crack length.
It should be noted that the MST is used here as a practical graph-based approximation for organizing unordered crack skeleton points into a connected structure. The input skeleton points are derived from extracted crack regions and semantic crack point clouds, and therefore are already constrained by the detected crack morphology rather than being arbitrary scattered points. Compared with directly connecting skeleton points according to their storage order, the MST can reduce artificial local jump errors caused by unordered point sequences and provide an acyclic connected representation for curved or locally branching cracks. However, the MST minimizes the total edge length only and does not explicitly enforce curvature continuity, local orientation consistency, or physical crack topology. Therefore, shortcut connections may still occur in noisy skeletons, dense crack networks, or areas where spatially adjacent branches are physically disconnected.
3.5.2. 3D Crack Width Calculation
Crack width reflects the opening degree and spatial development of mining-induced surface cracks. Because these cracks commonly exhibit curvature, irregular shapes, and non-uniform width variations, conventional fixed-direction or buffer-based measurement methods are prone to errors caused by local bending and boundary noise. To address this issue, a skeleton-guided boundary point-pairing method was adopted to estimate crack width adaptively. In this study, crack-width estimation follows a “2D boundary pairing and 3D distance calculation” strategy. Boundary pairing is performed in the horizontal image plane because crack edges are extracted from UAV orthomosaic-based semantic masks, whereas the final width calculation incorporates TLS-derived elevation information after the opposite boundary points have been identified.
In this method, crack skeleton points are used as local measurement centers. For the i-th skeleton point, the local tangent direction is first calculated based on neighboring skeleton points:
A local normal direction perpendicular to the crack direction is then established:
where
and
denote the local tangent and normal vectors at the current skeleton point, respectively, and
and
are the components of the tangent vector along the
and
axes.
Let the set of boundary points along the crack be:
To improve boundary-point search efficiency, a KDTree spatial index is constructed for the boundary points, and a local search region is established around each skeleton point. For each candidate boundary point, its projections along the local normal and tangent directions are calculated as follows:
where
u is the projection distance along the local normal direction,
v is the projection distance along the local tangent direction, Δ
x and Δ
y are the coordinate differences between the candidate point and the skeleton point in the
x and
y directions, respectively, and
and
are the components of the normal vector. The tangent projection
v is used to constrain candidate points close to the local normal cross-section. Here, the local tangent and normal directions are defined in the
x-
y plane of the common projected coordinate system. The purpose of this 2D projection-based filtering is to ensure that the paired boundary points are located on opposite sides of the crack and close to the same local cross-section. Elevation is not used in this pairing step to avoid unstable pairing caused by point-cloud noise or local terrain fluctuations.
Based on the sign of the normal projection, candidate boundary points are classified into left (
) and right (
) boundary sets:
Only points satisfying
below a predefined threshold are retained to reduce the influence of crack curvature and local noise on width measurements. After the opposite boundary points are determined in the 2D plane, their corresponding elevation values are assigned from the TLS point cloud. The 3D Euclidean distance between the paired boundary points is then calculated as the terrain-aware edge-to-edge crack width at the current skeleton point:
where
and
denote the coordinates of the
and
points. To reduce the influence of anomalous points and mismatches, upper and lower width constraints are imposed, and unreasonable width values are discarded. All valid width measurements are then aggregated for statistical analysis.
Compared with traditional fixed-direction width measurement methods, the proposed approach adaptively adjusts the measurement direction according to local crack morphology. It can accommodate curvature, branching, and non-uniform width variations in mining-induced surface cracks, thereby improving the stability and spatial fidelity of crack-width estimation. It should be noted that when a large vertical offset exists between the two crack edges or when the local terrain slope is very steep, the calculated 3D distance may include part of the terrain-relief effect and may therefore differ from the horizontal crack opening. In the present study area, the vertical offset between paired crack edges was generally limited, and the field validation results showed acceptable errors. For areas with strong vertical displacement or complex micro-topography, local terrain-plane projection or cross-sectional correction should be considered in future work.
4. Results
4.1. Crack Semantic Segmentation Results
The proposed DRA-UNet model was implemented using the PyTorch framework (version 2.0.1) and trained on a workstation equipped with GPU acceleration. During training, the AdamW optimizer was employed to update network parameters, with an initial learning rate of 1 × 10⁻⁴ and a batch size of 8. All input images were uniformly resized to 256 × 256 pixels, and the maximum number of training epochs was set to 180.
A hybrid loss function was adopted as the optimization objective. It consisted of Focal Tversky Loss, BCEWithLogitsLoss, and Edge Consistency Loss, with corresponding weight coefficients of 0.6, 0.3, and 0.1, respectively. Focal Tversky Loss was used to reduce the influence of the strong class imbalance between crack and background pixels, BCEWithLogitsLoss was used to constrain pixel-level crack/background classification, and Edge Consistency Loss was introduced to provide boundary-related supervision. It should be noted that the hybrid loss was designed to support crack-region recognition and boundary continuity, while the independent contribution of each loss term was not separately evaluated in this study.
During model training, data augmentation strategies were introduced to increase the diversity of training samples. Specifically, random brightness and contrast adjustment was applied with a probability of 0.5, with brightness and contrast factors randomly sampled from 0.8 to 1.2. Random horizontal flipping and random vertical flipping were each applied with a probability of 0.5. Random rotations of 90° or 180° were also applied with a probability of 0.5. These augmentation operations were intended to improve the robustness of the model under complex mining-area background conditions.
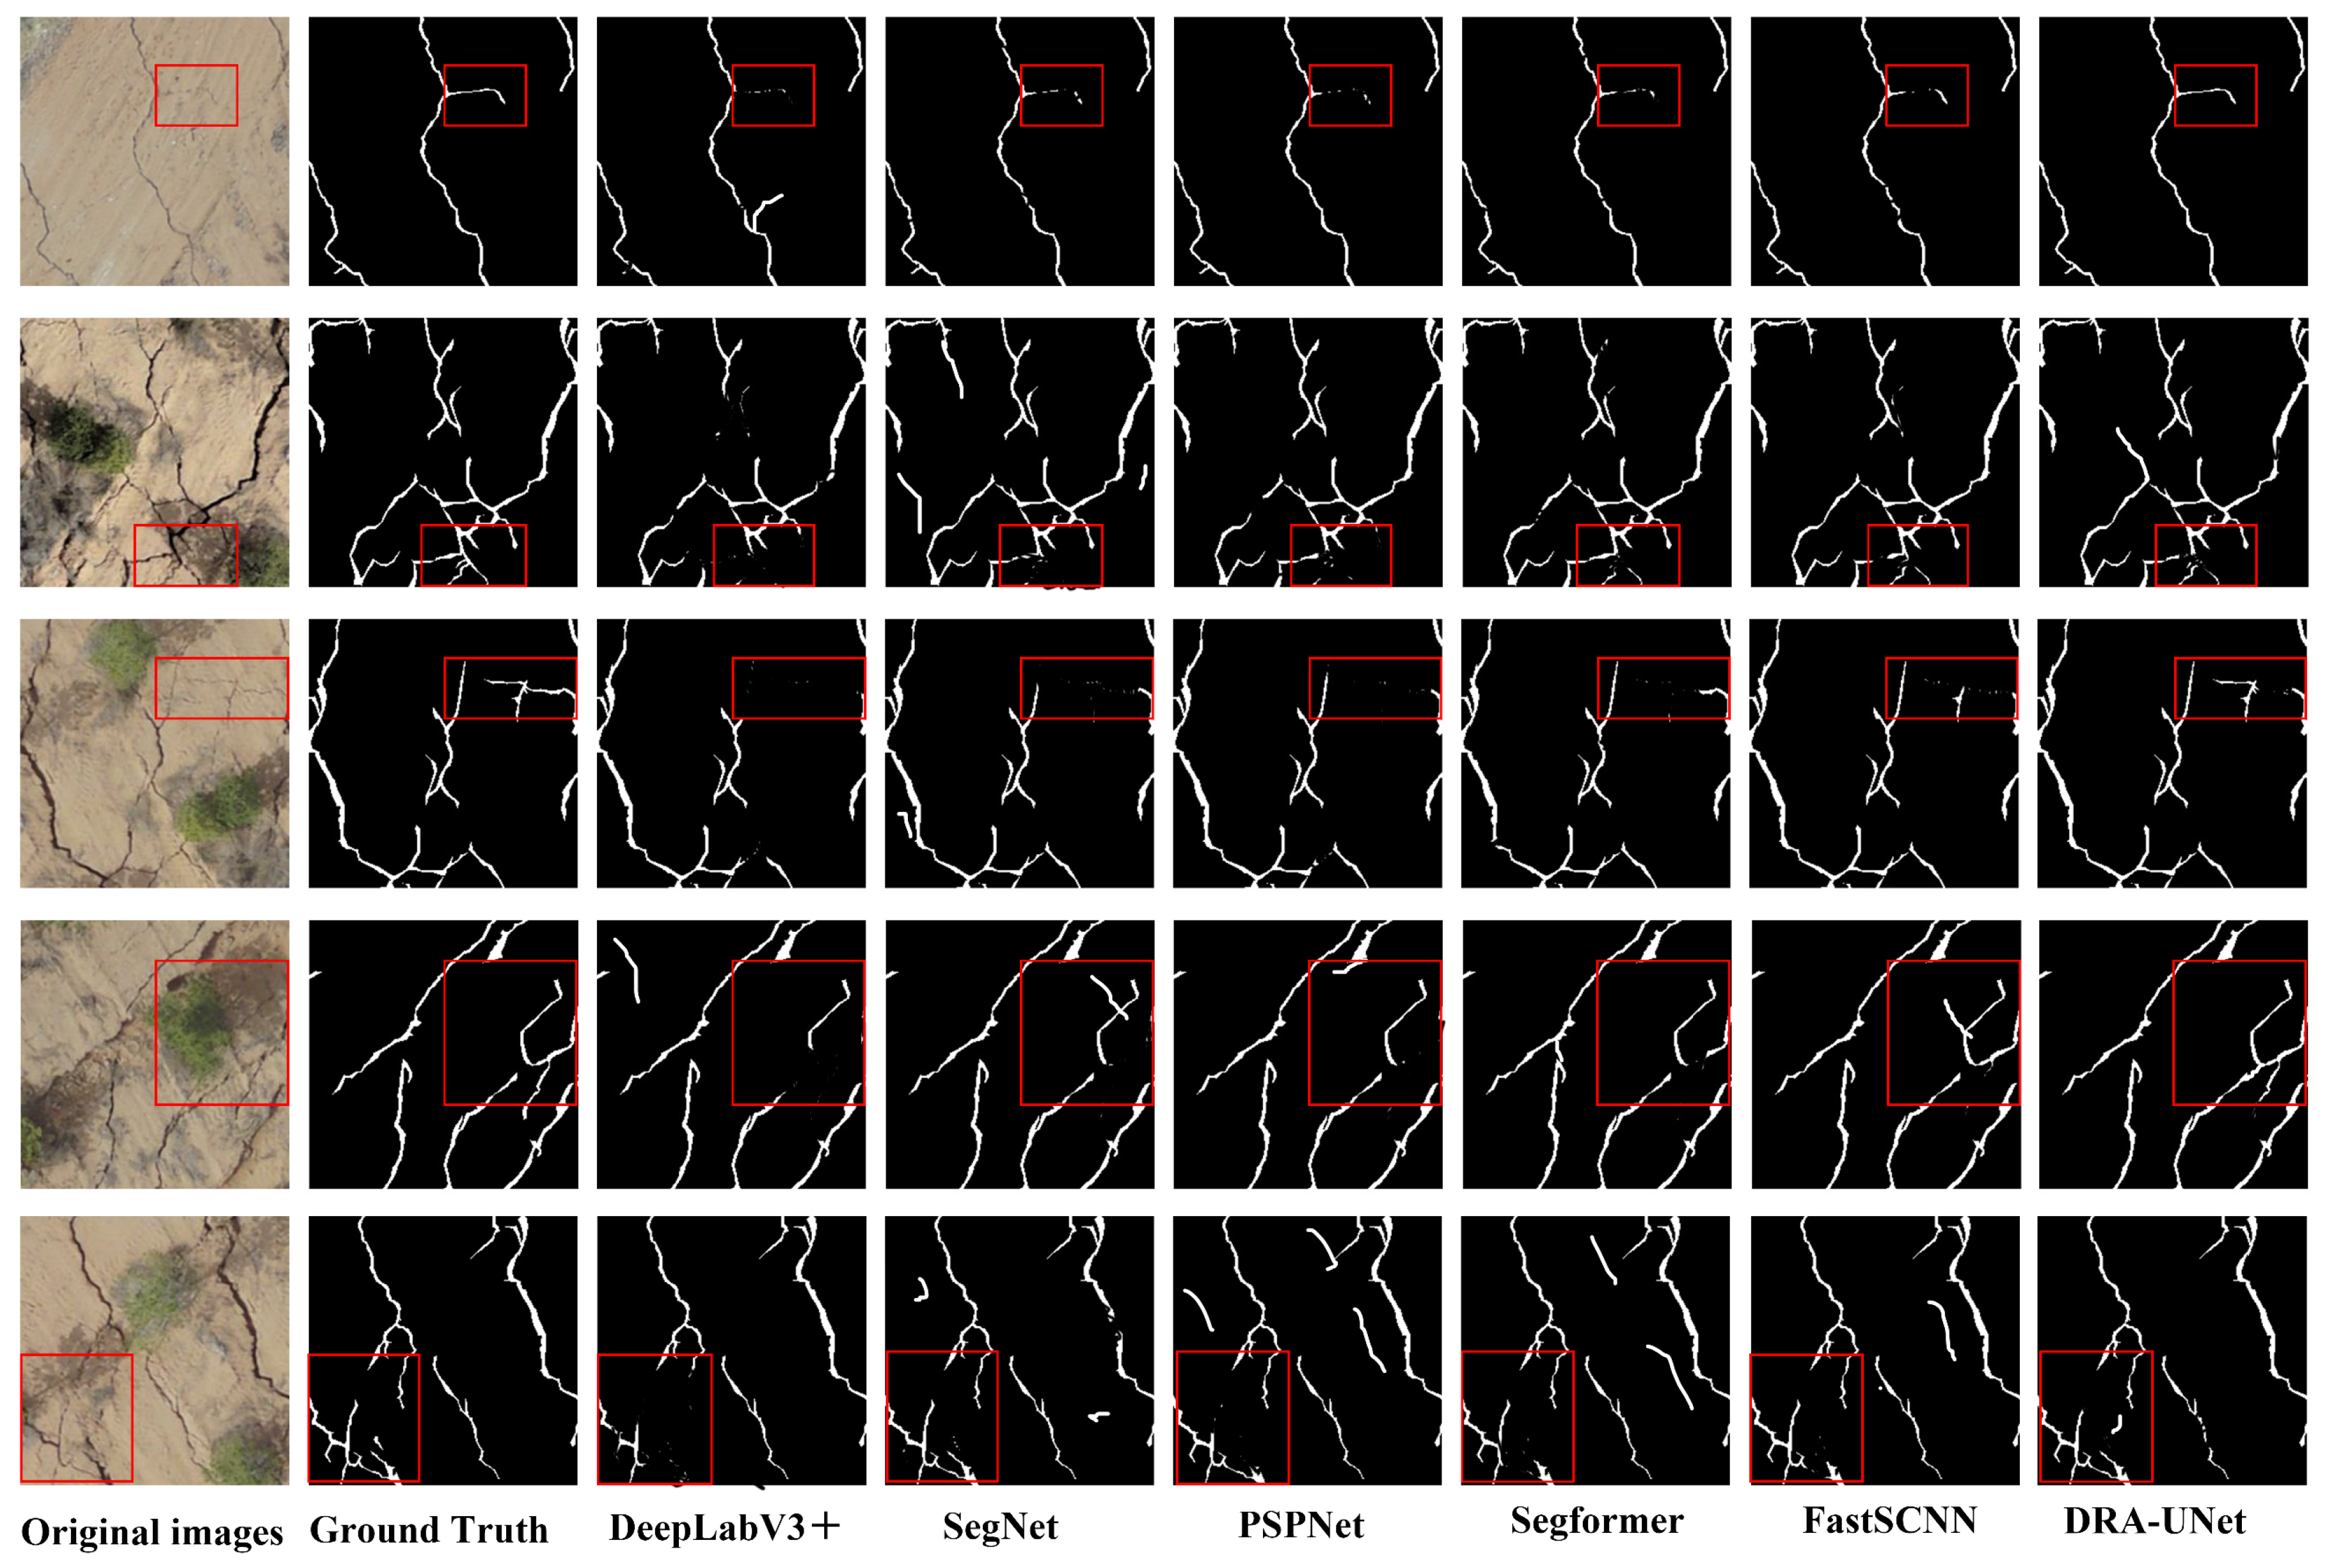
Segmentation performance was evaluated using four metrics: precision, recall, F1-score, and MIoU. To assess the effectiveness of DRA-UNet, comparative experiments were conducted using several representative semantic segmentation models, including DeepLabV3+, SegNet, PSPNet, SegFormer, and FastSCNN. All models were trained and evaluated using the same dataset partition and experimental settings to ensure a fair comparison.
As shown in
Figure 5, all models were able to identify the major crack regions when cracks exhibited clear morphological characteristics and strong contrast against the background. However, substantial differences were observed in areas containing narrow cracks, low-contrast cracks, and complex surface textures. In these regions, several models exhibited crack discontinuities, local omissions, and false detections, leading to reduced connectivity and incomplete boundary delineation. In contrast, DRA-UNet preserved the overall crack structure and spatial topology more effectively. The model demonstrated superior capability in maintaining the continuity of narrow branch cracks and suppressing background interference, particularly in areas with heterogeneous textures and complex surface conditions.
As shown in
Table 3, DRA-UNet achieved the highest performance across all four evaluation metrics, with a precision of 85.13%, recall of 77.84%, F1-score of 81.32%, and MIoU of 70.26%. Compared with the baseline models, DRA-UNet showed better overall segmentation performance in the test set, especially in terms of the balance between precision and recall. However, these results alone cannot fully determine the specific contribution mechanism of each architectural component. Therefore, an ablation experiment was further conducted under the same dataset partition and training settings. Starting from the U-Net baseline, RN, DAM, and ASPP were introduced individually and in combination to assess their effects on crack segmentation performance. The results are summarized in
Table 4.
As shown in
Table 4, the U-Net baseline achieved a precision of 79.55%, recall of 73.07%, F1-score of 76.18%, and MIoU of 66.16%. Introducing RN, DAM, and ASPP individually improved the F1-score to 78.43%, 76.78%, and 76.83%, respectively. Among the single-module variants, RN produced the largest improvement in F1-score. When multiple modules were combined, the segmentation performance further improved. The full DRA-UNet achieved the best overall performance, with a precision of 85.13%, recall of 77.84%, F1-score of 81.32%, and MIoU of 70.26%. Compared with the U-Net baseline, DRA-UNet improved precision, recall, F1-score, and MIoU by 5.58, 4.77, 5.14, and 4.10 percentage points, respectively. These results suggest that the combined use of RN, DAM, and ASPP is associated with improved crack segmentation performance in the present experimental setting. However, the exact contribution mechanism of each module and the possible interaction among modules were not further analyzed through feature visualization or more detailed controlled experiments. Therefore, the functional roles of RN, DAM, and ASPP should be interpreted as design motivations and empirical observations rather than definitive causal explanations. It should also be noted that the ablation experiment mainly evaluates the architectural components, while the independent contribution of the hybrid loss function to segmentation performance was not separately quantified in this study.
4.2. 3D Mapping and Semantic Point Cloud Extraction
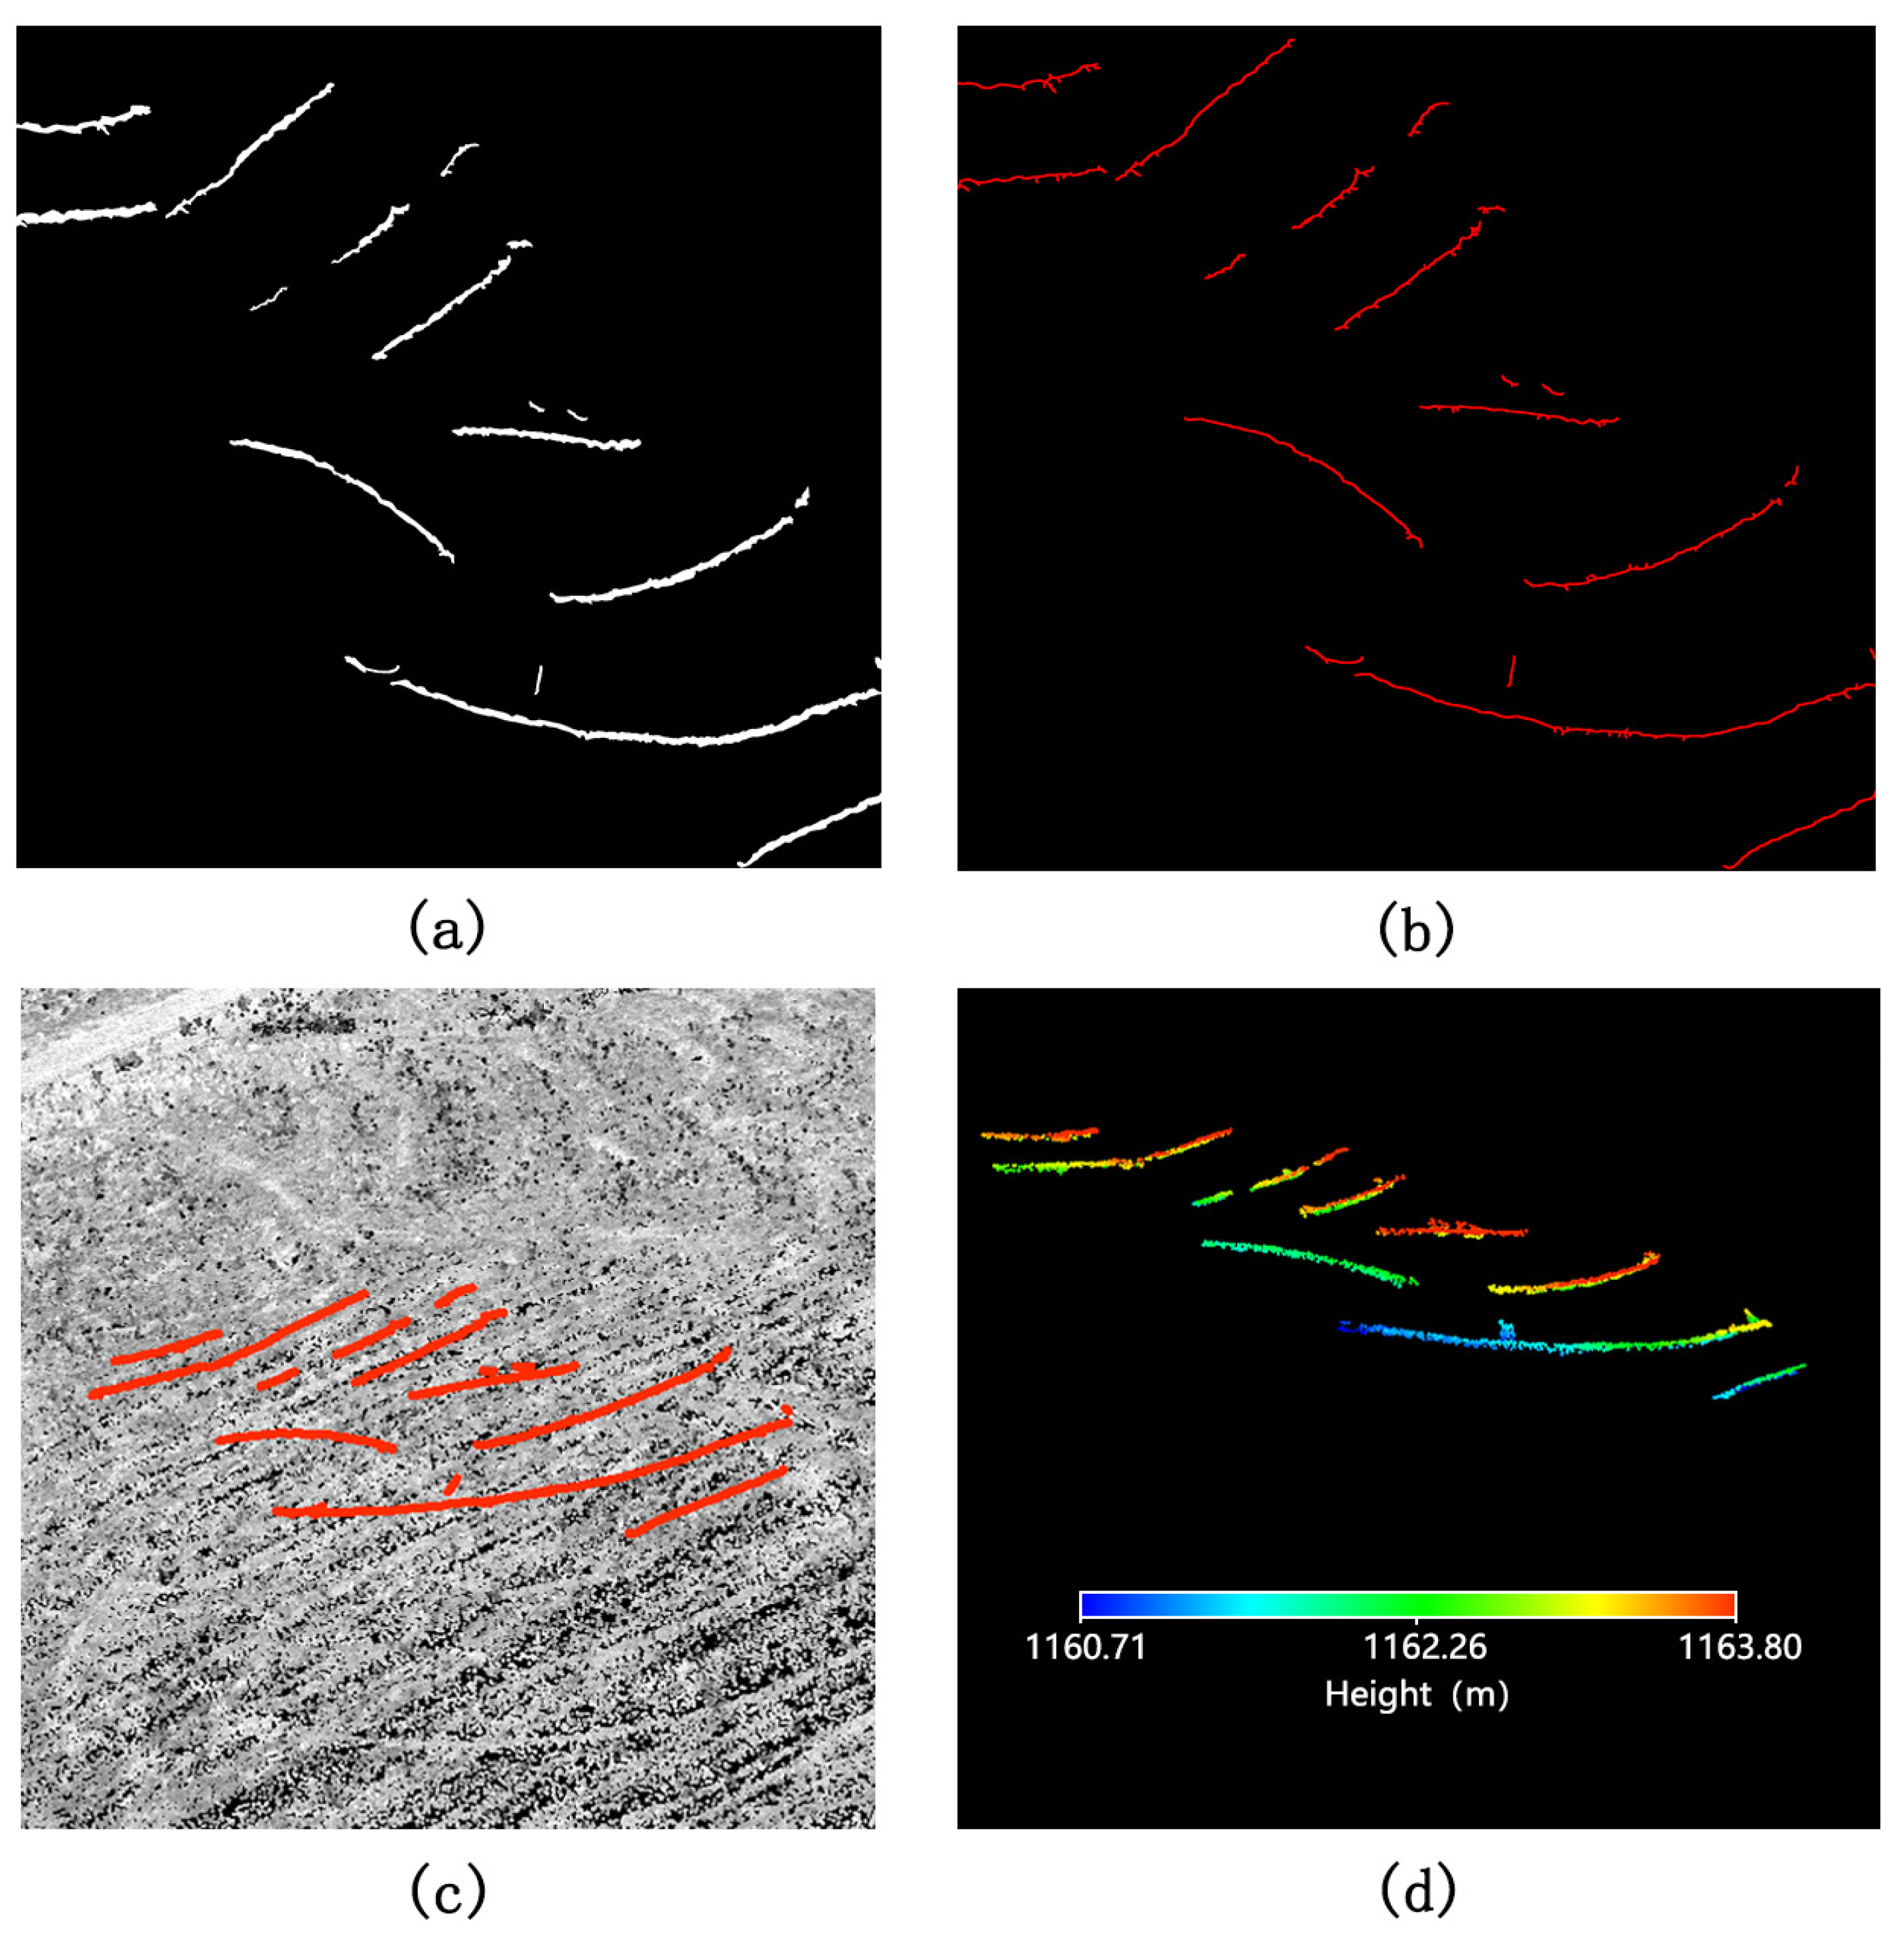
To validate the effectiveness of mapping 2D crack semantic information into 3D point cloud space, a representative area of crack development was selected for visualization. This area includes both elongated primary cracks and localized short or branching cracks, providing a comprehensive view of crack spatial morphology under complex surface conditions. The results of crack binarization, skeleton extraction, skeleton-to-point-cloud mapping, and semantic crack point cloud construction are shown in
Figure 6.
Figure 6a,b illustrate the conversion of crack segmentation results into skeletonized centerlines. The binarized crack masks effectively preserve the main crack structures, while skeletonization reduces crack regions to single-pixel-wide centerlines. This process removes redundant boundary information while maintaining topological structure and spatial connectivity. Compared with direct use of crack boundaries for spatial analysis, skeletonized centerlines provide a more stable geometric representation of crack propagation paths and a robust basis for point-cloud matching.
Figure 6c,d show the mapping of crack information from 2D image space to 3D point cloud space. The crack skeletons and TLS point clouds exhibit strong spatial correspondence, and the mapped centerlines accurately represent crack locations under real surface conditions. The constructed semantic crack point clouds retain the planar distribution of cracks while incorporating elevation information and 3D geometric attributes, thereby transforming cracks from 2D image objects into 3D spatial objects. These results demonstrate that integrating image-based semantic information with point cloud geometry overcomes the limitation of UAV orthomosaics lacking elevation information and provides a reliable data basis for subsequent analysis of 3D crack length, width, and elevation variation. Although independent ground-truth data for skeleton extraction and 2D–3D point-cloud matching were not available, the intermediate results were checked through visual overlay and spatial consistency analysis. The extracted skeletons were located within the segmented crack regions and preserved the main propagation directions of the cracks. After KDTree-based matching, the mapped crack centerlines showed good spatial correspondence with the TLS point clouds, indicating that the semantic crack information was successfully transferred from the 2D image plane to the 3D point-cloud space. In addition, the UAV–TLS co-registration RMSE of 0.03 m and the adopted search radius of 0.15 m provided a practical tolerance for minor spatial misalignment during matching.
4.3. 3D Geometric Parameter Estimation and Validation
4.3.1. 3D Length Estimation and Validation
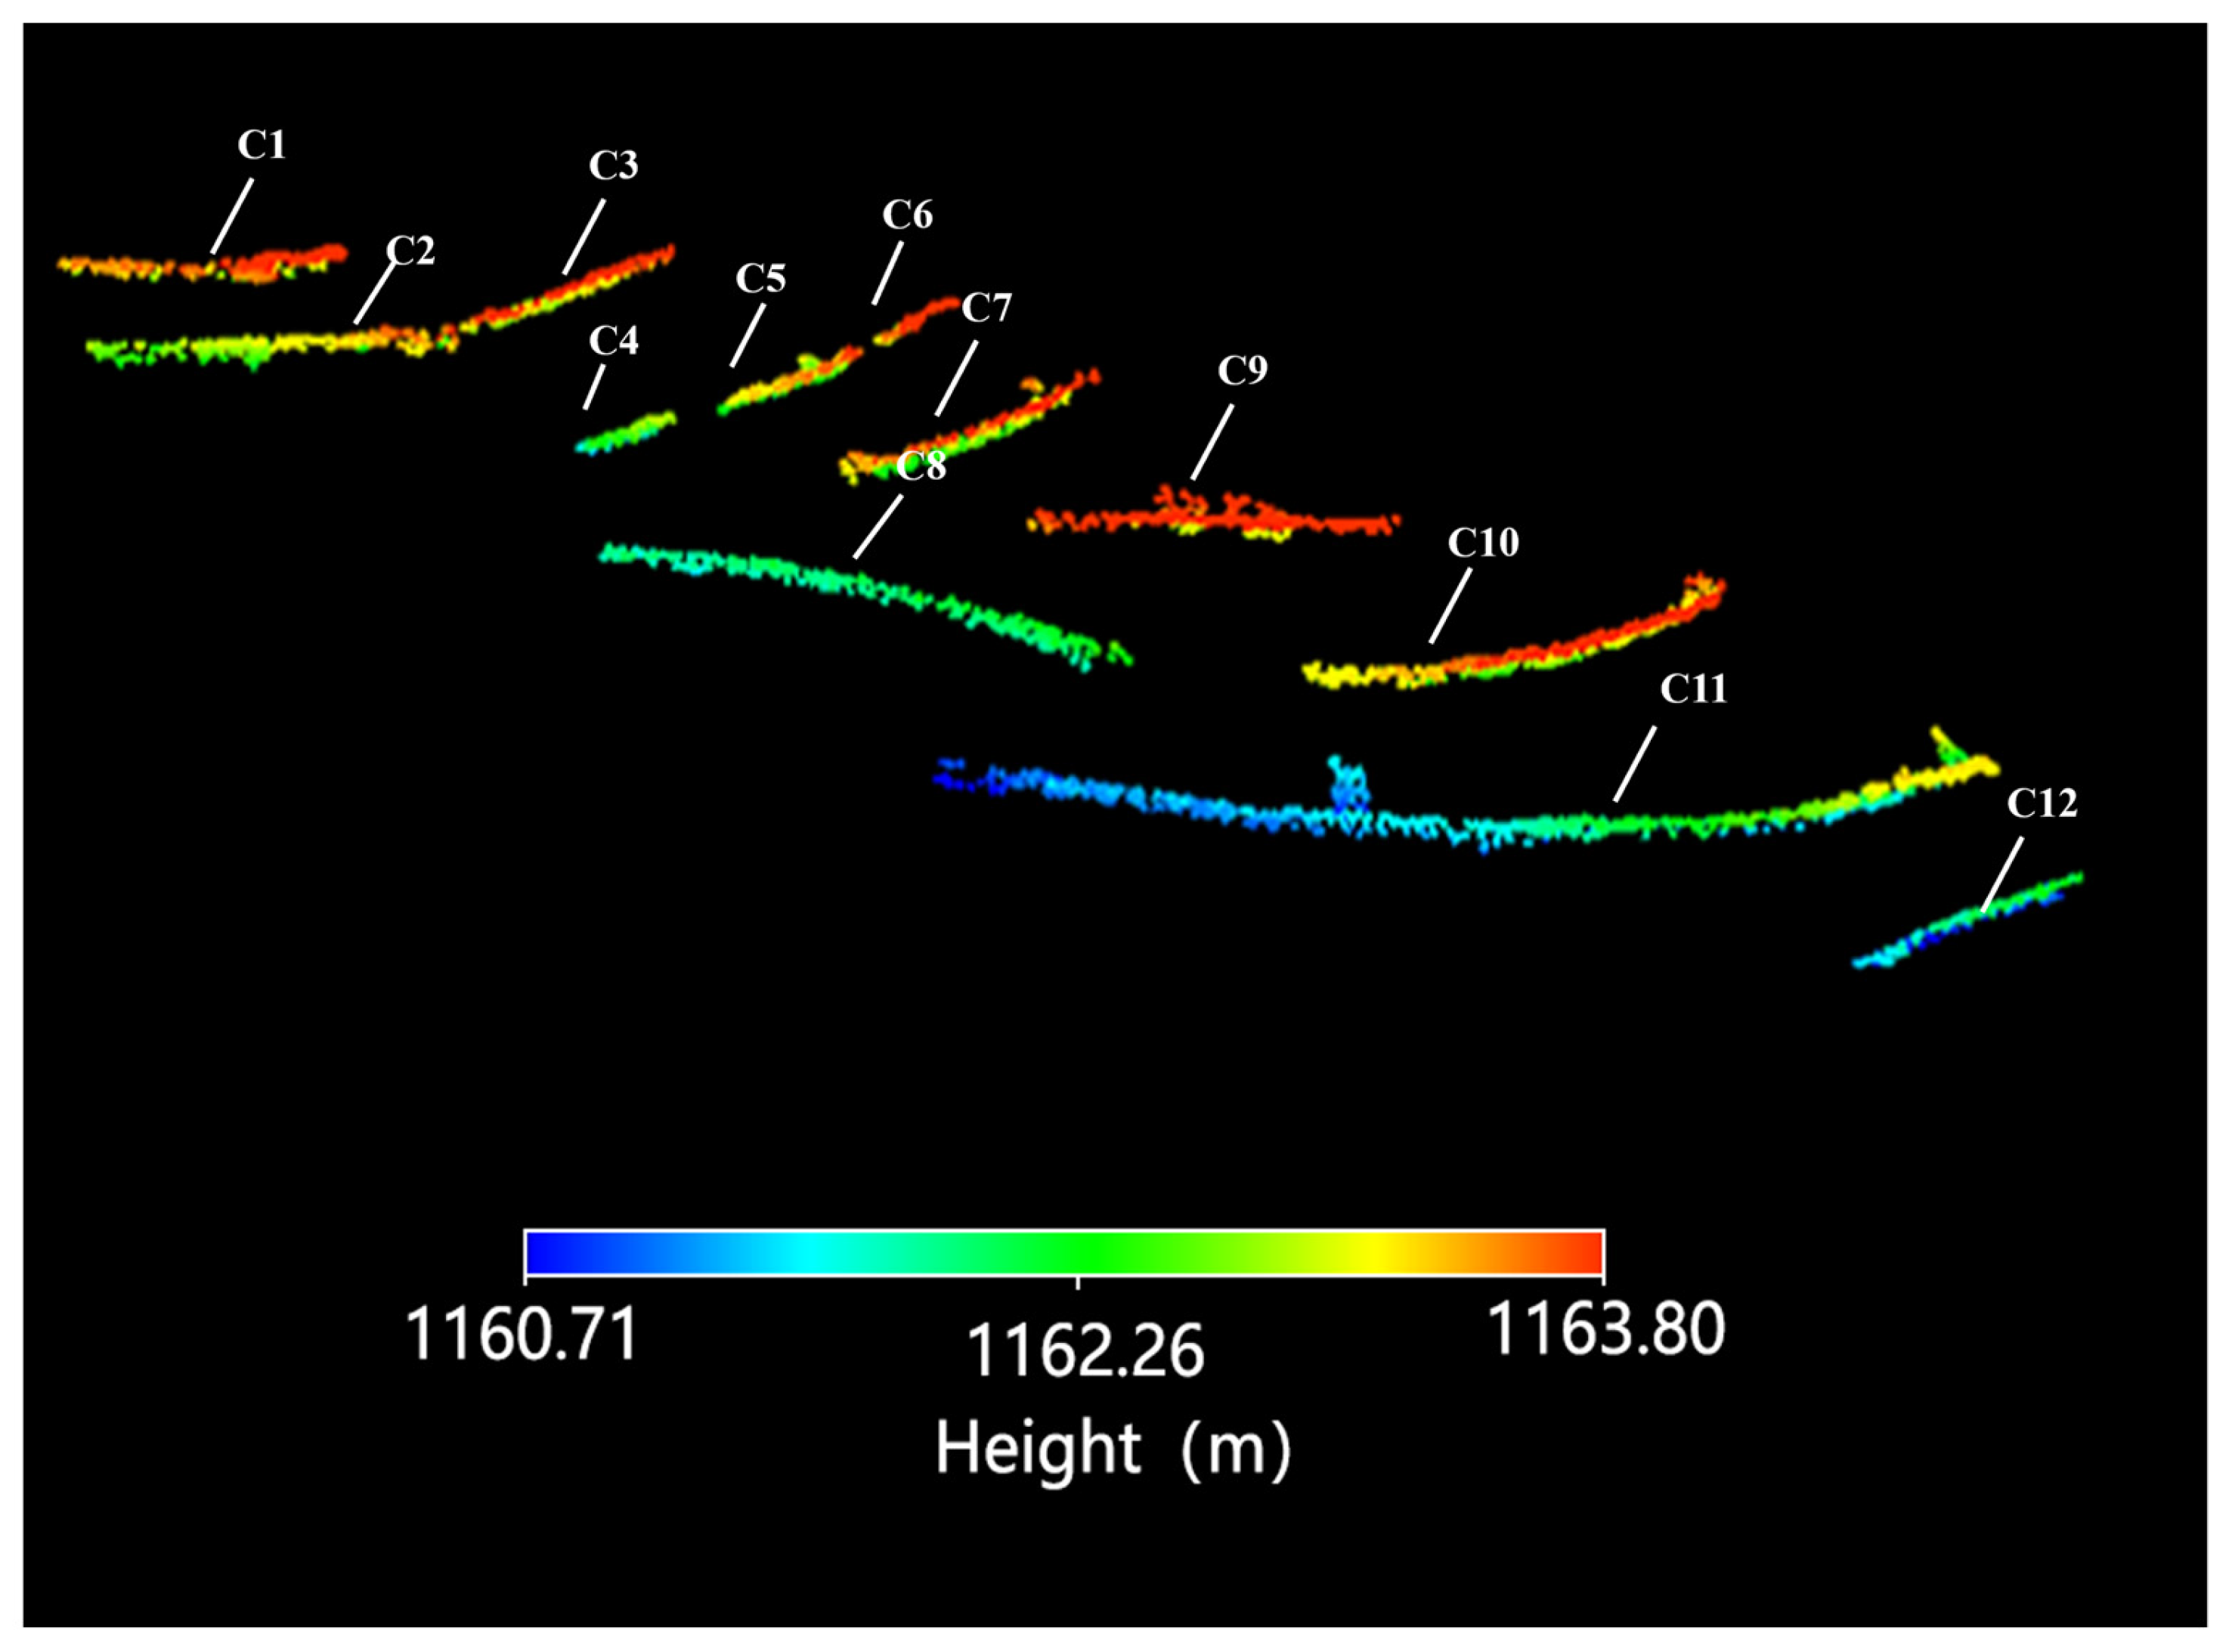
Figure 7 presents the semantic crack point clouds of representative cracks and their corresponding labels in the study area. The color variations indicate elevation differences within the crack point clouds, enabling visualization of crack propagation patterns under real topographic conditions. Overall, the identified cracks show heterogeneous spatial distributions, with clear variations in length, continuity, and propagation direction.
Among the representative cracks, C11 is the most continuous primary crack and has the largest spatial extent, indicating a well-developed propagation pattern across the mining-affected area. Cracks C10, C3, and C8 are medium-to-long cracks with relatively large spatial coverage, whereas C4 and C6 are short cracks mainly associated with local secondary fractures or crack termination zones. These results demonstrate that the semantic crack point cloud representation can effectively capture the spatial variability and geometric characteristics of mining-induced surface cracks under complex terrain conditions.
To evaluate the reliability of the proposed 3D crack characterization method, the twelve representative cracks shown in
Figure 7 were selected for field validation. These cracks were selected to cover different crack lengths, continuity levels, propagation directions, and spatial locations within the study area, including both long primary cracks and short secondary cracks. Field-measured crack lengths were obtained manually along the visible crack traces using a tape measure. For each representative crack, the two endpoints were identified according to the continuous visible crack trace observed in the field and the corresponding UAV orthomosaic. The tape measure was placed along the main crack path as closely as possible to follow local curvature and branching characteristics. Each crack length was measured repeatedly, and the average value was used as the reference length for validation. The 2D lengths derived from crack skeletons and the 3D lengths calculated from semantic crack point clouds were then compared with the field-measured lengths.
Table 5 summarizes the 2D length, 3D length, field-measured length, absolute error, relative error, RMSE, and R
2 for the representative cracks.
As shown in
Table 5, the 2D length estimates were consistently smaller than the corresponding field-measured lengths, with a mean absolute error of 0.70 m, an RMSE of 0.81 m, an R
2 of 0.993, and a mean relative error of 4.49%. Here, the 2D length estimation can be regarded as a 2D-only image-based baseline, because the crack lengths were derived from UAV-extracted crack skeletons without incorporating TLS-derived elevation information.
In contrast, the proposed UAV-TLS fusion method incorporates both the planar positions of crack centerlines and the elevation information from TLS point clouds. The resulting 3D lengths show better agreement with field measurements, with a mean absolute error of 0.41 m, an RMSE of 0.48 m, an R2 of 0.998, and a mean relative error of 2.64%. Compared with the 2D-only baseline, the proposed 3D method reduced the mean absolute error from 0.70 m to 0.41 m and the RMSE from 0.81 m to 0.48 m. For the longest primary crack (C11), the absolute error was 1.07 m, corresponding to a relative error of 2.51%. Shorter cracks, C4 and C6, exhibited relative errors of 3.17% and 3.06%, respectively.
4.3.2. Crack Width Analysis and Validation
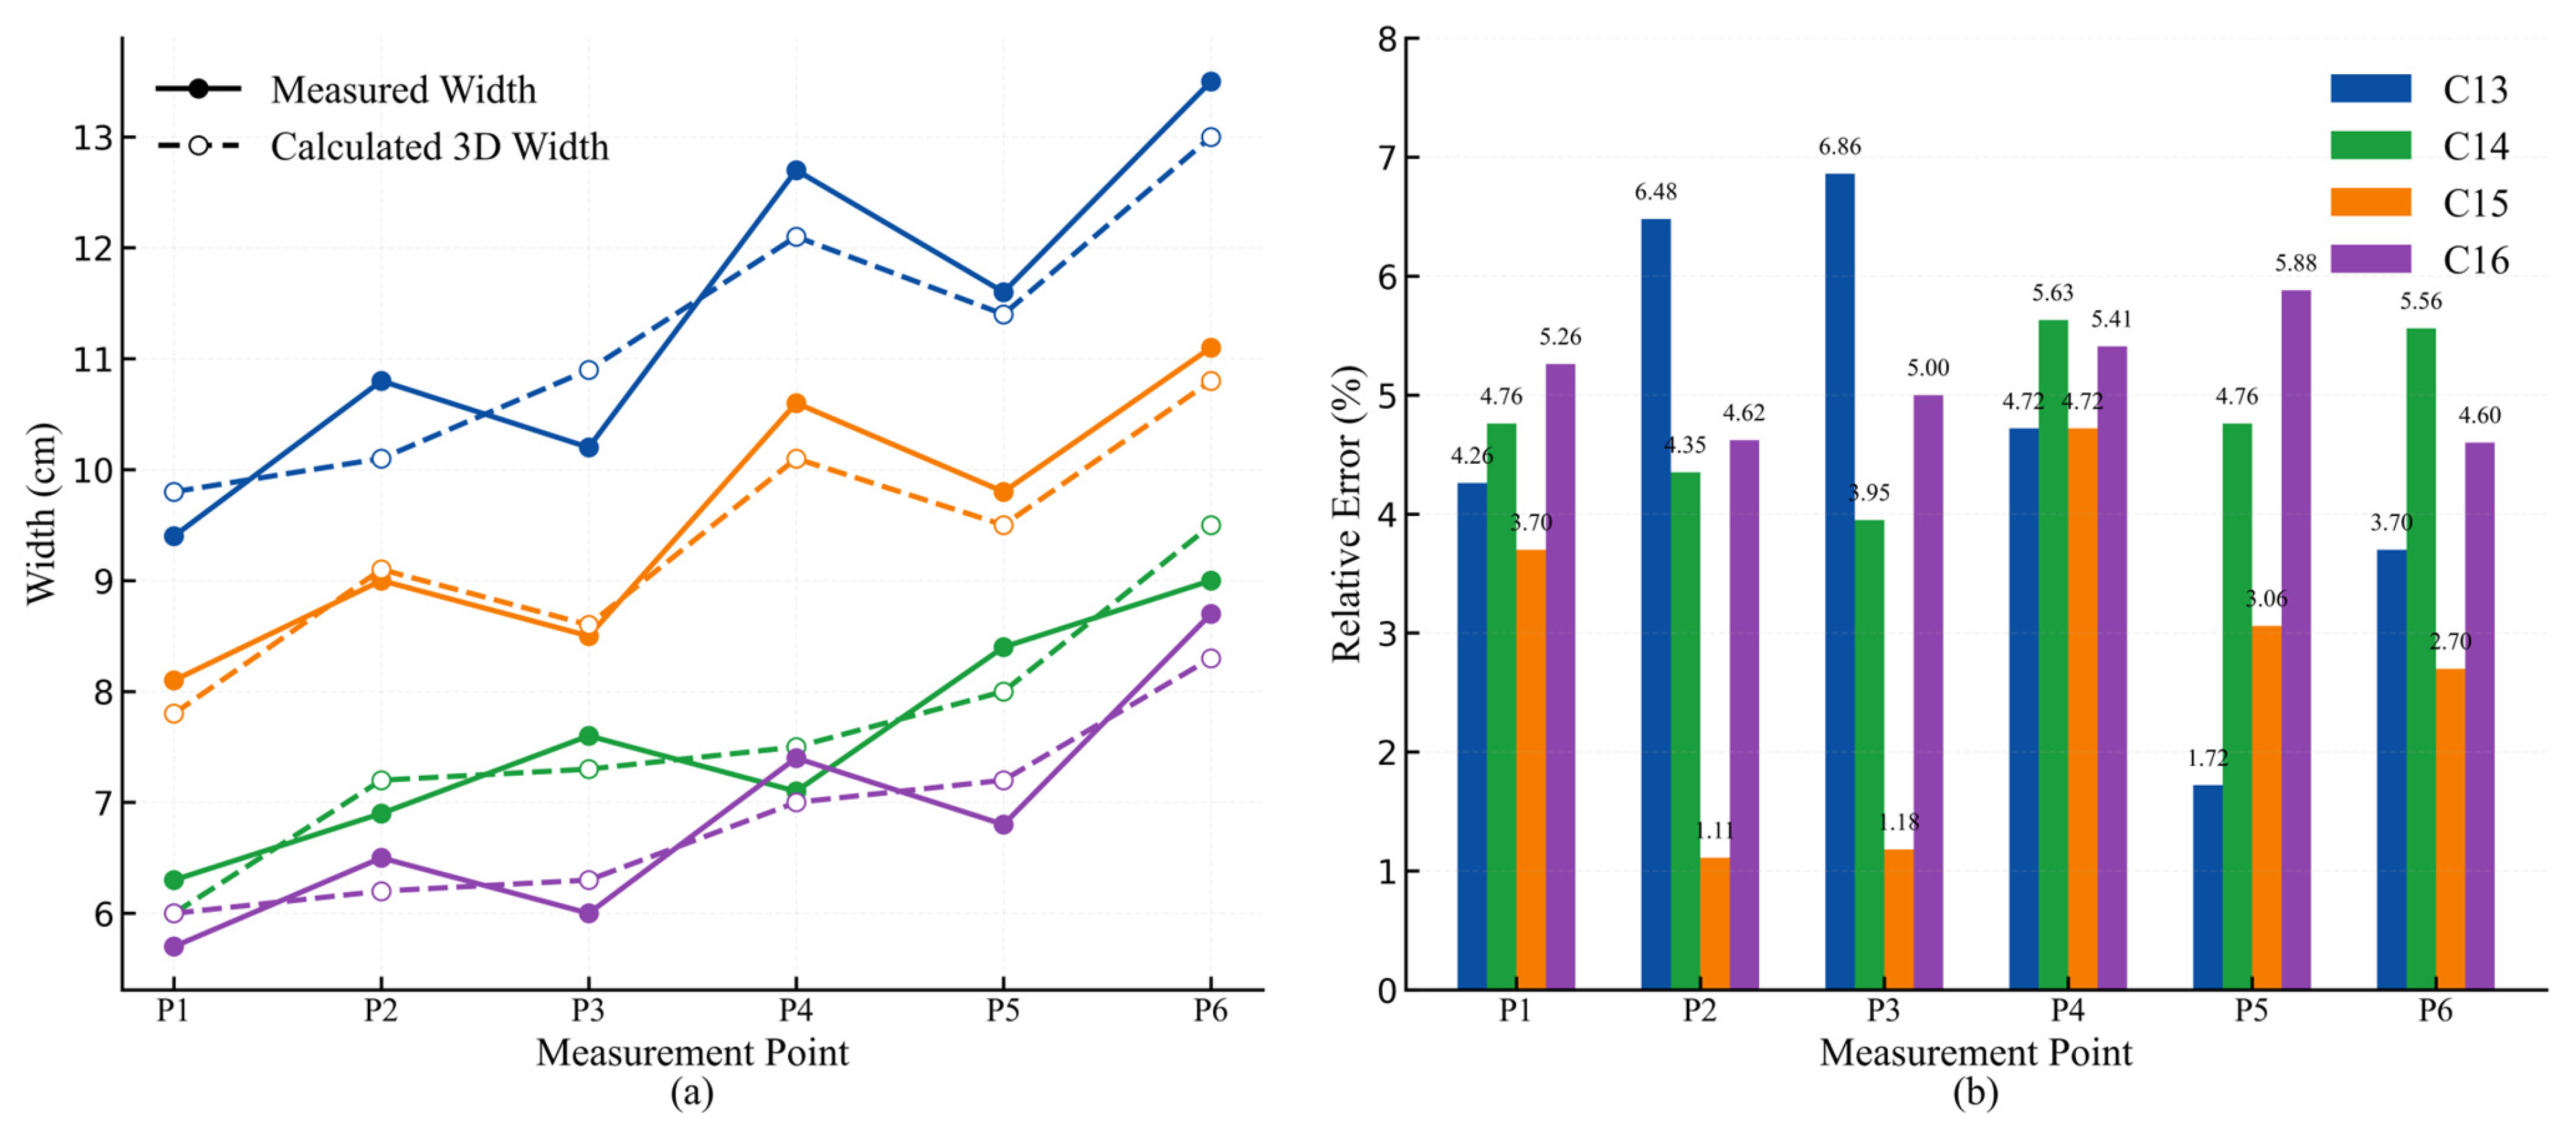
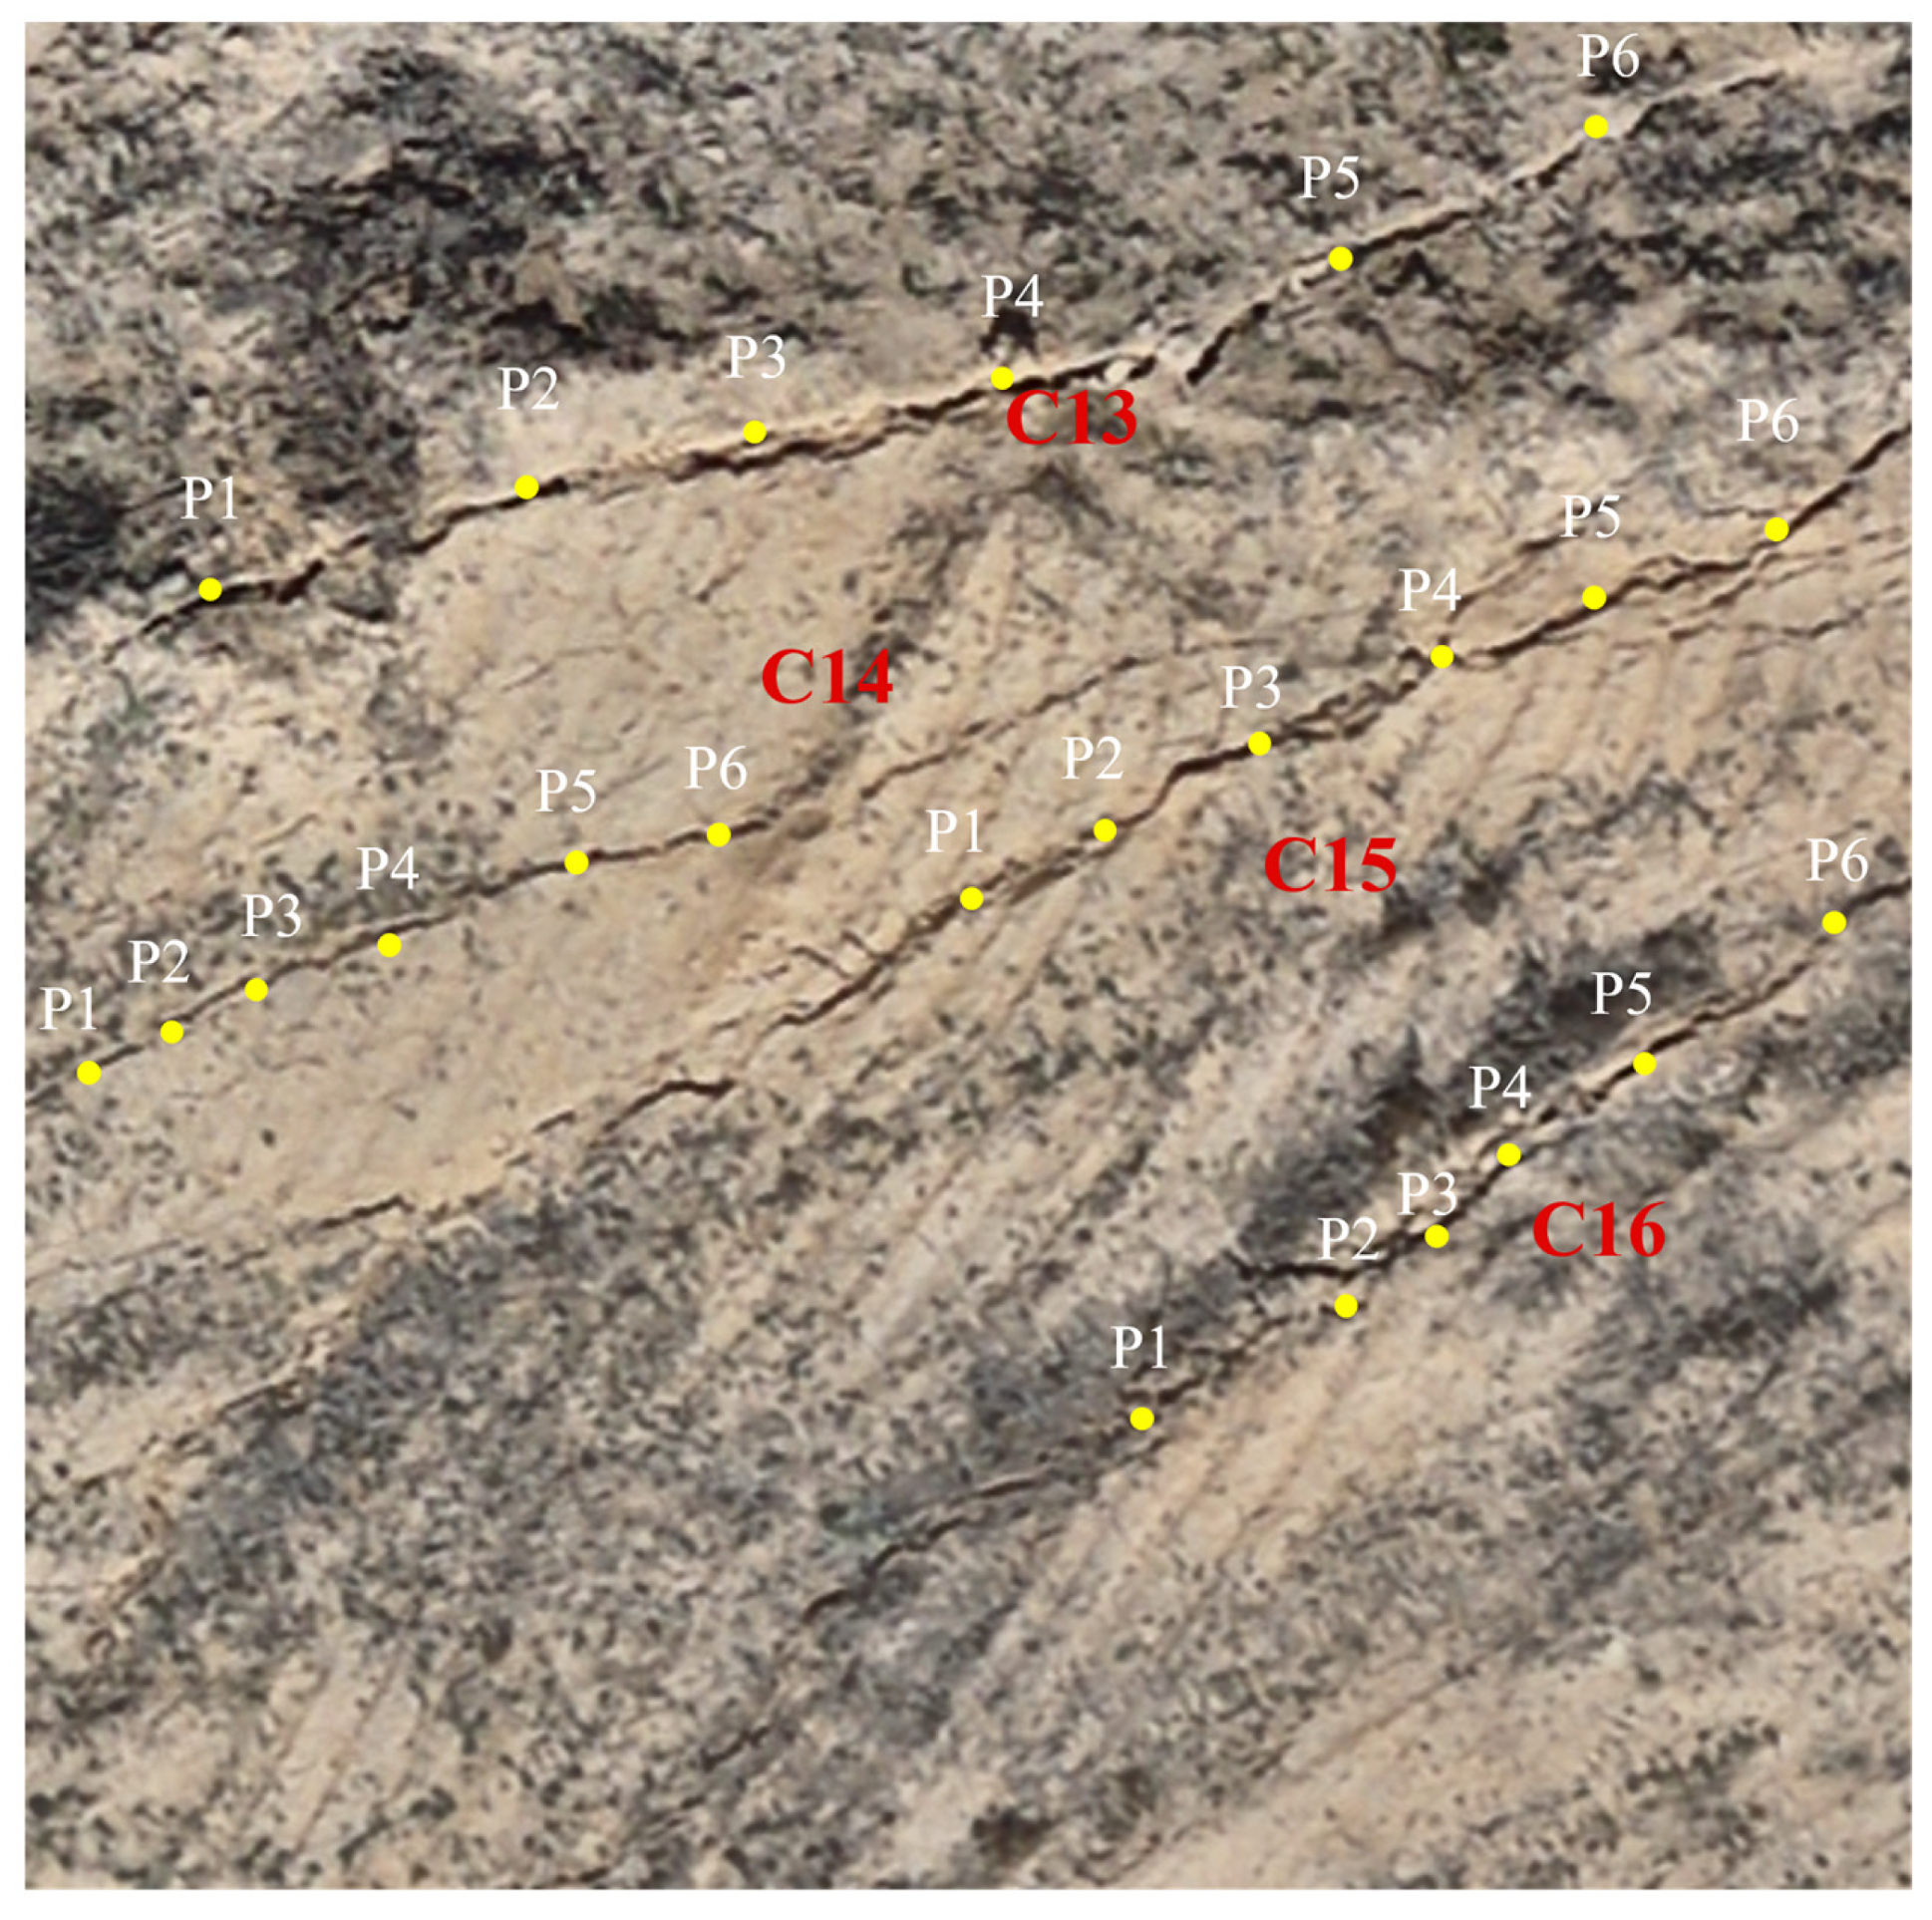
To evaluate the accuracy of the proposed method in estimating crack widths, four representative cracks (C13–C16) were selected to represent different width ranges and local boundary conditions. Six measurement points (P1–P6) were arranged along each crack, as shown in
Figure 8. Field-measured widths were obtained using a tape measure and compared with the calculated 3D widths obtained by the proposed framework. In this study, the calculated width refers to the terrain-aware edge-to-edge crack width derived from 2D boundary pairing and TLS-based 3D distance calculation, rather than a purely 2D image-based width. For field validation, the six measurement points were arranged from the crack head to the crack end to cover local width variations. At each measurement point, the crack width was measured approximately perpendicular to the local crack direction between the two visible crack edges. The measurement positions were identified based on field observations and the corresponding UAV orthomosaic to ensure consistency with the automatically extracted width locations. Small discrepancies may still arise from irregular crack edges, loose surface materials, local boundary fragmentation, and slight positioning differences between field measurement points and automatically extracted cross-sections.
Figure 9a compares the field-measured crack widths with those estimated by the proposed method at all measurement points. Overall, the estimated widths agree well with the field measurements and capture width variations along the crack traces. The method performs consistently across cracks with different width ranges and effectively characterizes local width variability. Among the investigated cracks, C13 exhibits the largest widths, ranging from 9.4 to 13.5 cm, whereas C16 has smaller widths, ranging from 5.7 to 8.7 cm. The estimated widths also closely follow the peaks and troughs observed in the field measurements, indicating that the proposed method can capture the spatial variability of crack width under real surface conditions.
The relative errors of the estimated crack widths ranged from 1.11% to 6.86% across all measurement points. The minimum relative error of 1.11% was observed at P2 of crack C15, whereas the maximum relative error of 6.86% occurred at P3 of crack C13. Although local variations were present among measurement points, the errors remained within a limited range, indicating that the skeleton-guided width estimation method provides consistent and reliable measurements under different crack conditions. For further comparison, the width-validation results of the four representative cracks are summarized in
Table 6.
As summarized in
Table 6, crack C15 achieved the lowest mean relative error of 2.91%, whereas the mean relative errors for cracks C13, C14, and C16 were 5.00%, 4.83%, and 5.13%, respectively. Across all 24 measurement points, the overall mean relative error was 4.47%, with a maximum relative error of 6.86%.
5. Discussion
The results demonstrate that integrating UAV-derived crack semantics with TLS-derived geometric information provides an effective pathway for three-dimensional characterization of mining-induced surface cracks. Unlike road or structural cracks, mining-induced cracks develop under the combined influence of overburden movement, ground subsidence, terrain undulation, and loose surface materials. These processes often produce curved traces, non-uniform openings, fragmented boundaries, and locally branching structures. Under such conditions, crack objects extracted only from UAV orthomosaics are inevitably constrained by planar projection, which limits their ability to represent true propagation paths and local topographic effects [
29].
The improvement in length estimation confirms the necessity of incorporating elevation information into crack geometry analysis. The comparison with the 2D-only image-based baseline further supports this point. The 2D-only method produced a mean relative error of 4.49%, whereas the proposed UAV-TLS fusion method reduced the error to 2.64%. This improvement indicates that TLS-derived elevation information can reduce planar-projection-related underestimation and provide a more realistic representation of crack propagation under actual terrain conditions. Therefore, mining-induced surface cracks should not be treated simply as planar image features, particularly in areas affected by subsidence basins, micro-topographic deformation, and local ground collapse [
30].
The construction of semantic crack point clouds is a key step in this transformation. Compared with TLS-only crack extraction, the proposed UAV-TLS fusion framework has clear advantages in mining-affected surface environments. Direct extraction of fine mining-induced cracks from TLS point clouds alone is difficult because narrow crack boundaries can be affected by point-density variations, rough ground surfaces, vegetation, occlusion, and scanning noise [
31,
32,
33]. In contrast, UAV orthomosaics provide clearer texture and boundary information for crack semantic extraction, while TLS point clouds provide reliable elevation and surface morphology information for 3D characterization. Therefore, the proposed framework avoids relying solely on geometric discontinuities in point clouds and instead transfers image-derived crack semantics into 3D space through spatial matching. Compared with direct boundary-to-point-cloud matching, the centerline-guided KDTree matching strategy adopted in this study provides a more stable spatial link between 2D crack semantics and TLS geometry, because skeletonized centerlines are less sensitive to fragmented boundaries and local segmentation noise than crack edges.
The width validation results further indicate that the skeleton-guided measurement strategy can capture local variations in crack opening. The overall mean relative error of 4.47% suggests that the method provides stable width estimates across cracks with different size ranges. Remaining errors are mainly related to local boundary fragmentation, shadow interference in UAV orthomosaics, small registration uncertainties between image and point-cloud data, and unavoidable differences between field-measured positions and automatically extracted cross-sections. These factors are particularly important for narrow or discontinuous cracks, where slight boundary deviations can lead to relatively large proportional errors.
From an application perspective, the proposed framework extends mining-induced crack analysis from image-based detection to spatially measurable 3D characterization. Crack length, width, spatial distribution, and elevation variation provide complementary information for evaluating the intensity and pattern of mining-induced ground damage. Therefore, the framework can support mining-area surface damage monitoring, crack development assessment, ecological restoration surveys, and surface stability evaluation. Compared with manual field surveys, the workflow offers a more repeatable and spatially continuous approach for monitoring crack development over mining-affected areas by linking crack morphology with local terrain deformation.
Several limitations should be acknowledged. First, the experiments were conducted in a single mining area using single-period UAV and TLS datasets, and the generalizability of the framework to different geomorphic settings, vegetation covers, mining stages, and point-cloud densities requires further validation. In addition, because the training, validation, and testing subsets were randomly divided at the patch level after sliding-window cropping, partial spatial information leakage may occur when adjacent overlapping patches are assigned to different subsets. Therefore, the segmentation metrics may be optimistic compared with evaluations based on spatially independent orthomosaics or acquisition areas. Second, dense crack networks and highly fragmented boundaries may still affect skeleton extraction, centerline vectorization, and local width measurement. In addition, although the MST provides an efficient way to connect unordered skeleton points, it minimizes the total edge length only and does not explicitly model curvature continuity or local orientation consistency. As a result, shortcut connections may occur in noisy skeletons, dense crack networks, or areas where adjacent crack branches are spatially close. Future work should explore graph-based reconstruction methods that incorporate orientation, curvature, and topological constraints to better preserve the physical crack trajectory. Moreover, in areas with dense vegetation cover, severe crack occlusion, complex terrain, or low point-cloud density, the accuracy of crack segmentation, point-cloud matching, and local width estimation may decrease. Third, the accuracy of 3D characterization depends on the spatial consistency between UAV orthomosaics and TLS point clouds. In this study, the horizontal RMSE of the UAV-TLS co-registration was 0.03 m, indicating good spatial consistency between the two datasets. Nevertheless, residual spatial misalignment may still affect local crack-edge pairing and width estimation, especially for very narrow cracks or areas with complex micro-topography. In addition, the KDTree search radius may influence semantic crack point-cloud construction. Although r = 0.15 m was adopted in this study by considering the UAV-TLS co-registration accuracy, UAV image resolution, TLS point density, and crack scale, this parameter should be adjusted according to image resolution, point-cloud density, co-registration accuracy, terrain complexity, and crack morphology when applying the proposed framework to other study areas. In addition, this study mainly validated crack length and width, while crack depth or vertical displacement was not independently measured in the field. Therefore, although TLS point clouds provide elevation information and can describe local height variations around cracks, the accuracy of crack-depth estimation was not quantitatively evaluated in this study. Future work should include field-measured depth or cross-sectional profiles to validate additional 3D geometric parameters. Moreover, improved segmentation performance does not automatically guarantee proportional improvement in final geometric measurements, because 3D length and width estimation are also affected by skeleton extraction, boundary quality, UAV-TLS co-registration accuracy, KDTree matching parameters, point-cloud density, and local terrain complexity. Therefore, the relationship between segmentation accuracy and downstream geometric accuracy should be further investigated through uncertainty propagation analysis or controlled comparative experiments. Future work should incorporate multi-temporal datasets from multiple mining sites to investigate crack initiation, propagation, closure, and migration. Furthermore, introducing topological constraints, temporal association strategies, and more robust point-cloud matching methods may further improve the stability and applicability of 3D crack reconstruction.
6. Conclusions
This study proposed a UAV–TLS fusion framework for 3D characterization of mining-induced surface cracks. Unlike conventional studies that mainly focus on 2D crack detection and planar parameter statistics, the proposed framework integrates crack semantic information from UAV orthomosaics with geometric information from TLS point clouds. Through crack segmentation, skeleton extraction, vectorization, and KDTree-based spatial matching, 2D crack objects were mapped into 3D point cloud space to construct semantic crack point clouds. This enables the transformation of mining-induced surface cracks from 2D image objects to 3D spatial objects.
The experimental results demonstrate that DRA-UNet provides reliable crack semantic extraction under complex mining-area conditions, achieving precision, recall, F1-score, and MIoU values of 85.13%, 77.84%, 81.32%, and 70.26%, respectively. Based on the constructed semantic crack point clouds, the proposed framework enables automatic estimation of 3D crack geometric parameters, including crack length and width. Compared with conventional 2D length measurements, which produced a mean relative error of 4.49%, the proposed 3D length estimation reduced the mean relative error to 2.64% by incorporating TLS-derived elevation information. Width validation at 24 field measurement points yielded a mean relative error of 4.47% and a maximum relative error of 6.86%, confirming the reliability of the skeleton-guided width estimation method.
These results indicate that UAV–TLS fusion can effectively overcome the limitations of image-only crack analysis, particularly the lack of elevation information in UAV orthomosaics. By linking crack morphology with terrain geometry, the proposed framework provides a more realistic representation of crack propagation under real topographic conditions and improves the accuracy of geometric parameter estimation. The method offers a practical remote sensing data fusion approach for ground damage monitoring, crack development analysis, ecological restoration assessment, and surface stability evaluation in mining areas.
Future work will focus on multi-temporal UAV and TLS data acquisition to monitor crack initiation, propagation, closure, and migration processes. Additional validation across different mining sites, geomorphic settings, vegetation conditions, and mining stages will further improve the robustness and generalizability of the proposed 3D crack characterization framework.





 ,
,