


Highlights
What are the main findings?
- A global satellite-based assessment combining the ESA-LIVAS four-dimensional multiyear atmospheric dust climate data record, GHSL world population estimates, ECMWF-ERA5 PBL information, and epidemiologically established relationships on human exposure–response to PM concentrations. Near-surface total and submicrometer-mode atmospheric dust concentrations and their spatial variability are quantified. The study assesses atmospheric dust as an air quality hazard to the world population.
- While ~91% of the global population experiences total dust concentrations below the WHO annual-mean PM10 guideline, about 33.5% (~2.5 billion people) are exposed to submicrometer-mode dust concentrations exceeding the WHO PM2.5 annual-mean guideline. The findings highlight the considerable population health-pressure associated with fine-mode mineral dust particles suspended in the atmosphere.
What are the implications of the main findings?
- Fine-mode mineral dust represents a significant global air-quality hazard, especially in the case of regions influenced by major desert sources and/or densely populated areas.
- Satellite-based aerosol observations provide essential information for assessing population exposure to dust aerosols and supporting air-quality management and environmental policies, particularly in regions lacking dense ground-based monitoring networks.
Abstract
Atmospheric dust is an important contributor to atmospheric particulate matter (PM) and a significant factor to air quality degradation worldwide. In this study, we assess atmospheric dust as an air quality hazard to the world population. Near-surface dust concentrations are quantified through the synergy of the “LIdar climatology of Vertical Aerosol Structure” (LIVAS) atmospheric dust data record, established based on Cloud-Aerosol Lidar with Orthogonal Polarization (CALIOP) aerosol profiles, and European Centre for Medium-Range Weather Forecasts (ECMWF) ERA5 information on planetary boundary layer (PBL). The health risk to the global population is estimated using empirically derived epidemiological exposure–response relationships that approximate the association between PM concentrations and adverse health outcomes. Our findings reveal elevated health risks in regions affected by major desert sources or over densely populated and highly industrialized regions. Approximately nine-out-of-ten (~91% or ~6.8 billion people) of the global population experience total dust concentrations below the World Health Organization (WHO) annual-mean PM10 guideline. However, a substantially larger proportion of approximately one-out-of-three (~33.5% or ~2.5 billion people) is exposed to submicrometer-mode dust concentrations exceeding the respective PM2.5 recommended threshold. The study highlights atmospheric dust as an important air quality hazard and demonstrates the value of satellite observations for assessing trustworthy health risks and supporting environmental policies.
1. Introduction
Air pollution remains one of the most widespread and persistent environmental threats to human health worldwide. Despite decades of progress in air quality regulation, recent global assessments by the World Health Organization (WHO) and the United Nations (UN) indicate that air pollution causes between seven and eight million premature deaths annually, with children and elderly being particularly vulnerable, representing one of the leading environmental risk factors for mortality and morbidity [1,2,3]. Beyond its direct health impacts, air pollution imposes substantial socioeconomic and developmental costs. The United Nations Economic Commission for Europe (UNECE) has shown that in the case of developed countries of the European and North America regions, the total damage cost from ambient air pollution through impacts on health, ecosystems, and productivity exceeds 5% of the gross domestic product (GDP), with some national estimates surpassing 10%, while in the case of low- and middle-income countries (LMICs) losses are even more pronounced [4].
The scale of potential health and socioeconomic losses underscore the urgency of implementing cost-effective air-quality control measures. Analyses conducted under the United Nations Framework Convention on Climate Change (UNFCCC), WHO, and allied institutions such as the International Institute for Applied Systems Analysis and the United Nations Environment Programme (IIASA), demonstrate that the costs of implementing air-quality regulation measures are generally an order of magnitude lower than the monetized damages associated with inaction [4,5]. In addition, regulations of air quality yield strong co-benefits for climate adaptation and mitigation [1], while simultaneously advancing global priorities such as the UN’s Sustainable Development Goals on Good Health and Well-being (SDG 3), by reducing disease burden and improving public health, and Climate Action (SDG 13), through the implementation of effective mitigation and adaptation measures (https://sdgs.un.org/2030agenda; last visit: 1 June 2026).
Towards tackling the environmental-induced health and socioeconomic impacts, and in light of the overwhelming and increasing body of evidence demonstrating the health disorders related to degradation of air quality, recently, WHO’s Air Quality Guidelines (AQGs) significantly tightened recommended exposure limits [6]. More specifically, the updated recommended AQGs thresholds aim for annual-mean particulate matter (PM) concentrations for PM2.5 and PM10 not exceeding 5 μg m−3 and 15 μg m−3, respectively (Table 1).
Table 1.
World Health Organization Air Quality Guidelines for PM2.5 and PM10.
As such, in recent years, in recognition of the increasing scientific evidence on the negative air pollution effects on human health and in light of the related adverse socioeconomic outcomes, and aligning with the recommendations of the WHO, several countries have revisited and updated existing air-quality legislations. The overarching objective is to progressively improve air quality to levels no longer considered harmful to human health, ecosystems, or biodiversity. For instance, building upon the WHO AQGs [6] and aligning with the European Green Deal, the European Union (EU) has established a comprehensive legal framework under the directive on ambient air quality (EU AAQD 2024/2881) [7] with the aim to achieve a zero-pollution objective, to progressively improve air quality across Member States (MSs).
In the framework of ambient air quality regulation, special emphasis is given to pollutant emissions directly or indirectly attributed to anthropogenic activity including, among others, the general levels of particulate matter (PM10 and PM2.5), ozone (O3), sulphur dioxide (SO2), nitrogen dioxide (NO2) and oxides of nitrogen (NOx), benzene (C6H6), carbon monoxide (CO), arsenic (As), cadmium (Cd), lead (Pb), and nickel (Ni). However, the updated adopted binding provisions target not only anthropogenic emissions, but also introduce mechanisms to account for the contribution from natural sources (i.e., sand and dust storm events, wild-land fires, volcanic emissions, sea salt particles). The underlying rationale of the anthropogenic–natural attribution distinction is that, while contributions from natural sources can be quantified and assessed, they are extremely challenging to be regulated or controlled. In this context, for instance, the EU ambient air quality regulation approach proposes where natural contributions to pollutants in ambient air are determined with sufficient certainty, and where exceedances are due in whole or in part attributed to these components and sources, natural aerosol contributions to the total aerosol load to be subtracted upon assessment of air quality regulation compliances in terms of limit values and average exposure reduction obligations.
Among the natural aerosol species resulting in degradation of air quality, atmospheric dust is considered one of the most significant components. Constituting the primary component of aerosol over extensive regions of the Earth [8,9], dust particles upon emission into the atmosphere can be transported over distances of hundreds or even thousands of kilometers prior to their removal through wet deposition or gravitational settling [10,11,12,13,14,15,16].
To date, an increasing number of epidemiological studies consistently report on a strong apparent association between high concentrations of airborne dust and various induced disorders on human health. It should be emphasized, however, that the impact of atmospheric dust on degradation of air quality and on human health is largely driven by the particle size distribution (PSD), for aeolian dust particles’ size is documented to span more than three orders of magnitude, between as low as 0.1 µm to more than 100 µm in diameter [17,18].
Overall, the health risk associated with larger mineral dust particles is predominantly associated with mild skin irritation or allergic reactions, even under prolonged exposure to high dust mass concentrations [19,20]. However, fine mineral particles, due to their small size, can penetrate deeper into the lungs and alveoli [21,22], leading to a spectrum of negative health disorders. These include allergic responses [23,24,25], cardiovascular diseases and respiratory outcomes [26,27,28,29,30,31]. In addition, exposure to dust has been linked to lung cancer [32,33], and even with epidemic outbreaks such as meningitis in the Sahel region during the Harmattan season [34,35,36,37].
Nowadays, the most direct and reliable quantifications of near-surface atmospheric dust load are provided by in situ measurements. Such measurements enable the assessment of PM2.5 and PM10 concentrations with high temporal resolution, low detection capabilities, and exceptional data quality [38]. However, even when the monitoring stations are established under exceptionally high-quality monitoring networks, such as in the case of Aerosol, Clouds, and Trace Gases (ACTRIS; https://www.actris.eu/; last access: 1 June 2026) or the Surface Particulate Matter Network (SPARTAN; https://www.spartan-network.org/; last access: 1 June 2026), in situ air quality measurements frequently lack extensive spatial coverage and density due to operational challenges, maintenance requirements, or resource limitations. Moreover, even though these measurements are widely regarded as reference-quality observations, they are not always homogeneous, as different protocols, calibration standards and procedures, and instrumentation types are employed across different networks and/or regions.
To account for these challenges in dust-related Air Quality (AQ) assessment, and more specifically in order to quantify the near-surface atmospheric dust load at larger spatial and temporal scales, the present study leverages satellite observations. More precisely, in terms of Earth Observations (EOs) the study extensively utilizes aerosol profiles provided by Cloud-Aerosol Lidar with Orthogonal Polarization (CALIOP) [39], along the Cloud-Aerosol Lidar and Infrared Pathfinder Satellite Observations (CALIPSO) [40] satellite orbit path. The rationale for considering CALIOP-based observations and products as the most suitable satellite-based geoinformation source is threefold. First, CALIOP’s configuration allows for depolarization measurements. Mineral dust particles, being of irregular shape, depolarize the polarization state of emitted lidar pulses, producing a distinct signature [41,42,43] that makes CALIOP particularly suitable for isolating and quantifying atmospheric dust from the total aerosol load. Second, as an active EO system, CALIOP provided aerosol profiles rather than just columnar measurements, as passive sensors do. This enables isolation and assessment of the near-surface dust load, where most human activity occurs and where the dust load impacts human health. Third, as the only satellite-based lidar system with a lifespan of more than a decade and a half, CALIOP provides the necessary dataset duration to support multiyear observation-based conclusions on the global dust load. The necessary EO-based geoinformation necessary for the present study is established under the European Space Agency (ESA) “LIdar climatology of Vertical Aerosol Structure” (LIVAS) CALIOP-based four-dimensional (4D), multiyear, and near-global climate data record (CDR) of the total, fine-mode (submicrometer in terms of diameter), and coarse-mode (supermicrometer in terms of diameter) dust components [13,14,15,44,45,46].
To assess the natural dust aerosol load as a health hazard, and in addition in light of the air quality regulation compliances, the present work addresses the following two central questions:
What is the load of total dust and fine-mode dust close to the Earth’s surface—where most anthropogenic activity occurs—and how does the dust mass concentrations vary across spatial scales from 1° × 1° grids to national and continental domains?
and
How do quantified near-surface dust mass concentrations translate into relative risks for human health disorders when applying empirically derived PM exposure response functions from epidemiological studies?
The structure of the present work is as follows. Section 2 provides a detailed description of the datasets employed (Section 2.1), including the climate data record of total, fine-mode (submicrometer in terms of diameter), and coarse-mode (supermicrometer in terms of diameter) atmospheric dust (Section 2.1.1), the global population dataset (Section 2.1.2), and planetary boundary layer (PBL) information (Section 2.1.3). The methodology for translating dust PM concentrations into relative risk estimates for dust-induced human health disorders is presented in Section 2.2. Section 3 provides the results of the analysis in terms of assessment of the atmospheric dust load as environmental risk factor for human health disorders, at (a) 1° × 1° grid spatial resolution (Section 3.1), and (b) national and continental level (Section 3.2). Through the combination of the study outcomes at different levels (Section 3), Section 4 discusses the atmospheric dust as a health hazard under a broader perspective. Finally, Section 5 summarizes the study and outlines the main findings and conclusions.
2. Materials and Methods
2.1. Data
2.1.1. Atmospheric Dust
The study is based on the ESA atmospheric, four-dimensional (4D), multiyear, and near-global LIVAS total dust CDR [47] and the fine-mode (submicrometer in terms of diameter) atmospheric dust CDR component [15]. Three are the key enablers allowing the establishment of the EO-based products. First, on lidar- and laboratory-based studies and experiments reporting on the distinct light-depolarizing optical properties of non-spherical particles, such as in the case of atmospheric dust [41,42,43]. Second, on sophisticated approaches, such as the one-step and two-step POlarization LIdar PHOtometer Networking (POLIPHON) techniques [47,48,49,50], developed in the framework of the European Aerosol Research Lidar Network (EARLINET; http://www.earlinet.org/; last access: 1 June 2026) activities [51]. The family of the POLIPHON techniques, established on the basis of extensive implementation of the empirically acquired and parametrized knowledge on atmospheric dust optical properties, allow decoupling the dust load from detected aerosol layers [47,48,52], providing at the same time insight on the submicrometer and supermicrometer (in terms of diameter) components of dust [49,50]. Third, on multiyear and near-global CALIPSO [40] CALIOP [39] level 2 (L2) version 4.51 (V4.51) aerosol and cloud profiles, along the satellite orbit path. The atmospheric dust products of the CDR [13,14,15,44,45,46] extensively expands the EO capacity on the atmospheric dust aerosol component, through the implementation of the one- and two-step POLIPHON techniques to CALIPSO-CALIOP optical products, from local to global scale in terms of spatial coverage, and for more than sixteen years of satellite-based observations (June 2006–May 2023).
The ESA-LIVAS dust CDR is composed of two pillars [15]. The first, “per-orbit” pillar, consists of the total, fine-mode (submicrometer in terms of diameter), and coarse-mode (supermicrometer in terms of diameter) components of dust provided in cloud-free quality-assured [13,53] profiles of backscatter coefficient at 532 nm, extinction coefficient at 532 nm, and mass concentration (in μg m−3), with the original L2 5 km horizontal resolution and 60 m vertical resolution of CALIOP, along the CALIPSO orbit-track [54]. The second, “per-grid” pilar, consists of the total, fine-mode, and coarse-mode components of dust provided in cloud-free quality-assured [13,53] profiles of backscatter coefficient at 532 nm, extinction coefficient at 532 nm, and mass concentration (in μg m−3), aggregated in monthly mean, seasonal-mean, and/or annual-mean temporal resolution, in 1° × 1° grid spatial resolution, and 60 m vertical resolution. The analysis of airborne dust as health hazard in the present study is restricted to the latitude band 60°S–60°N. The domain encompasses the major global dust source regions, principal transport pathways, and the vast majority of dust-related population exposure. While High-Latitude Dust (HLD) exerts regional impacts, its contribution to the global atmospheric dust burden and associated population exposure is considerably smaller than that of the major subtropical and mid-latitude desert regions.
Towards the aggregated monthly mean, seasonal-mean, and annual-mean products, all CALIPSO overpasses and L2 QA aerosol profiles within a specific area, for instance of 1° × 1° grid spatial resolution, are averaged to produce the mean aerosol profiles representative for each period, respectively. Moreover, the “per-grid” component of the ESA-LIVAS dust CDR, following vertical integration of the total, coarse-mode, and fine-mode dust extinction coefficient at 532 nm profiles, between the mean surface elevation and the top of atmosphere (TOA), provides information on the dust optical depth (DOD), coarse-mode DOD (DODcoarse-mode), and fine-mode DOD (DODfine-mode) at 532 nm. Synergy between the PBL height and the total, fine-mode, and coarse-mode dust CDRs, allows computation of the PBL-mean dust mass concentration (MC), coarse-mode dust mass concentration (MCcoarse-mode), and fine-mode dust mass concentration (MCfine-mode) at 532 nm. Both the “per-orbit” and “per-grid” pillars of the ESA-LIVAS total, fine-mode, and coarse-mode dust CDR span over the lifetime of the CALIPSO mission (June 2006–May 2023). Figure 1 provides the ESA-LIVAS aerosol optical depth (AOD; Figure 1a), DOD (Figure 1b), DODcoarse-mode (Figure 1c), and DODfine-mode (Figure 1d) at 532 nm gridded at 1° × 1° spatial resolution on the basis of CALIPSO-CALIOP aerosol observations conducted between June 2006 and May 2023.
Figure 1.
ESA-LIVAS AOD (a), DOD (b), coarse-mode DOD (c), and fine-mode DOD (d) at 532 nm at 1° × 1° grid spatial resolution, established on the basis of CALIPSO-CALIOP aerosol profiles between June 2006 and May 2023.
To date, the LIVAS dust CDR, as well as the underlying algorithms, parametrizations, assumptions, and retrieval approaches have undergone extensive validation and evaluation. These assessments have been performed using reference measurements provided by in situ [42,43], ground-based photometers and lidar systems [14,15,44,47,52,55,56,57], airborne in situ [15,20,58,59], and satellite-based systems [13,44]. Proestakis et al. (2024) [15] performed extensive evaluation of the satellite-based total, fine-mode, and coarse-mode dust products in terms of optical depth against AErosol RObotic NETwork (AERONET; https://aeronet.gsfc.nasa.gov/; last access: 1 June 2026) [60] Spectral Deconvolution Algorithm (SDA) [61,62,63] aerosol optical thickness (AOT) fine-mode and coarse-mode reference retrievals. The analysis demonstrated a good agreement of DODfine-mode with AOTfine-mode (R2 = 0.69, RMSE = 0.06, Absolute bias = −0.012) and of DODcoarse-mode with AOTcoarse-mode (R2 = 0.92, RMSE = 0.08, Absolute bias = −0.012). In addition, central validation activity of the satellite-based total, fine-mode, and coarse-mode dust products in terms of mass concentration included intercomparison against airborne high-quality in situ measurement of dust mass concentration carried out by the Facility for Airborne Atmospheric Measurements (FAAM) BAe-146 research aircraft during the “Ice in Clouds Experiment–Dust” (ICE–D)/“AERosol properties–Dust” (AER–D) extensive experimental campaigns over the tropical Atlantic Ocean in the presence of dust [18]. The coarse-mode concentrations (EO-based: 163.3 ± 31.8 µg m−3; in situ: 149.4 ± 55.2 µg m−3, averaged over 1.5–5 km a.m.s.l.) agreed within 10%, closely matching the total in situ mass, while fine-mode concentrations are underestimated in the Saharan Air Layer (SAL) (EO-based: 2.3 ± 0.4 µg m−3; in situ: 5.4 ± 2.1 µg m−3). Overall, the comparison showed good agreements between the EO-based and the airborne in situ measurements, demonstrating that the satellite retrievals reliably capture the spatial and vertical distribution of dust mass [15].
However, it should be noted that the satellite-derived dust PM mass concentrations (µg m−3) are not directly comparable to the WHO AQGs (Table 1) [6]. This discrepancy arises for three main reasons. First, the dust-depolarization laboratory experiments [42,43], which underpin the parameterizations used to separate fine-mode and coarse-mode dust via the two-step POLIPHON technique [49,50], define these modes based on particle diameter as submicrometer and supermicrometer. Consequently, the EO-based fine-mode dust CDR represents particles with diameters up to 1 μm, while the coarse-mode CDR includes particles larger than 1 μm. In contrast, the WHO AQGs [6] use a threshold of 2.5 μm, meaning that the EO-based fine-mode dust constitutes only a subset of WHO PM2.5. Second, the WHO PM10 metric includes particles with diameters up to 10 μm, whereas observational studies indicate that dust particles can reach sizes of several hundreds of micrometers [18]. Finally, satellite-derived dust PM mass concentrations refer to ambient atmospheric conditions, including humidity effects, while WHO guidelines are defined under dry conditions. For these reasons, WHO AQG thresholds are not applied here as strict limits, but rather as indicative benchmarks to contextualize whether the EO-based dust mass concentrations are relatively low or high.
Overall, the continuous multi-faceted rigorous quality assurance assessments and the documented uncertainties report on the high quality and reliability of the LIVAS dust CDR, enhancing the confidence to the provided long-term, homogeneous dust datasets and information across large regions where monitoring networks may be incomplete or even completely absent. This, in turn, facilitates addressing a number of scientific questions of the earth system and tracking the global dust load over time, thus supporting evidence-based insights on dust’s role as an environmental-induced pressure to air-quality deterioration and consequently to human health.
2.1.2. World Population
The study utilizes gridded population estimates from the Global Human Settlement Layer (GHSL) [64]. The GHSL population raster provides gridded population estimates at fine spatial resolution of 100 m and 1 km. The estimates are based on raw global census data harmonized by the Center for International Earth Science Information Network (CIESIN) at the Columbia University for the Gridded Population of the World, version 4.11 (GPWv4.11). The data have been disaggregated to regular grid cells based on the distribution of built-up area mapped by the other information layers of GHSL incorporating high-resolution satellite dataset. The data have been harmonized with the UN World Population Prospects 2022 [65] and the UN World Urbanization Prospects 2018 [66] datasets. GHSL used Eurostat series at level 2 Local Administrative Units (LAU2) to control and correct the population estimates at LAU2 level in the EU. For this study, the 1 km gridded data have been summed to a 1-degree resolution matching the LIVAS “per-grid” spatial resolution grid of 1° × 1°. Data from 3 epochs (2010, 2015, 2020) have been averaged to create an estimate for the average population in each grid during CALIPSO’s lifetime (Figure 2).
Figure 2.
GHSL world population (number of individuals: “#”) data record, processed to 1° × 1° spatial resolution, 2010, 2015 and 2020 epochs—mean.
2.1.3. ERA5 PBL
Satellite-based lidar EOs have the capacity to provide accurate vertical aerosol profiles. However, near-surface retrievals are characterized by significant uncertainties [67]. These arise from several factors such as the “negative signal anomaly” (NSA) [53], algorithmic detection and classification limitations in close-to-the-surface [68] or tenuous [69] layers, strong surface returns over areas of high variability in the surface elevation or over high-albedo surfaces [70] and reduced signal-to-noise ratios (SNRs) especially under daytime solar illumination conditions [71]. These sources of uncertainties often produce unrealistic negative or high positive near-surface backscatter signals and biased Level 3 (L3) products, hampering the capacity of satellite-based lidar EOs to provide insight on close-to-the-surface (<90 m) aerosol conditions.
To mitigate this, the mean total dust and fine-mode dust mass concentration values of the vertical range extending between the minimum surface elevation and the PBL height are utilized, and considered representative for near-surface dust PM and PMfine-mode atmospheric conditions. The underlying assumption lies in dynamical and thermodynamical processes of high significance occurring within this layer, including among others, the exchange of momentum, energy and mass through surface heating, and evaporation [72]. These processes have critical impact on the PBL depth [73] and chemical composition [74]. More specifically, inside the PBL, turbulent eddies promote strong mixing, leading to an approximately homogeneous distribution of thermodynamic properties. This enhanced turbulence also strengthens vertical mixing of aerosols [75,76], resulting in relatively uniform aerosol concentration throughout the layer [77,78]. Airborne in situ measurements by Pikridas et al. (2019) [79] demonstrated that once the daytime PBL is fully developed, aerosol concentrations are nearly constant from the surface to the PBL top. Moreover, it should be noted that the assumption of a well-mixed PBL is valid only during specific time periods. CALIPSO overpasses, as part of the afternoon-train constellation of polar orbit satellites are in general during stable atmospheric regimes or transitional phases of PBL development. More specifically, CALIOP measurements are acquired from the sun-synchronous CALIPSO platform, which crosses the Equator at approximately 13:30 local solar time on the daytime ascending orbit and 01:30 local solar time on the nighttime descending orbit. Consequently, the observations represent atmospheric conditions at two fixed local times per day. This sampling strategy is sufficient for deriving robust long-term climatological statistics; however, it does not resolve the full diurnal variability of the planetary boundary layer and dust vertical distribution. Moreover, it is emphasized that assuming a uniform vertical distribution of dust within the PBL introduces certain limitations, particularly regarding larger particles (>10 μm). Due to gravitational settling, larger dust particles exhibit vertical gradients with higher concentrations closer to the surface, especially under stable atmospheric conditions or low wind speeds. Consequently, using the PBL mean dust concentration may lead to a conservative underestimation of near-surface total dust exposure during periods of weak atmospheric mixing. However, during major dust emission and transport events—which drive the highest exposure risks—strong near-surface winds generate intense mechanical turbulence and vertical shearing. This turbulent kinetic energy effectively counteracts gravitational settling, leading to a well-mixed profile for both fine and coarse modes. Furthermore, CALIOP daytime profiles obtained at ~1:30 PM local time coincide with the diurnal peak of convective solar heating and thermal mixing, creating a highly convective, well-mixed daytime PBL that homogenizes aerosol concentrations vertically [73]. For the fine-particles, which represent the core global health hazard highlighted in this study, the uniform mixing assumption is highly robust due to the extended atmospheric residence time and negligible settling velocities of fine particles. Given the absence of a global, continuous ground-based vertical profiling network, this observational, PBL-averaged approach provides a transparent and reproducible baseline without introducing the compounding uncertainties of global chemical transport model simulations.
Information on PBL height is extracted from the fifth generation of atmospheric reanalyses produced by the European Centre for Medium-Range Weather Forecasts (ECMWF) ERA5 Reanalysis dataset [80]. The ERA5 data record provides model-based hourly estimates of various atmospheric, land, and oceanic climate variables at a global spatial coverage. In this study, ERA5 PBL height monthly averages of single level data are applied, accessible through ECMWF’s Climate Data Store (CDS; https://cds.climate.copernicus.eu/datasets/reanalysis-era5-single-levels-monthly-means?tab=overview; last access: 1 June 2026), spatially averaged from the native ERA5 global uniform grid of horizontal resolution 0.25° × 0.25° to the ESA-LIVAS dust CDR grid resolution of 1° × 1°, and from monthly to seasonal temporal resolution.
To derive the PBL-constrained dust mass concentrations, the seasonal mean LIVAS dust mass concentration layers located between the mean surface elevation and the corresponding ERA5 PBL height above mean surface elevation were considered. Seasonal ERA5 PBL heights were matched with the corresponding seasonal LIVAS dust mass concentration profiles prior to the long-term averaging procedure. Atmospheric layers located entirely above the PBL were excluded from the analysis. Layers intersecting the PBL entrainment zone (CALIOP L2 layers in the APro and CPro products are 60 m) and layers extending above the ECMWF ERA5 PBL height were not included in the PBL mean mass concentration computation.
2.2. Methodology—Atmospheric Dust and Health Risk Assessment
The health risk attributed to exposure to different levels of air pollution is assessed through the estimation of the Relative Risk (RR). The metric provides the occurrence probability of adverse human health impacts due to the exposure of a population to specific pollutant concentrations relative to a reference, unexposed population, where no health disorders are observed, in the form of empirical PSD-dependent mass concentration response functions.
The relative risk attributed to long-term exposure to PM10 for all-cause mortality can be estimated via an exponential function (Equation (1)) [81,82]:
In Equation (1) C denotes the annual mean mass concentration of PM10, 1.081 is the base Relative Risk obtained from recent epidemiological data on a global scale and x is the increment in exposure concentration which is equal to 10 μg m−3 [82].
Similarly, the relative risk attributed to long-term exposure to PM2.5 for all-cause mortality is estimated via (Equation (2)) [81,82]:
In Equation (2) C denotes the annual mean mass concentration of PM2.5, 1.095 is the base Relative Risk obtained from recent epidemiological data and x is the increment in exposure concentration which is again equal to 10 μg m−3 [82].
Moreover, the determination of RR facilitates the estimation of the Attributable Fraction (AF), a metric that provides the % incidences (deaths) attributed to exposure to the ambient concentrations based on the estimated RRs [82,83].
The epidemiological concentration–response functions employed in Equations (1)–(3) were originally developed for PM10 and PM2.5 exposure. The ESA LIVAS products provide dust mass concentrations for the total dust and fine-mode dust fractions, which do not exactly coincide with the PM10 and PM2.5 size definitions used in the underlying epidemiological studies. In the absence of globally consistent satellite-derived PM10 and PM2.5 dust products, the LIVAS total dust and fine-mode dust concentrations were used as proxies for PM10 and PM2.5 dust, respectively. Consequently, the resulting health-risk estimates should be interpreted as first-order approximations of dust-related health impacts and are subject to uncertainties associated with the differences between the LIVAS size classes and the epidemiological exposure metrics. Besides toxic heavy metals, typical crustal elements also contribute to particle driven health impacts [84], whilst exposure to mineral dust is associated with several health effects [85]. Given the variations in the chemical content and the relative contribution of either natural or anthropogenic sources, toxicity and the related health effects are not a single concentration parameterization although epidemiological results provide powerful insights on human health effects through concentration-response functions.
Figure 3 provides the expected estimations of the relative risk (left axis-blue) and attributable fraction (right axis-red) for total dust (Figure 3a) and fine-mode dust (Figure 3b) for mass concentration values extending up to 100 μg m−3. Shaded areas denote the WHO-classified annual-mean and 24 h AQGs (Table 1). It should be emphasized, that the scope of the study is to shed light on the impact of dust PM to human health and not to provide the risks for further health assessment. Given the above uncertainties, the estimates presented are precise of the concentrations incorporated but subject to a bias relating with the inherently lower mass concentration of LIVAS fine dust particles compared to PM2.5.
Figure 3.
Relative risk (left axis-blue) and attributable fraction (right axis-red) for the total dust (a) and fine-mode dust (b) for mass concentration values extending up to 100 μg m−3. Shaded areas denote the WHO-classified annual mean and 24 h AQGs (Table 1).
3. Results
3.1. Atmospheric Dust as Environmental Risk Factor for Human Health Disorders—Grid Level
The present section provides a grid-level assessment of atmospheric dust as environmental risk factor for human health disorders, using a uniform 1° × 1° spatial resolution. This grid-based approach is selected to assess the impact of an aerosol component both natural and anthropogenic on air-quality degradation by focusing on the spatial variability of dust in the atmosphere. The analysis seeks to reveal and quantify the dust-related health relative risk arising from the combined effects of transboundary dust transport and local dust anthropogenic emissions—effects that would be masked in broader-scale assessments. Grid-based analysis also avoids biases introduced by varying national boundaries or differing administrative unit sizes. More specifically, national-level averages can obscure critical spatial heterogeneity: in large countries, mean dust concentrations may appear low, while smaller regions, areas near deserts, and urban centers or megacities may experience elevated dust levels due to both natural and anthropogenic sources. A consistent grid approach allows identification of transboundary dust transport, areas characterized by elevated EO-derived dust concentrations relative to WHO AQG benchmark values, and population exposure hotspots, providing a more accurate assessment of environmental risk across regions. By linking these exposures to the resident population in each grid, eventually, the analysis aims to report on the number of individuals exposed to dust concentrations above WHO AQG reference values (Table 1), having as a cornerstone the EO-based near-surface dust mass concentration. As such, Figure 4 provides the ESA-LIVAS long-term (June 2006–May 2023), near-global (60°S to 60°N), and grided (1° × 1° grid spatial resolution) PBL-mean mass concentration of the atmospheric dust load, for the cases of total dust (MC; Figure 4a) fine-mode dust (MCfine-mode; Figure 4b), and thus the levels of dust mass concentration close to the Earth’s surface responsible for dust-induced negative impacts on human health.
Figure 4.
ESA-LIVAS PBL-mean dust mass concentrations for the total dust aerosol component (MC; (a)) and the fine-mode (MCfine-mode; (b)) component of dust, established on the basis of CALIOP long-term observations (June 2006–May 2023), for the geographical region extending between 60°S and 60°N, and grided to 1° × 1° grid spatial resolution.
Mineral dust emissions from the Sahara Desert dominate the global atmospheric dust budget [9] and strongly influence air quality across multiple continents through well-reported long-range transport pathways [10,86,87,88]. Intense dust emissions into the atmosphere occur under strong surface winds associated with the Saharan heat low (SHL) [89] and mobilization mechanisms such as pressure gradients [90,91], dust devils [92], haboobs [93,94], and low-level jets (LLJ) [95]. Once released into the Free Troposphere (FT), the dust layers frequently are subject to long-range transport, over distances of hundred or even thousands of kilometers towards Europe [13] and America [88]. Transported northwards, Saharan dust layers negatively impact the air quality of European countries, especially of those encompassing the Mediterranean Sea region from the North, such as Spain, Portugal, France, Italy, Greece, and the countries of the Balkan Peninsula. Over this area, Saharan Desert episodic outbreaks substantially increase total dust (Figure 4a) and fine-mode dust (Figure 4b) mass concentration levels above the WHO AQGs (WHO, 2021) regulatory thresholds [96], especially during intense episodes [97]. In addition to this Mediterranean pathway, Saharan dust is transported westward across the tropical Atlantic and within the Saharan Air Layer (SAL) [12], influencing atmospheric composition over the Caribbean, Central America, the Amazon Basin, and the southeastern United States [98]. These intercontinental transport pathways represent two of the most significant natural aerosol fluxes on Earth and exposes large populations across both sides of the Atlantic to elevated mineral aerosol concentrations, and as such to increased risk for dust-induced disorders on human health.
Dust emissions from the natural sources of Middle East and South Asia, including the Arabian Peninsula, Syrian and Iraqi deserts, the semi-arid regions of Ethiopia, Somalia, Iran, Iraq, Afghanistan, and the Thar Desert, constitute another major component of the global dust cycle [99,100], accounting for approximately 2100 Tg per year [9]. Frequent dust outbreaks occur in these regions, attributed mainly to the west Indian monsoon activity [101], convective episodes [102], strong pressure gradients [90,91], and dry soil conditions [99]. Transport from these sources regularly affects large numbers of individuals residing in several countries of the region including Saudi Arabia, Iraq, Kuwait, Iran, Pakistan, India, and Bangladesh. As such, these events constitute a particularly intense hazard for the large urban centers of Middle East and South Asia, such as Riyadh, Dubai, Kuwait City, Tehran, Karachi, and Delhi, which frequently experience elevated dust concentration levels (Figure 4), resulting in significant air-quality degradation [31,96].
In East Asia, the Taklimakan Desert encompassed by the Tarim Basin and the vast Gobi Desert spanning across northern China and Mongolia represent the primary regional dust sources [14]. The topography of the Tarim Basin favors the accumulation of mineral dust particles that are easily resuspended under strong winds [103]. At the same time strong cyclonic systems that are generated over the Mongolian Plateau [104] facilitate the uplift and eastward long-range transport of dust layers [105]. Dust storms generated in these regions frequently propagate across northern and eastern China, affecting densely populated areas and major population centers. The transported mineral dust layers significantly contribute to increased ambient particulate matter concentrations across North China [96], and in addition, due to long-range atmospheric transport of dust, impacts air quality also across North and South Korea and Japan [106]. Overall, across this area which is one of the most densely populated and industrialized regions of the world, the Taklimakan Desert and Gobi Desert negatively impact the aerosol load and frequently result in episodic significant air-quality degradation.
Additional, though comparatively weaker, regional arid and semi-arid dust sources are located in South America, South Africa, and Australia. In South America, the Patagonian Desert and the surrounding semi-arid regions (i.e., Rio Negro and Chubut provinces) generate dust plumes that degrade air quality and constitute an episodic dust-related health hazard for the citizens of Argentina, Chile, Uruguay, and southern Brazil [107,108]. In southern Africa, episodic emissions from the Etosha Pan, Makgadikgadi Pan, Kalahari Desert, and Namib Desert deserts have negative impact on the air quality and thus on the health of the populations of Namibia, Botswana, Angola, and South Africa [109,110,111]. Similarly, arid interior regions of Australia, particularly the Lake Eyre Basin, generate large dust storms that can be transported toward major population centers including Sydney, Melbourne, and Brisbane, occasionally producing severe regional air-quality events. Although the South America, South Africa, and Australia dust emission sources contribute less to the global dust budget compared with the Saharan and Asian deserts, they can exert substantial regional impacts on atmospheric composition, visibility, and population exposure especially during intense dust outbreaks, where dust events increase dust mass concentration levels (Figure 4) above the health safety thresholds of WHO AQGs [6].
However, it should be emphasized that the total atmospheric dust load corresponding to the total dust hazard for the world population and shown in Figure 4 is the cumulative result of natural dust and anthropogenic dust, a distinction grounded in dust sources and emission mechanisms [112,113]. Although difficult to quantify precisely, the current consensus suggests that natural dust accounts for approximately ~ 75% of the global atmospheric dust burden, while the remaining ~ 25% is attributed to anthropogenic activities [99,114]. Anthropogenic dust originates directly or indirectly from human activities, including transportation, infrastructure development, and building and road construction [115,116], as well as from soil surface degradation and land-use changes such as deforestation, overgrazing, urbanization, and agricultural practices [99,117]. Such activities disturb erodible soils or reduce vegetation cover, facilitating the entrainment of dust particles into the atmosphere, often confined within the PBL. Consequently, regions with intense anthropogenic activity frequently exhibit enhanced atmospheric dust loads relative to surrounding areas primarily influenced by long-range transport occurring in the free troposphere. In some densely populated and rapidly industrializing regions, particularly over the broader Indian subcontinent and across eastern China, anthropogenic dust may contribute up to ~ 70% of the total airborne dust load [118]. In addition, anthropogenic dust emissions associated with agricultural practices such as cultivation and overgrazing have been identified even in major desert regions, including the western Sahara [99]. Consequently, anthropogenic dust constitutes an additional and important source of uncertainty in the assessment of the global atmospheric dust budget [99], impacting negatively air quality.
Building on the spatial patterns described above, we quantify population exposure to the hazard posed by near-surface particulate loads of total and fine-mode dust globally by combining long-term mean near-surface dust concentrations with global population data from the Global Human Settlement Layer (GHSL) [64] (Section 2.1.2). Figure 5 presents the relationship between long-term mean near-surface dust concentrations and the global distribution of population.
Figure 5.
Relationship between long-term near-surface total dust ((left) column) and fine-mode ((right) column) mass concentrations (μg m−3) and global population (#), established on the basis of areas of 1° × 1° grid spatial resolution and for the geographical region extending between 60°S and 60°N. The relationship is provided in the form of 2-D density plots ((upper) row) and in terms of bubble charts ((lower) panel) towards quantification of population-exposure to atmospheric dust. Colors follow the convention: the light blue areas represent concentrations below WHO AQGs annual-mean recommended safety thresholds, the orange areas indicate concentrations in the range between WHO AQGs annual-mean and 24 h mean safety thresholds, the red areas mark high-risk levels that exceed WHO AQGs 24 h mean safety limits, distinct for the cases of PM10 and PM2.5.
The upper row of Figure 5 shows, through 2-D density plots, the joint distribution of PBL-mean dust mass concentration and population for total dust (Figure 5a) and fine-mode dust (Figure 5b). In both panels, the horizontal axis represents the dust mass concentration (µg m−3) on a logarithmic scale, while the vertical axis represents the number of inhabitants, also on a logarithmic scale, with the matching performed for grid cells of 1° × 1° spatial resolution. The color shading indicates the number of grid cells corresponding to each combination of dust concentration and population values, with warmer colors denoting a higher frequency of occurrence. In the upper-left panel (Figure 5a), which corresponds to total dust mass concentration, the highest density of grid cells is concentrated within dust concentrations of roughly a few to several tens of µg m−3 and population values between approximately 103 and 106 inhabitants per grid cell. The distribution gradually decreases toward higher dust concentrations and toward both very low and very high population counts. The upper-right panel (Figure 5b) shows the equivalent distribution for fine-mode dust mass concentration. Compared with total dust, the concentration range is shifted toward lower values, while the general structure of the population–dust relationship remains similar. Both upper-row panels graphs use three distinct colored shaded areas to indicate WHO AQGs safety limits for exposure. The light blue area represents concentrations below WHO AQG benchmark values used here for contextual interpretation of the EO-derived dust concentrations for PM10 (15 µg m−3) and PM2.5 (5 µg m−3), respectively, where health risks are minimal and exposure is generally acceptable for the population. The orange area indicates intermediate EO-derived dust concentration ranges relative to WHO AQG benchmark values for PM10 (15–45 µg m−3) and PM2.5 (5–15 µg m−3), respectively, of a moderate-risk where dust exposure may begin to pose health concerns, particularly for sensitive groups or individuals with pre-existing conditions. Finally, the red area marks elevated EO-derived dust concentration ranges exceeding WHO AQG benchmark levels used for contextual comparison for PM10 (45 µg m−3) and PM2.5 (15 µg m−3), respectively, indicating hazardous exposure where dust-related adverse health effects are more likely and potentially severe.
The lower row of Figure 5 summarizes through bubble charts the population exposure across different dust concentration ranges for the total dust (Figure 5c) and fine-mode dust (Figure 5d), respectively. In these panels, circles represent population in terms of percentage associated with different dust WHO AQGs PM safety regimes (Table 1), with circle size proportional to the number of inhabitants, shown as percentage of total world population. In addition, the colors of the circles that are used in the lower-row of Figure 5 follow the same definition of WHO AQGs safety regimes as in the upper-row of Figure 5. In the lower-left panel (Figure 5c), the largest circle corresponds to populations living in regions where total dust concentrations remain below the WHO AQG for PM10 accounting for ~91.7% of the global population, which corresponds to approximately 6780 million individuals. This indicates that the majority of the world’s population experiences long-term mean total dust levels within the recommended WHO AQGs. A circle of smaller size represents populations exposed to EO-derived total dust concentrations exceeding WHO PM10 benchmark values used as indicative reference thresholds of 15 μg m−3, comprising ~8.3% of the global population, or roughly 610 million people. Within this group, an even smaller inner circle indicates exposure to EO-derived dust concentrations above WHO 24 h PM10 benchmark levels of 45 μg m−3, affecting ~3.3% of the global population, equivalent to approximately 250 million individuals. In contrast, the lower-right panel (Figure 5d) shows the population exposure to fine-mode dust (PM2.5). The largest circle indicates that ~66.5% of the global population, or approximately 4920 million individuals, reside in areas where fine dust concentrations remain below the WHO AQGs PM2.5 annual-mean safety guideline. However, a substantially large fraction of the population is exposed to exceedances of this health safety threshold. Specifically, ~33.5% of the global population, corresponding to roughly 2480 million individuals, are exposed to EO-derived long-term mean fine-mode dust concentrations exceeding WHO PM2.5 benchmark thresholds used for contextual comparison, of 5 μg m−3. Within this group, ~3.9% of the global population, or about 290 million individuals, experience EO-derived fine-mode dust concentrations exceeding WHO PM2.5 benchmark levels of 15 μg m−3. Overall, these figures highlight that while most people reside in areas of dust mass concentration below the WHO health safety guidelines, exposure to fine dust particles at concentration levels exceeding WHO AQG benchmark thresholds used here as contextual indicators, affects a significant fraction of the global population, emphasizing the greater widespread impact of fine-mode dust particulate on public health. Together, the four panels provide a compact overview of the relationship between global population distribution and near-surface dust mass concentrations for both total and size-resolved dust components.
3.2. Atmospheric Dust as Environmental Risk Factor for Human Health Disorders—National Level
The present section provides a national-level assessment and quantification of atmospheric dust as an environmental risk factor for human health disorders. As discussed, an increasing body of scientific evidence reports that atmospheric dust constitutes a major component of ambient particulate matter (Figure 4) that constitute a non-trivial atmospheric-induced risk factor for human health, particularly for health-vulnerable population groups [19,20,21,22,23,24,25,26,27,28,29,30,31,32,33,34,35,36,37]. These reports highlight the growing recognition that comprehensive monitoring, management, and assessment of air quality at the national scale is essential to ensure that population exposure to both natural and anthropogenic pollutants are accurately evaluated and that pollution sources are effectively identified.
As such, monitoring atmospheric dust, among other aerosol types, at the national level is essential for several reasons. First, accurate information on atmospheric dust concentrations supports air-quality assessment frameworks and contextual evaluation relative to WHO AQGs, established by the WHO with the main objective to protect human health by recommending safe limits for air pollutants (Table 1). Second, atmospheric aerosol monitoring at the national level allows authorities to distinguish between anthropogenic emissions and natural contributions, such as desert dust, which is necessary for appropriate assessments and policy responses, facilitating identification of population vulnerability. This information is critical for designing targeted mitigation strategies, improving air quality management plans, and protecting public health. Third, natural aerosol contributions, such as dust-related particulate matter, when properly documented and verified, may be excluded from compliance assessments of limit values. Consequently, the monitoring and characterization of natural aerosols at national scales provide the scientific basis for subtracting their contribution from the total particulate matter load, ensuring that regulatory evaluations focus on controllable anthropogenic sources while maintaining an accurate assessment of population exposure and environmental risks.
In this context, quantification of the atmospheric dust load at the national level is performed on the basis of EO-based long-term (June 2006–May 2023), near-global (60°S to 60°N), and gridded (1° × 1°) mass concentrations, for both total dust (MC; Figure 4a) and fine-mode dust (MCfine-mode; Figure 4b). This approach is based on PM levels of dust mass concentration near the Earth’s surface (PBL-mean), which are responsible for dust-induced negative impacts on human health. By applying world administrative boundaries/countries shapefiles (https://public.opendatasoft.com/explore/assets/world-administrative-boundaries/; last access: 1 June 2026), provided as boundary coordinates, the “per-grid” long-term mean dust mass concentrations are aggregated and accordingly processed PBL-mean dust mass concentrations for both national-level total dust (MC; Figure 6a) and fine-mode dust (MCfine-mode; Figure 6b). The resulting mean mass concentration dust values therefore represent geographical (area-based) national mean dust concentrations. Population weighting is not applied during this aggregation, as the purpose of the national-level analysis is to characterize the mean atmospheric dust burden within each national territory rather than population exposure, which is addressed better in 1° × 1° grid cells analysis (Section 3.1). In this context, national-scale indicators provide a useful basis for air-quality assessment, environmental risk evaluation, and the development of evidence-based adaptation and management strategies. The provided insight also enables comparisons among countries and supports the assessment of dust transport across political boundaries, facilitating regional cooperation among countries affected by common source regions and atmospheric transport pathways. Consequently, the national averages reported in this study are intended to describe territorial dust conditions and the overall dust burden within national boundaries, while the gridded products are retained to identify local hotspots, spatial heterogeneities, and areas where targeted interventions may be required.
Figure 6.
National-level near-surface dust mass concentration for the cases of total dust (MC; (a)) and fine-mode dust (MCfine-mode; (b)), established on the basis of CALIOP long-term observations (June 2006–May 2023).
Having estimated the near-surface mass concentration for both total dust (Figure 6a) and the fine-mode dust (Figure 6b), the associated health risks from exposure to the EO-based quantified dust mass concentration levels can be assessed through the estimation of the Relative Risk (RR) [81,82]. More specifically, through the estimation of the RR metric the study quantifies and provides information on the likelihood of adverse human health outcomes occurring in a population exposed to specific concentrations relative to a reference, unexposed population in which no health effects are observed. Accordingly, the estimation of RR further enables the calculation of the Attributable Fraction (AF) [81,82]. Figure 7 provides the RR and AF as a response to the near-surface total accumulated atmospheric dust load (Figure 7-upper row), and in addition the RR and AF as a response to the near-surface fine-mode component of atmospheric dust load (Figure 7-bottom row) [81,82]. Overall national-level, near-surface long-term mean MC and MCfine-mode dust, including the corresponding quantified relative risks and attributable (Table A1).
Figure 7.
Upper row: National-level mean relative risk (RR; (a)) and attributable fraction (AF; (b)) of adverse human health outcomes associated with population exposure to near-surface total dust mass concentrations (MC) quantified at the national level using long-term EO data (Figure 6a). Bottom row: National-level mean relative risk (RR; (c)) and attributable fraction (AF; (d)) of adverse human health outcomes associated with populations exposed to near-surface fine-mode dust mass concentrations (MCfine-mode) quantified at the national level using long-term EO data (Figure 6b).
The RRs estimated for the dust fine-mode varied between 1.0022 (Greenland) to 1.766 (Guinea) whilst for total dust the RRs varied between 1.0062 (Greenland) to 3.895 (Benin). The RRs for total dust should not be considered independent of those estimated for the fine mode. Instead, they represent the excess risk for mortality arising from the partition of coarser particles (>2.5 μm). For this reason, RRs for total dust were always higher compared to the corresponding RR for the fine mode assessment when both pollutants are available. Yet, in this work the methodology was applied to both fine and total dust to contribute as indicative results of the input of coarser particles to mortality outcomes. PM2.5 is generally considered the best proxy for evaluating health risks.
Half of the countries had an RR lower than 1.053 for fine dust and 1.095 for total dust. The latter suggests that 50% of the world countries have risks that lie between 1 and 1.1 but increased mortality is associated with the remaining 50% (127 countries). Detailed analysis indicates a lognormal distribution of AFs both for both fine and total dust (Figure 8), i.e., most of the countries were characterized by relatively lower AFs but there are cases where AFs were substantially higher. More precisely, 192 countries (75%) had AF values lower than 10% but for the remaining 63, and the most burdened ones, AFs scaled up to 43%. For total dust, the situation is worse, as 182 countries (71%) had AFs up to 15% yet the remaining 73 AFs scaled up to 74%, highlighting the increased mortality induced by coarser particles.
Figure 8.
Histogram (bars) and cumulative probability (dotted line) of AFs estimated for each country for all-cause mortality and long-term exposure to dust fine-mode (a) and total dust (b).
At the continent level, higher relative risks were obtained for Africa (1.017–3.895) and Asia (1.011–3.033). For the remaining continents, RRs were considerably lower with a higher risk obtained at 1.174 for the case of America whilst the lowest RRs were obtained for Oceania (Figure 9). Under this case, populations in Africa and Asia are subject to an increased burden leading to higher all-cause mortality risks whereas significantly reduced mortality is expected for people living in Oceania. Particularly, Africa and Asia were characterized by greater variability in the estimated RRs, reflecting the wider range of dust concentrations. Apart from that, the RRs presented in Figure 9 are indicative of the higher overall risks corresponding to total dust compared to fine dust particles.
Figure 9.
Relative risk sorted per continent for all-cause mortality and long-term exposure to fine-mode dust and total dust.
Translation of RRs to the respective AFs suggests that almost 12% of deaths are attributed to long-term exposure to fine-mode dust in Africa and another 18.7% to the coarser dust particles (Figure 10). The numbers indicate a higher contribution to African populations by coarser particles associated inherently with the input of Sahara Desert. For Asia the overall deaths associated with long-term exposure to dust particles is 18.4% with half of them associated with fine-mode dust and the other half with coarser dust particles. For Europe, Americas and Oceania the contribution to total deaths is 4.7%, 3.3% and 2.8% respectively for fine-mode dust and 3.2%, 3.1% and 1.3% respectively for coarser dust particles.
Figure 10.
Attributable fraction per continent showing the contribution of each size dust classes. Values represent median AFs for each continent.
4. Discussion
This study provides a global assessment of atmospheric dust as an environmental health hazard by combining long-term satellite observations, global population datasets, and epidemiological exposure–response relationships. Using the ESA–LIVAS atmospheric dust climate data record (Section 2.1.1) derived from long-term CALIOP lidar observations (June 2006–May 2023), the analysis (a) quantified near-surface mass concentrations of total dust and fine-mode dust (μg m−3) and (b) assessed the health risks for human exposure across spatial scales ranging from 1° × 1° grids to national and continental levels.
The grid-level analysis highlighted the global distribution of PBL (Section 2.1.3) dust concentrations and identified regions with elevated near-surface dust and greater potential health impacts (Figure 4). High dust levels occur mainly near or downwind of major desert regions, including the Sahara, the Arabian Peninsula and Middle East, and the deserts of Central and East Asia. Long-range atmospheric transport also leads to elevated dust concentrations in regions far from deserts, such as the Mediterranean, Europe, and the Americas. Increased dust levels are also observed in highly populated and industrialized regions, including the Indian subcontinent and China, where anthropogenic activities such as land-use change, soil degradation, transportation, and construction can significantly enhance dust emissions locally. The dust patterns revealed transboundary dust transport pathways and highlight localized exposure hotspots that could be obscured in national-scale averages.
Combining grid-level dust concentrations with global population datasets allowed the quantification of population (Section 2.1.2) exposure to atmospheric dust. Results show that most of the global population experiences EO-derived total dust concentrations below WHO PM10 benchmark values used here for contextual interpretation (Table 1); however, a substantial fraction is exposed to fine-mode dust levels exceeding WHO PM2.5 benchmark thresholds used as indicative reference levels. More specifically, the analysis reports that approximately one-third of the global population resides in regions where fine-mode dust concentrations exceed WHO annual-mean PM2.5 benchmark thresholds used for contextual comparison of 5 μg m−3, indicating widespread exposure to fine particles (Table A1).
At the national scale (Figure 6), dust exposure varies considerably between countries due to differences in proximity to dust sources, atmospheric transport pathways, population density, anthropogenic activity, and environmental conditions. Using epidemiological exposure–response relationships (Section 2.2), the analysis linked these exposure patterns to measurable health risks at national level, outcomes associated with long-term exposure to dust particulate matter (Figure 7; Table A1).
The present findings are consistent with previous CALIPSO- and LIVAS-based analyses investigating the vertical structure, transport characteristics, and climatological behavior of atmospheric dust aerosols [13,14,15,44,45]. Previous studies based on CALIOP observations have extensively documented the capability of active remote sensing techniques to resolve the three-dimensional structure of mineral dust layers, identify long-range transport pathways, and characterize the vertical variability of dust aerosols over major source and receptor regions. Nevertheless, the majority of these investigations primarily focused on total-column aerosol properties, dust optical depth, free-tropospheric transport, or vertically resolved aerosol occurrence frequencies rather than on dust concentrations specifically constrained close to the Earth’s surface, with further focus on decoupling the modes of the dust aerosol components within this atmospheric layer.
Since the majority of anthropogenic activities and direct human exposure occur within the PBL [73,75,76], the integration of ERA5-derived PBL heights with the LIVAS vertically resolved dust mass concentration profiles CDR provided a substantially more exposure-oriented perspective of atmospheric dust as an air-quality hazard. Although several previous studies have investigated near-surface dust concentrations using ground-based observations, air-quality monitoring networks, numerical models, or data assimilation approaches [29,32,38,119,120,121], global Earth Observation-based assessments of near-surface or PBL-constrained dust mass concentrations remain relatively limited. Most satellite-based studies have instead concentrated on total-column dust optical properties, vertically integrated aerosol characteristics, transport pathways, or climatological aerosol distributions [13,15,44,45,85,85]. Similarly, several global modeling studies provide information relevant to surface dust abundance and variability [9,122,123,124], yet these are predominantly model-based representations rather than observation-driven vertically resolved satellite retrievals directly constrained close to the Earth’s surface.
In this context, the methodological developments introduced by Mamouri and Ansmann (2014) [49] and Mamouri and Ansmann (2017) [50] constitute an important step towards the quantitative retrieval of dust mass concentrations from polarization lidar observations. More specifically, Mamouri and Ansmann (2014) [49] introduced a methodology for separating fine (sub-micrometer) and coarse (super-micrometer) dust components using polarization lidar measurements, enabling the retrieval of vertically resolved dust mass concentration profiles through the combination of depolarization-ratio-based aerosol typing and dust-specific conversion factors. Subsequently, Mamouri and Ansmann (2017) [50] further expanded this framework by demonstrating the capability of polarization/Raman lidar observations to distinguish fine dust, coarse dust, maritime aerosol, and anthropogenic aerosol components within vertically resolved atmospheric profiles. These studies highlighted the strong potential of lidar observations for deriving physically meaningful dust mass concentration information relevant to air-quality and exposure studies. However, their analyses were primarily focused on methodological development, regional applications, and case-study investigations rather than long-term global climatological assessments. Consequently, despite the substantial progress achieved in satellite aerosol remote sensing and lidar-based dust profiling during the last decade, relatively few studies have attempted to derive long-term global dust mass concentration climatologies specifically constrained within the PBL and directly linked to potential human exposure. In this context, the present study contributes towards bridging this gap by combining the vertically resolved LIVAS pure-dust profiles with ERA5-derived PBL heights, enabling a long-term global satellite-based assessment of the atmospheric dust component most directly relevant to air-quality impacts and population exposure.
It is emphasized that an important source of uncertainty arises from the mismatch between the particle-size classes provided by the EO-based dust products and those used in the epidemiological studies from which the mass concentration–response functions are derived. Specifically, the health-risk relationships are based on PM10 and PM2.5 dust concentrations, whereas the satellite retrievals provide total dust and submicrometer-mode dust mass concentrations. Although the EO-based products represent the closest globally available satellite-derived analogs to PM10 and PM2.5 dust, the correspondence is not exact because the underlying size boundaries differ. Therefore, the estimated excess risks should be viewed as indicative of the spatial patterns and relative magnitude of dust-related health impacts rather than precise estimates of the absolute health burden. Future work would benefit from the development and validation of satellite-derived dust products explicitly tailored to PM10 and PM2.5 definitions used in epidemiological and air-quality studies, once laboratory experiments establish necessary parametrizations.
Overall, the study highlights the impact of the accumulated dust in the atmosphere as a significant global air-quality hazard to the world population. The findings also stress the importance of distinguishing between natural and anthropogenic aerosol contributions and improving, monitoring and reporting ambient concentrations of natural aerosols, such as dust, as an essential step for effective air-quality management and mitigation policies.
As such, and given the increasing scientific evidence that atmospheric dust poses health, environmental, climatic, and socioeconomic risks, several international organizations and initiatives, including the WMO Sand and Dust Storm Warning Advisory and Assessment System (SDS-WAS), the United Nations Coalition to Combat Sand and Dust Storms, the UNCCD, UNEP, and WHO support global efforts related to dust monitoring, forecasting, mitigation, and assessment of dust-related impacts on human health and the environment [6]. In this context, the EO-based global dust concentration and exposure analysis presented in this study can contribute to ongoing international efforts related to atmospheric dust monitoring, air-quality assessment, and population exposure evaluation. Moreover, within the atmospheric science community, coordinated international research efforts have led to the development of advanced observational capabilities and long-term climate data records for atmospheric aerosols. The Copernicus Atmosphere Monitoring Service (CAMS; https://atmosphere.copernicus.eu/; last access: 1 June 2026) provides global analyses and forecasts of dust and other atmospheric pollutants using satellite and ground-based data. ESA supports Earth observation missions that track, among others, dust transport, deposition, and source regions, and the development of novel EO-based products. ACTRIS operates ground-based observational networks across Europe to study aerosol properties, including dust particles, and their impacts on air quality, climate, and health.
The overall objective is to improve the ability to observe, model, and respond to dust events through international monitoring systems, scientific research initiatives, and coordinated policy frameworks. These efforts aim to enhance forecasting capabilities, strengthen early warning systems, and support sustainable land-management and air-quality policies worldwide. Such coordinated actions are essential given the transboundary nature of dust transport and the wide range of environmental, economic, and health impacts associated with atmospheric dust aerosols.
In this concept, the present study constitutes a supporting effort to monitoring and understanding the dust aerosol component close to the earth’s surface where the dust load impacts human health. The study represents an informative reporting analysis for supporting mitigating the impacts of dust events on air quality and public health. Enhancing our understanding on the dust hazard for human health has the potential to allow authorities to issue public health advisories and implement precautionary measures aimed at reducing population exposure to dust. Such measures may include limiting outdoor activities, implementing temporary health advisories, or providing guidance for vulnerable population groups such as children, the elderly, and individuals with pre-existing respiratory or cardiovascular conditions. The study, through translating satellite-based observation to information on the dust load and the dust-related risk for human health disorders, has the capacity to enhance the effectiveness of regulatory frameworks in managing the impacts of atmospheric dust on air quality. Although natural dust emissions cannot be directly controlled, regulatory policies can address anthropogenic dust emissions of particulate matter and reduce the overall exposure to harmful particles. Air quality legislation in many regions incorporates mechanisms that allow natural contributions to particulate matter concentrations to be identified when evaluating compliance with regulatory standards. This distinction enables policymakers to separate natural dust events from anthropogenic pollution sources while maintaining accurate assessments of population exposure and environmental health risks.
Overall, the findings presented here emphasize that atmospheric dust is not only a natural component of the Earth system but also a significant environmental factor influencing global air quality and human health. Through the integration of satellite observations, population datasets, and epidemiological exposure–response relationships, the present study provides new insights into the spatial distribution of dust exposure and its associated health risks at global scale.
5. Conclusions
What is the PM load of total and fine-mode dust near the Earth’s surface, where most anthropogenic activity occurs, and how does it vary across spatial scales from 1° × 1° grids to national and continental domains? How do estimates of near-surface dust mass concentrations translate into relative risks for human health induced disorders when applying empirically derived PM exposure–response functions established from epidemiological studies? And ultimately, to what extend atmospheric dust constitutes an air-quality health hazard to the world population?
The objective of the present study was to provide a comprehensive assessment of atmospheric dust as an air quality hazard to the world population. Cornerstones of the analysis were (1) the ESA-LIVAS four-dimensional multiyear atmospheric dust mass concentration CDR, established on the basis of CALIOP profiles of aerosol optical properties retrieved along the CALIPSO orbit track between June 2006 and May 2023; (2) GHSL world population estimates; (3) ECMWF-ERA5 PBL information; and (4) epidemiologically established relationships on human exposure–response to PM concentrations.
The first key conclusion of this study is that atmospheric dust constitutes a substantial environmental hazard to public health. Evaluation of EO-derived near-surface dust concentrations using WHO AQG values as contextual benchmark thresholds for human health exposure revealed several important findings. The majority of the world’s population is exposed, on a long-term mean basis, to relatively moderate total dust levels: ~92% of the global population (~6.8 billion people) reside in regions where total dust mass concentrations remain below the WHO AQGs for annual-mean PM10 (15 μg m−3). However, ~8% of the population (~610 million people) experience EO-derived dust concentrations exceeding this benchmark threshold, while ~3.3% (~250 million people) are exposed to levels exceeding the WHO AQG 24 h benchmark threshold used here for contextual interpretation for PM10 (45 μg m−3), indicating substantial regional air-quality pressure. In contrast, exposure to the fine-mode component of dust is considerably more widespread among the global population. Although ~67% of the global population (~4.9 billion individuals) live in regions where concentrations remain below the WHO AQGs for annual-mean PM2.5 (5 μg m−3), ~33% of the world population (~2.5 billion people) are exposed to EO-derived dust concentrations exceeding the WHO AQG benchmark threshold. Out of the total world population, ~3.9% (~290 million individuals) experience fine-mode dust mass concentrations exceeding 15 μg m−3, highlighting the considerable global health-pressure associated with fine-mode mineral dust particles suspended in the atmosphere.
The second key outcome of the study is the pronounced spatial variability in near-surface dust concentrations, highlighting again key global population exposure patterns. The national-scale quantification of near-surface dust mass concentrations revealed that atmospheric dust represents a non-negligible driver of health risks associated with particulate matter exposure. The largest health burdens are identified across Africa and Asia, where higher atmospheric dust loads lead to elevated population exposure levels.
The national-level analysis reported on the substantial spatial variability of dust-related health risks across countries, driven by differences in proximity to major desert sources, atmospheric transport pathways, and population density. Countries located in the proximity or downwind of major dust source regions exhibit the highest potential health burden, reflecting the combined influence of elevated near-surface dust concentrations and large exposed populations. The integration of epidemiological exposure–response relationships with satellite-derived dust concentrations demonstrated that atmospheric dust information provided by satellite-based observations can be translated into quantification of dust’s relative health risks at the national scale. These results also revealed that national averages may mask significant sub-regional variability, as localized dust hotspots can strongly influence population exposure patterns.
The study emphasized that atmospheric dust should be considered not only a natural component of the Earth system but also a significant factor influencing global air quality and human health. The integration of satellite observations, population datasets, and epidemiological exposure–response relationships provide the capacity to assess dust-related health risks across different spatial scales. These findings highlight the importance of improving monitoring and reporting of natural aerosols in air-quality assessments and regulatory frameworks and that the strengthening of observation-based assessments of atmospheric dust is an essential measure for supporting effective environmental policies and mitigating its impacts on public health.
Author Contributions
Conceptualization, E.P.; methodology, E.P., S.E.C., I.B. and M.L.; formal analysis, E.P., S.E.C., I.B., T.K. and T.G.; investigation, E.P., S.E.C. and I.B.; resources, E.P. and V.A.; data curation, E.P., S.E.C., I.B., T.K. and T.G.; writing—original draft preparation, E.P., S.E.C., I.B. and T.G.; writing—review and editing, E.P., S.E.C., I.B. and T.G.; visualization, E.P., S.E.C., I.B. and T.K.; supervision, E.P., M.L. and V.A.; project administration, E.P.; funding acquisition, E.P. All authors have read and agreed to the published version of the manuscript.
Funding
This research has been funded by the AXA Research Fund for postdoctoral researchers under the project entitled “Earth Observation for Air-Quality–Dust Fine-Mode (EO4AQ-DustFM)”.
Data Availability Statement
The EO-based level 2 pure-dust fine-mode and coarse-mode CDR is available at https://doi.org/10.5281/zenodo.10389741 [15]. The LIVAS level 2 and level 3 pure-dust CDR is available upon personal communication with E.P. (proestakis@noa.gr) and/or V.A. (vamoir@noa.gr). The CALIPSO lidar level 1B and level 2 data products are publicly available from the Atmospheric Science Data Center at NASA Langley Research Center (https://earthdata.nasa.gov/eosdis/daacs/asdc, Earthdata, last access: 1 June 2026). Population estimates are provided by the Global Human Settlement Layer (GHSL; https://population.un.org/wup/, last access: 1 June 2026). ERA5-PBL height was provided by ECMWF (https://www.ecmwf.int/en/forecasts/dataset/ecmwf-reanalysis-v5; last access: 1 June 2026).
Acknowledgments
In addition, the authors acknowledge “AtmoHub: A National Atmospheric Composition Hub for Air Quality Monitoring and Forecasting in Greece” (CAMS2_72GR_NOA project), funded by CAMS National Collaboration Programme (NCP) Greece (https://atmosphere.copernicus.eu/greece; last access: 1 June 2026) and the Copernicus Atmosphere Monitoring Service (CAMS) and the PANORAMA project, funded by the European Union’s HORIZON EUROPE Programme under the Grant Agreement No. 101182795.
Conflicts of Interest
The authors declare no conflicts of interest.
Abbreviations
The following abbreviations are used in this manuscript:
| AERONET | AErosol RObotic NETwork |
| AER-D | AERosol properties–Dust |
| AF | Attributable Fraction |
| AOD | Aerosol Optical Depth |
| AOT | Aerosol Optical Thickness |
| AQ | Air Quality |
| AQGs | Air Quality Guidelines |
| CALIOP | Cloud-Aerosol Lidar with Orthogonal Polarization |
| CALIPSO | Cloud-Aerosol Lidar and Infrared Pathfinder Satellite Observations |
| CDR | Climate Data Record |
| CDS | Climate Data Store |
| CIESIN | Center for International Earth Science Information Network |
| DOD | Dust Optical Depth |
| DODCM | Dust Optical Depth Coarse-Mode |
| DODFM | Dust Optical Depth Fine-Mode |
| GDP | Gross Domestic Product |
| EARLINET | European Aerosol Research Lidar Network |
| ECMWF | European Centre for Medium-Range Weather Forecasts |
| EO | Earth Observations |
| ESA | European Space Agency |
| EU | European Union |
| EU AAQD | European Union Ambient Air Quality Directive |
| FAAM | Facility for Airborne Atmospheric Measurements |
| GHSL | Global Human Settlement Layer |
| ICE-D | Ice in Clouds Experiment–Dust |
| LIVAS | LIdar climatology of Vertical Aerosol Structure |
| LMICs | low- and middle-income countries |
| LAU2 | Local Administrative Units Level 2 |
| L2/L3 | Level 2/Level 3 |
| MBL | Marine Boundary Layer |
| MS | Member States |
| NSA | Negative Signal Anomaly |
| PBL | Planetary Boundary Layer |
| POLIPHON | POlarization LIdar PHOtometer Networking |
| PSD | Particle Size Distribution |
| PM | Particulate Matter |
| RMSE | Root Mean Square Error |
| RR | Relative Risk |
| SAL | Saharan Air Layer |
| SDA | Spectral Deconvolution Algorithm |
| SDG | Sustainable Development Goals |
| Sect. | Section |
| SNR | Signal-to-Noise Ratio |
| SPARTAN | Surface Particulate Matter Network |
| TOA | Top of Atmosphere |
| UN | United Nations |
| UNECE | United Nations Economic Commission for Europe |
| UNFCCC | United Nations Framework Convention on Climate Change |
| WHO | World Health Organization |
Appendix A
Table A1.
(From left to right): Country (name; alphabetically listed), continent of country/region, countries/regions-level near-surface long-term mean total dust mass concentration (DustTotal MC; μg m−3), Total Dust Relative Risks (RRTotal all cause), Total Dust Attributable Fraction (ATTotal all cause), fine-mode dust mass concentration (DustFM MC; μg m−3), fine-mode dust mass concentration Relative Risk (RRFM all cause) and Attributable Fraction (ATFM all cause).
References
- World Health Organization. Air Pollution and Health. WHO Feature Story. 2023. Available online: https://www.who.int/news-room/feature-stories/detail/air-pollution--the-invisible-health-threat (accessed on 13 March 2026).
- Health Effects Institute. State of Global Air Report 2024; Health Effects Institute: Boston, MA, USA, 2024; Available online: https://www.stateofglobalair.org/resources/archived/state-global-air-report-2024?utm_source=chatgpt.com (accessed on 13 March 2026).
- UNICEF. Air Pollution Accounted for 8.1 Million Deaths Globally in 2021. UNICEF Press Release. 2024. Available online: https://www.unicef.org/romania/press-releases/air-pollution-accounted-81-million-deaths-globally-2021-becoming-second-leading-risk (accessed on 13 March 2026).
- United Nations Economic Commission for Europe. Cost of Inaction on Air Pollution; ECE/EB.AIR/2022/7; United Nations Economic Commission for Europe (UNECE): Geneva, Switzerland, 2022; Available online: https://unece.org/sites/default/files/2022-10/ECE_EB.AIR_2022_7-2215043E_0.pdf (accessed on 13 March 2026).
- Wagner, F.; Slater, J.; Kiesewetter, G.; Klimont, Z. Guide to Assessing the Costs of Inaction of Tackling Air Pollution; International Institute for Applied Systems Analysis and United Nations Environment Programme: Laxenburg, Austria, 2023; Available online: https://pure.iiasa.ac.at/id/eprint/18827/1/Guide%20to%20Assessing%20the%20Costs%20of%20Inaction%20of%20Tackling%20Air%20Pollution-IIASA%20-%20Advance%20copy-May2023-f.pdf (accessed on 13 March 2026).
- World Health Organization. WHO Global Air Quality Guidelines: Particulate Matter (PM2.5 and PM10), Ozone, Nitrogen Dioxide, Sulfur Dioxide and Carbon Monoxide; World Health Organization: Geneva, Switzerland, 2021; Available online: https://www.who.int/publications/i/item/9789240034228 (accessed on 13 March 2026).
- European Parliament and Council. Directive (EU) 2024/2881 of the European Parliament and of the Council of 23 October 2024 on Ambient Air Quality and Cleaner Air for Europe (Recast). Official Journal of the European Union. 2024. Available online: https://eur-lex.europa.eu/eli/dir/2024/2881/oj (accessed on 13 March 2026).
- Gliß, J.; Mortier, A.; Schulz, M.; Andrews, E.; Balkanski, Y.; Bauer, S.E.; Benedictow, A.M.K.; Bian, H.; Checa-Garcia, R.; Chin, M.; et al. AeroCom Phase III Multi-Model Evaluation of the Aerosol Life Cycle and Optical Properties Using Ground- and Space-Based Remote Sensing as Well as Surface in Situ Observations. Atmos. Chem. Phys. 2021, 21, 87–128. [Google Scholar] [CrossRef] [Scilit]
- Kok, J.F.; Storelvmo, T.; Karydis, V.A.; Adebiyi, A.A.; Mahowald, N.M.; Evan, A.T.; He, C.; Leung, D.M. Mineral Dust Aerosol Impacts on Global Climate and Climate Change. Nat. Rev. Earth Environ. 2023, 4, 71–86. [Google Scholar] [CrossRef] [Scilit]
- Prospero, J.M. Long-Range Transport of Mineral Dust in the Global Atmosphere: Impact of African Dust on the Environment of the Southeastern United States. Proc. Natl. Acad. Sci. USA 1999, 96, 3396–3403. [Google Scholar] [CrossRef] [Scilit] [PubMed]
- Schepanski, K.; Tegen, I.; Macke, A. Saharan Dust Transport and Deposition towards the Tropical Northern Atlantic. Atmos. Chem. Phys. 2009, 9, 1173–1189. [Google Scholar] [CrossRef] [Scilit]
- Kanitz, T.; Engelmann, R.; Heinold, B.; Baars, H.; Skupin, A.; Ansmann, A. Tracking the Saharan Air Layer with Shipborne Lidar across the Tropical Atlantic. Geophys. Res. Lett. 2014, 41, 1044–1050. [Google Scholar] [CrossRef] [Scilit]
- Marinou, E.; Amiridis, V.; Binietoglou, I.; Tsikerdekis, A.; Solomos, S.; Proestakis, E.; Konsta, D.; Papagiannopoulos, N.; Tsekeri, A.; Vlastou, G.; et al. Three-Dimensional Evolution of Saharan Dust Transport towards Europe Based on a 9-Year EARLINET-Optimized CALIPSO Dataset. Atmos. Chem. Phys. 2017, 17, 5893–5919. [Google Scholar] [CrossRef] [Scilit]
- Proestakis, E.; Amiridis, V.; Marinou, E.; Georgoulias, A.K.; Solomos, S.; Kazadzis, S.; Chimot, J.; Che, H.; Alexandri, G.; Binietoglou, I.; et al. Nine-Year Spatial and Temporal Evolution of Desert Dust Aerosols over South and East Asia as Revealed by CALIOP. Atmos. Chem. Phys. 2018, 18, 1337–1362. [Google Scholar] [CrossRef] [Scilit]
- Proestakis, E.; Gkikas, A.; Georgiou, T.; Kampouri, A.; Drakaki, E.; Ryder, C.L.; Marenco, F.; Marinou, E.; Amiridis, V. A Near-Global Multiyear Climate Data Record of the Fine-Mode and Coarse-Mode Components of Atmospheric Pure Dust. Atmos. Meas. Tech. 2024, 17, 3625–3667. [Google Scholar] [CrossRef] [Scilit]
- Adebiyi, A.A.; Kok, J.F. Climate Models Miss Most of the Coarse Dust in the Atmosphere. Sci. Adv. 2020, 6, eaaz9507. [Google Scholar] [CrossRef] [Scilit] [PubMed]
- Mahowald, N.; Albani, S.; Kok, J.F.; Engelstaeder, S.; Scanza, R.; Ward, D.S.; Flanner, M.G. The Size Distribution of Desert Dust Aerosols and Its Impact on the Earth System. Aeolian Res. 2014, 15, 53–71. [Google Scholar] [CrossRef] [Scilit]
- Ryder, C.L.; Highwood, E.J.; Walser, A.; Seibert, P.; Philipp, A.; Weinzierl, B. Coarse and Giant Particles Are Ubiquitous in Saharan Dust Export Regions and Are Radiatively Significant over the Sahara. Atmos. Chem. Phys. 2019, 19, 15353–15376. [Google Scholar] [CrossRef] [Scilit]
- Sandstrom, T.; Forsberg, B. Desert Dust: An Unrecognized Source of Dangerous Air Pollution? Epidemiology 2008, 19, 808. [Google Scholar] [CrossRef] [Scilit] [PubMed]
- Garcia-Pando, C.P.; Stanton, M.C.; Diggle, P.J.; Trzaska, S.; Miller, R.L.; Perlwitz, J.P.; Baldasano, J.M.; Cuevas, E.; Ceccato, P.; Yaka, P.; et al. Soil Dust Aerosols and Wind as Predictors of Seasonal Meningitis Incidence in Niger. Environ. Health Perspect. 2014, 122, 679–686. [Google Scholar] [CrossRef] [Scilit] [PubMed]
- Martinelli, N.; Olivieri, O.; Girelli, D. Air Particulate Matter and Cardiovascular Disease: A Narrative Review. Eur. J. Intern. Med. 2013, 24, 295–302. [Google Scholar] [CrossRef] [Scilit] [PubMed]
- Lazaridis, M. Modelling Approaches to Particle Deposition and Clearance in the Human Respiratory Tract. Air Qual. Atmos. Health 2023, 16, 1989–2002. [Google Scholar] [CrossRef] [Scilit]
- Bousquet, J.; Ndiaye, M.; Aït-Khaled, N.; Annesi-Maesano, I.; Vignola, A.-M. Management of chronic respiratory and allergic diseases in developing countries. Focus on sub-Saharan Africa. Allergy 2003, 58, 265–283. [Google Scholar] [CrossRef] [Scilit] [PubMed]
- Kellogg, C.A.; Griffin, D.W.; Garrison, V.H.; Peak, K.K.; Royall, N.; Smith, R.R.; Shinn, E.A. Characterization of Aerosolized Bacteria and Fungi From Desert Dust Events in Mali, West Africa. Aerobiologia 2004, 20, 99–110. [Google Scholar] [CrossRef] [Scilit]
- Watanabe, M.; Yamasaki, A.; Burioka, N.; Kurai, J.; Yoneda, K.; Yoshida, A.; Igishi, T.; Fukuoka, Y.; Nakamoto, M.; Takeuchi, H.; et al. Correlation between Asian Dust Storms Worsening Asthma in Western Japan. Allergol. Int. 2011, 60, 267–275. [Google Scholar] [CrossRef] [Scilit] [PubMed]
- Kwon, H.-J.; Cho, S.-H.; Chun, Y.; Lagarde, F.; Pershagen, G. Effects of the Asian Dust Events on Daily Mortality in Seoul, Korea. Environ. Res. 2002, 90, 1–5. [Google Scholar] [CrossRef] [Scilit] [PubMed]
- Middleton, N.; Yiallouros, P.; Kleanthous, S.; Kolokotroni, O.; Schwartz, J.; Dockery, D.W.; Demokritou, P.; Koutrakis, P. A 10-Year Time-Series Analysis of Respiratory and Cardiovascular Morbidity in Nicosia, Cyprus: The Effect of Short-Term Changes in Air Pollution and Dust Storms. Environ. Health 2008, 7, 39. [Google Scholar] [CrossRef] [Scilit] [PubMed]
- Goudie, A.S. Desert Dust and Human Health Disorders. Environ. Int. 2014, 63, 101–113. [Google Scholar] [CrossRef] [Scilit] [PubMed]
- Achakulwisut, P.; Mickley, L.J.; Anenberg, S.C. Drought-Sensitivity of Fine Dust in the US Southwest: Implications for Air Quality and Public Health under Future Climate Change. Environ. Res. Lett. 2018, 13, 054025. [Google Scholar] [CrossRef] [Scilit]
- Chen, Y.-S.; Sheen, P.-C.; Chen, E.-R.; Liu, Y.-K.; Wu, T.-N.; Yang, C.-Y. Effects of Asian Dust Storm Events on Daily Mortality in Taipei, Taiwan. Environ. Res. 2004, 95, 151–155. [Google Scholar] [CrossRef] [PubMed]
- Middleton, N. Health in Dust Belt Cities and beyond—An Essay by Nick Middleton. BMJ 2020, 371, m3089. [Google Scholar] [CrossRef] [Scilit] [PubMed]
- Giannadaki, D.; Pozzer, A.; Lelieveld, J. Modeled Global Effects of Airborne Desert Dust on Air Quality and Premature Mortality. Atmos. Chem. Phys. 2014, 14, 957–968. [Google Scholar] [CrossRef] [Scilit]
- Steenland, K.; Ward, E. Silica: A Lung Carcinogen. CA Cancer J. Clin. 2014, 64, 63–69. [Google Scholar] [CrossRef] [Scilit] [PubMed]
- Deroubaix, A.; Martiny, N.; Chiapello, I.; Marticorena, B. Suitability of OMI Aerosol Index to Reflect Mineral Dust Surface Conditions: Preliminary Application for Studying the Link with Meningitis Epidemics in the Sahel. Remote Sens. Environ. 2013, 133, 116–127. [Google Scholar] [CrossRef] [Scilit]
- Agier, L.; Martiny, N.; Thiongane, O.; Mueller, J.E.; Paireau, J.; Watkins, E.R.; Irving, T.J.; Koutangni, T.; Broutin, H. Towards Understanding the Epidemiology of Neisseria Meningitidis in the African Meningitis Belt: A Multi-Disciplinary Overview. Int. J. Infect. Dis. 2017, 54, 103–112. [Google Scholar] [CrossRef] [Scilit] [PubMed]
- Nakazawa, T.; Matsueda, M. Relationship between Meteorological Variables/Dust and the Number of Meningitis Cases in Burkina Faso. Meteorol. Appl. 2017, 24, 423–431. [Google Scholar] [CrossRef] [Scilit]
- Woringer, M.; Martiny, N.; Porgho, S.; Bicaba, B.W.; Bar-Hen, A.; Mueller, J.E. Atmospheric Dust, Early Cases, and Localized Meningitis Epidemics in the African Meningitis Belt: An Analysis Using High Spatial Resolution Data. Environ. Health Perspect. 2022, 126, 097002. [Google Scholar] [CrossRef] [Scilit] [PubMed]
- Querol, X.; Pérez, N.; Reche, C.; Ealo, M.; Ripoll, A.; Tur, J.; Pandolfi, M.; Pey, J.; Salvador, P.; Moreno, T.; et al. African Dust and Air Quality over Spain: Is It Only Dust That Matters? Sci. Total Environ. 2019, 686, 737–752. [Google Scholar] [CrossRef] [Scilit] [PubMed]
- Hunt, W.H.; Winker, D.M.; Vaughan, M.A.; Powell, K.A.; Lucker, P.L.; Weimer, C. CALIPSO Lidar Description and Performance Assessment. J. Atmos. Ocean. Technol. 2009, 26, 1214–1228. [Google Scholar] [CrossRef] [Scilit]
- Winker, D.M.; Pelon, J.; Coakley, J.A.; Ackerman, S.A.; Charlson, R.J.; Colarco, P.R.; Flamant, P.; Fu, Q.; Hoff, R.M.; Kittaka, C.; et al. The CALIPSO MissionA Global 3D View of Aerosols and Clouds. Bull. Amer. Meteor. Soc. 2010, 91, 1211–1230. [Google Scholar] [CrossRef] [Scilit]
- Freudenthaler, V.; Esselborn, M.; Wiegner, M.; Heese, B.; Tesche, M.; Ansmann, A.; Mueller, D.; Althausen, D.; Wirth, M.; Fix, A.; et al. Depolarization Ratio Profiling at Several Wavelengths in Pure Saharan Dust during SAMUM 2006. Tellus Ser. B-Chem. Phys. Meteorol. 2009, 61, 165–179. [Google Scholar] [CrossRef] [Scilit]
- Sakai, T.; Nagai, T.; Zaizen, Y.; Mano, Y. Backscattering Linear Depolarization Ratio Measurements of Mineral, Sea-Salt, and Ammonium Sulfate Particles Simulated in a Laboratory Chamber. Appl. Opt. 2010, 49, 4441–4449. [Google Scholar] [CrossRef] [Scilit] [PubMed]
- Järvinen, E.; Kemppinen, O.; Nousiainen, T.; Kociok, T.; Möhler, O.; Leisner, T.; Schnaiter, M. Laboratory Investigations of Mineral Dust Near-Backscattering Depolarization Ratios. J. Quant. Spectrosc. Radiat. Transf. 2016, 178, 192–208. [Google Scholar] [CrossRef] [Scilit]
- Amiridis, V.; Wandinger, U.; Marinou, E.; Giannakaki, E.; Tsekeri, A.; Basart, S.; Kazadzis, S.; Gkikas, A.; Taylor, M.; Baldasano, J.; et al. Optimizing CALIPSO Saharan Dust Retrievals. Atmos. Chem. Phys. 2013, 13, 12089–12106. [Google Scholar] [CrossRef] [Scilit]
- Amiridis, V.; Marinou, E.; Tsekeri, A.; Wandinger, U.; Schwarz, A.; Giannakaki, E.; Mamouri, R.; Kokkalis, P.; Binietoglou, I.; Solomos, S.; et al. LIVAS: A 3-D Multi-Wavelength Aerosol/Cloud Database Based on CALIPSO and EARLINET. Atmos. Chem. Phys. 2015, 15, 7127–7153. [Google Scholar] [CrossRef] [Scilit]
- Aslanoğlu, S.Y.; Proestakis, E.; Gkikas, A.; Güllü, G.; Amiridis, V. Dust Climatology of Turkey as a Part of the Eastern Mediterranean Basin via 9-Year CALIPSO-Derived Product. Atmosphere 2022, 13, 733. [Google Scholar] [CrossRef] [Scilit]
- Tesche, M.; Ansmann, A.; Mueller, D.; Althausen, D.; Engelmann, R.; Freudenthaler, V.; Gross, S. Vertically Resolved Separation of Dust and Smoke over Cape Verde Using Multiwavelength Raman and Polarization Lidars during Saharan Mineral Dust Experiment 2008. J. Geophys. Res.-Atmos. 2009, 114, D13202. [Google Scholar] [CrossRef] [Scilit]
- Ansmann, A.; Seifert, P.; Tesche, M.; Wandinger, U. Profiling of Fine and Coarse Particle Mass: Case Studies of Saharan Dust and Eyjafjallajokull/Grimsvotn Volcanic Plumes. Atmos. Chem. Phys. 2012, 12, 9399–9415. [Google Scholar] [CrossRef] [Scilit]
- Mamouri, R.E.; Ansmann, A. Fine and Coarse Dust Separation with Polarization Lidar. Atmos. Meas. Tech. 2014, 7, 3717–3735. [Google Scholar] [CrossRef] [Scilit]
- Mamouri, R.-E.; Ansmann, A. Potential of Polarization/Raman Lidar to Separate Fine Dust, Coarse Dust, Maritime, and Anthropogenic Aerosol Profiles. Atmos. Meas. Tech. 2017, 10, 3403–3427. [Google Scholar] [CrossRef] [Scilit]
- Pappalardo, G.; Amodeo, A.; Apituley, A.; Comeron, A.; Freudenthaler, V.; Linne, H.; Ansmann, A.; Boesenberg, J.; D’Amico, G.; Mattis, I.; et al. EARLINET: Towards an Advanced Sustainable European Aerosol Lidar Network. Atmos. Meas. Tech. 2014, 7, 2389–2409. [Google Scholar] [CrossRef] [Scilit]
- Ansmann, A.; Mamouri, R.-E.; Hofer, J.; Baars, H.; Althausen, D.; Abdullaev, S.F. Dust Mass, Cloud Condensation Nuclei, and Ice-Nucleating Particle Profiling with Polarization Lidar: Updated POLIPHON Conversion Factors from Global AERONET Analysis. Atmos. Meas. Tech. 2019, 12, 4849–4865. [Google Scholar] [CrossRef] [Scilit]
- Tackett, J.L.; Winker, D.M.; Getzewich, B.J.; Vaughan, M.A.; Young, S.A.; Kar, J. CALIPSO Lidar Level 3 Aerosol Profile Product: Version 3 Algorithm Design. Atmos. Meas. Tech. 2018, 11, 4129–4152. [Google Scholar] [CrossRef] [Scilit] [PubMed]
- Winker, D.M.; Vaughan, M.A.; Omar, A.; Hu, Y.; Powell, K.A.; Liu, Z.; Hunt, W.H.; Young, S.A. Overview of the CALIPSO Mission and CALIOP Data Processing Algorithms. J. Atmos. Ocean. Technol. 2009, 26, 2310–2323. [Google Scholar] [CrossRef] [Scilit]
- Mamouri, R.E.; Ansmann, A.; Nisantzi, A.; Kokkalis, P.; Schwarz, A.; Hadjimitsis, D. Low Arabian Dust Extinction-to-Backscatter Ratio. Geophys. Res. Lett. 2013, 40, 4762–4766. [Google Scholar] [CrossRef] [Scilit]
- Nisantzi, A.; Mamouri, R.E.; Ansmann, A.; Schuster, G.L.; Hadjimitsis, D.G. Middle East versus Saharan Dust Extinction-to-Backscatter Ratios. Atmos. Chem. Phys. 2015, 15, 7071–7084. [Google Scholar] [CrossRef] [Scilit]
- Hofer, J.; Althausen, D.; Abdullaev, S.F.; Makhmudov, A.N.; Nazarov, B.I.; Schettler, G.; Engelmann, R.; Baars, H.; Fomba, K.W.; Müller, K.; et al. Long-Term Profiling of Mineral Dust and Pollution Aerosol with Multiwavelength Polarization Raman Lidar at the Central Asian Site of Dushanbe, Tajikistan: Case Studies. Atmos. Chem. Phys. 2017, 17, 14559–14577. [Google Scholar] [CrossRef] [Scilit]
- Mamali, D.; Marinou, E.; Sciare, J.; Pikridas, M.; Kokkalis, P.; Kottas, M.; Binietoglou, I.; Tsekeri, A.; Keleshis, C.; Engelmann, R.; et al. Vertical Profiles of Aerosol Mass Concentration Derived by Unmanned Airborne in Situ and Remote Sensing Instruments during Dust Events. Atmos. Meas. Tech. 2018, 11, 2897–2910. [Google Scholar] [CrossRef] [Scilit]
- Marinou, E.; Tesche, M.; Nenes, A.; Ansmann, A.; Schrod, J.; Mamali, D.; Tsekeri, A.; Pikridas, M.; Baars, H.; Engelmann, R.; et al. Retrieval of Ice-Nucleating Particle Concentrations from Lidar Observations and Comparison with UAV in Situ Measurements. Atmos. Chem. Phys. 2019, 19, 11315–11342. [Google Scholar] [CrossRef] [Scilit]
- Holben, B.N.; Eck, T.F.; Slutsker, I.; Tanré, D.; Buis, J.P.; Setzer, A.; Vermote, E.; Reagan, J.A.; Kaufman, Y.J.; Nakajima, T.; et al. AERONET—A Federated Instrument Network and Data Archive for Aerosol Characterization. Remote Sens. Environ. 1998, 66, 1–16. [Google Scholar] [CrossRef] [Scilit]
- Eck, T.F.; Holben, B.N.; Reid, J.S.; Dubovik, O.; Smirnov, A.; O’Neill, N.T.; Slutsker, I.; Kinne, S. Wavelength dependence of the optical depth of biomass burning, urban and desert dust aerosols. J. Geophys. Res. 1999, 104, 31333–31350. [Google Scholar] [CrossRef] [Scilit]
- O’Neill, N.T.; Eck, T.F.; Smirnov, A.; Holben, B.N.; Thulasiraman, S. Spectral Discrimination of Coarse and Fine Mode Optical Depth. J. Geophys. Res.-Atmos. 2003, 108, 4559. [Google Scholar] [CrossRef] [Scilit]
- O’Neill, N.T.; Eck, T.F.; Holben, B.N.; Smirnov, A.; Dubovik, O.; Royer, A. Bimodal Size Distribution Influences on the Variation of Angstrom Derivatives in Spectral and Optical Depth Space. J. Geophys. Res. Atmos. 2001, 106, 9787–9806. [Google Scholar] [CrossRef] [Scilit]
- Schiavina, M.; Freire, S.; Carioli, A.; MacManus, K. GHS-POP R2023A—GHS Population Grid Multitemporal (1975–2030); European Commission, Joint Research Centre (JRC): Brussels, Belgium, 2023. [Google Scholar]
- United Nations. World Population Prospects 2022: Summary of Results; United Nations: New York, NY, USA, 2022; Available online: http://data.europa.eu/89h/2ff68a52-5b5b-4a22-8f40-c41da8332cfe (accessed on 13 March 2026). [CrossRef] [Scilit]
- United Nations, Department of Economic and Social Affairs, Population Division. World Urbanization Prospects: The 2018 Revision (ST/ESA/SER.A/420); United Nations: New York, NY, USA, 2019. [Google Scholar]
- Winker, D.M.; Tackett, J.L.; Getzewich, B.J.; Liu, Z.; Vaughan, M.A.; Rogers, R.R. The Global 3-D Distribution of Tropospheric Aerosols as Characterized by CALIOP. Atmos. Chem. Phys. 2013, 13, 3345–3361. [Google Scholar] [CrossRef] [Scilit]
- Vaughan, M.A.; Liu, Z.; McGill, M.J.; Hu, Y.; Obland, M.D. On the Spectral Dependence of Backscatter from Cirrus Clouds: Assessing CALIOP’s 1064 Nm Calibration Assumptions Using Cloud Physics Lidar Measurements. J. Geophys. Res.-Atmos. 2010, 115, D14206. [Google Scholar] [CrossRef] [Scilit]
- Rogers, R.R.; Vaughan, M.A.; Hostetler, C.A.; Burton, S.P.; Ferrare, R.A.; Young, S.A.; Hair, J.W.; Obland, M.D.; Harper, D.B.; Cook, A.L.; et al. Looking through the Haze: Evaluating the CALIPSO Level 2 Aerosol Optical Depth Using Airborne High Spectral Resolution Lidar Data. Atmos. Meas. Tech. 2014, 7, 4317–4340. [Google Scholar] [CrossRef] [Scilit]
- Proestakis, E.; Amiridis, V.; Marinou, E.; Binietoglou, I.; Ansmann, A.; Wandinger, U.; Hofer, J.; Yorks, J.; Nowottnick, E.; Makhmudov, A.; et al. EARLINET Evaluation of the CATS Level 2 Aerosol Backscatter Coefficient Product. Atmos. Chem. Phys. 2019, 19, 11743–11764. [Google Scholar] [CrossRef] [Scilit]
- Young, S.A.; Vaughan, M.A.; Kuehn, R.E.; Winker, D.M. The Retrieval of Profiles of Particulate Extinction from Cloud–Aerosol Lidar and Infrared Pathfinder Satellite Observations (CALIPSO) Data: Uncertainty and Error Sensitivity Analyses. J. Atmos. Ocean. Technol. 2013, 30, 395–428. [Google Scholar] [CrossRef] [Scilit]
- Arya, S.P. Introduction to Micrometeorology, 2nd ed.; International Geophysics; Academic Press: Cambridge, MA, USA, 2021; Volume 79, pp. 1–30. [Google Scholar] [CrossRef] [Scilit]
- Stull, R.B. Mean Boundary Layer Characteristics. In An Introduction to Boundary Layer Meteorology; Springer: Dordrecht, The Netherlands, 1988; pp. 1–27. [Google Scholar] [CrossRef] [Scilit]
- Esau, I.; Zilitinkevich, S. On the Role of the Planetary Boundary Layer Depth in the Climate System. In Proceedings of the Advances in Science and Research; Copernicus GmbH: Göttingen, Germany, 2010; Volume 4, pp. 63–69. [Google Scholar]
- McGrath-Spangler, E.L.; Denning, A.S. Global Seasonal Variations of Midday Planetary Boundary Layer Depth from CALIPSO Space-Borne LIDAR. J. Geophys. Res. Atmos. 2013, 118, 1226–1233. [Google Scholar] [CrossRef] [Scilit]
- Luo, T.; Yuan, R.; Wang, Z. Lidar-Based Remote Sensing of Atmospheric Boundary Layer Height over Land and Ocean. Atmos. Meas. Tech. 2014, 7, 173–182. [Google Scholar] [CrossRef] [Scilit]
- Hägeli, P.; Steyn, D.G.; Strawbridge, K.B. Spatial And Temporal Variability Of Mixed-Layer Depth And Entrainment Zone Thickness. Bound.-Layer. Meteorol. 2000, 97, 47–71. [Google Scholar] [CrossRef] [Scilit]
- Pal, S.; Behrendt, A.; Wulfmeyer, V. Elastic-Backscatter-Lidar-Based Characterization of the Convective Boundary Layer and Investigation of Related Statistics. Ann. Geophys. 2010, 28, 825–847. [Google Scholar] [CrossRef] [Scilit]
- Pikridas, M.; Bezantakos, S.; Močnik, G.; Keleshis, C.; Brechtel, F.; Stavroulas, I.; Demetriades, G.; Antoniou, P.; Vouterakos, P.; Argyrides, M.; et al. On-flight intercomparison of three miniature aerosol absorption sensors using unmanned aerial systems (UASs). Atmos. Meas. Tech. 2019, 12, 6425–6447. [Google Scholar] [CrossRef] [Scilit]
- Hersbach, H.; Bell, B.; Berrisford, P.; Hirahara, S.; Horányi, A.; Muñoz-Sabater, J.; Nicolas, J.; Peubey, C.; Radu, R.; Schepers, D.; et al. The ERA5 Global Reanalysis. Q. J. R. Meteorol. Soc. 2020, 146, 1999–2049. [Google Scholar] [CrossRef] [Scilit]
- Gowers, A.M.; Miller, B.G.; Stedman, J.R. Estimating Local Mortality Burdens Associated with Particulate Matter Pollution (Report PHE-CRCE-010); Public Health: London, UK, 2014. Available online: https://www.gov.uk/government/publications/estimating-local-mortality-burdens-associated-with-particulate-air-pollution (accessed on 3 May 2026).
- Orellano, P.; Kasdagli, M.-I.; Velasco, R.P.; Samoli, E. Long-term exposure to particulate matter and mortality: An update of the WHO Global Air Quality Guidelines systematic review and meta-analysis. Int. J. Public Health 2024, 69, 1607683. [Google Scholar] [CrossRef] [Scilit] [PubMed]
- Chalvatzaki, E.; Chatoutsidou, S.E.; Lehtomäki, H.; Almeida, S.M.; Eleftheriadis, K.; Hänninen, O.; Lazaridis, M. Characterization of Human Health Risks from Particulate Air Pollution in Selected European Cities. Atmosphere 2019, 10, 96. [Google Scholar] [CrossRef] [Scilit]
- Franklin, M.; Koutrakis, P.; Schwartz, J. The Role of Particle Composition on the Association Between PM2.5 and Mortality. Epidemiology 2008, 19, 680. [Google Scholar] [CrossRef] [Scilit] [PubMed]
- Fubini, B.; Areán, C.O. Chemical Aspects of the Toxicity of Inhaled Mineral Dusts. Chem. Soc. Rev. 1999, 28, 373–381. [Google Scholar] [CrossRef] [Scilit]
- Prospero, J.M.; Ginoux, P.; Torres, O.; Nicholson, S.E.; Gill, T.E. Environmental Characterization of Global Sources of Atmospheric Soil Dust Identified with the Nimbus 7 Total Ozone Mapping Spectrometer (Toms) Absorbing Aerosol Product. Rev. Geophys. 2002, 40, 1002. [Google Scholar] [CrossRef] [Scilit]
- Gkikas, A.; Proestakis, E.; Amiridis, V.; Kazadzis, S.; Di Tomaso, E.; Marinou, E.; Hatzianastassiou, N.; Kok, J.F.; Gar-cía-Pando, C.P. Quantification of the Dust Optical Depth across Spatiotemporal Scales with the MIDAS Global Dataset (2003–2017). Atmos. Chem. Phys. 2022, 22, 3553–3578. [Google Scholar] [CrossRef] [Scilit]
- Proestakis, E.; Amiridis, V.; García-Pando, C.P.; Tsyro, S.; Griesfeller, J.; Gkikas, A.; Georgiou, T.; Ageitos, M.G.; Escribano, J.; Myriokefalitakis, S.; et al. Quantifying Dust Deposition over the Atlantic Ocean. Earth Syst. Sci. Data Discuss. 2025, 17, 4351–4395. [Google Scholar] [CrossRef] [Scilit]
- Schepanski, K.; Heinold, B.; Tegen, I. Harmattan, Saharan heat low, and West African monsoon circulation: Modulations on the Saharan dust outflow towards the North Atlantic. Atmos. Chem. Phys. 2017, 17, 10223–10243. [Google Scholar] [CrossRef] [Scilit]
- Tyson, P.D.; Garstang, M.; Swap, R.; Kallberg, P.; Edwards, M. An air transport climatology for subtropical southern Africa. Int. J. Climatol. 1996, 16, 265–291. [Google Scholar] [CrossRef]
- Klose, M.; Shao, Y.; Karremann, M.K.; Fink, A.H. Sahel Dust Zone and Synoptic Background. Geophys. Res. Lett. 2010, 37, L09802. [Google Scholar] [CrossRef] [Scilit]
- Koch, J.; Renno, N.O. The Role of Convective Plumes and Vortices on the Global Aerosol Budget. Geophys. Res. Lett. 2005, 32, L18806. [Google Scholar] [CrossRef] [Scilit]
- Knippertz, P.; Deutscher, C.; Kandler, K.; Mueller, T.; Schulz, O.; Schuetz, L. Dust Mobilization Due to Density Currents in the Atlas Region: Observations from the Saharan Mineral Dust Experiment 2006 Field Campaign. J. Geophys. Res.-Atmos. 2007, 112, D21109. [Google Scholar] [CrossRef] [Scilit]
- Ansmann, A.; Baars, H.; Tesche, M.; Müller, D.; Althausen, D.; Engelmann, R.; Pauliquevis, T.; Artaxo, P. Dust and Smoke Transport from Africa to South America: Lidar Profiling over Cape Verde and the Amazon Rainforest. Geophys. Res. Lett. 2009, 36, L11802. [Google Scholar] [CrossRef] [Scilit]
- Fiedler, S.; Schepanski, K.; Heinold, B.; Knippertz, P.; Tegen, I. Climatology of Nocturnal Low-Level Jets over North Africa and Implications for Modeling Mineral Dust Emission. J. Geophys. Res.-Atmos. 2013, 118, 6100–6121. [Google Scholar] [CrossRef] [Scilit] [PubMed]
- Proestakis, E.; Papachristopoulou, K.; Georgiou, T.; Chatoutsidou, S.E.; Lazaridis, M.; Gkikas, A.; Fountoulakis, I.; Tsikoudi, I.; Petrakis, M.P.; Amiridis, V. Atmospheric Dust and Air Quality over Large-Cities and Megacities of the World. Atmos. Chem. Phys. 2025, 25, 14777–14823. [Google Scholar] [CrossRef] [Scilit]
- Gkikas, A.; Basart, S.; Hatzianastassiou, N.; Marinou, E.; Amiridis, V.; Kazadzis, S.; Pey, J.; Querol, X.; Jorba, O.; Gassó, S.; et al. Mediterranean Intense Desert Dust Outbreaks and Their Vertical Structure Based on Remote Sensing Data. Atmos. Chem. Phys. 2016, 16, 8609–8642. [Google Scholar] [CrossRef] [Scilit]
- Yu, H.; Chin, M.; Yuan, T.; Bian, H.; Remer, L.A.; Prospero, J.M.; Omar, A.; Winker, D.; Yang, Y.; Zhang, Y.; et al. The Fertilizing Role of African Dust in the Amazon Rainforest: A First Multiyear Assessment Based on Data from Cloud-Aerosol Lidar and Infrared Pathfinder Satellite Observations. Geophys. Res. Lett. 2015, 42, 1984–1991. [Google Scholar] [CrossRef] [Scilit]
- Ginoux, P.; Prospero, J.M.; Gill, T.E.; Hsu, N.C.; Zhao, M. Global-Scale Attribution of Anthropogenic and Natural Dust Sources and Their Emission Rates Based on Modis Deep Blue Aerosol Products. Rev. Geophys. 2012, 50, RG3005. [Google Scholar] [CrossRef] [Scilit]
- Hamidi, M.; Kavianpour, M.R.; Shao, Y. Synoptic Analysis of Dust Storms in the Middle East. Asia-Pac. J. Atmos. Sci. 2013, 49, 279–286. [Google Scholar] [CrossRef] [Scilit]
- Vinoj, V.; Rasch, P.J.; Wang, H.; Yoon, J.-H.; Ma, P.-L.; Landu, K.; Singh, B. Short-Term Modulation of Indian Summer Monsoon Rainfall by West Asian Dust. Nat. Geosci. 2014, 7, 308–313. [Google Scholar] [CrossRef] [Scilit]
- Karami, S.; Ranjbar, A.; Mohebalhojeh, A.R.; Moradi, M. A Rare Case of Haboob in Tehran: Observational and Numerical Study. Atmos. Res. 2017, 185, 169–185. [Google Scholar] [CrossRef] [Scilit]
- Liu, Z.; Liu, D.; Huang, J.; Vaughan, M.; Uno, I.; Sugimoto, N.; Kittaka, C.; Trepte, C.; Wang, Z.; Hostetler, C.; et al. Airborne Dust Distributions over the Tibetan Plateau and Surrounding Areas Derived from the First Year of CALIPSO Lidar Observations. Atmos. Chem. Phys. 2008, 8, 5045–5060. [Google Scholar] [CrossRef] [Scilit]
- Gong, S.L.; Zhang, X.Y.; Zhao, T.L.; Zhang, X.B.; Barrie, L.A.; McKendry, I.G.; Zhao, C.S. A Simulated Climatology of Asian Dust Aerosol and Its Trans-Pacific Transport. Part II: Interannual Variability and Climate Connections. J. Clim. 2006, 19, 104–122. [Google Scholar] [CrossRef] [Scilit]
- Uno, I.; Eguchi, K.; Yumimoto, K.; Takemura, T.; Shimizu, A.; Uematsu, M.; Liu, Z.; Wang, Z.; Hara, Y.; Sugimoto, N. Asian Dust Transported One Full Circuit around the Globe. Nat. Geosci. 2009, 2, 557–560. [Google Scholar] [CrossRef] [Scilit]
- Huang, J.P.; Liu, J.J.; Chen, B.; Nasiri, S.L. Detection of Anthropogenic Dust Using CALIPSO Lidar Measurements. Atmos. Chem. Phys. 2015, 15, 11653–11665. [Google Scholar] [CrossRef] [Scilit]
- McConnell, J.R.; Aristarain, A.J.; Banta, J.R.; Edwards, P.R.; Simões, J.C. 20th-century doubling in dust archived in an Antarctic Peninsula ice core parallels climate change and desertification in South America. Proc. Natl. Acad. Sci. USA 2007, 104, 5743–5748. [Google Scholar] [CrossRef] [Scilit] [PubMed]
- Mazzonia, E.; Vazquez, M. Desertification in Patagonia. In Natural Hazards and Human-Exacerbated Disasters in Latin America; Latrubesse, E.M., Ed.; Elsevier: Amsterdam, The Netherlands, 2009; Volume 13, pp. 351–377. [Google Scholar] [CrossRef] [Scilit]
- Eckardt, F.D.; Kuring, N. SeaWiFS identifies dust sources in the Namib Desert. Int. J. Remote Sens. 2005, 26, 4159–4167. [Google Scholar] [CrossRef] [Scilit]
- Bryant, R.G.; Bigg, G.R.; Mahowald, N.M.; Eckardt, F.D.; Ross, S.G. Dust Emission Response to Climate in Southern Africa. J. Geophys. Res. Atmos. 2007, 112, D09207. [Google Scholar] [CrossRef] [Scilit]
- Vickery, K.J.; Eckardt, F.D.; Bryant, R.G. A Sub-Basin Scale Dust Plume Source Frequency Inventory for Southern Africa, 2005–2008. Geophys. Res. Lett. 2013, 40, 5274–5279. [Google Scholar] [CrossRef] [Scilit]
- Penner, J.E.; Charlson, R.J.; Hales, J.M.; Laulainen, N.S.; Leifer, R.; Novakov, T.; Ogren, J.; Radke, L.F.; Schwartz, S.E.; Travis, L. Quantifying and Minimizing Uncertainty of Climate Forcing by Anthropogenic Aerosols. Bull. Am. Meteorol. Soc. 1994, 75, 375–400. [Google Scholar] [CrossRef] [Scilit]
- Tegen, I.; Fung, I. Contribution to the Atmospheric Mineral Aerosol Load from Land Surface Modification. J. Geophys. Res. 1995, 100, 18707–18726. [Google Scholar] [CrossRef] [Scilit]
- Joshi, J.R. Quantifying the Impact of Cropland Wind Erosion on Air Quality: A High-Resolution Modeling Case Study of an Arizona Dust Storm. Atmos. Environ. 2021, 263, 118658. [Google Scholar] [CrossRef] [Scilit]
- Moulin, C.; Chiapello, I. Impact of Human-Induced Desertification on the Intensification of Sahel Dust Emission and Export over the Last Decades. Geophys. Res. Lett. 2006, 33, L18808. [Google Scholar] [CrossRef] [Scilit]
- Chen, S.; Jiang, N.; Huang, J.; Xu, X.; Zhang, H.; Zang, Z.; Huang, K.; Xu, X.; Wei, Y.; Guan, X.; et al. Quantifying Contributions of Natural and Anthropogenic Dust Emission from Different Climatic Regions. Atmos. Environ. 2018, 191, 94–104. [Google Scholar] [CrossRef] [Scilit]
- Tegen, I.; Lacis, A.A.; Fung, I. The Influence on Climate Forcing of Mineral Aerosols from Disturbed Soils. Nature 1996, 380, 419–422. [Google Scholar] [CrossRef] [Scilit]
- Chen, S.; Jiang, N.; Huang, J.; Zang, Z.; Guan, X.; Ma, X.; Luo, Y.; Li, J.; Zhang, X.; Zhang, Y. Estimations of Indirect and Direct Anthropogenic Dust Emission at the Global Scale. Atmos. Environ. 2019, 200, 50–60. [Google Scholar] [CrossRef] [Scilit]
- Pey, J.; Querol, X.; Alastuey, A.; Forastiere, F.; Stafoggia, M. African dust outbreaks over the Mediterranean Basin during 2001–2011: PM10 concentrations, phenomenology and trends, and its relation with synoptic and mesoscale meteorology. Atmos. Chem. Phys. 2013, 13, 1395–1410. [Google Scholar] [CrossRef] [Scilit]
- Querol, X.; Pey, J.; Pandolfi, M.; Alastuey, A.; Cusack, M.; Pérez, N.; Moreno, T.; Viana, M.; Mihalopoulos, N.; Kallos, G.; et al. African Dust Contributions to Mean Ambient PM10 Mass-Levels across the Mediterranean Basin. Atmos. Environ. 2009, 43, 4266–4277. [Google Scholar] [CrossRef] [Scilit]
- Stafoggia, M.; Zauli-Sajani, S.; Pey, J.; Samoli, E.; Alessandrini, E.; Basagaña, X.; Cernigliaro, A.; Chiusolo, M.; Demaria, M.; Díaz, J.; et al. Desert Dust Outbreaks in Southern Europe: Contribution to Daily PM10 Concentrations and Short-Term Associations with Mortality and Hospital Admissions. Environ. Health Perspect. 2016, 124, 413–419. [Google Scholar] [CrossRef] [Scilit] [PubMed]
- Huneeus, N.; Schulz, M.; Balkanski, Y.; Griesfeller, J.; Prospero, J.; Kinne, S.; Bauer, S.; Boucher, O.; Chin, M.; Dentener, F.; et al. Global Dust Model Intercomparison in AeroCom Phase I. Atmos. Chem. Phys. 2011, 11, 7781–7816. [Google Scholar] [CrossRef] [Scilit]
- Kok, J.F.; Ridley, D.A.; Zhou, Q.; Miller, R.L.; Zhao, C.; Heald, C.L.; Ward, D.S.; Albani, S.; Haustein, K. Smaller Desert Dust Cooling Effect Estimated from Analysis of Dust Size and Abundance. Nat. Geosci. 2017, 10, 274–278. [Google Scholar] [CrossRef] [Scilit] [PubMed]
- Kok, J.F.; Adebiyi, A.A.; Albani, S.; Balkanski, Y.; Checa-Garcia, R.; Chin, M.; Colarco, P.R.; Hamilton, D.S.; Huang, Y.; Ito, A.; et al. Contribution of the World’s Main Dust Source Regions to the Global Cycle of Desert Dust. Atmos. Chem. Phys. Discuss. 2021, 21, 8169–8193. [Google Scholar] [CrossRef] [Scilit]
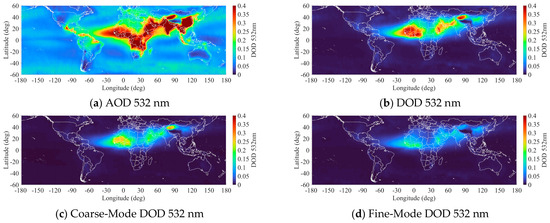
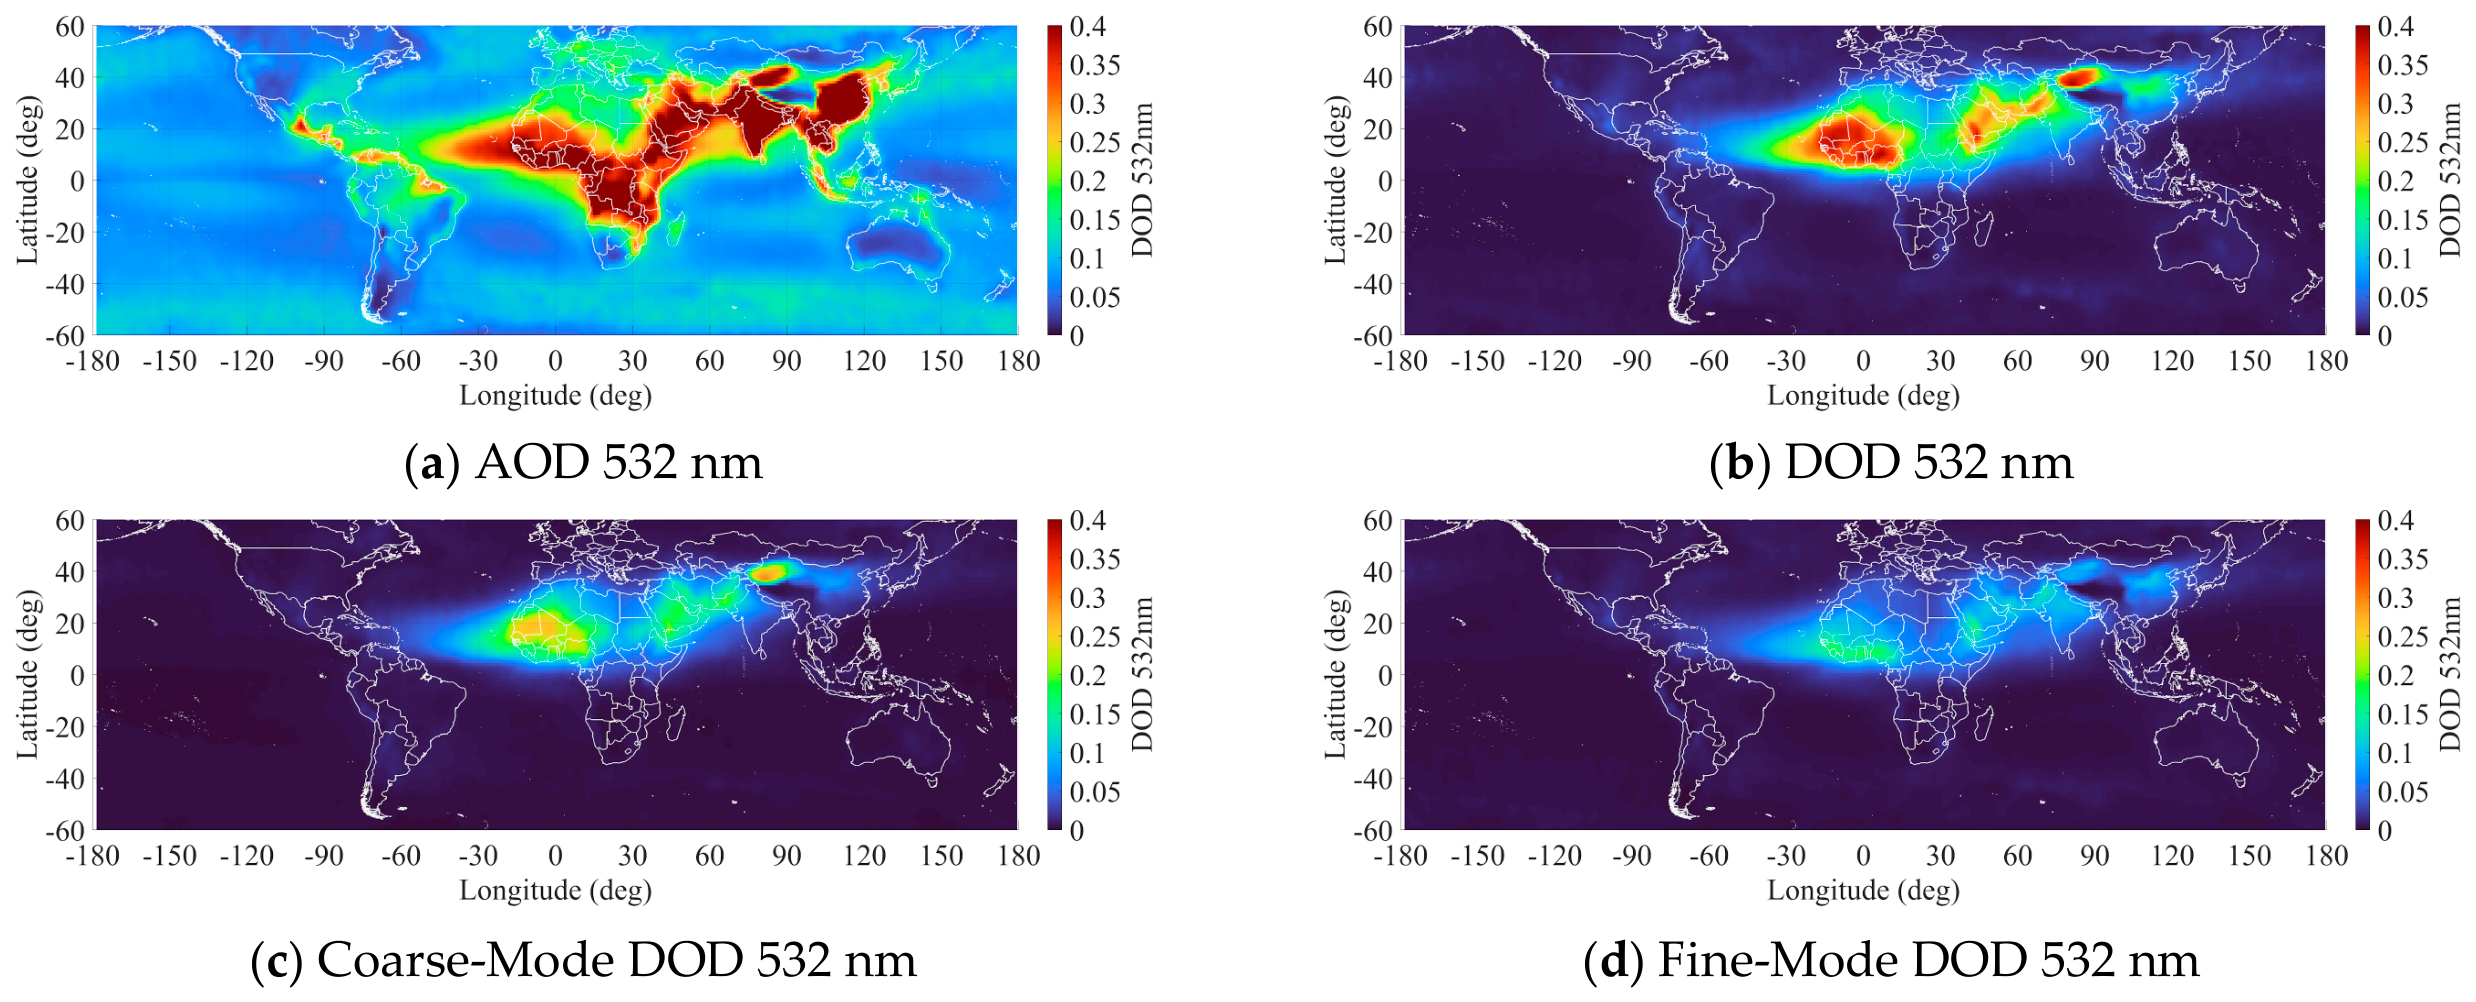
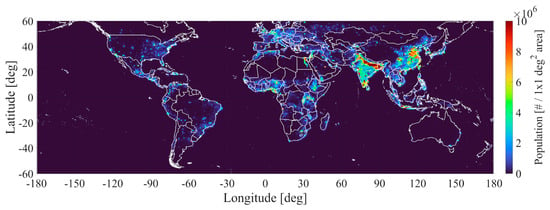
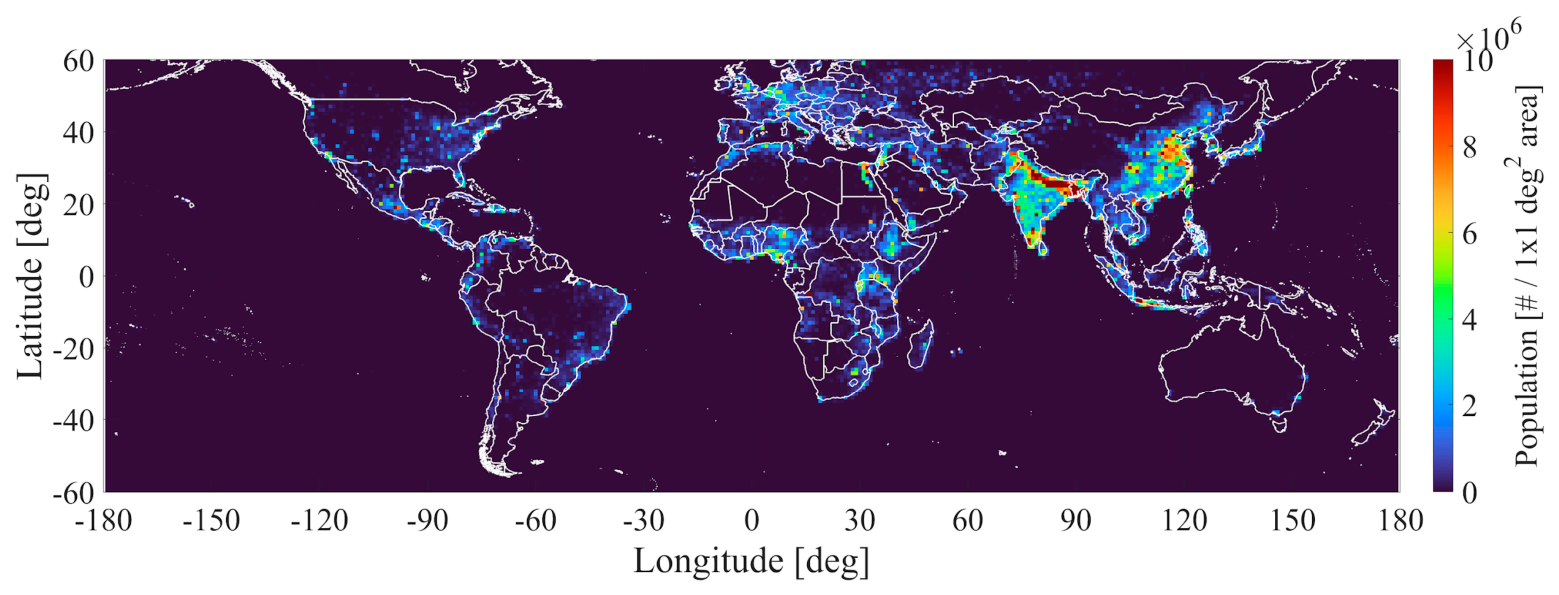
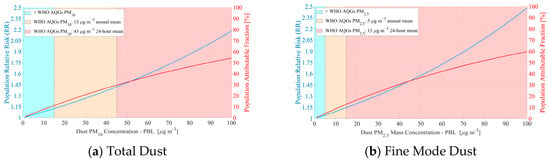
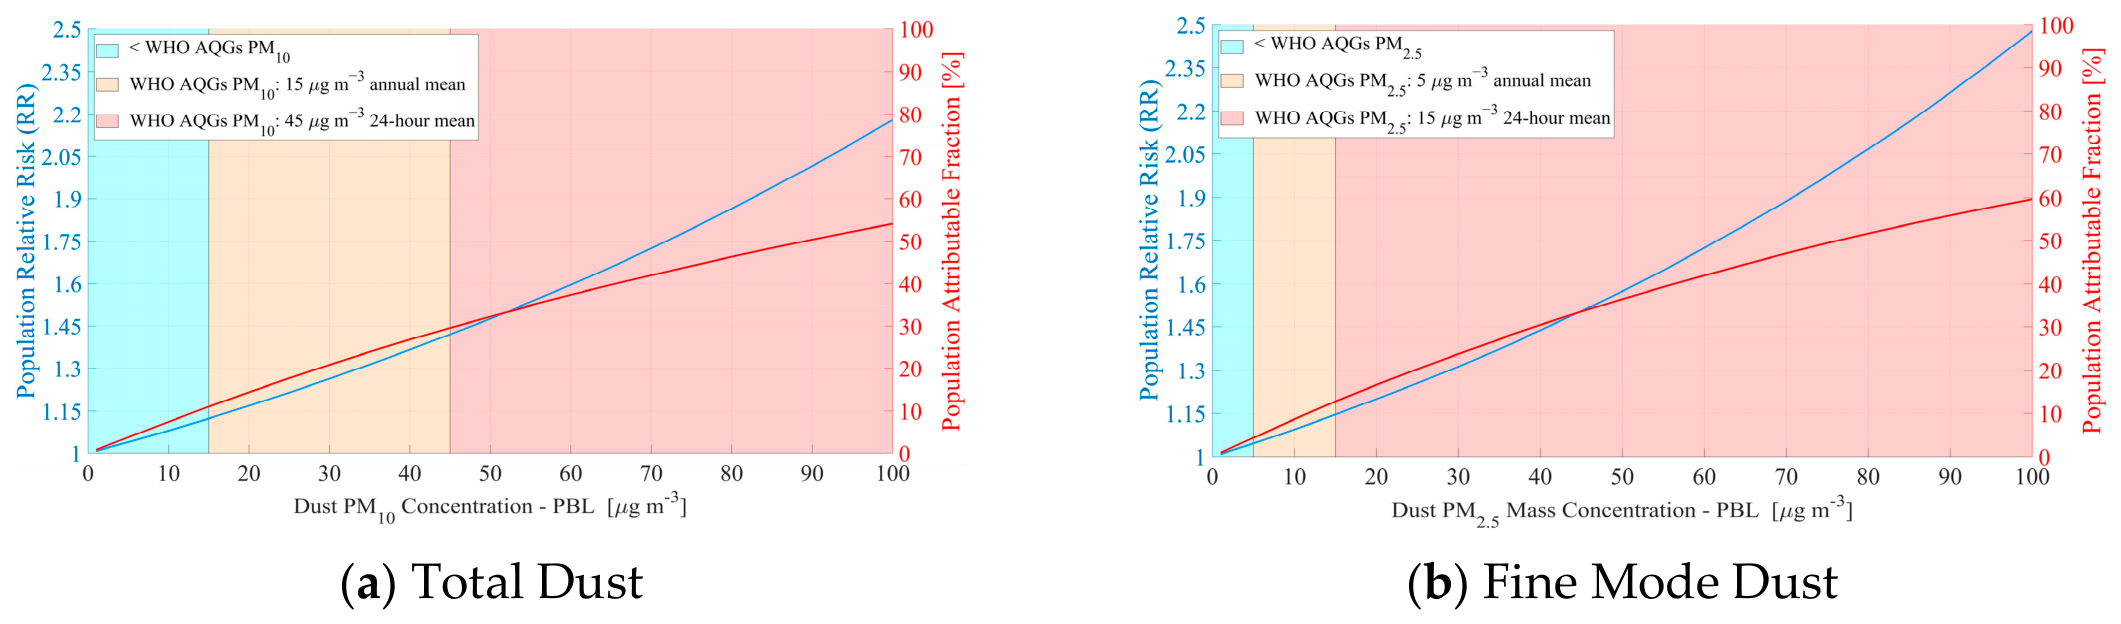
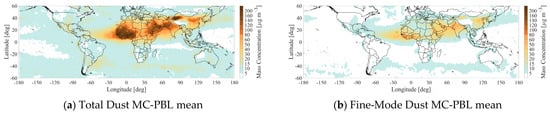
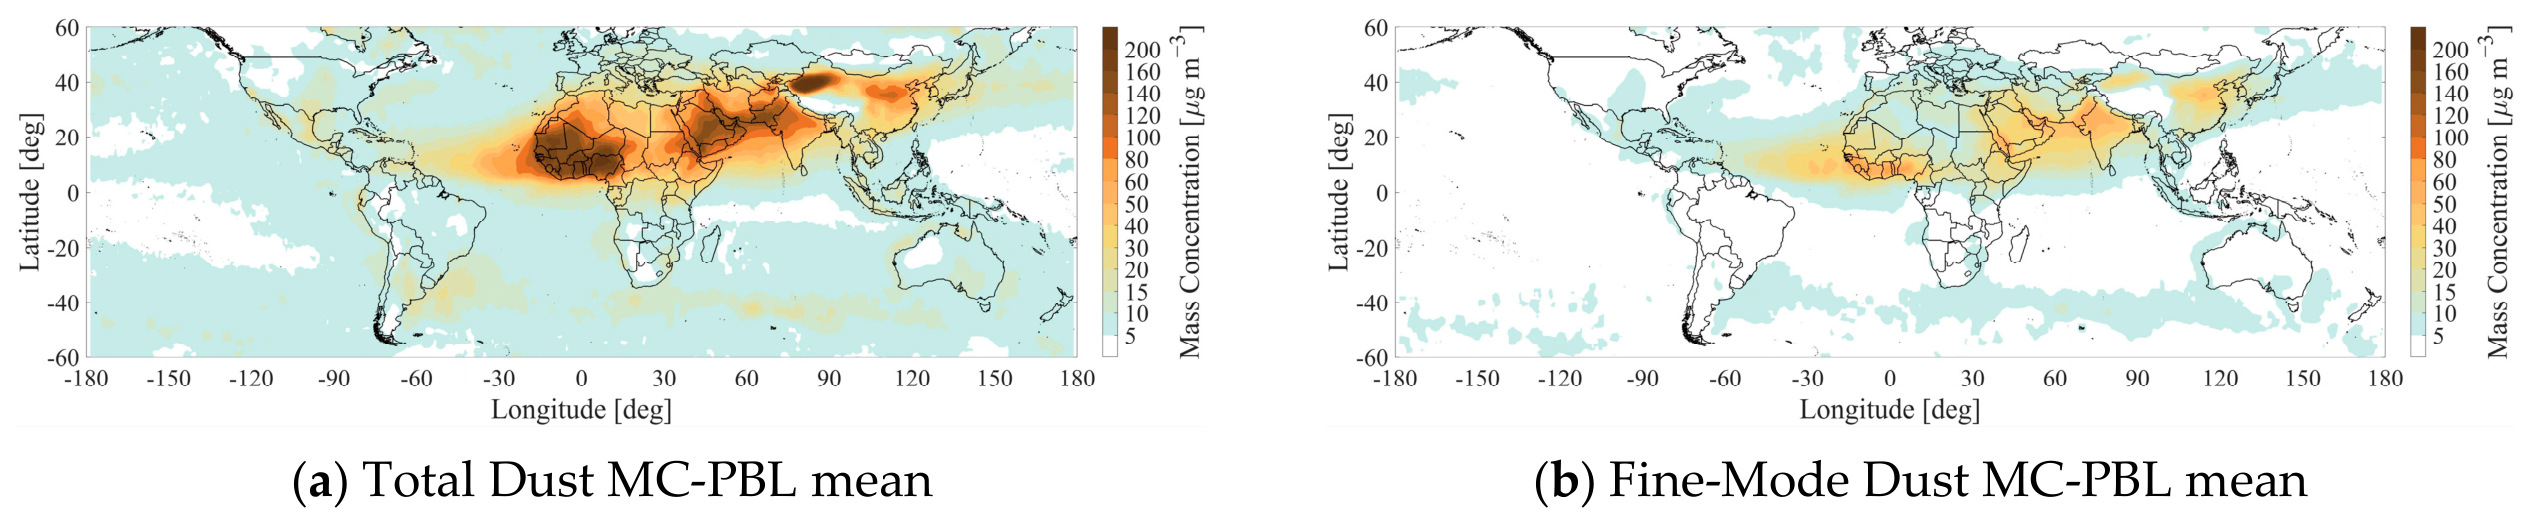
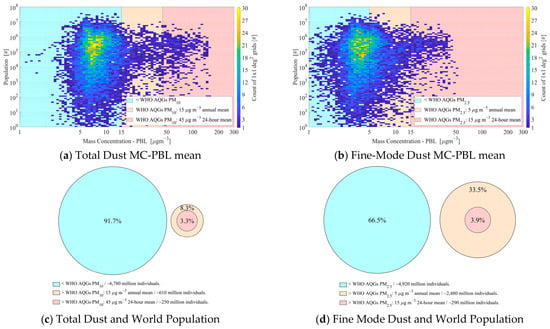
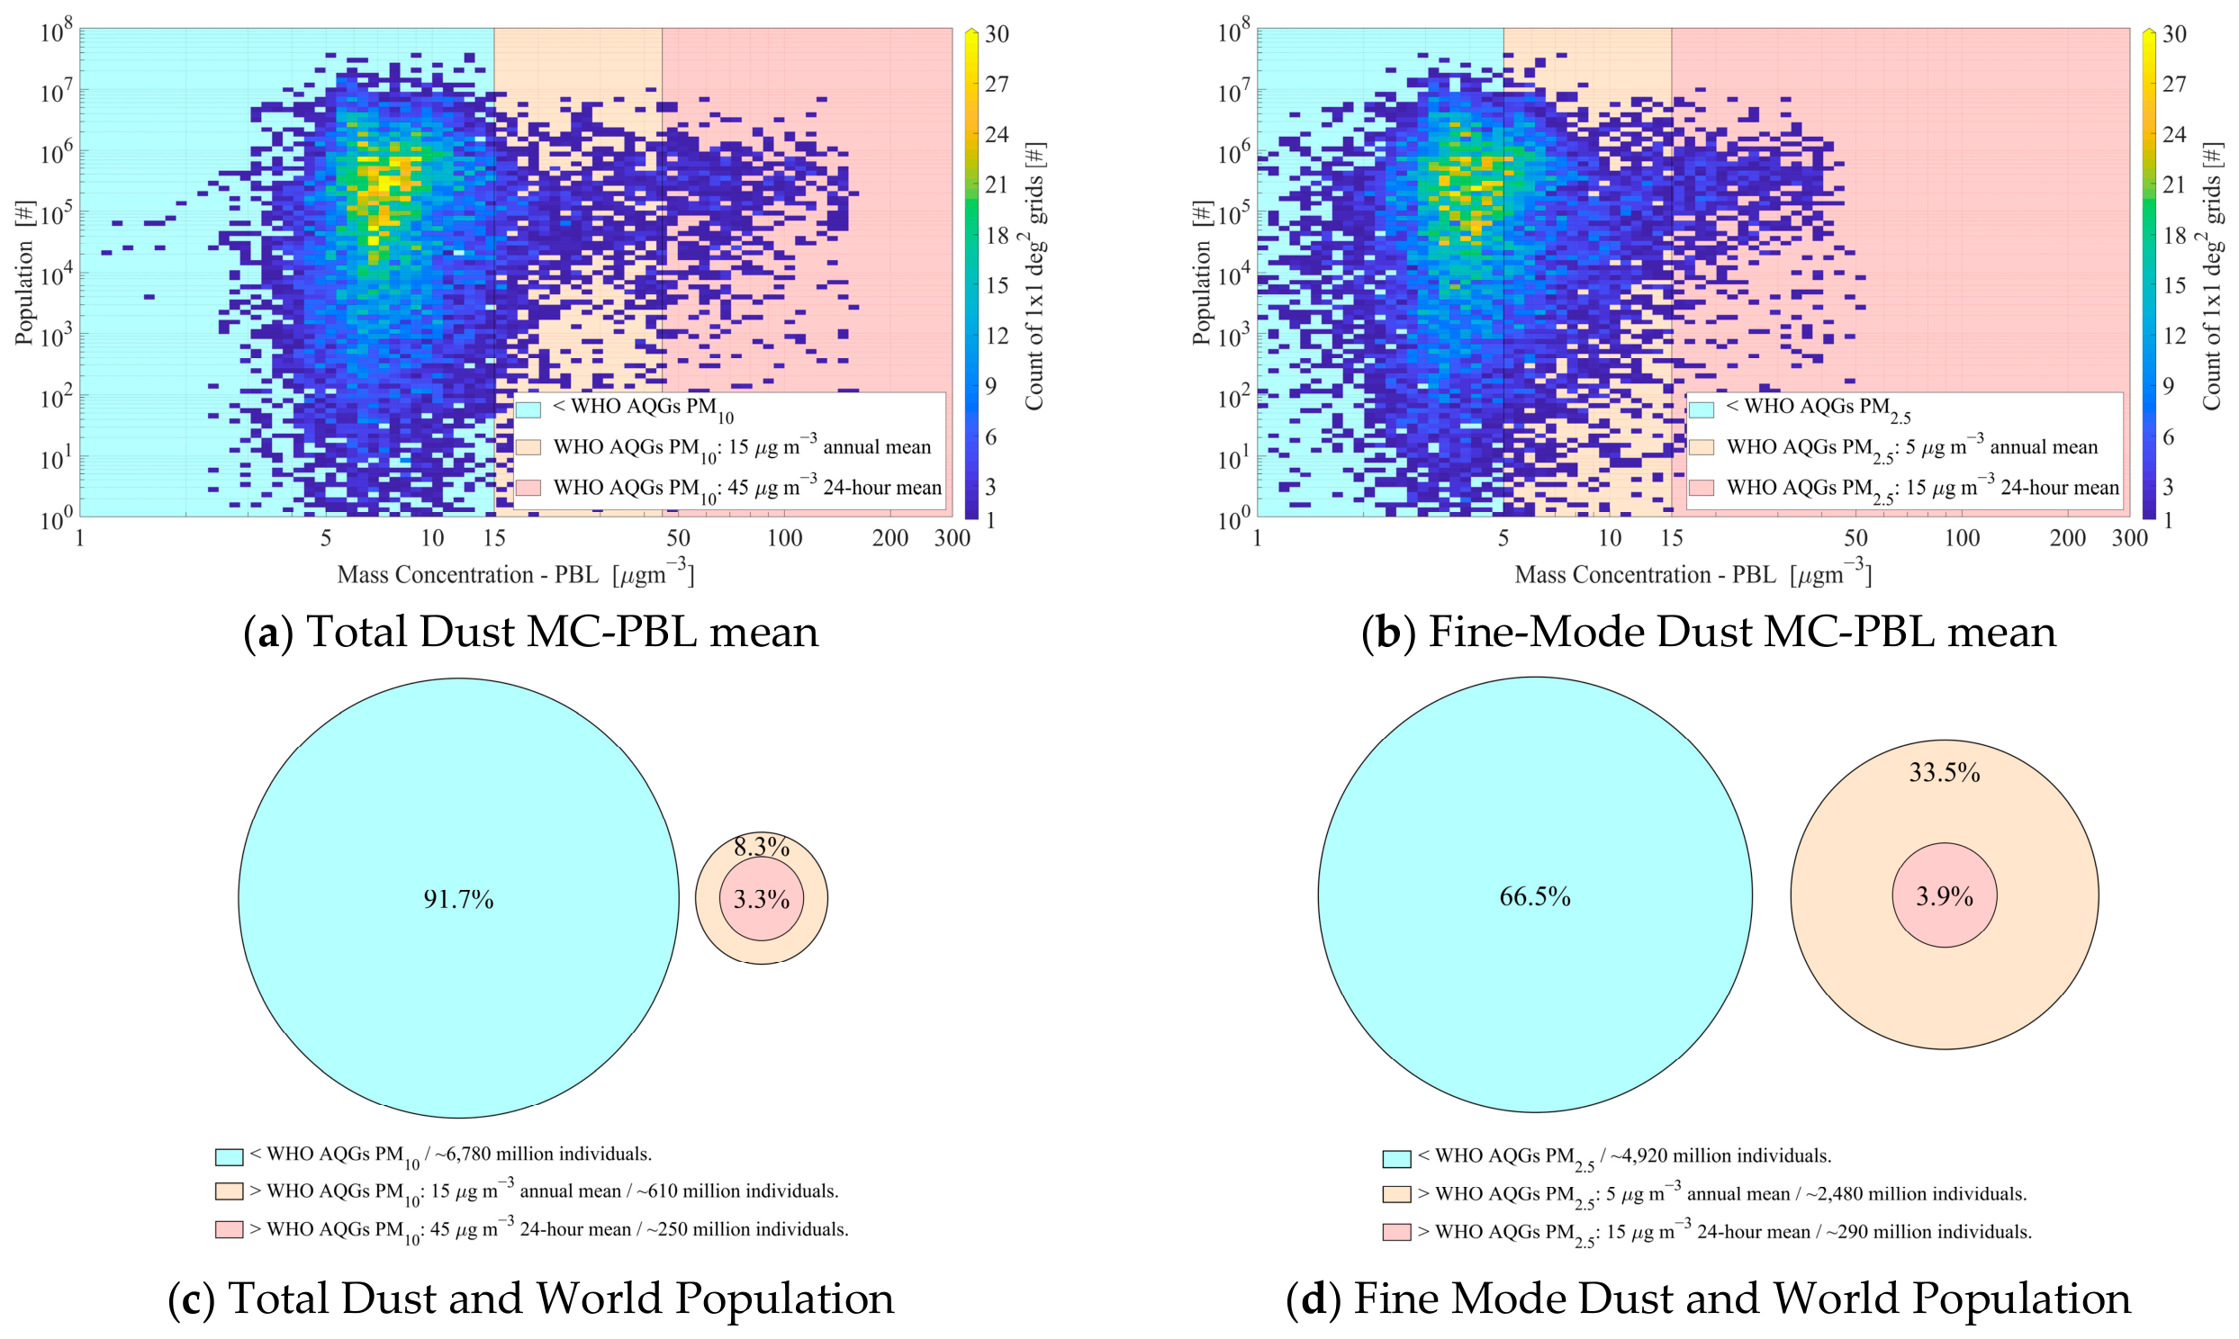
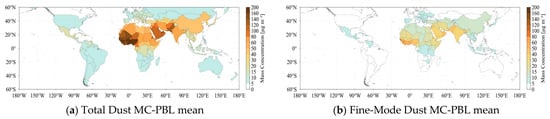
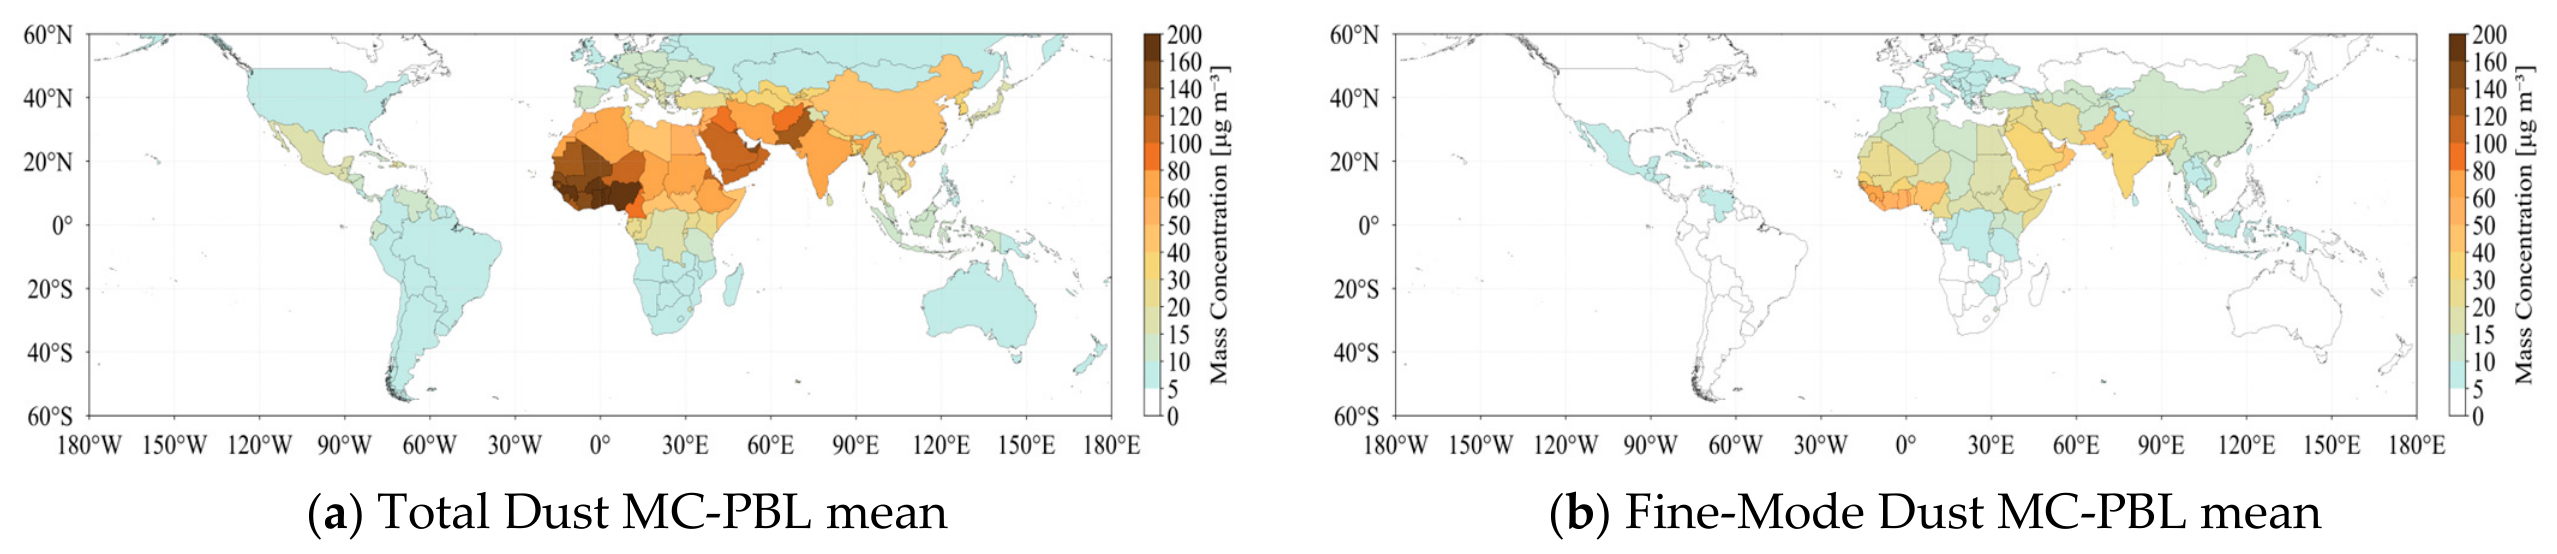
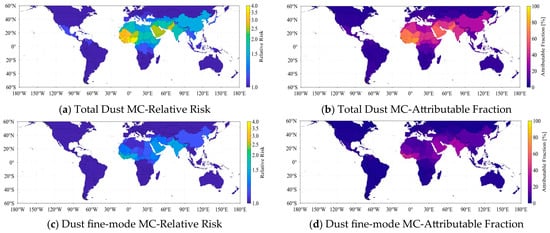
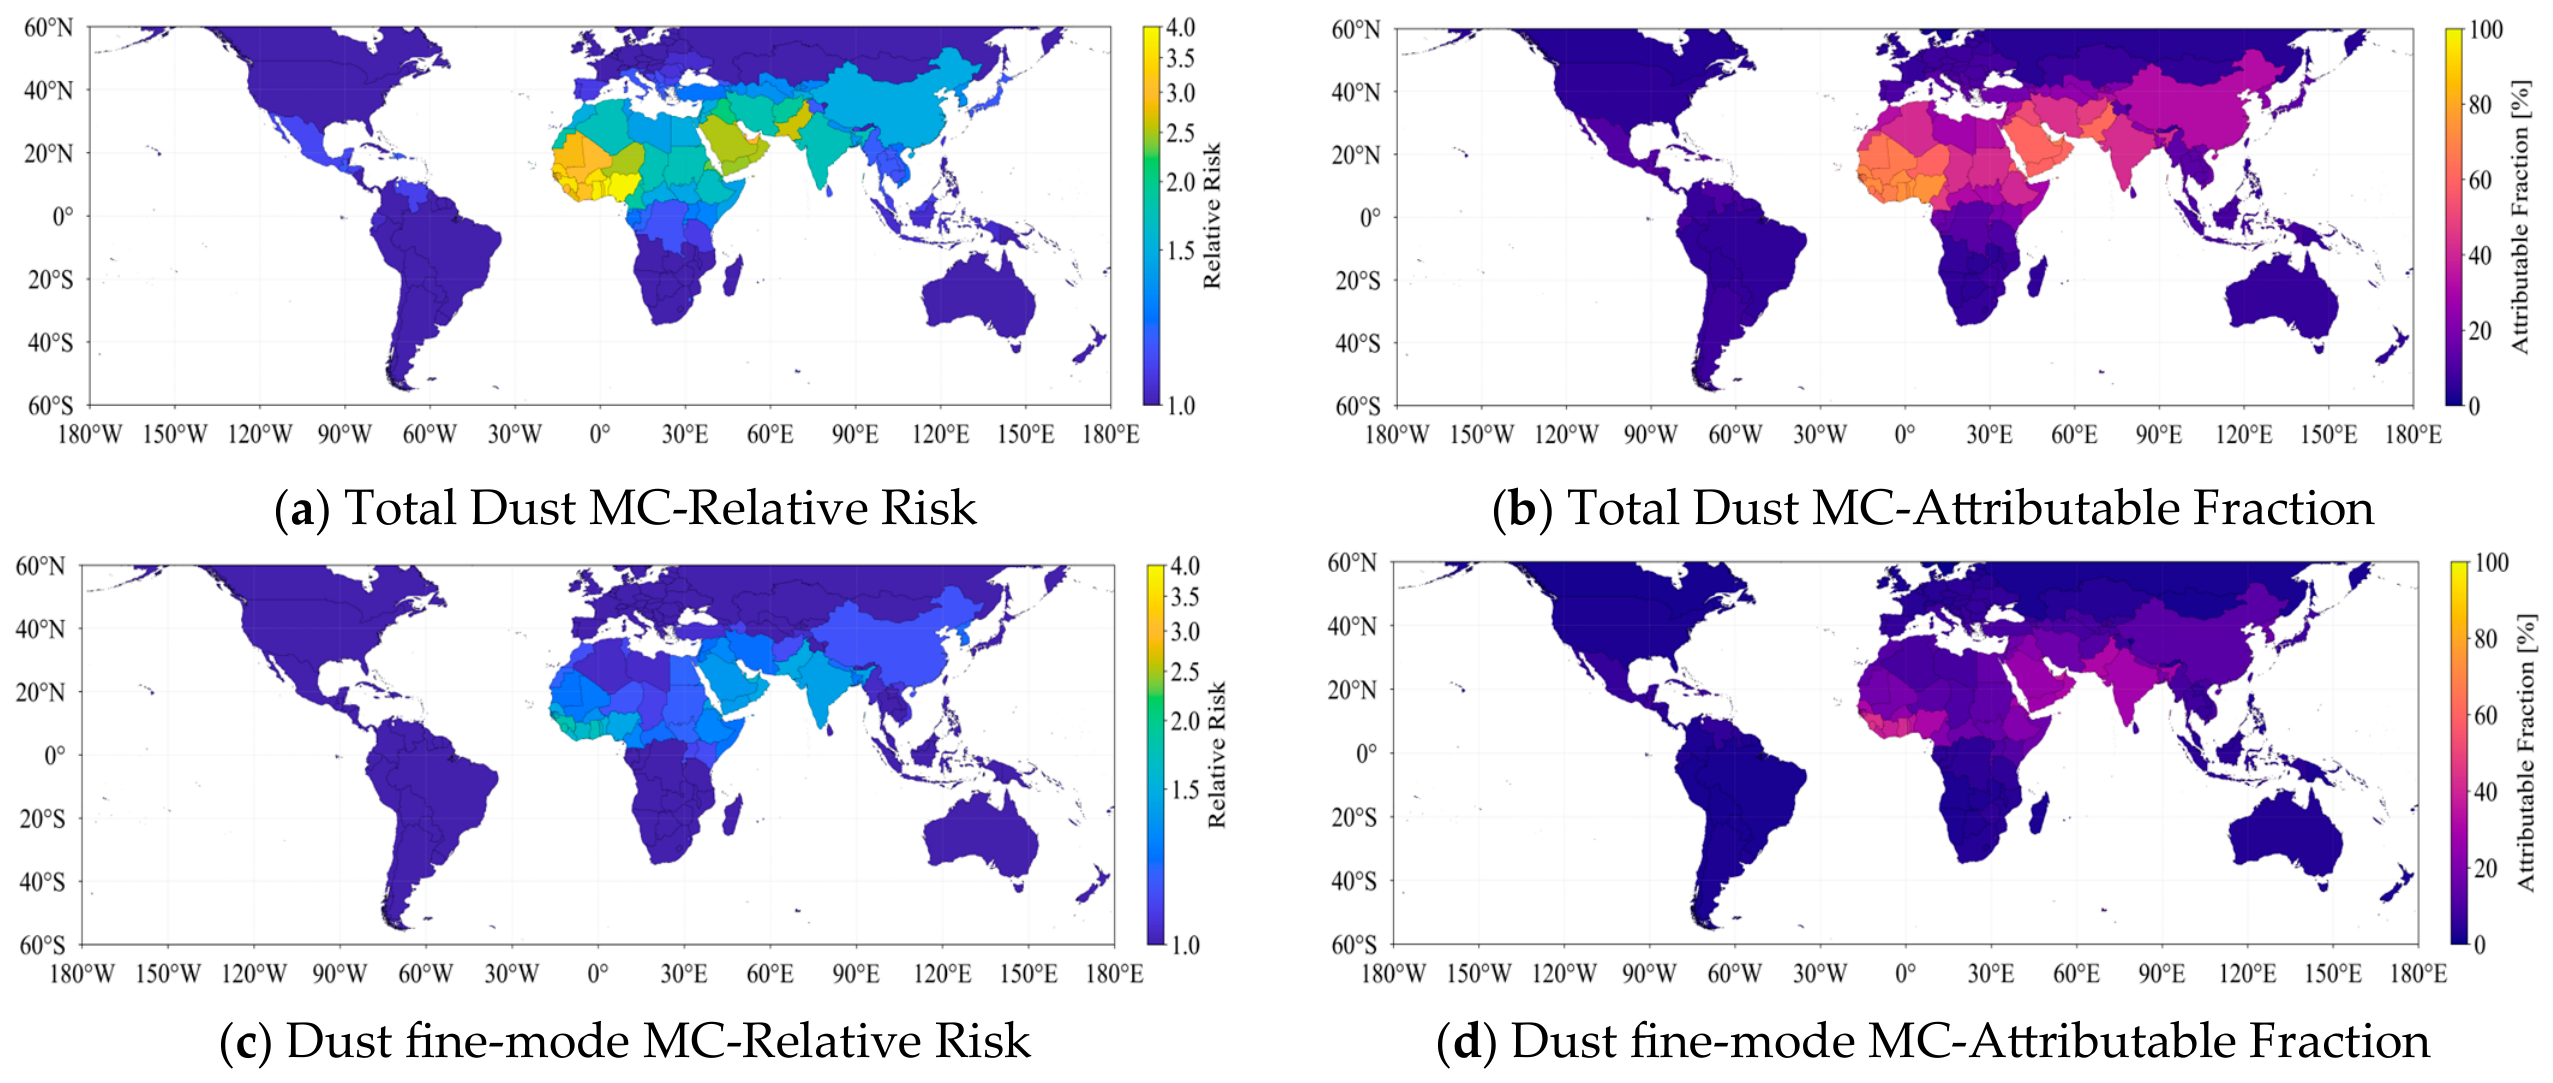
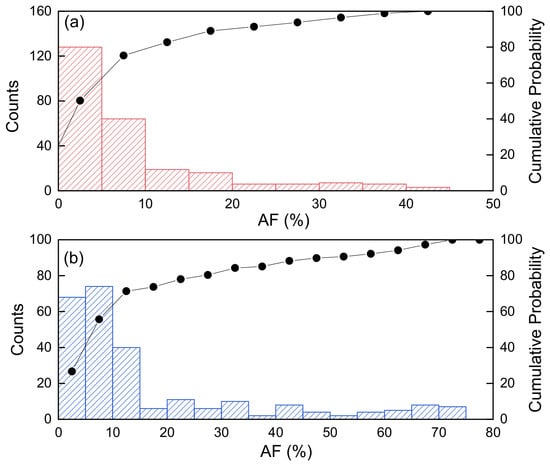
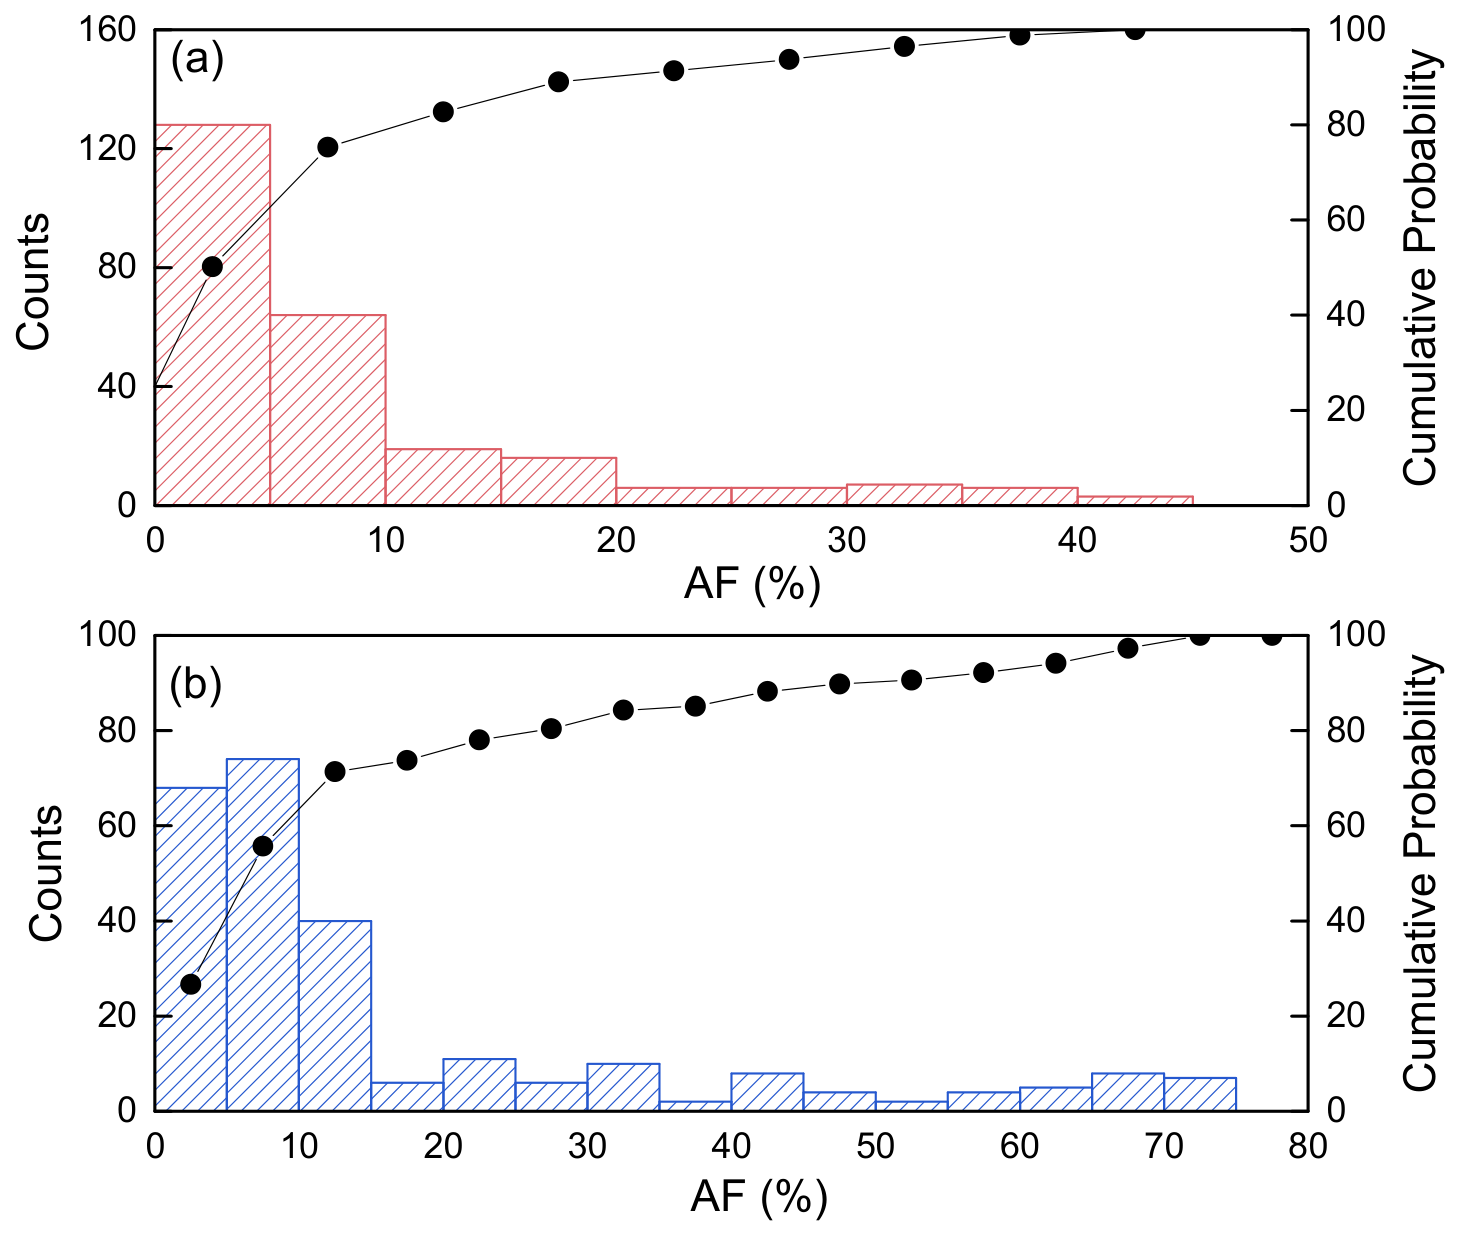
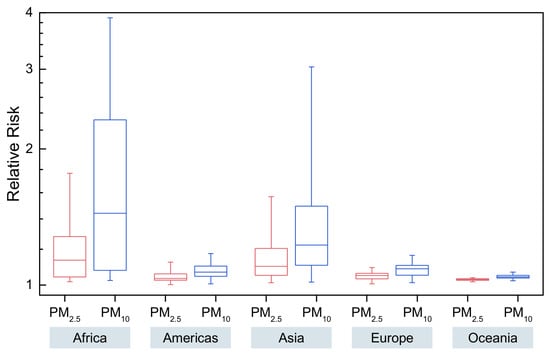
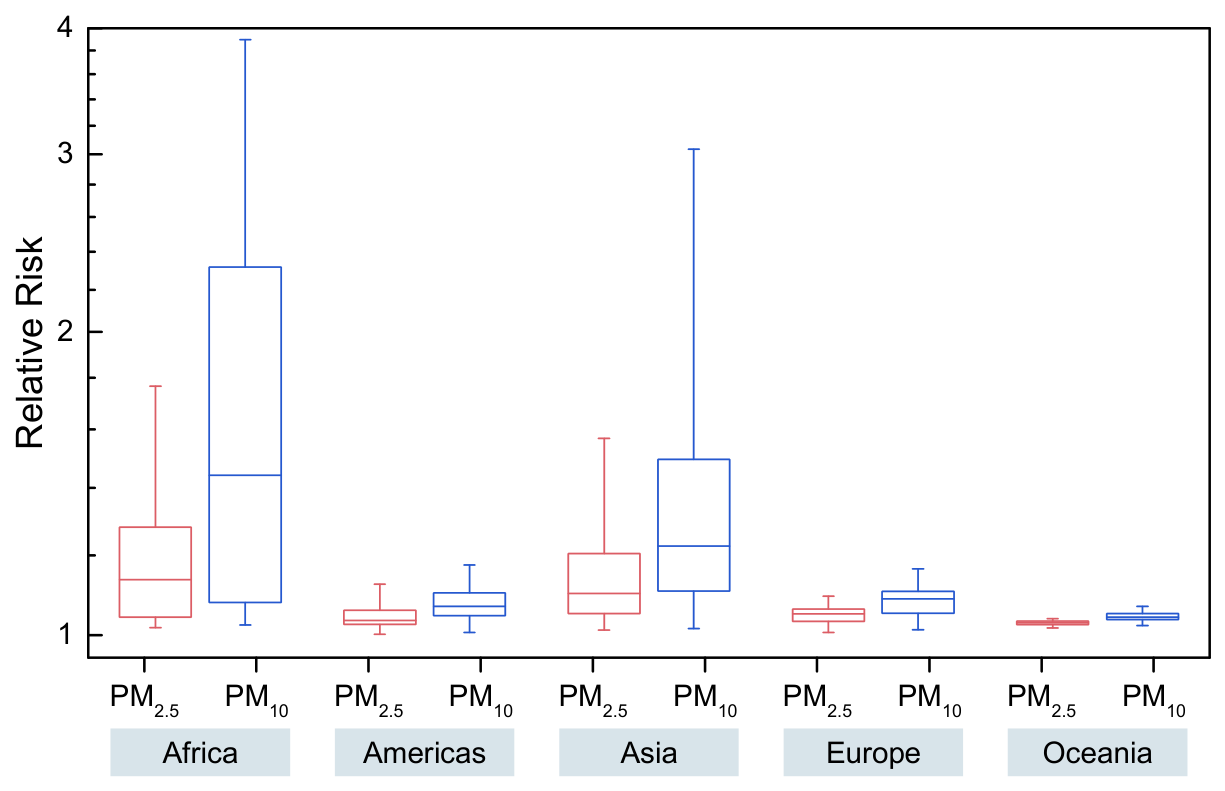
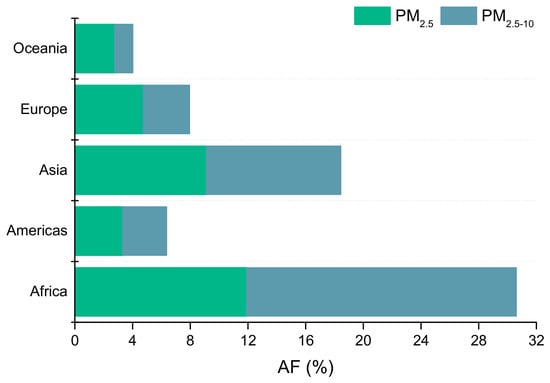
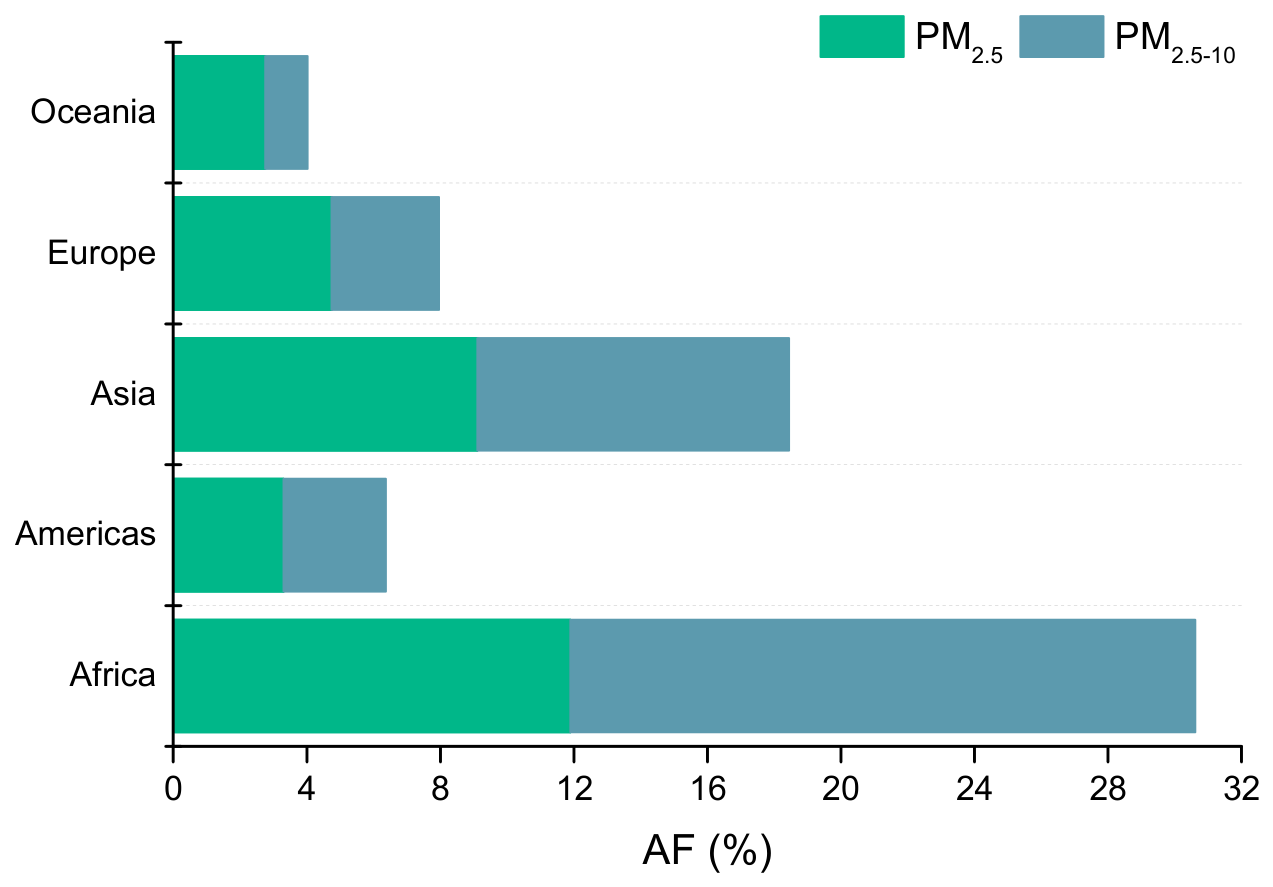

Disclaimer/Publisher’s Note: The statements, opinions and data contained in all publications are solely those of the individual author(s) and contributor(s) and not of MDPI and/or the editor(s). MDPI and/or the editor(s) disclaim responsibility for any injury to people or property resulting from any ideas, methods, instructions or products referred to in the content. |
© 2026 by the authors. Licensee MDPI, Basel, Switzerland. This article is an open access article distributed under the terms and conditions of the Creative Commons Attribution (CC BY) license.