


Highlights
What are the main findings?
- Cloud optical thickness and effective radius are key determinants of fire detectability.
- Fire detection probability drops sharply when COT > 50, with optimal CER around 15–20 μm.
- The XGBoost forest fire monitoring model improves thick-cloud fire detection F1-score by 9%.
What are the implications of the main findings?
- Reduces fire detection omission and false alarm rates under clouds and at edges.
- The model enables reliable fire monitoring in cloudy southern China.
- This study provides a theoretical basis for satellite fire detection under cloudy conditions.
Abstract
In recent years, global warming has increased forest fire frequency. Satellite remote sensing has become a key monitoring tool; however, cloud cover severely limits detection accuracy by causing omission and commission errors. To overcome this limitation, this study aims to use Himawari-8/9 multi-source data; this study introduces cloud optical thickness (COT) and cloud effective radius (CER) as core cloud parameters and incorporates surface downward shortwave radiation to develop a cloud-constrained XGBoost forest fire monitoring model. A multi-spectral threshold method with the cloud product (CLP) was applied for cloud identification and typing, and key cloud indicators were derived from COT and CER. A feature set comprising brightness temperatures, cloud parameters with neighborhood statistics, and radiation normalization features was constructed to train and compare XGBoost, random forest, and logistic regression models. Feature importance, partial dependence, and SHAP value analyses quantitatively revealed the nonlinear attenuation mechanisms of cloud parameters, and optimization strategies such as dynamic threshold adjustment were proposed. The XGBoost model achieved the best performance, with an overall AUC of 0.968 and a 9.0% improvement in F1-score over thick cloud regions after joint optimization and validation against the Himawari-8/9 WLF product. These results demonstrate that the proposed model effectively enhances forest fire monitoring accuracy under complex cloud conditions, providing a technical and theoretical basis for precise fire detection in cloudy environments. The novelty of this study lies in the explicit incorporation of COT and CER as physical constraints, the systematic elucidation of their nonlinear effects, and the provision of a technical and theoretical basis for precise fire detection under cloudy environments.
1. Introduction
Forest fires are major natural disasters that affect the stability of forest ecosystems. Characterized by sudden onset, rapid spread, and extensive coverage, they not only disrupt ecological balance but also threaten human lives and property [1]. Satellite remote sensing has become a core technology for forest fire monitoring. Among available platforms, the Himawari-8/9 geostationary meteorological satellites, with a high temporal resolution of 10 min, have demonstrated remarkable advantages in continuous regional monitoring [2,3].
Satellite platforms used for forest fire monitoring can be divided into two categories based on orbital altitude: polar orbiting and geostationary satellites. Polar orbiting satellites operate in sun-synchronous orbits at altitudes of approximately 700–800 km, offering relatively high spatial resolutions (tens to hundreds of meters). Representative sensors include NOAA/AVHRR, EOS/MODIS, VIIRS, and Landsat/TIRS [4,5]. These satellites typically observe the same area only 2–4 times per day. Although they perform well in land cover characterization and burned area assessment due to finer spatial detail, their low temporal resolution cannot meet the demands of continuous tracking and rapid response required for forest fire monitoring [6]. In contrast, geostationary satellites operate in geosynchronous orbits at approximately 35,800 km above the equator, enabling high-frequency observations of fixed regions at minute-level intervals. Typical platforms include the GOES series, MSG/SEVIRI, and Himawari-8/9 [7]. The Advanced Himawari Imager (AHI) onboard Himawari-8/9 provides full-disk scans every 10 min and a spatial resolution of 2 km in the mid-infrared channel, making it an important data source for dynamic forest fire monitoring in the East Asia–Western Pacific region [8,9,10]. Cloud cover exhibits pronounced spatiotemporal dynamics; intermittent windows of thin cloud cover often last only tens of minutes. High-frequency observations from geostationary satellites such as Himawari-8/9 can therefore provide richer and more stable sample sequences [11,12].
Existing forest fire hotspot detection methods can be broadly classified into three categories: traditional threshold and contextual algorithms, machine learning methods, and deep learning methods. Among traditional approaches, fixed-threshold methods identify fire hotspots by applying brightness temperature thresholds in specific spectral bands, but they struggle to accommodate the spatial heterogeneity of land surface temperatures [13,14,15]. Contextual algorithms improve detection accuracy by comparing the brightness temperature of a target pixel with that of its background. A representative work is the improved contextual algorithm proposed by Giglio et al., which has been adopted for the operational production of MODIS fire products [16]. Machine learning-based methods, such as support vector machines and random forests, can automatically learn feature differences between fire and non-fire pixels from training samples, thereby improving classification accuracy [17,18,19]. In recent years, deep learning methods such as CNNs and the YOLO series have achieved notable progress in extracting flame and smoke features [20,21,22]. Nevertheless, these methods still face severe challenges under cloud-covered conditions.
Cloud cover is one of the most significant sources of uncertainty in satellite-based fire detection [23,24]. Cloud obstruction directly attenuates the high-temperature signals from the surface, distorts spectral features, and causes a loss of effective observational information, frequently leading to omission and commission errors in hotspot identification [25]. Traditional algorithms typically process only clear-sky pixels after identifying those contaminated by clouds, leaving cloud-covered areas as blind zones for fire detection [26]. To address this issue, some studies have attempted to fill observation gaps caused by cloud obstruction through land surface temperature reconstruction or to estimate potential fire probabilities by constructing cloud obstruction correction models. However, existing research has largely focused on cloud detection and cloud removal, with insufficient attention to the detectability of fire information in the presence of clouds [27]. There is a lack of systematic understanding of how cloud parameters nonlinearly attenuate the thermal radiation signals of fires, resulting in limited generalization ability of algorithms under cloudy conditions [28]. Despite the variety of detection algorithms available, existing cloud-adaptive fire detection methods generally follow two main approaches: cloud masking/removal techniques that attempt to fill observational gaps through interpolation, and empirical correction models that adjust fire probabilities without explicit physical constraints. This study differs from these approaches by explicitly introducing cloud optical thickness (COT) and cloud effective radius (CER) as physical constraints within an XGBoost framework, enabling systematic quantification of cloud-induced signal attenuation. From a radiative transfer perspective, cloud optical thickness (COT) and cloud effective radius (CER) jointly govern the attenuation of surface-emitted thermal radiation in the mid-infrared region: COT quantifies the total extinction along the optical path, while CER determines the single-scattering properties that control scattering directionality [29]. These two parameters have been widely adopted as the primary descriptors of cloud radiative effects in both operational cloud products and infrared retrieval algorithms [30]. Despite their physical significance, COT and CER have rarely been exploited to improve fire detection under cloudy conditions. Specifically, cloud removal methods that rely on spatial or temporal interpolation tend to smooth out thermal anomalies and cannot recover the attenuated fire signal, frequently missing small or short-lived fires. Cloud correction models, on the other hand, are often built upon empirical statistical relationships without incorporating cloud microphysical properties, resulting in limited physical interpretability and poor generalization across different cloud regimes.
Building on previous research, this paper focuses on the southern Hunan region and proposes an XGBoost forest fire monitoring model that integrates cloud parameters using multi-source data from the Himawari-8/9 satellites. This study aims to evaluate how cloud parameters improve the internal consistency of hotspot identification within the Himawari system. The main contributions are as follows: we introduce cloud optical thickness (COT) and cloud effective radius (CER) as core cloud parameters to quantify the attenuation effect of clouds on thermal radiation from fires; we construct a multi-source feature set by combining brightness temperature features, cloud parameters with their neighborhood statistics, and surface radiation normalization features; and we reveal the nonlinear influence mechanisms of cloud parameters on fire identification through interpretable analysis, and propose targeted model optimization strategies to improve the accuracy of forest fire monitoring.
2. Materials
2.1. Study Area
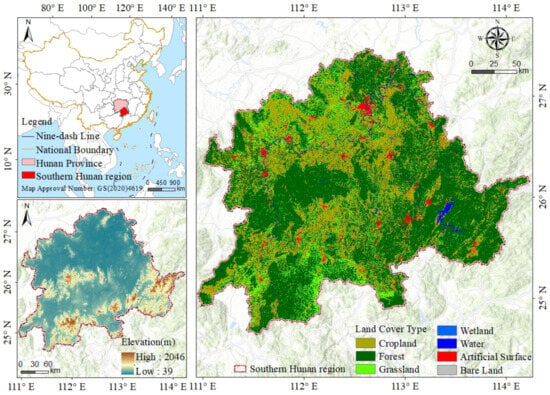
This study focused on the southern Hunan region as the study area. Located in the southern part of Hunan Province, China, the study area encompasses the entire administrative areas of the cities of Hengyang, Yongzhou, and Chenzhou, spanning from 110°30′ to 114°15′E and 24°53′ to 27°27′N, covering a total area of 57,100 km2 (Figure 1). The region experiences a mid-subtropical monsoon humid climate characterized by distinct seasons and the synchronous occurrence of rain and heat. The geomorphology exhibits pronounced transitional characteristics and complexity: the southern part is dominated by the Nanling Mountains, while the northern part features the Hengyang Basin embedded within the hills of central Hunan. This diverse geomorphic pattern not only influences vegetation distribution and forest fire risk variability, but also, through the rugged terrain, alters local water vapor transport and cloud system persistence, thereby directly affecting satellite-based forest fire monitoring.
Figure 1.
Overview map of the study area.
Southern Hunan is one of the core forest resource distribution areas in Hunan Province, with a forestland area of approximately 3.0763 million hectares and a forest coverage rate of 54%. The vegetation is dominated by subtropical evergreen broad-leaved forests. This region is also a high-incidence area for forest fires in Hunan Province. In October 2022, a catastrophic forest fire occurred, with a burned area reaching thousands of hectares. Driven by extreme weather conditions including drought, high temperatures, and strong winds, the fire spread rapidly [31]. This study selected the period from August to October 2022 as the main study period, which encompasses the peak forest fire season and typical cloud-contaminated scenarios in southern Hunan.
2.2. Data Resources and Data Pre-Processing
2.2.1. Data Resources
The core satellite data of this study are derived from the Level-1 NetCDF products of the AHI (Advanced Himawari Imager) sensor aboard the Himawari-8/9 satellites, which are operated by the Japan Meteorological Agency (JMA). The Himawari-8/9 satellites are positioned in geostationary orbit at approximately 35,786 km above the equator, covering a vast area from 80°E to 160°W longitude and 60°N to 60°S latitude, with a temporal resolution of 10 min for full-disk observations and 16 spectral bands. The 3.9 μm mid-wave infrared channel (Band 7) was used as the core band for fire detection, while the 11.2 μm (Band 14) and 12.4 μm (Band 15) long-wave infrared channels were used for background temperature analysis and brightness temperature difference calculation. COT (cloud optical thickness), CER (cloud effective radius), and CLTYPE (cloud type) were obtained from the Level-2 CLP (cloud product) at 5 km spatial resolution. Surface downward shortwave radiation (SWR) was acquired from the Level-2 photosynthetically available radiation (PAR) product, and was supplemented by the ERA5 hourly surface downward short-wave solar radiation flux (DSSR) at 0.25° resolution. Land cover information was derived from the 2024 China Land Cover Dataset (CLCD) at 30 m resolution to restrict fire detection to vegetated areas. The Himawari-8/9 Wild Land Fire (WLF) product (2 km, 10 min) served as the basis for positive sample definition and as the validation reference.
2.2.2. Data Pre-Processing
- (1)
- Cloud Pixel Identification and Cloud Type Classification
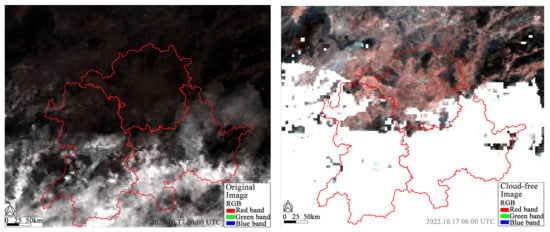
Cloud pixel identification is based on thermal radiation characteristics in the thermal infrared channels and high reflectivity in the visible channels [32]. Moreover, distinct cloud types exhibit significant differences in reflectance and brightness temperature responses across various spectral bands. Therefore, multispectral information is typically integrated in the cloud detection process to improve the accuracy of cloud pixel identification. This study adopted a multispectral threshold method for cloud pixel detection, the results before and after detection are shown in Figure 2. Based on the Himawari-8/9 official algorithm documentation and related cloud detection studies [33,34], with minor adjustments tailored to the study area, the cloud detection algorithm is derived as follows:
Figure 2.
Comparison of remote sensing images of the study area before and after cloud detection.
Daytime cloud detection algorithm:
Nighttime cloud detection algorithm:
where and denote the reflectance of Himawari-8/9 Band 3 and Band 4, respectively, and T15 represents the brightness temperature of Band 15. Pixels satisfying Equations (1) and (2) were defined as cloudy areas during daytime and nighttime, respectively.
Based on the completed cloud pixel identification, to characterize the differential effects of various cloud layers on fire thermal radiation signals, cloud type data were used to classify the clouds in the study area. This study employed the Himawari-8/9 Cloud Product (CLP), which identifies cloud types by integrating spectral features from visible, near-infrared, and thermal infrared channels based on multispectral observations and radiative transfer model retrievals. The Himawari-8/9 CLP follows the ISCCP cloud classification scheme. The main cloud types in the study area included cirrus (Ci), cirrostratus (Cs), deep convection (DC), stratocumulus (Sc), and Altocumulus (Ac), as detailed in Table 1. Specifically, introducing cloud type information provides a physical context for analyzing how COT and CER vary across different cloud regimes, which is essential for interpreting their attenuation effects on fire signals and for designing cloud-conditioned detection strategies.
Table 1.
ISCCP standard cloud classification diagram.
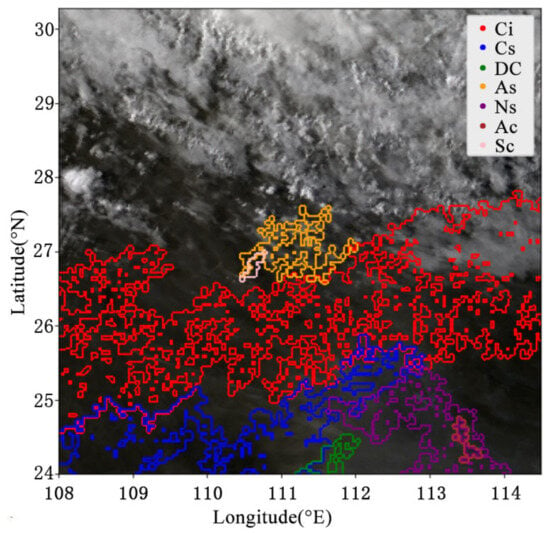
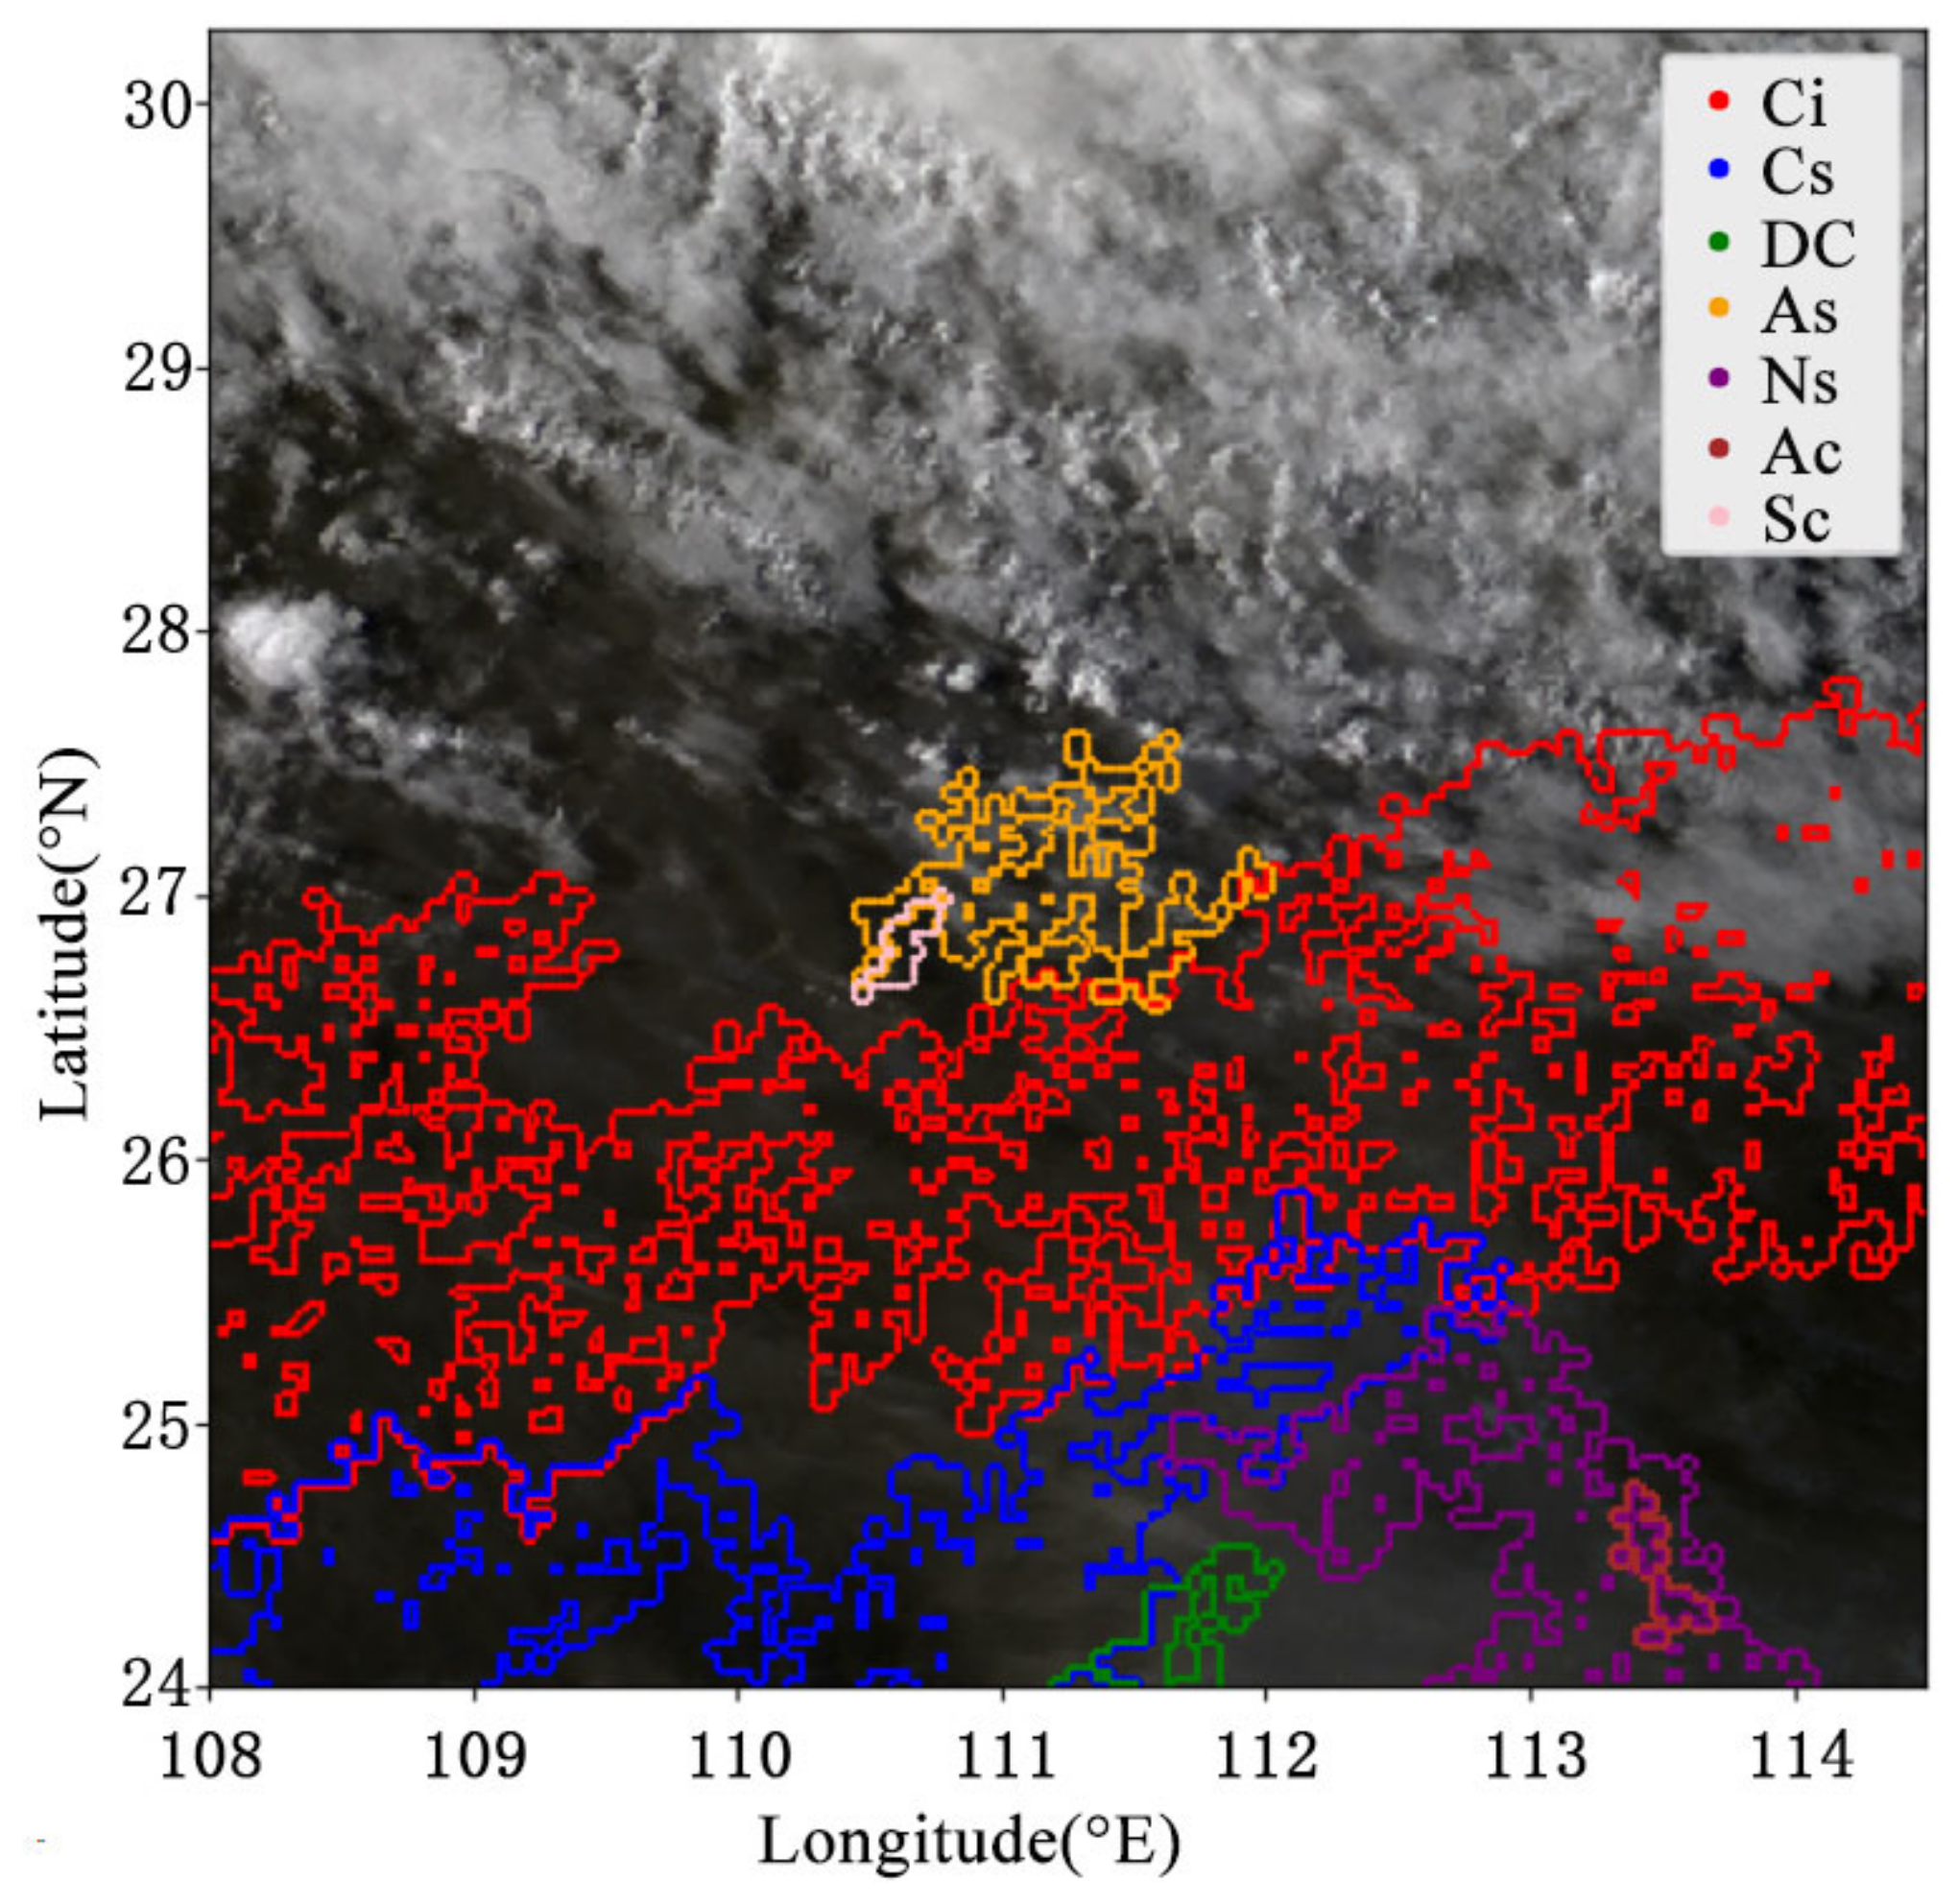
Different cloud types exhibit significant differences in cloud optical thickness, cloud top height, and multispectral response characteristics, leading to varying degrees of attenuation of fire thermal radiation signals from the land surface. By mapping the boundary distribution of the largest connected regions for different cloud types (Figure 3), the spatial aggregation extent and morphological characteristics of each cloud type can be intuitively presented, thereby clearly identifying the main coverage areas of thick clouds, thin clouds, and other cloud types, as well as their obscuration patterns over high-incidence forest fire zones.
Figure 3.
Boundary distribution map of the largest connected regions of different Cloud Types for Himawari-8/9 Cloud Property (CLP).
- (2)
- Acquisition of Modeling Factors
- ①
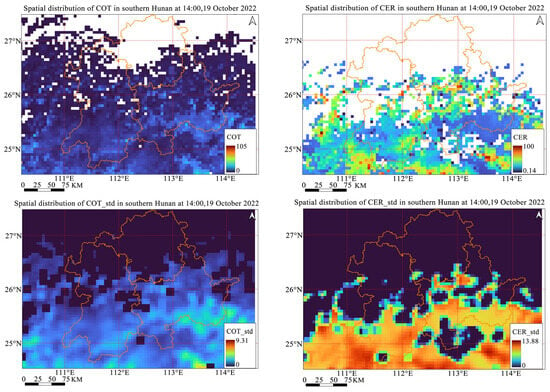
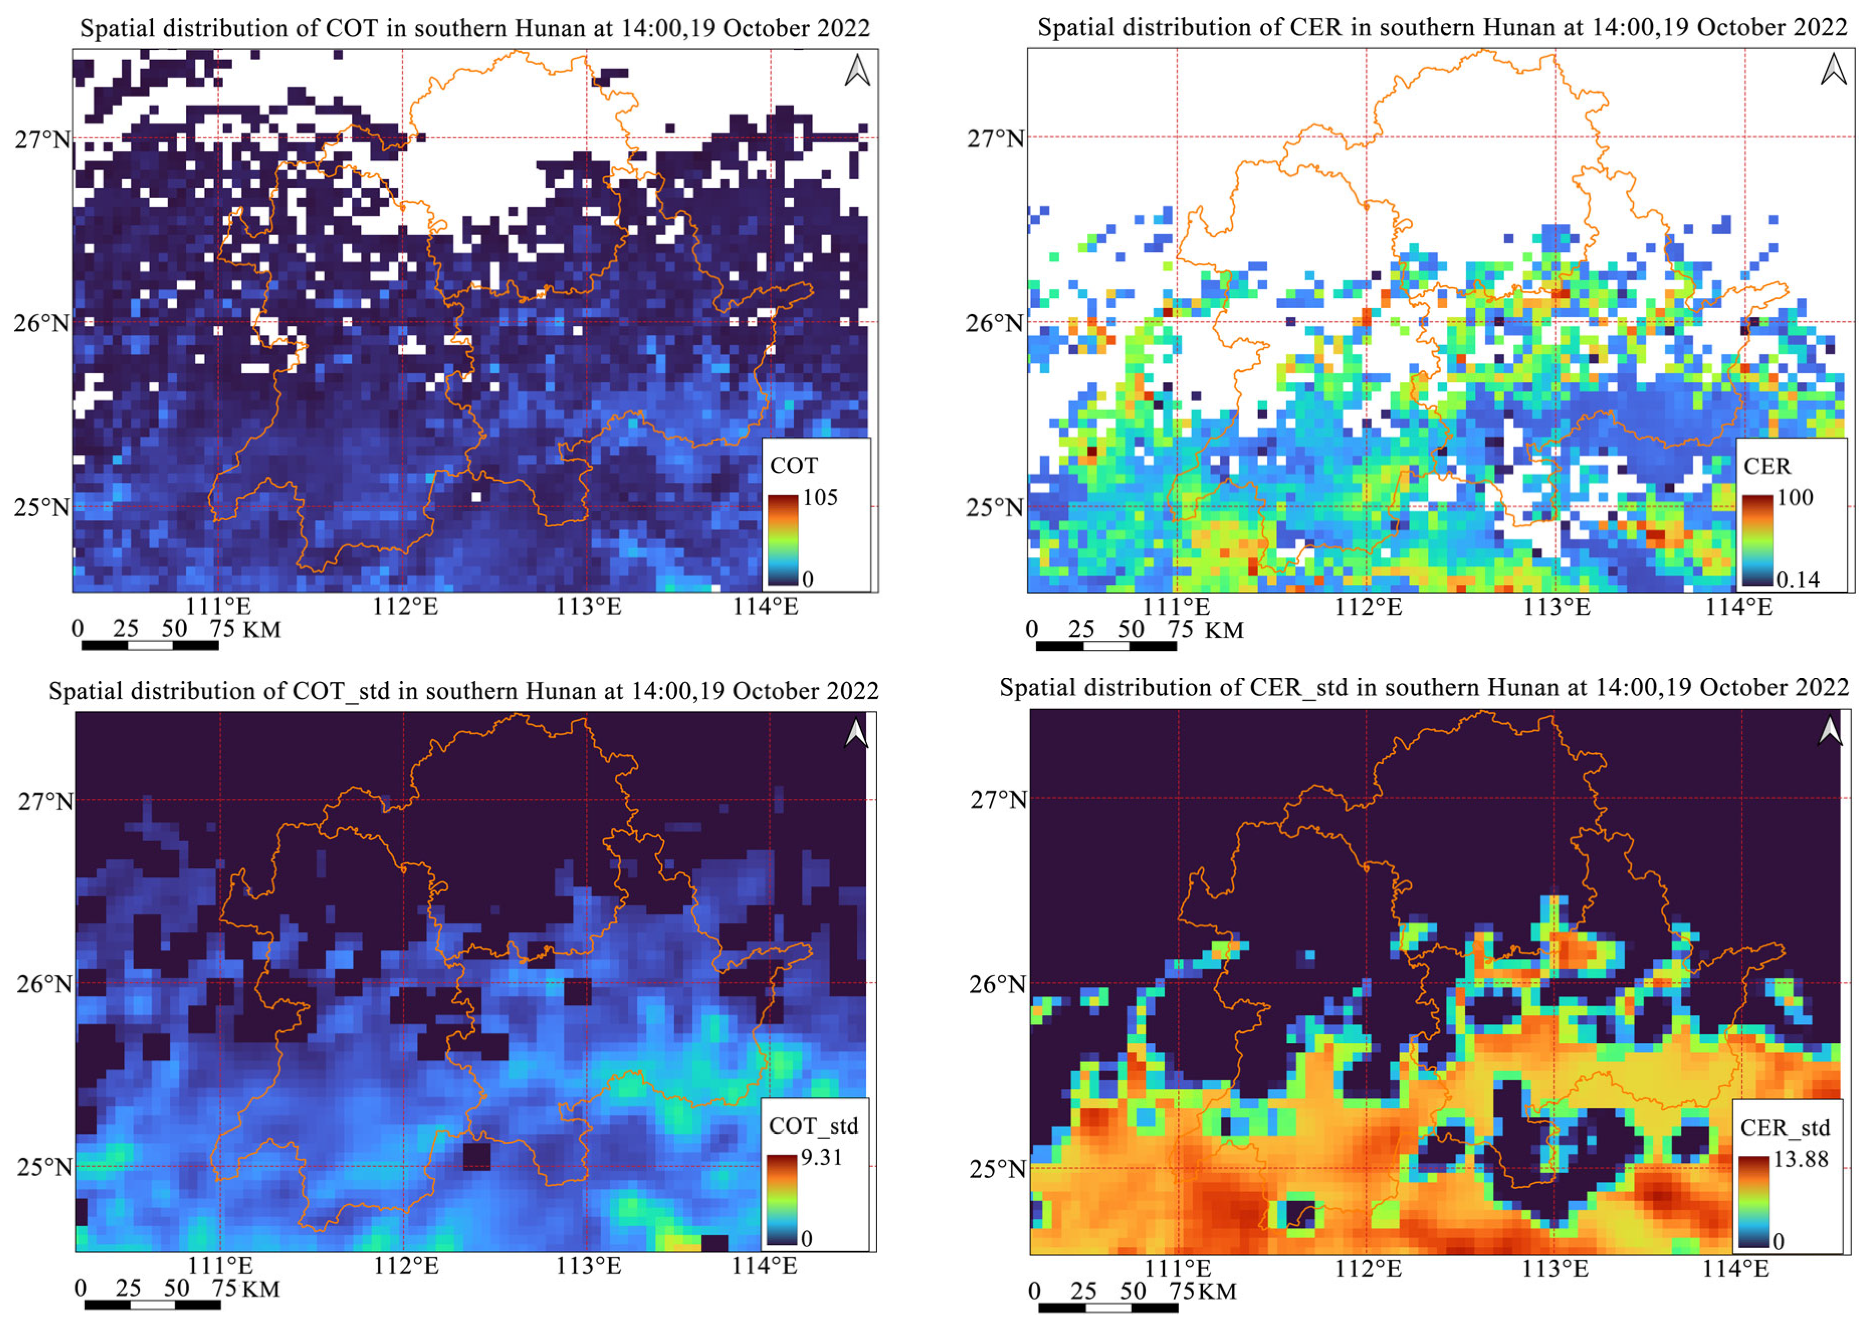
- Construction of Cloud Indicators. Cloud optical thickness (COT) and cloud effective radius (CER) are key physical parameters that characterize the radiative attenuation capacity of clouds [35,36]. COT reflects the ability of clouds to transmit and attenuate solar radiation and surface thermal radiation, and its magnitude directly affects the detectability of fire hotspot signals. CER reflects the size of cloud particles and influences the radiation transfer path by modulating scattering efficiency. Based on an adaptive effective cloud background window calculation and standard deviation quantification method, for each target pixel, a window of a certain size (e.g., 5 × 5 pixels) was constructed, and the proportion of effective cloud pixels within the window was calculated. If the proportion was below a threshold (50%), the window was gradually expanded. Subsequently, the standard deviations of COT and CER within the window were calculated to obtain the neighborhood statistical features COT_std and CER_std. Figure 4 shows the feature space distribution of these four features.Figure 4. Feature space distribution maps of COT, CER, COT_std and CER_std.
For an effective cloud background window of size n × n, let the COT pixel values be x1, x2, …, xN (N = n2) and the CER pixel values be y1, y2, …, yN (N = n2). The standard deviations of the pixels within the window can be expressed as follows:
- ②
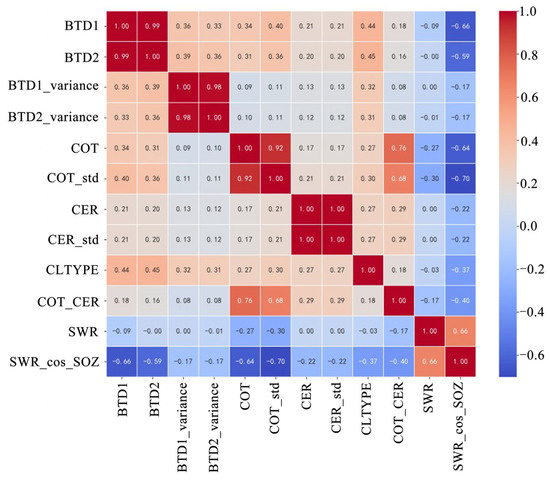
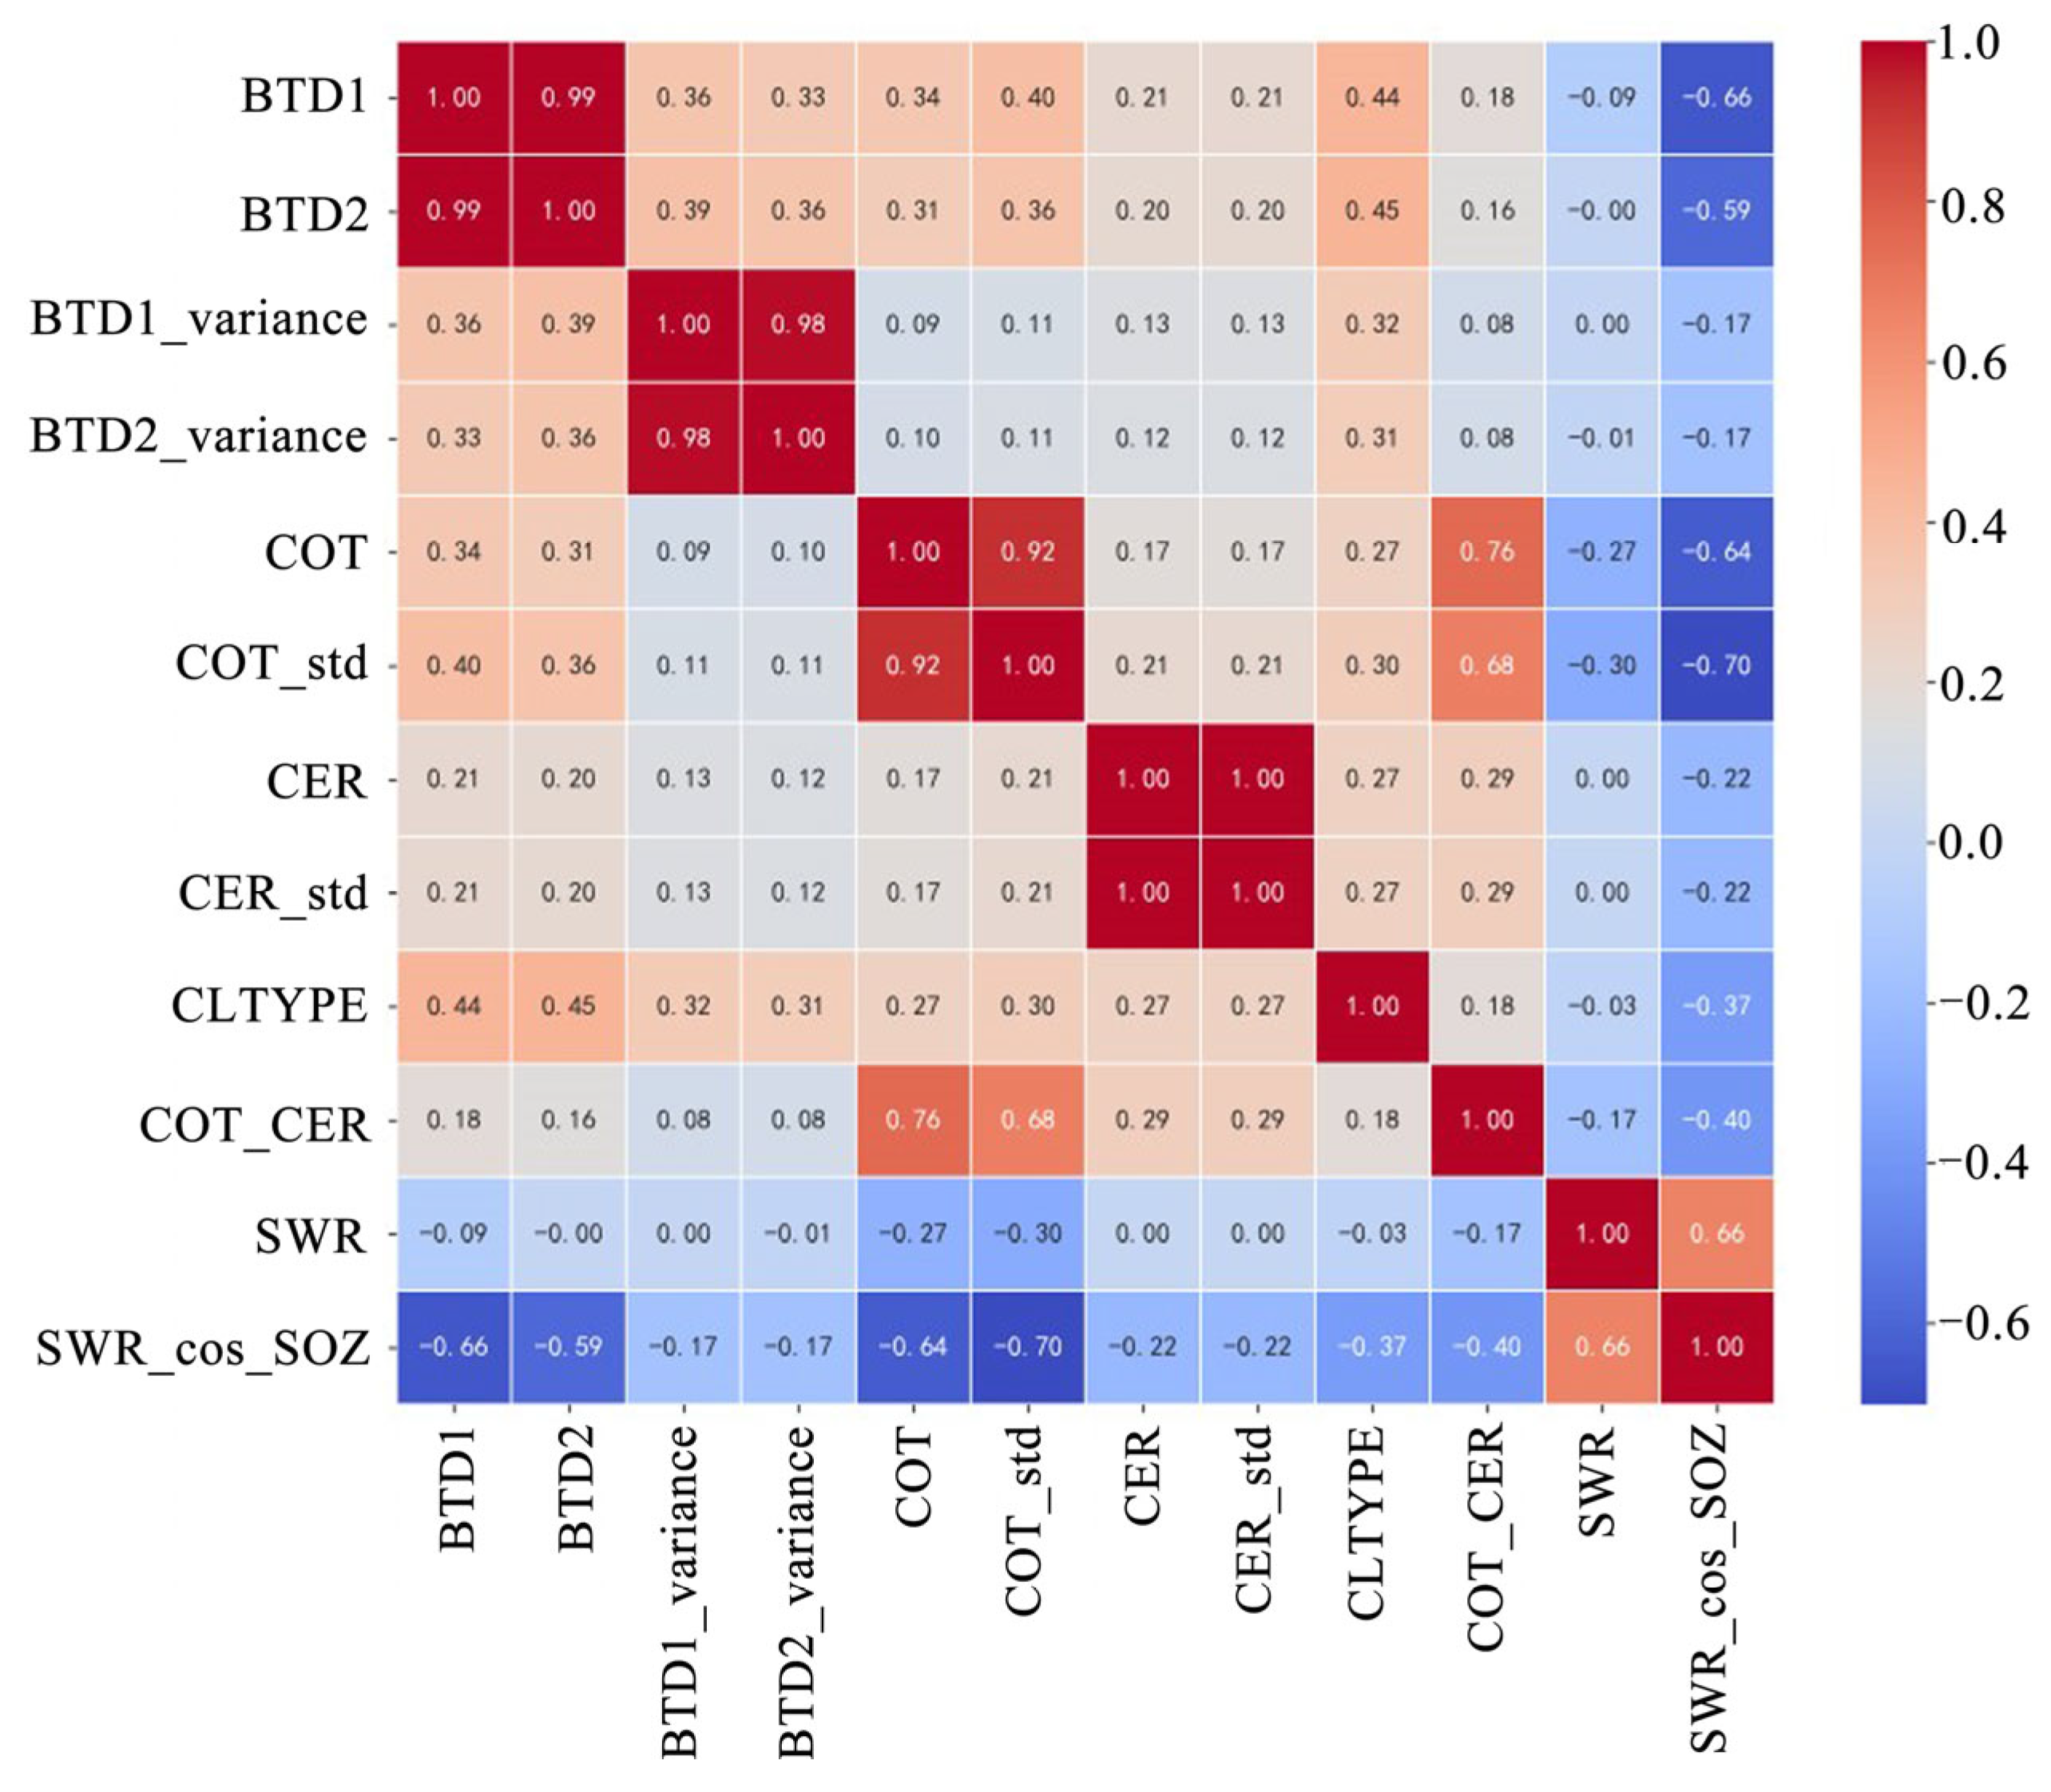
- Multi-source Feature Set Construction. A multi-source feature set comprising four categories was constructed by integrating Himawari-8/9 Level-1 brightness temperatures, Level-2 cloud parameters, Level-2 surface downward shortwave radiation, and ERA5 reanalysis data. The first category included basic brightness temperature and fire index features: tbb_07 (3.9 μm), tbb_14 (11.2 μm), tbb_15 (12.4 μm), and the brightness temperature difference indices BTD1 (tbb_07 − tbb_14) and BTD2 (tbb_07 − tbb_15). The second category encompassed surface radiation state features: SWR from the PAR product corrected with ERA5 net radiation (SWR_final = 0.4 × SWR_H8 + 0.6 × SWR_ERA5) and a solar zenith angle-normalized index (SWR_cos_SOZ = SWR/cos(SOZ)). The third category consisted of cloud parameter features—COT, CER, CLTYPE, and their neighborhood standard deviations COT_std and CER_std derived from an adaptive cloud background window. The fourth category comprised spatiotemporal context features based on pixel neighborhood statistics and multi-temporal variation to capture cloud edge gradients and fire temporal patterns while suppressing noise. The correlation coefficients between features are shown in Figure 5.Figure 5. Heatmap of Pearson correlation coefficients between features.
3. Methods
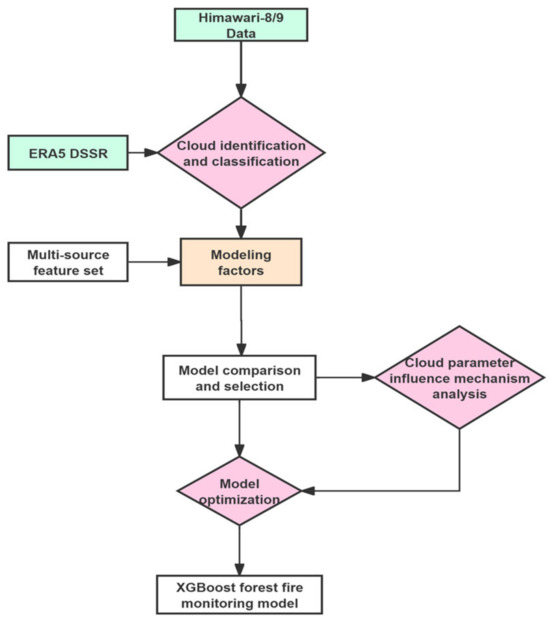
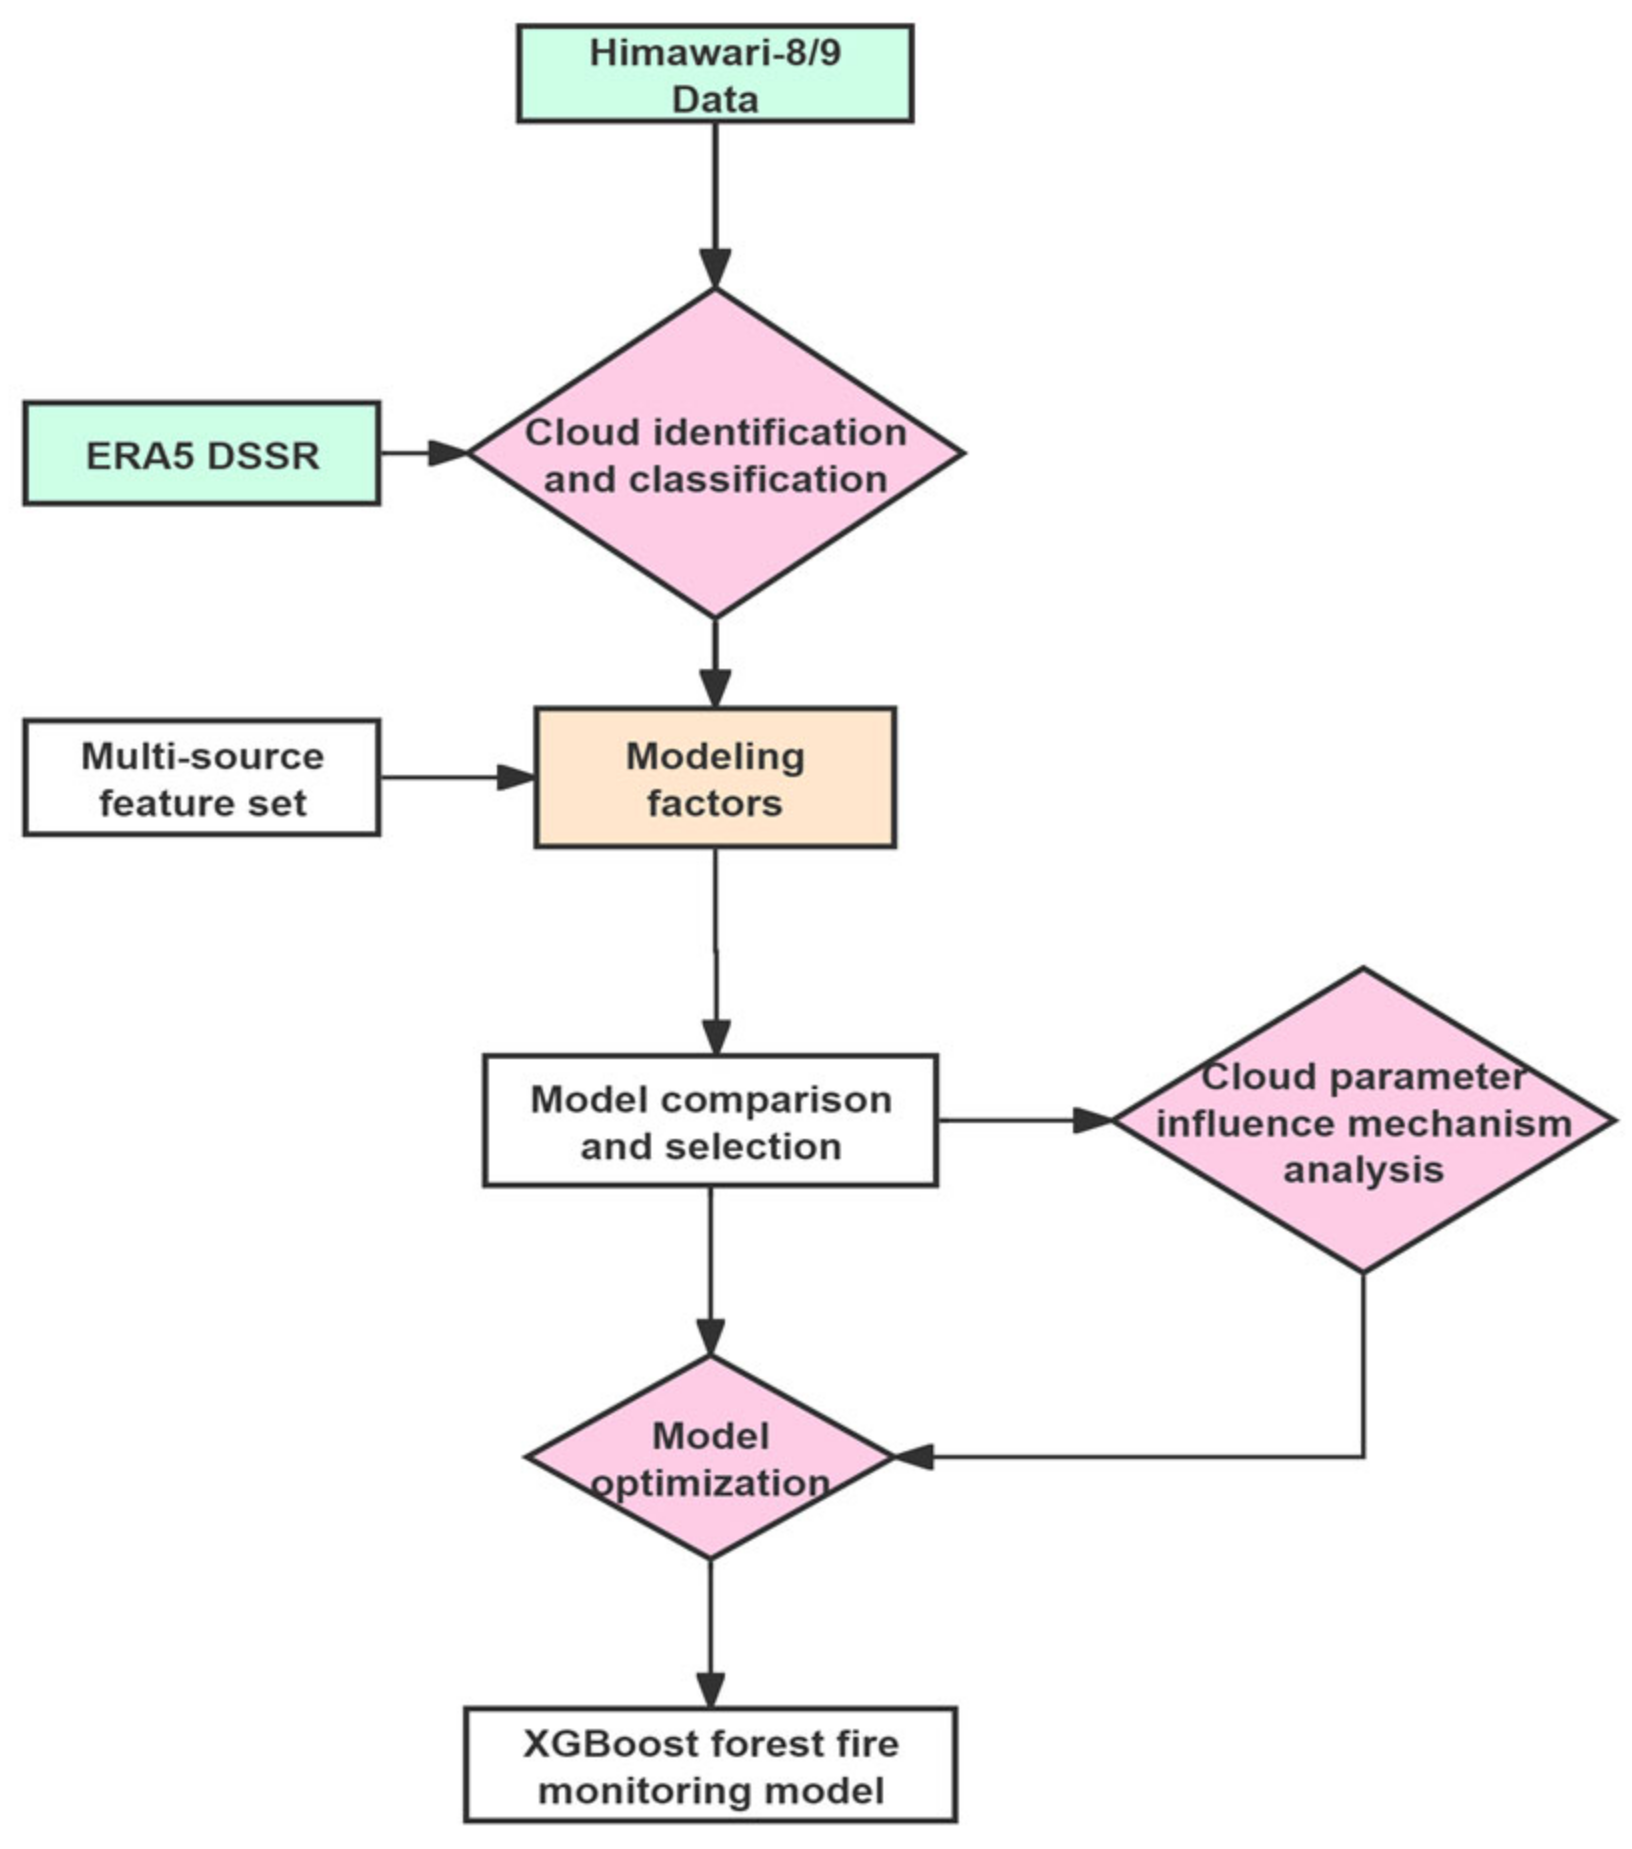
The cloud-parameter-integrated forest fire monitoring method proposed in this study consists of two core components: construction of a forest fire monitoring model under cloud interference, and the influence mechanism of cloud parameters on forest fire monitoring. The specific workflow of the method is illustrated in Figure 6.
Figure 6.
Flowchart of fire point detection algorithm.
3.1. Construction of Forest Fire Monitoring Model Under Cloud Interference
3.1.1. Model Selection
Three representative machine learning models—XGBoost, random forest, and logistic regression—were selected for comparison [37]. XGBoost handles high-dimensional nonlinear remote sensing features well through its gradient boosting mechanism and built-in regularization [38,39]. XGBoost was ultimately selected as the core model due to its superior interpretability (SHAP and partial dependence analysis), efficient training on moderate-sized datasets, and built-in regularization that mitigates overfitting under class imbalance. Random forest is robust to noise via its Bagging ensemble strategy; and logistic regression serves as a linear baseline for verifying the advantages of nonlinear models under complex cloud interference.
where denotes the final prediction output of the random forest model for input sample x; x represents the input feature vector, i.e., the multi-source remote sensing features in this study such as brightness temperatures, cloud parameters, and radiation features; T is the total number of decision trees in the random forest; and ht(x, θt) is the prediction function of the t-th decision tree, with θt representing the independently randomly generated parameter set for the t-th tree.
The logistic regression model algorithm is as follows:
where is the predicted fire probability for feature vector x, y is the true label (1 for fire, 0 otherwise), is the sigmoid function, and is the weight vector representing feature contributions.
The XGBoost model used a binary logistic loss with hyperparameters optimized via grid search (n_estimators = 100, max_depth = 6, learning_rate = 0.1) and class weights to address sample imbalance. A 7:2:1 spatiotemporal split was applied to ensure independent training, validation, and test sets.
where is the initial model prediction, taking a constant for all samples ; denotes the selection of the value that minimizes the sum of the loss function; yi is the true label of the i-th sample (e.g., 0 or 1 for non-fire and fire hotspot, respectively); and is the initial prediction constant, typically a transformation of the sample mean.
3.1.2. Loss Function and Evaluation Metric Selection
The loss function is a core component of model training, measuring the discrepancy between predictions and true values. By minimizing the loss function, model parameters are iteratively optimized so that outputs gradually approach the true values. This can be expressed as:
where is the true value, is the predicted value, and is the per-sample loss. During training, the loss function is typically minimized through backpropagation and gradient descent to achieve parameter optimization.
- (1)
- XGBoost Loss Function
The XGBoost model adopts the binary logistic loss, namely:
where is the true label (fire or non-fire) and is the predicted probability. This loss function optimizes the classification boundary by minimizing the negative log-likelihood, combined with L1 and L2 regularization to prevent overfitting.
- (2)
- Random Forest Loss Function
The random forest model uses Gini impurity as the splitting criterion, namely:
where denotes the Gini impurity, which measures the class disorder within a node—the smaller the value, the higher the node purity, and the larger the value, the more uniform the class distribution; is the vector of class probability distributions for the samples in the node.
- (3)
- Logistic Regression Loss Function
The logistic regression model uses the binary cross-entropy loss, namely:
where is the average loss over all training samples, measuring the difference between predicted probabilities and true labels (smaller values indicate higher accuracy); is the total number of training samples; is the true label of the i-th sample; and is the predicted fire probability of the i-th sample, ranging in (0, 1).
- (4)
- Model Evaluation Metrics
The selected evaluation metrics include precision, recall, F1-score, and area under the curve (AUC). Precision assesses the accuracy of positive predictions, recall measures the fire omission rate, the F1-score as their harmonic mean is suitable for class-imbalanced scenarios, and AUC quantifies the overall discriminative ability across different thresholds. These metrics were computed using Scikit-learn’s classification_report and roc_auc_score functions and reported on the test set to comprehensively validate model performance in under-cloud fire detection. The metric definitions are as follows:
Precision is defined as the proportion of true fire hotspots among all samples predicted as fire hotspots, namely:
where TP (true positive) refers to correctly detected fire hotspots, and FP (false positive) refers to cloud areas or non-fire pixels misclassified as fire. This metric primarily reflects the model’s ability to control false alarms; high precision means fewer false alarms on cloud-edge pseudo-fire pixels.
Recall is defined as the proportion of true fire hotspots correctly detected by the model, namely:
where FN (false negative) refers to fire hotspots missed under clouds. This metric directly measures the model’s ability to capture real fires; high recall indicates a low omission rate under complex conditions such as thick cloud cover and is a key indicator for reducing missed alarms in forest fire monitoring.
The F1-score is the harmonic mean of precision and recall, calculated as:
This metric is particularly suitable for remote sensing datasets with a very low proportion of fire samples and severe class imbalance, as it balances both false alarms and missed detections, providing a single comprehensive performance measure.
AUC (Area Under the ROC Curve), ranging in [0.5, 1], measures the overall discriminative ability of the model across different classification thresholds. AUC is unaffected by specific threshold choices and class imbalance; a value closer to 1 indicates stronger ranking ability between fires and non-fires, with particularly outstanding discrimination of cloud-contaminated pixels, making it the most robust metric for evaluating model generalization.
Together, these four metrics form a complete evaluation framework: precision and recall emphasize individual aspects, the F1-score achieves balance, and AUC provides a threshold-independent global perspective, offering a reliable basis for subsequent comparative analysis with traditional brightness temperature background algorithms and stratified evaluation by cloud optical thickness.
3.1.3. Dataset Partitioning Strategy
Positive samples were strictly defined based on the Himawari-8/9 official WLF (Wild Fire) L2 product: a pixel labeled as fire (confidence ≥ 3) with forest land cover (land_cover = 2) was assigned as a positive sample (label = 1). To construct balanced and representative negative samples, two strategies were adopted: (1) random sampling from cloud-free non-fire areas along the image edge, with a buffer of >10 pixels from any fire pixel; and (2) sampling from cloudy regions (COT > 5) to help the model distinguish fire from high-reflectance cloud artifacts. Negative samples were generated at approximately 1–2 times the number of positive samples.
All samples were split into training (70%), validation (20%), and test (10%) sets using a spatiotemporal partitioning strategy: temporal division was applied first, followed by spatial stratification based on latitude/longitude blocks within each subset to ensure independence across different cloud conditions and fire events. Finally, all samples were fully shuffled to remove temporal continuity and enhance generalization.
3.2. Influence Mechanism of Cloud Parameters on Forest Fire Monitoring
3.2.1. Model Interpretability Analysis Methods
To systematically reveal the influence mechanisms of cloud optical thickness (COT) and cloud effective radius (CER) on forest fire detection accuracy, this study adopted the optimized XGBoost model as the core and conducted quantitative analyses from four dimensions: feature importance, partial dependence, SHAP interpretability, and stratified performance evaluation by cloud parameters. All analyses were based on an independent test set with a fixed random seed to ensure reproducibility.
- ①
- Feature importance analysis. Three importance metrics built into XGBoost—Gain, Weight, and Cover—were used, which respectively reflect the reduction in the loss function contributed by a feature at splits, the number of times a feature is used for splitting, and the sample coverage. In addition, permutation importance was employed to evaluate the performance degradation after randomly shuffling a single feature, so as to robustly identify the relative contributions of COT, CER, and their derived features under cloud interference.
- ②
- Partial dependence analysis. While holding other features constant, COT or CER values were systematically varied to generate partial dependence plots (PDP) that depict the average trend of fire probability change. Individual conditional expectation (ICE) plots were also supplemented to reveal inter-sample heterogeneity in cloud parameter effects, enabling identification of nonlinear threshold effects of clouds on fire thermal signals.
- ③
- SHAP value analysis. Based on Shapley values from game theory, TreeExplainer was used to compute SHAP values for each feature in the XGBoost model, decomposing the model prediction into a baseline value and the sum of feature contributions:
- ④
- Stratified performance evaluation. The test set was divided into multiple intervals based on COT and CER values, such as [0, 5), [5, 10), …, [60, 65). Within each stratum, Precision, Recall, F1-score, and AUC were calculated for both XGBoost and the traditional brightness temperature background algorithm. The degradation pattern of model performance with increasing cloud thickness was assessed, and the usability boundary for thick cloud regions (COT ≥ 50) was determined.
3.2.2. Model Optimization Strategies
Based on the above mechanism analysis, four optimization strategies were further proposed to improve fire detection in thick cloud regions. To address the strong negative contribution of COT (Cloud optical thickness) to prediction probability, we designed a dynamic threshold and class weight adjustment strategy based on real-time COT. Specifically, COT was divided into four intervals ([0, 5), [5, 20), [20, 50), [50+)), with adaptive classification thresholds (τ) and class weights (scale_pos_weight) assigned to each interval:
where is the classification threshold dynamically adjusted based on COT, and is the fire class weight.
To mitigate misleading high-confidence predictions in thick-cloud regions, the model-estimated fire probability was directly used as an uncertainty score, with three confidence levels defined: high (>0.75, direct alert), medium (0.45–0.75, manual/multi-source validation), and low (<0.45, flagged as suspected thick-cloud fire with reduced alarm priority).
For varying cloud conditions, we constructed two parallel XGBoost sub-models (thin-cloud vs. thick-cloud, split at COT = 20), combined via soft voting with weights determined by real-time COT. Additionally, a two-layer fully connected network (128-64 neurons) was appended to the final XGBoost layer to capture higher-order COT × CER × BTD interactions.
Based on feature importance and SHAP results [40], a reduced Top-8 feature set (COT, CER, COT_std, CER_std, SWR_cos_SOZ, BTD1, BTD2, COT_CER) was selected, excluding CLTYPE and low-contribution BTD-derived features, and the XGBoost model was retrained and validated on the same dataset.
4. Results
4.1. Performance Comparison of Forest Fire Monitoring Models
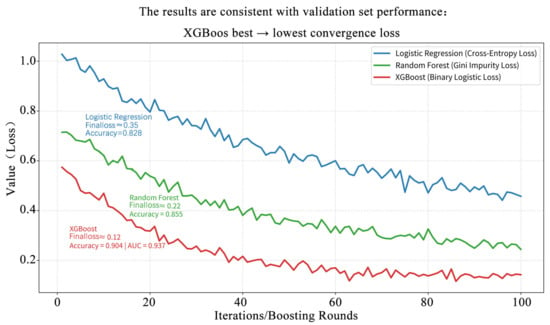
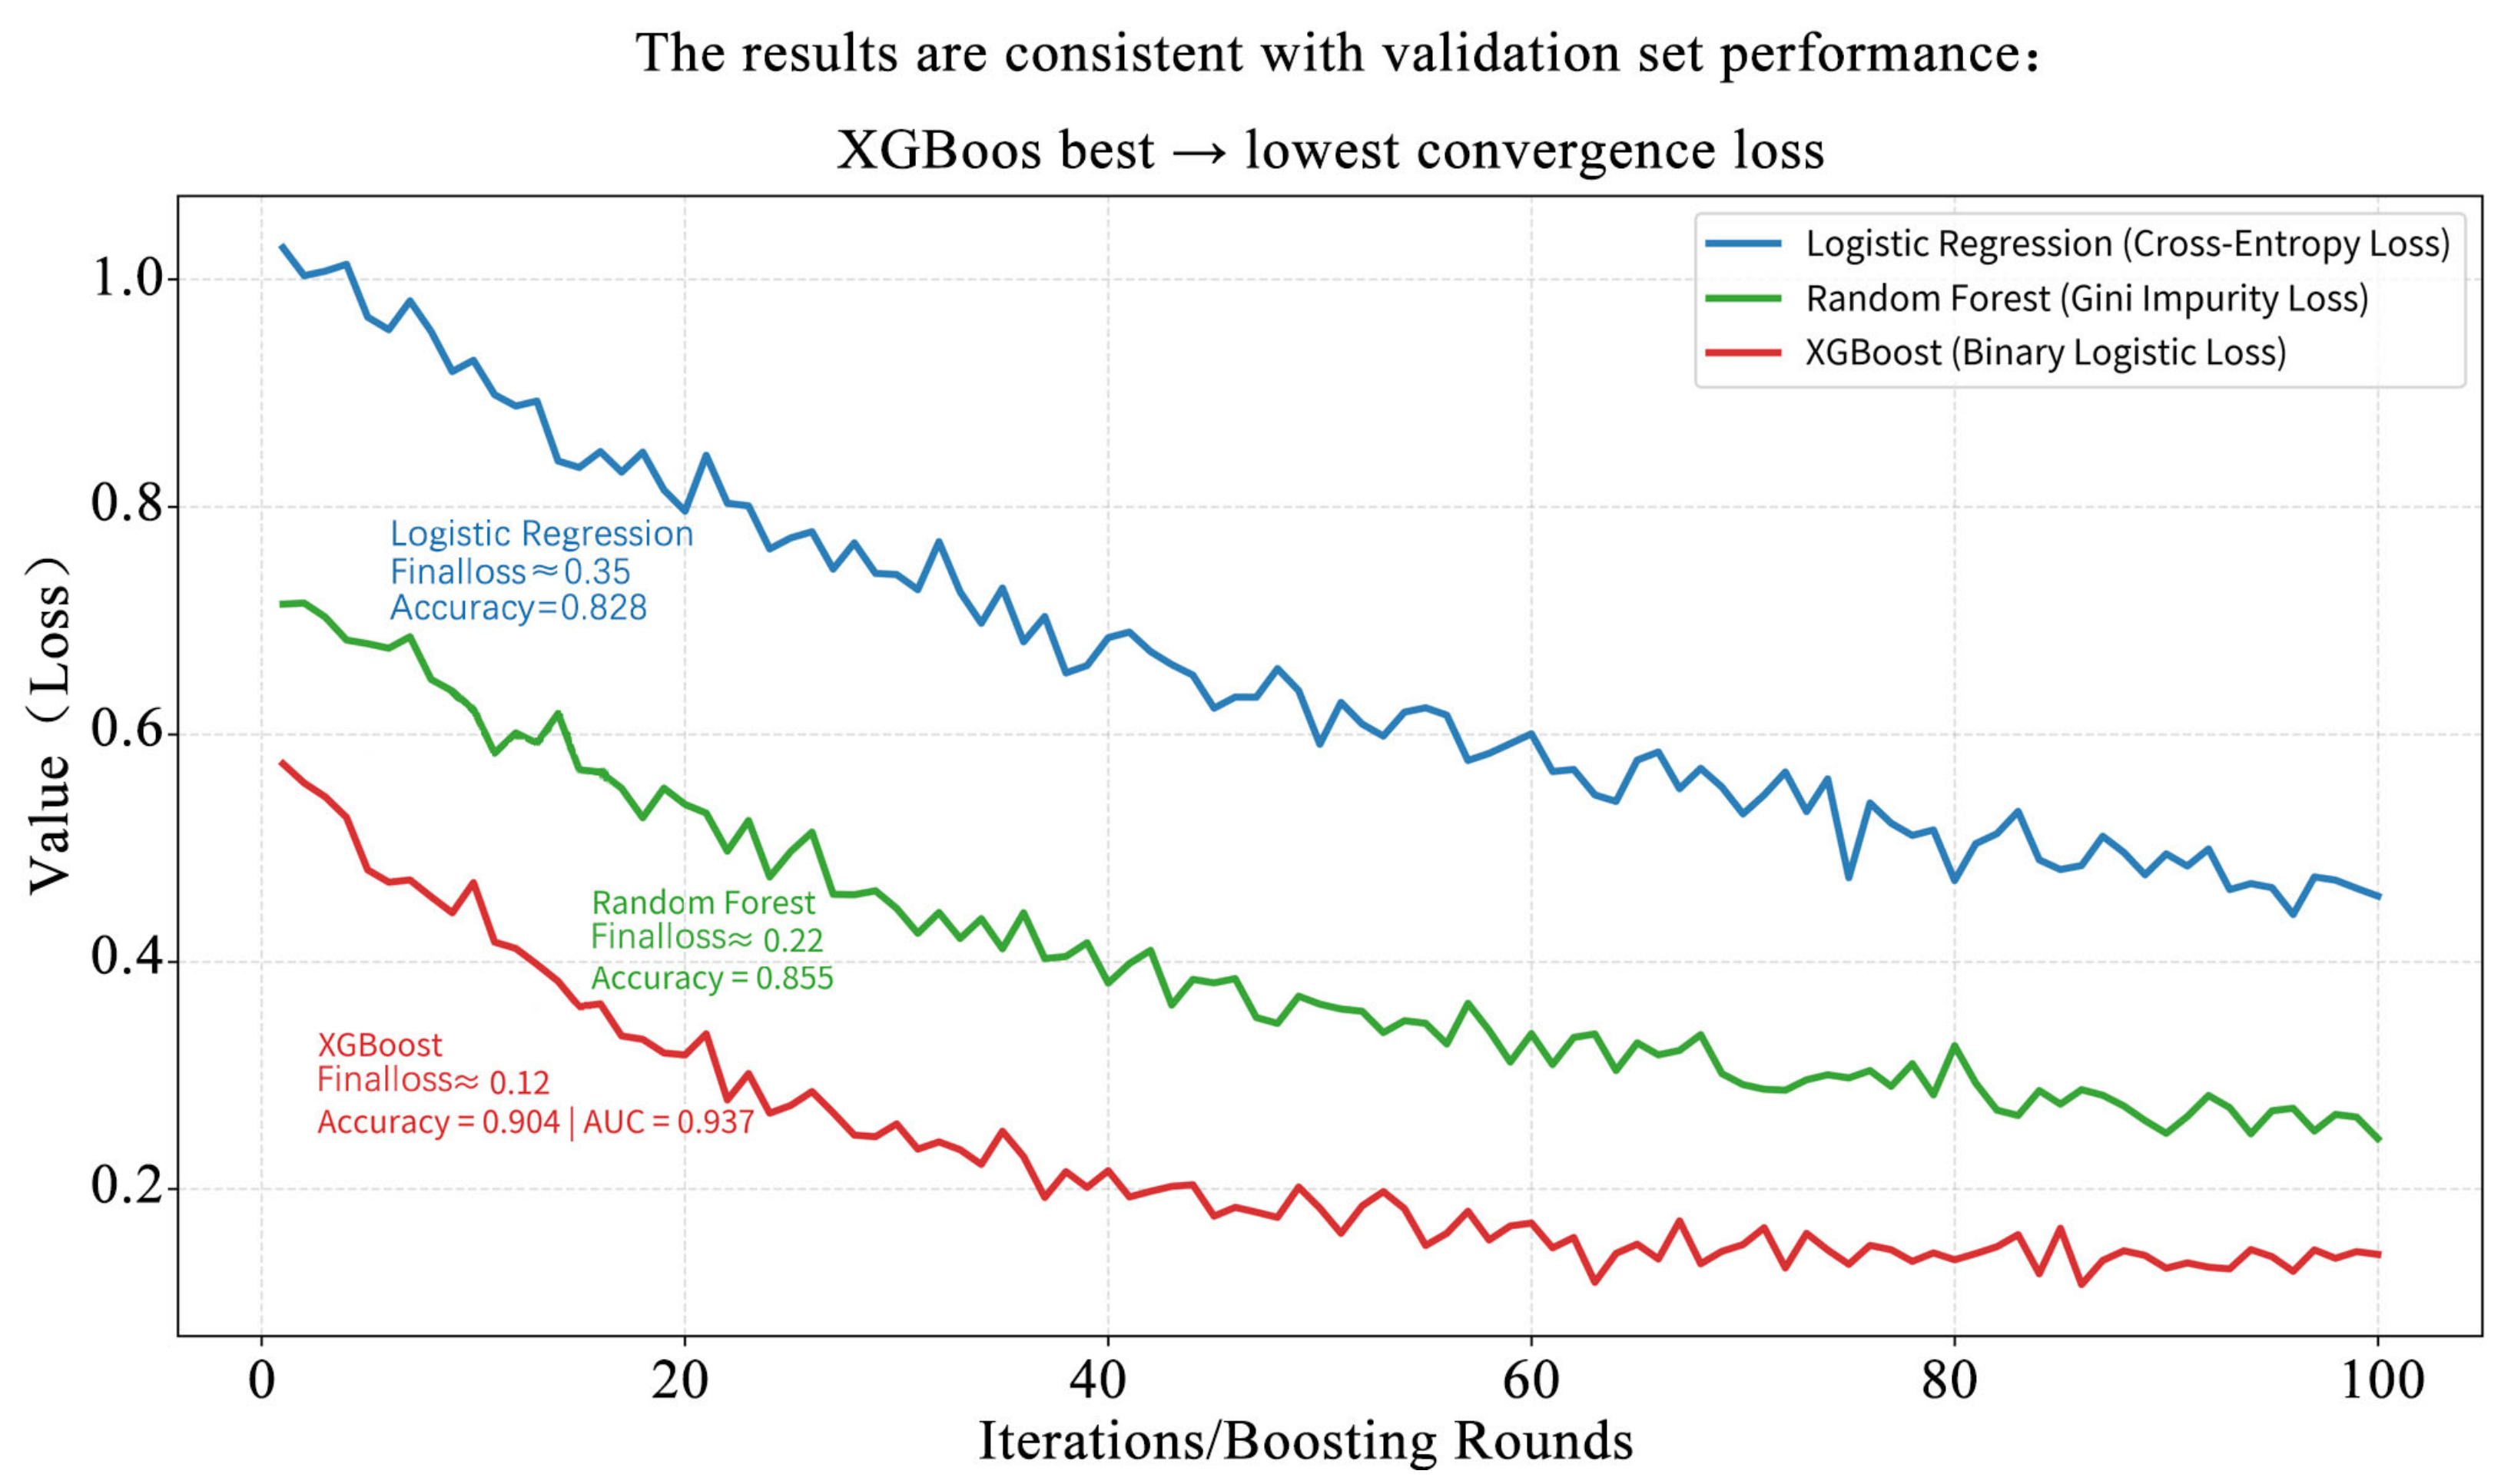
To evaluate the learning efficiency and fitting ability of different machine learning models for forest fire monitoring under cloud interference, the loss changes during training were compared for XGBoost, random forest, and logistic regression. The results are shown in Figure 7.
Figure 7.
Loss curves of the three models.
XGBoost converged fastest, stabilizing around the 40th iteration with a final loss of approximately 0.12. This was due to the strong optimization capability of gradient boosting with binary logistic loss and the effective suppression of cloud interference features by regularization. Random forest exhibited moderate convergence, with a final loss of about 0.22, corresponding to Accuracy = 0.855 and AUC = 0.862. The steady decrease in Gini impurity loss reflected the robustness of the Bagging ensemble to noise, though it remained inferior to XGBoost. Logistic regression converged slowest with the highest final loss (approximately 0.35), closely aligning with its baseline performance (Accuracy = 0.828, AUC = 0.835). The limited optimization capacity of cross-entropy loss under high-dimensional cloud parameter features indicated the constraints of linear models in complex remote sensing scenarios.
The validation results of the three models on the test set are shown in Table 2. XGBoost achieved the best performance, with Accuracy = 0.904, F1-score = 0.904, and AUC = 0.937, significantly outperforming random forest (Accuracy = 0.855, AUC = 0.862) and logistic regression (Accuracy = 0.828, AUC = 0.835). In terms of class-specific performance, all three models showed higher recall for the fire class than for the non-fire class (0.843–0.921), indicating a strong ability to capture actual fire hotspots.
Table 2.
Validation results of the three models.
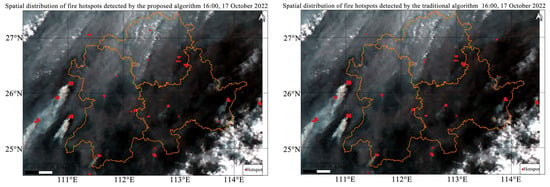
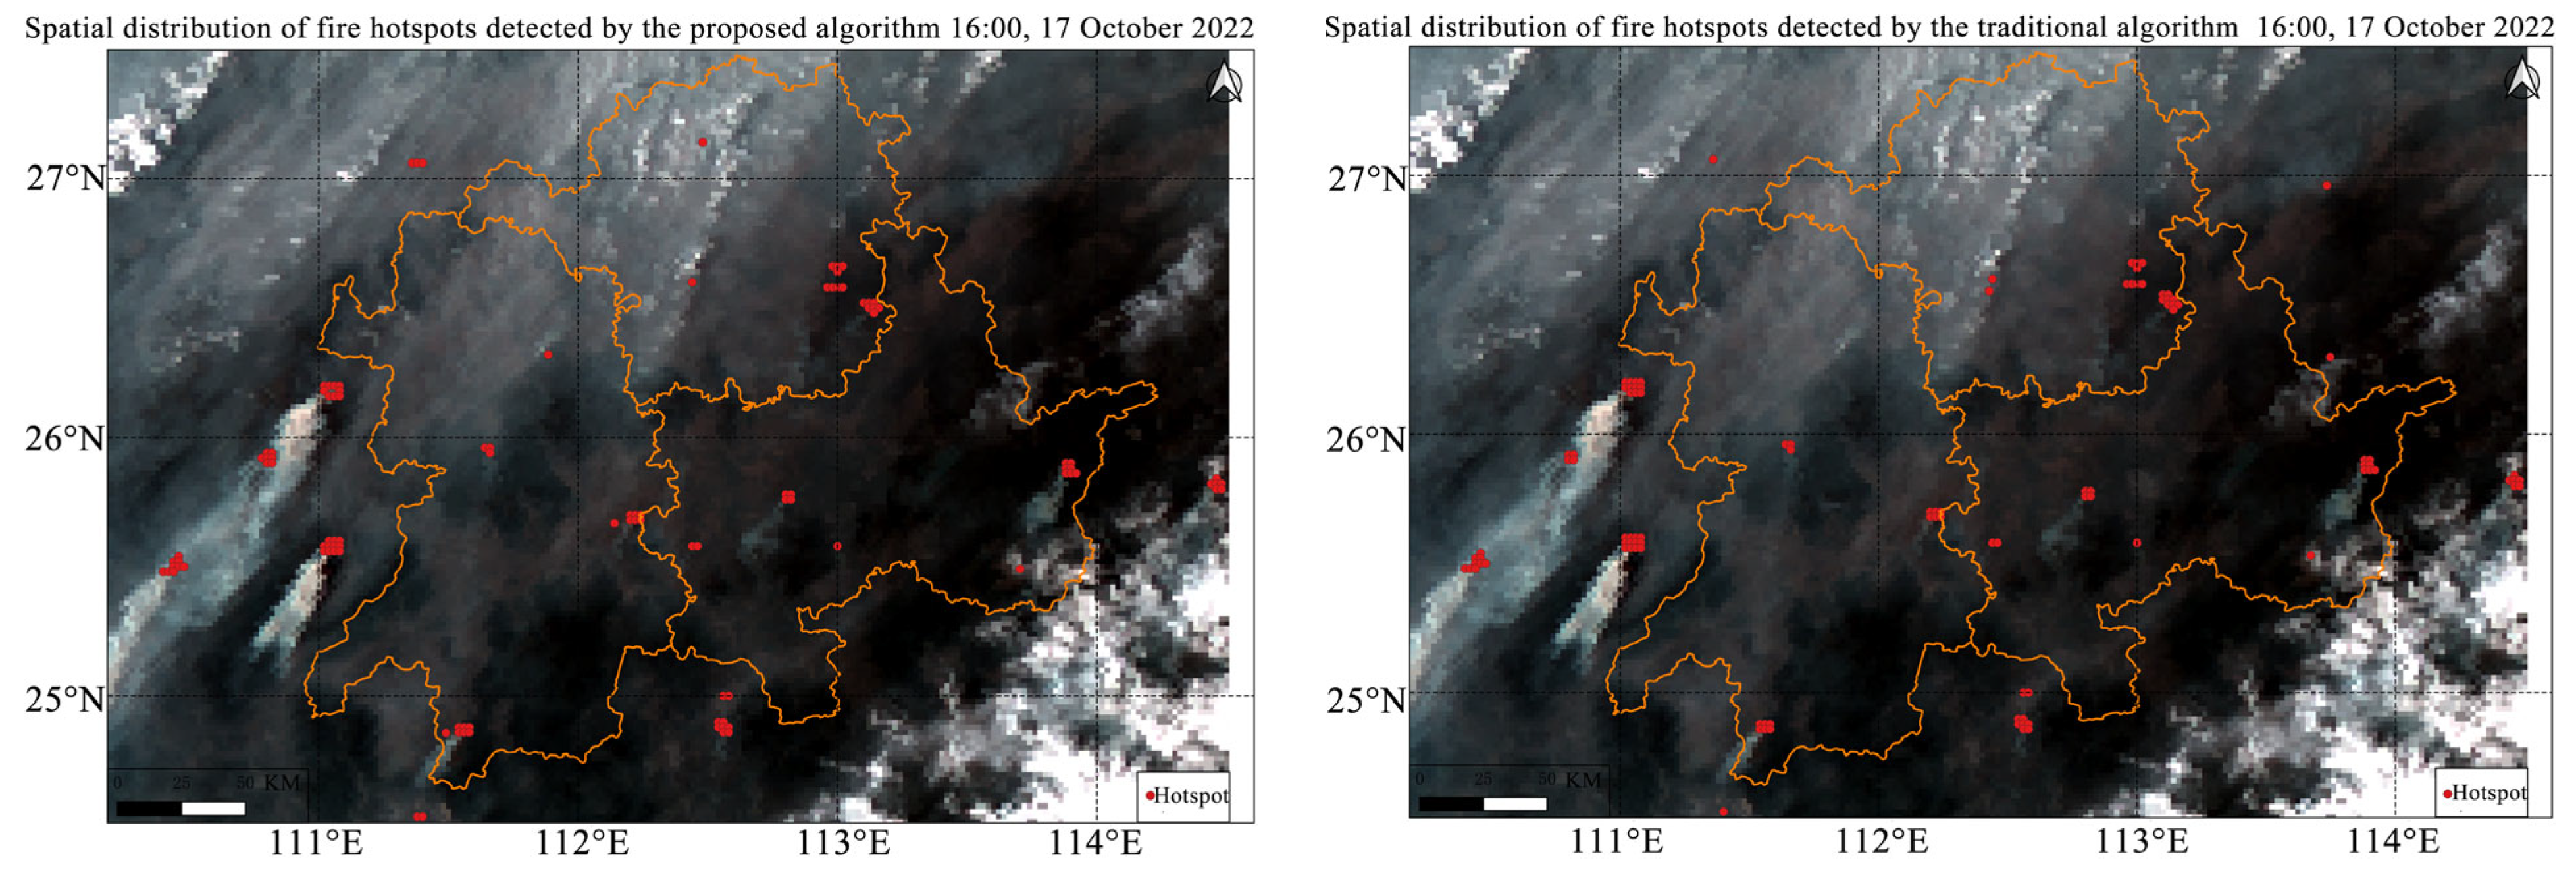
Compared with the traditional brightness temperature background algorithm [41], the proposed method improved accuracy by 15.3% and reduced the false alarm rate and omission rate by 58.1% and 63.4% (Table 3), respectively, with advantages particularly evident in under-cloud and cloud-edge scenarios (Figure 8). For under-cloud fires, the traditional algorithm, unable to account for cloud attenuation, yielded an omission rate of 54.8% and a recall of only 45.2%. By incorporating COT, CER, and their neighborhood statistics, our algorithm compensated for cloud-induced absorption and scattering of mid-infrared radiation, increasing recall to 87.1% and reducing the omission rate by 77.0%, confirming the critical role of cloud parameters in signal recovery over thick clouds. For cloud-edge fires, the traditional algorithm suffered from pseudo-high temperatures caused by high cloud-edge reflectivity, resulting in a false alarm rate of 34.5%. By combining SWR_cos_SOZ radiation normalization and COT spatial heterogeneity features, our algorithm suppressed the cloud-edge false alarm rate to 7.1% and improved precision to 91.3%, effectively eliminating spurious alarms along cloud boundaries.
Table 3.
Comparative analysis of detection results.
Figure 8.
Fire hotspot spatial distribution maps of the proposed algorithm and the traditional algorithm.
4.2. Analysis of the Influence Mechanism of Cloud Parameters on Forest Fire Monitoring
4.2.1. Results of Model Interpretability Analysis
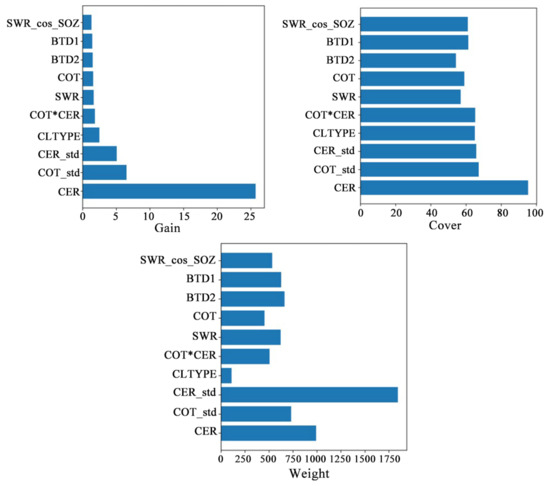
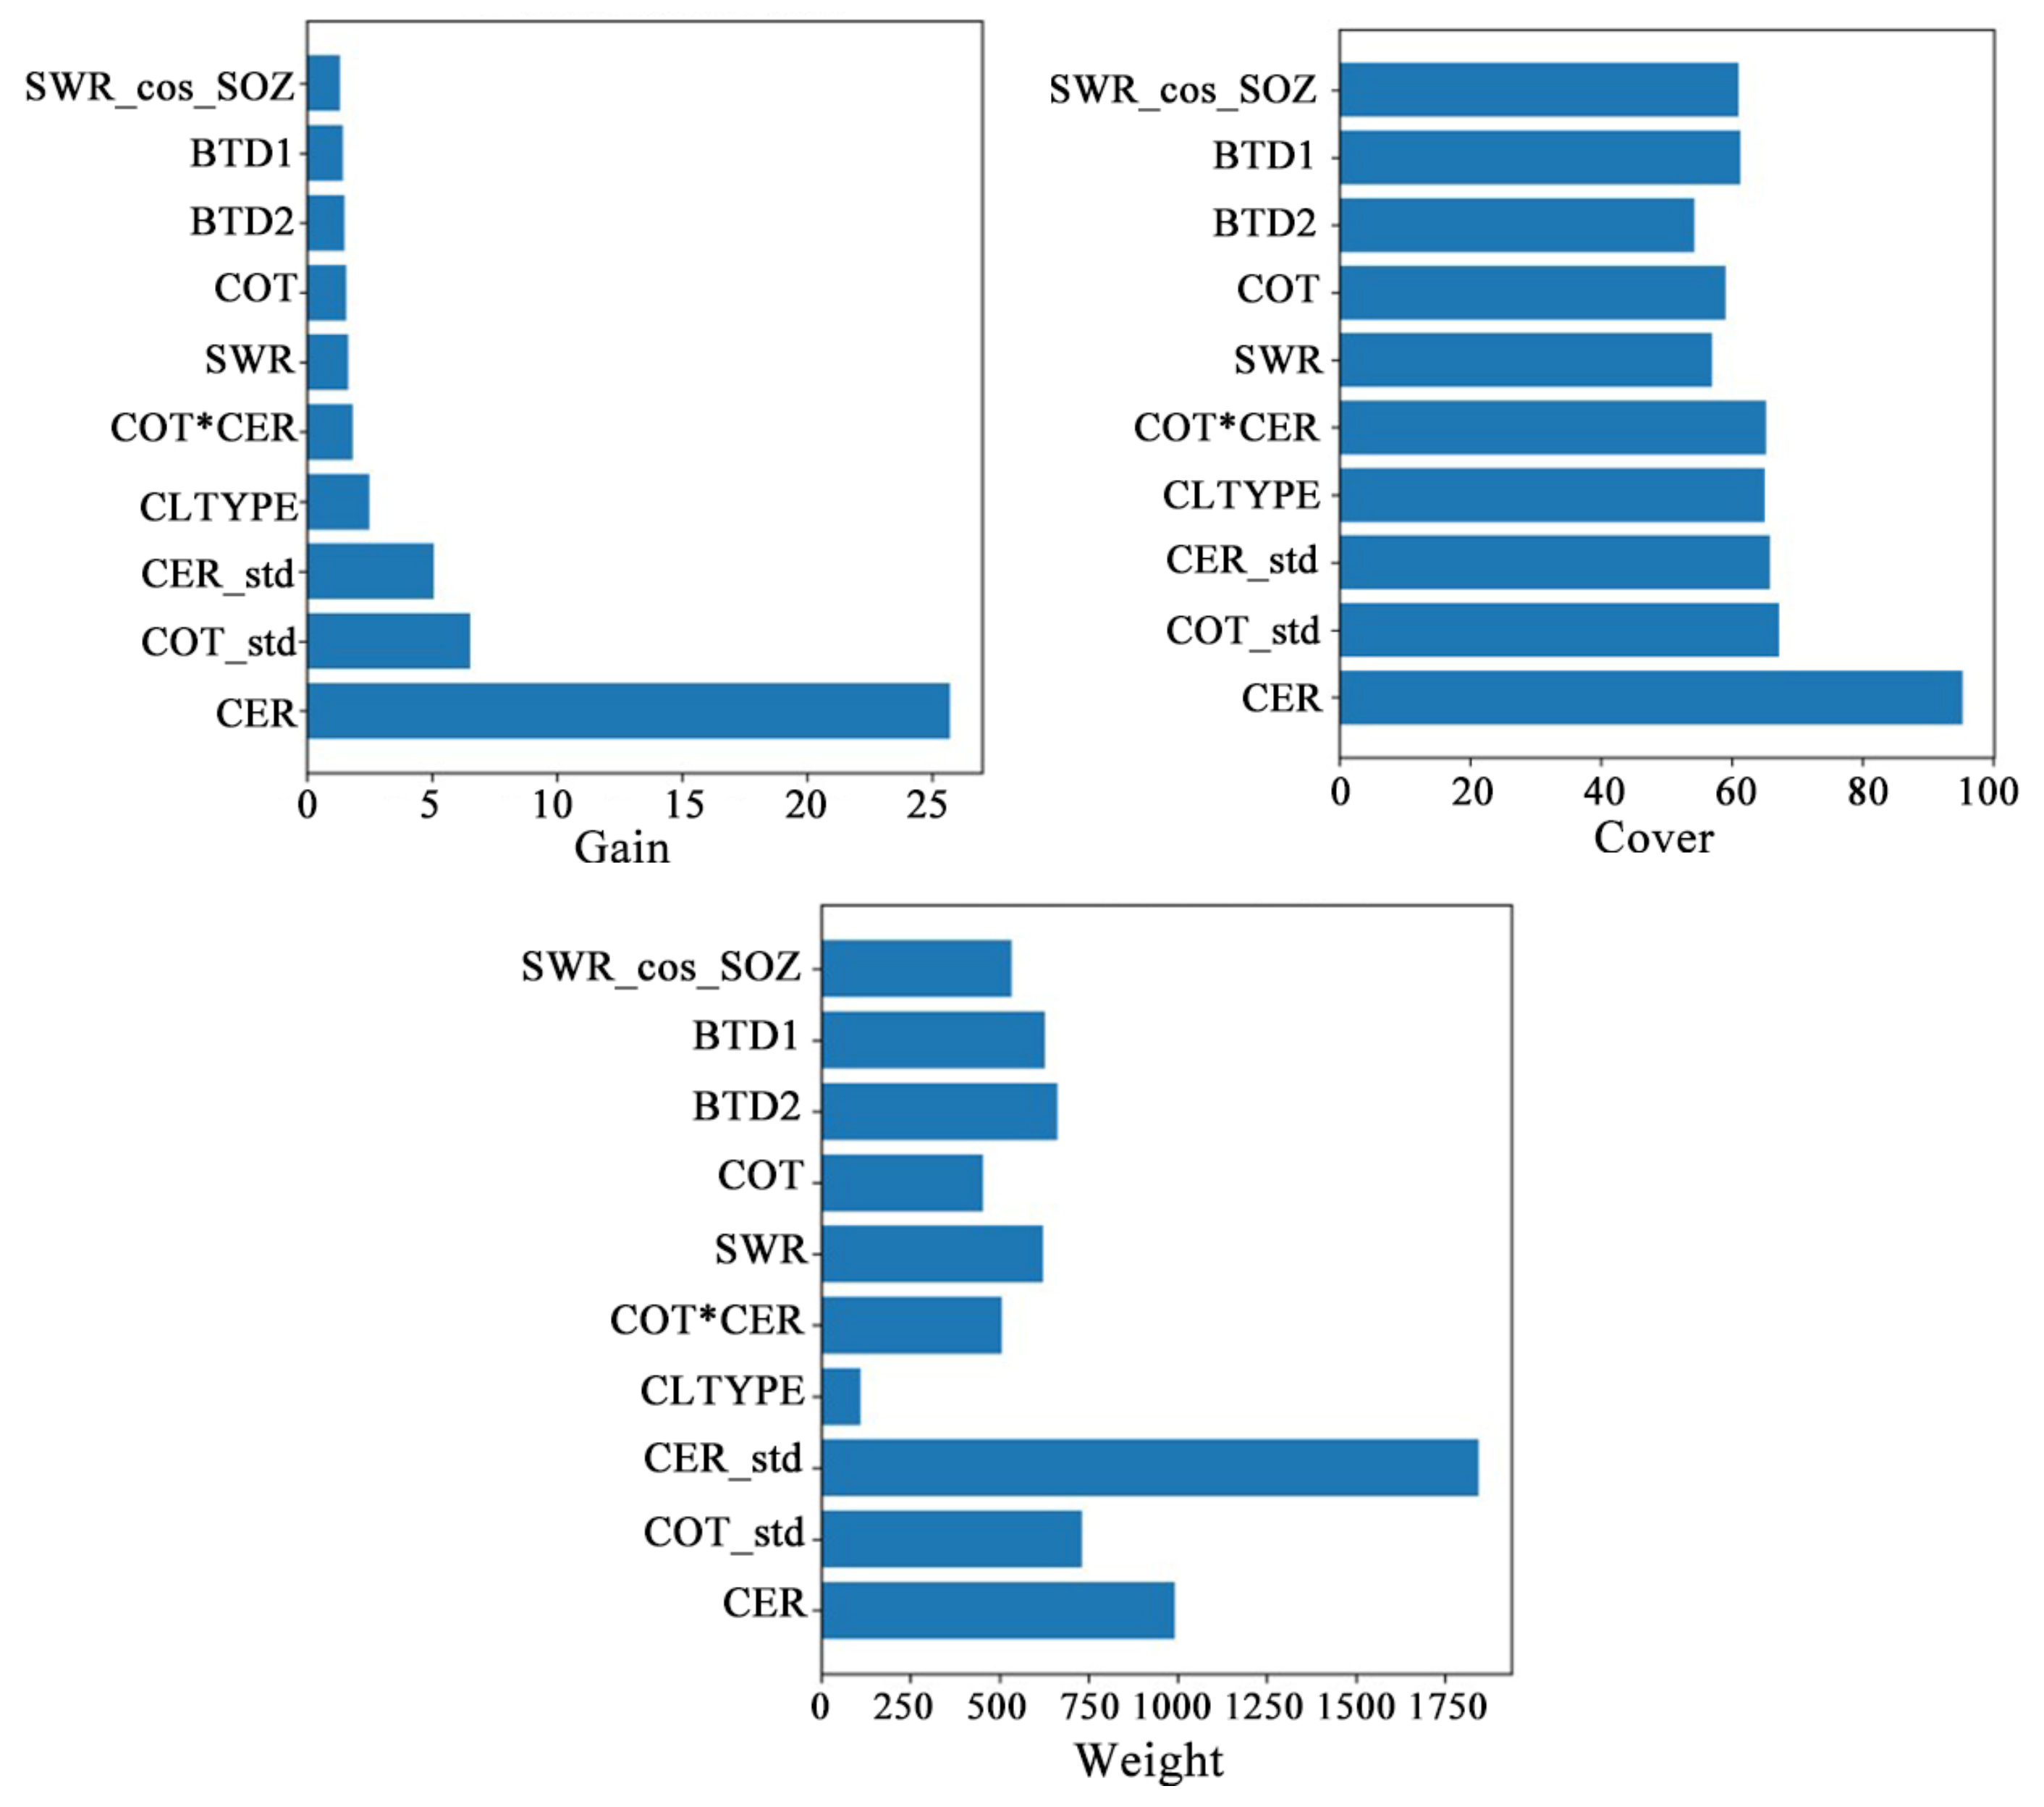
To clarify the actual contributions of COT and CER to model decision-making, this section performs a feature importance analysis based on the trained XGBoost model, comprehensively evaluating the classification contribution of each feature using three metrics: Gain, Weight, and Cover.
Feature importance analysis results are shown in Figure 9. Across Gain, Weight, and Cover metrics, COT, CER, and their neighborhood statistics dominated. CER ranked first in Gain by a clear margin, followed by COT_std, indicating cloud parameters contributed most to loss reduction at key splits. SWR_cos_SOZ steadily appeared in the top five across all three metrics, while BTD1 and BTD2 ranked lower, suggesting cloud parameters had become the primary decision basis for the model.
Figure 9.
Three importance metrics of built-in features.
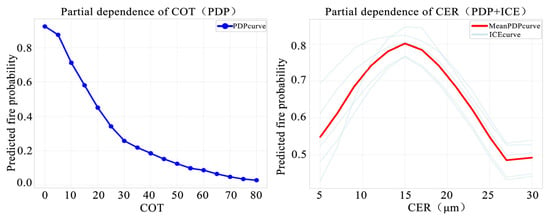
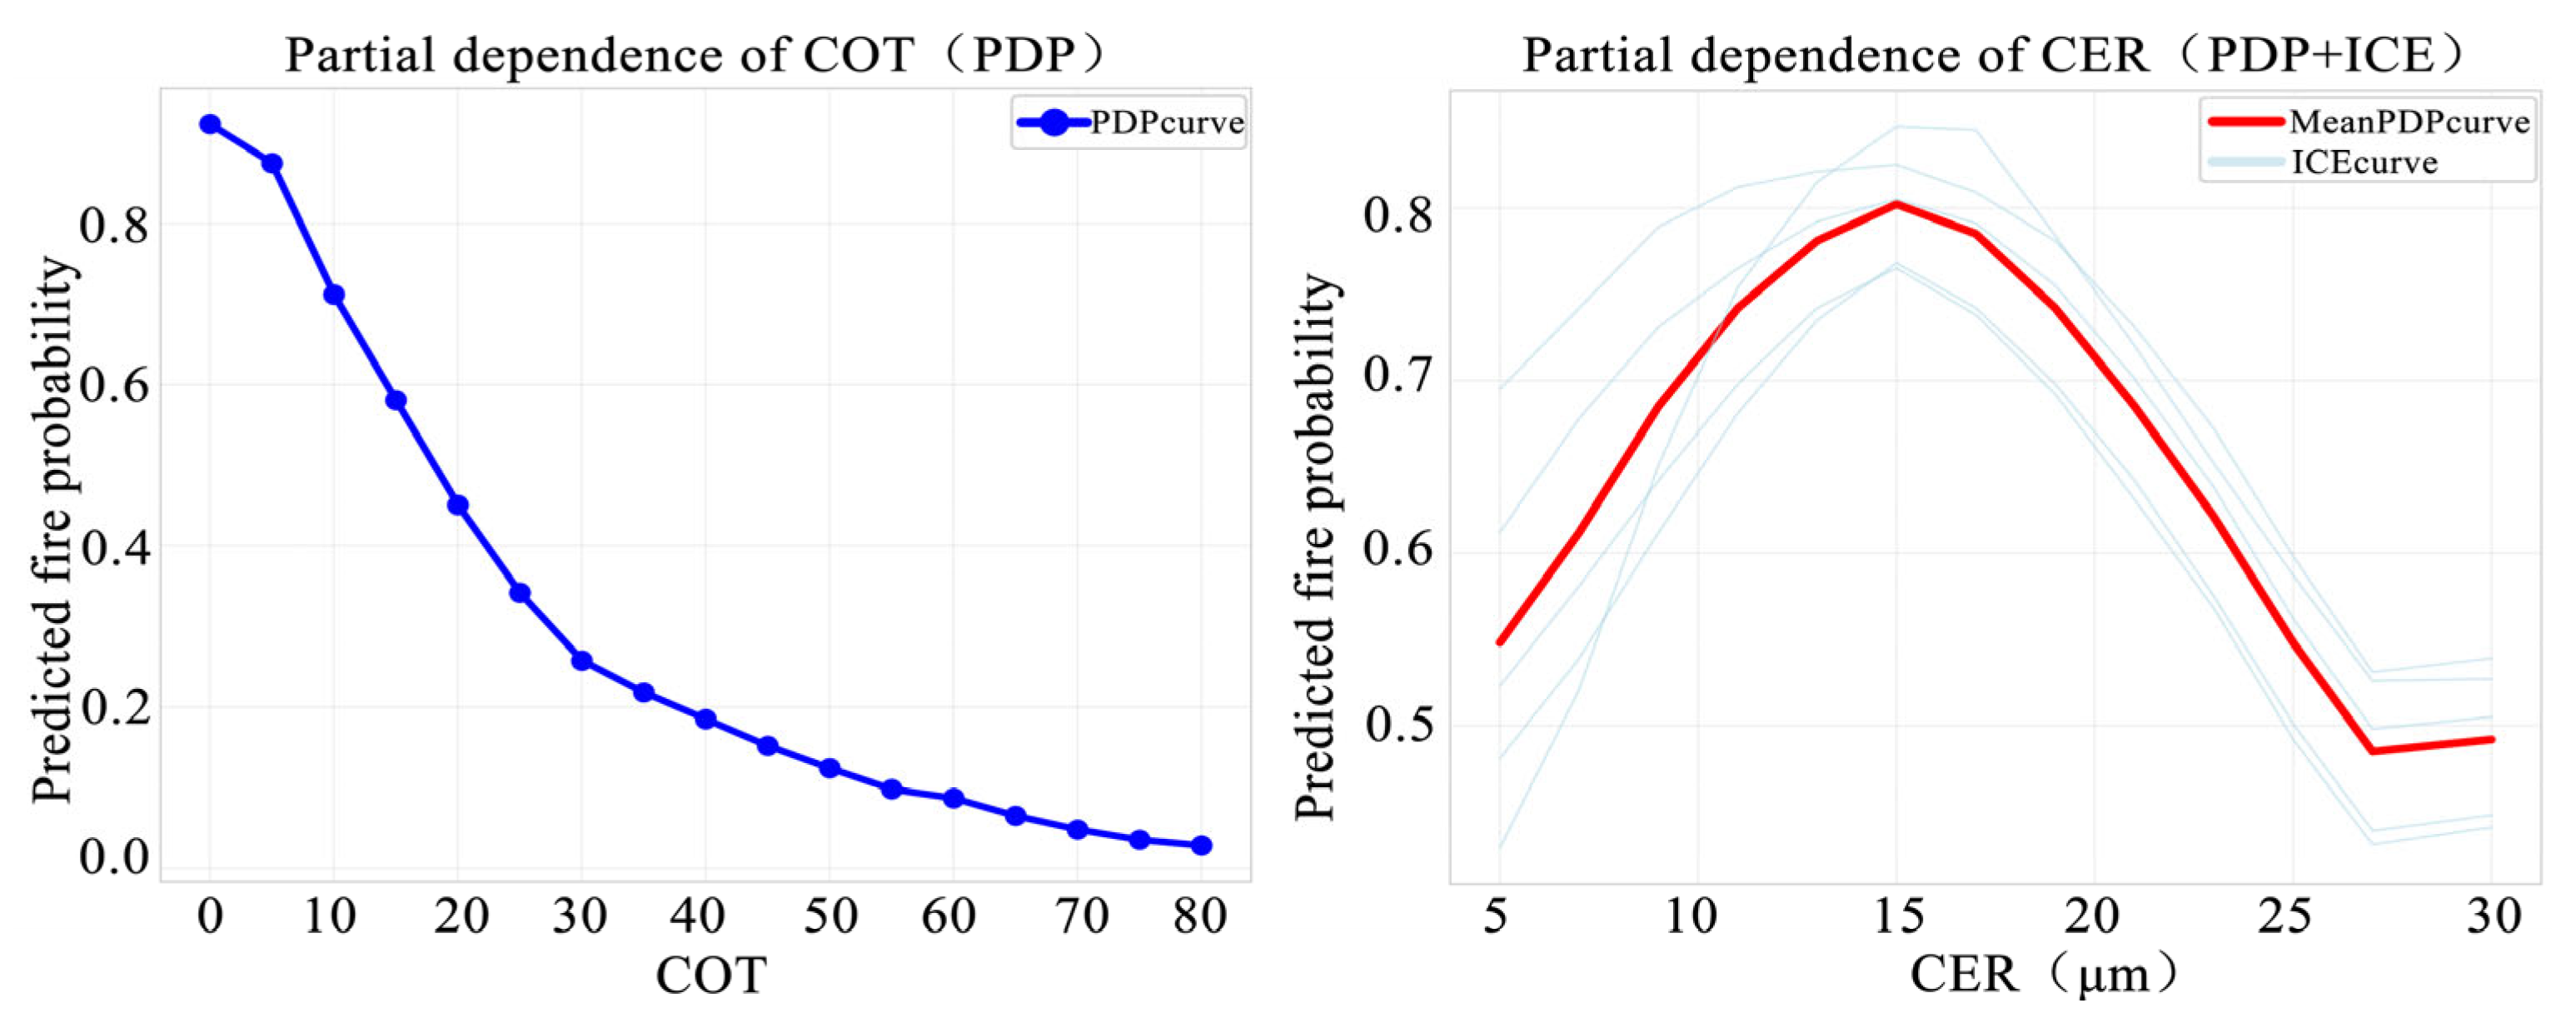
Partial dependence analysis (PDP) results (Figure 10) showed that as COT increased from 0 to 20, the predicted fire probability dropped sharply from 0.92 to 0.45; when COT exceeded 50, the probability fell further below 0.12, revealing a pronounced nonlinear threshold effect. This exponential-like decay is physically consistent with the Beer–Lambert law of radiative transfer, where increasing cloud optical thickness exponentially reduces the transmittance of upwelling thermal radiation from the fire. The PDP curve for CER exhibited a mild inverted U-shape over the [5, 25] μm range, peaking around 15 μm, indicating that both excessively small and excessively large cloud particle radii reduced the detection probability. The ICE curve demonstrates significant heterogeneity in the impact of CER, with samples above the fire point being more sensitive to changes in CER. This exponential-like decay is physically consistent with the Beer–Lambert law of radiative transfer, where increasing cloud optical thickness exponentially reduces the transmittance of upwelling thermal radiation from the fire.
Figure 10.
Partial dependence analysis results.
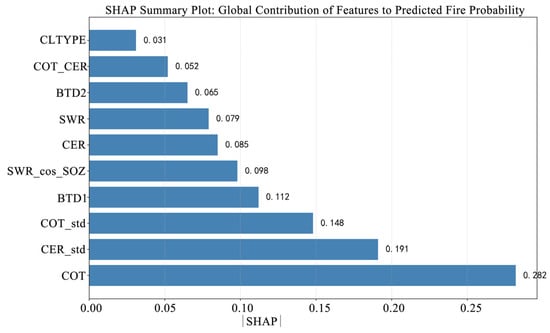
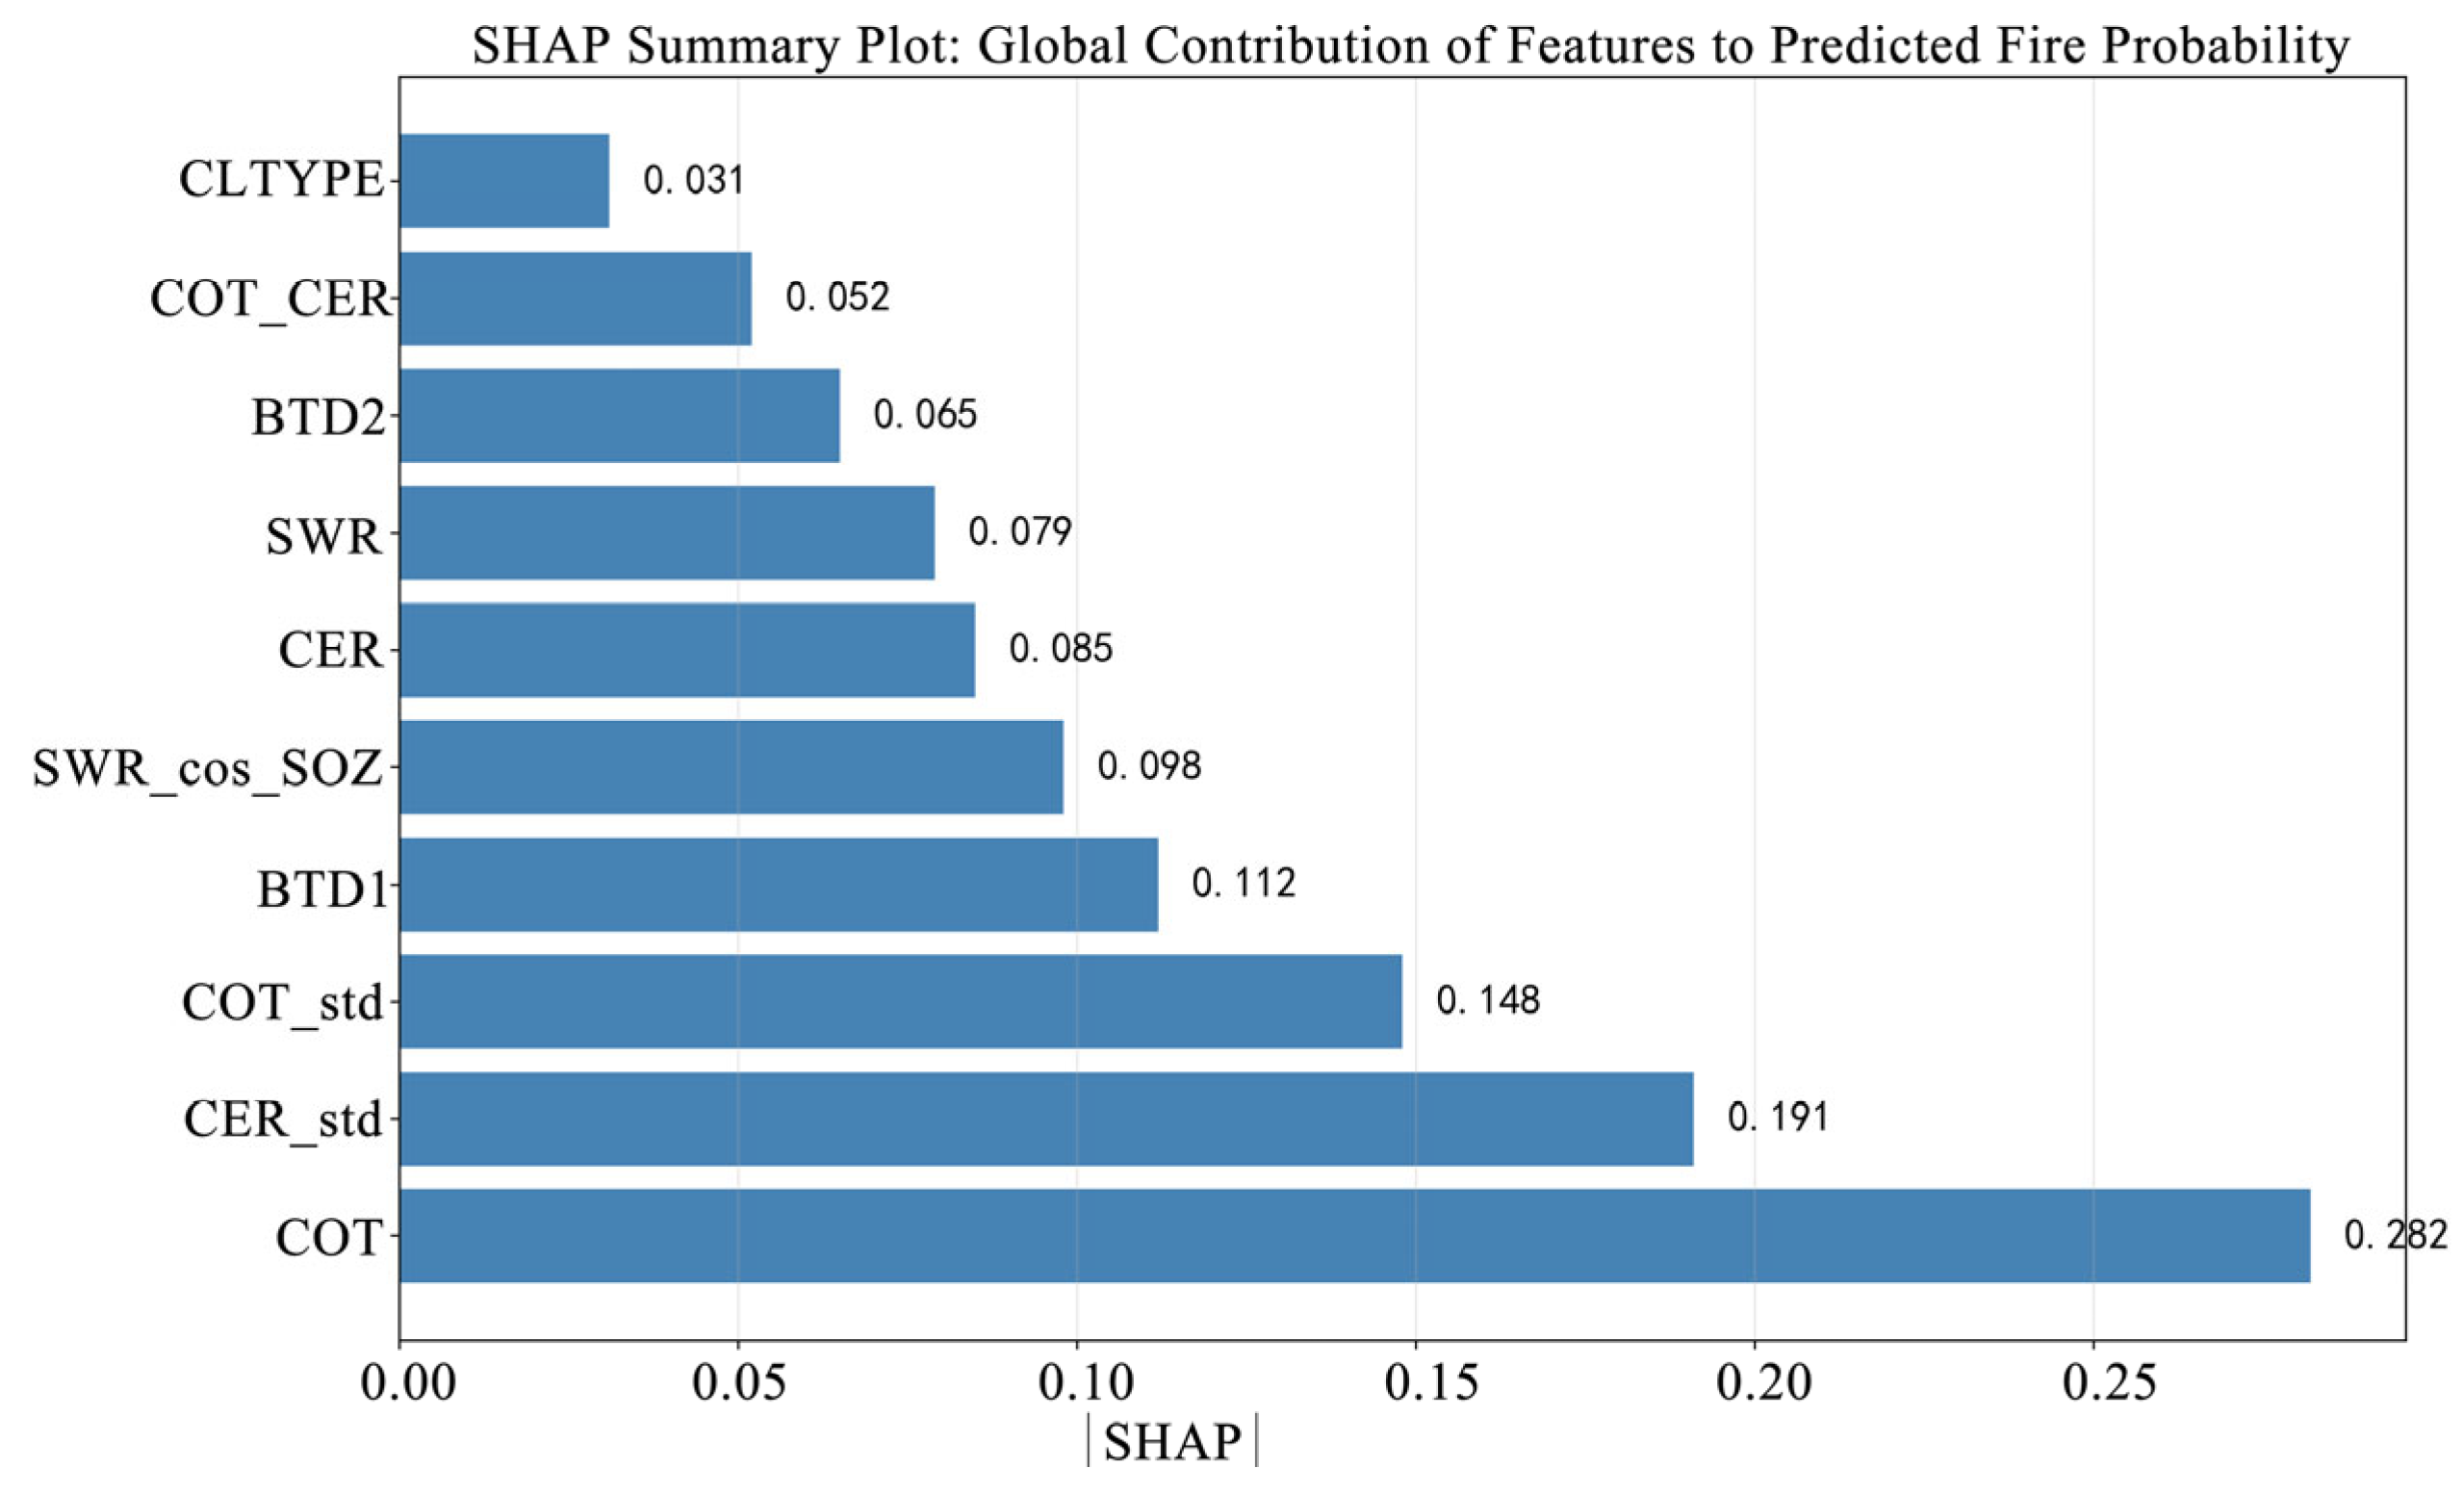
The SHAP analysis results (Figure 11) further validated these findings. COT exhibited the highest global mean absolute SHAP value (0.282), with high COT values showing strong negative SHAP contributions and low COT values showing positive contributions, which is fully consistent with the physical process of cloud-induced signal attenuation in radiative transfer.
Figure 11.
SHAP summary plot.
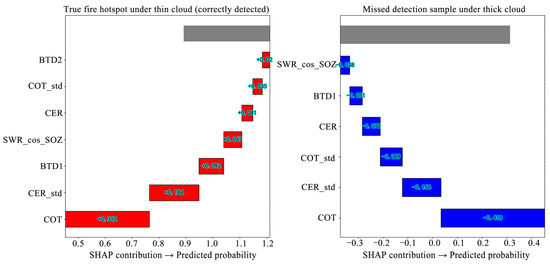
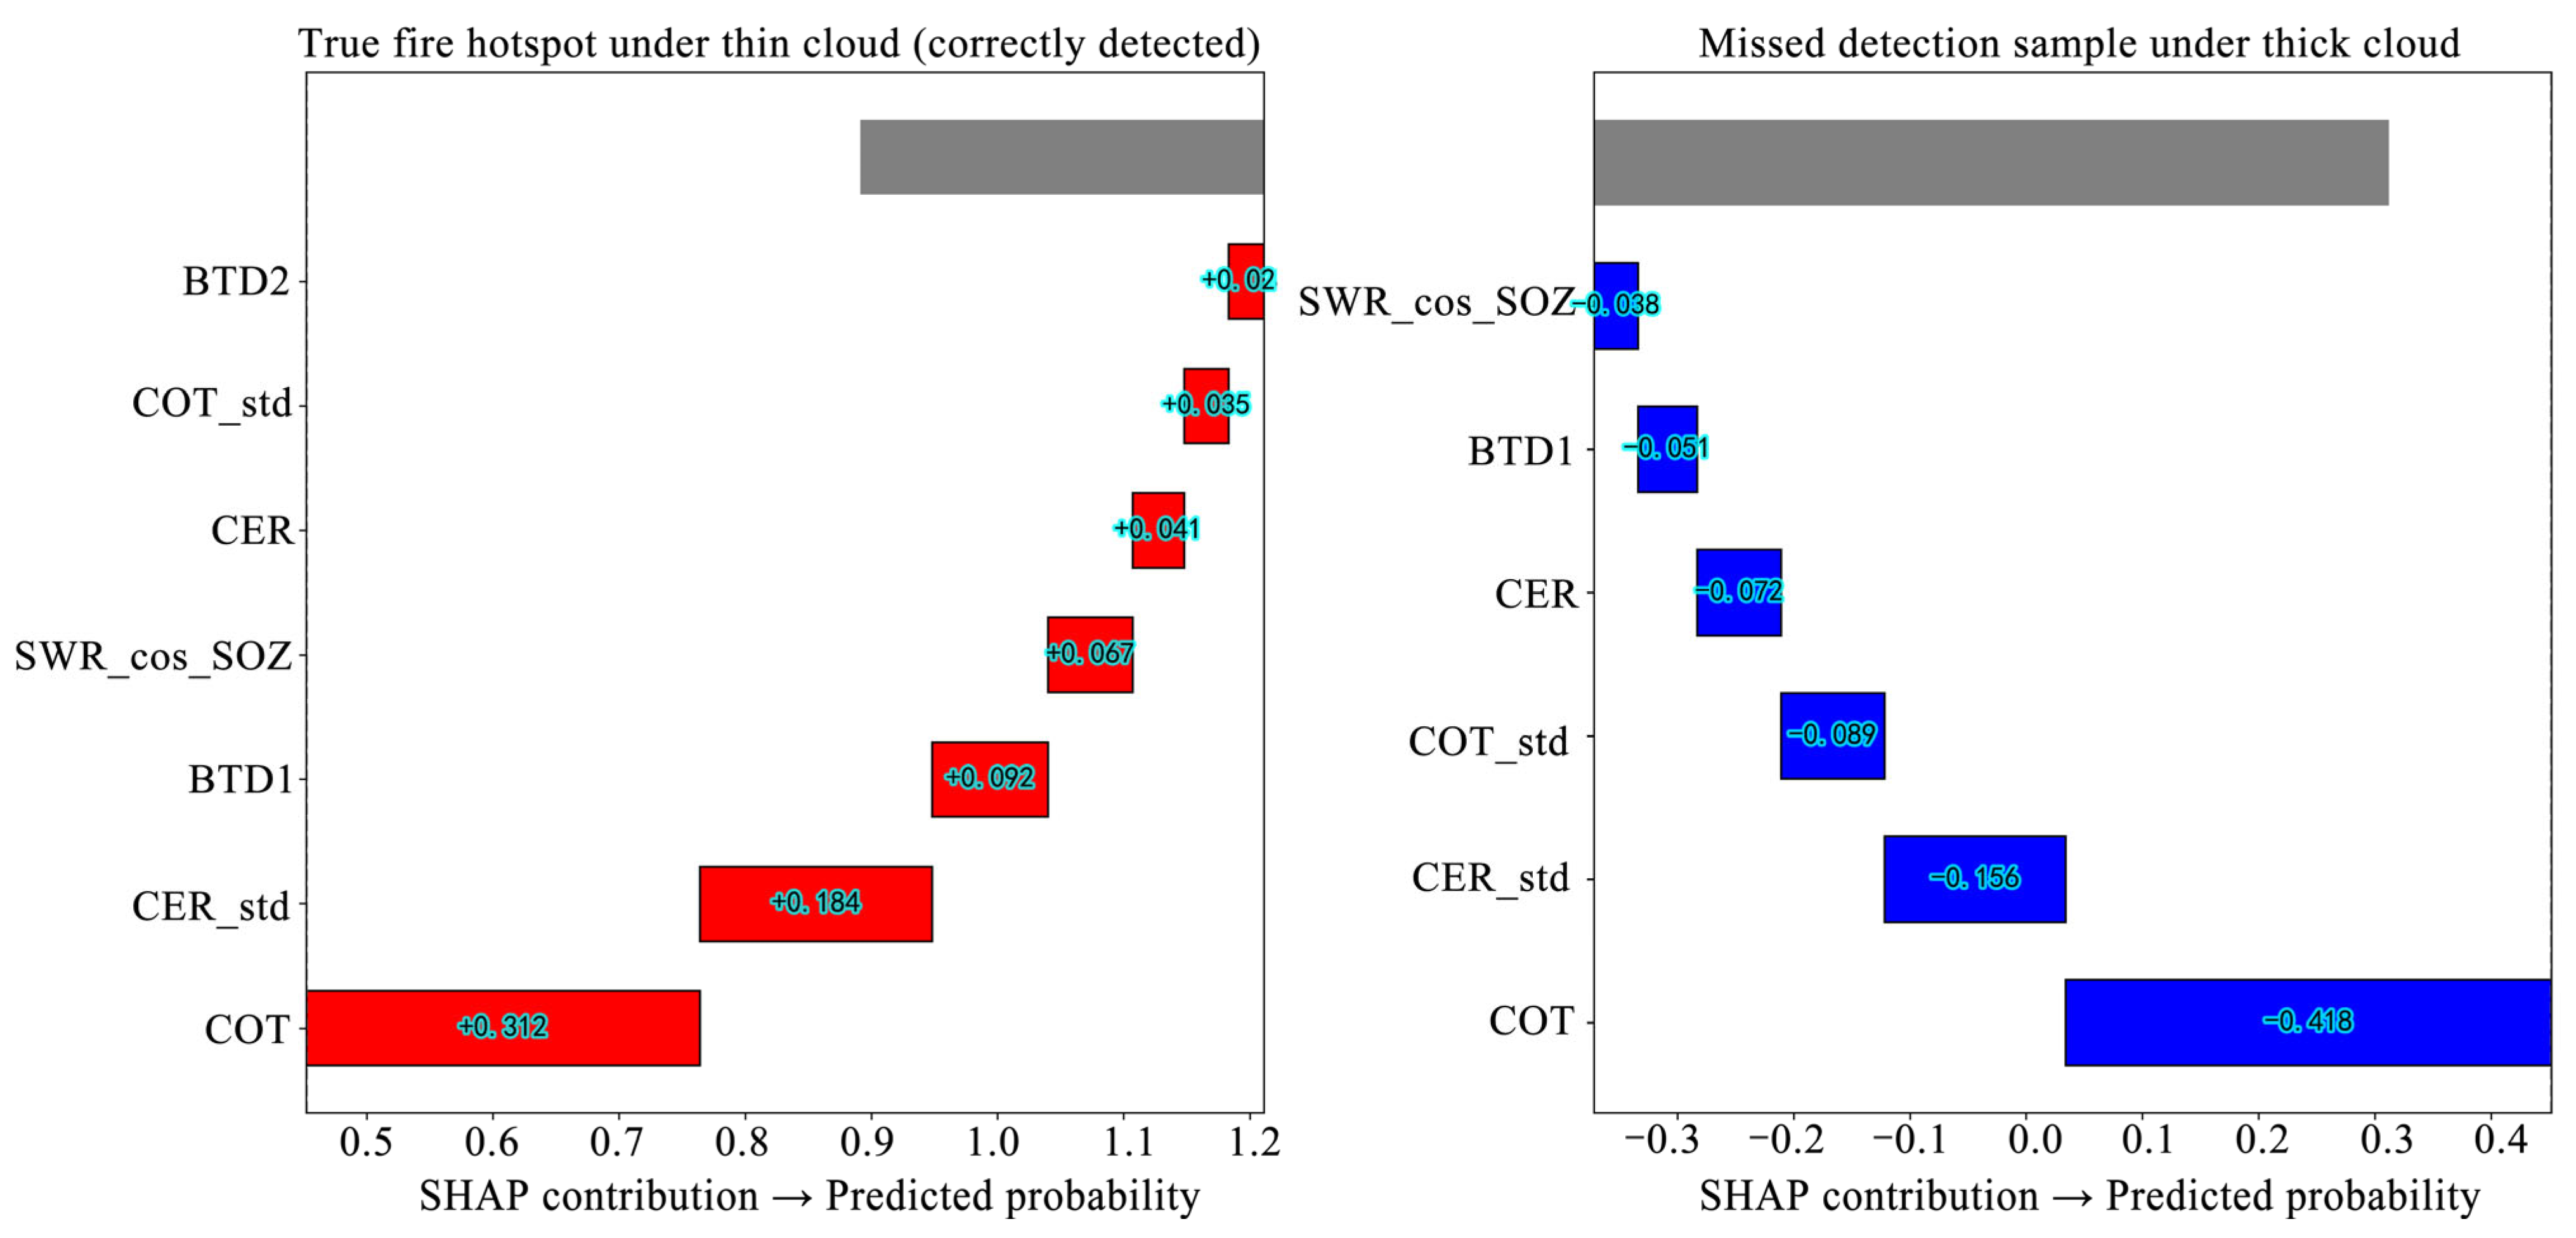
Figure 12 present force plots for typical samples. For example, sample #237 (true fire hotspot, COT = 8.2): COT contributed +0.31 and CER_std contributed +0.18, resulting in a final prediction probability of 0.89 (correctly detected). Sample #1562 (under-cloud missed detection, COT = 42.7): COT contributed −0.42 (the dominant factor), causing the final probability to drop to 0.31 (omission). Sample #891 (cloud-edge false alarm, COT = 3.5 but anomalous CER): CER contributed +0.25, driving the false alarm probability up to 0.76.
Figure 12.
Waterfall plot of a typical sample.
Stratified performance evaluation confirmed the nonlinear interference effect of cloud parameters on fire hotspot identification. The test set was divided into intervals by COT and CER values, revealing a clear gradient: under thin-cloud conditions (COT < 5, CER < 20 μm), both algorithms maintained high accuracy; when COT > 10 and CER > 25 μm, performance began to diverge, with the traditional algorithm declining notably first; when COT > 30 and CER > 40 μm, the miss rates of both methods increased sharply, yet XGBoost still maintained an F1-score approximately 0.2 higher than that of the traditional method. This indicates that thicker clouds and larger particles cause more severe attenuation of the fire signal.
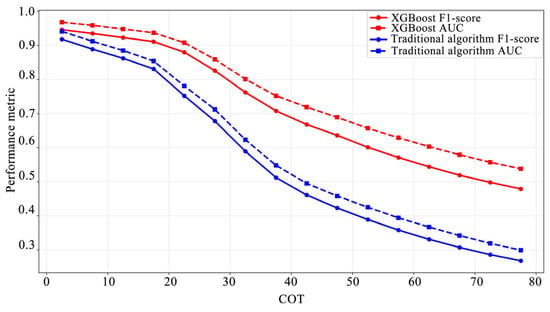
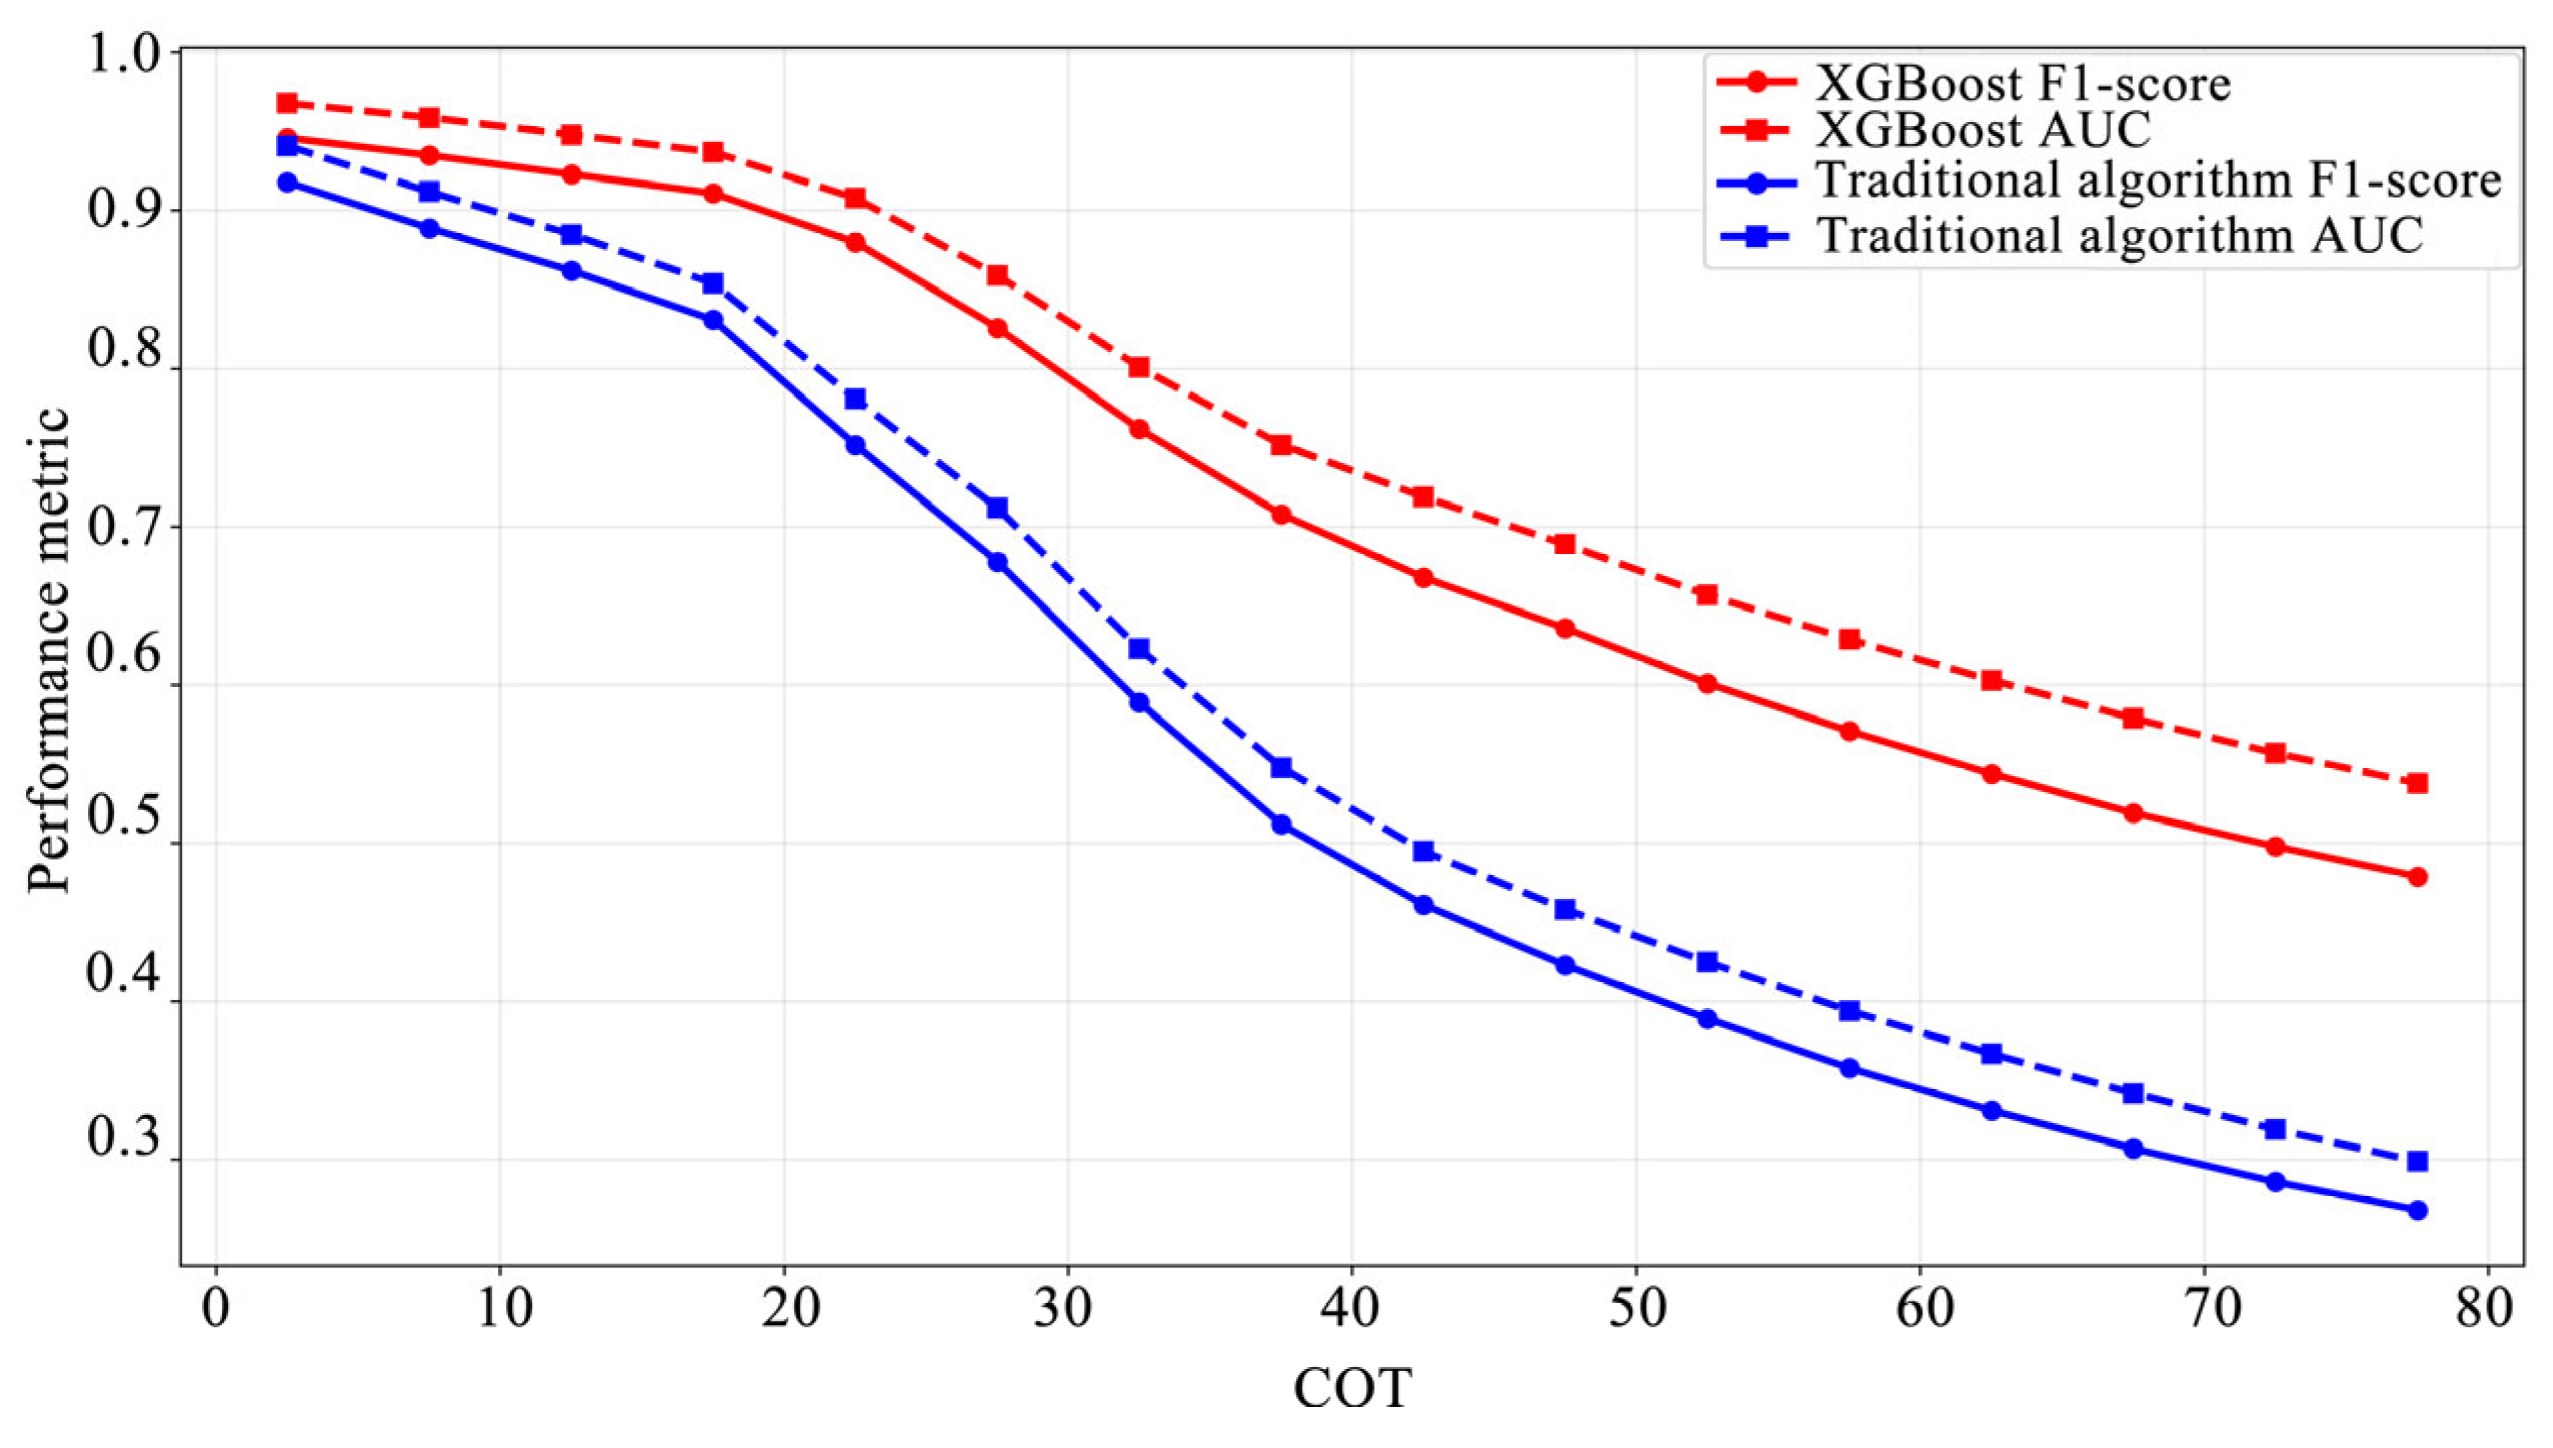
The stratified performance evaluation results by COT are presented in Table 4 and Figure 13. In the thin cloud interval (COT < 5), XGBoost achieved an F1-score of 0.946. In the medium cloud interval [5, 20), the F1-score remained above 0.880. When COT ≥ 50, XGBoost maintained a usable F1-score of 0.601, whereas the traditional algorithm dropped sharply to 0.389, essentially becoming ineffective. This result fully validates the effectiveness of introducing cloud parameters in improving fire detection capability over thick cloud regions.
Table 4.
Comparison of COT-stratified performance: XGBoost vs. traditional algorithms.
Figure 13.
F1-score/AUC trend curves of the proposed XGBoost algorithm and the traditional algorithm under different COT intervals.
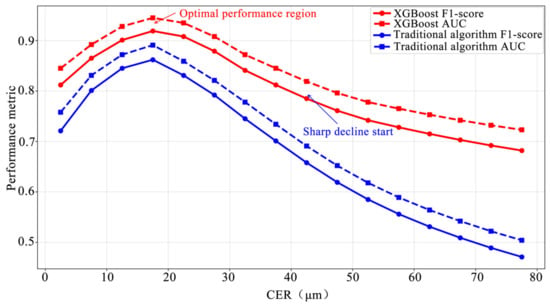
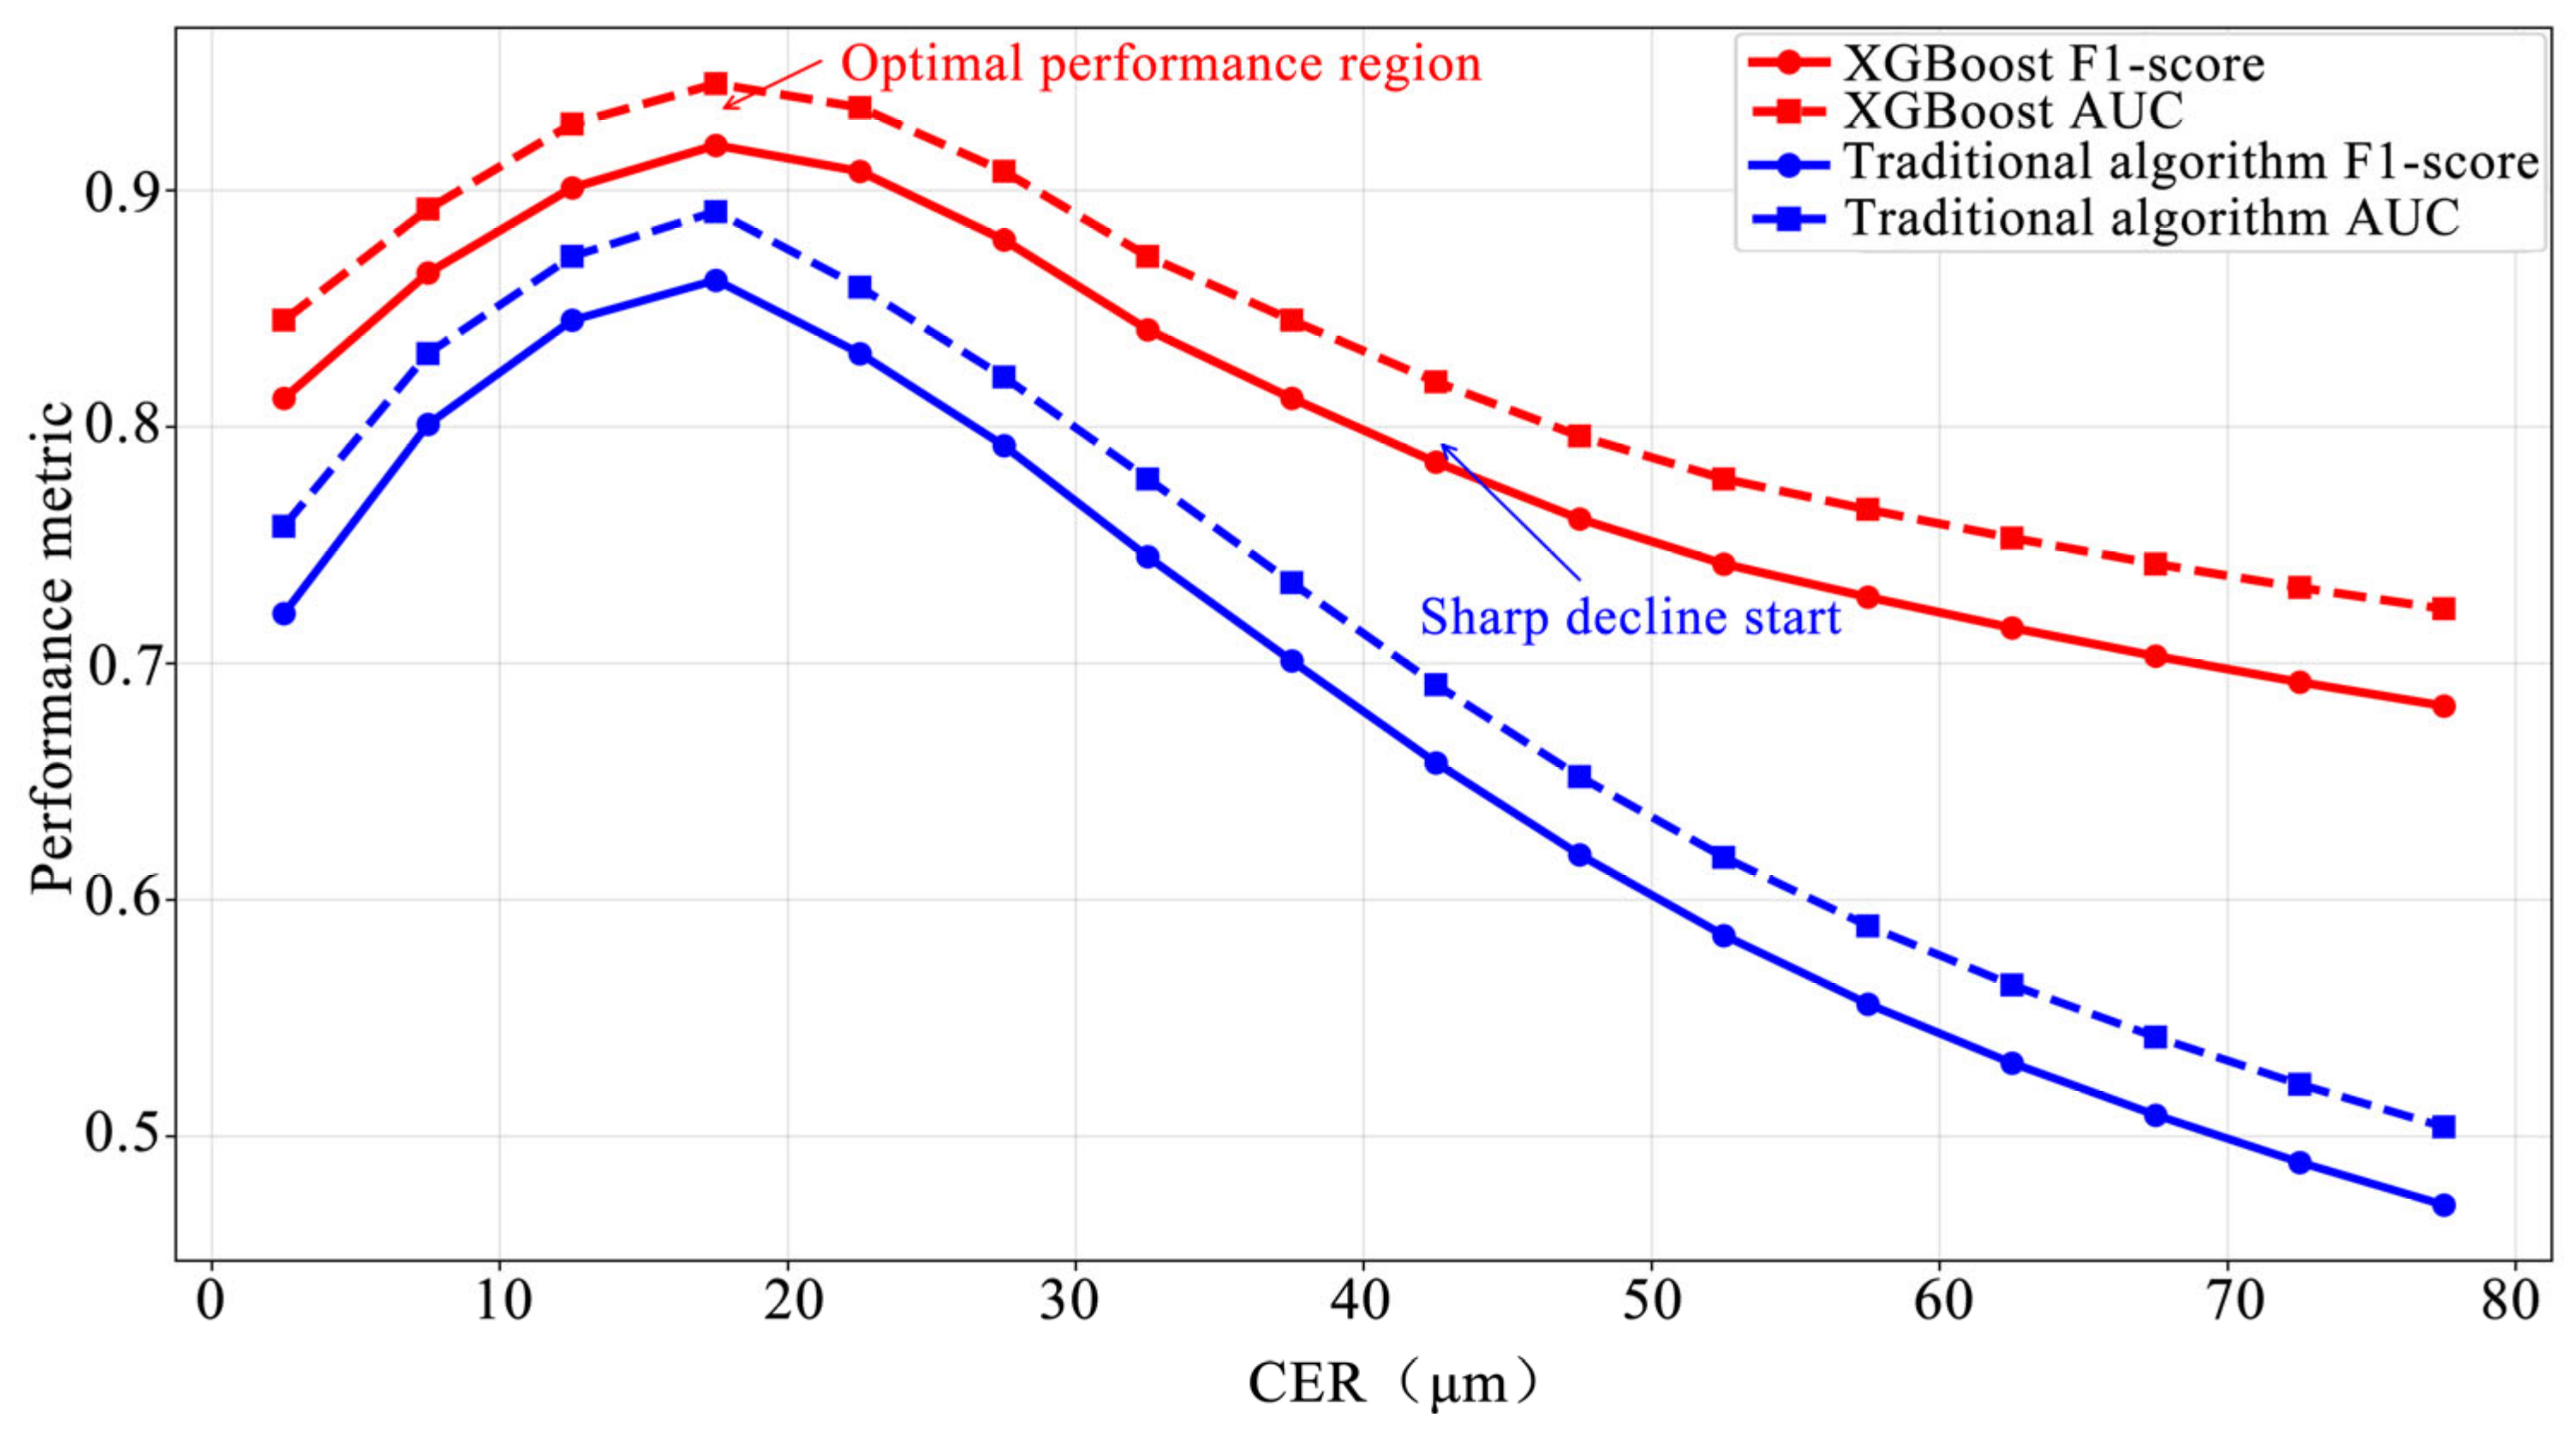
The variation trend along the CER dimension exhibited more pronounced nonlinear characteristics, as shown in Table 5 and Figure 14. In the CER range of 15–20 μm, the F1-score and AUC of XGBoost reached their peak values (approximately 0.93 and 0.95, respectively), forming a distinct optimal cloud particle radius window. When CER exceeded 25 μm, the performance began to decline gradually; beyond 40 μm, an abrupt change occurred, with the curve slope increasing markedly and both F1-score and AUC dropping rapidly. The traditional algorithm exhibited an earlier and more drastic decline across the entire CER range, and had essentially lost effective detection capability when CER exceeded 30 μm.
Table 5.
Comparison of CER-stratified performance: XGBoost vs. traditional algorithms.
Figure 14.
F1-score/AUC trend curves of the proposed XGBoost algorithm and the traditional algorithm under different CER intervals.
4.2.2. Model Optimization Results
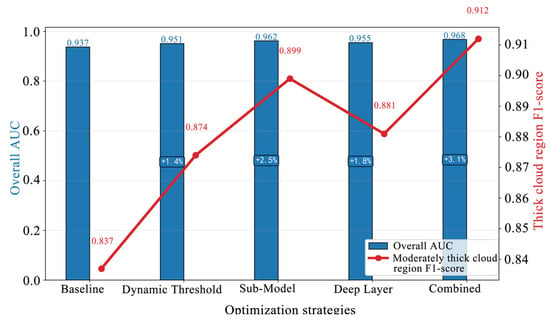
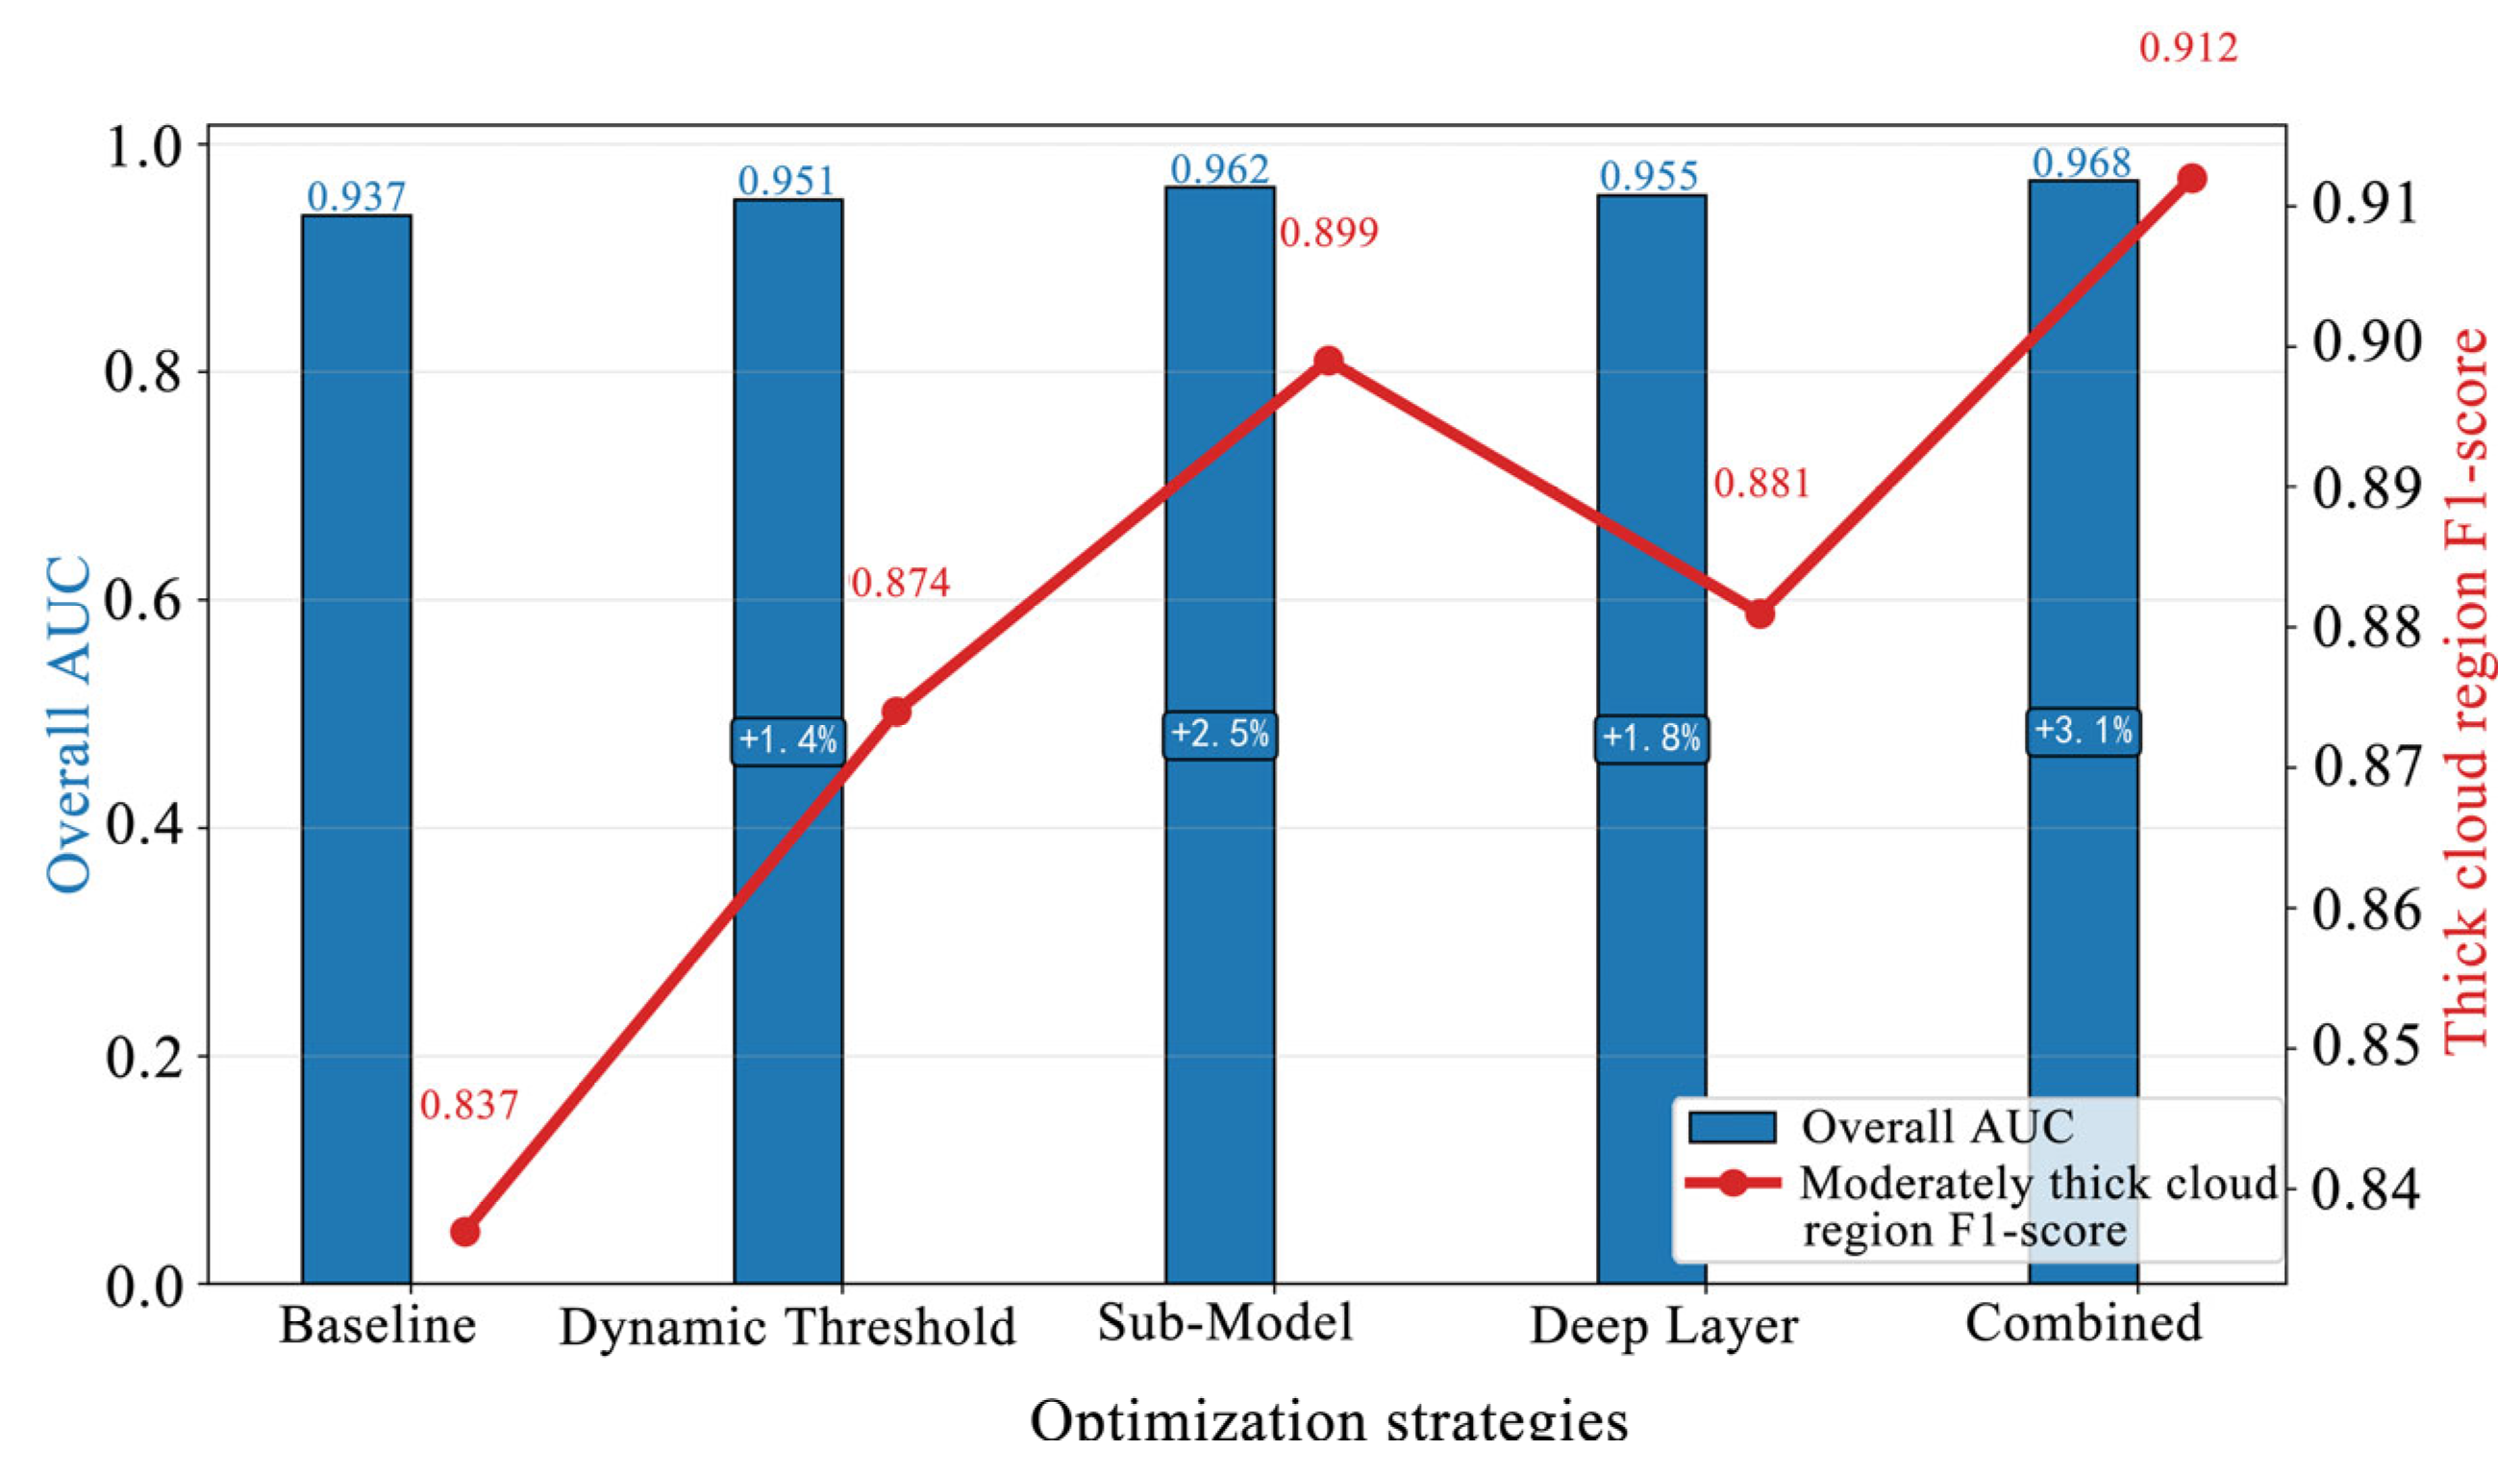
The comprehensive evaluation of the joint application of the four optimization strategies is shown in Figure 15. The fusion of dynamic thresholding and uncertainty quantification improved the F1-score in moderately thick cloud regions by 3.7%; the sub-model and depth structure strategy improved it by 7.8%; and feature reduction improved it by 6.2%. After combining all four strategies, the overall AUC reached 0.968, usability in moderately thick cloud regions was significantly enhanced, and the F1-score in thick cloud regions increased from 0.837 to 0.912 (a gain of 9.0%). These results fully demonstrate the scientific validity and engineering value of the targeted optimization pathway based on the influence mechanisms of cloud parameters, and effectively mitigate the issues of missed detections in thick cloud zones and false alarms at cloud edges.
Figure 15.
Comparison of comprehensive performance improvement for different optimization strategies.
Based on the above evaluation results, it is evident that machine learning models generally yield higher predictive accuracy and larger AUC values. For instance, in a national-scale assessment of Montenegro, the MaxEnt model (AUC = 0.81) substantially outperformed the GIS-MCDA/AHP approach (AUC = 0.51) [42]; the MCDA model based on Combination Weighting of Game Theory (CWGT) reported an AUC of 0.700 [43]; and the XGBoost model employed in this study achieved an AUC of 0.968. These comparisons collectively demonstrate the superiority of machine learning methods over traditional MCDA approaches for forest fire monitoring, and clearly justify the rationality and methodological advancement of our model selection.
5. Discussion
The core contribution of this study lies in explicitly incorporating cloud optical thickness (COT) and cloud effective radius (CER) as physical constraints within the forest fire monitoring model, and systematically revealing their nonlinear influence mechanisms through multi-dimensional interpretable analysis. Unlike traditional methods that rely solely on brightness temperature thresholds, our model was able to extract reliable fire information from attenuated signals under thick cloud conditions. Feature importance analysis demonstrated that COT and CER surpassed conventional brightness temperature difference indices in decision-making, which closely aligns with radiative transfer physics—fire signals in the mid-infrared channel are exponentially suppressed as COT increases, consistent with the Beer–Lambert law. The inverted U-shaped response to CER, with an optimal particle radius around 15 μm, corresponds to the Mie scattering regime where extinction efficiency is minimized. Stratified performance evaluation further identified a critical transition interval at COT 20–30, where the traditional algorithm loses effectiveness while the proposed XGBoost model maintained robust performance. This resilience is largely attributed to the effective utilization of neighborhood statistical features (COT_std, CER_std), which capture spatial heterogeneity at cloud edges and thin–thick cloud boundaries. Moreover, partial dependence analysis revealed an inverted U-shaped response to CER, with an optimal particle radius window around 15 μm providing relatively strong signal penetration, thus offering a quantitative basis for predicting under-cloud detection feasibility.
The joint application of dynamic threshold adjustment, uncertainty quantification, cloud-conditioned sub-models, and feature reduction improved the F1-score in thick cloud regions by 9.0%, demonstrating that adaptive strategies driven by cloud parameters can substantially mitigate cloud-induced omission errors. SHAP-based local explanations further strengthen the operational transparency of the model by showing the magnitude and direction of each feature’s contribution to individual predictions, thereby enhancing operator trust in automated results. Despite these advances, several limitations remain. The model was trained exclusively on Himawari-8/9 data from southern Hunan, and its generalization to other regions and climatic conditions requires validation. Meteorological factors such as terrain slope, wind direction, and humidity were not integrated, although they can significantly influence fire spread and cloud dynamics. The hourly temporal resolution adopted here does not fully exploit the 10 min capability of Himawari-8/9, suggesting that future work could incorporate time series models such as LSTM or Transformer for dynamic perception of fires under clouds, because fire radiative signals exhibit continuous temporal evolution, and these sequential architectures can capture the signal variations before, during, and after cloud obscuration. Beyond sequential models, attention-based deep fusion networks could further improve detection under complex cloud interference by learning robust spatiotemporal representations. Future work should integrate ground-based records and multi-source satellite products to perform cross-validation and further validate the model’s generalizability. Moreover, multi-source data fusion, particularly the integration of optical and SAR data, represents an emerging trend that may enable all-weather wildfire monitoring in operational systems.
6. Conclusions
This study set out to evaluate whether the inclusion of physical cloud parameters—cloud optical thickness (COT) and cloud effective radius (CER)—can improve the internal consistency and robustness of Himawari-8/9-based hotspot identification under cloudy conditions, using the official WLF product as the reference standard. The XGBoost model achieved optimal performance (Accuracy = 0.904, F1-score = 0.904, AUC = 0.937), improving under-cloud fire detection accuracy by 92.7% and reducing the omission rate by 77.0% compared with the traditional brightness temperature algorithm. The main contribution of this work is twofold. First, it provides a systematic, physically constrained framework that moves beyond the conventional “cloud-masking” paradigm by explicitly incorporating COT and CER as input features rather than treating clouds solely as noise to be discarded. Second, through multi-dimensional interpretable analysis (feature importance, SHAP, and partial dependence), it quantitatively reveals how these cloud parameters nonlinearly attenuate fire thermal radiation signals, offering a mechanistic understanding that is largely absent in previous fire detection studies.
Regarding the influence of COT and CER on fire detection, several key scientific insights emerge. COT exerts a dominant negative control over fire detectability (mean absolute SHAP value = 0.282), with an exponential-like decay pattern consistent with the Beer–Lambert law of radiative transfer. This effect is most pronounced in the critical transition interval of COT 20–30, where detection becomes highly uncertain. In contrast, CER exhibits a more nuanced inverted U-shaped influence, with an optimal particle radius window around 15 μm corresponding to minimized Mie extinction efficiency. These findings demonstrate that cloud parameters do not merely introduce random noise, but follow physically interpretable attenuation laws that can be modeled and, to some extent, compensated for when appropriate features are incorporated into the learning framework.
The implications for operational fire monitoring are twofold. On one hand, the dynamic threshold adjustment and uncertainty quantification strategies developed in this study offer a practical pathway for integrating cloud-aware decision rules into existing early warning systems, potentially reducing both false alarms at cloud edges and missed detections under thick cloud cover. The joint application of these optimization strategies—dynamic threshold adjustment, uncertainty quantification, cloud-conditioned sub-models, and feature reduction—elevated the overall AUC to 0.968 and improved the thick-cloud F1-score from 0.837 to 0.912 (a 9.0% gain). On the other hand, the SHAP-based local explanations provide operators with interpretable justifications for each alert, which is critical for building trust in automated fire detection products.
Nevertheless, the approach has several limitations that must be clearly acknowledged. First, the model was trained and validated exclusively on Himawari-8/9 data from southern Hunan (August–October 2022), and its transferability across different seasons, years, and geographic regions remains unverified. Second, all training and validation samples were derived from the Himawari-8/9 official WLF product rather than from independent ground-based records or other satellite products (e.g., MODIS, VIIRS, Landsat). Consequently, the results support the conclusion that cloud parameters improve the internal consistency of the Himawari-based system, but do not constitute a validation of absolute fire occurrence on the ground. Third, the cloud detection thresholds adopted in this study were sourced from the literature and official documentation with minor local adjustments, yet no systematic sensitivity analysis or cross-regional transferability assessment was conducted.
The next research steps should focus on four directions. First, the model should be evaluated on multi-year and full-season datasets to assess its temporal generalizability. Second, independent reference data from ground-based records and multi-source satellite products should be integrated for rigorous cross-validation of absolute fire detection performance. Third, the current hourly temporal resolution should be upgraded to fully exploit the 10 min capability of Himawari-8/9, potentially through LSTM or Transformer architectures that capture temporal evolution of fire radiative signals. Fourth, multi-sensor synergistic frameworks, combining optical geostationary data with polar orbiting active fire products and SAR imagery, could enable all-weather wildfire monitoring in operational systems. Despite these limitations, the cloud-parameter-constrained XGBoost framework proposed in this study provides a robust and interpretable baseline for advancing forest fire monitoring under complex cloud conditions.
Author Contributions
Z.Y. and X.X. jointly conceived and designed the study; X.X. wrote the first draft, analyzed the data, and collected all the study data; Z.Y. and G.Z. provided critical insights in editing the manuscript. All authors have read and agreed to the published version of the manuscript.
Funding
This research was funded by the Natural Science Foundation of Hunan Province (grant: № 2022JJ31006).
Data Availability Statement
We thank the Japan Meteorological Agency for the Himawari-8/9. series data. We thank the China Forest and Grassland Fire Prevention and Suppression Network for providing fire data records. We thank the European Centre for Medium-Range Weather Forecasts (ECMWF) for providing the ERA5 data.
Acknowledgments
During the preparation of this work, the authors used OpenAI’s ChatGPT (GPT-4 Turbo) and DeepSeek-V4 for English translation and language polishing. The authors have fully reviewed, revised and modified all AI-assisted content, and take full responsibility for all of the content of this publication.
Conflicts of Interest
The authors declare no conflicts of interest.
References
- Flannigan, M.; Cantin, A.S.; De Groot, W.J.; Wotton, M.; Newbery, A.; Gowman, L.M. Global Wildland Fire Season Severity in the 21st Century. For. Ecol. Manag. 2013, 294, 54–61. [Google Scholar] [CrossRef] [Scilit]
- Xu, G.; Zhong, X. Real-Time Wildfire Detection and Tracking in Australia Using Geostationary Satellite: Himawari-8. Remote Sens. Lett. 2017, 8, 1052–1061. [Google Scholar] [CrossRef] [Scilit]
- Wickramasinghe, C.H.; Jones, S.; Reinke, K.; Wallace, L. Development of a Multi-Spatial Resolution Approach to the Surveillance of Active Fire Lines Using Himawari-8. Remote Sens. 2016, 8, 932. [Google Scholar] [CrossRef] [Scilit]
- Hua, L.; Shao, G. The Progress of Operational Forest Fire Monitoring with Infrared Remote Sensing. J. For. Res. 2017, 28, 215–229. [Google Scholar]
- Schroeder, W.; Oliva, P.; Giglio, L.; Csiszar, I.A. The New VIIRS 375 m Active Fire Detection Data Product: Algorithm Description and Initial Assessment. Remote Sens. Environ. 2014, 143, 85–96. [Google Scholar] [CrossRef] [Scilit]
- Giglio, L.; Schroeder, W.; Justice, C.O. The Collection 6 MODIS Active Fire Detection Algorithm and Fire Products. Remote Sens. Environ. 2016, 178, 31–41. [Google Scholar] [CrossRef] [Scilit] [PubMed]
- Schmit, T.J.; Griffith, P.; Gunshor, M.M.; Daniels, J.M.; Goodman, S.J.; Lebair, W.J. A Closer Look at the ABI on the Goes-r Series. Bull. Am. Meteorol. Soc. 2017, 98, 681–698. [Google Scholar] [CrossRef] [Scilit]
- Bessho, K.; Date, K.; Hayashi, M.; Ikeda, A.; Imai, T.; Inoue, H.; Kumagai, Y.; Miyakawa, T.; Murata, H.; Ohno, T.; et al. An Introduction to Himawari-8/9—Japan’s New-Generation Geostationary Meteorological Satellites. J. Meteorol. Soc. Jpn. 2016, 94, 151–183. [Google Scholar] [CrossRef] [Scilit]
- Na, L.; Zhang, J.; Bao, Y.; Bao, Y.; Na, R.; Tong, S.; Si, A. Himawari-8 Satellite Based Dynamic Monitoring of Grassland Fire in China-Mongolia Border Regions. Sensors 2018, 18, 276. [Google Scholar] [CrossRef] [Scilit] [PubMed]
- Liu, X.; Ming, Y. Fusing Instantaneous and Historical Spatial–Contextual Brightness Temperature Differences for Himawari-8/9 Active Fire Detection. Remote Sens. 2026, 18, 907. [Google Scholar] [CrossRef] [Scilit]
- Li, F.; Zhang, X.; Kondragunta, S. Biomass Burning in Africa: An Investigation of Fire Radiative Power Missed by MODIS Using the 375 m VIIRS Active Fire Product. Remote Sens. 2020, 12, 1561. [Google Scholar] [CrossRef] [Scilit]
- Peterson, D.A.; Fromm, M.D.; McRae, R.H.D.; Campbell, J.R.; Hyer, E.J.; Taha, G.; Camacho, C.P.; Kablick, G.P.; Schmidt, C.C.; DeLand, M.T. Australia’s Black Summer Pyrocumulonimbus Super Outbreak Reveals Potential for Increasingly Extreme Stratospheric Smoke Events. npj Clim. Atmos. Sci. 2021, 4, 38. [Google Scholar] [CrossRef] [Scilit]
- Kaufman, Y.J.; Justice, C.O.; Flynn, L.P.; Kendall, J.D.; Prins, E.M.; Giglio, L.; Ward, D.E.; Menzel, W.P.; Setzer, A.W. Potential Global Fire Monitoring from EOS-MODIS. J. Geophys. Res. Atmos. 1998, 103, 32215–32238. [Google Scholar] [CrossRef] [Scilit]
- Giglio, L.; Csiszar, I.; Restás, Á.; Morisette, J.T.; Schroeder, W.; Morton, D.; Justice, C.O. Active Fire Detection and Characterization with the Advanced Spaceborne Thermal Emission and Reflection Radiometer (ASTER). Remote Sens. Environ. 2008, 112, 3055–3063. [Google Scholar] [CrossRef] [Scilit]
- Barmpoutis, P.; Papaioannou, P.; Dimitropoulos, K.; Grammalidis, N. A Review on Early Forest Fire Detection Systems Using Optical Remote Sensing. Sensors 2020, 20, 6442. [Google Scholar] [CrossRef] [Scilit] [PubMed]
- Giglio, L.; Descloitres, J.; Justice, C.O.; Kaufman, Y.J. An Enhanced Contextual Fire Detection Algorithm for MODIS. Remote Sens. Environ. 2003, 87, 273–282. [Google Scholar] [CrossRef] [Scilit]
- Singh, H.; Ang, L.M.; Srivastava, S.K. Active Wildfire Detection via Satellite Imagery and Machine Learning: An Empirical Investigation of Australian Wildfires. Nat. Hazards 2025, 121, 9777–9800. [Google Scholar] [CrossRef] [Scilit]
- Collins, L.; McCarthy, G.; Mellor, A.; Newell, G.; Smith, L. Training Data Requirements for Fire Severity Mapping Using Landsat Imagery and Random Forest. Remote Sens. Environ. 2020, 245, 111839. [Google Scholar] [CrossRef] [Scilit]
- Cao, H.; Wang, Y.; Li, X.; Hu, S.; Qiu, S.; Wei, Y. Method for Detecting Farmland Fire Pixels in VIIRS Night-Time Light Images. Wuhan Daxue Xuebao (Xinxi Kexue Ban)/Geomat. Inf. Sci. Wuhan Univ. 2025, 50, 2072–2085. [Google Scholar]
- Elhanashi, A.; Essahraui, S.; Dini, P.; Saponara, S. Early Fire and Smoke Detection Using Deep Learning: A Comprehensive Review of Models, Datasets, and Challenges. Appl. Sci. 2025, 15, 10255. [Google Scholar] [CrossRef] [Scilit]
- Abdusalomov, A.B.; Islam, B.M.S.; Nasimov, R.; Mukhiddinov, M.; Whangbo, T.K. An Improved Forest Fire Detection Method Based on the Detectron2 Model and a Deep Learning Approach. Sensors 2023, 23, 1512. [Google Scholar] [CrossRef] [Scilit] [PubMed]
- Zheng, Y.; Guo, P.; Tian, X.; Ye, Y. A Forest Fire Identification and Monitoring Model Based on Improved YOLOv8. Sci. Rep. 2025, 15, 37018. [Google Scholar] [CrossRef] [Scilit] [PubMed]
- Cardil, A.; Mola-Yudego, B.; Blázquez-Casado, Á.; González-Olabarria, J.R. Fire and Burn Severity Assessment: Calibration of Relative Differenced Normalized Burn Ratio (RdNBR) with Field Data. J. Environ. Manag. 2019, 235, 342–349. [Google Scholar] [CrossRef] [Scilit]
- Chuvieco, E.; Aguado, I.; Salas, J.; García, M.; Yebra, M.; Oliva, P. Satellite Remote Sensing Contributions to Wildland Fire Science and Management. Curr. For. Rep. 2020, 6, 81–96. [Google Scholar] [CrossRef] [Scilit]
- Carreiras, J.M.B.; Quegan, S.; Tansey, K.; Page, S. Sentinel-1 Observation Frequency Significantly Increases Burnt Area Detectability in Tropical SE Asia. Environ. Res. Lett. 2020, 15, 054008. [Google Scholar] [CrossRef] [Scilit]
- Wooster, M.J.; Roberts, G.; Freeborn, P.H.; Xu, W.; Govaerts, Y.; Beeby, R.; He, J.; Lattanzio, A.; Fisher, D.; Mullen, R. LSA SAF Meteosat FRP Products-Part 1: Algorithms, Product Contents, and Analysis. Atmos. Chem. Phys. 2015, 15, 13217–13239. [Google Scholar] [CrossRef] [Scilit]
- Mahajan, S.; Fataniya, B. Cloud Detection Methodologies: Variants and Development—A Review. Complex Intell. Syst. 2020, 6, 251–261. [Google Scholar]
- Filizzola, C.; Corrado, R.; Marchese, F.; Mazzeo, G.; Paciello, R.; Pergola, N.; Tramutoli, V. RST-FIRES, an Exportable Algorithm for Early-Fire Detection and Monitoring: Description, Implementation, and Field Validation in the Case of the MSG-SEVIRI Sensor. Remote Sens. Environ. 2016, 186, 196–216. [Google Scholar] [CrossRef] [Scilit]
- King, M.D.; Platnick, S.; Menzel, W.P.; Ackerman, S.A.; Hubanks, P.A. Spatial and Temporal Distribution of Clouds Observed by MODIS Onboard the Terra and Aqua Satellites. IEEE Trans. Geosci. Remote Sens. 2013, 51, 3826–3852. [Google Scholar] [CrossRef] [Scilit]
- Iwabuchi, H.; Saito, M.; Tokoro, Y.; Putri, N.S.; Sekiguchi, M. Retrieval of Radiative and Microphysical Properties of Clouds from Multispectral Infrared Measurements. Prog. Earth Planet. Sci. 2016, 3, 32. [Google Scholar] [CrossRef] [Scilit]
- Prestemon, J.P.; Pye, J.M.; Butry, D.T.; Holmes, T.P.; Mercer, D.E. Understanding Broadscale Wildfire Risks in a Human-Dominated Landscape. For. Sci. 2002, 48, 685–693. [Google Scholar] [CrossRef] [Scilit]
- Schroeder, W.; Csiszar, I.; Morisette, J. Quantifying the Impact of Cloud Obscuration on Remote Sensing of Active Fires in the Brazilian Amazon. Remote Sens. Environ. 2008, 112, 456–470. [Google Scholar] [CrossRef] [Scilit]
- Ishida, H.; Nakajima, T.Y. Development of an Unbiased Cloud Detection Algorithm for a Spaceborne Multispectral Imager. J. Geophys. Res. Atmos. 2009, 114, D07206. [Google Scholar] [CrossRef] [Scilit]
- Letu, H.; Nagao, T.M.; Nakajima, T.Y.; Riedi, J.; Ishimoto, H.; Baran, A.J.; Shang, H.; Sekiguchi, M.; Kikuchi, M. Ice Cloud Properties From Himawari-8/AHI Next-Generation Geostationary Satellite: Capability of the AHI to Monitor the DC Cloud Generation Process. IEEE Trans. Geosci. Remote Sens. 2019, 57, 3229–3239. [Google Scholar] [CrossRef] [Scilit]
- Rossow, W.B.; Schiffer, R.A. ISCCP Cloud Data Products. Bull. Am. Meteorol. Soc. 1991, 72, 2–20. [Google Scholar] [CrossRef] [Scilit]
- Letu, H.; Yang, K.; Nakajima, T.Y.; Ishimoto, H.; Nagao, T.M.; Riedi, J.; Baran, A.J.; Ma, R.; Wang, T.; Shang, H.; et al. High-Resolution Retrieval of Cloud Microphysical Properties and Surface Solar Radiation Using Himawari-8/AHI next-Generation Geostationary Satellite. Remote Sens. Environ. 2020, 239, 111583. [Google Scholar] [CrossRef] [Scilit]
- Reyes-Bueno, F.; Loján-Córdova, J. Assessment of Three Machine Learning Techniques with Open-Access Geographic Data for Forest Fire Susceptibility Monitoring—Evidence from Southern Ecuador. Forests 2022, 13, 474. [Google Scholar] [CrossRef] [Scilit]
- Cao, G.; Wei, X.; Ye, J. Fireground Recognition and Spatio-Temporal Scalability Research Based on ICESat-2/ATLAS Vertical Structure Parameters. Forests 2024, 15, 1597. [Google Scholar] [CrossRef] [Scilit]
- Jain, P.; Coogan, S.C.P.; Subramanian, S.G.; Crowley, M.; Taylor, S.; Flannigan, M.D. A Review of Machine Learning Applications in Wildfire Science and Management. Environ. Rev. 2020, 28, 478–505. [Google Scholar] [CrossRef] [Scilit]
- Yilmaz, E.O.; Kavzoglu, T. Burned Area Detection with Sentinel-2A Data: Using Deep Learning Techniques with EXplainable Artificial Intelligence. ISPRS Ann. Photogramm. Remote Sens. Spat. Inf. Sci. 2024, X-5–2024, 251–257. [Google Scholar] [CrossRef] [Scilit]
- Madan, A.K.; Batra, A.K. Percutaneous Endoscopic Gastrostomy in the Elderly: Complications (Review). J. Nutr. Elder. 1996, 15, 39–49. [Google Scholar] [CrossRef] [Scilit] [PubMed]
- Vujović, F.; Grozdanić, G.; Đurović, R.; Valjarević, A.; Milevski, I. Comparative Assessment of GIS-Based Multi-Criteria Decision Analysis (AHP) and Machine Learning (MaxEnt) Approaches for Wildfire Susceptibility Modeling in Montenegro. Egypt. J. Remote Sens. Space Sci. 2025, 28, 724–736. [Google Scholar] [CrossRef] [Scilit]
- Ju, W.; Xing, Z.; Wu, J.; Kang, Q. Evaluation of Forest Fire Risk Based on Multicriteria Decision Analysis Techniques for Changzhou, China. Int. J. Disaster Risk Reduct. 2023, 98, 104082. [Google Scholar] [CrossRef] [Scilit]

Disclaimer/Publisher’s Note: The statements, opinions and data contained in all publications are solely those of the individual author(s) and contributor(s) and not of MDPI and/or the editor(s). MDPI and/or the editor(s) disclaim responsibility for any injury to people or property resulting from any ideas, methods, instructions or products referred to in the content. |
© 2026 by the authors. Licensee MDPI, Basel, Switzerland. This article is an open access article distributed under the terms and conditions of the Creative Commons Attribution (CC BY) license.