


Highlights
What are the main findings?
- A spatially coherent subsidence was mapped at the Doornpoort TSF using multi-temporal SBAS-InSAR and GNSS analyses conducted between 2022 and 2024. This analysis captured a representative range of deformation rates, with a peak of −26.09 mm per year, which aligns with the locations of active underground extraction blocks.
- The superimposed deformation signals were separated using Non-negative Matrix Factorisation (NMF). This decoupling process revealed that deep mining stress redistribution, transmitted through the underlying karstified dolomites, accounts for 92% of the cumulative subsidence, whereas localised tailings consolidation contributes only 8%.
What are the implications of the main findings?
- The findings redefine tailings storage facilities as passive surface loads within broader regional subsidence basins. This necessitates a fundamental shift in geotechnical risk management, emphasizing the consideration of deep-seated stress gradients rather than focusing solely on isolated surface failures.
- The integrated SBAS-NMF framework offers a scalable and non-invasive method for monitoring multiple hazards. It provides conservative estimates of subsidence drivers in complex karstic mining environments globally, reducing reliance on limited ground-based instrumentation.
Abstract
Mining-induced land subsidence poses significant geohazard risks to critical on-site mining operational support infrastructure, such as tailings storage facilities (TSFs). This study investigates the Doornpoort TSF subsidence at the South Deep gold mine in South Africa, using multi-temporal Small Baseline Subset Interferometric Synthetic Aperture Radar (SBAS-InSAR) and Non-negative Matrix Factorisation (NMF) algorithm approach to split the superimposed subsidence contributing drivers, alongside the incorporation of Global Navigation Satellite System (GNSS) data and underground mining layout plans. 78 Sentinel-1A Satellite Aperture Radar (SAR) ascending acquisitions between May 2022 and December 2024 were obtained and processed to determine the average annual deformation rates and cumulative time-series displacement for the study area. The InSAR-derived subsidence rates at the designated three benchmarks on the embankments of the Doornpoort TSF and TSF 1&2 are −26.09 mm/year, −13.40 mm/year and −16.25 mm/year, while the maximum cumulative subsidence was −57.45 mm, −42.76 mm and −36.44 mm. A comparison of the InSAR results with the GNSS-derived subsidence results showed correlation standard deviations of 1.87 mm, 0.93 mm, and 1.05 mm, respectively. The InSAR results revealed spatially coherent subsidence patterns and a good correlation between deformation boundaries and underground mining layouts, suggesting that mining-induced stress redistribution is the primary driver of regional surface subsidence. The NMF decomposition of the InSAR-derived deformation result at a selected benchmark on the Doornpoort TSF embankment, whose average annual deformation with a cumulative time series deformation of −26.09 mm/year and −57.45 mm, respectively, revealed that 92% of the observed cumulative deformation is associated directly with the underground mining, whilst the remaining 8% is associated with TSF embankment consolidation. Furthermore, the selected decomposition benchmark within the TSF basin showed that underground mining alone accounted for 100% of the observed subsidence there. These findings support a coupled deformation framework in which deep mining activities influence regional subsidence, while localised geological conditions modulate its surface manifestation.
1. Introduction
Land subsidence associated with mining is a major geohazard in areas with deep underground mines and tailings storage facilities (TSFs). Gold mining in South Africa’s Witwatersrand Basin has been a major factor in the country’s economic growth for over a century [1]. Nonetheless, deep-level mining and associated dewatering have had an impact on subsurface stress patterns and hydrogeological conditions, resulting in ground deformation, infrastructure damage, and environmental risks [2,3]. Recent studies further emphasize the extensive spatial subsidence patterns driven by deep mineral extraction across varying geological conditions [4]. The historical failures of TSFs in South Africa emphasised the importance of continuous deformation monitoring in challenging geological environments such as mining areas [5,6,7,8,9].
Communities and infrastructure in Gauteng Province are now more vulnerable to subsidence-related risks due to the province’s rapid urbanisation [10,11,12]. The South Deep gold mine stands as one of the deepest underground mining operations in the world [13]. This facility is primarily an underground gold mine equipped with essential infrastructure, including tailings storage facilities, processing plants, underground railcar conveyances, and surface entrances to underground shafts, among others. Deep mineral extraction and groundwater modification in dolomitic formations have been linked to subsidence and seismic instability in the region [14,15,16,17].
Typical ground-surveying techniques, such as levelling campaigns, encounter limitations in both spatial and temporal coverage. Conversely, Interferometric Synthetic Aperture Radar (InSAR) provides a remote sensing method capable of identifying millimetric surface subsidence over large areas [18]. Multi-temporal approaches, including the Small Baseline Subset (SBAS) method, have proven effective at tracking non-linear deformation associated with mining activities [19]. In areas characterised by scarce vegetation, SBAS-InSAR provides reliable visualisation signals capable of detecting gradual to extensive subsidence and is highly effective for tracing long-term deformation evolution and failure mechanisms over mining sites [20,21].
Research into integrating SBAS-InSAR observations with underground mining layout data to assess deformation affecting the infrastructure of the on-site tailings storage facility has been limited, despite the operational importance of the South Deep gold mine. This study bridges this research gap by analysing seventy-eight Sentinel-1A acquisitions collected between May 2022 and December 2024, which are supplemented by GNSS observations and detailed underground mining geometry. The objective of this study is to (1) quantify the patterns of spatial and temporal deformation, (2) analyse the correlation between surface subsidence and active extraction blocks, and (3) decompose the subsidence results to quantify the contributions of the individual subsidence drivers to the observed deformation.
2. Materials and Methods
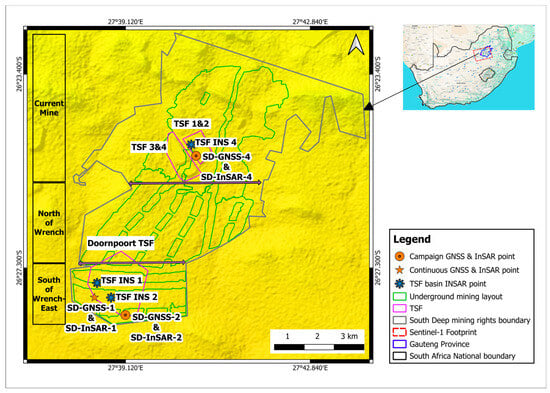
Figure 1 shows the South Deep gold mine’s location and boundaries on a coloured relief digital elevation model that is geocoded in WGS84.
Figure 1.
Locations of the South Deep gold mine, as well as GNSS and InSAR measurement points.
South Deep Gold Mine
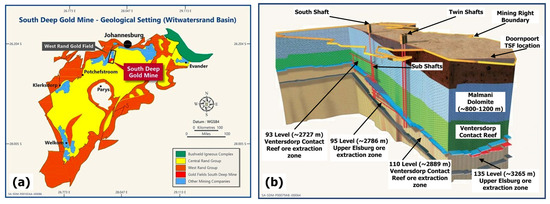
The South Deep gold mine is located near the town of Westonaria in the northeastern part of Gauteng Province, South Africa. Geographically, it can be located at latitude 26°25′00″S and longitude 27°39′45″E. The mine has a total surface area spanning about 4268 hectares [22]. It is regarded as one of the world’s biggest gold mining operations. South Deep is a key mining operation in South Africa’s mining industry and is situated in the Witwatersrand Basin, which is home to the largest gold deposits in the world, mostly in quartz-pebble conglomerate horizons [23,24,25]. This basin has a long record of mineral exploitation and has made substantial contributions to the world’s gold production. The gold ore mined at the South Deep mine is found in the Upper Elsburg conglomerate reef, and as such, this reef is located at a depth exceeding 2700 metres below the earth’s surface (Figure 2) [26]. Due to the nature and depth at which this reef is located, fully automated or mechanised long hole stoping and drift-and-fill mining techniques have been adopted to exploit the gold mineral, making the extraction process efficient and safe for personnel working underground. Currently, the mine is one of the deepest in the world, with mining taking place at a depth ranging between 2700 metres and 3400 metres below the earth’s surface. Recent high-resolution 3D deep seismic reflection surveys have further highlighted the complex geological structures and fault networks intersecting these deep mining levels [27]. This mine is a key project of the Gold Fields Group in South Africa and has an estimated mine life of 75 years [28]. Additionally, in 2018, the mine estimated its reserves at 32.8 million ounces of gold and currently produces 320,000 ounces each year, accounting for about 13% of the company’s total production [28].
Figure 2.
(a) The Geological Settings of the Witwatersrand Basin [1]; (b) the three-dimensional isometric representation of the stratigraphy of South Deep Mine [2].
3. Datasets and Methodology
3.1. SAR Datasets
In this study, we used the Copernicus Sentinel-1A satellite as our primary dataset source, as this platform is specifically designed to provide data for analysing and assessing surface subsidence, in addition to other Earth observation duties. This satellite can remotely collect Earth data through its C-band Synthetic Aperture Radar (SAR) instrument. Sentinel-1A can produce high-resolution radar imagery, which is needed for thorough monitoring of ice dynamics, ground movement, and other delicate geophysical processes. The satellite orbits Earth at an altitude of 693 km and completes a revisit cycle approximately every 12 days. It has been engineered and programmed in this manner to ensure that it can thoroughly track deformation changes across larger areas and over an extended time period and to collect continuous data. The satellite can transition between several specialised modes of operation to better meet the requirements of different observational tasks.
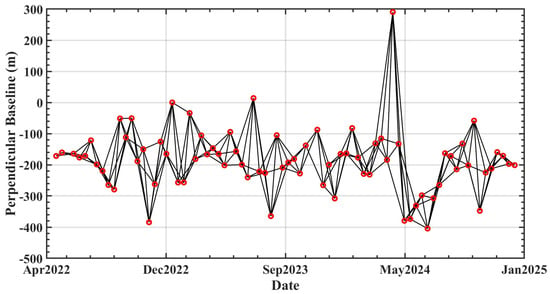
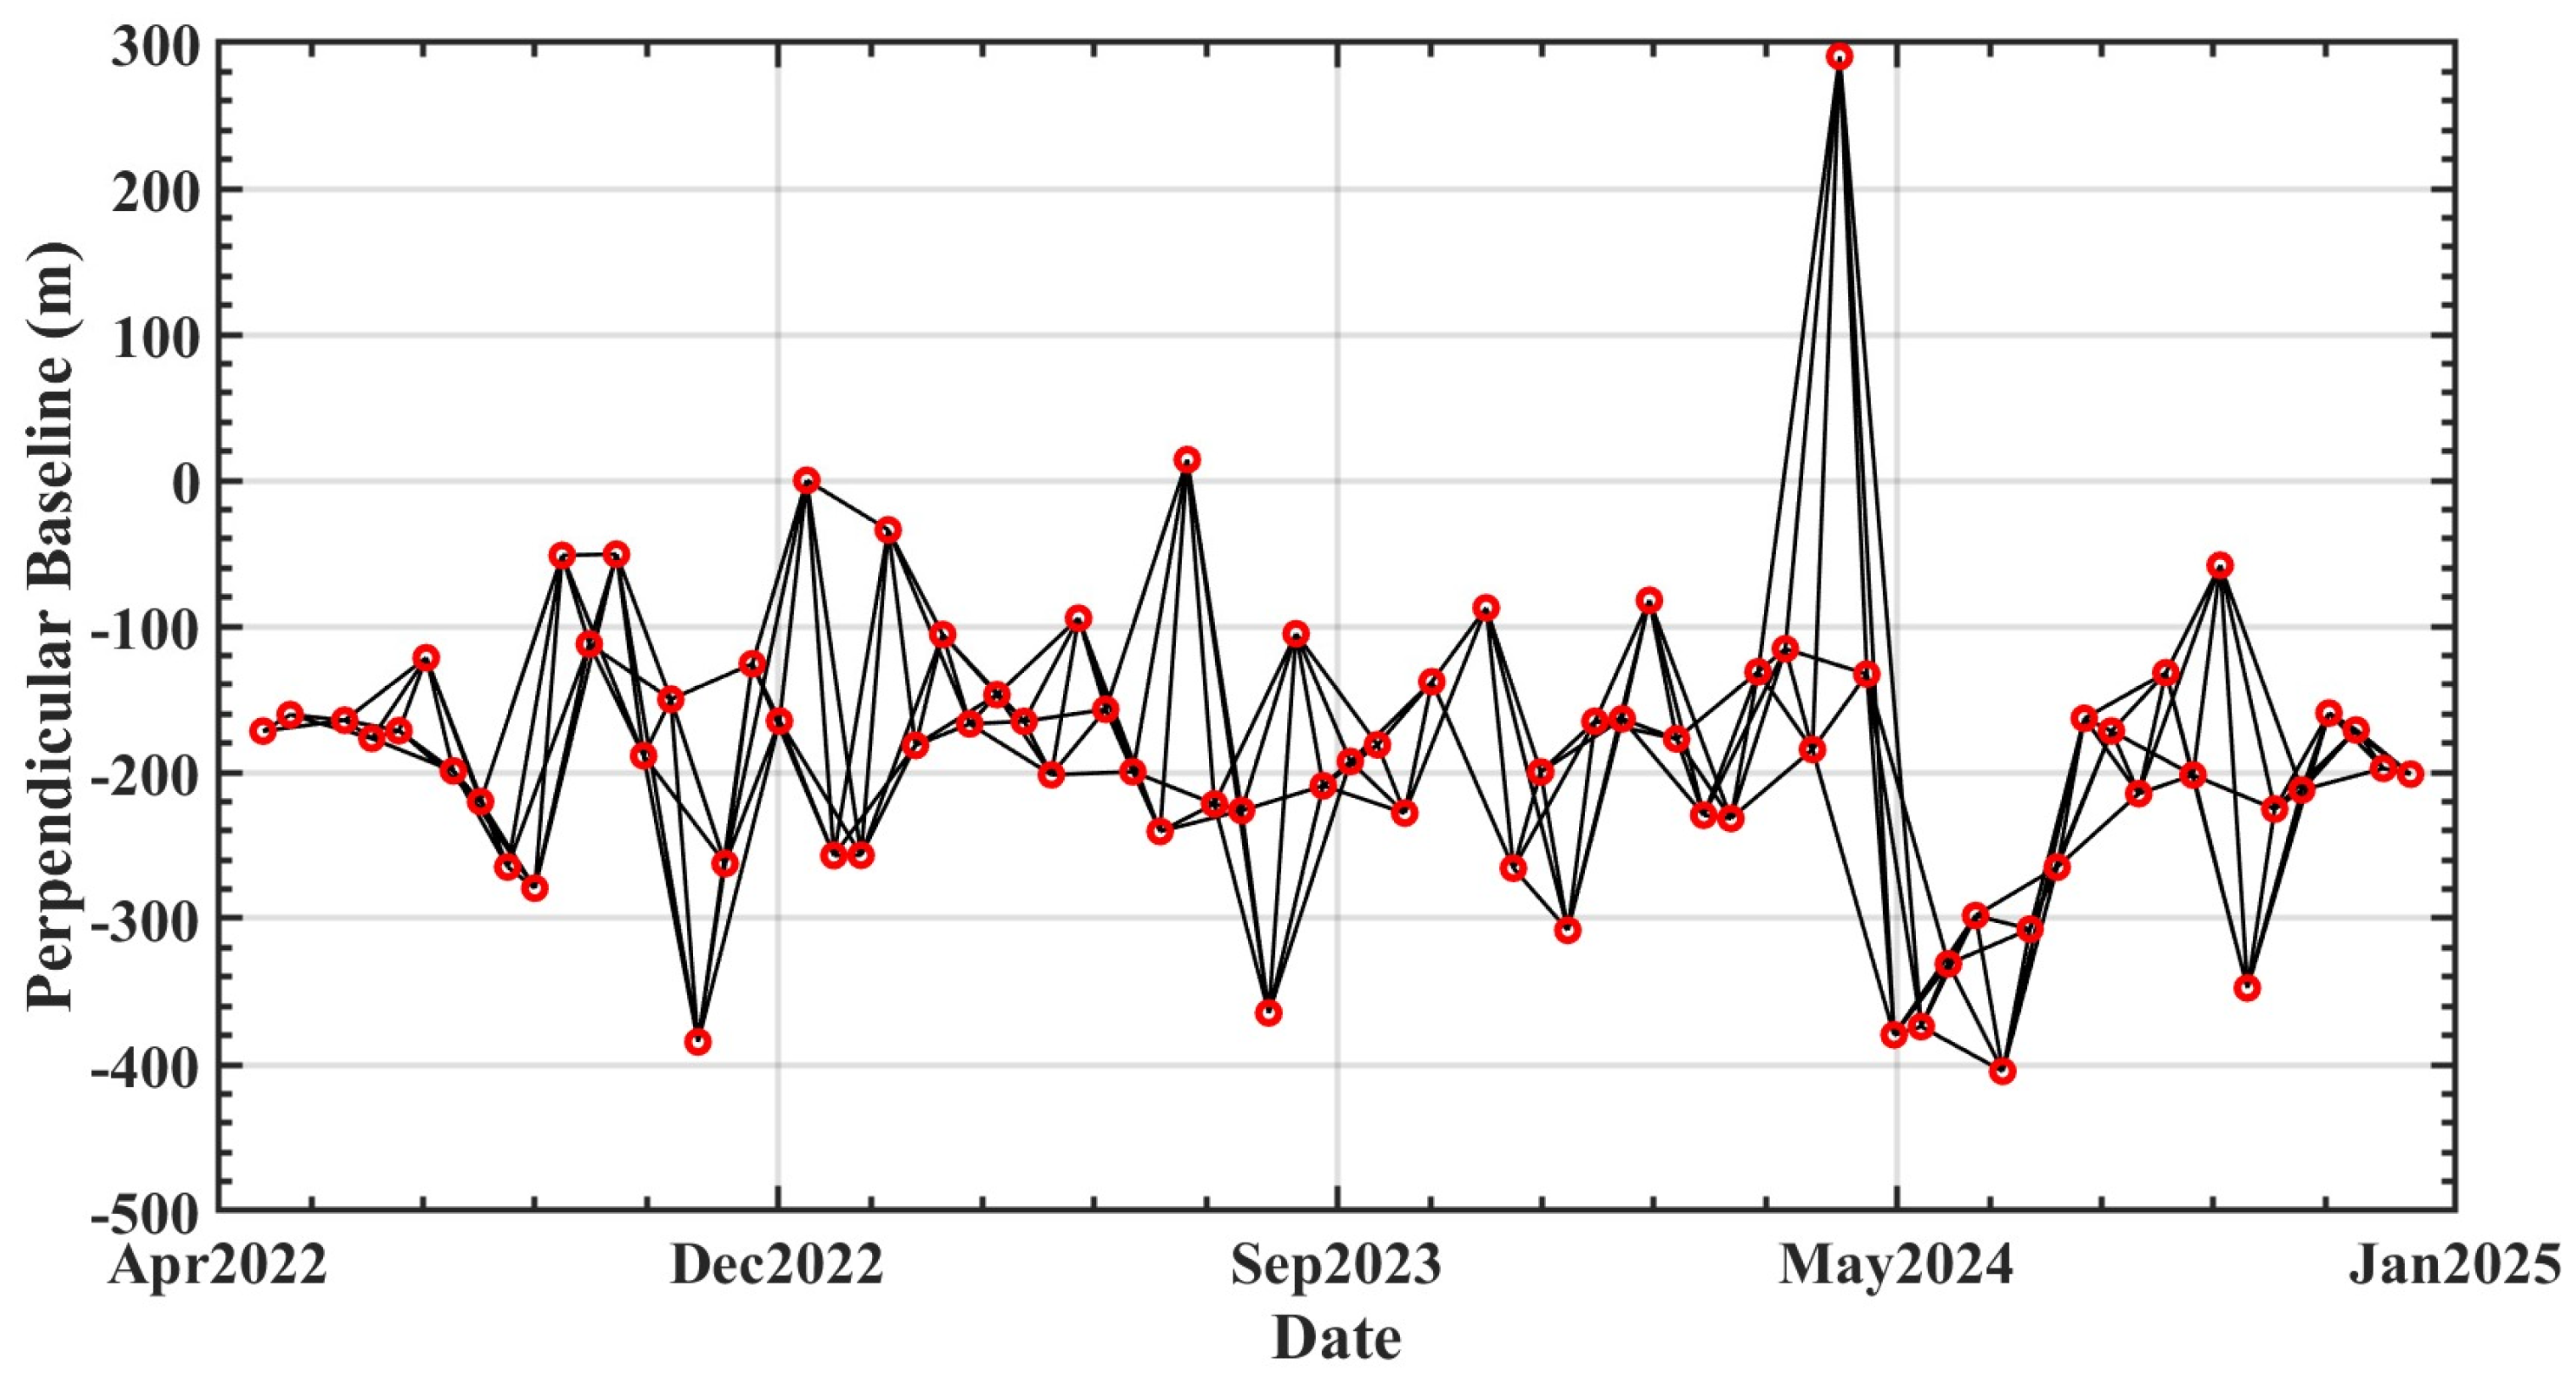
We used the ascending track Sentinel-1 SAR images in the interferometric width (IW) swath mode and VV polarization for our research. For this study, we analysed a dataset of seventy-eight Sentinel-1A Single Look Complex (SLC) SAR images acquired between May 2022 and December 2024. Sentinel-1 relies on the Terrain Observation and Progressive Scan (TOPS) technique to efficiently capture wide-area remote sensing data. This Interferometric Wide (IW) swath mode generates overlapping bursts to cover a large area of 250 km with a high spatial resolution of 5 m (range) by 20 m (azimuth) [29]. To manage the raw SAR generation across such wide geographic areas, the system uses advanced processing algorithms, including azimuth linear frequency modulation and chirp-z transformation [30]. All imagery used in our research was downloaded via the Alaska Satellite Facility’s Data Search Vertex [31]. The details of the SAR data are listed in Table 1 and Table 2. We also downloaded and used the Copernicus GLO-30 DEM digital elevation model (DEM) from the Copernicus website [32]. During preprocessing, this 30 m spatial-resolution DEM was used to ensure accurate assignment of geographical coordinates to acquired SAR images and to eliminate topographic errors from the phase components. These steps improve the accuracy of the interferograms generated during data processing. To ensure that the generated interferograms effectively reduced decorrelation while maintaining a high signal-to-noise ratio, we set strict selection criteria. The maximum perpendicular baseline was set at 300 m, and the temporal baseline at 45 days (Figure 3). Precise digital elevation models and the evaluation of phase observation’s response to height changes depend on the perpendicular baseline [33,34,35]. The incidence angle for the ascending-track SAR data captured by the Sentinel-1 satellite is set to 33.46 degrees. Incorporating orbital information is one of the most important preprocessing steps for InSAR data. Regarding this, we used Precise Orbit Ephemerides (POE) to enhance the accuracy of our InSAR data processing results. Precise orbital data significantly improves the accuracy of baseline estimation, which is essential for generating reliable digital elevation models and measuring accurate ground deformation changes. Accurate baseline determination helps in reducing phase errors and improving the co-registration accuracy of InSAR images. Residual fringes in interferograms contain orbital errors, which can be effectively removed using precise satellite orbital data.
Table 1.
Coverage period of Sentinel-1A ascending SAR images.
Table 2.
Sentinel-1A experimental data parameters.
Figure 3.
Temporal and spatial baseline distribution of the Ascending Sentinel-1A SAR datasets.
3.2. GNSS Datasets
At the South Deep gold mine, GNSS data is collected using Trimble Zephyr 2 Geodetic choke ring antennas together with NavStar GMS 700 dual-frequency (L1/L2) geodetic-grade receivers. Continuous and static campaign GNSS measurements were used to validate the InSAR-derived deformation. Accurate GNSS data processing, including assessment of positioning accuracy and mitigation of environmental errors, is essential for establishing reliable ground truth in remote sensing validation [36,37,38]. In this study, the GNSS data was processed and analysed with the Bernese GNSS Software (Version 5.4), developed by the Astronomical Institute of the University of Bern (AIUB), and the Precise Point Positioning (PPP) technique was applied. The GPS carrier-phase and pseudo-range measurements were processed using the ionosphere-free linear combination of dual-frequency observations to eliminate first-order ionospheric delays. During both pre-processing and processing, orbital and satellite clock errors were addressed by applying the Final Precise Orbit Ephemerides (POE) and precise clock products from the International GNSS Service (IGS) [39]. Tropospheric delays were corrected with the Saastamoinen model, and the antenna phase centre variations were also corrected using IGS absolute calibration models. The vertical accuracy of the processed GNSS solutions is estimated at ±3 mm to ±5 mm. Throughout this manuscript, GNSS stations at the South Deep mine site are consistently referred to as ‘SD-GNSS’ (South Deep GNSS) to distinguish them from regional reference networks. It is installed as a permanent base station on the embankment wall of the Doornpoort TSF. There, it regularly and continuously receives coordinate data from as many satellites as possible along the easting (x), northing (y), and elevation (z) axes. The data is downloaded into the device’s memory in 30 s intervals, daily. The permanent station is codenamed SD-GNSS-1 in our research. In addition to the main continuous GNSS monitoring station, there are three additional campaign GNSS stations. The first campaign GNSS station, codenamed SD-GNSS-2, is positioned at the east section of the same Doornpoort TSF. The second campaign GNSS station, SD-GNSS-3, is mounted near the central Twin Shaft. The last campaign GNSS station, SD-GNSS-4, is installed on the TSF 1&2 embankment. All stations are located on the South Deep concession. The GNSS campaign data are also collected once every three months, during which the GNSS machines are mounted to collect accurate positional data through static surveys. Afterward, they are removed, and the recorded data is downloaded for further use. The locations of the South Deep gold mine, as well as GNSS measurement points are shown in Figure 1.
3.3. Methodology
In this study, we combined two monitoring techniques, namely, the SBAS-InSAR and GNSS techniques, to track ground subsidence caused by gold mining at the South Deep in South Africa. A stack of Sentinel-1 SAR images collected between May 2022 and December 2024 was used, and the SBAS method was applied to generate a reliable time series of ground movement. To ensure accurate signal coherence and to minimize noise from atmospheric or surface effects, the image pairs were carefully selected. The radar coordinate system’s line-of-sight deformation results were transformed to ensure uniformity with the GNSS data coordinate system. This study used only ascending-track Sentinel-1 SAR images, as descending-track data with adequate temporal coverage are not available for this region during the monitoring period. Although integrating both ascending and descending orbits enables the resolution of two- or three-dimensional deformation vectors, the primary vertical deformation mechanism at the South Deep Gold Mine is the consequence of deep tabular ore body extraction. The following equation is used to project the Line-of-Sight (LOS) displacement that the SAR sensor measures onto the vertical component :
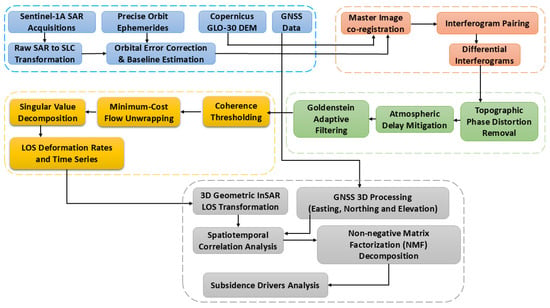
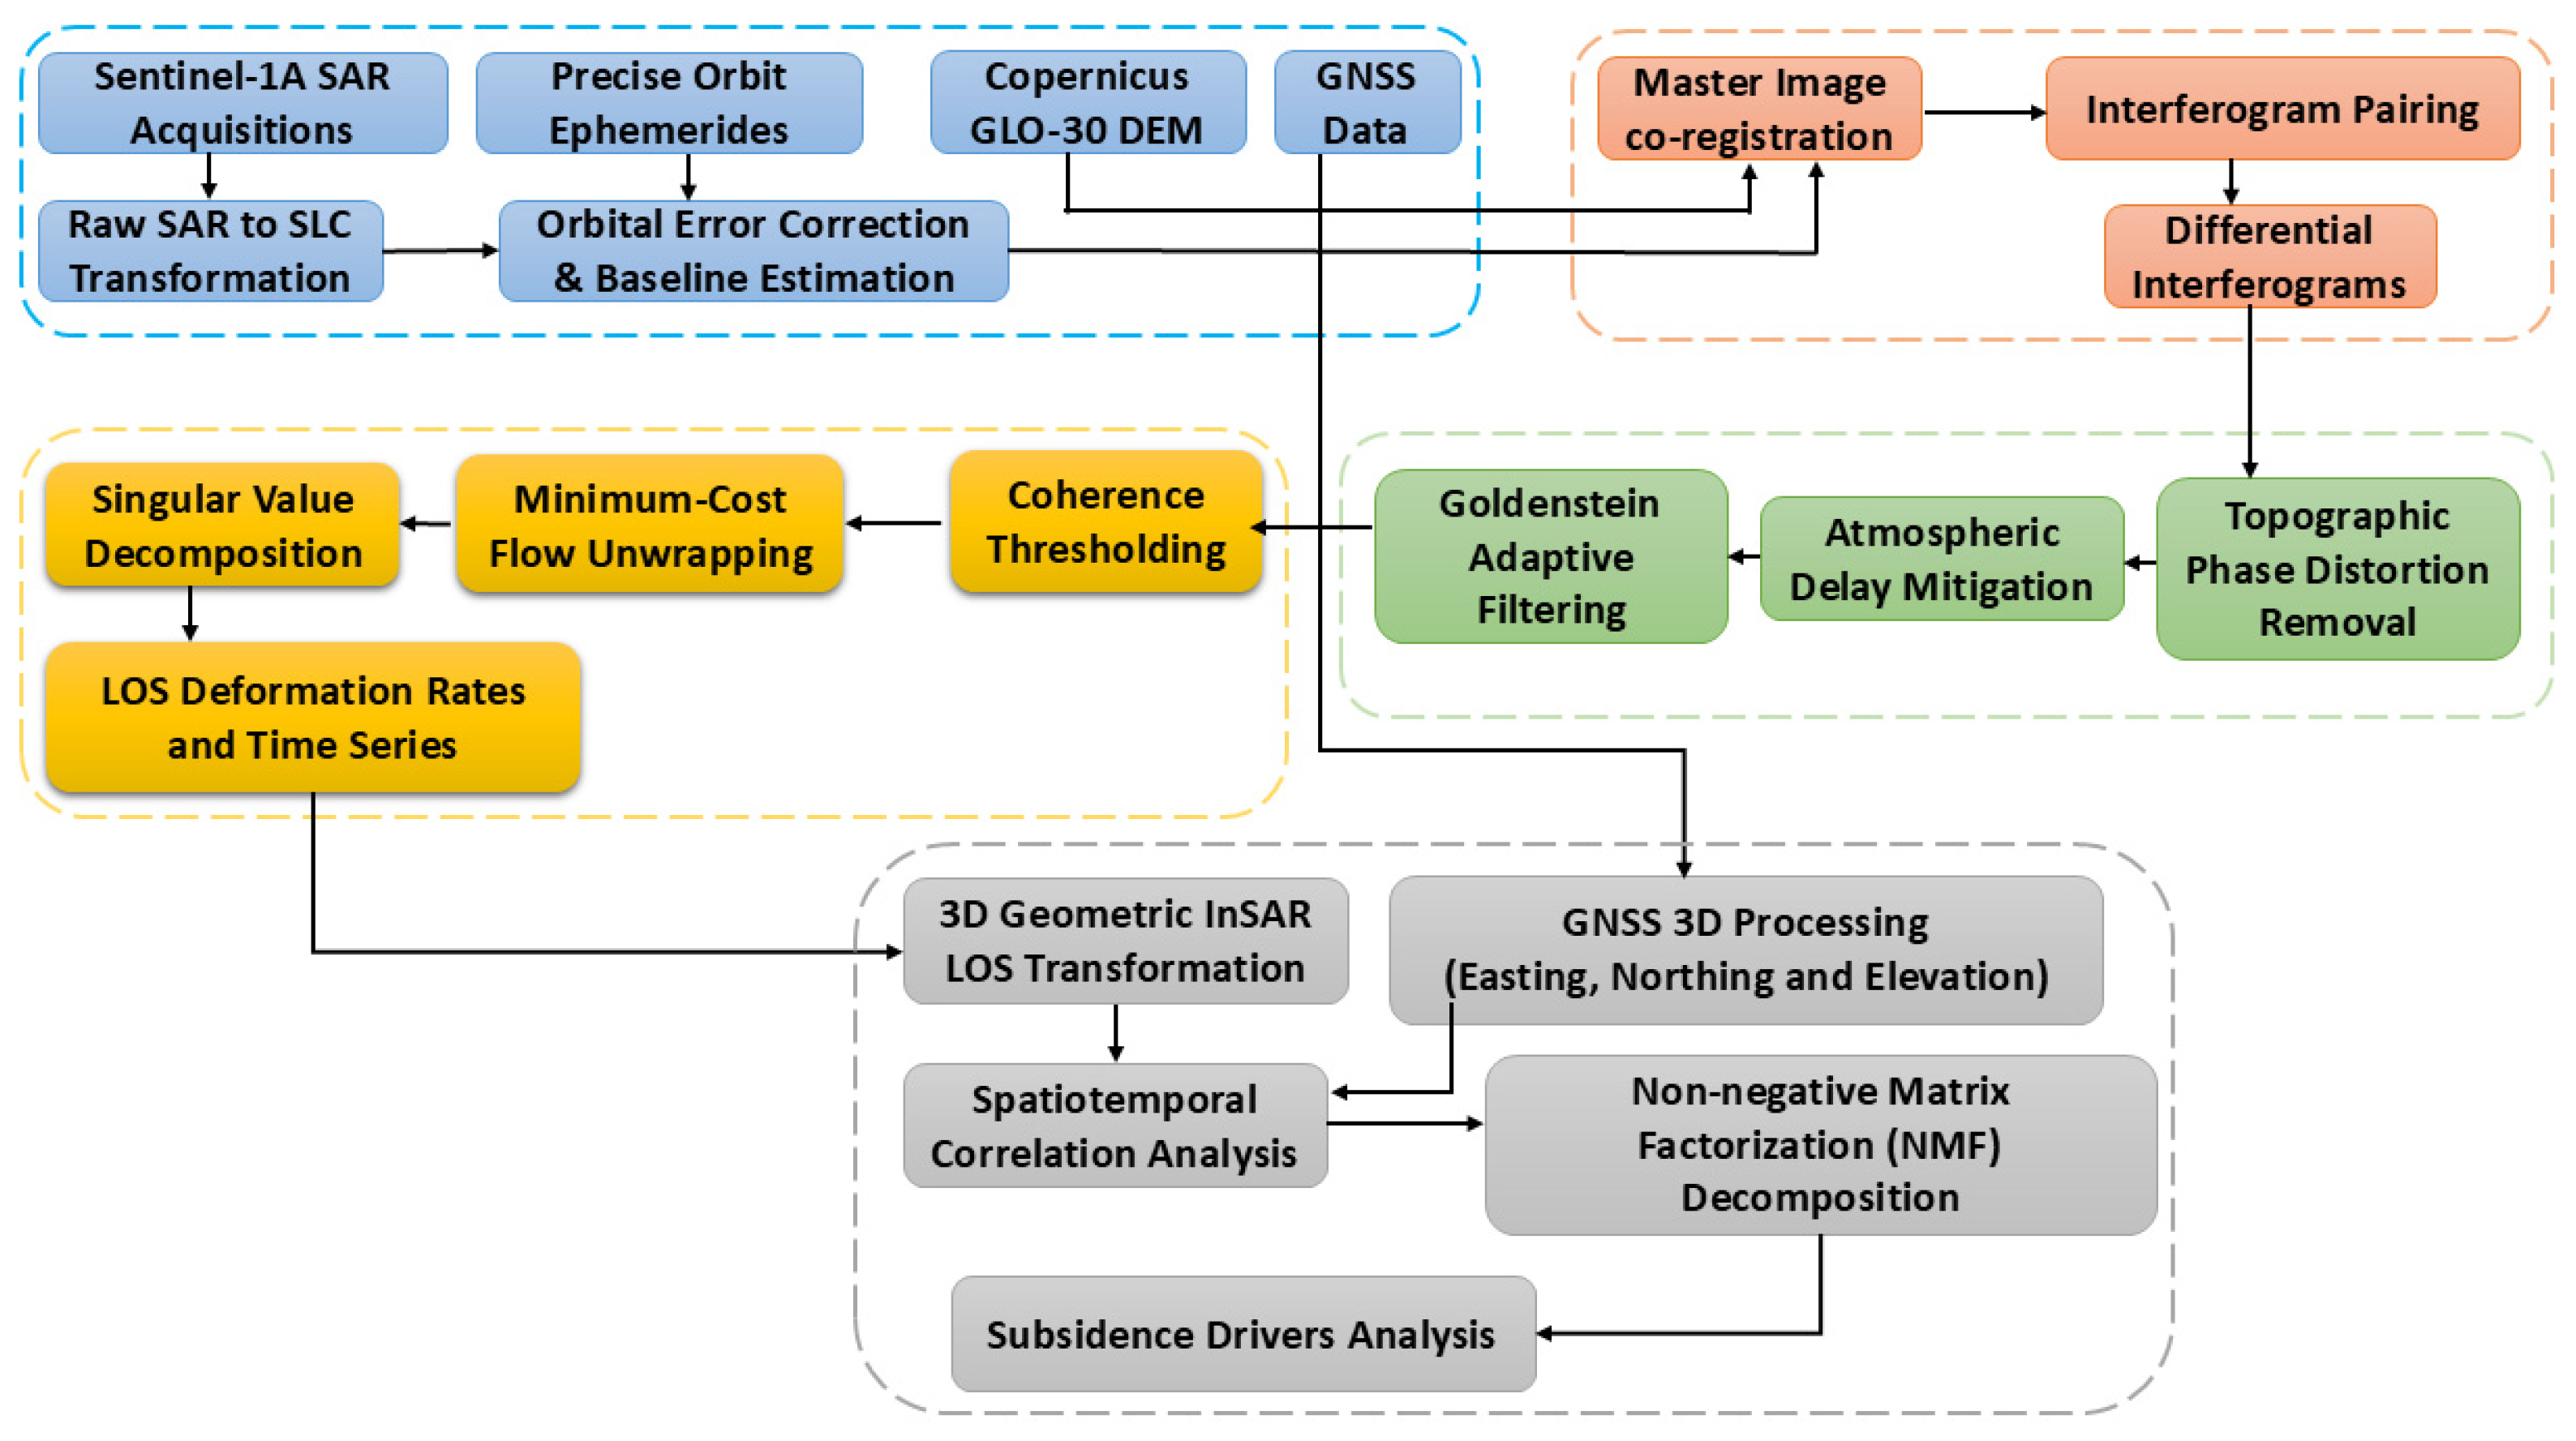
The symbols , , and denote the radar incidence angle, horizontal displacement, satellite heading angle, and azimuth of the horizontal displacement, respectively. In this context, the horizontal displacement is considered negligible relative to the vertical component , based on the conservative assumption that deep-level gold mining produces subsidence bowls with minimal horizontal gradients at the surface and that spatial averaging is used to reduce noise in specific areas. is the resultant value for the vertical displacement. This assumption is often adopted when using single-orbit SAR data to monitor vertical subsidence in deep hard-rock mining environments. Time series positional deformation changes were generated by processing both GNSS data and SBAS cumulative time series data, and the two datasets were then correlated to assess their agreement. This approach was used to validate the SBAS results. This process enhances the interpretation of results for explaining the subsidence phenomenon. The merging of these datasets enabled an accurate and reliable visualisation of ground movement locations and mechanisms, providing information for subsidence risk management in active mining regions. The technical workflow for this integrated methodology is presented in Figure 4.
Figure 4.
The research methodology flowchart.
3.4. SBAS-InSAR Process
We used the SBAS-InSAR (Small Baseline Subset-Interferometric Synthetic Aperture Radar) technique to process and analyse the SAR data in this study. Each SAR acquisition frame comprises three interferometric widths (IWs) forming a single unit. These interferometric widths are IW1, IW2, and IW3. We downloaded and processed SAR data from the ascending orbit track, which included all three IWs and was the only available track for this research. We used the GAMMA 2022 Remote Sensing software suite to process the SAR data. Beginning with the entire workflow, the raw SAR acquisitions were first converted to the Single Look Complex (SLC) format. Amongst the acquisitions, the SAR data acquired on 20 September 2023 was selected as the master image, to which all subsequent scenes were co-registered. The Copernicus GLO-30 Digital Elevation Model (DEM) was used concurrently to match the corresponding SAR datasets and ensure accurate phase derivation during data processing. Following data registration, an SBAS interferometric network was established. In order to enhance image coherence, improve the number of interferometric pairs and reduce scattering noise, a multi-look ratio of 8 range pixels to 2 azimuth pixels, a vertical baseline of 300 m, and a maximum time baseline of 45 days were used. While doing all this, the Copernicus GLO-30 DEM and the European Centre for Medium-Range Weather Forecasts (ECMWF) ERA5 global atmospheric model were both used to remove the effects of topographical phase errors and distortion, and of atmospheric phase delays, respectively. The atmospheric element that affects tropospheric delay modelling is surface pressure. Hence, through the application of the ERA5 component, this element is effectively removed due to the high temporal and spatial resolution nature of this model. Because of the ERA5 global atmospheric model’s enhanced precision and its compatibility with common statistical correction methods, such as power-law and linear regression models, it makes it an efficient means for eliminating phase errors in InSAR data. As a result, deformation measurement and velocity estimation are improved [40,41,42,43,44,45]. The Goldstein adaptive filtering method was subsequently engaged to facilitate and improve phase unwrapping by means of reducing spatial phase noise. This filtering technology was developed by Goldstein and Werner in 1998 [46]. We used local coherence to determine the adaptive window size, which ranged from 5 × 5 to 15 × 15 pixels. Only pixels with an average coherence of 0.65 or higher across all the time series were maintained during the deformation inversion process. Once the interferograms were created, the Minimum-Cost Flow (MCF) algorithm was used to repeat the unwrapping and filtering steps from the previous phase. In previous research, the MCF algorithm was widely employed to reduce phase anomalies that happen during unwrapping [47]. In order to proceed, the procedure of ‘differential interferometric processing → filtering → differential interferogram unwrapping’ had to be repeated using the determined exact baseline. During the second round of the reiteration process, the selected unwrapped differential interferograms were carefully separated from the other interferograms that were influenced by orbital and atmospheric delay errors in order to obtain a consistent set of unwrapped differential interferograms. Finally, the deformation results were computed using the yearly deformation rate together with the deformation time series derived from the unwrapped interferograms. We used the Singular Value Decomposition (SVD), a useful linear-algebraic algorithm that breaks down phase data into several similar components, to estimate the deformation rates for coherent points across the study area. This decomposition algorithm facilitates the reconstruction of the deformation time series and the highly accurate estimation of the rates of deformation and accumulated displacements over the study time range.
The mathematical expression of the SBAS principle is as follows:
The SBAS-InSAR methodology begins with the collection of SAR images that entirely extend across a specified geographic area. is the temporal sequence in which the images are arranged, with each denoting the period of acquisition time of the respective SAR image. The preliminary and necessary step involved selecting one of the images that would function as the reference image. This image is then co-registered with the other SAR images to ensure correct spatial alignment. The reference image is carefully selected to allow for the creation of at least one interferogram when paired with another SAR image in the dataset. The quantity of potential interferograms that are generated is represented as , and is limited by the numerical possibilities for pairing the images, conforming to the inequality . This range represents the minimum and maximum numbers of interferometric pairs that can be generated, accounting for real-world constraints such as temporal and spatial baselines, while providing sufficient data for reliable analysis.
Here is the mathematical expression for the interferometric phase for a pixel at azimuth coordinate x and range coordinate r in the differential interferogram, which is constructed from SAR images acquired at times and where :
This equation shows the difference in time phases between the two SAR images, where and are the phases of the SAR images at timeframes and , respectively. The phase change caused by surface subsidence along the radar’s line of sight is given by the equation . Here, is the radar wavelength and and are the deformation at times and , respectively, relative to a reference deformation . as stated in Equation (2) describes the residual topographic phase, which arises from minor errors within the DEM used for processing. captures the atmospheric phase delay that is induced by variations in water vapour and temperature as the radar signal passes through the troposphere. indicates orbital phase differences arising from tiny errors in the satellite’s orbital parameters, and includes random noise effects, which are inherent defects of the SAR system or arise from unforeseen environmental influences.
After these phase errors have been corrected, the deformation signal can be extracted using advanced processing techniques. Among these steps are the use of an accurate digital elevation model to eliminate topographic phase, the application of atmospheric correction models, and an enhancement of the baseline. Upon correction, the phase mainly reveals the surface subsidence results. Although SBAS-InSAR processing determines total surface displacement, this total measurement is actually a superimposition of signals from multiple subsidence drivers. To separate these combined effects, an advanced signal decomposition technique is subsequently used to split the signals.
3.5. Signal Decomposition Using NMF
Multi-temporal InSAR often detects superimposed deformation signals arising from multiple, simultaneously active physical processes. At the Doornpoort TSF, the observed surface subsidence is hypothesised to result from a combination of regional deformation induced by deep-level underground mining extraction and localised consolidation of the tailings and embankment structures. To quantitatively distinguish these contributing factors, Non-negative Matrix Factorisation (NMF), a blind source separation technique that is highly effective for unmixing complex InSAR time-series data, was applied. NMF is an advanced signal decomposition technique that factorizes a non-negative data matrix into the product of two lower-dimensional non-negative matrices, thereby enabling the extraction of latent physical feature patterns [48]. Since the multi-temporal InSAR deformation signals in this study mostly reflect continuous subsidence, the recorded values are mostly negative. Sign inversion and an overall constant positive shift were used to convert the original deformation time-series data into the positive domain, in order to meet the strict non-negativity constraint of the NMF algorithm. This transformation enhances the decomposition’s accuracy by carefully preserving the original kinematic trends and physical characteristics.
The initial matrix, denoted as , represents the cumulative deformation time-series. The procedure for constructing the non-negative input matrix is described below:
In this context, represents the constant positive baseline shift. The NMF algorithm then decomposes into two-part matrices:
When considering this situation, the spatial weight patterns are given as matrix , which represents the geographic distribution of deformation drivers, and their corresponding temporal evolution patterns are denoted by matrix . The decomposition process finds the best separation by repeatedly minimising the Frobenius threshold between the input matrix and the reconstructed product:
The physical assumption that two dominant and distinct mechanisms influence the overall deformation led to assigning the rank parameter to 2 in this analysis. Finding the right number of components is an important part of non-negative matrix factorisation. To reduce subjectivity, a sensitivity analysis was carried out by measuring the physical interpretability of the components for values between 1 and 5, as well as the reconstruction error (Frobenius norm). The selected rank was , even though increasing marginally decreased the reconstruction error. The selection was guided by the physical context of the study area. Consequently, two non-negative spatial patterns were isolated at , corresponding to the primary sources of anthropogenic deformation, that is, the Tailings Storage Facility and the deep-level mining stopes. As became larger, these physical sources were broken down into smaller, mathematically separate, and physically irrelevant components. The mathematical transformations, NMF computations, and subsequent matrix reconstructions were all executed using Python 3.9. Each component’s isolated deformation field was calculated using the outer product of its respective column in and row in . As a result of this method, the algorithm is able to decouple the coupled signals into two parts: the tailings storage facility’s localised geotechnical behaviour and deep mining’s expansive regional subsurface influence .
An inverse transformation was applied to the separated spatial and temporal matrices after the decomposition had converged:
The final restoration step reverts the decoupled signals to their original negative cumulative subsidence scale. This process enables accurate and direct quantitative interpretation of the true displacement associated with each specific physical driver.
4. Results
4.1. Deformation Distribution and Time Series Analysis
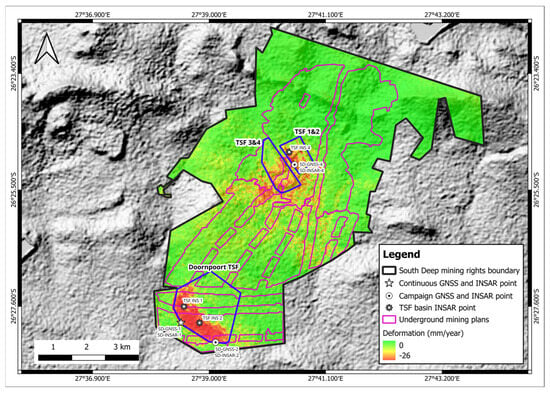
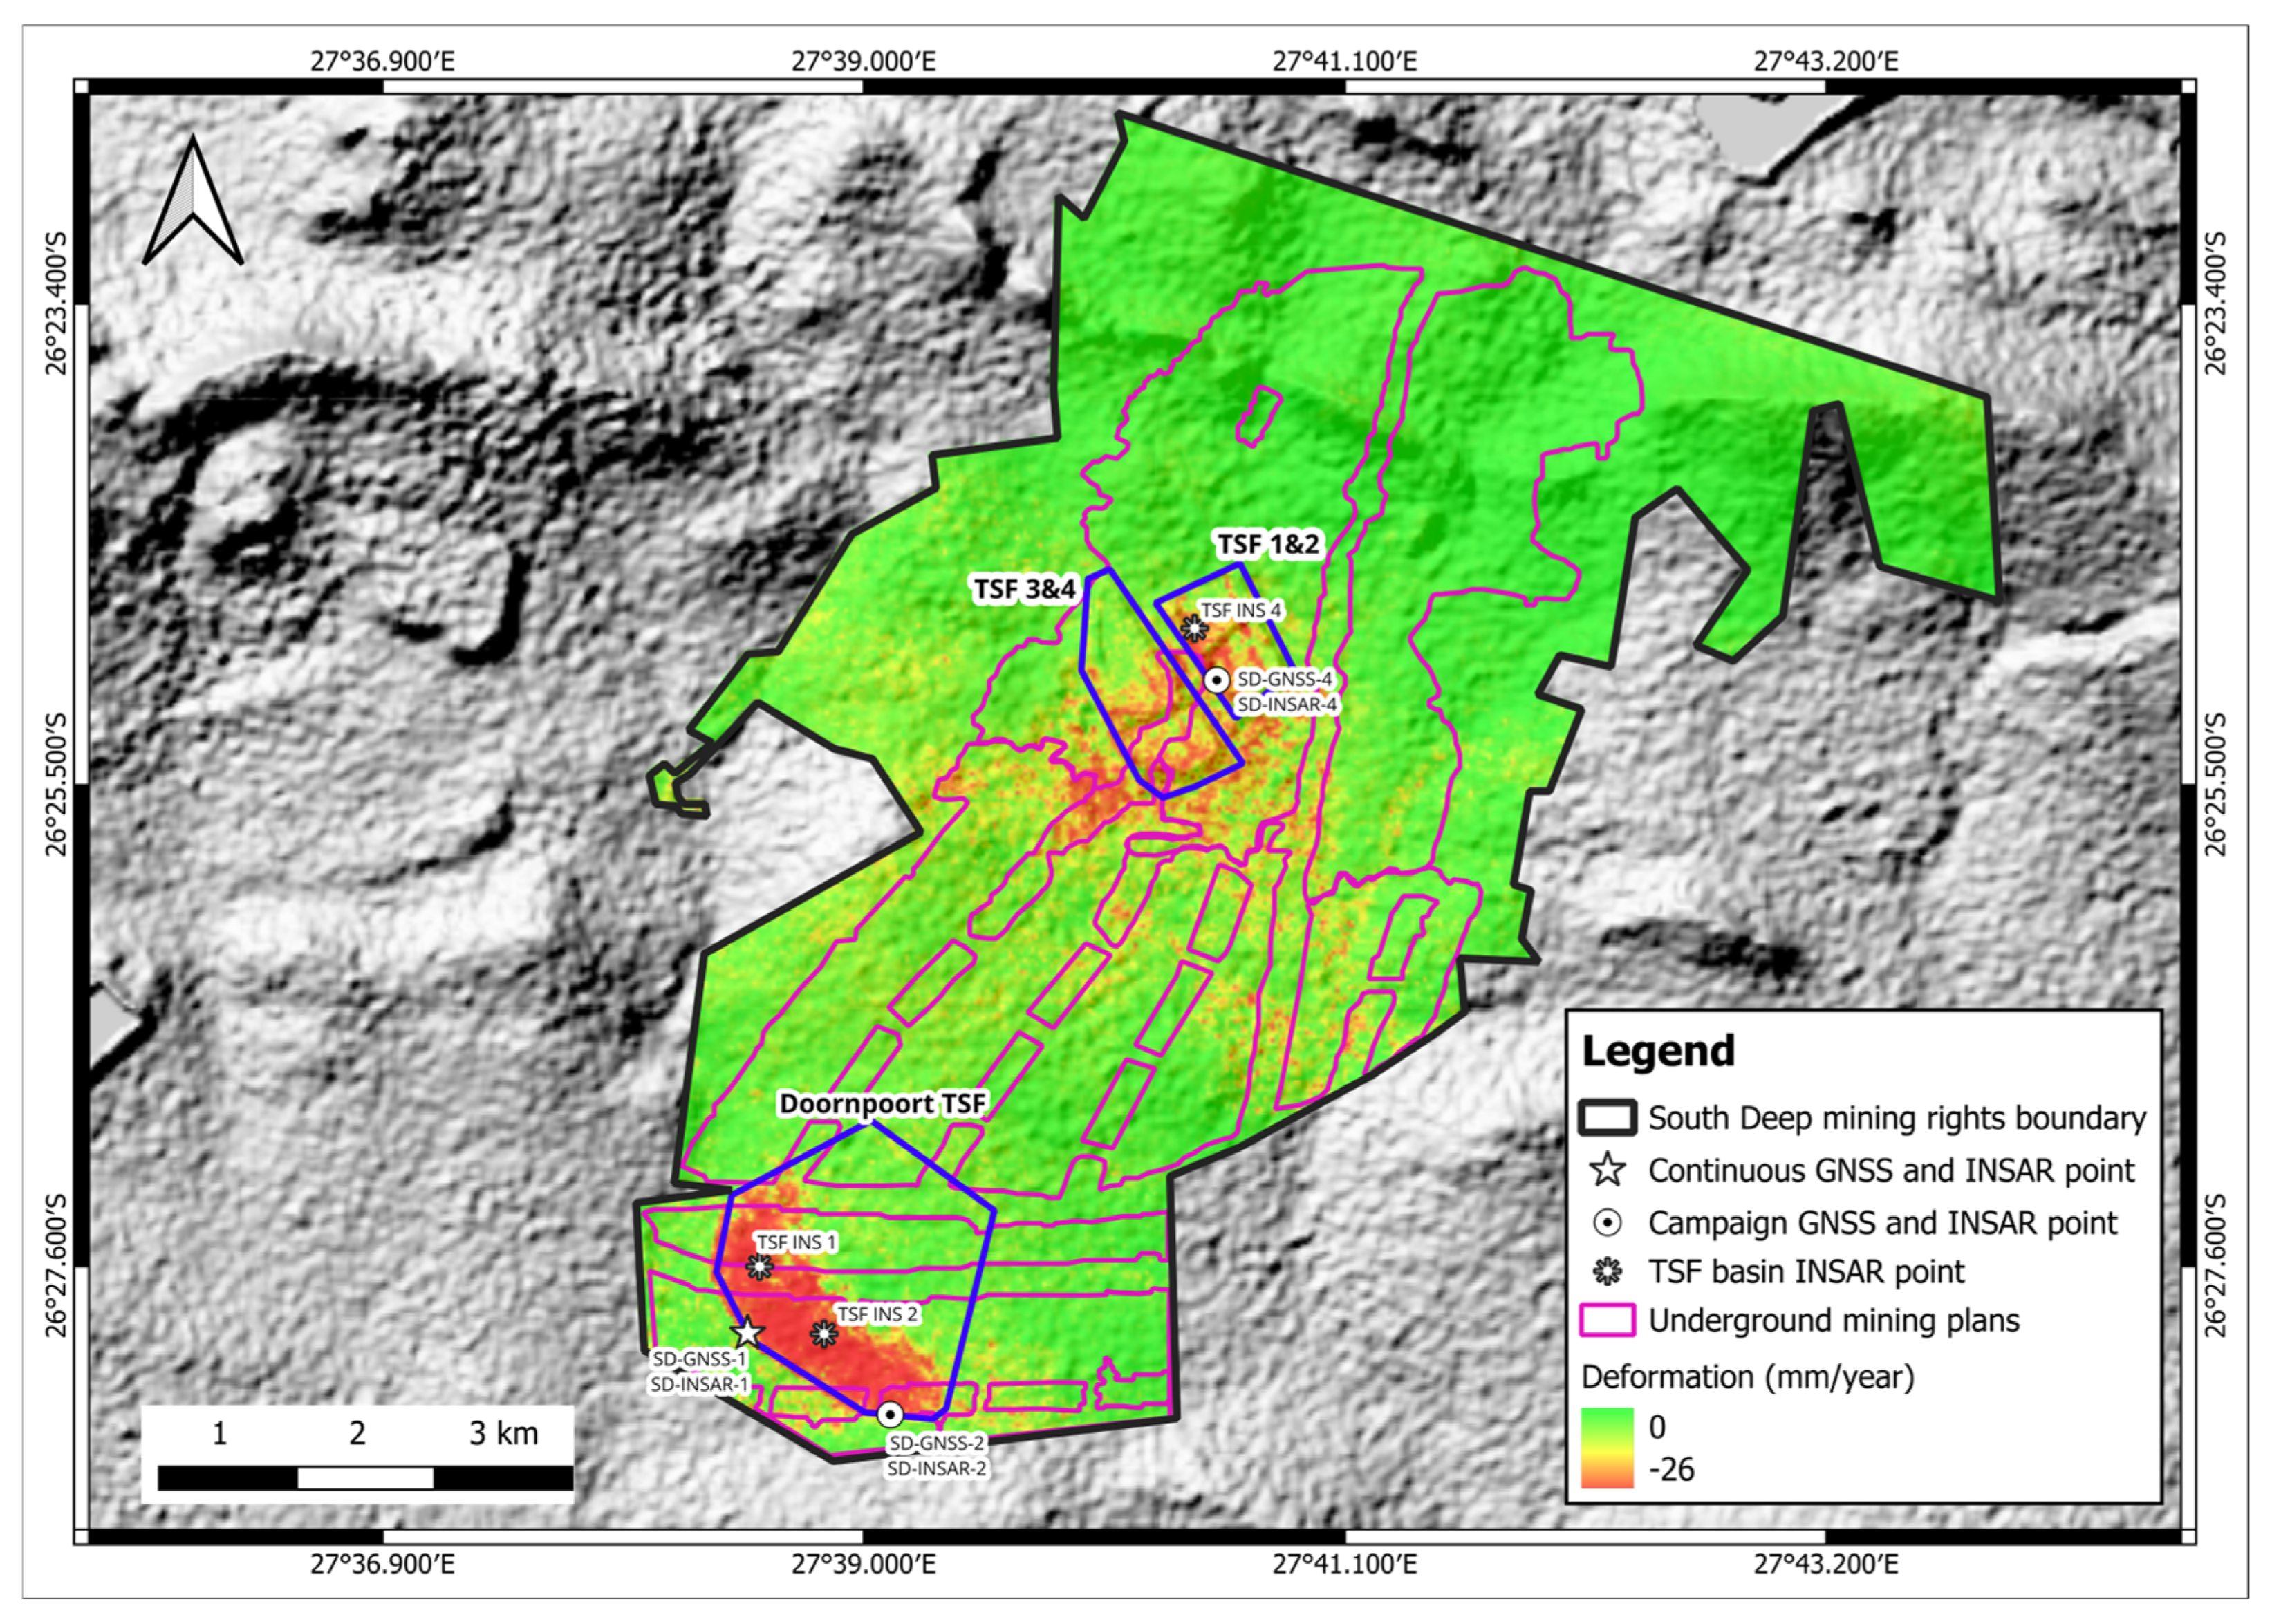
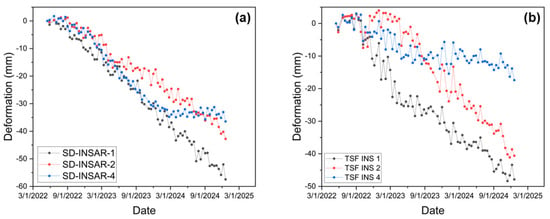
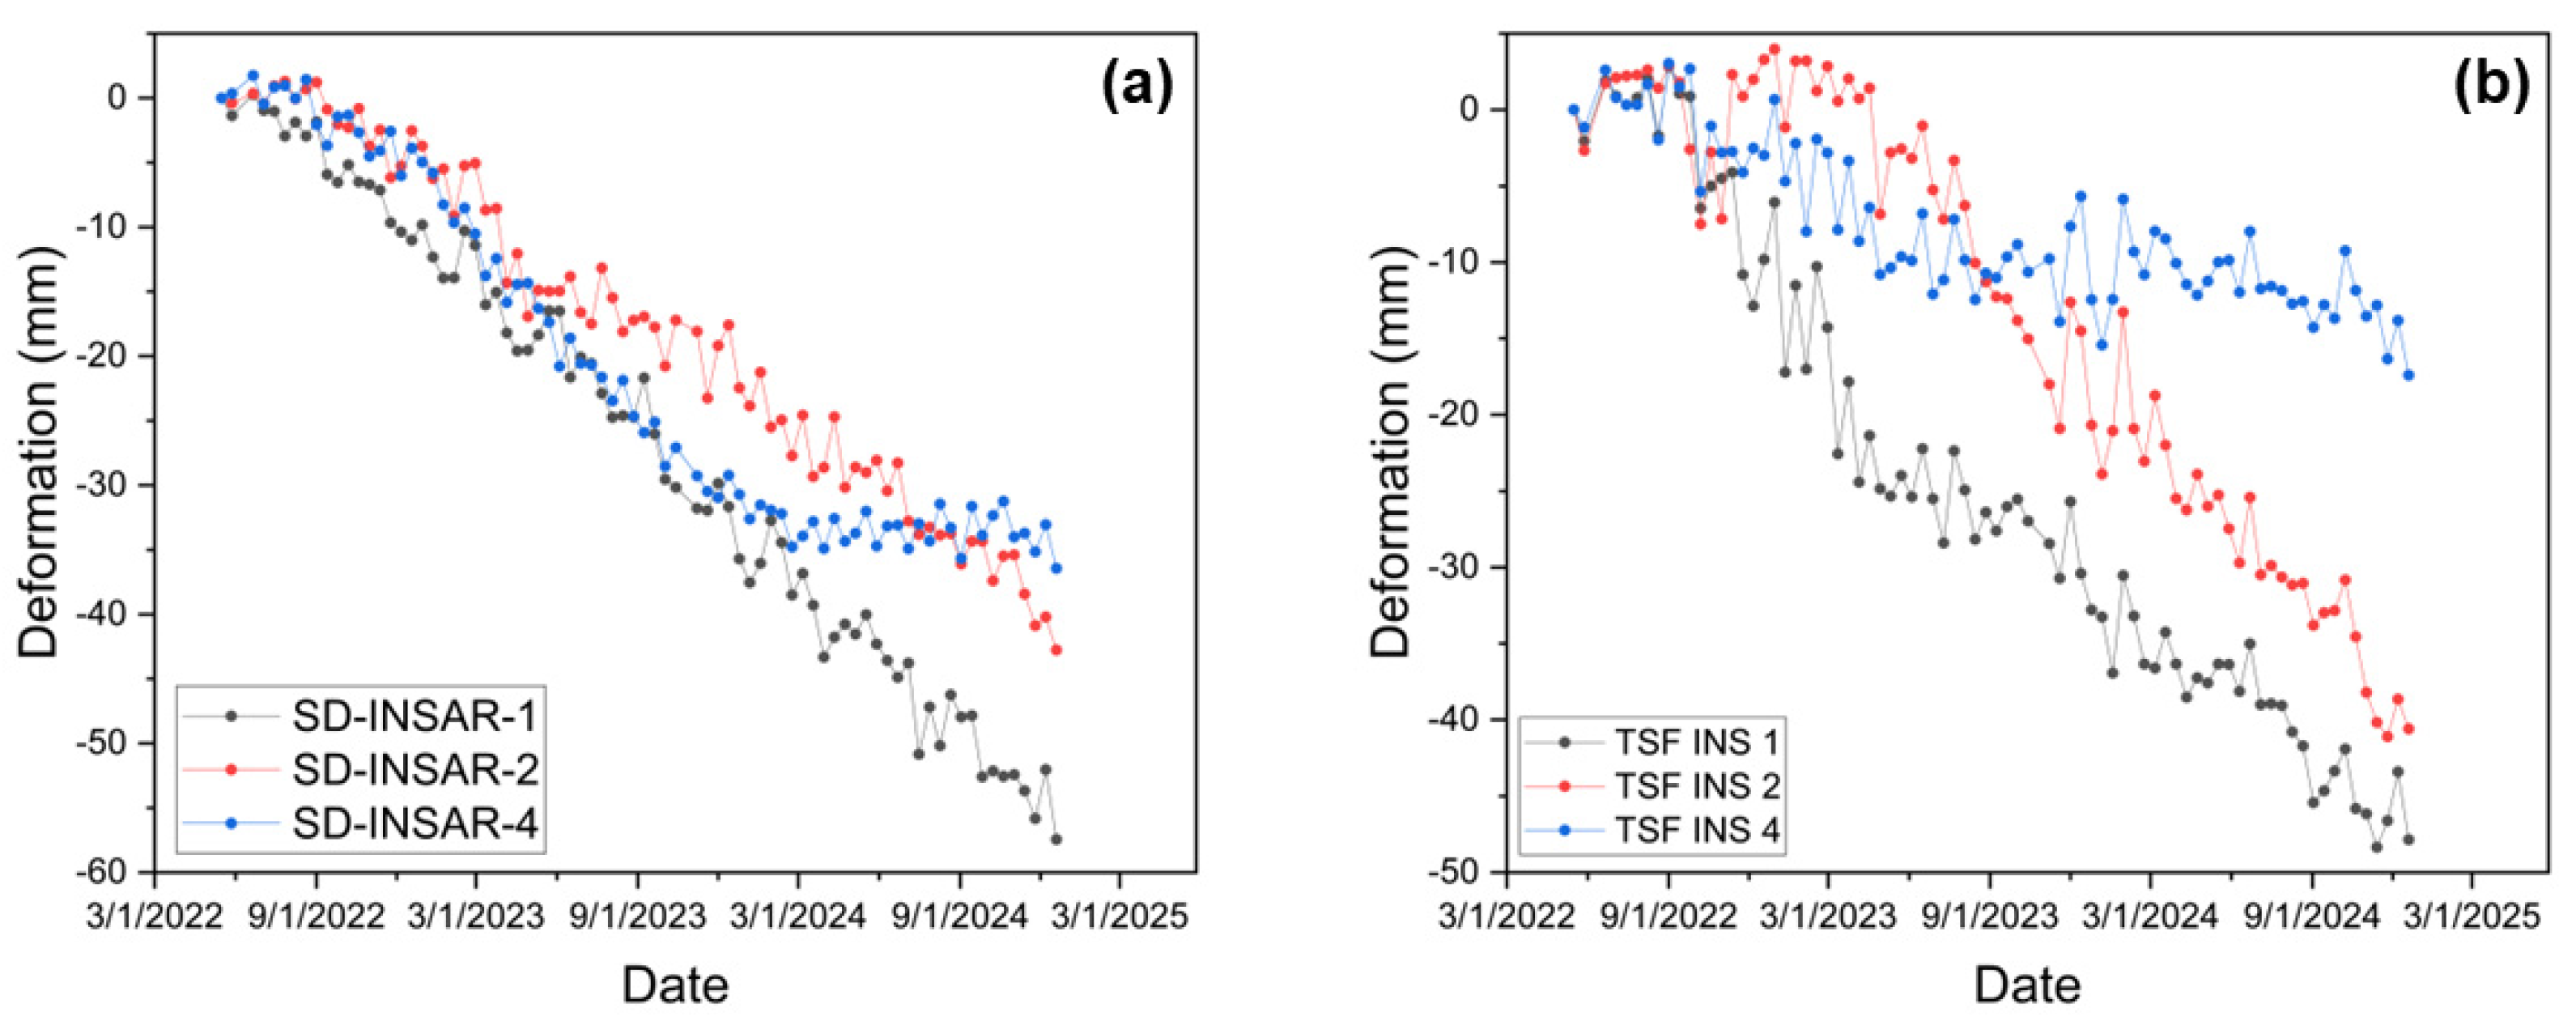
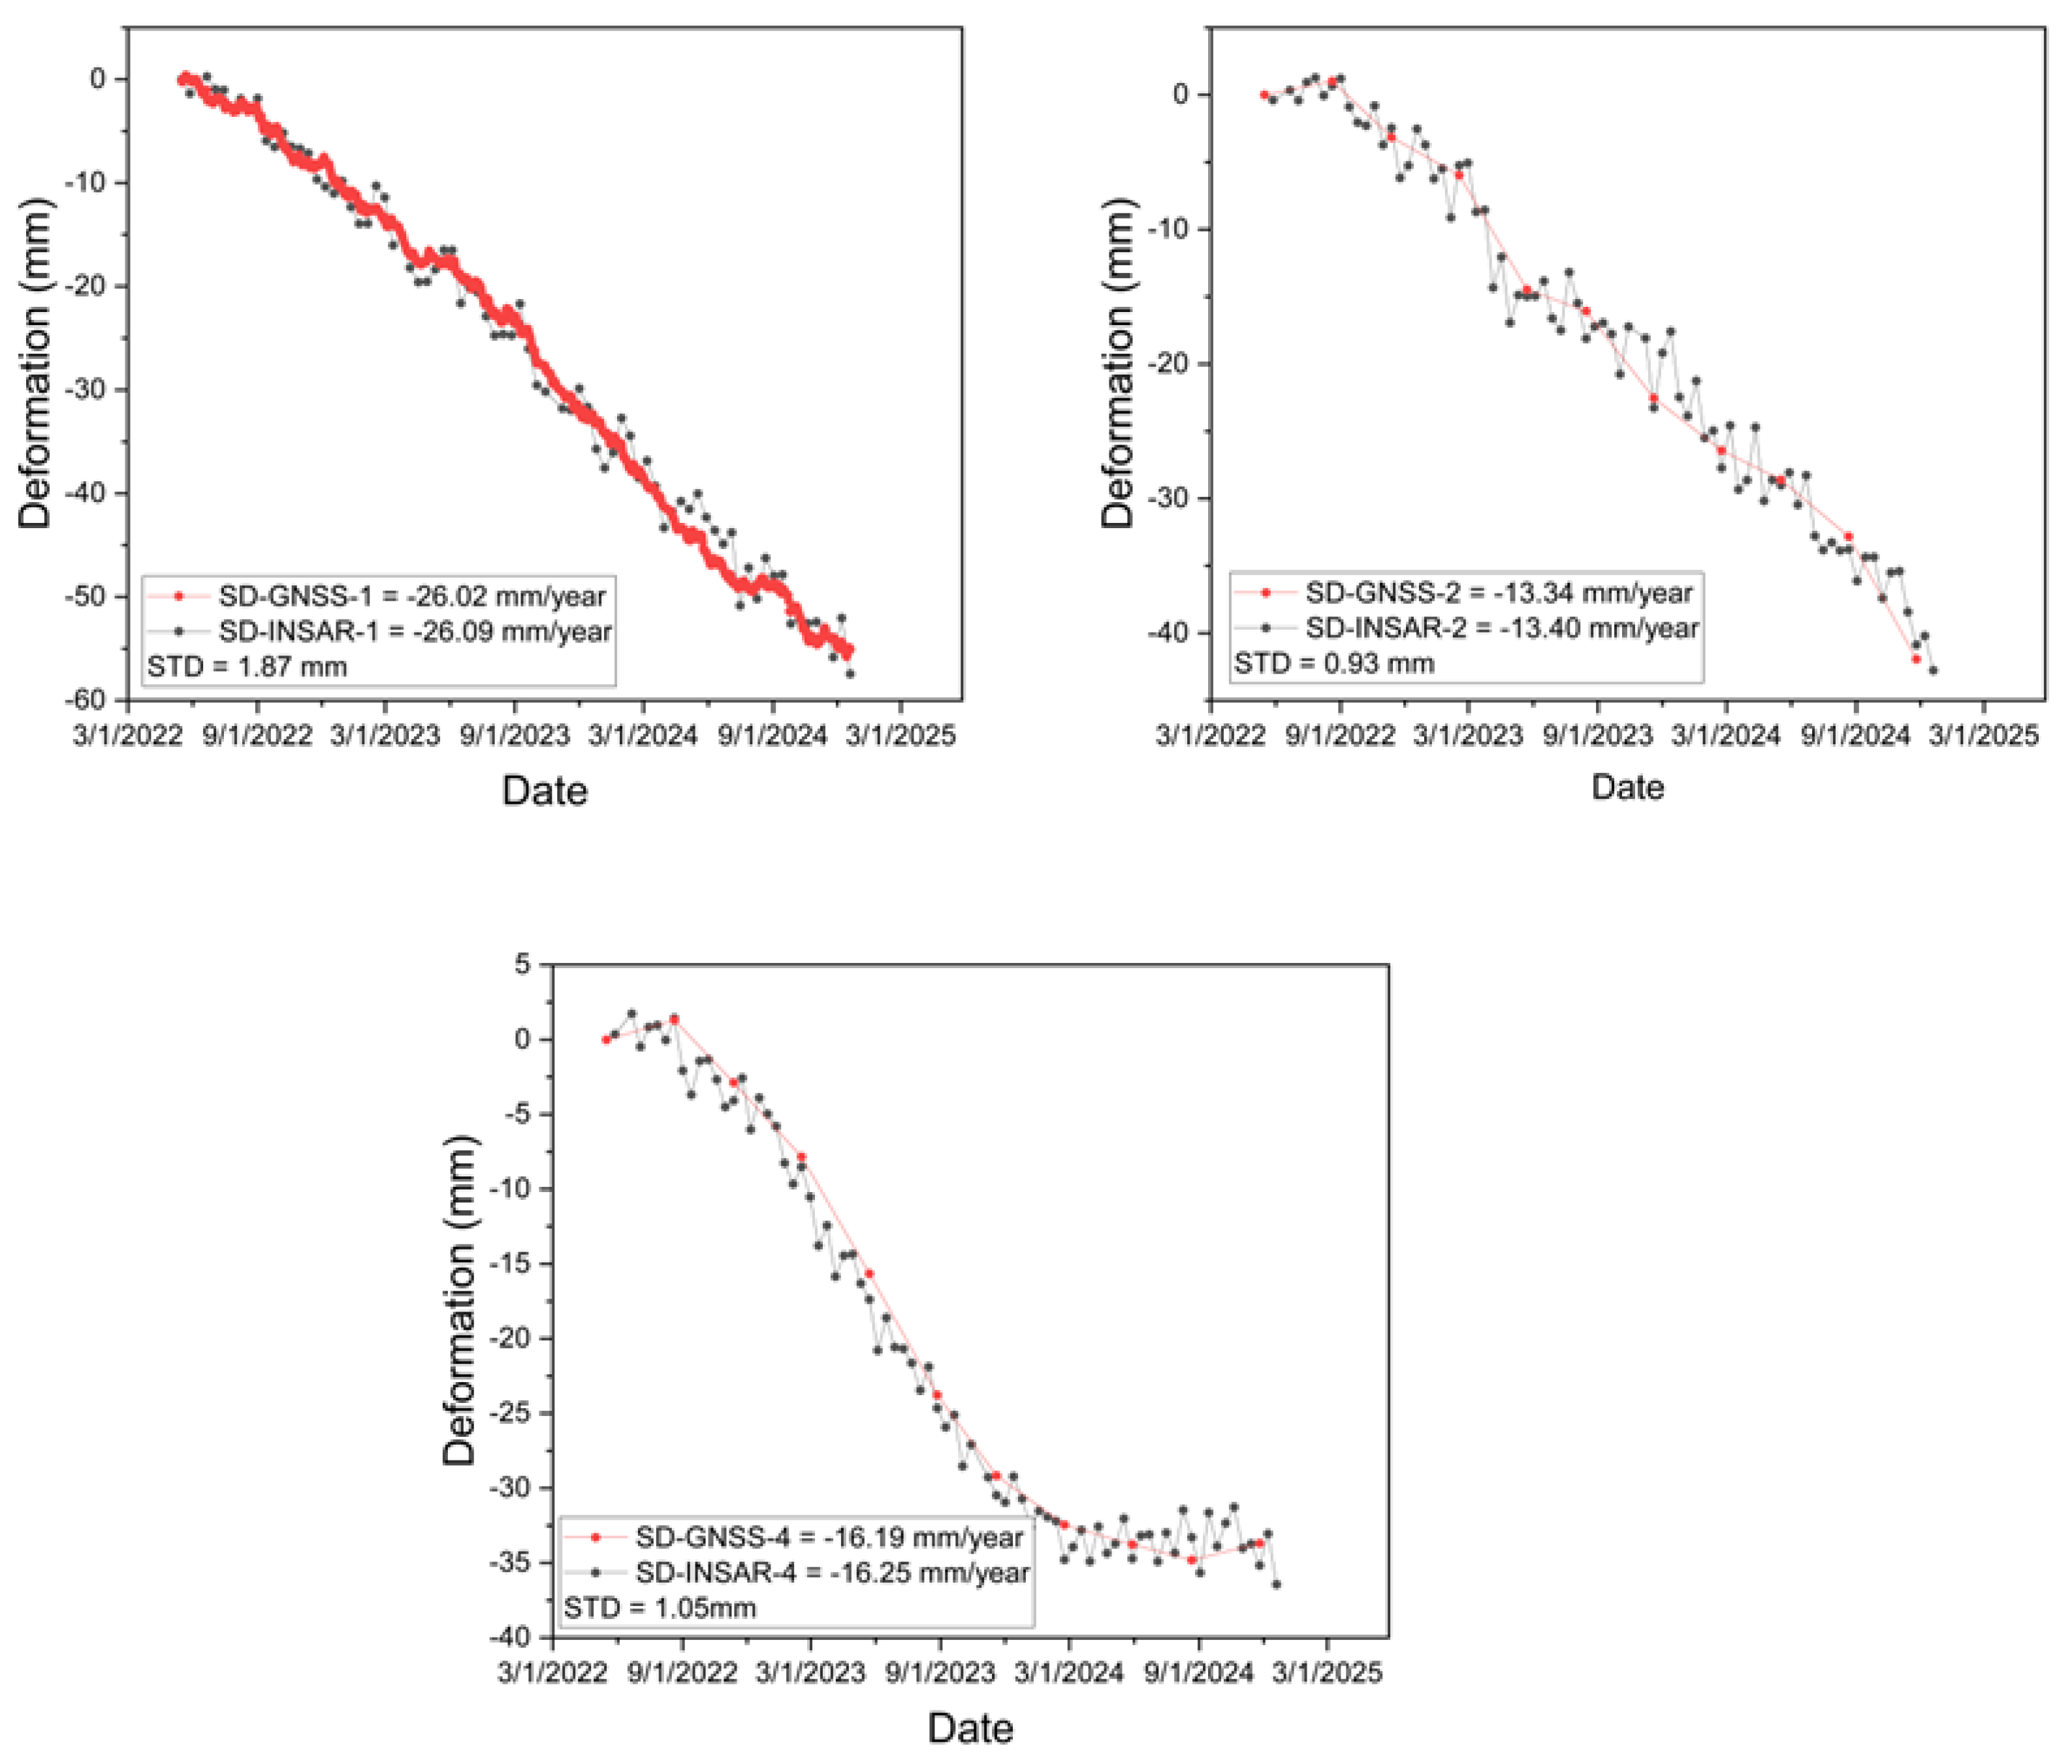
Figure 5 shows the results for the study area after SBAS data processing. Ground subsidence was detected in the southern section of the South Deep gold mine, which includes the Doornpoort tailings storage facility, as well as in the central part of the mining site, which includes the central shaft, TSF 1&2, and TSF 3&4. The annual average deformation rate recorded for the entire site was −26 mm/year. To visualise the areas that have shown signs of subsidence, the deformation result was overlaid on the Copernicus GLO-30 Digital Elevation Model shaded-relief map and on the underground mining layout plan, georeferenced to the World Geodetic System 1984 (WGS 84) and falling within the extraction rights boundary. There are four distinct areas within the mining site: the Current Mine (CM), North of Wrench (NoW), South of Wrench-East (SoW-E), and South of Wrench-West (SoW-W). Presently, active underground gold ore extraction is taking place at the Current Mine, North of Wrench and South of Wrench-East. Production at South of Wrench-West is expected to begin at a later date. Both TSF 1&2 and TSF 3&4 are located in the Current Mine section, whilst the Doornpoort TSF is in the South of Wrench East section. The results indicate that the areas being mined, as depicted in the underground mining plans in Figure 5, are experiencing subsidence spatially coincident with deep regional mining as the primary factor. Red indicates regions of subsidence, while green denotes areas that are currently stable. Figure 6 show the time series results for the InSAR points in proximity to the GNSS monitoring stations at the South Deep mine. These InSAR points are named similarly to the GNSS codename, with the addition of ‘InSAR’ to their codenames. The codenames are SD-InSAR-1, SD-InSAR-2 and SD-InSAR-4. The recorded average annual deformation at SD-InSAR-1 was −26.09 mm/year, with a cumulative deformation of −57.45 mm across the monitoring period. SD-InSAR-2 recorded an average deformation of −13.40 mm/year and a cumulative deformation of −42.76 mm. At SD-InSAR-4, the recorded average deformation rate stood at −16.25 mm/year, with a cumulative deformation of −36.44 mm. Three InSAR control points were randomly selected to quantify deformation magnitudes within the Doornpoort TSF and TSF 1&2 basins. These InSAR points, designated as TSF INS 1, TSF INS 2 and TSF INS 4, recorded average annual subsidence rates of −11.89 mm/year, −9.32 mm/year and −13.40 mm/year, respectively. Time series analysis at these sites revealed cumulative deformations of −47.85 mm, −40.59 mm and −17.39 mm, respectively, across the monitoring period. The cumulative deformation time series for the TSF embankment InSAR benchmarks and the TSF basin InSAR points are shown in Figure 6.
Figure 5.
Annual average SBAS-InSAR results at the South Deep gold mine, South Africa.
Figure 6.
(a) Time series cumulative deformation of the InSAR monitoring points on the TSF embankments from May 2022 to December 2024; (b) Cumulative deformation of the InSAR monitoring points within the TSF basins from May 2022 to December 2024.
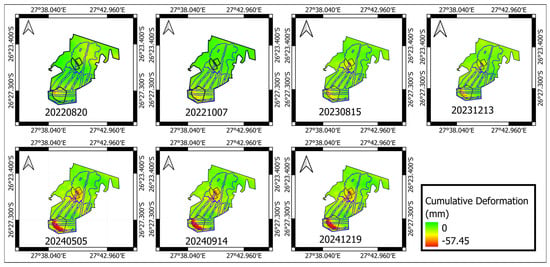
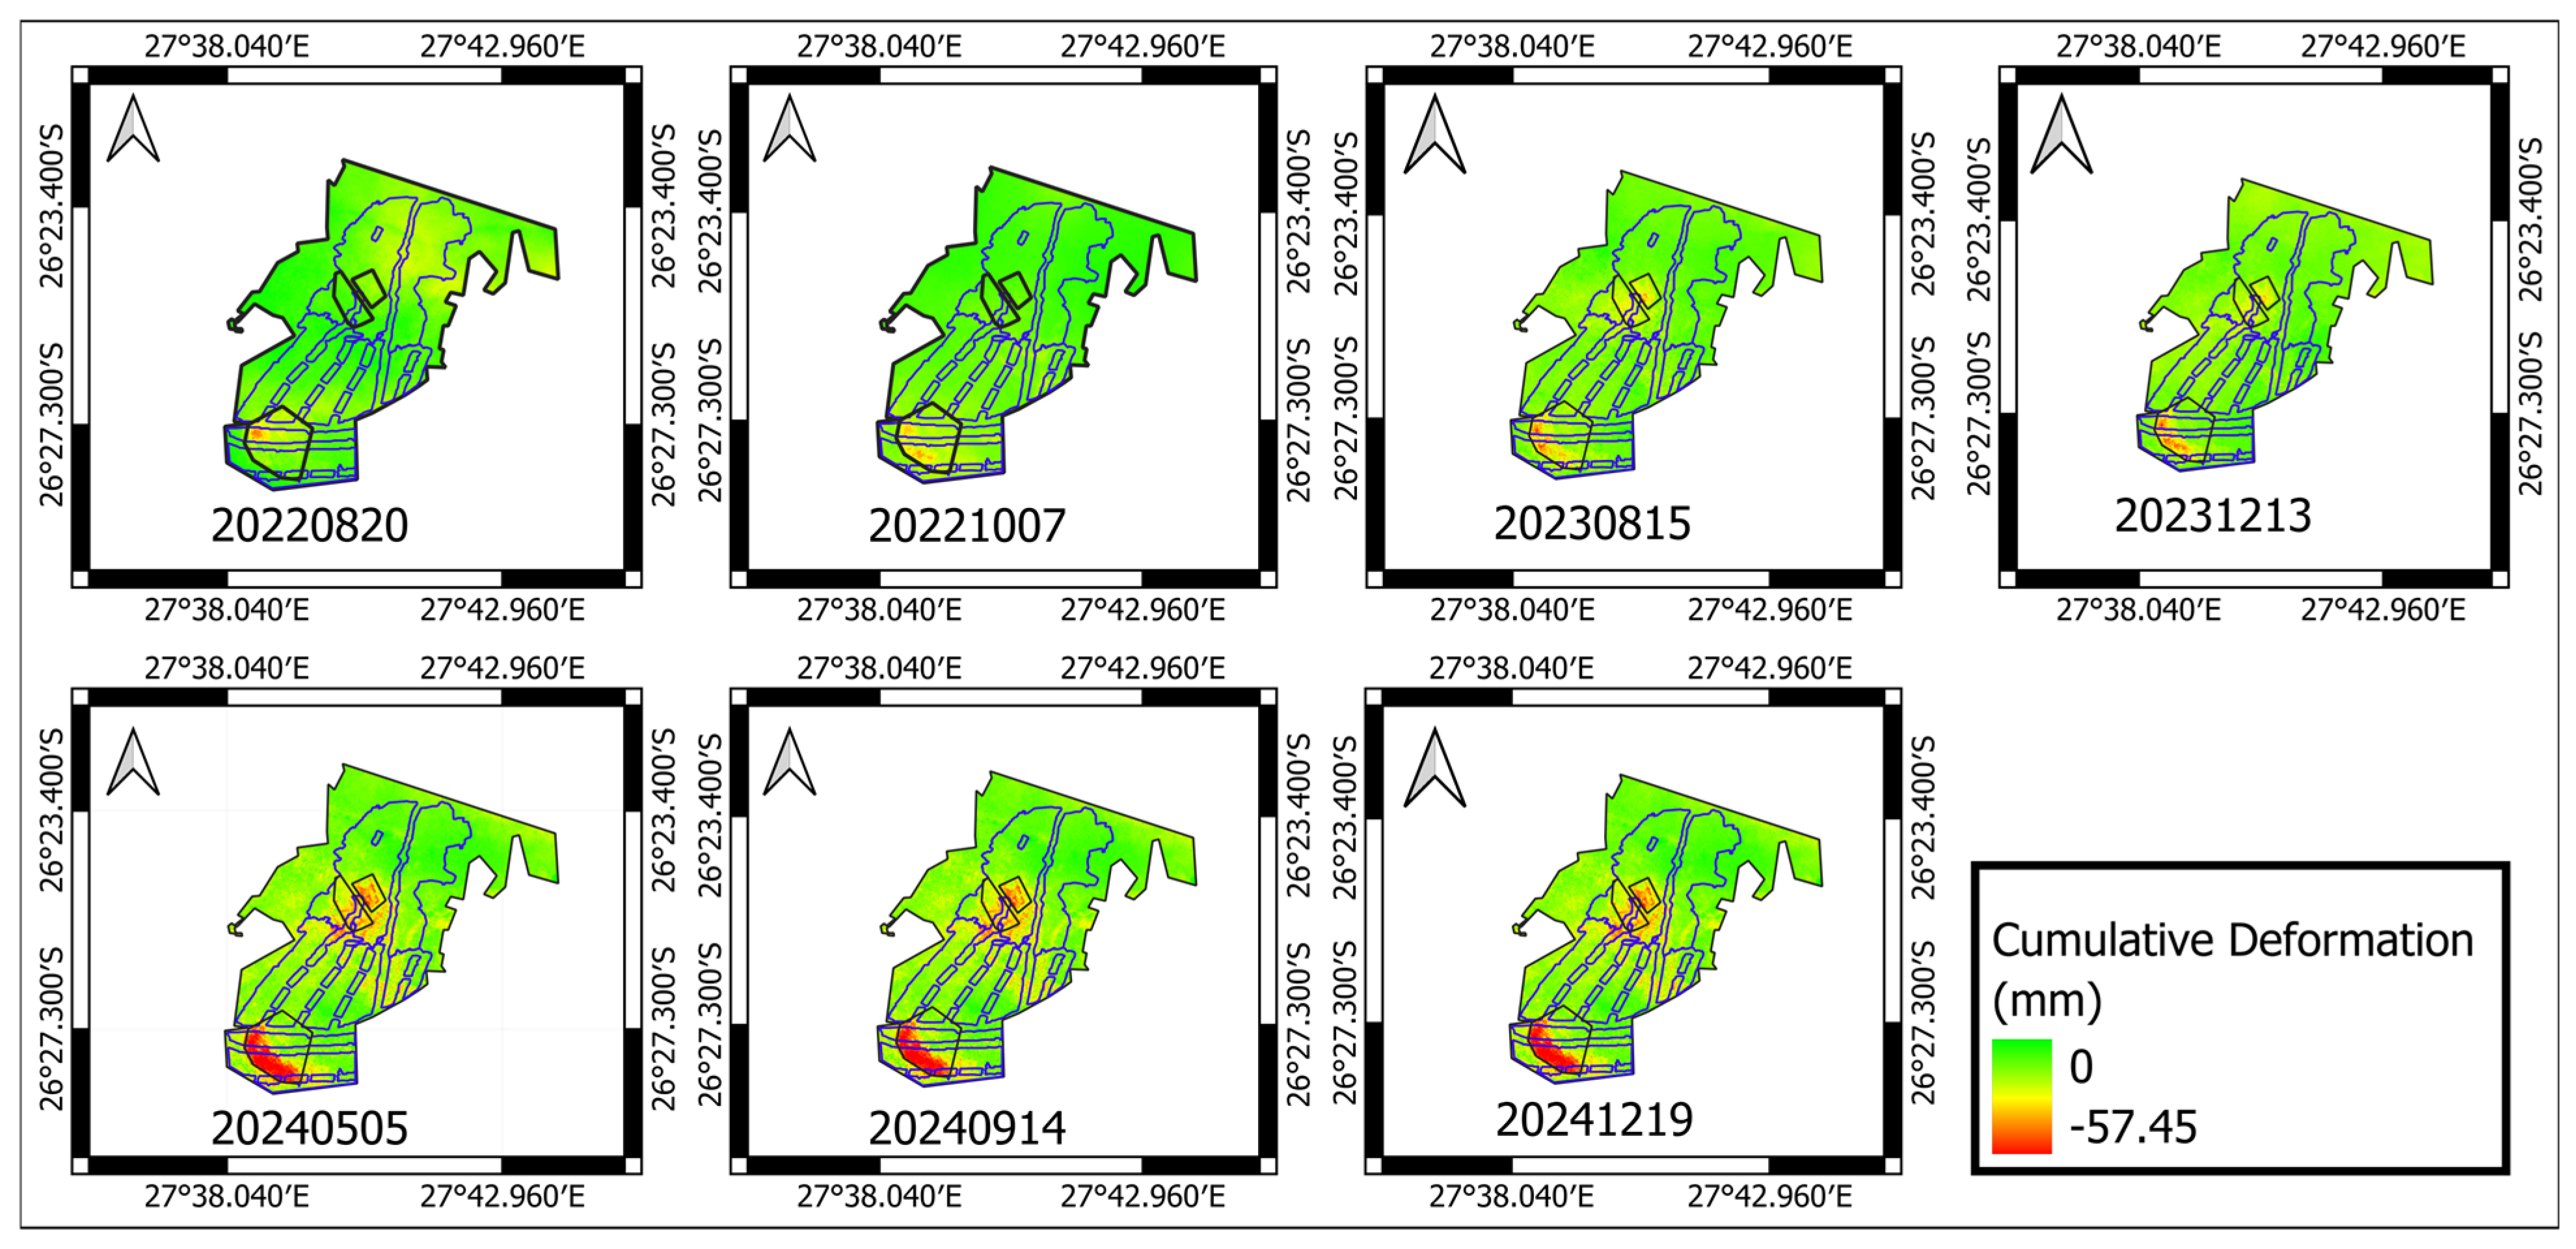
Figure 7 shows the spatial and temporal evolution of the observed subsidence across the South Deep gold mine from May 2022 to December 2024. The findings show a pattern of area expansion, intensification, and consolidation of deforming zones when closely observed, and thus, emphasising the interpretation of long-term, coupled deformation processes beneath the mining area. At the beginning of the observation began in May 2022, the detected surface subsidence was relatively small and confined to the Doornpoort TSF area and to a few isolated spots near the central shaft and the TSF 1&2 area. The initial deformation patterns show no signs of spatial continuity, with different contrasts between the deformed and relatively stable ground. The deformation area experiences a substantial transition from the middle of 2022 to the middle of 2023. Subsidence begins to spread across from previously isolated areas, and deformation zones expand in both area and spatial coherence. Subsidence at the Doornpoort TSF spreads from the top of the embankment into neighbouring parts of the TSF basin, whereas deformation is more continuous close to the central shaft and TSF 1&2. In this stage, the separate areas undergoing subsidence gradually merge into larger subsidence areas. The deformation becomes intense by the end of 2023 and continues through December 2024. There is a noticeable increase in the magnitude and extent of subsidence, resulting in the most significant deformation area recorded throughout the monitoring period, especially along the Doornpoort TSF embankment and across the TSF basin. Simultaneously, the deformation being experienced at TSF 1&2 and TSF 3&4 expands and overlaps with the subsidence near the central shaft. By the end of the monitoring period in December 2024, the ground displacement response is cumulative, having gradually occurred over time and no longer limited to isolated zones; it now appears as wide subsidence basins. The observed subsidence spatial evolution, which is also confined to the boundaries of the projected underground mining layout, aligns with the combined effects of deep-level underground mining geometry and progressive surface loading from tailings deposition. Even though the operational tunnels are located deeper below ground, the enormous stress from high-profile destress and long-hole stoping extraction activities is transmitted to the surface in both vertical and horizontal directions. This causes structures like the TSF, which are much more sensitive, to react by settling. A thorough visualisation of the deformation result overlaid on the underground extraction layout plan shows that the TSFs are located within mining blocks and regional pillar boundaries where differential vertical displacement and strain gradients have the tendency to be transmitted from deep below to the surface. Thus, the deformation patterns that have been observed can be explained by the unique structural context provided by the spatial correspondence between the mapped underground mining domains and the expanding subsidence zones shown in Figure 7. The deformation is gradual and does not happen in isolated collapse areas. On the contrary, it evolves slowly, with gradual expansion of persistent subsidence signals. This pattern of behaviour indicates that the rock layer is responding on a regional scale due to ongoing underground extraction rather than temporary surface instability. At the same time, an additional factor contributing to subsidence, especially in the TSF basins and along embankment slopes, is incremental loading from ongoing tailings deposition. The magnitude and pattern of deformation shown in Figure 6 can be reasonably explained by the combined effects of subsidence deep within the earth caused by stress redistribution underground and compression close to the surface caused by tailings loading. The direction, consistency, and expansion of the subsiding areas can be better understood with the help of the underground extraction layout plan. Given that there is no localised uplift, this supports the suggestion that the observed surface deformation is most likely caused by anthropogenic forcing mechanisms, notably underground stoping activities that alter the earth’s strata, rather than by temporary atmospheric or environmental artefacts.
Figure 7.
Deformation time series spatial evolution at South Deep gold mine.
4.2. Correlation Between GNSS and InSAR Results
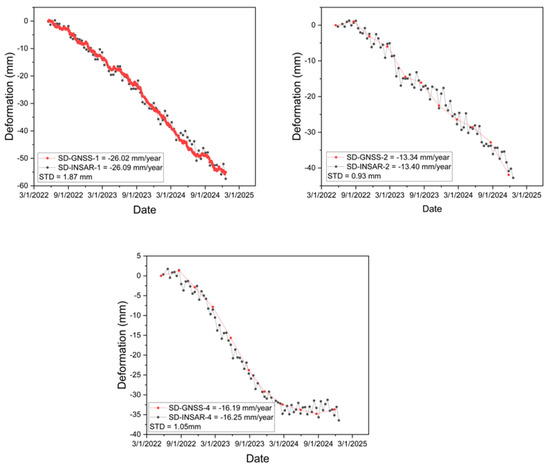
Previous studies, including recent advancements in three-dimensional deformation monitoring, have demonstrated correlation and agreement between GNSS and SBAS-InSAR measurements [49,50,51]. Figure 8 presents the correlation analysis of GNSS and InSAR time series data. As previously noted, InSAR measurement points are located within a 50 m radius of the GNSS stations. Three GNSS monitoring station datasets, designated as SD-GNSS-1, SD-GNSS-2 and SD-GNSS-4, were collected from May 2022 to December 2024 at the mining site. The SD-GNSS-1 benchmark is a continuous GNSS monitoring station installed on the southern embankment of the Doornpoort tailings storage facility. The average vertical deformation velocities at each monitoring point are as follows: SD-GNSS-1 recorded a GNSS average deformation velocity of −26.02 mm/year and a corresponding InSAR average deformation velocity of −26.09 mm/year, with a standard deviation of 1.87 mm. At SD-GNSS-2, located on the eastern embankment section of the Doornpoort TSF, the vertical average GNSS deformation velocity was −13.34 mm/year, and the corresponding InSAR vertical velocity was −13.40 mm/year, with a standard deviation of 0.93 mm. SD-GNSS-4, installed on the TSF 1&2 embankment, recorded an average vertical velocity of −16.19 mm/year and a corresponding InSAR velocity of −16.25 mm/year, with a standard deviation of 1.05 mm. Additionally, cumulative GNSS and InSAR deformations of −55.07 mm and −57.45 mm, −41.93 mm and −42.76 mm, and −33.68 mm and −36.44 mm were recorded for SD-GNSS-1 and SD-InSAR-1, SD-GNSS-2 and SD-InSAR-2, and SD-GNSS-4 and SD-InSAR-4, respectively, over the two-year monitoring period. The results indicate close agreement between InSAR and GNSS measurements. Results from subsidence studies in low-coherence areas are more reliable when using this integrated monitoring approach. This is because these areas tend to be dry and sparsely vegetated.
Figure 8.
Cumulative InSAR and GNSS deformation results.
4.3. Spatial Correspondence Between Observed Subsidence and Underground Mining Activity
A thorough visual analysis of the spatial distribution of the South Deep gold mine deformation results indicates that the subsidence phenomenon is confined within the ore extraction areas shown on the underground layout plan. The observed spatial correspondence demonstrates that multi-temporal InSAR techniques can delineate irregular boundaries of mining-induced subsidence [52]. Following the SBAS processing, subsidence is detected within the Current Mine, North of Wrench, and South of Wrench-East blocks, as shown by the mine’s operational underground mining layout plan as presented in Figure 5. Ore is mined from both the Current Mine and the North of Wrench sections using long-hole stoping (LHS) and high-profile destress mining techniques. Cumulative deformation of −57.45 mm was recorded at the Doornpoort TSF south embankment, which is located in the South of Wrench-East section of the ore mining zone. Again, in this section, the mechanized destress-LHS sequence extraction technique is used to extract the gold ore, and this region alone contains an estimated mineral reserve of 50 Mt [53]. Also, a deformation of −36.44 mm is being recorded on the embankment of TSF1&2, located in the Current Mine block, as shown in the layout plan. Although areas within the mining zones, as shown in the underground mining layout plan, show varying levels of subsidence, other areas, such as buffer zones between blocks, undeveloped corridors, and peripheral areas, show relative stability. This relative stability in these areas indicates that subsidence is primarily confined to the areas where underground destress activities and long-hole stoping extraction operations are taking place, despite their proximity to the deforming zones. As per the mine’s development schedule, overburden destressing activities and ore extraction in the South of Wrench-West are scheduled to take place in the future. As such, since there is no available or evident subsidence shown in this area, it serves as a negative control indicator showing that the subsidence detected in the other areas is not caused by regional tectonics, seasonal hydrology, or atmospheric artefacts, but rather results from localised stress redistribution associated with active stope void creation. The detected subsiding areas fall within the geometry of the mining layout plan, and these regions remain consistent across multiple interferometric time periods, indicating a long-term deformation response rather than isolated or episodic events. Although the depth of excavation, the sequence of extraction, and the stope dimensions cannot be revealed through interferometric analysis, it has been demonstrated that deformation is confined to designated areas of the underground mining layout plan. This provides an observational framework for linking the observed subsidence to deep-level mining operations within the study area.
4.4. NMF Decomposition and Subsidence Cause Analysis
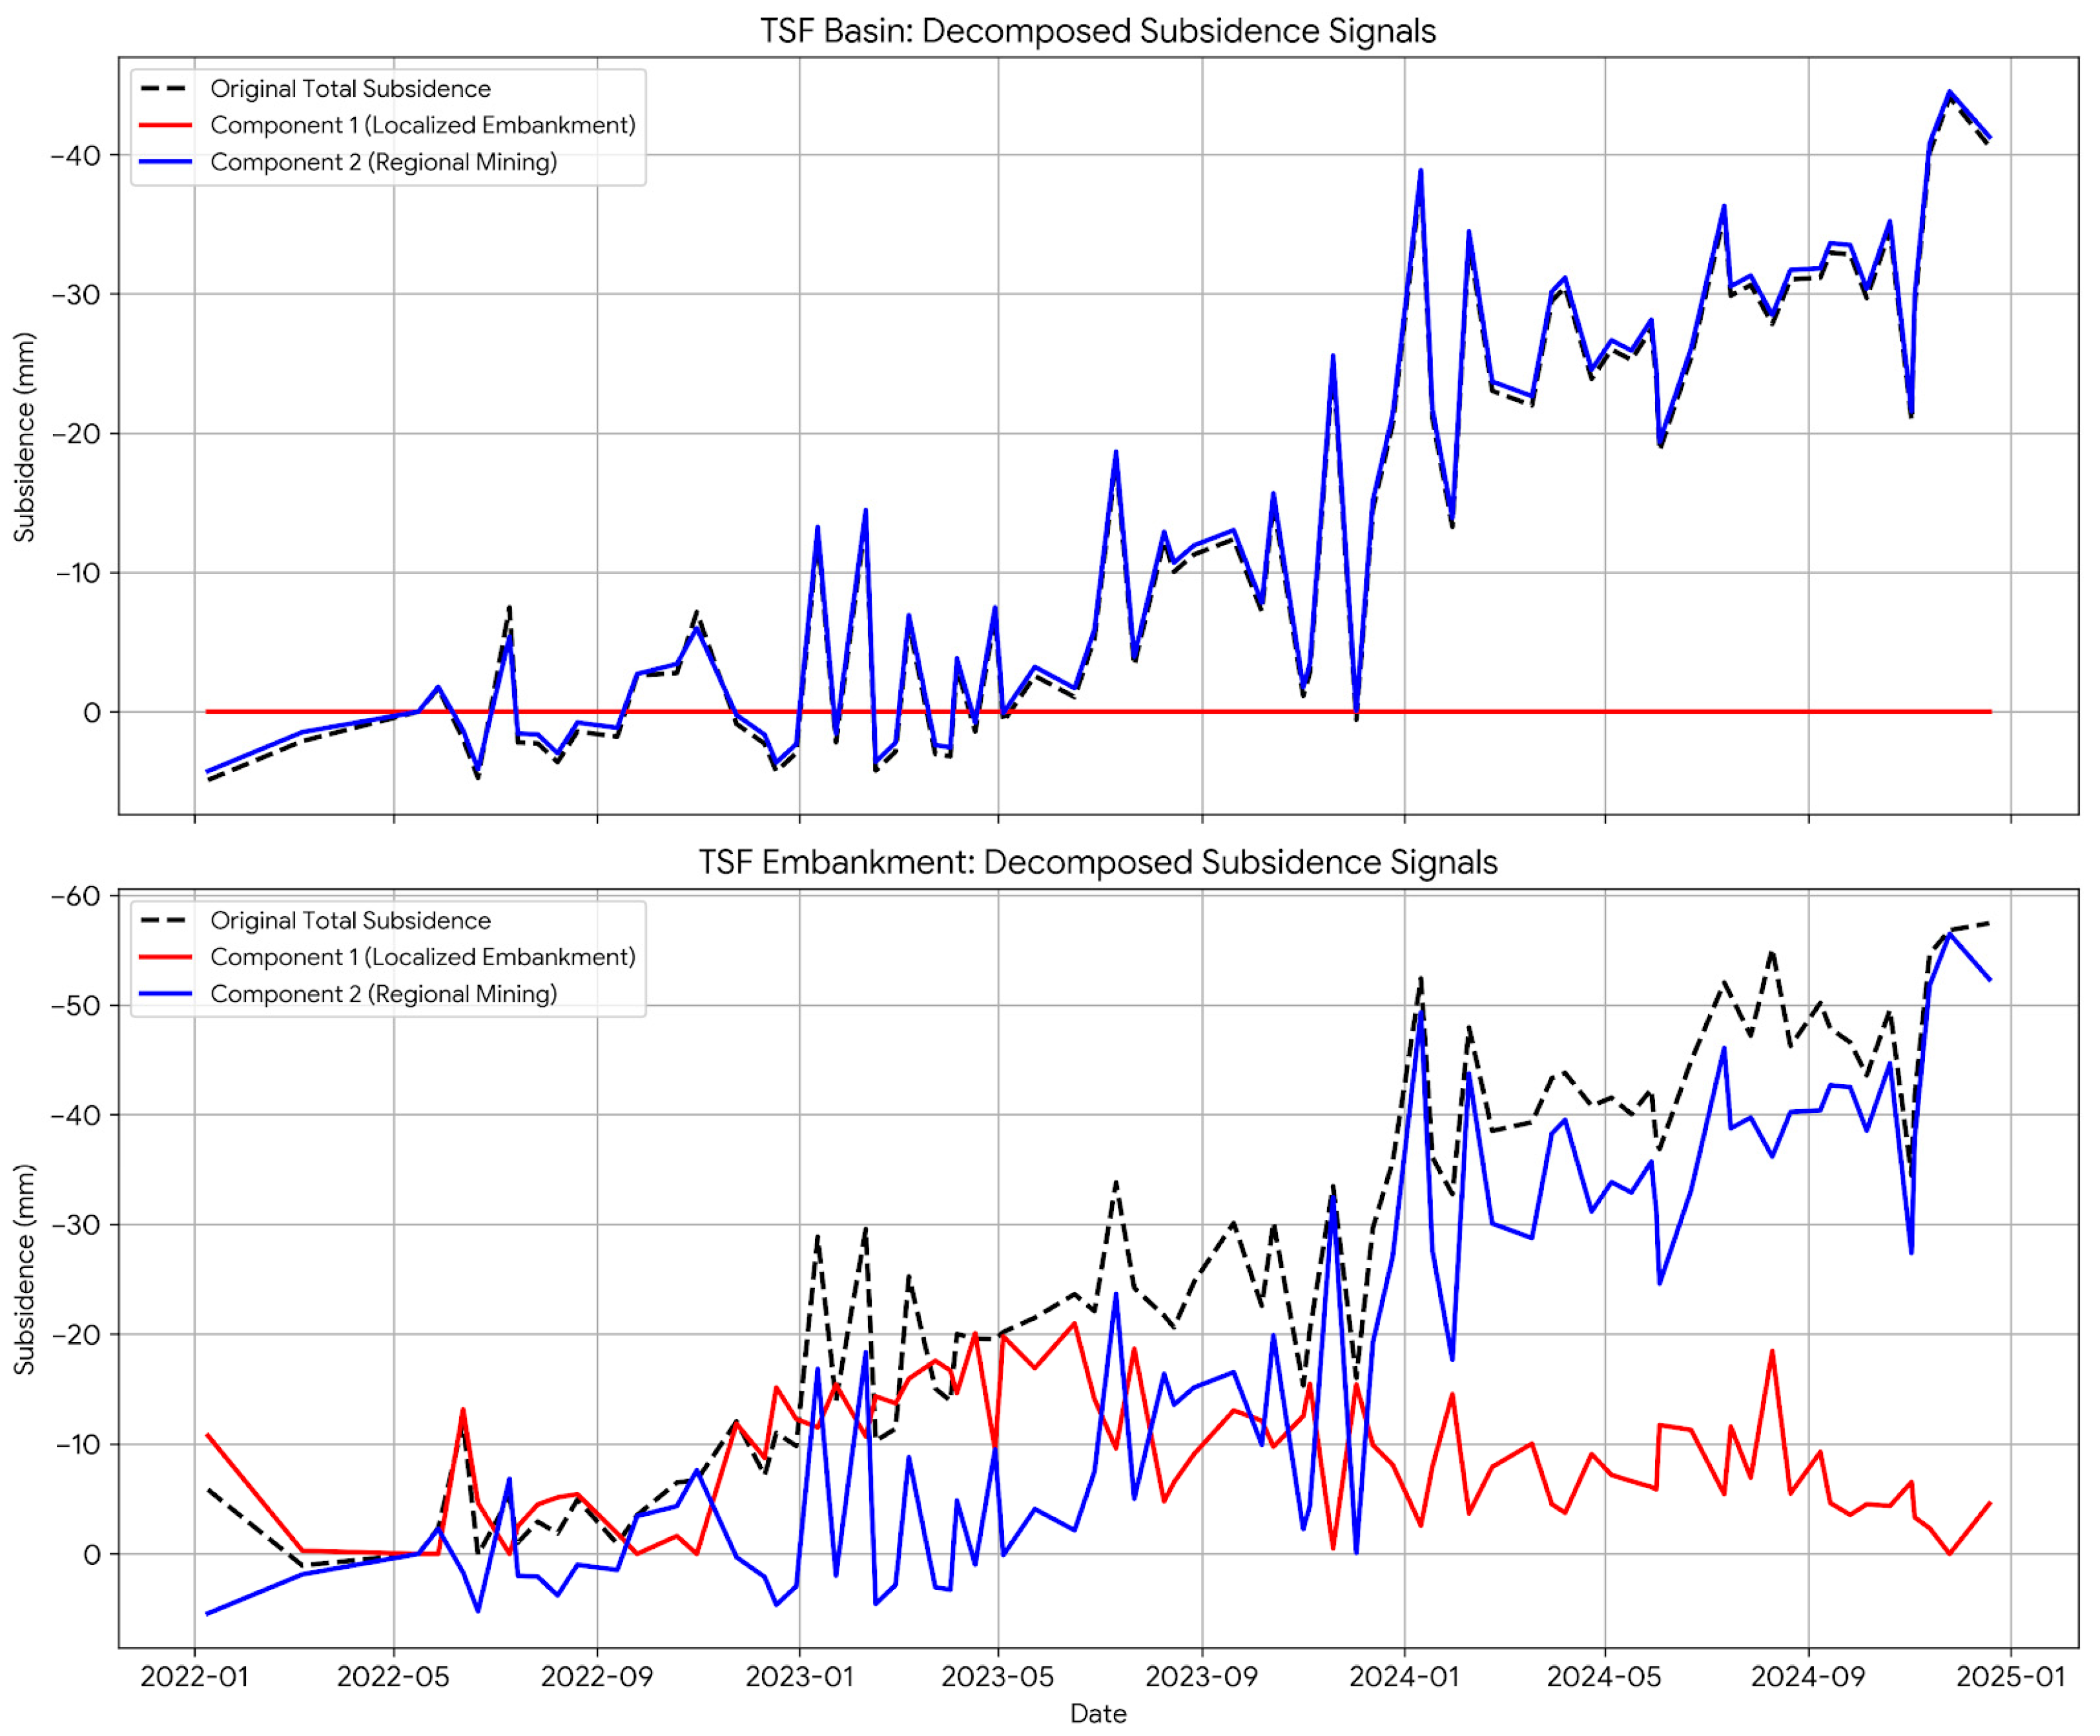
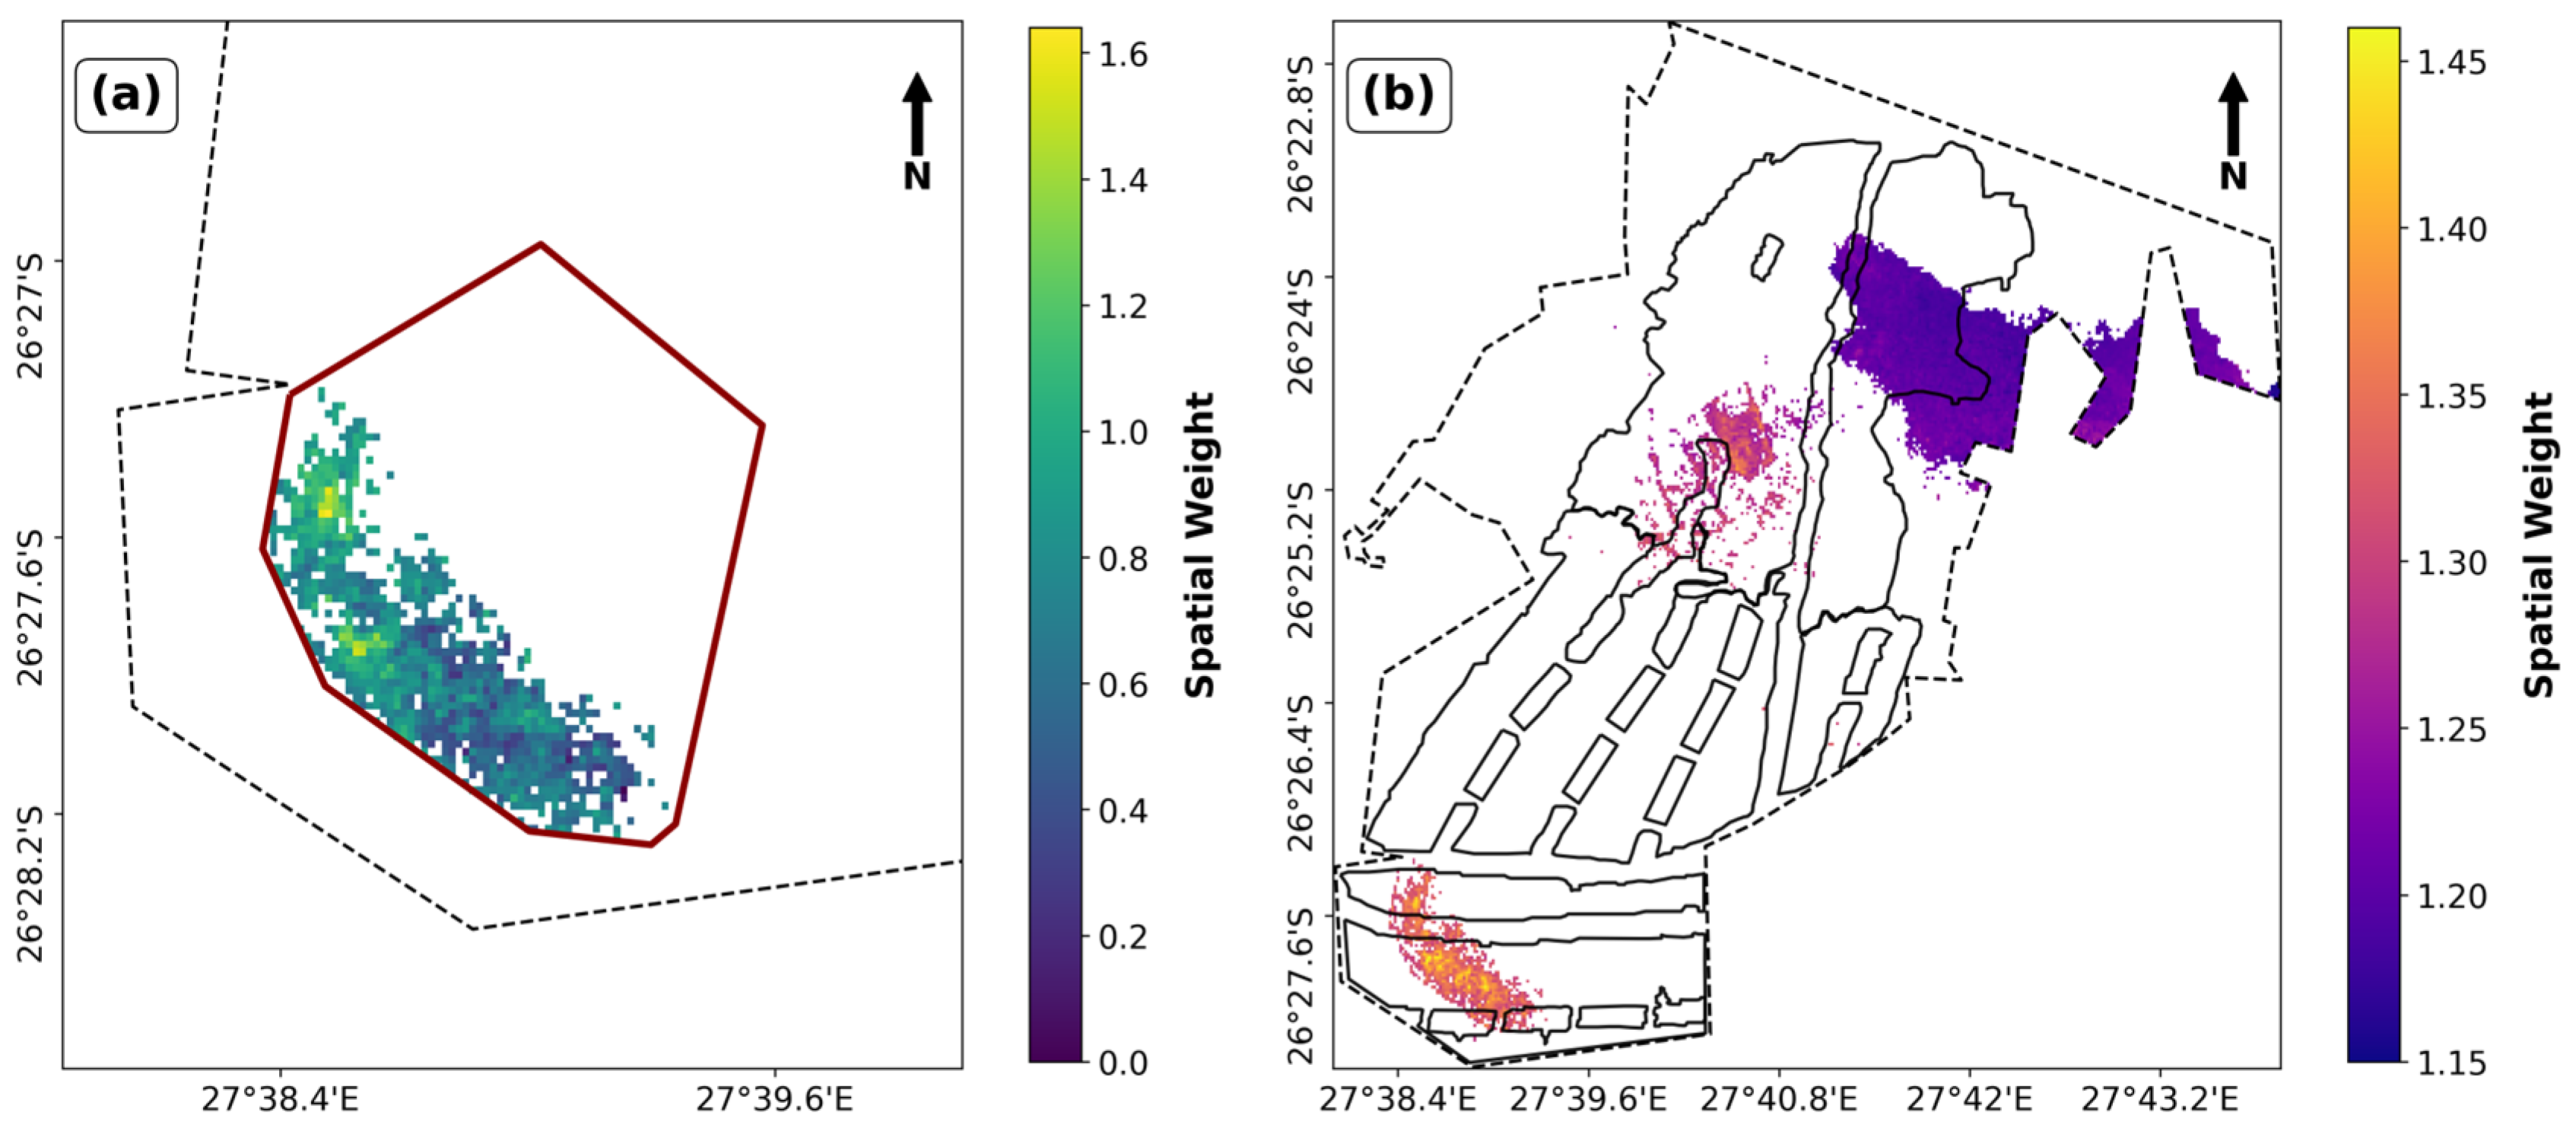
The SBAS-InSAR time series for the selected decomposition sites were successfully separated into two influential components using the Non-negative Matrix Factorization algorithm, which effectively handled the complex and overlapping subsidence signals. NMF imposes a strict non-negativity requirement, unlike traditional blind source separation techniques such as Principal Component Analysis (PCA) or Independent Component Analysis (ICA), which allow negative values and may introduce non-physical artefacts, such as artificial uplift. Because of this feature, NMF is well suited to subsidence monitoring, since the spatial weight matrix W and the temporal signature matrix H produced represent physically significant, strictly unidirectional downward displacement. By breaking down the combined signal, we can see how each mechanism’s physical footprint was identified by the spatial weight matrix (Figure 9) and how its respective evolutionary trend was revealed by the temporal signature matrix (Figure 10). The spatial and temporal decomposition using non-negative matrix factorization via k = 2 reveals two distinct deformation modalities. Although NMF offers an avenue for the mathematical separation of signals, attributing these components to specific physical mechanisms depends on spatial correlation and temporal evolution rather than direct causation. Component 1 demonstrates a spatial signature that corresponds with the geographical extent of the TSF. Its temporal evolution is characterised by a monotonically increasing, asymptotic settlement curve, which is indicative of primary consolidation in saturated tailings materials. On the other hand, Component 2 spatially correlates with the locations of deep-level mining stopes. Its temporal pattern is marked by step-wise subsidence signals, a behaviour characteristic of episodic stress release and void migration associated with active stoping, in contrast to the smooth, asymptotic curve expected from consolidation. By integrating these spatial correlations with established geomechanical behaviours of tailings consolidation and deep mining subsidence, Component 1 is interpreted as TSF consolidation, while Component 2 is attributed to the regional mining-induced subsidence.
Figure 9.
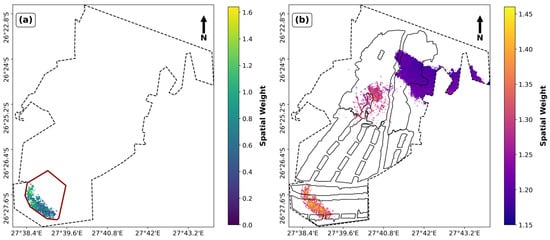
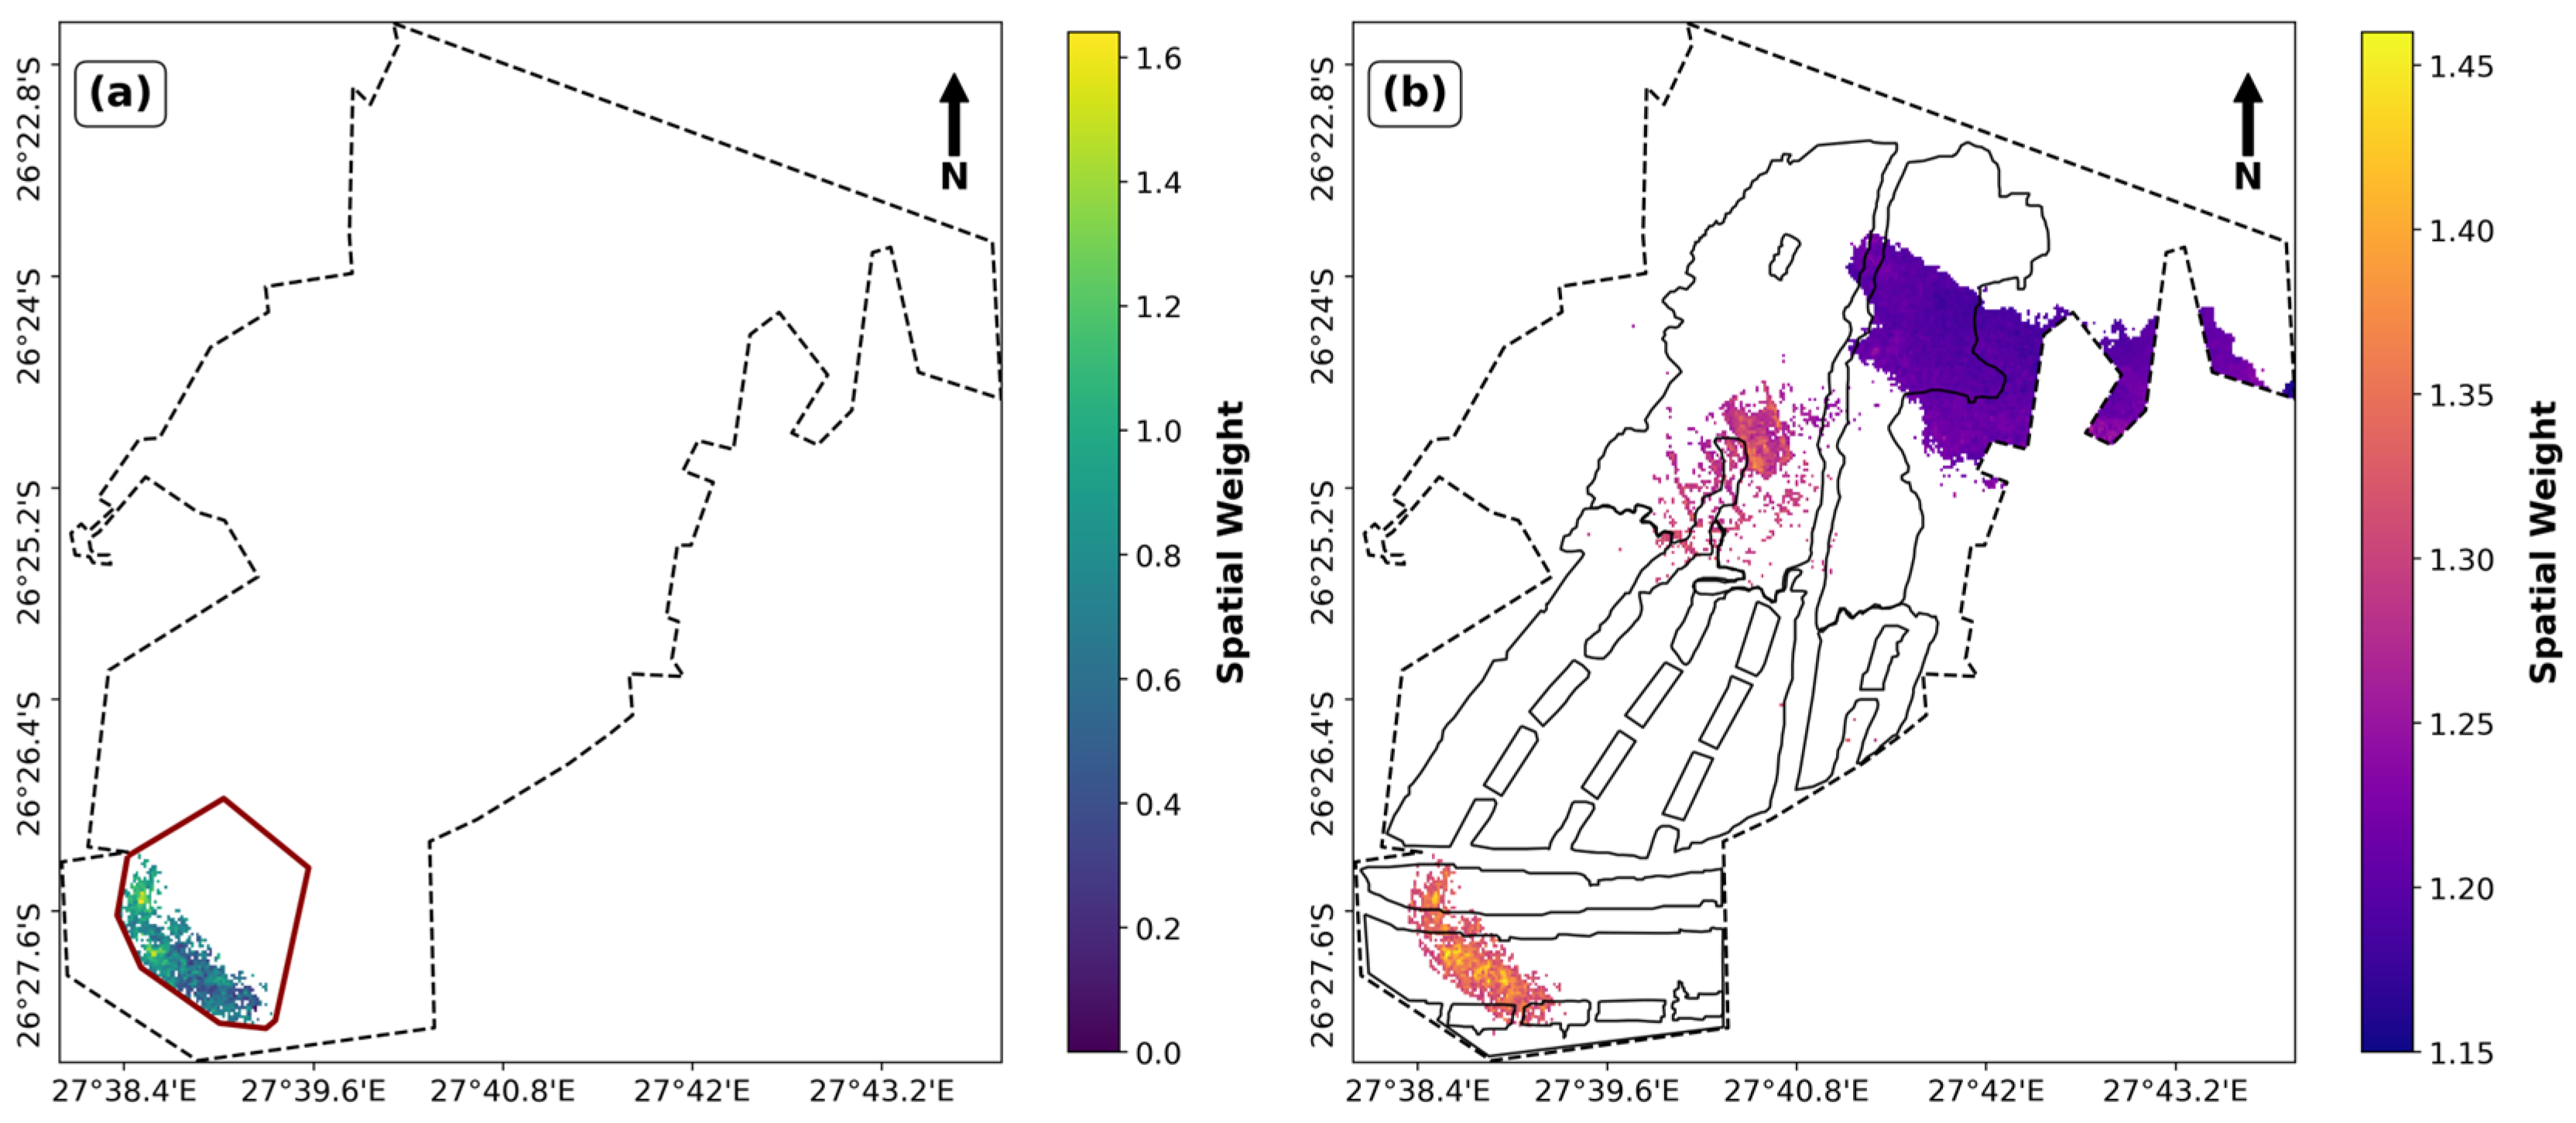
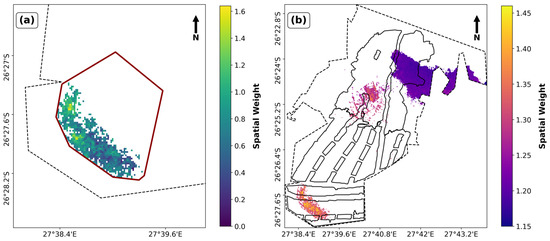
Spatial distribution of the NMF weightings (W) of decoupled components. (a) Isolated localised TSF embankment consolidation; (b) Isolated broad, regional subsidence basin driven by deep underground mining.
Figure 10.
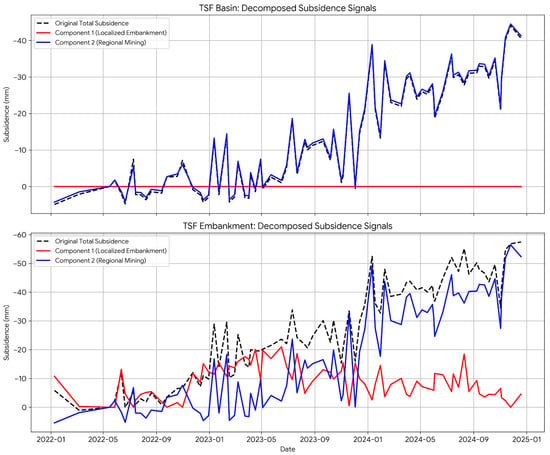
NMF-decoupled subsidence components.
The identified first element, which is the TSF consolidation, indicated a spatial weight maximum value of 1.64 on the TSF embankment and 0.00 in the wider basin, suggesting a very localised process related to the structural loading on the embankment wall. This component shows a constant, non-linear increase over time. This pattern is consistent with the expected geotechnical behaviour of long-term primary consolidation, which is characterised by the gradual dissipation of excess pore water pressure and the ongoing self-weight compaction of fine-grained tailings. The soil gradually becomes compacted as the heavy weight of the mud releases trapped water. Component 2, on the other hand, represents Regional Mining Subsidence, which is the broad surface subsidence caused by deep underground mining. This process has a significant impact on the entire landscape, with weights observed in both the interior basin (1.15) and the embankment (1.46). The embankment is subjected to increased loading due to its proximity to underground excavation zones, leading to greater absorption of downward forces during earth movement. Mining-induced subsidence is typically dynamic, often resulting in abrupt drops or steps, unlike the gradual compaction typical of wet soil. The repeated cycles of rock extraction during the ore mining process cause the earth’s surface layers to shift, crack, and settle into newly formed voids, eventually leading to these downward movements. Analysing the different spatial distributions and their time signatures using the NMF algorithm is consistent with deep regional mining being the dominant factor affecting the tailings facility. This type of mining continuously imposes large-scale settlement effects on the localised shallow consolidation.
4.5. Decoupled NMF Components Validation
A three-step validation system was introduced to carefully ensure that the decoupled mechanisms as identified by the NMF model are not superficial artefacts of computational processes that exist only in nature. This framework includes verification of ground-truth, evaluation of mathematical accuracy, and geographical-spatial correlations of the subsiding areas (Figure 11).
Figure 11.
NMF spatial validation. (a) Component 1: TSF-constrained localised consolidation (SNR = 5.50); (b) Component 2: Broad regional subsidence driven by deep underground panels (SNR = 3.58).
Firstly, a spatiotemporal agreement with adjacent GNSS stations was used to ascertain the physical consistency of the underlying SBAS-InSAR data, as detailed in Section 4.2. The subsequent comparison and ground-truth cross-validation confirmed that the baseline cumulative subsidence matrix utilised in the NMF algorithm is consistent with physical ground movement.
Secondly, the mathematical accuracy of the NMF decomposition was measured using Signal-to-Noise Ratio (SNR) and correlation coefficient of determination . When comparing the original SBAS-InSAR result with the NMF-reconstructed matrix at the first embankment benchmark, the model attained an value of 0.96. These results suggest that the two extracted components capture nearly all the real kinematic variability and do not lose much spatial detail or require additional, more complex components. In addition, the SNR values verify that the decoupled drivers are spatially different. Component 1 displayed a very localised shallow embankment consolidation with an SNR of 5.50. Alternatively, Component 2, with an SNR of 3.58, was a quantitative measure of the dispersed, regional signal propagation associated with underground extraction. These findings indicate that the observed signal is an inherent natural reaction and not a processing anomaly.
Thirdly, quantitative spatial correlation was used to verify the observed phenomenon. The reliability of the decomposition method is indicated by the absolute values of the settlements at the main point of the decomposition control. The overall cumulative subsidence at the selected embankment point recorded at the monitoring period was about −57.5 mm. Application of the NMF spatial weights to isolate the overlapping signals indicated that 92% of the total displacement was as a result of deep regional mining influence (Component 2). Localised TSF consolidation (Component 1), on the other hand, contributed only 8% of the subsidence, amounting to −4.6 mm.
The differences in contributions to deformation indicate that surface-level infrastructure settlement is mainly due to the relaxation of strata beneath the surface. In addition, the deep mining signal dominating at the surface facility by 92 percent gives a step-by-step physical account of how stress at considerable depth is transferred to the surface. The wide and diffuse spatial boundary and the intermittent time signature are consistent with the effect of the geotechnical Angle of Draw, as explained below.
4.6. Geomechanical Interpretation of the Angle of Draw Influence Zone
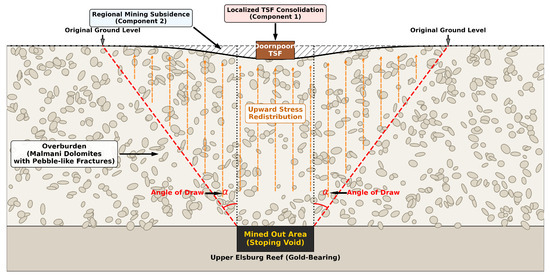
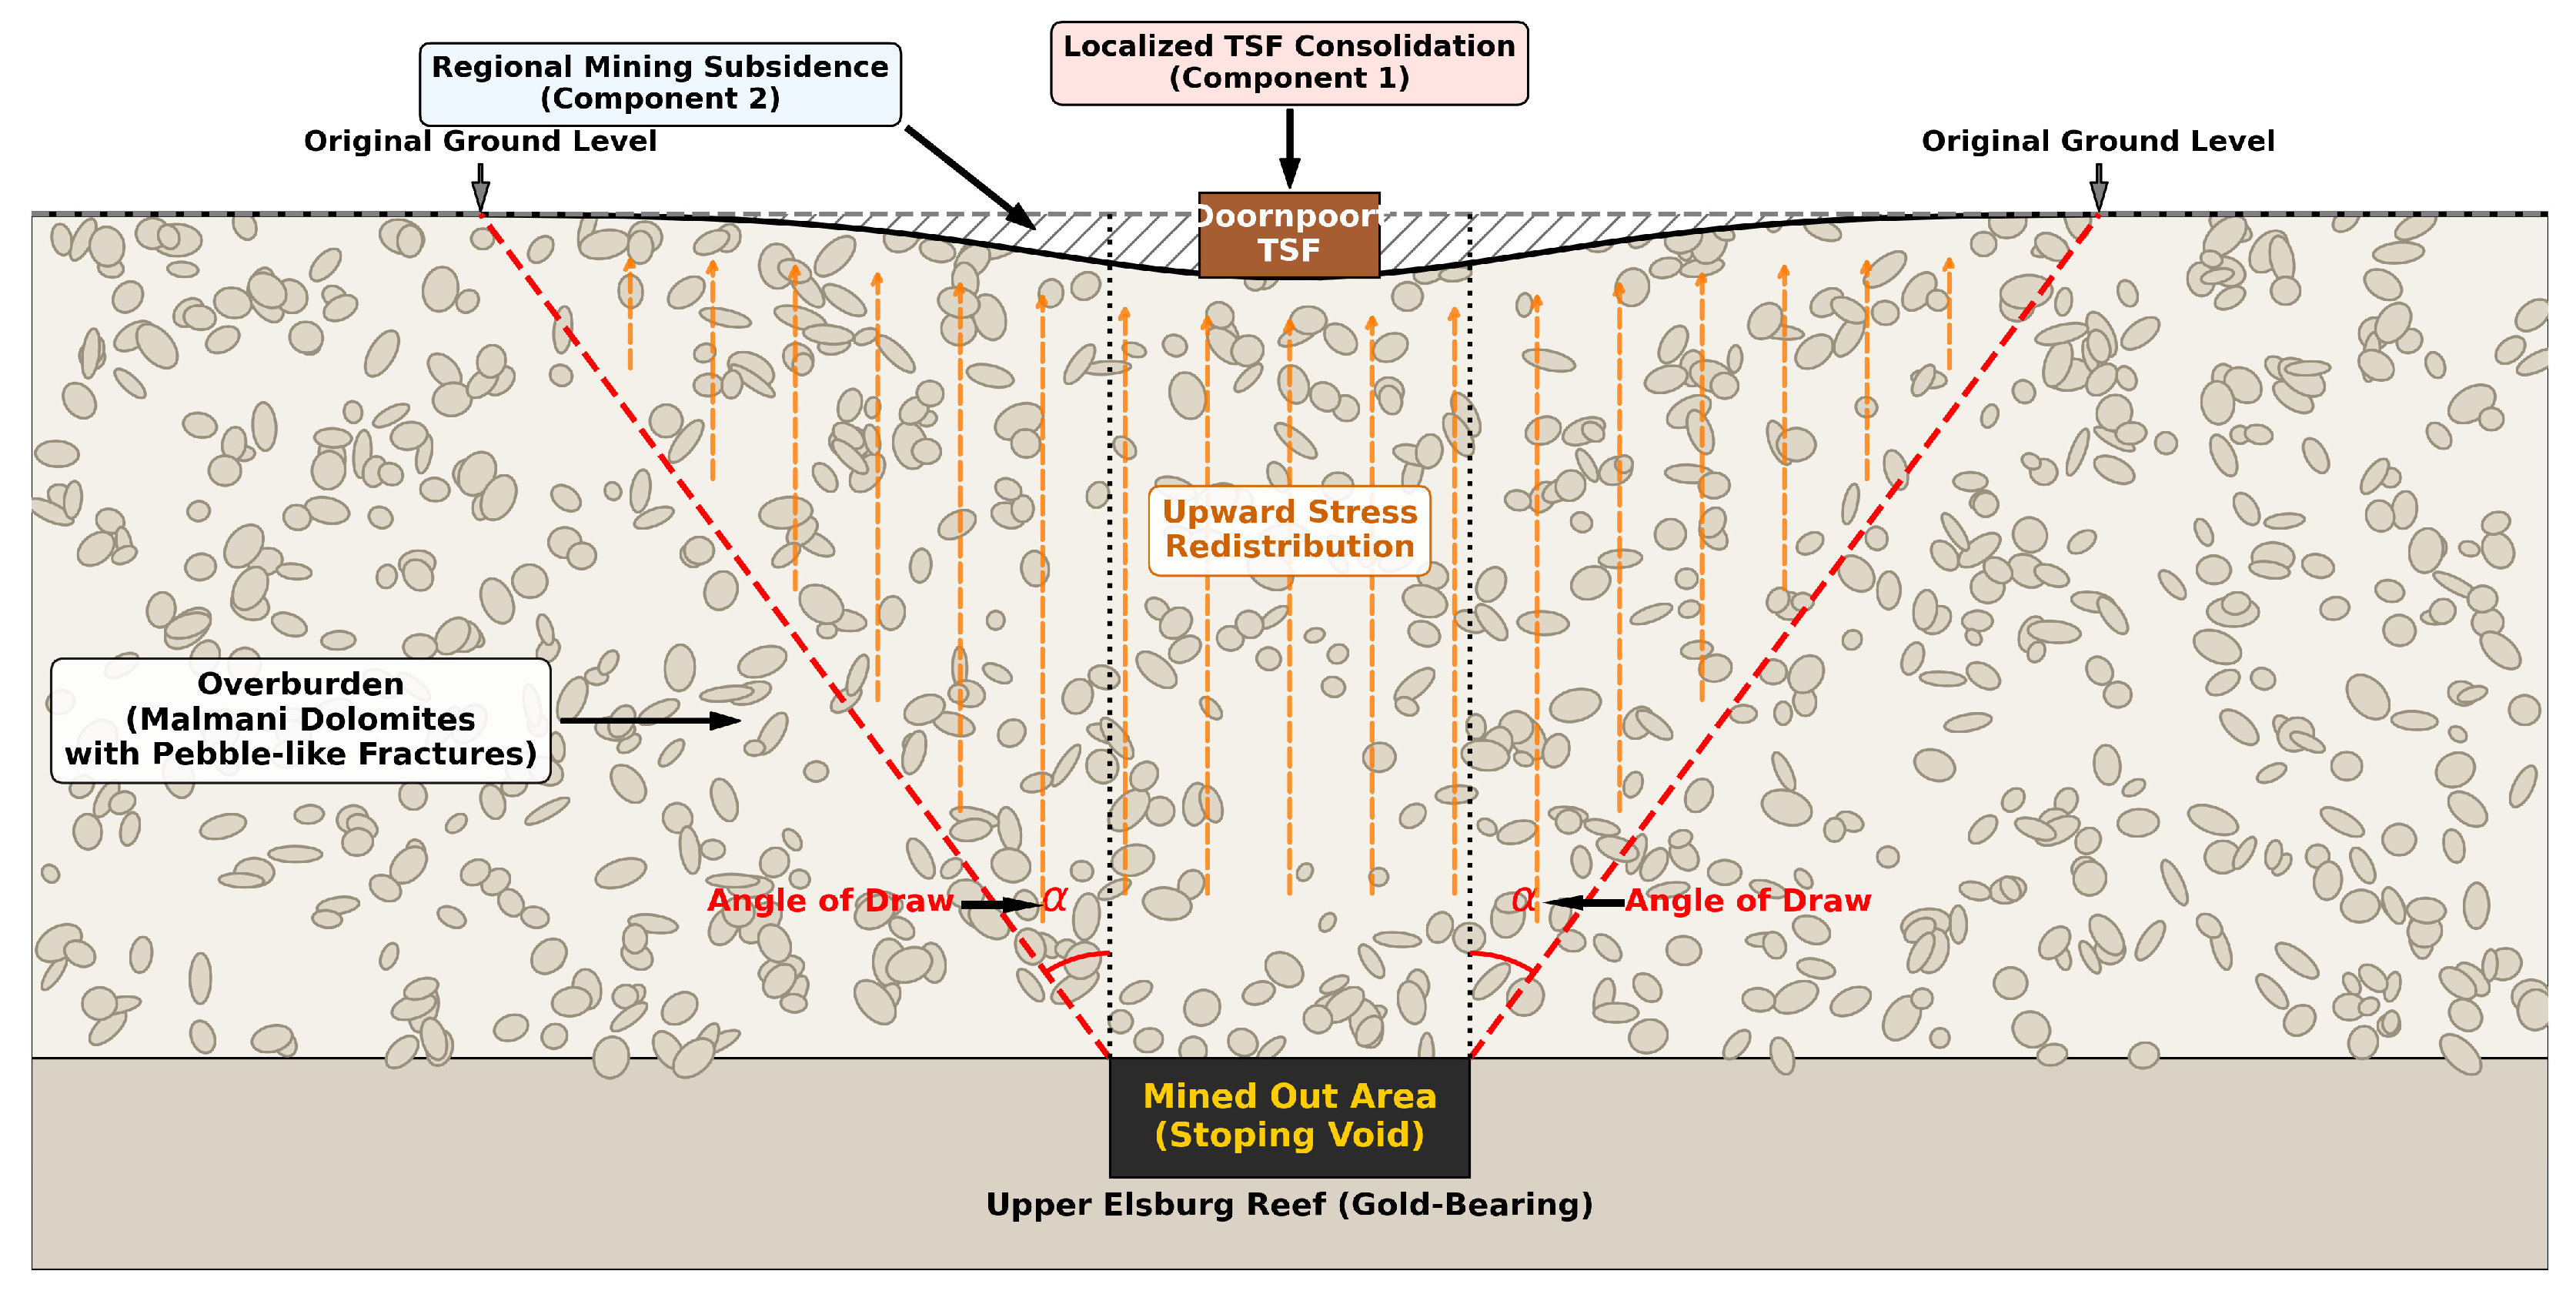
The regional mining component, that is, component 2, shows a significant spatial expansion, with large spatial weights extending significantly beyond the immediate vertical boundaries of the active underground mining panels. This diffuse spatial pattern is a direct manifestation of the geotechnical phenomenon known as the Angle of Draw. Because mining at the South Deep mine occurs at great depths within the Upper Elsburg reef, the subsidence caused by the induced stresses from the removal of mineral-bearing rock does not spread vertically to the surface. Instead, the induced stresses are redistributed outward by the continuous, fractured overburden layers above the main mineral ore-bearing rocks. The subsidence footprint expands at an angle to the excavation edges as it approaches the surface, due to the rock mass settling as voids form at deeper levels as mining progresses. As a result, the area where this subsidence is most noticeable forms a large deformation trough that naturally extends beyond the specific extraction panels and covers nearby surface infrastructure. Moreover, the different irregular phases in the spatiotemporal pattern of Component 2 suggest that this redistribution of stress is kinetically nonlinear. As deep rock layers break apart and move into voids below the surface, the surface shows delayed and rapid downward movements. The Doornpoort TSF and other important surface infrastructure are located in the active Angle of Draw influence zone, making them vulnerable to regional external geomechanical forces. From the NMF decomposition, it was found that Component 2 accounts for 92% of the total displacement, thus making it a major concern. Figure 12, shown below, depicts the Angle of Draw scenario.
Figure 12.
Sketch diagram illustrating the Angle of Draw phenomenon.
5. Discussions
The NMF decomposition suggests that deep-level mining at the South Deep gold mine does not act solely through localised void collapse but initiates a regional-scale redistribution of stress across the mechanically heterogeneous dolomitic overburden. Beneath the surface, karstified and fractured dolomitic sublayers appear to act as a semi-permeable mechanical medium that transmits stress upward from the deep extraction horizons, transforming discrete stope-scale failures into broad surface deformation. The influential nature of the mining-induced component suggests that deep stress emanating from the extraction zones, rather than near-surface soil behaviour, influences the stability of the overlying surface infrastructure, propagating through gradual creep, delayed fracture formation, and progressive destabilisation. Within this framework, the localised, structurally limited response attributed to tailings consolidation is consistent with the Doornpoort TSF behaving as a passive surface load on a regionally subsiding surface, whose deformation is modulated by deep force gradients rather than driven by them. The absence of cyclic uplift or seasonal oscillation in the InSAR time series makes short-term groundwater recharge an unlikely primary driver, although localised dewatering and pore-pressure changes in the dolomitic aquifers may influence how stress is transferred to the surface.
Methodologically, coupling SBAS-InSAR with a physically constrained NMF decomposition addresses a known limitation of conventional blind source separation methods, which can introduce non-physical artefacts such as false uplift in settings where subsidence is the dominant process. Enforcing non-negativity allows the merged kinematic signal to be separated into geomechanically plausible components, consistent with recent applications of NMF to multi-source land subsidence [54]. Two limitations should be noted. First, GNSS cross-validation was enabled by projecting single-orbit Sentinel-1 acquisitions to the vertical; combining ascending and descending tracks in a multi-orbit fusion would resolve the full three-dimensional displacement vector and better capture the lateral strain relevant to embankment stability. Second, validation relied on three continuous GNSS stations, which limits the spatial density of the ground truth. To mitigate this, InSAR displacements were averaged over all coherent pixels within a 50 m radius of each GNSS benchmark, reducing the influence of localised atmospheric noise, decorrelation, and unwrapping errors and yielding a conservative, spatially representative comparison against the point-based GNSS records.
This study does not incorporate direct geotechnical measurements such as piezometer, extensometer, or inclinometer readings, nor were underground blasting or extraction schedules available for direct temporal correlation with the decomposed components; therefore, the attribution of components rests on spatial correspondence with the mining layout and on the consistency of their temporal signatures with established geomechanical behaviour. The InSAR-derived rates nonetheless provide a useful behavioural indicator: the embankment consolidation rates of −9.32 to −13.40 mm/year fall within ranges generally regarded as slow, uniform primary consolidation, compared to the faster or spatially uneven rates that can signal shear failure or internal erosion [7,8]. On this basis, the current deformation does not indicate an immediate threat to overall TSF stability, although continued spatial monitoring remains warranted to detect localised anomalies early. These results support revising TSF risk assessment to consider regional, mining-driven subsurface deformation alongside internal geotechnical factors. Adopting InSAR-NMF decoupling as a routine monitoring step could help identify developing issues in critical mine infrastructure and inform reinforcement, drainage, or destress planning. The approach is potentially applicable to other underground mining regions underlain by karstified, fractured, or hydrogeologically active strata, and its value would be further enhanced by integration with time-dependent geophysical modelling, microseismic monitoring, and in situ pore-pressure telemetry.
6. Conclusions
This study integrated multi-temporal SBAS-InSAR, GNSS observations, and Non-negative Matrix Factorisation with underground mining layout data to characterise mining-induced subsidence impacting surface infrastructure at the South Deep gold mine, South Africa, with particular emphasis on the Doornpoort TSF. Analysis of 78 Sentinel-1A acquisitions from May 2022 to December 2024 identified spatially coherent subsidence restricted to the Current Mine, North of Wrench, and South of Wrench–East blocks, which correspond to active underground extraction zones. The maximum deformation rate and cumulative displacement at the Doornpoort TSF south embankment benchmark were −26.09 mm/year and −57.45 mm, respectively.
Application of NMF to the cumulative time series separated the superimposed signal into two physically interpretable components. At the embankment benchmark, regional mining-induced deformation accounted for 92% of total displacement, while localised TSF consolidation contributed 8% (−4.6 mm). These results demonstrate that deep-level mining is the primary driver of surface settlement and that the Doornpoort TSF functions predominantly as a passive surface load within a broader regional deformation basin, rather than experiencing isolated geotechnical failure. The decomposition achieved an R2 of 0.96 relative to the original SBAS-InSAR series, with component signal-to-noise ratios of 5.50 for localised consolidation and 3.58 for regional mining, supporting the physical validity of the separation rather than a processing artefact.
These findings suggest that risk assessment for tailings storage facilities in deep-mining environments should incorporate regional, deep-seated stress redistribution in addition to conventional internal geotechnical factors. The present study did not evaluate the engineered strength or integrity of the TSF, and validation relied on three GNSS stations. Future research will integrate InSAR observations with in situ pore-pressure monitoring, geophysical surveys, and geotechnical characterisation to enhance predictive, multi-hazard risk frameworks for the site.
Author Contributions
Conceptualization, B.A. and C.Z.; methodology, B.A., B.A.K. and J.L.; software, B.A., N.K. and W.L.; validation, B.A., N.K. and W.L.; formal analysis, B.A. and C.Z.; investigation, B.A.; resources, C.Z.; data curation, N.K. and B.A.K.; writing—original draft preparation, B.A.; writing—review and editing, B.A. and C.Z.; visualization, B.A.; supervision, C.Z.; project administration, C.Z.; funding acquisition, C.Z. All authors have read and agreed to the published version of the manuscript.
Funding
This research was funded by the National Natural Science Foundation of China, grant number 42474029, and also by fundamental research funds for the central universities, CHD (grant number 300102265301); it was also supported by the Chang’an University High Performance Computing Platform.
Data Availability Statement
The data presented in this study are available from the first and corresponding author upon reasonable request. The data are not publicly accessible because a thesis is currently being prepared based on these data.
Acknowledgments
This study would not have been possible without the Sentinel-1 data provided by the European Space Agency (ESA), for which we are incredibly grateful for their generosity.
Conflicts of Interest
The authors declare no conflicts of interest.
References
- Ledwaba, P.; Nhlengetwa, K. When Policy Is Not Enough: Prospects and Challenges of Artisanal and Small-Scale Mining in South Africa. J. Sustain. Dev. Law Policy 2016, 7, 25. [Google Scholar] [CrossRef] [Scilit]
- Miller, D.; Desai, N.; Lee-Thorp, J. Indigenous Gold Mining in Southern Africa: A Review. Goodwin Ser. 2000, 8, 91. [Google Scholar] [CrossRef] [Scilit]
- Durand, J.F. The Impact of Gold Mining on the Witwatersrand on the Rivers and Karst System of Gauteng and North West Province, South Africa. J. Afr. Earth Sci. 2012, 68, 24–43. [Google Scholar] [CrossRef] [Scilit]
- Du, Q.; Guo, G.; Zhang, L.; Li, H.; Zheng, H.; Meng, F.; Wei, T. Analyzing the Surface Subsidence Pattern of Deep Mining in Ecologically Fragile Areas of Western China. KSCE J. Civ. Eng. 2025, 29, 100136. [Google Scholar] [CrossRef] [Scilit]
- Van Niekerk, H.J.; Viljoen, M.J. Causes and Consequences of The Merriespruit and Other Tailings-Dam Failures. Land Degrad. Dev. 2005, 212, 201–212. [Google Scholar] [CrossRef] [Scilit]
- Marais, L.; Kemp, D.; van der Watt, P.; Matebesi, S.; Cloete, J.; Harris, J.; Ang Li Ern, M.; Owen, J.R. The Catastrophic Failure of the Jagersfontein Tailings Dam: An Industrial Disaster 150 Years in the Making. Int. J. Disaster Risk Reduct. 2024, 109, 104585. [Google Scholar] [CrossRef] [Scilit]
- Rana, N.M.; Delaney, K.B.; Evans, S.G.; Deane, E.; Small, A.; Adria, D.A.M.; McDougall, S.; Ghahramani, N.; Take, W.A. Application of Sentinel-1 InSAR to Monitor Tailings Dams and Predict Geotechnical Instability: Practical Considerations Based on Case Study Insights. Bull. Eng. Geol. Environ. 2024, 83, 204. [Google Scholar] [CrossRef] [Scilit]
- Zare, M.; Nasategay, F.; Gomez, J.A.; Moayedi Far, A.; Sattarvand, J. A Review of Tailings Dam Safety Monitoring Guidelines and Systems. Minerals 2024, 14, 551. [Google Scholar] [CrossRef] [Scilit]
- Xie, W.; Wu, J.; Gao, H.; Chen, J.; He, Y. SBAS-InSAR Based Deformation Monitoring of Tailings Dam: The Case Study of the Dexing Copper Mine No.4 Tailings Dam. Sensors 2023, 23, 9707. [Google Scholar] [CrossRef] [Scilit] [PubMed]
- Theron, A.; Engelbrecht, J.; Kemp, J.; Kleynhans, W.; Turnbull, T. Detection of Sinkhole Precursors through SAR Interferometry: First Results from South Africa. In Proceedings of the 2016 IEEE International Geoscience and Remote Sensing Symposium (IGARSS), Beijing, China, 10–15 July 2016; IEEE: Piscataway, NJ, USA, 2016; pp. 5398–5401. [Google Scholar] [CrossRef] [Scilit]
- Nhamo, L.; Rwizi, L.; Mpandeli, S.; Botai, J.; Magidi, J.; Tazvinga, H.; Sobratee, N.; Liphadzi, S.; Naidoo, D.; Modi, A.T.; et al. Urban Nexus and Transformative Pathways towards a Resilient Gauteng City-Region, South Africa. Cities 2021, 116, 103266. [Google Scholar] [CrossRef] [Scilit] [PubMed]
- Mabele, N.; Manzi, M.; Sekiba, M.; Rapetsoa, K.; Gomo, S.; Mutshafa, N.; Onyebueka, E. Delineation of The Sinkhole Along R21 Highway In Gauteng (South Africa) Using Integrated Geophysical Methods. In Proceedings of the 28th European Meeting of Environmental and Engineering Geophysics, Held at the Near Surface Geoscience Conference and Exhibition 2022, NSG 2022; European Association of Geoscientists and Engineers, EAGE: Utrecht, The Netherlands, 2022. [Google Scholar]
- Andrews, P.G.; Butcher, R.J.; Ekkerd, J. The Geotechnical Evolution of Deep-Level Mechanized Destress Mining at South Deep Mine. J. S. Afr. Inst. Min. Metall. 2020, 120, 33–40. [Google Scholar] [CrossRef] [Scilit]
- Van Eeden, E.S.; De Villiers, B.; Strydom, H.; Stoch, L. Effects of Dewatering and Sinkholes on People and Environment-an Analysis of the Carletonville Area in Gauteng, South Africa. Historia 2003, 48, 95–125. [Google Scholar]
- Cole, M.J.; Broadhurst, J.L. Sustainable Development in Mining Communities: The Case of South Africa’s West Wits Goldfield. Front. Sustain. Cities 2022, 4, 895760. [Google Scholar] [CrossRef] [Scilit]
- Constantinou, S.; Van Rooy, J.L. Sinkhole and Subsidence Size Distribution across Dolomitic Land in Gauteng. J. S. Afr. Inst. Civ. Eng. 2018, 60, 2–8. [Google Scholar] [CrossRef] [Scilit]
- Masethe, R.T.; Zvarivadza, T. The Impact of Scattered Mining on Gold Recovery: A Case Study in the Deep Level Gold Mine, South Africa. In Proceedings of the 59th U.S. Rock Mechanics/Geomechanics Symposium, Santa Fe, NM, USA, 8–11 June 2025. Paper ID: D021S002R003. [Google Scholar] [CrossRef] [Scilit]
- Ferretti, A.; Prati, C.; Rocca, F. Permanent Scatterers in SAR Interferometry. IEEE Trans. Geosci. Remote Sens. 2001, 39, 8–20. [Google Scholar] [CrossRef] [Scilit]
- Zhang, Z.; Qian, L.; Wu, Y.; Chen, Y.; Sun, Y. SBAS-InSAR-Based Monitoring and Hierarchical Spatiotemporal Deep Learning for Subsidence Monitoring and Prediction in Active Mining Areas: A Case Study of the Dexing Copper Mine. Remote Sens. 2026, 18, 1810. [Google Scholar] [CrossRef] [Scilit]
- Kakar, N.; Zhao, C.; Li, G.; Zhao, H. GNSS and Sentinel-1 InSAR Integrated Long-Term Subsidence Monitoring in Quetta and Mastung Districts, Balochistan, Pakistan. Remote Sens. 2024, 16, 1521. [Google Scholar] [CrossRef] [Scilit]
- Wang, H.; Chen, J.; Liang, W.; Xu, G. Long-Term Post-Mining Deformation Evolution and Failure Mechanism of the Rongxing Gypsum Mine Revealed by SBAS-InSAR and Microseismic Monitoring. Remote Sens. 2026, 18, 1584. [Google Scholar] [CrossRef] [Scilit]
- Gold Fields Limited. Mineral Resources and Mineral Reserves Supplement to the Integrated Annual Report 2023; Gold Fields Limited: Johannesburg, South Africa, 2023. [Google Scholar]
- Handley, M. Where Is All the Gold? J. S. Afr. Inst. Min. Metall. 2023, 123, 175–192. [Google Scholar] [CrossRef] [Scilit]
- Tucker, R.F.; Viljoen, R.P.; Viljoen, M.J. A Review of the Witwatersrand Basin—The World’s Greatest Goldfield. Episodes 2016, 39, 105–133. [Google Scholar] [CrossRef] [Scilit]
- Khoza, P.N. A Framework for Sedimentological Data Structure Extraction in Gold Mining Facies Delineation. In Proceedings of the 2019 IEEE Asia-Pacific Conference on Computer Science and Data Engineering, CSDE 2019; IEEE: Piscataway, NJ, USA, 2019. [Google Scholar] [CrossRef] [Scilit]
- Osburn, K.; Pretorius, H.; Kock, D.; King, N.; Pillaye, R.; Hlangwane, M. Enhanced Geological Modelling of the Upper Elsburg Reefs and VCR to Optimize Mechanized Mine Planning at South Deep Gold Mine. J. S. Afr. Inst. Min. Metall. 2014, 114, 275–283. [Google Scholar]
- Gomo, S.; Khosro Anjom, F.; Colombero, C.; Karimpour, M.; Jogee, B.A.; Manzi, M.S.D.; Socco, L.V. Near-Surface Characterization and Delineation of Water Preferential Flow-Pathways at South Deep Gold Mine, South Africa. Solid Earth 2026, 17, 249–273. [Google Scholar] [CrossRef] [Scilit]
- Gold Fields Limited. Report to Stakeholders; Gold Fields Limited: Johannesburg, South Africa, 2023. [Google Scholar]
- De Zan, F.; Guarnieri, A.M. TOPSAR: Terrain Observation by Progressive Scans. IEEE Trans. Geosci. Remote Sens. 2006, 44, 2352–2360. [Google Scholar] [CrossRef] [Scilit]
- Yang, L.; Wang, G.; Lv, G. Efficient TOPS Mode Raw Data Simulator of Extended Scenes. IET Radar Sonar Navig. 2016, 10, 1065–1070. [Google Scholar] [CrossRef] [Scilit]
- European Space Agency. Available online: https://search.asf.alaska.edu/ (accessed on 10 July 2025).
- Copernicus GLO-30 DEM. Available online: https://browser.dataspace.copernicus.eu/ (accessed on 10 July 2025).
- Chua, K.M.; Wu, J.; Liew, S.C.; Kwoh, L.K. Removal of Residual Topological Phase Using Three Pass DInSAR Stack. In Proceedings of the 34th Asian Conference on Remote Sensing 2013, ACRS 2013; Asian Association on Remote Sensing: Tokyo, Japan, 2013; Volume 1, pp. 636–641. [Google Scholar]
- Li, S.; Zhang, S.; Li, T.; Gao, Y.; Chen, Q.; Zhang, X. Modeling the Optimal Baseline for a Spaceborne Bistatic SAR System to Generate DEMs. ISPRS Int. J. Geo-Inf. 2020, 9, 108. [Google Scholar] [CrossRef] [Scilit]
- Zhang, H.; Jin, G.; Xu, Q.; Zhang, Y. Performance Analysis and Simulation of 3D Information Deriving from InSAR with Different Baselines. In Proceedings of the 2016 12th International Conference on Natural Computation, Fuzzy Systems and Knowledge Discovery, ICNC-FSKD; IEEE: Piscataway, NJ, USA, 2016; Volume 2016, pp. 1921–1925. [Google Scholar] [CrossRef] [Scilit]
- Maciuk, K. Advantages of Combined Gnss Processing Involving a Limited Number of Visible Satellites. Sci. J. Sil. Univ. Technol. Ser. Transp. 2018, 98, 89–99. [Google Scholar] [CrossRef] [Scilit]
- Purfürst, T. Evaluation of Static Autonomous GNSS Positioning Accuracy Using Single-, Dual-, and Tri-Frequency Smartphones in Forest Canopy Environments. Sensors 2022, 22, 1289. [Google Scholar] [CrossRef] [Scilit] [PubMed]
- Elsobeiey, M.E. Stochastic Analysis of Low-Cost Single-Frequency GPS Receivers. Positioning 2016, 7, 91–100. [Google Scholar] [CrossRef]
- International GNSS Service. Available online: https://igs.org/ (accessed on 10 July 2025).
- Zhou, Y.; Lou, Y.; Zhang, W.; Kuang, C.; Liu, W.; Bai, J. Improved Performance of ERA5 in Global Tropospheric Delay Retrieval. J. Geod. 2020, 94, 103. [Google Scholar] [CrossRef] [Scilit]
- Huang, D.; Wang, J.; Li, M.; Huang, C.; Tang, B. Incorporating Power-Law Model and ERA-5 Data for InSAR Tropospheric Delay Correction Analysis. Sensors 2025, 25, 716. [Google Scholar] [CrossRef] [Scilit] [PubMed]
- Zhang, W.; Jiang, Y.; Dong, J.; Song, X.; Pang, R.; Guoan, B. A Deep Learning Method for Real-Time Bias Correction of Wind Field Forecasts in the Western North Pacific. Atmos. Res. 2023, 284, 106586. [Google Scholar] [CrossRef] [Scilit]
- Nzelibe, I.U.; Tata, H.; Idowu, T.O. Assessment of GNSS Zenith Tropospheric Delay Responses to Atmospheric Variables Derived from ERA5 Data over Nigeria. Satell. Navig. 2023, 4, 15. [Google Scholar] [CrossRef] [Scilit]
- Wang, Y.; Chang, L.; Feng, W.; Samsonov, S. Topography-Correlated Atmospheric Signal Mitigation for InSAR Applications in the Tibetan Plateau Based on Global Atmospheric Models. Int. J. Remote Sens. 2021, 42, 4361–4379. [Google Scholar] [CrossRef] [Scilit]
- Qiao, F.; Wang, Y.; Zhang, Y.; Chang, C.; Chi, H.; Liu, C.; Meng, X.; Liu, Y.; Yang, C. Analysis of Atmospheric Residual Error and Construction of Correction Model for GACOS-Corrected PS+DS Time-Series InSAR Based on ERA5 PWV. Int. J. Remote Sens. 2026, 47, 684–717. [Google Scholar] [CrossRef] [Scilit]
- Goldstein, R.M.; Werner, C.L. Radar Interferogram Filtering for Geophysical Applications. Geophys. Res. Lett. 1998, 25, 4035–4038. [Google Scholar] [CrossRef] [Scilit]
- Kakar, N.; Zhao, C.; Li, G.; Zhang, Z.; Adoko, B. Spatio-Temporal Analysis of Subsiding Districts in Balochistan, Pakistan Using Multi-Sensor SBAS InSAR and GNSS. Nat. Hazards 2025, 121, 10553–10581. [Google Scholar] [CrossRef] [Scilit]
- Mirzal, A. NMF versus ICA for Blind Source Separation. Adv. Data Anal. Classif. 2017, 11, 25–48. [Google Scholar] [CrossRef] [Scilit]
- Del Soldato, M.; Confuorto, P.; Bianchini, S.; Sbarra, P.; Casagli, N. Review of Works Combining GNSS and Insar in Europe. Remote Sens. 2021, 13, 1684. [Google Scholar] [CrossRef] [Scilit]
- Yalvac, S. Validating InSAR-SBAS Results by Means of Different GNSS Analysis Techniques in Medium- and High-Grade Deformation Areas. Environ. Monit. Assess. 2020, 192, 120. [Google Scholar] [CrossRef] [Scilit] [PubMed]
- Tao, Q.; Liu, R.; Li, X.; Gao, T.; Chen, Y.; Xiao, Y.; He, H.; Wei, Y. A Method for Monitoring Three Dimensional Surface Deformation in Mining Areas Combining SBAS-InSAR, GNSS and Probability Integral Method. Sci. Rep. 2025, 15, 2853. [Google Scholar] [CrossRef] [Scilit] [PubMed]
- Liu, L.; Xu, N.; Zhou, W.; Qin, Y.; Luan, S. Improvement of Coal Mining-Induced Subsidence-Affected (MISA) Zone Irregular Boundary Delineation by MT-InSAR Techniques, UAV Photogrammetry, and Field Investigation. Remote Sens. 2024, 16, 4221. [Google Scholar] [CrossRef] [Scilit]
- Gold Fields Limited. Gold Fields South Deep Rebase Plan Market Presentatio; Gold Fields Limited: Johannesburg, South Africa, 2017. [Google Scholar]
- Wang, Y.; Gong, H.; Chen, B.; Zhou, C.; Guo, L.; Wang, H.; Wang, Q.; Hao, S.; Yang, Y. Non-Negative Matrix Factorization-Assisted Independent Component Analysis for Land Subsidence Feature Decomposition and Attribution in Lubei Plain, and Further Integration with Deep Learning for Subsidence Prediction. Int. J. Appl. Earth Obs. Geoinf. 2026, 146, 105097. [Google Scholar] [CrossRef] [Scilit]

Disclaimer/Publisher’s Note: The statements, opinions and data contained in all publications are solely those of the individual author(s) and contributor(s) and not of MDPI and/or the editor(s). MDPI and/or the editor(s) disclaim responsibility for any injury to people or property resulting from any ideas, methods, instructions or products referred to in the content. |
© 2026 by the authors. Licensee MDPI, Basel, Switzerland. This article is an open access article distributed under the terms and conditions of the Creative Commons Attribution (CC BY) license.