


Highlights
What are the main findings?
- An Attention-GAN framework is proposed to detect real orthophoto changes while suppressing false alarms caused by residual geometric and radiometric inconsistencies.
- Perturbation-negative samples are used as unchanged examples, and thus the model learns that small nuisance differences should not be labeled as land cover change.
What are the implications of the main findings?
- The approach provides a reproducible training and evaluation protocol for false alarm resistance in orthophoto change detection.
- It is suited to operational mapping scenarios where candidate change maps must remain useful despite imperfect co-registration and illumination consistency.
Abstract
Orthophoto change detection is used to find real land cover changes in urban monitoring, disaster assessment, and environmental management. In practice, however, multi-temporal orthophotos are rarely identical in geometry and radiometry even after standard preprocessing. Small residual misregistration, local building displacement, shadow movement, and illumination differences can produce edge-like responses that look like change but do not correspond to any land cover transition. These false alarms increase manual checking costs and reduce the reliability of change maps. This study addresses that practical problem by proposing an attention-guided conditional adversarial framework, named Attention-GAN, for false alarm-resistant orthophoto change detection. The aim is not to detect small perturbations as changes but to detect real land cover changes while suppressing responses to nuisance variations that should be treated as unchanged. The framework integrates a multi-scale spatial attention module, a channel attention module, and a PatchGAN discriminator. It also introduces perturbation-negative training pairs, where controlled geometric and radiometric perturbations are applied to unchanged image pairs and assigned all-zero change masks. Experiments on LEVIR-CD, WHU-CD, and DSIFN-CD show competitive or moderately higher accuracy than the selected representative baselines, with F1 scores of 91.2%, 92.45%, and 93.18%, respectively. In the ablation experiment, the false change rate on perturbation-negative validation pairs is reduced to 4.9%. Repeated-run statistics and ablation results indicate that the proposed training strategy mainly improves robustness by reducing false alarms under the evaluated perturbation range. The results support the use of controlled nuisance perturbations as a reproducible way to train and evaluate false alarm resistance, while broader validation under real multi-view, seasonal, and cross-sensor distortions remains necessary.
1. Introduction
The rapid development of remote sensing technology has produced dense archives of multi-temporal imagery for monitoring land-surface dynamics [1,2]. Orthophotos are particularly useful for change detection because they are geometrically corrected, georeferenced, and presented at a near-uniform scale. Comparing orthophotos acquired at different times is therefore a common way to locate building construction, land cover transitions, urban expansion, and disaster damage, supporting urban planning, emergency assessment, and environmental management [3,4].
In operational orthophoto change detection, the desired output is not a map of every pixel-level difference between two images. The desired output is a map of real land cover change. This distinction is important because multi-temporal orthophotos are rarely perfectly matched, even after standard preprocessing [5,6]. Differences in illumination, solar altitude angle, atmospheric condition, sensor response, and acquisition season can change image radiometry. Terrain relief, building displacement, off-nadir viewing, residual registration error, orthorectification uncertainty, and shadow movement can also create local geometric inconsistencies [7,8]. These factors are usually nuisance variations rather than target changes, but they often appear along building edges, roads, and object boundaries, where many change detectors are most sensitive [9,10,11].
This problem matters in practical mapping. In many monitoring tasks, unchanged areas occupy most of the image, and only a small fraction contains real change. A detector that responds strongly to residual misalignment or brightness differences may obtain visually plausible masks but still generate many false alarms. These false alarms increase manual verification effort and can hide the true change signal in downstream statistics. Therefore, the goal of this study is not to detect small perturbations themselves. The goal is to make the change detector less sensitive to small geometric and radiometric differences that should be ignored while preserving sensitivity to real land cover change.
Traditional remote sensing change detection methods include image differencing, image ratioing, change vector analysis, and principal component analysis [12]. These methods are efficient but usually rely on handcrafted features or manually selected thresholds, and thus their performance can degrade under illumination variation, registration residuals, and heterogeneous land cover changes. Deep learning methods, especially convolutional neural network (CNN)-based models, have improved feature representation for change detection. Representative models include FC-EF, FC-Siam-Diff, and FC-Siam-Conc. Nevertheless, many existing methods still focus mainly on standard benchmark accuracy and do not explicitly train or evaluate the ability to reject false responses caused by nuisance variation [13,14,15].
Generative adversarial networks (GANs) [16] have been widely used for image generation, image translation, and representation learning [17,18]. In change detection, adversarial supervision can encourage predicted change maps to be more spatially coherent. However, adversarial training alone does not tell the model which image differences should be ignored. A change detector also needs negative evidence, namely examples in which two images are different in appearance but should still be labeled as unchanged. This motivates the use of perturbation-negative samples in this study.
To address the above issues, this study proposes an attention-based generative adversarial network (Attention-GAN) for false alarm-resistant orthophoto change detection. The model combines a Siamese CNN backbone, a multi-scale spatial attention module, a channel attention module, and a PatchGAN discriminator. In addition, controlled geometric and radiometric perturbations are applied to construct perturbation-negative image pairs with all-zero change masks. These samples do not define a new semantic class. They are used to teach the model that residual misalignment and radiometric differences are nuisance variables when no land cover change is present. We emphasize that the individual modules are established components; the contribution lies in their task-oriented integration with a reproducible negative-sample training and evaluation protocol for reducing false alarms. Extensive experiments on multiple public datasets show competitive or moderately improved accuracy compared with the selected representative approaches, together with lower false change rates under the evaluated perturbation settings.
The remainder of this study is organized as follows. Section 2 reviews the related work. Section 3 presents the problem formulation and the proposed network architecture. Section 4 describes the datasets, test areas, implementation details, and comparison methods. Section 5 reports the experimental results and analysis. Section 6 discusses the main findings and limitations of the proposed method. Finally, Section 7 concludes the paper and outlines future research directions.
2. Related Work
2.1. Traditional and Deep Learning-Based Change Detection
Remote sensing change detection has moved from pixel- and object-based analysis to deep learning models [12]. Classical approaches such as image differencing, ratioing, change vector analysis (CVA), and principal component analysis (PCA) are efficient, but they are sensitive to radiometric inconsistency, geometric residuals, and threshold selection [5,6]. CNN-based methods, including FC-EF, FC-Siam-Diff, and FC-Siam-Conc, learn paired-image features and predict change maps from end to end [14,19,20]. Later studies introduced spatiotemporal attention, dense Siamese connections, and transformer architectures such as STANet, SNUNet, BIT, and ChangeFormer to improve feature interaction and context modeling [21,22,23,24]. Recent lightweight and hard sample-oriented methods, including TinyCD and HSONet, further refine high-resolution change detection [8,25]. Foundation models and self-supervised geospatial representation learning are also becoming relevant because they provide transferable visual features [26,27]. Most of these methods are evaluated on real-change masks, while their behavior on unchanged pairs with residual shifts or illumination differences is measured less often [9,10,11].
2.2. GANs and Adversarial Training for Change Detection
Generative adversarial networks (GANs) [16] and conditional GANs (cGANs) [17] have been used in remote sensing for image-to-image translation, domain adaptation, and semantic segmentation [18]. In change detection, the generator produces a change map from a bi-temporal input, and the discriminator judges whether the map is realistic, encouraging the generator to align with the distribution of real change patterns [28]. Adversarial training can improve boundary sharpness and reduce over-smoothing compared with pure supervised segmentation losses. Existing GAN-based change detection methods, however, often emphasize the realism of positive change masks. They provide less direct supervision for the opposite requirement; unchanged pairs should not produce fragmented or edge-like false positives when the two dates differ only because of imaging conditions. PatchGAN discriminators [18] are commonly adopted to enforce local realism; we follow this design and combine it with attention modules and perturbation-negative samples.
2.3. Attention Mechanisms in Vision and Remote Sensing
Attention modules reweight spatial locations or feature channels according to their relevance. Spatial attention can strengthen change boundaries, while channel attention emphasizes semantic responses that are useful for separating changed and unchanged regions. The Squeeze-and-Excitation (SE) module [29] and related designs such as CBAM [30] have been widely used in classification and segmentation [31,32]. In remote sensing change detection, attention has been combined with Siamese and transformer backbones to improve multi-scale feature interaction on building and land cover datasets [31,32,33,34]. In this study, MSAM is applied after bi-temporal feature fusion, and SE recalibrates the fused channels. They are used as established attention components within a PatchGAN-supervised framework rather than as standalone methodological novelties.
3. Methodology
3.1. Problem Definition
The objective of the change detection task is to identify regions that have undergone real land cover changes in a pair of bi-temporal remote sensing images , where H, W, and C denote the image’s height, width, and number of channels, respectively. The objective is to learn a mapping from the input image pair to a binary change map , in which represents a changed pixel and represents an unchanged pixel.
In this formulation, “unchanged” does not mean that the two image patches are numerically identical. It means that no target land cover transition is present. Small residual shifts, illumination differences, and other acquisition-related discrepancies are treated as nuisance variation. A useful model should therefore satisfy two requirements at the same time: it should respond to real object-level change, and it should remain conservative when the observed differences can be explained by nuisance variation.
To this end, we formulate the task within a conditional generative adversarial network (cGAN) framework. The generator G learns to predict the change map
conditioned on the bi-temporal images, whereas the discriminator D aims to distinguish the real change map Y from the generated one under the same condition. By optimizing the two networks in an adversarial manner, the proposed framework encourages the generator to produce more realistic and structurally coherent change maps, thereby improving the quality of the change detection results.
3.2. Network Architecture Overview
In this study, we used a conditional adversarial network with multi-scale spatial attention and channel attention. The generator was constructed on a dual-tower Siamese CNN [14,22]; the two towers extract features from and separately with shared weights, and the fused features are then processed by the Multi-Scale Spatial Attention Module (MSAM) and the Squeeze-and-Excitation (SE) channel attention module [29,31,32]. This design combines temporal feature comparison with spatial and channel feature reweighting. The decoder then generates the final change probability map.
The discriminator employs the PatchGAN structure, which makes local judgments about image patches rather than the entire image. This local patch-based discrimination helps the model capture fine details in the change map. The generator and discriminator were optimized adversarially to improve the quality of the generated change map.
The proposed model differs from STANet and SNUNet mainly in its training objective and supervision structure. STANet focuses on spatiotemporal attention for correspondence modeling, and SNUNet relies on dense Siamese feature fusion. The Attention-GAN combines multi-scale spatial attention, channel recalibration, PatchGAN supervision, and perturbation-negative samples so that unchanged but visually inconsistent pairs are explicitly represented during training. The contribution is therefore the task-oriented integration and evaluation protocol, not the invention of the MSAM, SE, or PatchGAN.
3.3. Generator Network
3.3.1. Dual-Tower Siamese CNN Backbone
The generator adopts a dual-tower Siamese CNN as the backbone for change detection [14,22]. In this architecture, the two towers process the bi-temporal images and separately while sharing the same network parameters. This weight-sharing strategy ensures that both images are encoded in a common feature space, enabling consistent comparison of features at corresponding spatial locations.
Compared with early-fusion strategies that concatenate and before a single encoder, the dual-tower design explicitly models temporal correspondence and typically yields better performance in change detection tasks [14,20].
Each tower employs the same CNN encoder E (e.g., ResNet blocks [35] or VGG-style convolutional layers) to extract hierarchical features over L stages. The feature maps at stage l are defined as follows:
where denotes the shared encoder up to stage l. The feature maps and have dimensions .
The two branches operate in parallel, and their outputs are fused through channel-wise concatenation:
where . This fusion strategy preserves complementary spatial and semantic information from both temporal observations and provides the basis for subsequent attention-based feature refinement.
3.3.2. Multi-Scale Spatial Attention Module (MSAM)
To capture change patterns at different spatial scales, we introduce the MSAM. Given the fused feature map , parallel convolution operations with different kernel sizes are applied:
where denotes the ReLU activation function. The multi-scale features are then aggregated:
Next, a spatial attention map is generated:
where denotes the sigmoid activation. The final spatially enhanced feature is obtained by
This module enables the network to emphasize spatial regions corresponding to potential changes while suppressing irrelevant responses.
3.3.3. Squeeze-and-Excitation (SE) Module
To further enhance feature discrimination, we incorporated the Squeeze-and-Excitation (SE) module to model channel-wise dependencies. Given the spatially refined feature , global average pooling is applied first:
Then, two fully connected layers capture channel interactions:
where denotes the ReLU and denotes sigmoid activation. The channel-refined feature is
where s is broadcast along spatial dimensions. This mechanism adaptively highlights informative channels while suppressing redundant features.
3.3.4. Decoder
The decoder progressively restores the spatial resolution of encoded features to generate the final change map. Let denote the decoder feature at stage l. The decoding process can be written as follows:
where denotes upsampling, ⊕ represents feature concatenation, and denotes convolution followed by nonlinear activation.
Finally, a convolution followed by sigmoid activation produces the change probability map:
Each pixel value in represents the probability that the corresponding location belongs to the changed class.
3.4. Discriminator Network
The discriminator adopts a PatchGAN structure, which performs local patch-based discrimination rather than judging the entire image. In the conditional adversarial setting, the discriminator receives the bi-temporal input pair together with either the reference change map or the predicted change map. It then outputs a patch-wise probability map:
where each element represents the probability that the corresponding local patch belongs to the real distribution. This local discrimination strategy encourages the generator to produce spatially consistent and realistic change patterns, which is particularly beneficial for fine-grained change detection tasks.
3.5. Loss Functions
The generator is trained with a composite loss consisting of adversarial loss, segmentation loss, and perceptual loss. The three terms target different aspects of the prediction: local realism, pixel-level accuracy, and structural consistency.
3.5.1. Adversarial Loss
The adversarial objective is written separately for the discriminator and generator. The discriminator is trained to distinguish the reference change map from the generated change map under the same image pair condition:
The generator is trained to make the predicted change map difficult for the discriminator to distinguish from a reference map:
3.5.2. Segmentation Loss
Segmentation loss measures the pixel-wise difference between the generated change map and the real change map. We use the binary cross-entropy (BCE) loss to calculate the error between the predicted and true change maps:
where is the ground-truth change map and is the predicted change map.
3.5.3. Perceptual Loss
To maintain structural consistency, we use the perceptual loss [36] to measure the difference between the generated and real change maps in a feature space. In the implementation, both the predicted probability map and the binary reference map are replicated to three channels and fed into an ImageNet-pretrained VGG-16 network. Features from layer relu3_3 are used to compute the perceptual loss, while VGG parameters are frozen during training. We selected relu3_3 because it provides a compromise between local boundary information and mid-level structural representation; lower layers were more sensitive to pixel noise, whereas deeper layers were less responsive to small building changes. Perceptual loss encourages the predicted change map to remain close to the reference map in this feature space:
where denotes the frozen VGG-16 feature extractor at layer relu3_3.
3.5.4. Total Loss
The final optimization objective is to combine the three losses into a total loss function:
where and are hyperparameters used to balance the different components of the loss. In this study, and were determined on the validation set. We first fixed the BCE segmentation loss as the main supervised objective (), because pixel-level change labels provide the most direct training signal for binary change detection. We then tested and selected , which provided the best trade-off between validation F1 and boundary smoothness without suppressing small changed objects. Larger perceptual loss weights produced smoother but less complete change maps, whereas smaller weights had a limited regularization effect. The adversarial term was kept with the unit weight because reducing it weakened the PatchGAN regularization, while increasing it led to less stable generator–discriminator training. Therefore, the final settings were , , and .
3.6. Optimization Strategy
The generator and discriminator are trained alternately. We used the Adam optimizer to minimize the generator loss and the discriminator loss . Both the generator and discriminator use Adam with and . The lower first-moment coefficient follows common cGAN and PatchGAN training practice and helps reduce excessive momentum accumulation during alternating adversarial updates. The initial learning rate was set to for both networks. We used the same optimizer type and learning rate for the two networks after validation-based tuning because this setting produced stable adversarial training with the PatchGAN discriminator in our experiments. We also tested a lower discriminator learning rate (), but it slowed discriminator convergence and did not improve the validation F1 or FCR. A cosine annealing schedule was used after a 10-epoch warm-up, and the minimum learning rate was set to for both networks. The validation F1 and validation FCR were evaluated after each epoch. The model checkpoint with the highest validation F1 was selected for the standard benchmark tables; when two checkpoints have the same F1 within 0.1 percentage points, the one with the lower validation FCR is selected. Early stopping is applied if the validation F1 does not improve for 30 consecutive epochs. The maximum number of epochs is 200:
No test set information was used for checkpoint selection or hyperparameter adjustment.
The change data in this paper were experimentally validated on three publicly available datasets. The detailed data sources, scene characteristics, and preprocessing protocol are presented in Section 4.1 to avoid separating the dataset description from the experimental design. To reduce false alarms caused by geometric or radiometric differences, we additionally generated perturbation-negative samples by applying controlled nuisance perturbations to existing image pairs and assigning them all-zero change masks. A hybrid training strategy was used, which is described below.
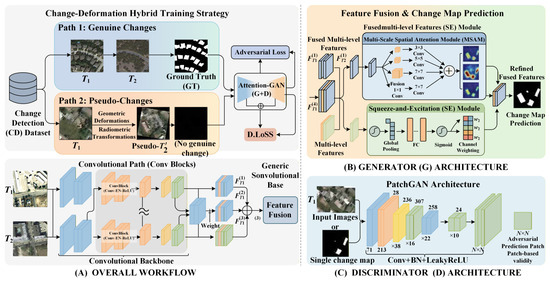
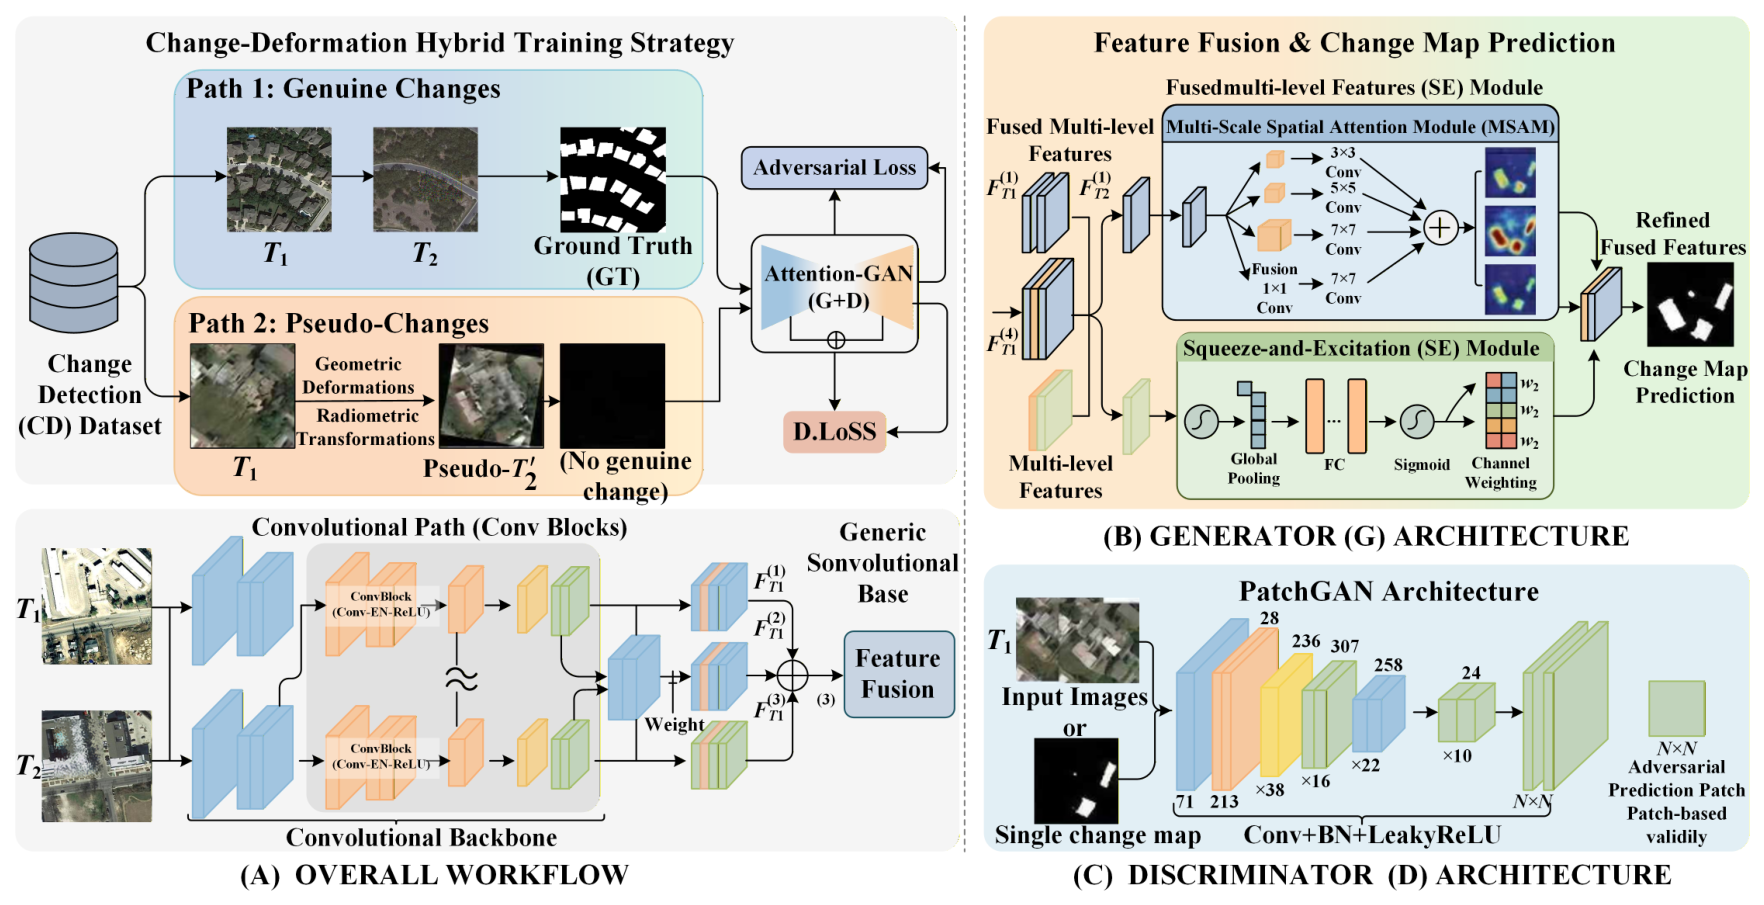
Figure 1 illustrates the training workflow and architecture of the proposed Attention-GAN model. The model takes two input images and and processes them through a dual-tower Siamese CNN backbone for feature extraction; the fused features are then passed through the MSAM and SE for feature refinement, and the decoder restores the image to its original resolution and outputs the predicted change map. Perturbation-negative samples are included as unchanged examples during hybrid training. A PatchGAN discriminator performs patch-based classification to distinguish between real and generated change maps, contributing to adversarial training. The model is optimized using the segmentation loss, perceptual loss, and adversarial loss.
Figure 1.
Overall workflow and architecture of Attention-GAN. The figure shows perturbation-negative hybrid training, the dual-tower Siamese generator with the MSAM and SE attention blocks, the decoder, and the PatchGAN discriminator used for adversarial supervision. Blue, orange, and green blocks indicate feature groups at different processing stages; arrows indicate data or feature flow; plus symbols denote feature aggregation, and numbers in parentheses indicate feature levels.
4. Experimental Design
4.1. Study Data and Test Areas
Experiments were conducted on three public datasets: LEVIR-CD, WHU-CD, and DSIFN-CD. The original data sources and dataset descriptions are specified below. LEVIR-CD consists of 637 pairs of Google Earth images with a 0.5-m spatial resolution and pixels per pair, mainly covering building changes in urban and suburban scenes. WHU-CD is an aerial image building change dataset with a 0.2-m resolution; the original image has a size of pixels, and it was cropped into patches for training and testing. DSIFN-CD contains 394 high-resolution bi-temporal image pairs and covers changes in multiple land cover types, including buildings, roads, vegetation, water-related areas, and other land cover transitions, providing more diverse scenes than building-only datasets. All datasets were obtained from their publicly released sources cited in the related work and reference list. The generated perturbation-negative samples were derived only from these public datasets and were not treated as independent real-world distortion data. Table 1 summarizes the public datasets and test areas used in this study.
Table 1.
Summary of the public datasets and test areas used in this study.
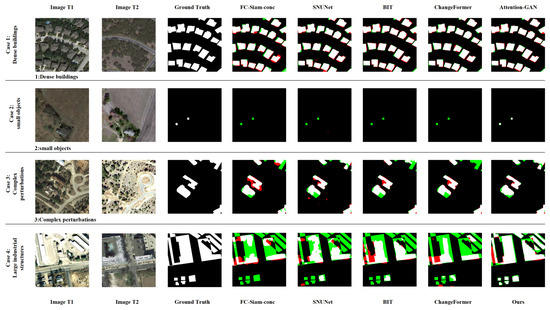
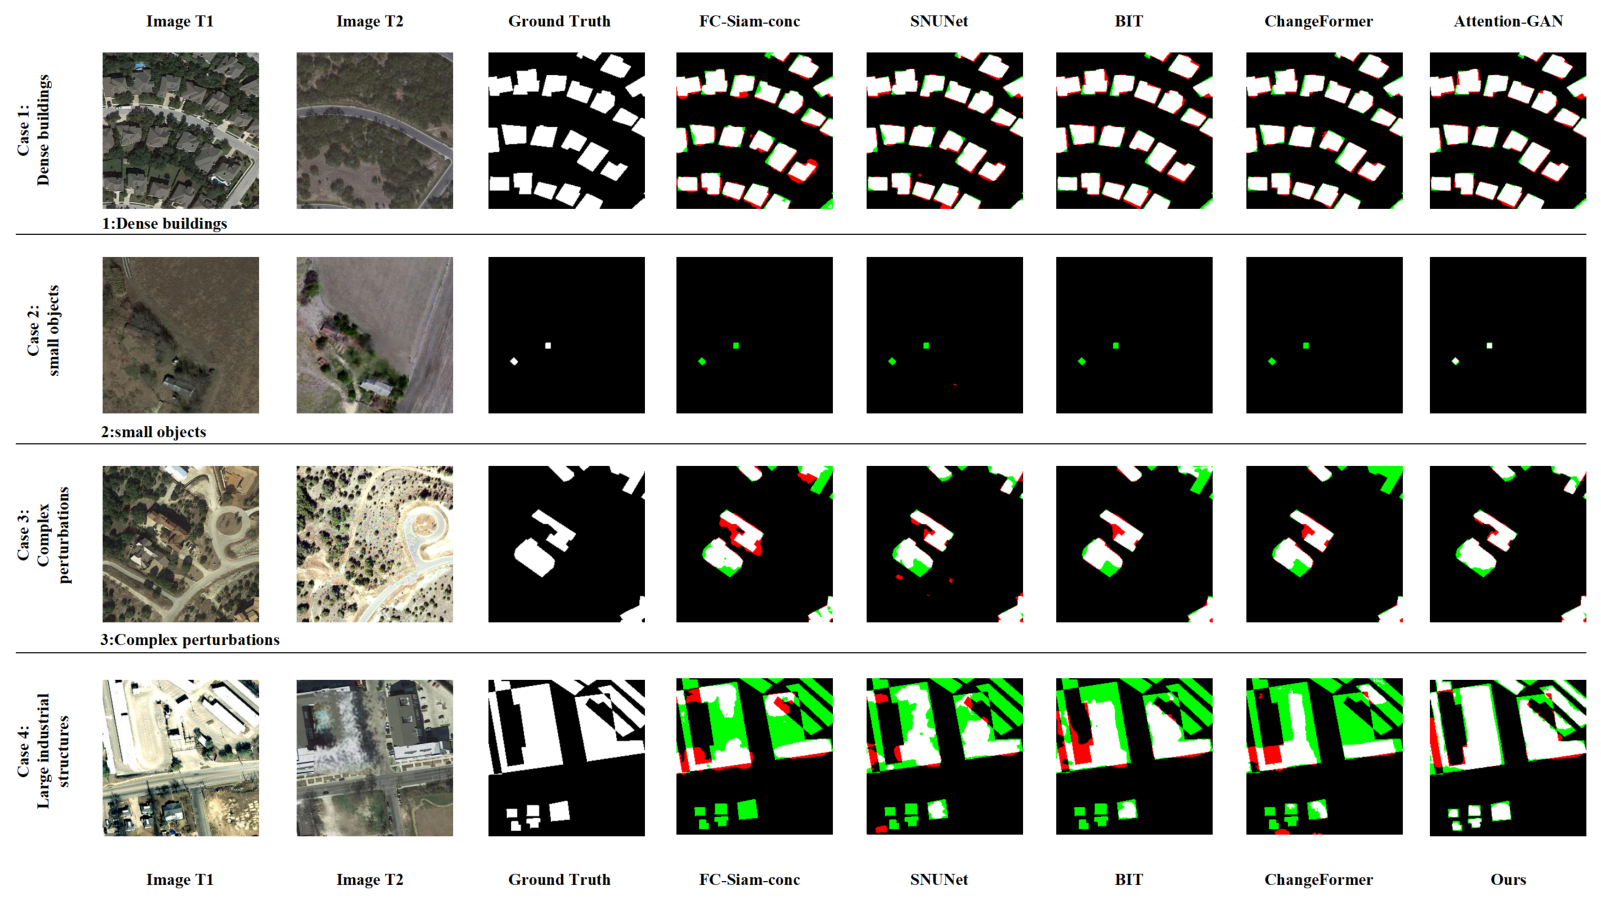
The visual examples in Figure 2 show four representative test scenes with different change characteristics: dense buildings, small objects, complex perturbations, and large industrial structures. The columns show the first temporal image, the second temporal image, the reference change map, representative baseline predictions, and the proposed Attention-GAN result. Since the public datasets provide cropped image pairs rather than complete satellite track metadata for every patch, the test area description focuses on the spatial resolution, scene type, image pair scale, and land cover category.
Figure 2.
Representative visual results for four test scenes. Columns show the bi-temporal images, ground truth, selected baseline predictions, and the proposed Attention-GAN prediction. In the prediction overlays, white pixels indicate correctly detected changed pixels, green pixels indicate omission errors, and red pixels indicate false alarms.
The following describes the perturbation-negative sample generation and hybrid training procedure.
4.2. Perturbation-Negative Samples and Hybrid Training
To improve resistance to false alarms, we applied controlled geometric and radiometric perturbations to a subset of the bi-temporal image pairs. For each such pair , we treated as the reference and generated a perturbed version of (or, symmetrically, perturbed to ). These pairs were used only when the intended label was unchanged. The image appearance was modified, but no land cover change was introduced. The model was then trained to predict a null change map (all zeros) so that it learned to suppress responses to nuisance differences:
- Geometric perturbation: We applied an affine transform to one image of the pair. The transform was composed of (1) random rotation by an angle drawn uniformly from (e.g., in our experiments); (2) random scaling by a factor s in (e.g., ); and (3) random translation by pixels within pixels. The image was resampled using bilinear interpolation. This simulates mild local misalignment caused by different viewing geometry, orthorectification errors, or registration residuals.
- Radiometric perturbation: To simulate illumination and sensor differences between dates, we applied a random linear intensity transform to one image, namely , where (contrast) is drawn from and (brightness) is drawn from (e.g., , in pixel value units after normalization). Optionally, a per-channel gamma correction with can be applied to mimic nonlinear radiometric differences.
- Hybrid training: In each training batch, we mixed (1) standard change detection samples with real change masks from the datasets and (2) perturbation-negative samples (or ) with an all-zero change map. The ratio of real-change to perturbation-negative samples was set so that the model was exposed to both types; we used a 1:1 ratio unless otherwise noted. This hybrid set-up treats controlled nuisance differences as non-changing. The perturbation is not an additional semantic class; it is a negative-sample augmentation strategy. The affine and radiometric operations used here cover common, controllable nuisance sources in orthophoto change detection, such as residual registration error, small viewpoint-induced displacement, scale inconsistency, and illumination variation. More complex distortions, including parallax, off-nadir viewing geometry, relief displacement, DEM error, shadow displacement, atmospheric effects, and cross-sensor differences, are outside the controlled setting and are discussed as limitations in Section 6.3.
4.3. Experiment Set-Up
The experiment was implemented using the PyTorch 2.7.0+cu118 framework and trained on an NVIDIA RTX 4060 GPU. Images were normalized to and cropped into patches. During training, random rotation, horizontal and vertical flipping, and color jittering were used as data augmentation. For each dataset, the standard train/validation/test split was used where available (e.g., LEVIR-CD and DSIFN-CD); for WHU-CD, the single large image was cropped into patches with 50% overlap and then split at the patch level. The generator encoder contains four stages with channel numbers 64, 128, 256, and 512. Each encoder stage contains two convolutional layers followed by batch normalization and ReLU activation. The decoder uses bilinear upsampling followed by convolution, batch normalization, and the ReLU. The MSAM uses parallel , , and convolution branches; the SE reduction ratio was set to 16. The PatchGAN discriminator consists of four convolutional blocks with LeakyReLU activation and outputs a patch-wise real/fake probability map. The probability threshold for converting the change probability map into a binary map is 0.5. Unless otherwise specified, the main single-run results were obtained with random seed 42 for data shuffling and model initialization. Additional repeated runs with seeds 42, 3407, and 2026 were used only for the statistical significance analysis. The main parameter settings are given in Table 2.
Table 2.
Experimental parameter settings.
Table 3 further summarizes the implementation details needed for reproduction.
Table 3.
Reproducibility-oriented implementation details.
4.4. Evaluation and Baselines
4.4.1. Evaluation Protocol
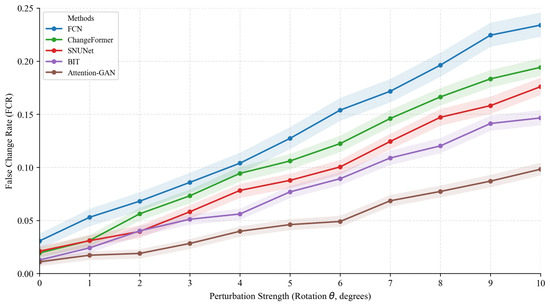
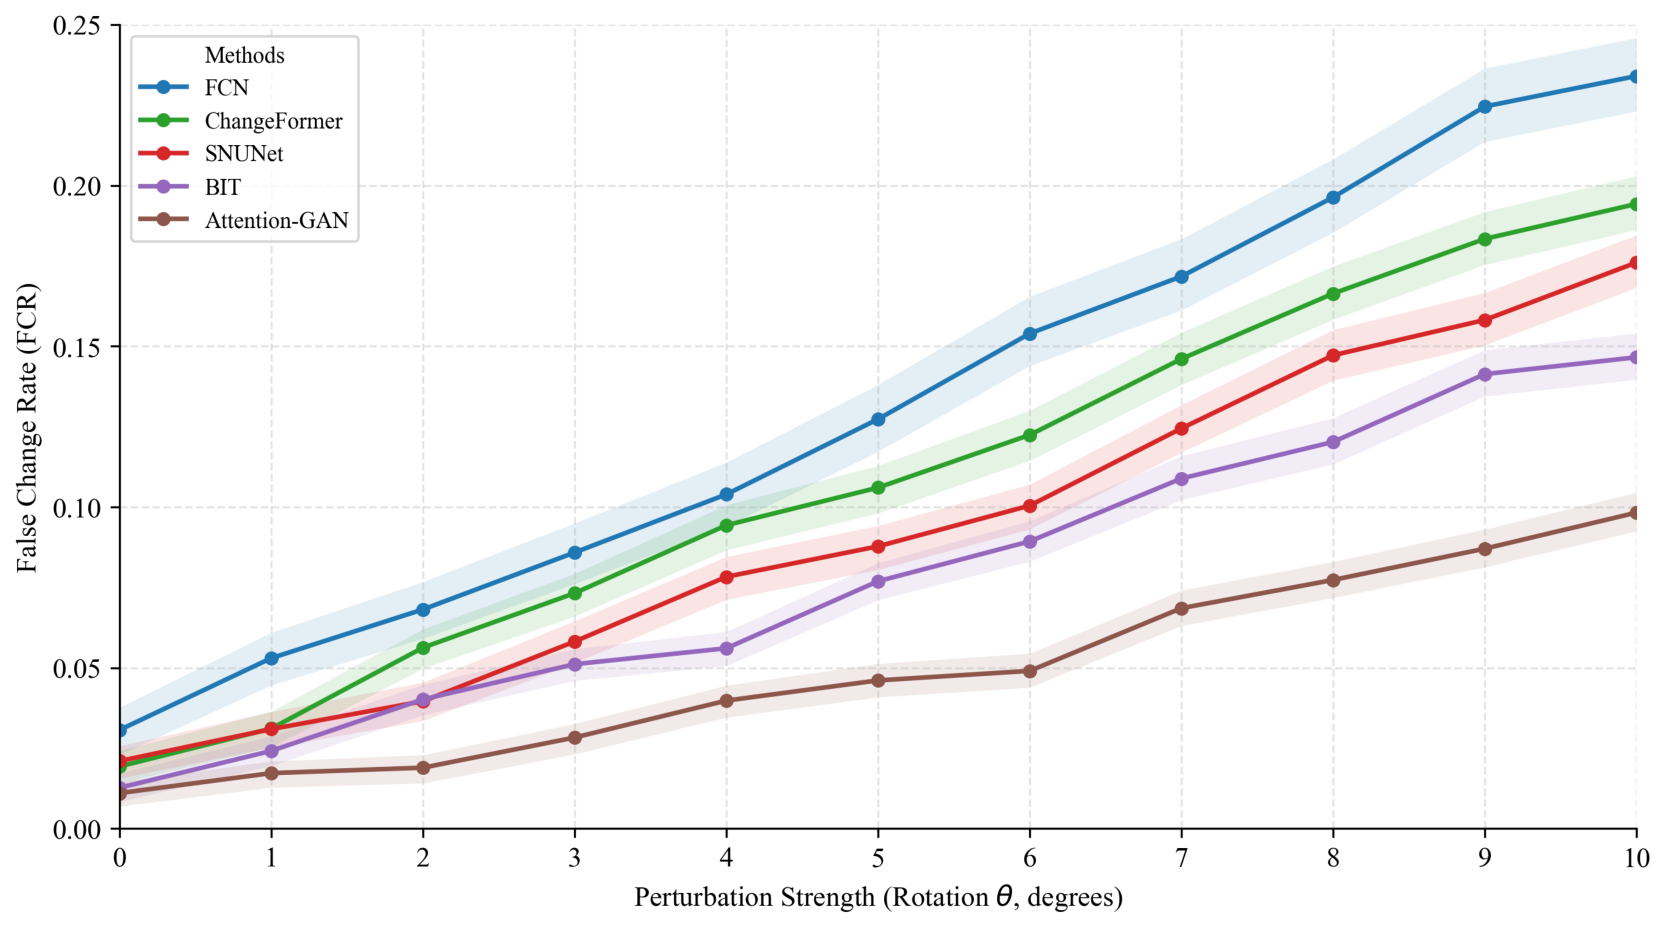
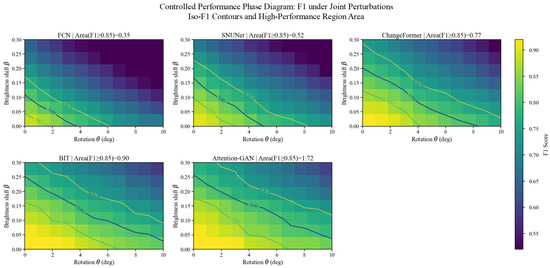
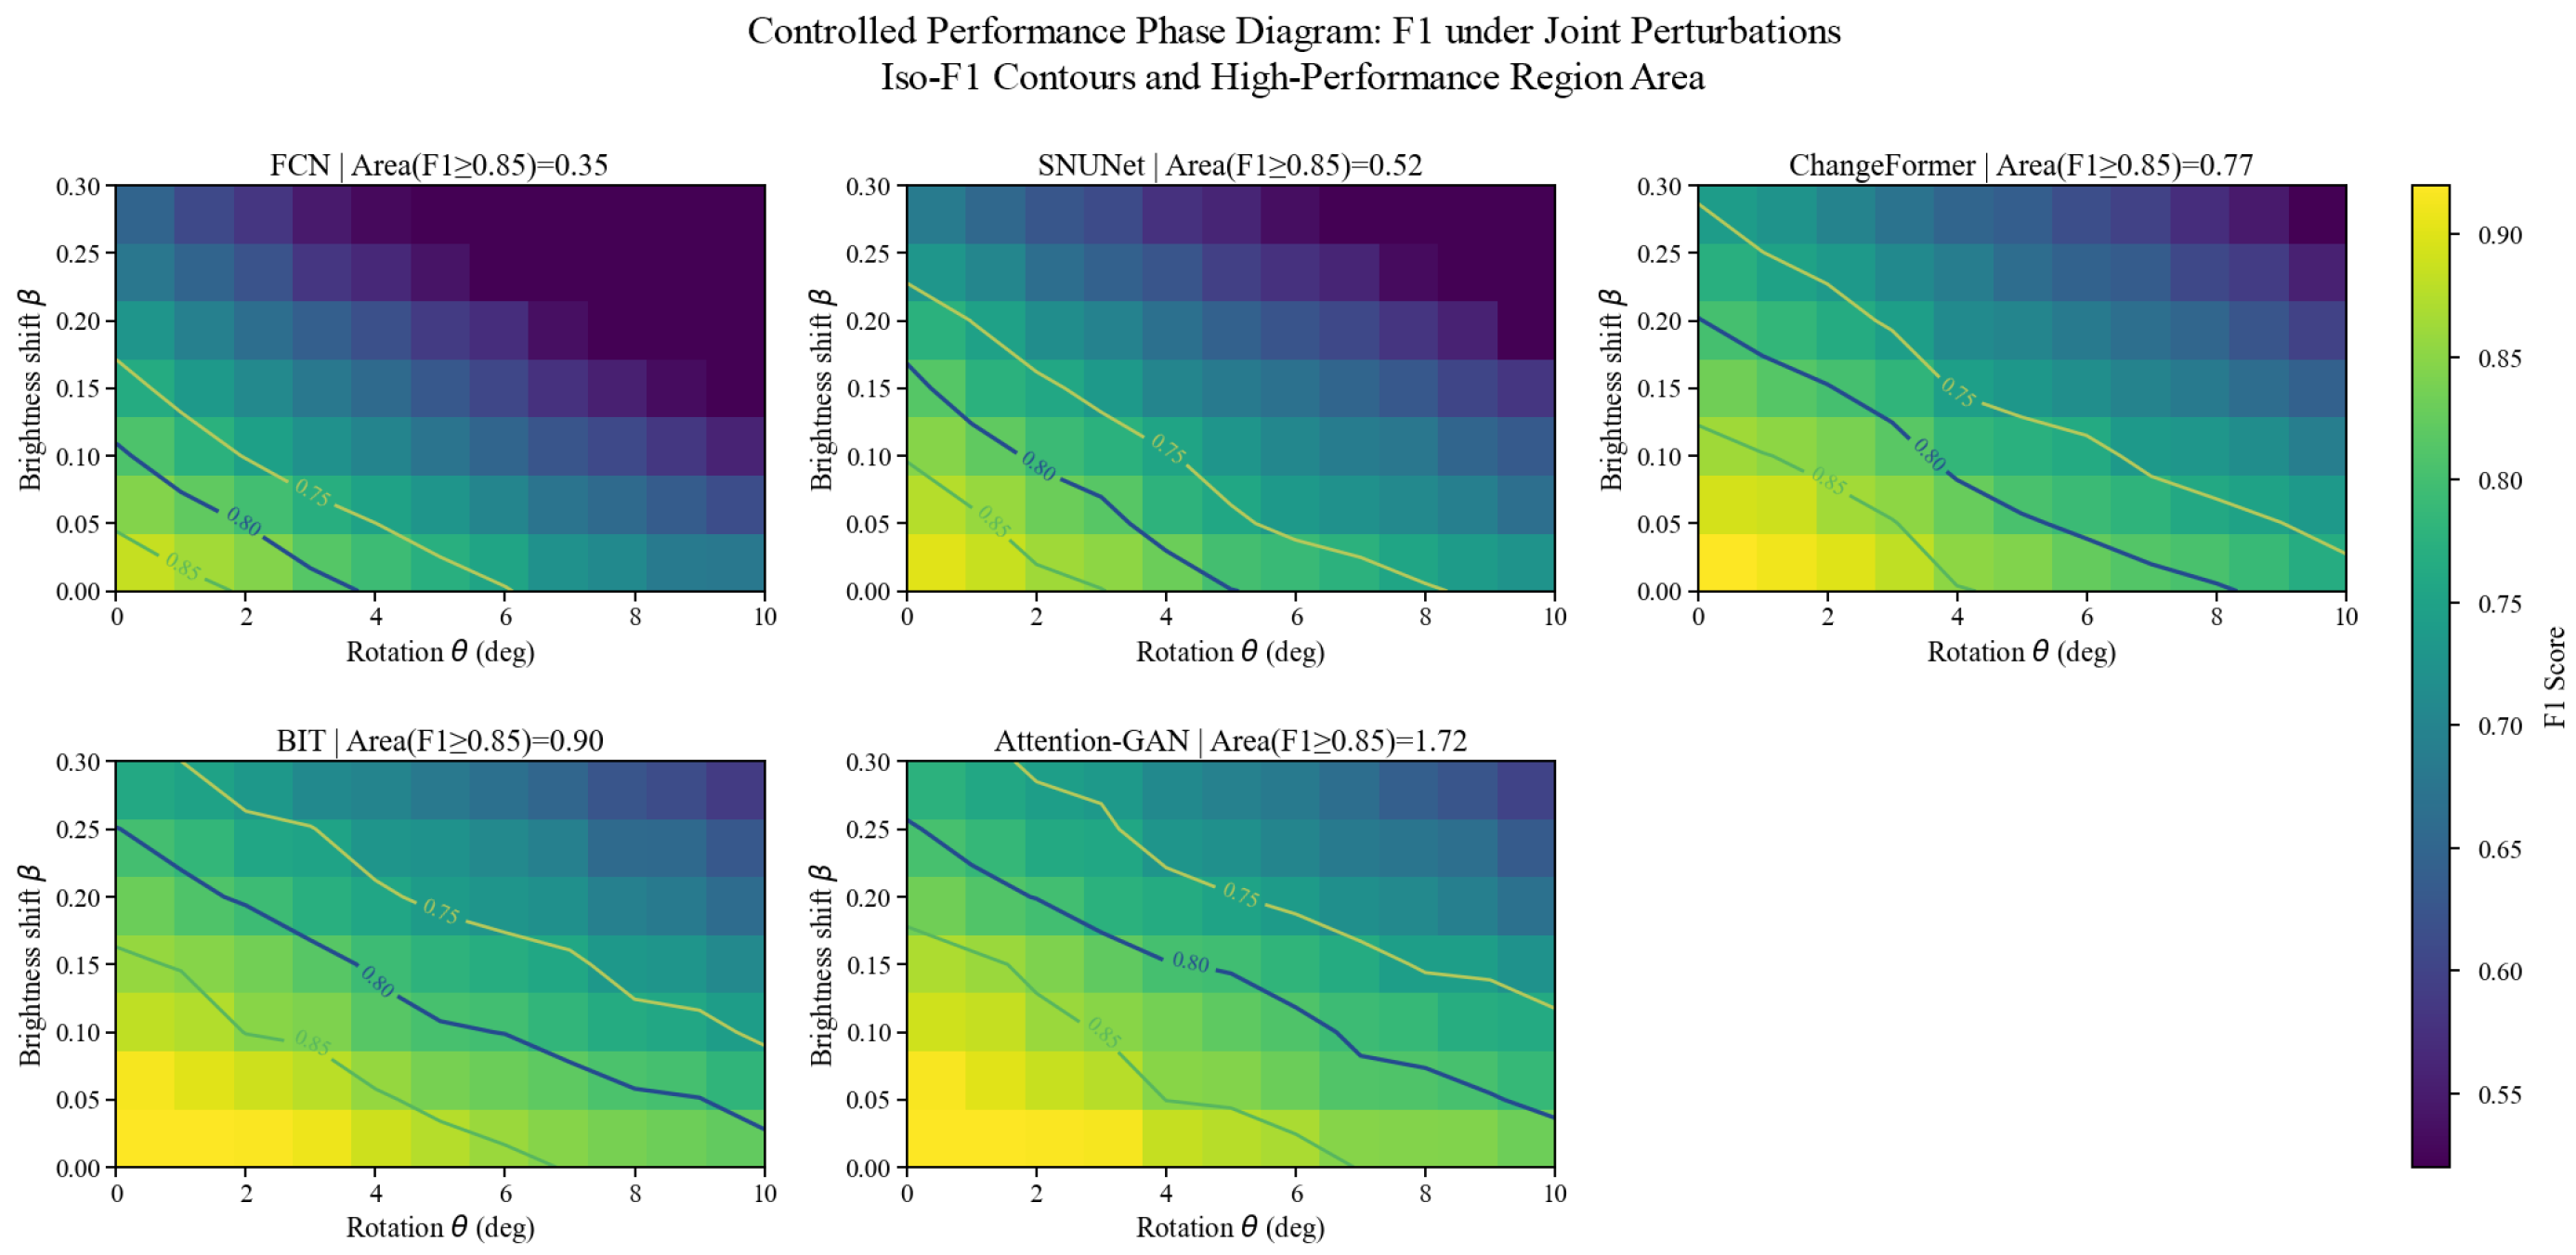
The evaluation had two parts. First, standard test sets with real land-cover changes were evaluated using the precision, recall, F1, IoU, OA, and Kappa (Section 4.4.2). Second, perturbation-negative pairs were evaluated using the false change rate (FCR), defined as the fraction of pixels incorrectly predicted as changed when the reference mask was all zeros. Figure 3 reports the FCR under increasing rotation perturbation. In Figure 4, the same perturbation family is applied to held-out test pairs with valid real-change masks, and F1 is computed against the original reference masks. Thus, the FCR was used for all-zero perturbation-negative pairs, while F1 under perturbation was used only when a real-change reference mask was available. All perturbation parameters were sampled from continuous ranges on held-out image pairs, and thus the experiment tested generalization within a controlled nuisance family rather than reuse of fixed training samples.
Figure 3.
Robustness degradation curve under rotation perturbation. FCR vs. ; shaded region shows standard deviation over three runs. FCN denotes the fully convolutional early-fusion baseline used in this robustness comparison.
Figure 4.
Controlled 2D performance phase diagram under joint rotation () and brightness () perturbations. Color indicates F1 score on perturbed held-out test pairs with valid reference change masks; contours show F1 region. FCN denotes the fully convolutional early-fusion baseline used in this robustness comparison.
To assess whether the improvements reported in Table 4, Table 5 and Table 6 were stable beyond the main seed 42 runs, the strongest competing method, TinyCD, and the proposed Attention-GAN were additionally trained with the matched random seeds 42, 3407, and 2026. A two-sided paired Student’s t-test was then applied to the F1 scores from the matched runs on each dataset. The null hypothesis was that the mean F1 difference between Attention-GAN and TinyCD was zero. A result was considered statistically significant when .
Table 4.
Performance comparison on the LEVIR-CD dataset.
Table 5.
Performance on WHU-CD dataset.
Table 6.
Performance on DSIFN-CD dataset.
4.4.2. Evaluation Metrics
The following metrics were used to evaluate model performance. Precision (Pre) and recall (Rec) are defined as follows:
where , , and denote true positives, false positives, and false negatives, respectively. The F1 score is the harmonic mean of precision and recall:
The intersection over union (IoU) and overall accuracy (OA) are
Kappa was used to measure the agreement between the predicted and reference maps after accounting for chance agreement.
4.4.3. Comparison Methods
The quantitative comparisons used the same method order across datasets: FC-EF, FC-Siam-Diff, FC-Siam-Conc, ChangeFormer, SNUNet, BIT, HSONet, TinyCD, and Attention-GAN. FC-EF and the two FC-Siam variants are classical convolutional and Siamese baselines; SNUNet represents dense Siamese fusion; ChangeFormer and BIT represent transformer-based change detection; and HSONet and TinyCD represent recent high-resolution methods. All methods were trained and tested on the same data splits and patch settings. The comparison was therefore limited to these representative baselines rather than all recent change detection methods.
5. Experimental Results and Analysis
5.1. Quantitative Analysis
Table 4 shows the performance comparison of different methods on the LEVIR-CD dataset. Attention-GAN achieved the best results across all metrics, with an F1 score of 91.2%, a 1.0 percentage point improvement over the second-best method, TinyCD. Because the margin was modest, this result is interpreted together with the repeated-run statistical analysis in Table 7, where the paired test against TinyCD gave .
Table 5 and Table 6 present the results on the WHU-CD and DSIFN-CD datasets, respectively. The proposed method obtained the highest F1 and IoU among the selected baselines on both datasets. The improvements were moderate, but the repeated-run paired tests against TinyCD remained significant on WHU-CD () and DSIFN-CD (), as reported in Table 7.
Across the three datasets, the gain over the second-best method was consistent but modest. The results support the usefulness of combining attention, adversarial supervision, and perturbation-negative training, but they should not be read as a large performance leap over recent methods. The higher F1 on DSIFN-CD (93.18%) than on LEVIR-CD (91.2%) may also reflect dataset-specific scene composition and annotation characteristics.
Table 7 summarizes the repeated-run statistics corresponding to Table 4, Table 5 and Table 6. Attention-GAN obtained a higher mean F1 on all three datasets, with under the three-run paired-test protocol. The effect size was still moderate, and thus the results are interpreted as statistically supported but incremental improvements.
Figure 2 presents the representative results from four test scenes. The columns show the first image, second image, ground truth, selected baseline predictions, and proposed Attention-GAN prediction. The proposed method produced more continuous changed regions and fewer isolated false alarms in these examples.
5.2. Ablation Experiments
Ablation experiments were conducted on the LEVIR-CD split used in Table 4. The baseline was a Siamese encoder–decoder trained with BCE loss only. The MSAM, SE, PatchGAN supervision, and perturbation-negative samples were then evaluated individually and in combination. All variants used the same data split, optimizer, learning rate schedule, batch size, and checkpoint selection rule; thus, the changes in F1 and FCR mainly reflected the contribution of the added component.
In Table 8, M, S, P, and N denote the MSAM, SE, PatchGAN supervision, and perturbation-negative samples, respectively. The MSAM and SE both improved the F1 score over the Siamese baseline and reduced the FCR. Using the MSAM and SE together increased the F1 by 2.5 percentage points and lowered the FCR by 3.9 percentage points. Adding PatchGAN supervision raised the F1 from 90.1% to 90.6% and lowered the FCR from 10.9% to 9.8%. Adding perturbation-negative samples without PatchGAN raised the F1 to 90.8% and lowered the FCR to 6.3%, showing that the proposed negative-sample strategy mainly contributes to false alarm suppression. The full model obtained the best F1 and the lowest FCR, suggesting that local adversarial supervision and perturbation-negative training are complementary.
Table 8.
Ablation test results on LEVIR-CD. FCR was measured on perturbation-negative validation pairs; lower values are better. ΔF1 and ΔFCR were computed relative to the Siamese baseline. A checkmark indicates that the corresponding component was included.
The qualitative ablation results followed the same pattern. The baseline model often produced fragmented changed regions, blurred object boundaries, and isolated false alarms in unchanged backgrounds. After adding the MSAM, changed objects became more spatially continuous, and missed detections of small or narrow changed regions were reduced. Adding SE further suppressed background noise and improved the separation between changed and unchanged semantic regions. When the MSAM and SE were used together, the predicted maps showed clearer object-level boundaries, fewer nuisance responses, and more complete small-object changes.
A data ratio sensitivity analysis was also conducted on LEVIR-CD. As shown in Table 9, the F1 decreased as fewer training samples were used. Attention-GAN remained usable at 50% and 75% of the training data, but the recall dropped more clearly at 25%, indicating that diverse real-change annotations were still needed. The mini-batches included both changed and perturbation-negative examples to reduce class imbalance effects.
Table 9.
Sensitivity to reduced training data on the LEVIR-CD split.
5.3. Visualization Analysis
Figure 3 shows the FCR under controlled rotation perturbation, with . Each curve reports the mean over three runs, and the shaded region shows the standard deviation. FCN denotes the fully convolutional early-fusion baseline used in this robustness comparison.
The FCR increased for all methods as the rotation became stronger. Attention-GAN had the lowest FCR across the evaluated range and degraded more slowly than the compared baselines. Since perturbation-negative samples were used during training, this result should be interpreted as improved robustness within the evaluated perturbation family and not as unrestricted robustness to all real-world distortions.
Figure 4 reports the F1 under joint rotation and brightness perturbations. The horizontal axis is , and the vertical axis is the brightness shift . The color map gives F1 scores on perturbed held-out test pairs with valid reference masks, and the contour lines mark the F1 region.
All methods degraded as the rotation or brightness disturbance increased. Attention-GAN preserved a larger F1 region than the compared methods, indicating better stability within the controlled compound perturbation range.
6. Discussion
6.1. Interpretation of Results
On LEVIR-CD, WHU-CD, and DSIFN-CD, Attention-GAN gave the highest F1 among the selected baselines. The margins were modest, even though the paired tests were significant under the three-run protocol. The results are therefore best interpreted as incremental gains from combining attention, adversarial supervision, and perturbation-negative training. The ablation study suggests that the MSAM improved spatial continuity, SE improved channel discrimination, PatchGAN improved local regularity, and perturbation-negative samples reduced false alarms under the evaluated nuisance perturbations.
The robustness experiments (Figure 3 and Figure 4) show that the method degraded more slowly under geometric and radiometric perturbations than the representative baselines shown in those figures. This is important for orthophoto change detection because mild misalignment or radiometric inconsistency should not by itself produce a large change mask. At the same time, the training and testing perturbations belonged to the same broad family of affine and radiometric transformations. Thus, the robustness results demonstrate generalization within a controlled perturbation distribution rather than unrestricted robustness to all real-world nuisance sources. The test perturbation parameters were continuously sampled on held-out image pairs and not reused from the training samples, but the results should not be interpreted as evidence of robustness to parallax, strong seasonal variation, atmospheric artifacts, DEM errors, or cross-sensor distortions.
The model is related to recent intertemporal attention-guided change detection networks, including the Multi-Level Intertemporal Attention-Guided Network. The difference is that Attention-GAN couples attention modules with PatchGAN supervision and perturbation-negative samples. Its purpose is false alarm-resistant change detection and not a new semantic class formulation or a replacement for existing change detection paradigms.
6.2. Training Stability of the GAN Framework
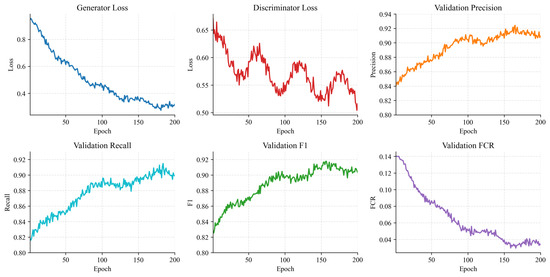
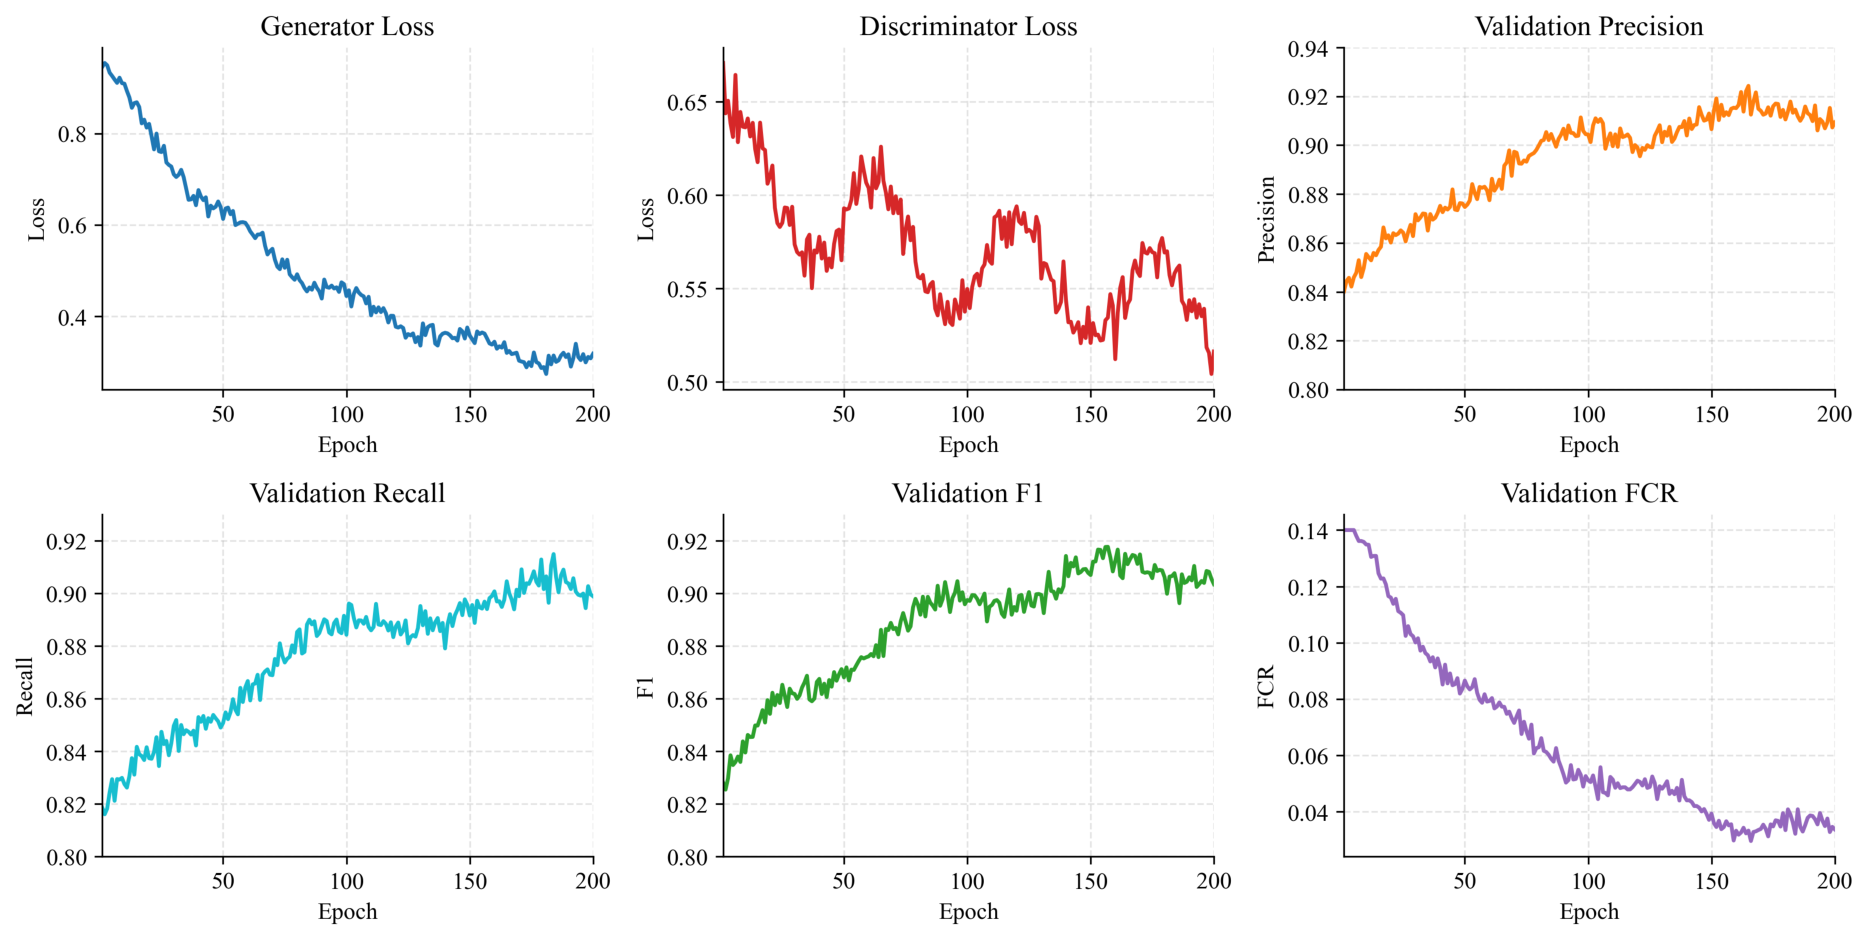
GAN training can be unstable because the discriminator may dominate or collapse. To reduce this risk, the discriminator uses local PatchGAN supervision, and the adversarial loss is combined with pixel-wise segmentation and perceptual losses. The generator loss, discriminator loss, validation precision, recall, F1, and FCR were monitored after each epoch. Figure 5 shows the representative curves; the generator loss decreased and stabilized, the discriminator loss did not collapse to zero, the validation F1 converged after the middle training stage, and the validation FCR decreased. If strong oscillation was observed, then the adversarial weight was reduced while keeping the segmentation loss unchanged.
Figure 5.
Training stability analysis of Attention-GAN. The curves show the generator loss, discriminator loss, validation precision, validation recall, validation F1, and validation FCR over 200 epochs.
6.3. Limitations
Several limitations remain. First, the dual-tower Siamese CNN backbone increases the parameter count and inference cost. The experiments were conducted on a single GPU with a fixed input size and augmentation setting, and thus performance under different patch sizes, extremely high resolutions, and cross-sensor settings was not fully examined. Second, the affine and radiometric perturbations used here covered only controlled nuisance sources. Real scenes may contain parallax, off-nadir viewing effects, relief displacement, occlusion, seasonal variation, atmospheric artifacts, DEM errors, shadow displacement, or cross-sensor differences. The reported robustness therefore applies to the evaluated perturbation family and not to all real-world distortions. Third, the experiments mainly used LEVIR-CD, WHU-CD, and DSIFN-CD. Broader validation on vegetation dynamics, water body change, cropland change, disaster damage, and cross-sensor datasets is needed. Future work should evaluate real multi-view and cross-sensor benchmarks, include stronger recent baselines under a reproducible protocol, and test more severe low-annotation and class imbalance settings.
7. Conclusions
This study presented an attention-guided generative adversarial network for false alarm-resistant change detection in remote sensing orthophotos. The model integrates multi-scale spatial attention and channel attention into a Siamese change detection framework, and it uses perturbation-negative samples to indicate that mild geometric and radiometric differences should remain unchanged when no land cover transition is present. PatchGAN supervision further improves the local regularity of the predicted change maps.
Experiments on three public datasets showed that Attention-GAN achieved competitive or moderately higher accuracy than the selected baselines. The robustness results indicated lower false alarm rates under the controlled affine and radiometric perturbations evaluated in this study.
The framework is intended for orthophoto-based change detection in scenarios where imperfect co-registration and radiometric inconsistency can create false alarms. It is most relevant to monitoring workflows in which candidate change maps are reviewed manually or used in downstream spatial analysis.
Practical implications and future work: The approach is suited to orthophoto-based urban and land cover monitoring when co-registration and radiometric consistency are imperfect. Future work will focus on lighter backbones, multi-temporal or multi-sensor inputs, semantic change maps, and uncertainty-based human verification.
Author Contributions
Conceptualization, Y.H. and Z.J.; methodology, Y.H.; software, Y.H.; validation, Y.H.; formal analysis, Y.H.; investigation, Y.H.; resources, Y.H., Z.J. and W.L.; data curation, Y.H.; writing—original draft preparation, Y.H.; writing—review and editing, Y.H., Z.J., W.L. and Y.L.; visualization, Y.H.; supervision, Z.J.; project administration, Y.H. and Z.J.; funding acquisition, Z.J. All authors have read and agreed to the published version of the manuscript.
Funding
This research was funded by the Hubei Provincial Science and Technology Plan Project, China, grant number 2025BAB050.
Institutional Review Board Statement
Not applicable.
Informed Consent Statement
Not applicable.
Data Availability Statement
The LEVIR-CD, WHU-CD, and DSIFN-CD datasets used in this study are publicly available. Perturbation-negative samples were generated from these datasets using the procedure described in Section 4.1 and Section 4.2.
Acknowledgments
The authors thank the providers of the LEVIR-CD, WHU-CD, and DSIFN-CD datasets.
Conflicts of Interest
The authors declare no conflicts of interest.
Abbreviations
| GAN | Generative adversarial network |
| MSAM | Multi-Scale Spatial Attention Module |
| SE | Squeeze-and-Excitation |
| cGAN | Conditional generative adversarial network |
| FCR | False change rate |
| BCE | Binary cross-entropy |
| OA | Overall accuracy |
| IoU | Intersection over union |
| CNN | Convolutional neural network |
References
- Li, J.; Bhatti, U.A.; Nawaz, S.A.; Huang, M.; Ahmad, R.M.; Ghadi, Y.Y. Remote-Sensing Image Classification: A Comprehensive Review and Applications. In Deep Learning for Multimedia Processing Applications; CRC Press: Boca Raton, FL, USA, 2024; pp. 18–47. [Google Scholar]
- Gui, S.; Song, S.; Qin, R.; Tang, Y. Remote Sensing Object Detection in the Deep Learning Era—A Review. Remote Sens. 2024, 16, 327. [Google Scholar] [CrossRef] [Scilit]
- Kazanskiy, N.; Khabibullin, R.; Nikonorov, A.; Khonina, S. A Comprehensive Review of Remote Sensing and Artificial Intelligence Integration: Advances, Applications, and Challenges. Sensors 2025, 25, 5965. [Google Scholar] [CrossRef] [Scilit] [PubMed]
- Paheding, S.; Saleem, A.; Siddiqui, M.F.H.; Rawashdeh, N.; Essa, A.; Reyes, A.A. Advancing Horizons in Remote Sensing: A Comprehensive Survey of Deep Learning Models and Applications in Image Classification and Beyond. Neural Comput. Appl. 2024, 36, 16727–16767. [Google Scholar] [CrossRef] [Scilit]
- Saha, S. Confidence Estimation in Unsupervised Deep Change Vector Analysis. IEEE Trans. Geosci. Remote Sens. 2024, 62, 4709609. [Google Scholar] [CrossRef] [Scilit]
- Lin, Y.; Liu, S.; Zheng, Y.; Tong, X.; Xie, H.; Zhu, H. An Unsupervised Transformer-Based Multivariate Alteration Detection Approach for Change Detection in VHR Remote Sensing Images. IEEE J. Sel. Top. Appl. Earth Obs. Remote Sens. 2024, 17, 3251–3261. [Google Scholar] [CrossRef] [Scilit]
- Jia, J.; Lee, G.; Wang, Z.; Lyu, Z.; He, Y. Siamese Meets Diffusion Network: SMDNet for Enhanced Change Detection in High-Resolution RS Imagery. IEEE J. Sel. Top. Appl. Earth Obs. Remote Sens. 2024, 17, 8189–8202. [Google Scholar] [CrossRef] [Scilit]
- Tao, C.; Kuang, D.; Huang, Z.; Peng, C.; Li, H. HSONet: A Siamese Foreground Association-Driven Hard Case Sample Optimization Network for High-Resolution Remote Sensing Image Change Detection. arXiv 2024, arXiv:2402.16242. [Google Scholar]
- Ji, S.; Shen, Y.; Lu, M.; Zhang, Y. Building Instance Change Detection from Large-Scale Aerial Images Using Convolutional Neural Networks and Simulated Samples. Remote Sens. 2019, 11, 1343. [Google Scholar] [CrossRef] [Scilit]
- Zheng, Z.; Ma, A.; Zhang, L.; Zhong, Y. Change is Everywhere: Single-Temporal Supervised Object Change Detection in Remote Sensing Imagery. In Proceedings of the IEEE/CVF International Conference on Computer Vision (ICCV), Montreal, QC, Canada, 10–17 October 2021; pp. 15193–15202. [Google Scholar]
- Liu, Y.; Pang, C.; Zhan, Z.; Zhang, X.; Yang, X. Building Change Detection for Remote Sensing Images Using a Dual-Task Constrained Deep Siamese Convolutional Network Model. IEEE Geosci. Remote Sens. Lett. 2021, 18, 811–815. [Google Scholar] [CrossRef] [Scilit]
- Saha, S.; Bovolo, F.; Bruzzone, L. Unsupervised Deep Change Vector Analysis for Multiple-Change Detection in VHR Images. IEEE Trans. Geosci. Remote Sens. 2019, 57, 3677–3693. [Google Scholar] [CrossRef] [Scilit]
- Peng, D.; Zhang, Y.; Guan, H. End-to-End Change Detection for High Resolution Satellite Images Using Improved UNet++. Remote Sens. 2019, 11, 1382. [Google Scholar] [CrossRef] [Scilit]
- Daudt, R.C.; Le Saux, B.; Boulch, A. Fully Convolutional Siamese Networks for Change Detection. In Proceedings of the IEEE International Conference on Image Processing (ICIP), Athens, Greece, 7–10 October 2018; IEEE: New York, NY, USA, 2018; pp. 4063–4067. [Google Scholar]
- Ji, S.; Wei, S.; Lu, M. Fully Convolutional Networks for Multisource Building Extraction from an Open Aerial and Satellite Imagery Data Set. IEEE Trans. Geosci. Remote Sens. 2019, 57, 574–586. [Google Scholar] [CrossRef] [Scilit]
- Goodfellow, I.; Pouget-Abadie, J.; Mirza, M.; Xu, B.; Warde-Farley, D.; Ozair, S.; Courville, A.; Bengio, Y. Generative Adversarial Nets. In Advances in Neural Information Processing Systems; MIT Press: Cambridge, MA, USA, 2014; Volume 27, pp. 2672–2680. [Google Scholar]
- Mirza, M.; Osindero, S. Conditional Generative Adversarial Nets. arXiv 2014, arXiv:1411.1784. [Google Scholar]
- Isola, P.; Zhu, J.-Y.; Zhou, T.; Efros, A.A. Image-to-Image Translation with Conditional Adversarial Networks. In Proceedings of the IEEE Conference on Computer Vision and Pattern Recognition (CVPR), Thiruvananthapuram, India, 25–26 November 2023; IEEE: New York, NY, USA, 2017; pp. 1125–1134. [Google Scholar]
- Kaur, G.; Afaq, Y. Developments in Deep Learning for Change Detection in Remote Sensing: A Review. Trans. GIS 2024, 28, 223–257. [Google Scholar] [CrossRef] [Scilit]
- Zhang, C.; Yue, P.; Tapete, D.; Jiang, L.; Shangguan, B.; Huang, L.; Liu, G. A Deeply Supervised Image Fusion Network for Change Detection in High Resolution Bi-Temporal Remote Sensing Images. ISPRS J. Photogramm. Remote Sens. 2020, 166, 183–200. [Google Scholar] [CrossRef] [Scilit]
- Chen, H.; Shi, Z. A Spatial-Temporal Attention-Based Method and a New Dataset for Remote Sensing Image Change Detection. Remote Sens. 2020, 12, 1662. [Google Scholar] [CrossRef] [Scilit]
- Fang, S.; Li, K.; Shao, J.; Li, Z. SNUNet-CD: A Densely Connected Siamese Network for Change Detection of VHR Images. IEEE Geosci. Remote Sens. Lett. 2022, 19, 8007805. [Google Scholar] [CrossRef] [Scilit]
- Chen, H.; Qi, Z.; Shi, Z. Remote Sensing Image Change Detection with Transformers. IEEE Trans. Geosci. Remote Sens. 2022, 60, 5607514. [Google Scholar] [CrossRef] [Scilit]
- Bandara, W.G.C.; Patel, V.M. A Transformer-Based Siamese Network for Change Detection. In Proceedings of the IEEE International Geoscience and Remote Sensing Symposium (IGARSS), Kuala Lumpur, Malaysia, 17–22 July 2022; IEEE: New York, NY, USA, 2022; pp. 207–210. [Google Scholar]
- Codegoni, A.; Lombardi, G.; Ferrari, A. TinyCD: A (Not So) Deep Learning Model for Change Detection. arXiv 2022, arXiv:2207.13159. [Google Scholar]
- Bastani, F.; Wolters, P.; Gupta, R.; Ferdinando, J.; Kembhavi, A. SatlasPretrain: A Large-Scale Dataset for Remote Sensing Image Understanding. In Proceedings of the IEEE/CVF International Conference on Computer Vision, Paris, France, 1–6 October 2023; pp. 16772–16782. [Google Scholar]
- Mendieta, M.; Han, B.; Shi, X.; Zhu, Y.; Chen, C. Towards Geospatial Foundation Models via Continual Pretraining. In Proceedings of the IEEE/CVF International Conference on Computer Vision, Paris, France, 1–6 October 2023; pp. 16806–16816. [Google Scholar]
- Lebedev, M.A.; Vizilter, Y.V.; Vygolov, O.V.; Knyaz, V.A.; Rubis, A.Y. Change Detection in Remote Sensing Images Using Conditional Adversarial Networks. Int. Arch. Photogramm. Remote Sens. Spat. Inf. Sci. 2018, XLII-2, 565–571. [Google Scholar] [CrossRef] [Scilit]
- Hu, J.; Shen, L.; Sun, G. Squeeze-and-Excitation Networks. In Proceedings of the IEEE/CVF Conference on Computer Vision and Pattern Recognition, Salt Lake City, UT, USA, 18–23 June 2018; IEEE: New York, NY, USA, 2018; pp. 7132–7141. [Google Scholar]
- Woo, S.; Park, J.; Lee, J.-Y.; Kweon, I.S. CBAM: Convolutional Block Attention Module. In Proceedings of the European Conference on Computer Vision (ECCV); Springer: Cham, Switzerland, 2018; pp. 3–19. [Google Scholar]
- Shangguan, Y.; Li, J.; Chen, Z.; Ren, L.; Hua, Z. Multiscale Attention Fusion Graph Network for Remote Sensing Building Change Detection. IEEE Trans. Geosci. Remote Sens. 2024, 62, 4402618. [Google Scholar] [CrossRef] [Scilit]
- Huang, Z.; Qiu, H.; Hou, M.; Yu, Z.; Wang, S.; Li, X. MCECF: A Multi-Scale Complementary Enhanced Context Fusion Network for Remote Sensing Change Detection. IEEE Trans. Geosci. Remote Sens. 2025, 63, 4407414. [Google Scholar] [CrossRef] [Scilit]
- Chen, J.; Yuan, Z.; Peng, J.; Chen, L.; Huang, H.; Zhu, J. DASNet: Dual Attentive Fully Convolutional Siamese Networks for Change Detection in High-Resolution Satellite Images. IEEE J. Sel. Top. Appl. Earth Obs. Remote Sens. 2021, 14, 1194–1206. [Google Scholar] [CrossRef] [Scilit]
- Liu, S.; Zhang, Q.; Zhang, Y.; Niu, X.; Zhang, W.; Xie, F. Multi-Level Intertemporal Attention-Guided Network for Change Detection in Remote Sensing Images. Remote Sens. 2025, 17, 2233. [Google Scholar] [CrossRef] [Scilit]
- He, K.; Zhang, X.; Ren, S.; Sun, J. Deep Residual Learning for Image Recognition. In Proceedings of the IEEE Conference on Computer Vision and Pattern Recognition, Las Vegas, NV, USA, 27–30 June 2016; IEEE: New York, NY, USA, 2016; pp. 770–778. [Google Scholar]
- Johnson, J.; Alahi, A.; Fei-Fei, L. Perceptual Losses for Real-Time Style Transfer and Super-Resolution. In Proceedings of the European Conference on Computer Vision (ECCV); Springer: Cham, Switzerland, 2016; pp. 694–711. [Google Scholar]

Disclaimer/Publisher’s Note: The statements, opinions and data contained in all publications are solely those of the individual author(s) and contributor(s) and not of MDPI and/or the editor(s). MDPI and/or the editor(s) disclaim responsibility for any injury to people or property resulting from any ideas, methods, instructions or products referred to in the content. |
© 2026 by the authors. Licensee MDPI, Basel, Switzerland. This article is an open access article distributed under the terms and conditions of the Creative Commons Attribution (CC BY) license.