


Highlights
What are the main findings?
- The MaxEnt–PLUS–HLCI framework identified scenario-based spatial overlaps between projected Quercus suitable habitats and future built-up or cultivated land.
- Under high-emission and intensive land-use scenarios, projected suitable habitats showed increased spatial overlap with built-up land and cultivated land, suggesting potential habitat–land-use conflicts rather than direct evidence of migration pathway disruption.
What are the implications of the main findings?
- Climate-only species distribution assessments may overestimate the spatial availability of future suitable habitats when dynamic land-use patterns are not considered
- Forest conservation must shift from static, in situ protection to adaptive territorial spatial planning and the construction of cross-regional ecological corridors in human-dominated landscapes.
Abstract
Global warming is driving large-scale shifts in the climatically suitable habitats of many species. However, climate-only species distribution assessments may overestimate the spatial availability of future suitable habitats when dynamic land-use change is not considered. To assess potential spatial overlaps between climate-driven habitat suitability shifts and human land-use patterns, this study focuses on Quercus L. as a widely distributed keystone forest taxon in China. The genus-level assessment was designed to identify broad-scale habitat–land-use conflict patterns under multiple climate pathways and territorial spatial planning scenarios, rather than to predict species-specific distribution responses. We developed a soft-coupled framework integrating the Maximum Entropy (MaxEnt) model and the Patch-generating Land-Use Simulation (PLUS) model, and applied the Habitat–Land-Use Conflict Index (HLCI) as a categorical spatial overlay framework to classify potential overlaps between projected suitable habitats and future land-use categories across 16 exploratory scenario combinations integrating Shared Socioeconomic Pathway (SSP)-based climate projections and land-use/land-cover (LULC) scenarios for the 2040s at the grid scale. The results indicate that: (1) climate warming may reshape Quercus habitat suitability, characterized by northward/westward expansion and southward contraction in some low-latitude regions; (2) future land-use patterns may reduce the spatial availability of projected suitable habitats by increasing their overlap with built-up land and cultivated land. Under high-emission scenarios, potential newly suitable habitats overlapped with built-up land by up to 5.90 × 10⁴ km2 and with cultivated land by up to 36.42 × 10⁴ km2; and (3) the Ecological Protection scenario showed lower overlap with non-ecological land-use categories and a larger area of potentially realizable habitat expansion. This study provides a scenario-based spatial assessment of where future Quercus habitat suitability may overlap with human land-use patterns, offering broad-scale support for adaptive forest conservation and territorial spatial planning.
1. Introduction
In macro-biodiversity conservation and forest resource management, Species Distribution Models (SDMs) have been widely used to project potential shifts in species’ climatically suitable habitats under climate change [1,2]. Grounded in Hutchinson’s multidimensional niche theory, SDMs relate species occurrence records to environmental variables and provide an effective tool for assessing broad-scale habitat suitability and potential climate refugia [3,4]. As one of the dominant keystone forest taxa in the Northern Hemisphere, Quercus L. plays important roles in ecosystem carbon sequestration, hydrological regulation, and forest community succession, while also being sensitive to climate change and habitat fragmentation [4,5]. In China, oaks are widely distributed across the temperate-to-subtropical transition zone, a region that also overlaps with densely populated, economically active, and rapidly changing land-use areas. Therefore, Quercus represents a suitable forest taxon for examining broad-scale potential conflicts between projected habitat suitability shifts and human land-use patterns [6,7,8]. Previous studies have shown that changes in temperature and precipitation regimes may drive large-scale shifts in the climatically suitable habitats of wide-ranging forest taxa [9,10,11,12].
However, many species distribution assessments still focus primarily on climatic suitability and may insufficiently account for the spatial consequences of dynamic land-use change [13,14]. Recent methodological developments have attempted to address this limitation from different perspectives. Dispersal-constrained SDMs incorporate dispersal assumptions or migration limits to distinguish potentially accessible habitats from climatically suitable but unreachable areas. SDM–land-use coupling approaches combine habitat suitability projections with land-use or land-cover change scenarios to evaluate how human land transformation may alter future habitat availability. Resistance-surface and landscape connectivity models further assess movement cost, corridor accessibility, and landscape permeability across heterogeneous landscapes [15,16]. These approaches provide important tools for evaluating non-climatic constraints on species distribution shifts.
Nevertheless, broad-scale forest habitat assessments still rarely integrate future climatic suitability, dynamic land-use simulations, territorial spatial planning scenarios, and an explicit grid-scale classification of habitat–land-use conflict in a single scenario-based framework. In particular, existing dispersal or connectivity models are often designed to evaluate movement processes or corridor structure, whereas land-use scenario models focus on spatial allocation and transition dynamics. The specific gap addressed in this study is therefore not the absence of all non-climatic constraints in previous SDM studies, but the lack of a transparent framework that links projected climatic suitability with simulated future land-use categories under alternative territorial planning scenarios. In human-dominated landscapes, built-up land expansion and Cultivated Land Protection do not directly prove dispersal failure, but they can indicate areas where projected suitable habitats may be less likely to be realized or may face stronger land-use conflicts [17,18,19,20,21]. Therefore, rather than treating future habitat shifts as determined by climate alone, there is a need for a scenario-based spatial framework that identifies where projected climatic suitability overlaps with future land-use categories that may constrain habitat realization [22,23].
To address this gap, this study develops a spatiotemporal soft-coupling framework that links climatic niche projections with dynamic land-use simulations. Specifically, we combine MaxEnt-based habitat suitability modeling with PLUS-based land-use simulation and apply a Habitat–Land-Use Conflict Index (HLCI) to classify potential spatial relationships between projected suitable habitats and future land-use categories [24,25]. The HLCI was developed as an adaptation of land-use conflict and spatial overlay concepts for habitat–land-use assessment. Unlike conventional land-use conflict indices that mainly evaluate competing land-use functions, the HLCI focuses on whether projected climatically suitable habitats spatially coincide with land-use categories that may constrain habitat realization. Therefore, it should be interpreted as a scenario-based habitat–land-use conflict classification framework rather than as a general land-use conflict index or a dispersal-process model. Rather than directly simulating realized migration, dispersal failure, or corridor accessibility, this framework aims to identify where climatically suitable habitats may spatially overlap with built-up land or cultivated land under different SSP–LULC scenario combinations [26]. In this way, the framework provides a transparent scenario-based assessment of potential habitat–land-use conflicts at the grid scale [27,28].
The objectives of this study are therefore to: (1) project the potential shifts in Quercus climatically suitable habitats under different future climate scenarios; (2) simulate future land-use patterns under alternative territorial spatial planning scenarios; (3) identify potential spatial conflicts between projected suitable habitats and built-up or cultivated land across 16 coupled scenarios; and (4) discuss how these scenario-based conflict patterns may inform adaptive forest conservation and land-use planning.
2. Materials and Methods
2.1. Study Area and Target Species
China has a vast territory with diverse climate types, and precipitation generally decreases from the southeast to the northwest. This broad environmental gradient provides diverse climatic and habitat conditions for forest species. Quercus is widely distributed across China and includes many ecologically important oak taxa, which are important components of mixed forests and coniferous–broadleaved mixed forests.
The occurrence records of Quercus were obtained from the data in Table 1. Only records with the occurrence status of “PRESENT” and located within China were retained. To improve data quality, duplicate records, records with missing geographic coordinates, and records with uncertain coordinates were removed. After these filtering procedures, a total of 8675 valid Quercus occurrence records were retained for MaxEnt model construction. The spatial distribution of the occurrence records is shown in Figure 1.
Table 1.
Overview of data types and corresponding sources.
Figure 1.
Overview of the study area and geographical distribution records of Quercus in China.
2.2. Data Acquisition and Variable Selection
This study constructed a multidimensional comprehensive database containing climate, topography, human activity, and socioeconomic driving factors (2). Current climate data were sourced from WorldClim version 2.1 (1970–2000), encompassing 19 bioclimatic variables with a spatial resolution of 30″ (approximately 1 km2). Future climate data were simulated based on multiple sets of Shared Socioeconomic Pathways (SSPs) from the Coupled Model Intercomparison Project Phase 6 (CMIP6). Topographic factors (altitude, slope, aspect) were extracted based on a high-precision digital elevation model (DEM).
Future bioclimatic variables for the 2040s were obtained from CMIP6-based projections under SSP1-2.6, SSP2-4.5, SSP3-7.0, and SSP5-8.5. The period 2041–2060 was used to represent the 2040s to mid-century climatic conditions, and the climate layers were derived from the BCC-CSM2-MR global climate model at a spatial resolution of 30″.
Although the original bioclimatic variables from WorldClim had a spatial resolution of 30″, the final climate–land-use coupled spatial analysis was conducted at a unified resolution of 2 km × 2 km. To reduce inconsistencies in spatial scale among multi-source geographical datasets and to meet the computational requirements of national-scale modeling, the spatial data used for PLUS land-use simulation, including topographic, socioeconomic, accessibility, and land-use layers, were resampled to a unified spatial resolution of 2 km × 2 km. After the MaxEnt model generated habitat suitability maps for Quercus, the resulting suitability rasters were resampled and aligned to the same 2 km × 2 km grid as the PLUS land-use simulation outputs before HLCI overlay analysis. This resolution was adopted to ensure spatial consistency among different data layers and to support broad-scale comparison across the 16 climate–land-use coupled scenarios. Considering the large spatial extent of China and the uncertainty associated with future climate projections from CMIP6 global climate models (GCMs), a 2 km grid provides a practical compromise between spatial detail, data consistency, and computational efficiency [29]. Subsequently, all raster layers used for the final overlay analysis were aligned to the same spatial extent, coordinate system, and grid structure for pixel-level spatial overlay and map algebra analysis.
To reduce multicollinearity among climatic predictors, Pearson correlation analysis was conducted only for the 19 bioclimatic variables (BIO1–BIO19) (Table 2). The correlation heatmap (Figure 2) showed strong correlations among several temperature-related variables, such as BIO1, BIO5, BIO6, BIO8, BIO9, BIO10, and BIO11, as well as among precipitation-related variables, such as BIO12, BIO13, BIO16, and BIO18. In addition, BIO4 and BIO7 were highly correlated, and BIO14, BIO17, and BIO19 also showed strong correlations. Therefore, for variable pairs with high correlation coefficients (|r| ≥ 0.8), only one representative variable was retained based on ecological relevance and redundancy reduction. Finally, seven bioclimatic variables, including BIO2, BIO3, BIO4, BIO5, BIO13, BIO15, and BIO19, were retained for MaxEnt modeling.
Table 2.
Candidate bioclimatic variables used for Pearson correlation analysis.
Figure 2.
Correlation analysis of 19 bioclimatic variables.
2.3. Spatiotemporal Land-Use Simulation
The dynamic evolution of land use was simulated using the PLUS (Patch-generating Land-Use Simulation) model. The driving factors used in the LEAS (Land Expansion Analysis Strategy) module included DEM, slope, aspect, population density, distance to drainage, and distance to railroad. These factors were used to characterize the effects of topography, population distribution, and transportation or hydrological accessibility on land-use change.
To validate the simulation performance of the model, land-use data from 2003 and 2013 were used to simulate the land-use pattern in 2023, and the simulated result was compared with the observed land-use map of 2023. For the multi-scenario simulation, land-use data from 2013 and 2023 were used to calculate the expansion intensity of each land-use type. The expansion intensity was then standardized according to the actual land-use conditions of the study area to obtain the neighborhood weight parameters. In the Cellular Automata based on Random Seeds (CARS) module, the patch generation threshold was set to the default value of 0.2, the patch expansion coefficient was set to 0.1, and the seed percentage was set to 0.1. The land-use demand of each category was predicted using the Markov chain model. The land-use categories included cultivated land, forestland, grassland, water area, built-up land, and unused/barren land. Here, unused land refers to unused/barren land, mainly including bare or sparsely vegetated land surfaces, and does not refer to uncultivated or fallow cropland. The neighborhood weights and scenario-specific conversion cost matrices are provided in Table 3 and Table 4. In the conversion cost matrix, a value of 1 indicates that conversion from the row land-use type to the column land-use type is allowed, whereas a value of 0 indicates that the conversion is restricted.
Table 3.
Neighborhood weight settings.
Table 4.
Conversion cost matrices under different land-use scenarios for 2023–2043.
Four land-use scenarios were designed in this study: Natural Development, Cultivated Land Protection, Ecological Protection, and Urban Expansion.
Under the Natural Development scenario, factors such as various policies and regulations, land-use planning, and urban development planning were not considered.
Under the Cultivated Land Protection scenario, emphasis was placed on the protection of stable cultivated land and high-quality cultivated land in China. The cultivated land layers from 2003, 2013, and 2023 were overlaid, and the areas that were cultivated land in all three years were extracted as long-term stable cultivated land in China. Meanwhile, with reference to the Regulations for Gradation on Agricultural Land Quality and previous studies, cultivated land with a slope of less than 6° was extracted as high-quality cultivated land. The stable cultivated land and high-quality cultivated land were then merged and used as restricted conversion areas. In addition, based on the linear development scenario and with reference to related studies, the Markov transition probability matrix was modified. The probability of conversion from cultivated land to built-up land was reduced by 70%, the probabilities of conversion from cultivated land to grassland and water areas were reduced by 40%, and the probability of conversion from unused land to cultivated land was increased by 50%, so as to strictly implement the Cultivated Land Protection policy.
Under the Urban Expansion scenario, due to the past influence of development goals prioritizing economic growth, urbanization and industrialization in China advanced rapidly. In many areas, urban construction land expanded in a disorderly manner, continuously squeezing agricultural production space and ecological space, and inducing a series of land-use conflict phenomena. Based on the linear development scenario, this scenario reduced the probability of conversion from built-up land to cultivated land, water areas, forestland, grassland, and unused land by 40%. Meanwhile, the probabilities of conversion from cultivated land, forestland, grassland, water areas, and unused land to built-up land were increased by 40%, 10%, 20%, 10%, and 50%, respectively.
Under the Ecological Protection scenario, this scenario was based on China’s “three zones and three lines” territorial spatial control system, the Yangtze River Protection Law, the Wetland Protection Law, and the Ecological Protection redline management system, with the aim of implementing the priority protection requirements for ecological space. Limited by the availability of research data, this scenario incorporated nature reserves as restricted conversion areas on the basis of the linear development scenario. The probabilities of conversion from forestland and grassland to built-up land were reduced by 20%, the probability of conversion from water areas to built-up land was reduced by 40%, and the probability of conversion from water areas to cultivated land was increased by 30%. In addition, the probability of conversion from cultivated land to built-up land was reduced by 30%, and the probability of conversion from unused land to built-up land was increased by 40%. The probability of conversion from built-up land to grassland was increased by 10%, so as to simulate the land-use pattern under the condition of balancing Ecological Protection and economic development.
2.4. Habitat Suitability Modeling Under Climate Change
The MaxEnt model was used to evaluate the potential habitat suitability of Quercus under current and future climate scenarios. Because this study aimed to assess broad-scale habitat–land-use conflict patterns at the genus level, all available Quercus occurrence records were pooled for MaxEnt modeling. Therefore, the modeling results represent aggregated genus-level potential habitat suitability rather than species-specific habitat predictions. The retained bioclimatic variables and non-climatic environmental predictors, including the digital elevation model (DEM), slope, aspect, and human footprint index, were jointly included in the MaxEnt modeling. These selected environmental predictors and filtered Quercus occurrence records were imported into MaxEnt after format conversion. The model was run using logistic output, with a maximum iteration number of 1000. A random 75% of occurrence records were used for model training, and the remaining 25% were used for model testing. The model was repeated 10 times, and other parameters were kept as MaxEnt default settings, including automatic feature classes, a regularization multiplier of 1, and the default background-point setting.
Model performance was evaluated using the area under the receiver operating characteristic curve (AUC). The continuous suitability outputs ranging from 0 to 1 were imported into ArcGIS 10.8 and reclassified into four habitat suitability levels using the natural breaks classification method. Four future climate scenarios under the CMIP6 framework, including SSP1-2.6, SSP2-4.5, SSP3-7.0, and SSP5-8.5, were used for future habitat suitability projections.
2.5. Dynamic Coupling Framework and Spatial Conflict Metrics
Although SSPs include socioeconomic assumptions, this study used SSP1-2.6, SSP2-4.5, SSP3-7.0, and SSP5-8.5 only to provide future bioclimatic variables for MaxEnt projection. The four PLUS-based land-use scenarios were designed as policy-oriented planning scenarios, namely Natural Development, Cultivated Land Protection, Ecological Protection, and Urban Expansion. Thus, the 4 × 4 scenario combinations were used as an exploratory factorial design to compare potential Quercus habitat–land-use conflicts under different climate and land-use assumptions, rather than as internally coupled official SSP land-use trajectories.
To identify potential spatial conflicts between projected climatic suitability and future land-use patterns, this study applied the Habitat–Land-Use Conflict Index (HLCI) as a categorical spatial classification framework. In this study, the term “index” refers to a rule-based categorical indicator of habitat–land-use conflict states rather than a continuous numerical value of conflict intensity. The HLCI was implemented through pixel-scale map algebra by overlaying the binarized current and future Quercus habitat suitability maps generated by MaxEnt with the future land-use matrix simulated by PLUS.
The following expression provides a simplified representation of the pixel-scale overlay operation used for HLCI classification:
where Ω represents the total spatial pixel set of the study area; p represents a specific spatial pixel; represents the climatic suitable state of Quercus for pixel p under the 2040s future climate scenario (1 for suitable habitat, 0 for non−suitable habitat); represents the 2040s land-use type pixel value simulated by the PLUS model.
After spatial alignment, each grid cell was assigned to only one mutually exclusive HLCI category according to Table 5. Current suitable areas that became unsuitable in the future were treated as habitat loss rather than land-use conflict. Future suitable areas overlapping with built-up land or cultivated land were classified as urban-encroached habitat or agriculture-limited habitat, respectively. Forestland and grassland were regarded as relatively less restrictive land-use backgrounds because they generally represent natural or semi-natural vegetation cover, but they were not considered universally suitable habitats for all Quercus species. In contrast, built-up land and cultivated land were treated as potentially restrictive land-use types because they are generally associated with stronger human land-use intensity, impervious surfaces, agricultural management, and land-use conversion constraints.
Table 5.
Classification logic matrix of spatial states for the Habitat–Land-Use Conflict Index (HLCI).
Unlike conventional land-use conflict indices, which mainly evaluate incompatibility among different land-use functions, the HLCI used here focuses on the spatial relationship between projected suitable habitats and land-use categories that may constrain habitat realization. It should therefore be interpreted as a scenario-based classification tool rather than a mechanistic model of species dispersal, movement cost, or landscape connectivity.
2.6. Methodological Roadmap
To illustrate the climate–land-use coupled framework used in this study, a methodological roadmap was constructed (Figure 3). The framework consists of four main steps. First, Quercus occurrence records and environmental predictors were prepared for MaxEnt modeling, while the spatial data used for PLUS land-use simulation were standardized to a unified 2 km × 2 km grid. Second, MaxEnt was used to project Quercus habitat suitability under current and future bioclimatic conditions, and the PLUS model was used to simulate future land-use patterns under four policy-oriented planning scenarios. Third, the MaxEnt habitat suitability outputs were resampled and aligned to the same 2 km × 2 km grid as the PLUS land-use outputs, and the two types of spatial outputs were combined under 16 exploratory climate–land-use scenario combinations. Finally, the HLCI classification matrix was applied to identify potential spatial overlaps between projected suitable habitats and future land-use categories, including stable habitat, habitat expansion, urban-encroached habitat, and agriculture-limited habitat. This framework provides broad-scale screening information on potential habitat–land-use conflicts, rather than direct evidence of species dispersal pathways, landscape connectivity, movement cost, or habitat fragmentation.
Figure 3.
Roadmap of methodology used in present study.
3. Results
3.1. Robustness of the Coupled Simulation Framework
The robustness of the climate–land-use coupled framework was assessed by evaluating the performance of the MaxEnt and PLUS models separately. For the MaxEnt model, the AUC values were 0.900, 0.896, 0.900, 0.897, and 0.889 under the SSP1-2.6, SSP2-4.5, SSP3-7.0, SSP5-8.5, and current climate scenarios, respectively (Figure 4). The AUC values ranged from 0.889 to 0.900, with a mean value of 0.896, indicating generally good discriminatory ability for identifying the potential habitat suitability of Quercus. These results suggest that the MaxEnt model provides a reasonable basis for subsequent habitat suitability projection. However, because the evaluation was based on random training–testing partitioning rather than fully independent spatial validation, the AUC values should be interpreted as internal model performance indicators.
Figure 4.
Average AUC values of the MaxEnt model under SSP126 (a), SSP245 (b), SSP370 (c), SSP585 (d), and current (e) climate scenarios.
For the PLUS model, simulation performance was evaluated using historical back-casting validation. Specifically, land-use data from 2003 and 2013 were used to simulate the 2023 land-use pattern, and the simulated result was compared with the observed 2023 land-use map. The validation results are summarized in Table 6. The Kappa coefficient was 0.752, the FoM (Figure of Merit) value was 0.031, and the overall accuracy was 0.82. In addition, the LEAS fitting results showed RMSE (root mean square error) values of 0.0486–0.1851 and OOB RMSE (out-of-bag root mean square error) values of 0.1373–0.5263 across the six land-use types. These results suggest that the PLUS model can reasonably reproduce broad-scale land-use patterns, although the relatively low FoM indicates uncertainty in the simulation of changed areas.
Table 6.
Historical back-casting validation results of the PLUS model.
3.2. Spatiotemporal Patterns of Current Spatial Conflicts Between Quercus Habitats and Land Use
Through an overlay analysis of the current distribution of Quercus suitable habitats (Figure 5a) and land-use patterns (Figure 5b), this study quantified their spatial overlap status. As shown in the spatial distribution in Figure 5c,d, the highly and moderately suitable habitats for Quercus in China are primarily concentrated in East, Central, South, and Southwest China. Through quantitative statistics, the total area of the current highly suitable habitat for Quercus is calculated to be 14.91 × 10⁴ km2, and the moderately suitable habitat is 181.61 × 10⁴ km2 (Table 7).
Figure 5.
Current spatial conflict patterns between Quercus habitat suitability and land use. (a) Current climatically suitable habitat distribution of Quercus; (b) Current spatial distribution of land-use types; (c) Overlap pattern between land use and Quercus moderately suitable habitat (M); (d) Overlap pattern between land use and Quercus highly suitable habitat (H) (note: in subplots (c,d), “M” represents moderately suitable habitat and “H” represents highly suitable habitat; unsuitable and low-suitability areas have been masked to highlight core habitat conflicts).
Table 7.
Spatial overlap area and proportion of various land-use types within the current highly and moderately suitable habitats for Quercus.
The land-use composition within the suitable habitats reveals varying degrees of human infiltration. In the highly suitable habitat, the forestland area is 8.92 × 10⁴ km2, accounting for 59.78%; while cultivated land occupies 3.28 × 10⁴ km2, accounting for 22.02%. Meanwhile, built-up land occupies 1.97 × 10⁴ km2 in the highly suitable habitat, accounting for 13.22%. In the moderately suitable habitat, the proportion of forestland is 63.91% (116.07 × 10⁴ km2), cultivated land is 25.76% (46.78 × 10⁴ km2), and built-up land is 5.22% (9.49 × 10⁴ km2). The overall spatial pattern exhibits a characteristic of high overlap between the Quercus climatically suitable habitats and high-intensity human utilization spaces (cultivated land and built-up land).
3.3. Spatiotemporal Evolution of Quercus Habitats and Land Use Under Future Climate Scenarios
The macroscopic evolution of land-use patterns and the climate-driven migration of suitable habitats jointly constitute a dual constraint limiting the future living space of Quercus. Combining the prediction charts under different scenarios in the 2040s, it can be seen that, by the 2040s, the climatic niche migration trajectory of Quercus and the development trajectory of human land use will exhibit significant characteristics of divergence and intersection.
3.3.1. Spatiotemporal Changes in Quercus Habitats Under Future Climate Scenarios
Driven by different Shared Socioeconomic Pathways (SSPs) in the 2040s, the spatial distribution of climatically suitable habitats for Quercus in China exhibits obvious geographical displacement and hierarchical structure differentiation. Under the relatively mild low-to-medium emission pathways (SSP1-2.6 and SSP2-4.5) (Figure 6a,b), the spatial evolution trend of suitable habitats is relatively gentle, and their core habitats are widely distributed in East, Central, and Southwest China; among them, provinces such as Yunnan, Guizhou, eastern Sichuan, Hunan, Jiangxi, Zhejiang, and Fujian maintain large areas of moderately and highly suitable habitats with good spatial connectivity.
Figure 6.
Spatial distribution patterns of the climatically suitable habitat for Quercus in China under different climate scenarios in the 2040s. (a) SSP1-2.6, (b) SSP2-4.5, (c) SSP3-7.0, (d) SSP5-8.5.
With the significant increase in greenhouse gas emission concentrations (SSP3-7.0 and SSP5-8.5 scenarios) (Figure 6c,d), the advancing boundaries of the suitable habitats undergo significant spatial drift, overall showing a trend of expansion towards high latitudes (northward) and high altitudes (westward). In the northern (high-latitude) expansion areas, the advancing boundaries of suitable habitats cross traditional geographical boundaries, with large newly added areas appearing in the North China Plain (Hebei, Shandong, Shanxi) and Northeast China (Liaoning, Jilin, southern Heilongjiang, and the eastern edge of Inner Mongolia), among which the Liaodong Peninsula and Shandong Peninsula are locally upgraded to highly suitable habitats. In the western (high-altitude) regions, the moderately and highly suitable habitats climb along the Hengduan Mountains and the eastern edge of the Qinghai–Tibet Plateau, with the suitable area significantly increasing in western Sichuan, southeastern Tibet, southern Gansu, and the Qinling Mountains in Shaanxi.
Contrary to the expansion trend in the north and western inland, the area of moderately and highly suitable habitats in the low-latitude traditional distribution regions experiences varying degrees of contraction and fragmentation. Under the extreme high-emission SSP5-8.5 scenario, in low-latitude areas such as Guangdong, most of Guangxi, the coast of Fujian, and the southern edges of Hunan and Jiangxi, the original highly suitable habitat patches exhibit severe fragmentation characteristics and experience large-scale hierarchical downgrading spatially, locally even transforming into non-suitable habitats.
3.3.2. Spatiotemporal Changes in Land Use Under Future Scenarios
Meanwhile, driven by different management policies, land-use patterns exhibit obvious directional differentiation in their spatiotemporal evolution (Table 8, Figure 7 and Figure 8). As shown in Figure 7, the span and direction of the connecting lines between the current baseline (hollow dots) and future predictions (solid dots) intuitively reveal the intense degree of this land resource replacement.
Table 8.
Area changes in various land-use types under current and future (2040s) different scenarios.
Figure 7.
Evolution characteristics and spatial responses of land-use patterns driven by multiple scenarios in the 2040s. White hollow circles with gray outlines indicate the current baseline, blue solid circles indicate projected land-use expansion in the 2040s, and red solid circles indicate projected land-use contraction in the 2040s. The connecting line between the baseline and forecasted values represents the magnitude of land-use change. A rightward shift indicates area expansion, whereas a leftward shift indicates area contraction.
Figure 8.
Spatial predictions of land use under multiple scenarios in the 2040s.
Under the Ecological Protection scenario, the best ecological restoration efficacy is demonstrated. The dumbbell chart shows that both forestland and grassland exhibit a significant positive expansion trajectory, with the forestland area expanding to 2,855,722.25 km2 (+2.0%), whereas the cultivated land area, which has strong interference attributes, experiences the longest negative retreat, being drastically reduced to 1,170,672.15 km2 (−8.0%). This “returning farmland to forest”-style structural optimization maximally mitigates human habitat encroachment, providing the most open ecologically permissive space for Quercus to cope with climate change.
In contrast, under the Urban Expansion scenario, absolutely irreversible impervious surfaces spread rapidly. From the built-up land facet of the dumbbell chart, an extreme rightward mutation can be clearly seen, with its total area surging by 23.0% compared to the current baseline, skyrocketing to 636,386.59 km2. This rapid urbanization process constructs severe physical barriers spatially, and dense built-up land patches will severely fragment the possible natural migration pathways of species.
Under the Cultivated Land Protection scenario, restricted by the rigid requirement of strictly observing the cultivated land redline, the prediction point representing cultivated land in the dumbbell chart significantly surpasses the current baseline point (+6.4%), and the area is locked at a high level of 1,353,828.28 km2. This macro-orientation forms continuous agricultural matrix barriers spatially, inevitably resulting in intense spatial competition and habitat lock-in with the potential natural habitats of Quercus.
Under the Natural Development scenario, the spans of the dumbbell connecting lines for all land types are relatively short. Among them, built-up land continues the historical trend of natural spread (+3.5%) to 535,799.59 km2, overall maintaining a medium-intensity habitat encroachment trend.
3.4. Multi-Scenario Compound Distribution Pattern Simulation Based on the Habitat–Land-Use Conflict Index (HLCI)
To deeply disentangle the dual pressures of future climate change and human activities on Quercus habitats, this study, by constructing the “Habitat–Land-Use Conflict Index” (HLCI), classified the spatial evolution of suitable habitats under 16 interactive scenarios into four core states: stable suitable habitat (stable), newly expanded suitable habitat (expansion), built-up land encroached area (urban-encroached), and cultivated land limited area (agri-limited).
3.4.1. Spatial Distribution Characteristics Under 16 Interactive Scenarios
By deeply spatially coupling the Quercus suitable habitats driven by four climate emission pathways (SSP1-2.6 to SSP5-8.5) with four territorial spatial land-use evolution scenarios, this study quantitatively extracted the habitat overlap patterns and area data under 16 interactive combinations (Figure 9, Figure 10, Figure 11 and Figure 12).
Figure 9.
Comparative analysis of spatial conflicts for Quercus suitable habitats across multiple climate pathways under the Urban Expansion scenario in the 2040s. (a) SSP1-2.6; (b) SSP2-4.5; (c) SSP3-7.0; (d) SSP5-8.5. The bar charts represent the total overlapping area (km2) between suitable habitats and specific land-use types, while the donut charts display the corresponding area proportions.
Figure 10.
Comparative analysis of spatial conflicts for Quercus habitats across multiple climate pathways (SSPs) under the Cultivated Land Protection scenario in the 2040s. (a) SSP1-2.6; (b) SSP2-4.5; (c) SSP3-7.0; (d) SSP5-8.5. The bar charts represent the total overlapping area (km2) between suitable habitats and specific land-use types, while the donut charts display the corresponding area proportions.
Figure 11.
Comparative analysis of spatial conflicts for Quercus habitats across multiple climate pathways (SSPs) under the Ecological Protection scenario in the 2040s. (a) SSP1-2.6; (b) SSP2-4.5; (c) SSP3-7.0; (d) SSP5-8.5. The bar charts represent the total overlapping area (km2) between suitable habitats and specific land-use types, while the donut charts display the corresponding area proportions.
Figure 12.
Comparative analysis of spatial conflicts for Quercus habitats across multiple climate pathways (SSPs) under the Natural Development scenario in the 2040s. (a) SSP1-2.6; (b) SSP2-4.5; (c) SSP3-7.0; (d) SSP5-8.5. The bar charts represent the total overlapping area (km2) between suitable habitats and specific land-use types, while the donut charts display the corresponding area proportions.
To improve the interpretation of the coupled results, the following analysis distinguishes three components: climate-driven changes in projected Quercus suitable habitats derived from MaxEnt, land-use-driven changes in future land-use patterns simulated by PLUS, and the spatial interaction between these two components represented by the HLCI. Therefore, changes in habitat–land-use conflict areas should be interpreted as the result of spatial overlap between projected suitable habitats and future land-use categories, rather than as the effect of climate change or land-use change alone.
- (1)
- Spatial characteristics of habitat overlap under the Urban Expansion scenario
Under the interaction of the Urban Expansion scenario and different Shared Socioeconomic Pathways (SSPs) (Figure 9), the spatial distribution of Quercus suitable habitats exhibits non-linear fluctuation characteristics. Quantitative spatial overlay results show that forestland maintains the largest scale of spatial overlap with suitable habitats across all climate pathways, with overlap areas of 1,134,004.04 km2, 1,146,897.33 km2, 1,052,808.31 km2, and 1,240,808.36 km2 under the SSP1-2.6, SSP2-4.5, SSP3-7.0, and SSP5-8.5 pathways, respectively.
In contrast, the overlap area of non-ecologically permissive land (cultivated land and built-up land) on suitable habitats shows a trend of initial contraction followed by a rebound as emission concentrations increase. Under the low-emission SSP1-2.6 pathway, the spatial overlap areas of cultivated land and built-up land are 315,659.96 km2 and 56,476.76 km2, respectively; moving to the medium-high emission SSP3-7.0 pathway, the two phase-wise converge to 294,182.36 km2 and 50,445.51 km2, respectively. However, under the extreme SSP5-8.5 pathway, the conflict areas of all land types simultaneously rebound to their global peaks, where the overlap areas of built-up land and cultivated land surge to 58,959.26 km2 and 340,882.61 km2, respectively.
- (2)
- Spatial characteristics of habitat overlap under the Cultivated Land Protection scenario
Under the Cultivated Land Protection scenario, agricultural production space constitutes the main non-ecological land-use type that spatially overlaps with Quercus suitable habitats. Data indicate that forestland still occupies the largest spatial share of the suitable habitats, with its overlap area fluctuating between 1,057,277.63 km2 (SSP3-7.0) and 1,247,319.13 km2 (SSP5-8.5) (Figure 10). From the perspective of spatial encroachment by non-ecologically permissive land, the spatial occupation of suitable habitats by cultivated land is significantly higher under all climate pathways than in other land-use scenarios. Under the SSP1-2.6 pathway, the spatial overlap area between cultivated land and suitable habitats reaches as high as 338,322.86 km2, while the built-up land area is controlled at 39,096.77 km2. As the emission pathways progress to SSP2-4.5 and SSP3-7.0, the overlap areas of cultivated land and built-up land experience a phase-wise decline, dropping to phase-wise troughs of 303,458.72 km2 and 34,101.04 km2, respectively. However, under the extreme high-emission SSP5-8.5 pathway, spatial overlap intensifies again, with the cultivated land overlap area soaring to a historical peak of 364,189.12 km2, and the built-up land conflict area simultaneously rebounding to 40,564.45 km2. This rebound can be interpreted as the result of the spatial interaction between climate-driven habitat redistribution and land-use constraints. Under SSP5-8.5, the projected suitable habitats of Quercus expand or shift into areas where cultivated land and built-up land also remain widely distributed. Therefore, the increase in overlap area does not indicate the effect of climate change or land-use change alone, but reflects the coupled spatial relationship between newly suitable habitats and non-ecological land-use categories.
- (3)
- Spatial characteristics of habitat overlap under the Ecological Protection scenario
Under the interaction of the Ecological Protection scenario and different climate pathways, the spatial infiltration of non-ecological land into Quercus suitable habitats receives significant global containment. Quantitative data show (Figure 11) that under this scenario, land types such as forestland and grassland provide broader and more continuous ecologically permissive spaces for Quercus. From the SSP1-2.6 to SSP5-8.5 pathways, the overlap area between forestland and suitable habitats not only maintains absolute dominance but also reaches the highest value among all 16 combination scenarios at 1,270,853.06 km2 under the extreme SSP5-8.5 pathway, with the grassland overlap area simultaneously reaching a maximum of 302,435.51 km2. Meanwhile, the overlap areas of built-up land and cultivated land on suitable habitats are 39,115.79 km2 and 293,424.76 km2 respectively under the SSP1-2.6 pathway, and are further reduced under medium-high emission pathways (e.g., under the SSP2-4.5 pathway, cultivated land drops to a global trough of 259,164.13 km2). Although the overlap areas of both rebound to 40,590.69 km2 and 313,538.47 km2 respectively under the SSP5-8.5 pathway, a horizontal comparison with the other three land-use scenarios shows that the non-ecological land overlap area under the Ecological Protection scenario remains stably at the global lowest level.
- (4)
- Spatial characteristics of habitat overlap under the Natural Development scenario
The Natural Development scenario, which continues the historical evolution trajectory, objectively demonstrates the baseline overlap characteristics of the spatial distribution of Quercus suitable habitats. Overlay data indicate (Figure 12) that the forestland overlap area under this scenario transitions between 1,052,312.88 km2 (SSP3-7.0) and 1,241,774.80 km2 (SSP5-8.5) as emission concentrations change, and its overall evolution trend is highly isomorphic with other scenarios. From the perspective of the overlap patterns of non-ecological land types, their area evolution similarly follows a non-linear rule of initially decreasing and then increasing: under the mild SSP1-2.6 pathway, the conflict areas of cultivated land and built-up land are 311,836.13 km2 and 50,201.00 km2, respectively; under the SSP3-7.0 pathway, the two converge to 290,078.39 km2 and 44,321.23 km2, respectively; and under the extreme SSP5-8.5 pathway, due to drastic changes in the extent of suitable habitats, the overlap areas of cultivated land and built-up land rebound significantly to 334,475.87 km2 and 52,607.46 km2, respectively. A horizontal comparison shows that all spatial conflict indicators under the Natural Development scenario fall between those of the Urban Expansion and Ecological Protection scenarios.
3.4.2. Evolution Dynamics of Spatial Conflicts Based on HLCI
The HLCI results further reveal how projected Quercus suitable habitats spatially interact with future land-use patterns under the 16 coupled scenarios. In this section, stable habitat and habitat expansion mainly reflect climate-driven suitability changes, whereas urban-encroached and agriculture-limited habitats represent the overlap between future suitable habitats and built-up or cultivated land. Therefore, the HLCI results should be interpreted as scenario-based spatial interaction patterns rather than direct evidence of realized migration obstruction. A summary of the climate-driven suitability changes, land-use-driven constraints, and their coupled spatial interaction in the HLCI results is provided in Table 9. The coupled relationship among climate-driven habitat evolution, land-use constraints, and HLCI conflict categories is further summarized in Figure 13.
Table 9.
Statistics of habitat evolution and multidimensional conflict characteristics of Quercus based on HLCI under 16 interactive scenarios.
Figure 13.
Spatial conflict patterns and trade-off analysis of Quercus habitats based on the Habitat–Land-Use Conflict Index (HLCI). (A–D) display the geographical distribution patterns of habitat spatial evolution and land-use conflicts under four representative interactive scenarios; (E) illustrates the trade-off analysis between ecological benefits (realized expansion area on the x-axis) and spatial conflicts (total conflict area on the y-axis). The dashed lines divide the quadrants to evaluate policy efficacy, such as “Win–Win” and “Lose–Lose” zones; (F) shows the composition of the ultimate spatial fates of potential newly expanded habitats across the 16 interactive combinations, reflecting the proportion of actual expansion versus areas encroached or limited by human land uses.
- (1)
- Urban-encroached habitat under different climate–land-use scenarios
The built-up land encroachment conflict (urban-encroached) represents the spatial overlap between projected future suitable habitats and built-up land at the grid scale. Quantitative simulation results show that this conflict type was generally more pronounced under the Urban Expansion scenario than under the other land-use scenarios. Under SSP1-2.6, the urban-encroached area under the Urban Expansion scenario reached 56,476.75 km2. Under SSP5-8.5, the urban-encroached area was 52,607.33 km2 under the Natural Development scenario and reached the highest value of 58,959.18 km2 under the Urban Expansion scenario. In contrast, the urban-encroached area under the Cultivated Land Protection and Ecological Protection scenarios remained relatively lower across the climate pathways, ranging approximately from 3.6 × 10⁴ to 4.0 × 10⁴ km2. These results indicate that built-up land conflict was mainly associated with the spatial overlap between projected suitable habitats and future built-up land patterns, particularly under the Urban Expansion scenario.
- (2)
- Agriculture-limited habitat under different climate–land-use scenarios
The cultivated land limitation conflict (agri-limited) was the dominant type of potential habitat–land-use conflict in terms of area. This category was defined as the spatial overlap between projected future suitable habitats and cultivated land. Therefore, changes in the agri-limited area can result from both the expansion or redistribution of projected suitable habitats and the persistence or conversion of cultivated land under different land-use scenarios.
The agri-limited area was highest under the Cultivated Land Protection scenario. Under SSP1-2.6, the area of projected suitable habitats overlapping with cultivated land reached 338,321.88 km2. Under SSP5-8.5, this area increased to 364,188.86 km2 under the Cultivated Land Protection scenario. This increase was mainly associated with the climate-driven expansion and redistribution of projected suitable habitats under SSP5-8.5, which increased the probability that future suitable habitats would overlap with existing or retained cultivated land. Land-use change further modulated this pattern by determining whether cultivated land persisted in areas where future suitable habitats were projected. Therefore, the increase in agri-limited habitat under SSP5-8.5 should be interpreted primarily as a result of increased spatial overlap driven by habitat expansion and redistribution, with land-use patterns acting as an additional modifying factor. Even under the Natural Development scenario, the agri-limited area remained relatively high under SSP5-8.5, reaching 334,475.70 km2.
- (3)
- Potential conflict reduction under the Ecological Protection scenario
Comparison among the four land-use scenarios shows that the Ecological Protection scenario reduced the potential overlap between projected suitable habitats and non-ecological land-use types compared with more development-oriented scenarios. Under SSP5-8.5, the expansion category under the Ecological Protection scenario reached 467,551.57 km2, while the urban-encroached and agri-limited areas were 40,590.56 km2 and 313,538.18 km2, respectively. Compared with the Urban Expansion and Cultivated Land Protection scenarios under the same climate pathway, the Ecological Protection scenario showed a lower overall level of potential land-use conflict. This suggests that Ecological Protection-oriented land-use planning may help buffer potential habitat–land-use conflicts at the grid scale, although these results represent scenario-based spatial overlaps rather than direct evidence of realized habitat establishment or migration outcomes.
4. Discussion
By constructing a macro-scale climate–land-use coupled simulation framework, this study examined the spatial interactions between climate-driven habitat suitability shifts and future land-use patterns for Quercus in China. The results indicate broad-scale changes in projected Quercus habitat suitability under future climate scenarios and estimate the extent to which these projected suitable areas overlap with built-up land and cultivated land under alternative land-use planning scenarios. Therefore, the HLCI results should be interpreted as a scenario-based assessment of potential habitat–land-use conflicts, rather than as direct evidence of realized migration failure, dispersal limitation, or ecological corridor disruption.
Compared with climate-only SDM studies, the MaxEnt–PLUS–HLCI framework used here further considers whether projected suitable habitats coincide with future land-use categories that may constrain habitat realization. This is consistent with previous SDM–LULC studies showing that climate-driven range shifts may be overestimated when future land-use dynamics are ignored. However, unlike landscape connectivity or resistance-surface models, the present framework does not estimate dispersal probability, movement cost, or corridor accessibility. Its main contribution is to provide a broad-scale spatial screening of where future habitat suitability may conflict with land-use patterns under different climate–land-use scenarios.
4.1. Spatial Reshaping of Suitable Habitats Driven by Climate Warming and Its Ecological Mechanisms
The macroscopic geographical reshaping pattern of “northward expansion, southward retreat, and westward climbing” exhibited by Quercus habitats under future climate scenarios suggests that climate warming may substantially reshape the distribution of climatically suitable habitats for broadleaved forest taxa in China [30,31]. From the perspective of biological and meteorological mechanisms, this large-scale spatial shift may be associated with the combined effects of heat limitation release in northern and high-elevation regions and increasing heat–drought stress in some southern low-latitude regions [32]. In the baseline period, traditional suitable habitats in East and South China generally show favorable hydrothermal conditions and also coincide with regions of intensive human activities. This spatial overlap between high climatic suitability and intensive land use provides an important background for understanding future habitat–land-use conflict patterns.
In the habitat expansion areas at high latitudes and high elevations, the projected northward and westward expansion of suitable habitats may be related to the relaxation of low-temperature constraints [33,34,35]. For a long time, cold climatic conditions in Northeast China and low-temperature conditions in high-elevation regions, such as the eastern edge of the Qinghai–Tibet Plateau and the Hengduan Mountains, have limited the potential establishment of broadleaved trees [36,37]. Under future warming, winter low-temperature constraints in these regions may be reduced, and accumulated temperature conditions may become more favorable. This mechanism may help explain why potential suitable habitats are projected to increase in regions such as the North China Plain, southern Heilongjiang, and southeastern Tibet under high-emission scenarios [38]. In contrast, the projected decline of suitable habitats in some southern low-latitude regions may be associated with increasing compound heat–drought stress [39]. Traditional southern distribution areas, such as Guangdong, Guangxi, and the coastal areas of southern Fujian, are already located in relatively warm climatic zones [40]. Under high-emission scenarios, further warming may push some areas closer to or beyond the thermal and moisture conditions suitable for Quercus growth, potentially affecting photosynthesis, dry matter accumulation, and water balance [41]. Combined with uneven seasonal precipitation, increased heat stress may reduce climatic suitability in some low-latitude habitats [42].
4.2. Potential Habitat–Land-Use Constraints Associated with Human Land-Use Patterns
In the spatiotemporal evolution of multiple future scenarios, the overlap between projected suitable habitats and human land-use categories indicates potential constraints on habitat realization [43,44]. Under the Urban Expansion scenario and high-emission climate pathways, up to 58,959.18 km2 of projected suitable habitats overlap with built-up land. This quantified overlap indicates that a climate-only MaxEnt projection would identify these areas as climatically suitable, whereas the HLCI overlay further classified them as potential habitat–land-use conflict areas; therefore, the possible overestimation refers to unconstrained suitable habitat availability rather than realized adaptation potential.
From the perspective of landscape ecology, built-up land may reduce the availability of continuous land-use backgrounds for habitat realization, although habitat fragmentation and corridor accessibility were not directly quantified in this study. Because this study is based on scenario simulation and spatial overlay, urban-encroached habitats should be interpreted as potential conflict areas rather than direct evidence of dispersal failure or corridor disruption. Spatial overlap with built-up land alone cannot determine realized migration failure, because actual migration and establishment may also depend on seed dispersal capacity, animal-mediated dispersal, soil conditions, microclimate, local habitat quality, and management interventions. Further landscape connectivity or resistance-surface analyses would be needed to evaluate movement cost, corridor accessibility, and functional habitat connectivity.
Compared with built-up land, cultivated land represents a broader but more heterogeneous potential land-use constraint in the HLCI framework [45]. As the projected climatically suitable areas of Quercus shift towards higher-latitude plains, such as the North China Plain and the southern edge of the Northeast Plain, some newly suitable areas are projected to spatially overlap with regions dominated by cultivated land. Under the Cultivated Land Protection scenario, the area of overlap between projected suitable habitats and cultivated land reaches 36.42 × 10⁴ km2, accounting for approximately 22–25% of the projected suitable habitat area across the corresponding scenarios. This result indicates a potential habitat–land-use conflict under the scenario assumptions, rather than direct evidence of realized dispersal failure or an absolute agricultural barrier. These spatial overlap patterns suggest that Cultivated Land Protection may constrain the realization of some newly suitable habitats in high-latitude plains. However, agriculture-limited habitats should be interpreted as a potential constraint under scenario assumptions, rather than as direct evidence that cultivated land prevents actual dispersal or establishment of Quercus. The ecological permeability of cultivated land may vary across cropland types, orchards, agroforestry systems, and local management conditions; therefore, cultivated land should not be regarded as an absolute barrier to Quercus establishment. More broadly, these findings indicate that climate-only habitat suitability assessments may overestimate the spatial availability of future suitable habitats when dynamic land-use patterns are not considered. Thus, the HLCI results should be understood as a scenario-based identification of potential habitat–land-use conflicts, rather than direct evidence of actual dispersal pathway obstruction or realized migration failure.
In contrast, the Ecological Protection scenario showed a relatively lower level of potential habitat–land-use conflict compared with the Urban Expansion and Cultivated Land Protection scenarios [46]. By increasing forest and grassland areas and reducing the expansion of non-ecological land uses, this scenario reduced the spatial overlap between projected Quercus suitable habitats and built-up or cultivated land under high-emission pathways. It also produced the largest area of potentially realizable habitat expansion among the 16 scenario combinations, reaching 467,551.57 km2. These results suggest that coordinated land-use planning and ecological structure optimization may help reduce potential spatial conflicts between future habitat suitability shifts and human land-use expansion. However, this interpretation remains based on scenario-based spatial overlap analysis and should not be considered direct evidence of realized migration success or ecological buffering mechanisms.
4.3. Conservation Strategies and Spatial Planning Implications for Dynamic Niches
Future climate-driven shifts in projected suitable habitats may challenge conservation planning that relies only on static protected-area boundaries. As some suitable habitats in southern regions are projected to decline while new suitable areas may emerge in northern and western regions, forest conservation and territorial spatial planning may need to pay more attention to dynamic transition zones. Planning strategies that reduce habitat–land-use conflicts and maintain spatial accessibility could help improve the adaptive capacity of forest conservation under future climate uncertainty [47].
Based on the HLCI categories, differentiated management strategies can be considered for different habitat–land-use states. For stable suitable habitats, in situ conservation, forest quality improvement, and refined stand management should remain important priorities. For habitat expansion areas, especially those projected to remain suitable under multiple climate scenarios, future planning could consider them as potential climate adaptation spaces, but their ecological feasibility should be further evaluated through field surveys, species-level modeling, and habitat quality assessment. For areas where projected suitable habitats overlap with built-up land, planning may focus on reducing fragmentation and improving ecological connectivity through urban green infrastructure, ecological corridor assessment, and restoration of fragmented habitat patches [48,49]. However, because this study does not directly simulate corridor accessibility or movement cost, these areas require further analysis using landscape connectivity or resistance-surface models before site-specific planning decisions are made.
For agriculture-limited habitats, especially marginal cultivated land located in high-slope or ecologically fragile areas, ecological restoration or land-use optimization could be considered where it is consistent with local land-use policy and food security requirements. However, cultivated land should not be interpreted as an absolute barrier, because different cropland types, orchards, and agroforestry systems may vary in ecological permeability. Therefore, future conservation strategies should combine broad-scale HLCI screening with finer-scale land-use classification, habitat quality evaluation, and local management conditions. However, these conservation measures should be regarded as potential planning options rather than directly implementable management actions. Before implementation, ecological corridor construction, cropland-to-forest conversion, and assisted migration should be further evaluated through feasibility analysis, ecological risk assessment, and spatial prioritization. In particular, assisted migration may involve risks such as genetic pollution, unintended invasion, pest and pathogen spread, and maladaptation to local soil or microclimatic conditions. Therefore, assisted migration should only be considered after careful species-level assessment, provenance selection, pilot experiments, and long-term monitoring.
Overall, the HLCI framework can provide a useful broad-scale screening tool for identifying potential conservation priority areas, but it should be integrated with species-level ecological evidence, landscape connectivity analysis, feasibility assessment, and ecological risk evaluation before being used for fine-scale conservation planning.
4.4. Limitations and Future Perspectives
Based on the area statistics of habitat–land-use conflict categories under the 16 coupled climate–land-use scenarios, different land-use planning pathways showed different levels of potential conflict with future Quercus suitable habitats. Under the Urban Expansion and Cultivated Land Protection scenarios, future suitable habitats showed greater spatial overlap with built-up land or cultivated land, indicating stronger potential habitat–land-use conflicts. In contrast, the Ecological Protection scenario generally showed lower overlap between future suitable habitats and non-ecological land-use categories, suggesting that Ecological Protection-oriented land planning may help reduce potential conflicts under future climate uncertainty. However, these results should be interpreted within the scope of a scenario-based spatial overlay framework.
Although the MaxEnt–PLUS–HLCI framework provides a useful approach for identifying potential spatial conflicts between projected suitable habitats and future land-use categories, it does not directly simulate realized migration, seed dispersal processes, establishment probability, or ecological corridor accessibility. For instance, species-specific seed dispersal capacity and dispersal limitation were not explicitly incorporated into the current modeling framework [50]. Moreover, realized migration and establishment may also be influenced by animal-mediated seed dispersal, soil conditions, microclimate, local habitat quality, and assisted migration or other management interventions, which were not explicitly represented in the current scenario-based overlay framework. In addition, the MaxEnt model evaluation may still contain uncertainty. Although repeated runs were used, spatial block validation and bias-file correction were not applied in this study. Therefore, the random training–testing partition may be affected by spatial autocorrelation and sampling bias in occurrence records, potentially leading to an optimistic estimation of model performance. Future studies should incorporate spatially structured validation and sampling-bias correction to improve model robustness. Accordingly, the HLCI results should be understood as potential spatial conflict patterns under scenario assumptions, rather than as direct evidence of realized ecological processes.
Another limitation is that the broad land-use classification used in the HLCI may simplify the ecological permeability of different land-use types. Cultivated land was treated as a potential land-use constraint, but different cropland types, orchards, and agroforestry systems may vary in their permeability and suitability for Quercus establishment. Similarly, forestland and grassland were regarded as relatively less restrictive land-use backgrounds, but they are not automatically suitable for all Quercus species because local habitat quality, forest structure, management intensity, and species-specific requirements may differ substantially. In addition, the PLUS-based land-use simulation treats forestland and other land-use categories as relatively homogeneous spatial units and therefore does not capture micro-scale forest structure, interspecific competition, community succession, or local habitat quality within forest patches.
The spatial resolution used in this study may also introduce scale-related uncertainty. Although the 2 km × 2 km grid is suitable for harmonizing multi-source datasets and supporting broad-scale national scenario comparison, it may smooth fine-scale landscape features, such as urban edges, small habitat patches, narrow riparian corridors, and local fragmentation patterns. Therefore, the results should be interpreted as broad-scale potential habitat–land-use conflict patterns rather than fine-scale conservation planning outputs. Future studies should conduct scale sensitivity analyses and use higher-resolution datasets to better evaluate local habitat fragmentation and corridor accessibility.
Future climate projections were based on the BCC-CSM2-MR global climate model, and no multi-GCM ensemble mean was used in the current study. Therefore, uncertainty associated with differences among GCMs was not fully quantified, and future studies should incorporate multiple GCMs or ensemble projections to better evaluate climate-model uncertainty.
A further limitation is that this study evaluates Quercus at the genus level. Although this approach is appropriate for broad-scale screening of potential habitat–land-use conflicts across China, it may mask interspecific differences in climatic tolerance, dispersal capacity, habitat preference, and competitive ability. Therefore, the results should not be interpreted as species-specific conservation recommendations. Future studies should perform species-level or functional-group analyses when sufficient occurrence records and trait information are available.
To better understand the dynamic responses of forest ecosystems under global change, future studies could move beyond static spatial overlay analysis by incorporating process-based ecological mechanisms [51]. For example, integrating forest succession, interspecific competition, dispersal processes, and establishment constraints into climate–land-use modeling frameworks may improve the ecological realism of future habitat assessments [52]. Competition indices or process-based forest models could be used to examine how different tree species respond to the combined effects of climate change and human land-use pressure. Such developments would provide a useful direction for improving dynamic forest habitat assessment and adaptive silvicultural planning, while also helping to reduce the uncertainty associated with scenario-based spatial overlap analyses [53].
5. Conclusions
This study developed a macro-scale MaxEnt–PLUS coupled simulation framework and applied the Habitat–Land-Use Conflict Index (HLCI) to assess potential spatial conflicts between projected Quercus habitat suitability and future land-use patterns. The results indicate that climate warming may generate newly suitable habitats in higher-latitude and higher-elevation regions, while future land-use patterns may influence the extent to which these climatically suitable areas can be realized. In particular, under SSP5-8.5, the urban-encroached area reached 58,959.18 km2 under the Urban Expansion scenario, while the agri-limited area reached 364,188.86 km2 under the Cultivated Land Protection scenario. Even under the Ecological Protection scenario, the agri-limited area remained 313,538.18 km2 under SSP5-8.5. These quantitative findings suggest that the spatial overlap between projected suitable habitats and built-up or cultivated land may create potential constraints for habitat expansion across the assessed climate–land-use scenarios. However, these results should not be interpreted as direct evidence of realized migration failure or dispersal limitation.
These findings further indicate that climate-only species distribution assessments may overestimate the spatial availability of future suitable habitats when dynamic land-use change is not considered. The HLCI framework used in this study provides a scenario-based approach for identifying potential hotspots where projected suitable habitats overlap with built-up land or cultivated land. From a conservation perspective, climate mitigation and adaptation efforts should be coordinated with land-use planning, Ecological Protection, and connectivity-oriented conservation strategies to better address future habitat–land-use conflicts. However, measures such as ecological corridor construction, cropland-to-forest conversion, or assisted migration should be further evaluated through feasibility analysis, ecological risk assessment, and spatial prioritization. In particular, assisted migration should be implemented cautiously because it may involve genetic pollution, invasion risk, pest and pathogen spread, and maladaptation to local environmental conditions.
Overall, this study provides a scenario-based spatial assessment of potential habitat–land-use conflicts for Quercus under future climate and land-use scenarios. Future research should further incorporate community succession, interspecific competition, dispersal capacity, establishment processes, and finer land-use classifications to improve the transition from static spatial overlay assessment to more process-informed habitat modeling.
Author Contributions
Conceptualization, J.D.; methodology, J.D.; software, J.D. and D.Z.; validation, J.D. and D.Z.; formal analysis, J.D. and D.Z.; investigation, J.D. and D.Z.; resources, J.D. and D.Z.; data curation, J.D. and D.Z.; writing—original draft preparation, J.D.; writing—review and editing, J.D. and D.Z.; visualization, J.D. and D.Z.; supervision, Z.W.; project administration, Z.F.; funding acquisition, Z.F. All authors have read and agreed to the published version of the manuscript.
Funding
This research was funded by the National Innovation Park for Forestry and Grass Equipment (grant number 2024YG13), the Natural Science Foundation of Beijing (grant numbers 8232038, 8234065), the 5·5 Engineering Research and Innovation Team Project of Beijing Forestry University (grant number BLRC2023A03), the National Natural Science Foundation of China (grant number 42330507), the Key Research and Development Projects of the Ningxia Hui Autonomous Region (grant number 2023BEG02050), and the Xing’an Alliance Science and Technology Program Project (MBJH2024019).
Data Availability Statement
The data used to support the findings of this study are available from the corresponding author upon request.
Conflicts of Interest
The authors declare no conflicts of interest.
Abbreviations
The following abbreviations are used in this manuscript:
| HLCI | Habitat–Land-Use Conflict Index |
References
- Safdar, S.; Younes, I.; Ahmad, A.; Sastry, S. A comprehensive review of spatial distribution modeling of plant species in mountainous environments: Implications for biodiversity conservation and climate change assessment. Kuwait J. Sci. 2025, 52, 100337. [Google Scholar]
- Vasconcelos, R.N.; Cantillo-Pérez, T.; Franca Rocha, W.J.; Aguiar, W.M.; Mendes, D.T.; de Jesus, T.B.; de Santana, C.O.; de Santana, M.M.; Oliveira, R.P. Advances and challenges in species ecological niche modeling: A mixed review. Earth 2024, 5, 963–989. [Google Scholar] [CrossRef] [Scilit]
- Xu, W.H.; Luo, D.W.; Peterson, K.; Zhao, Y.R.; Yu, Y.; Ye, Z.Y.; Sun, J.J.; Yan, K.; Wang, T.L. Advancements in ecological niche models for forest adaptation to climate change: A comprehensive review. Biol. Rev. 2025, 100, 1754–1781. [Google Scholar] [CrossRef] [Scilit] [PubMed]
- Zhao, Y.R.; O’Neill, G.A.; Wang, T.L. Predicting fundamental climate niches of forest trees based on species occurrence data. Ecol. Indic. 2023, 148, 110072. [Google Scholar] [CrossRef] [Scilit]
- Zhang, H.; Guo, J.; Zhang, Y.; Wang, Z.; Liu, Z. Climate Change Drives Shifts in Suitable Habitats and Habitat Fragmentation of Quercus baronii Forests in China. Forests 2026, 17, 598. [Google Scholar] [CrossRef] [Scilit]
- Morelli, T.L.; Barrows, C.W.; Ramirez, A.R.; Cartwright, J.M.; Ackerly, D.D.; Eaves, T.D.; Ebersole, J.L.; Krawchuk, M.A.; Letcher, B.H.; Mahalovich, M.F.; et al. Climate-change refugia: Biodiversity in the slow lane. Front. Ecol. Environ. 2020, 18, 228–234. [Google Scholar] [CrossRef] [Scilit] [PubMed]
- Lin, L.; Jiang, X.L.; Guo, K.Q.; Byrne, A.; Deng, M. Climate change impacts the distribution of Quercus section Cyclobalanopsis (Fagaceae), a keystone lineage in East Asian evergreen broadleaved forests. Plant Divers. 2023, 45, 552–568. [Google Scholar] [CrossRef] [Scilit] [PubMed]
- Song, H.; Zhang, X.; Wang, X.; Wang, Y.; Li, S.; Xu, Y. Not the expected poleward migration: Impact of climate change scenarios on the distribution of two endemic evergreen broad-leaved Quercus species in China. Sci. Total Environ. 2023, 889, 164273. [Google Scholar] [CrossRef] [Scilit] [PubMed]
- Huang, H.; Zhou, L.J.; Yang, J. Optimizing MaxEnt model performance for forecasting current and future potential geographical distribution of Quercus glauca in China. Appl. Ecol. Environ. Res. 2026, 24, 4507–4528. [Google Scholar] [CrossRef] [Scilit]
- Lenoir, J.; Bertrand, R.; Comte, L.; Bourgeaud, L.; Hattab, T.; Murienne, J.; Grenouillet, G. Species better track climate warming in the oceans than on land. Nat. Ecol. Evol. 2020, 4, 1044–1059. [Google Scholar] [CrossRef] [Scilit] [PubMed]
- Miao, J.; Xu, Y.; Ferguson, D.K.; Yang, Y. Differential Performance of Distribution Shifts Between Endangered Coniferous and Broad-Leaved Tree Species in Subtropical China Under Climate Change. Plants 2026, 15, 515. [Google Scholar] [CrossRef] [Scilit] [PubMed]
- Yang, X.; Wang, S.; Lu, D.; Shao, Y.; Feng, Z.; Wang, Z. Ecological Adaptation and Sustainable Cultivation of Citrus reticulata by Applying Mixed Design Principles under Changing Climate in China. Remote Sens. 2024, 16, 2338. [Google Scholar] [CrossRef] [Scilit]
- Hof, A.R.; Mina, M.; Mairota, P.; Aguilar, F.; Leitinger, G.; Brna, J.; Koivula, M.; Klopcic, M.; Sjögren, J.; Vacchiano, G. A perspective on the need for integrated frameworks linking species distribution and dynamic forest landscape models across spatial scales. Front. Ecol. Evol. 2024, 12, 1112712. [Google Scholar] [CrossRef] [Scilit]
- Li, W.B.; Teng, Y.; Zhang, M.Y.; Shen, Y.; Liu, J.W.; Qi, J.W.; Wang, X.C.; Wu, R.F.; Li, J.H.; Garber, P.A. Human activity and climate change accelerate the extinction risk to non-human primates in China. Glob. Change Biol. 2024, 30, e17114. [Google Scholar]
- Sirami, C.; Caplat, P.; Popy, S.; Clamens, A.; Arlettaz, R.; Jiguet, F.; Brotons, L.; Martin, J.L. Impacts of global change on species distributions: Obstacles and solutions to integrate climate and land use. Glob. Ecol. Biogeogr. 2017, 26, 385–394. [Google Scholar] [CrossRef] [Scilit]
- Hao, R.F.; Yu, D.Y.; Liu, Y.P.; Liu, Y.; Qiao, J.M.; Wang, X.; Du, J.S. Impacts of changes in climate and landscape pattern on ecosystem services. Sci. Total Environ. 2017, 579, 718–728. [Google Scholar] [CrossRef] [Scilit] [PubMed]
- Doherty, T.S.; Hays, G.C.; Driscoll, D.A. Human disturbance causes widespread disruption of animal movement. Nat. Ecol. Evol. 2021, 5, 513–519. [Google Scholar] [CrossRef] [Scilit] [PubMed]
- Williams, D.R.; Clark, M.; Buchanan, G.M.; Ficetola, G.F.; Rondinini, C.; Tilman, D. Proactive conservation to prevent habitat losses to agricultural expansion. Nat. Sustain. 2021, 4, 314–322. [Google Scholar] [CrossRef] [Scilit]
- Bowler, D.E.; Bjorkman, A.D.; Dornelas, M.; Myers-Smith, I.H.; Navarro, L.M.; Niamir, A.; Supp, S.R.; Waldock, C.; Winter, M.; Vellend, M. Mapping human pressures on biodiversity across the planet uncovers anthropogenic threat complexes. People Nat. 2020, 2, 380–394. [Google Scholar] [CrossRef] [Scilit]
- Newbold, T.; Oppenheimer, P.; Etard, A.; Williams, J.J. Tropical and Mediterranean biodiversity is disproportionately sensitive to land-use and climate change. Nat. Ecol. Evol. 2020, 4, 1630–1638. [Google Scholar] [CrossRef] [Scilit] [PubMed]
- Powers, R.P.; Jetz, W. Global habitat loss and extinction risk of terrestrial vertebrates under future land-use-change scenarios. Nat. Clim. Change 2019, 9, 323–329. [Google Scholar] [CrossRef] [Scilit]
- Braunisch, V.; Coppes, J.; Arlettaz, R.; Suchant, R.; Schmid, H.; Bollmann, K. Selecting from correlated climate variables: A major source of uncertainty for predicting species distributions under climate change. Ecography 2013, 36, 971–983. [Google Scholar] [CrossRef] [Scilit]
- Lee-Yaw, J.A.; McCune, J.L.; Pironon, S.; Sheth, S.N. Species distribution models rarely predict the biology of real populations. Ecography 2022, 2022, e05877. [Google Scholar] [CrossRef] [Scilit]
- Tan, X.; Liu, S.; Tian, Y.; Zhou, Z.; Wang, Y.; Jiang, J.; Shi, H. Impacts of Climate Change and Land Use/Cover Change on Regional Hydrological Processes: Case of the Guangdong-Hong Kong-Macao Greater Bay Area. Front. Environ. Sci. 2022, 9, 783324. [Google Scholar] [CrossRef] [Scilit]
- Jiang, S.; Meng, J.J.; Zhu, L.K.; Cheng, H.R. Spatial-temporal pattern of land use conflict in China and its multilevel driving mechanisms. Sci. Total Environ. 2021, 801, 149697. [Google Scholar] [CrossRef] [Scilit] [PubMed]
- Bai, T.Q.; Fan, L.K.; Song, G.X.; Song, H.Q.; Ru, X.T.; Wang, Y.B.; Zhang, H.P.; Min, R.Q.; Wang, W.J. Effects of Land Use/Cover and Meteorological Changes on Regional Climate under Different SSP-RCP Scenarios: A Case Study in Zhengzhou, China. Remote Sens. 2023, 15, 2601. [Google Scholar] [CrossRef] [Scilit]
- Liang, X.; Guan, Q.F.; Clarke, K.C.; Liu, S.S.; Wang, B.Y.; Yao, Y. Understanding the drivers of sustainable land expansion using a patch-generating land use simulation (PLUS) model: A case study in Wuhan, China. Comput. Environ. Urban Syst. 2021, 85, 101569. [Google Scholar] [CrossRef] [Scilit]
- Yerkenhazi, A.; Mamat, K.; Abulizi, A.; Mamitimin, Y.; Wei, X.M.; Tang, S.S.; Wang, J.X.; Bai, S.J.; Yuan, L. Identification of Production-Living-Ecological Spatial Conflicts and Multi-Scenario Simulations in Extreme Arid Areas. Land 2025, 14, 1002. [Google Scholar] [CrossRef] [Scilit]
- Manzoor, S.A.; Griffiths, G.; Lukac, M. Species distribution model transferability and model grain size—Finer may not always be better. Sci. Rep. 2018, 8, 7168. [Google Scholar] [CrossRef] [Scilit] [PubMed]
- Chen, Y.H.; Li, Y.; Mao, L.F. Combining the Effects of Global Warming, Land Use Change and Dispersal Limitations to Predict the Future Distributions of East Asian Cerris Oaks (Quercus Section Cerris, Fagaceae) in China. Forests 2022, 13, 367. [Google Scholar] [CrossRef] [Scilit]
- Guo, Y.L.; Zhao, Z.F.; Wang, J.B. Projected degradation of Quercus habitats in Southern China under future global warming scenarios. For. Ecol. Manag. 2024, 568, 122133. [Google Scholar] [CrossRef] [Scilit]
- Zhang, Q.; Qin, J.; Zhou, J.; Jiang, S.; Zhang, C. Vegetation, Climate and Depositional Environment Changes Since the Middle Holocene in the Karst Area of Guilin, Guangxi. Chin. Sci. Bull. 2015, 60, 1197–1206. [Google Scholar] [CrossRef] [Scilit]
- Pellerin, F.; Cote, J.; Bestion, E.; Aguilée, R. Matching habitat choice promotes species persistence under climate change. Oikos 2019, 128, 221–234. [Google Scholar]
- Smith, A.J.; Goetz, E.M. Climate change drives increased directional movement of landscape ecotones. Landsc. Ecol. 2021, 36, 3105–3116. [Google Scholar] [CrossRef] [Scilit]
- Zellweger, F.; De Frenne, P.; Lenoir, J.; Vangansbeke, P.; Verheyen, K.; Bernhardt-Römermann, M.; Baeten, L.; Hédl, R.; Berki, I.; Brunet, J.; et al. Forest microclimate dynamics drive plant responses to warming. Science 2020, 368, 772–775. [Google Scholar] [CrossRef] [Scilit] [PubMed]
- Song, Z.; Song, X.; Pan, Y.; Dai, K.; Shou, J.; Chen, Q.; Huang, J.; Tang, X.; Huang, Z.; Du, Y. Effects of winter chilling and photoperiod on leaf-out and flowering in a subtropical evergreen broadleaved forest in China. For. Ecol. Manag. 2020, 458, 117766. [Google Scholar] [CrossRef] [Scilit]
- Wang, C.; Wang, Z.-H.; Wang, C.; Myint, S.W. Environmental cooling provided by urban trees under extreme heat and cold waves in U.S. cities. Remote Sens. Environ. 2019, 227, 28–43. [Google Scholar] [CrossRef] [Scilit]
- Sun, S.; Zhang, Y.; Huang, D.; Wang, H.; Cao, Q.; Fan, P.; Yang, N.; Zheng, P.; Wang, R. The effect of climate change on the richness distribution pattern of oaks (Quercus L.) in China. Sci. Total Environ. 2020, 744, 140786. [Google Scholar] [CrossRef] [Scilit] [PubMed]
- Zhong, W.; Cheng, K.H.; Zhou, L.; Zhang, J.; Zhang, F.; Feng, G.; Zhang, X.; Ma, Q.; Su, Y.; Jin, S.; et al. Metabolite-derived spectral modelling can differentiate heat and drought stress under hot-dry environments. Remote Sens. Environ. 2025, 328, 114884. [Google Scholar] [CrossRef] [Scilit]
- Briceño, V.F.; Arnold, P.A.; Cook, A.M.; Courtney Jones, S.K.; Gallagher, R.V.; French, K.; Bravo, L.A.; Nicotra, A.B.; Leigh, A. Drivers of thermal tolerance breadth of plants across contrasting biomes. J. Ecol. 2025, 113, 3812–3829. [Google Scholar] [CrossRef] [Scilit]
- Crabbe, R.A.; Dash, J.; Rodriguez-Galiano, V.F.; Janous, D.; Pavelka, M.; Marek, M.V. Extreme warm temperatures alter forest phenology and productivity in Europe. Sci. Total Environ. 2016, 563–564, 486–495. [Google Scholar] [CrossRef] [Scilit] [PubMed]
- Li, X.Y.; Huntingford, C.; Wang, K.; Cui, J.P.; Xu, H.; Kan, F.; Anniwaer, N.; Yang, H.; Penuelas, J.; Piao, S.L. Increased crossing of thermal stress thresholds of vegetation under global warming. Glob. Change Biol. 2024, 30, e17406. [Google Scholar] [CrossRef] [Scilit] [PubMed]
- Guo, Y.; Wang, C.; Hong, S.; Hong, W.; Geng, R.; Ren, Z.; He, X. Dynamic evolution of PM2.5 removal by urban forests during rapid urbanization: From forest landscape pattern dominance to impervious surfaces. J. Clean. Prod. 2025, 493, 144930. [Google Scholar] [CrossRef] [Scilit]
- Zhong, Q.; Ma, J.; Zhao, B.; Wang, X.; Zong, J.; Xiao, X. Assessing spatial-temporal dynamics of urban expansion, vegetation greenness and photosynthesis in megacity Shanghai, China during 2000–2016. Remote Sens. Environ. 2019, 233, 111374. [Google Scholar] [CrossRef] [Scilit]
- Sheng, S.; Zhang, Z.; Huang, J.; Lu, G. Urban expansion-induced cropland grain production potential loss in China: Spatial heterogeneity and driving mechanisms. J. Clean. Prod. 2026, 557, 148162. [Google Scholar] [CrossRef] [Scilit]
- Huan, Y.; Nijhuis, S.; Tillie, N. Optimizing urban agriculture for long-term ecosystem services: Integrating scenario-based suitability analysis and the landscape approach. J. Clean. Prod. 2025, 536, 147149. [Google Scholar] [CrossRef] [Scilit]
- Littlefield, C.E.; McRae, B.H.; Michalak, J.L.; Lawler, J.J.; Carroll, C. Connecting today’s climates to future climate analogs to facilitate movement of species under climate change. Conserv. Biol. 2017, 31, 1397–1408. [Google Scholar] [CrossRef] [Scilit] [PubMed]
- Li, X.; Li, J.; Ma, B.; Tang, Z.; Zhang, D.; Li, C.; Tian, Q.; Yang, C.; Yan, Y. Scale-dependent effects of road hierarchy and species dispersal capacities on ecological connectivity in urban agglomerations. J. Clean. Prod. 2026, 543, 147632. [Google Scholar] [CrossRef] [Scilit]
- Ward, M.; Saura, S.; Williams, B.; Ramírez-Delgado, J.P.; Arafeh-Dalmau, N.; Allan, J.R.; Venter, O.; Dubois, G.; Watson, J.E.M. Just ten percent of the global terrestrial protected area network is structurally connected via intact land. Nat. Commun. 2020, 11, 4563. [Google Scholar] [CrossRef] [Scilit] [PubMed]
- Zurell, D.; Thuiller, W.; Pagel, J.; Cabral, J.S.; Münkemüller, T.; Gravel, D.; Dullinger, S.; Normand, S.; Schiffers, K.H.; Moore, K.A. Benchmarking novel approaches for modelling species range dynamics. Glob. Change Biol. 2016, 22, 2651–2664. [Google Scholar] [CrossRef] [Scilit]
- Khan, A.; Ali, M.; Mandadi, A.; Anjum, A.; Balzter, H. Digital Twin-Ready Earth Observation: Operationalizing GeoML for Agricultural CO2 Flux Monitoring at Field Scale. Remote Sens. 2025, 17, 3615. [Google Scholar]
- Mina, M.; Huber, M.O.; Forrester, D.I.; Thürig, E.; Rohner, B. Multiple factors modulate tree growth complementarity in Central European mixed forests. J. Ecol. 2018, 106, 1106–1119. [Google Scholar]
- Pugh, T.A.; Lindeskog, M.; Smith, B.; Poulter, B.; Arneth, A.; Haverd, V.; Calle, L. Role of forest regrowth in global carbon sink dynamics. Proc. Natl. Acad. Sci. USA 2019, 116, 4382–4387. [Google Scholar] [CrossRef] [Scilit] [PubMed]
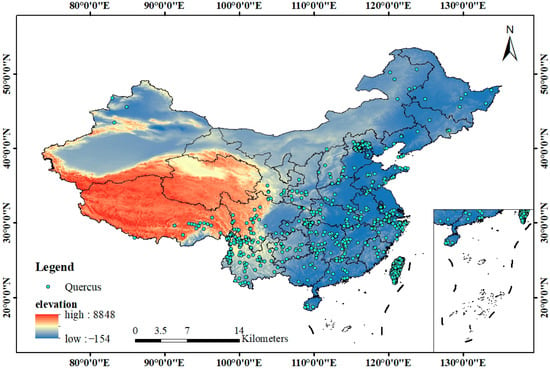
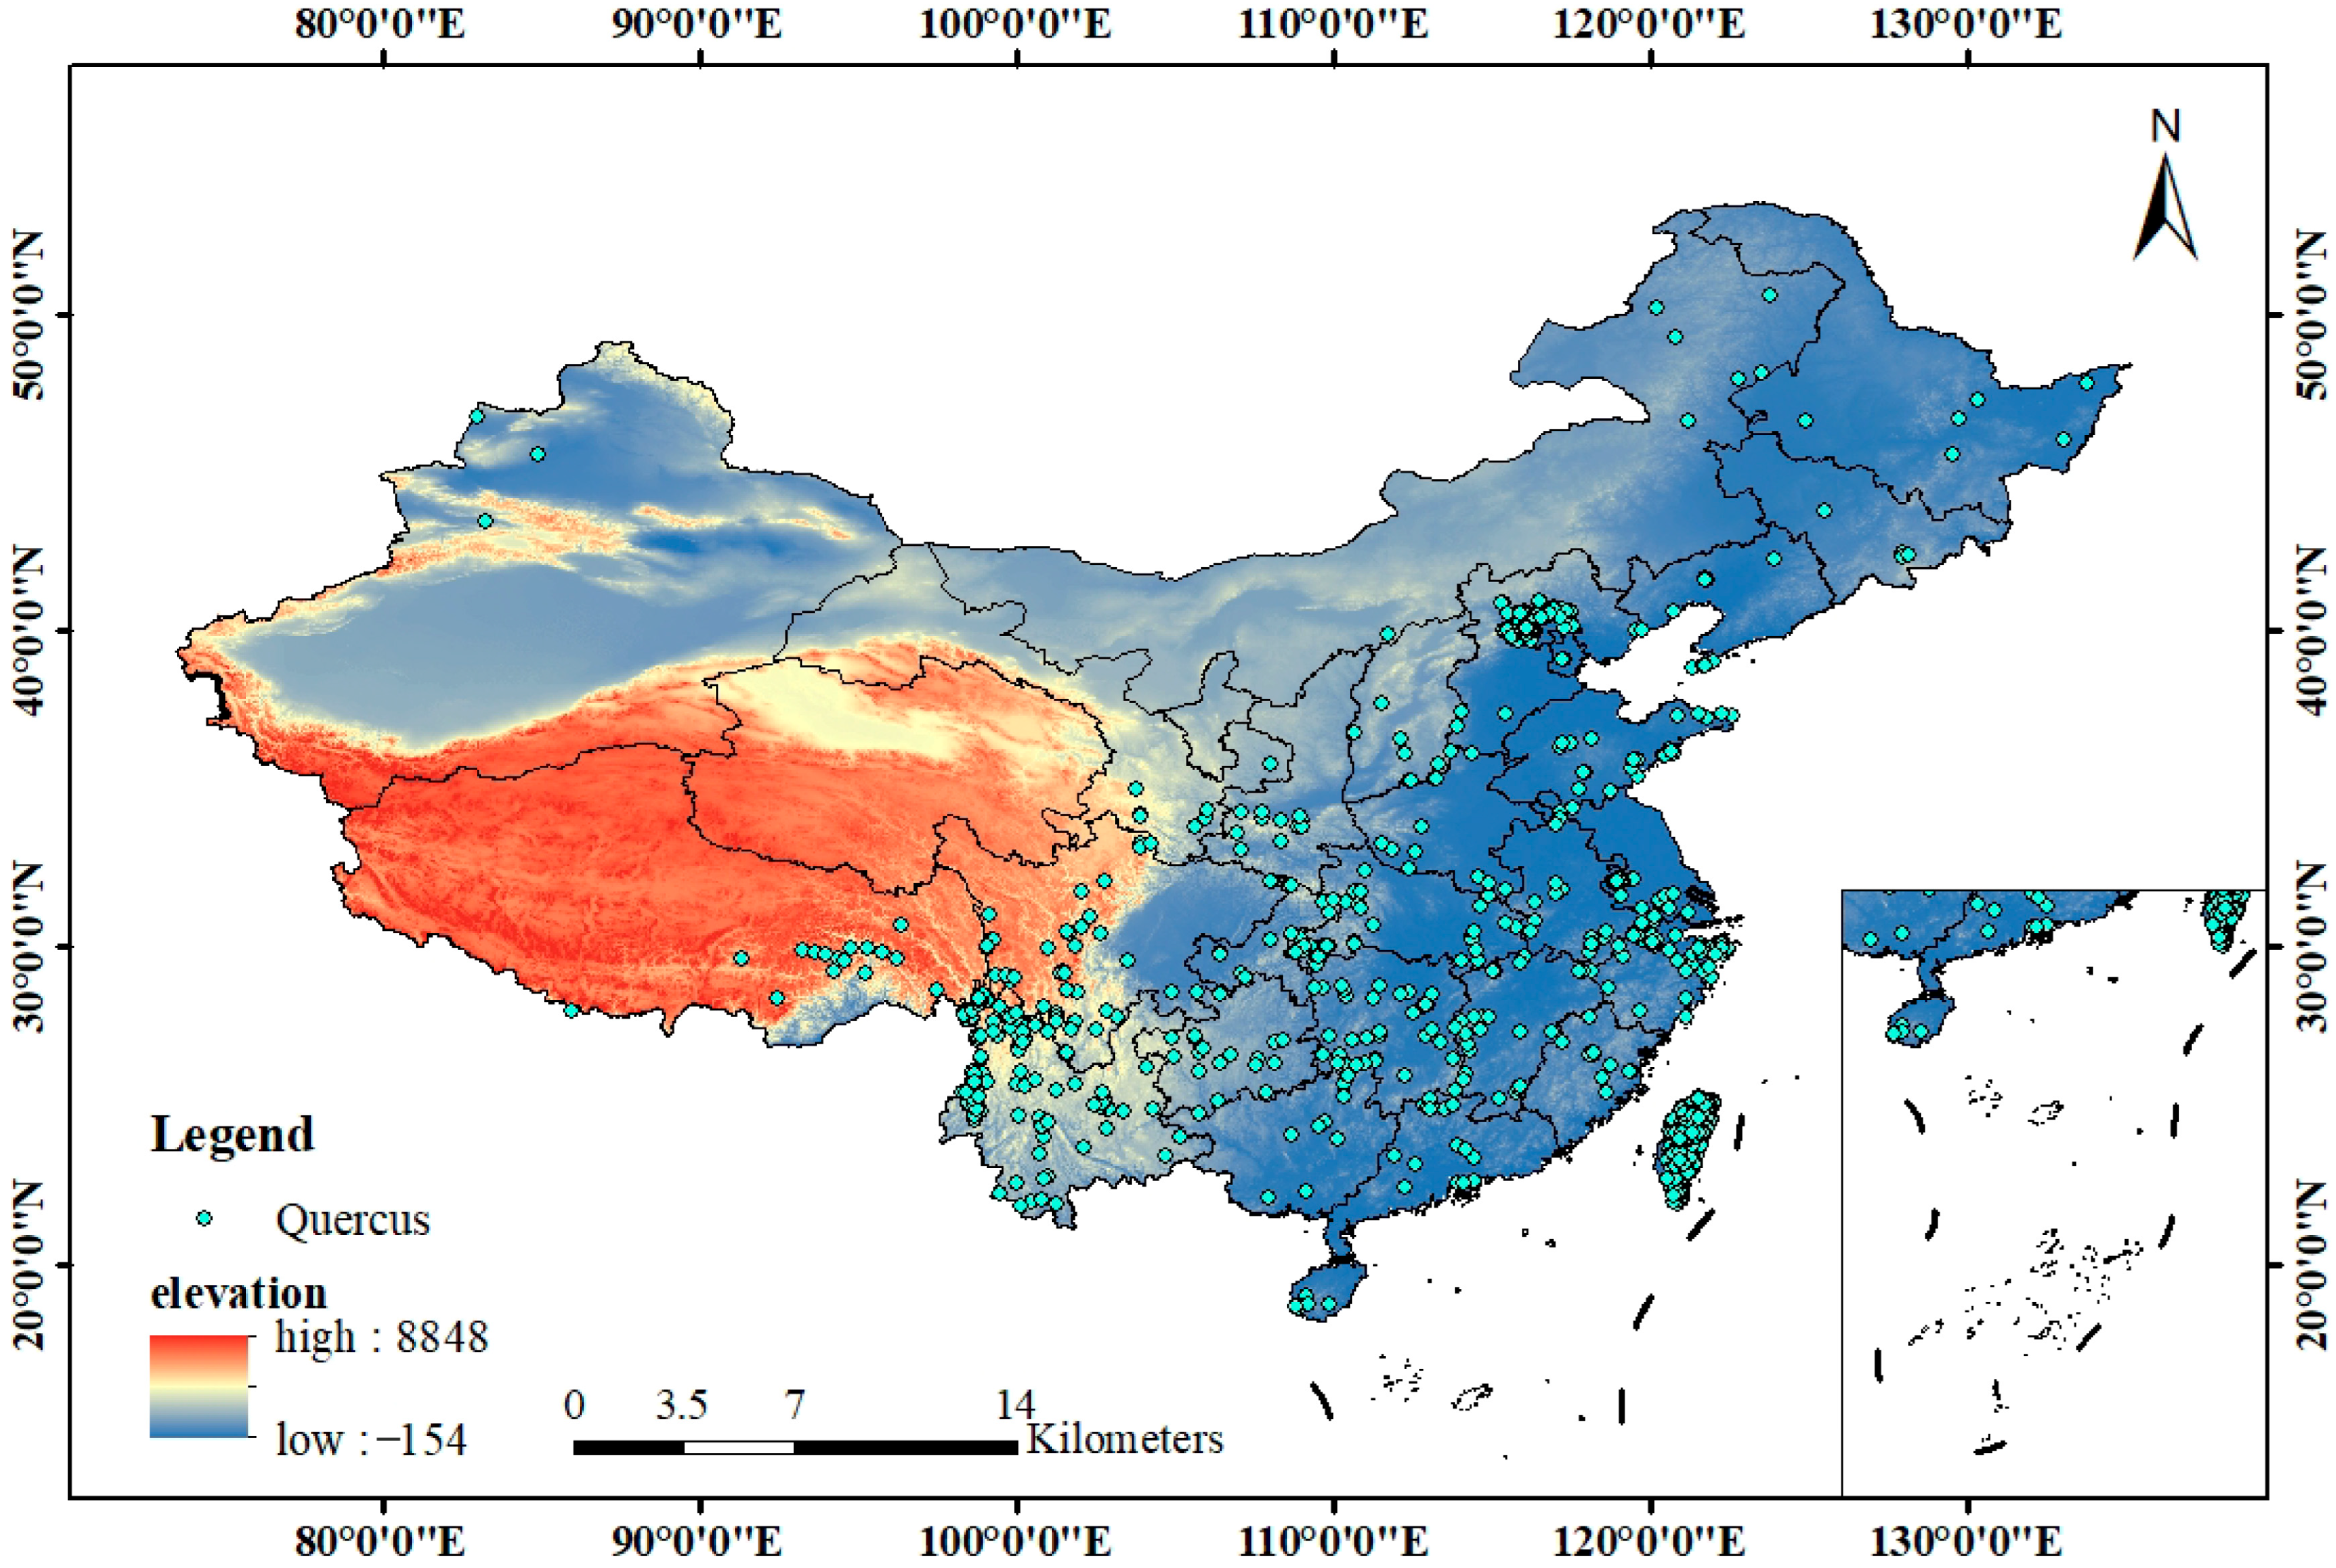
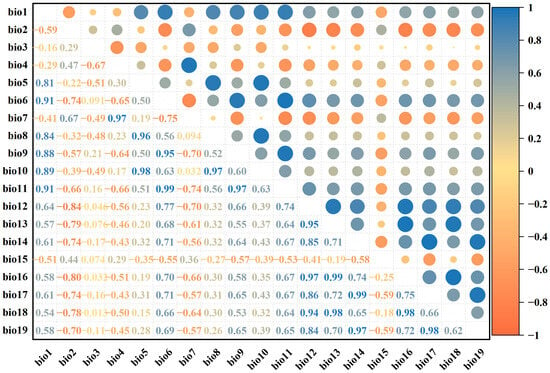
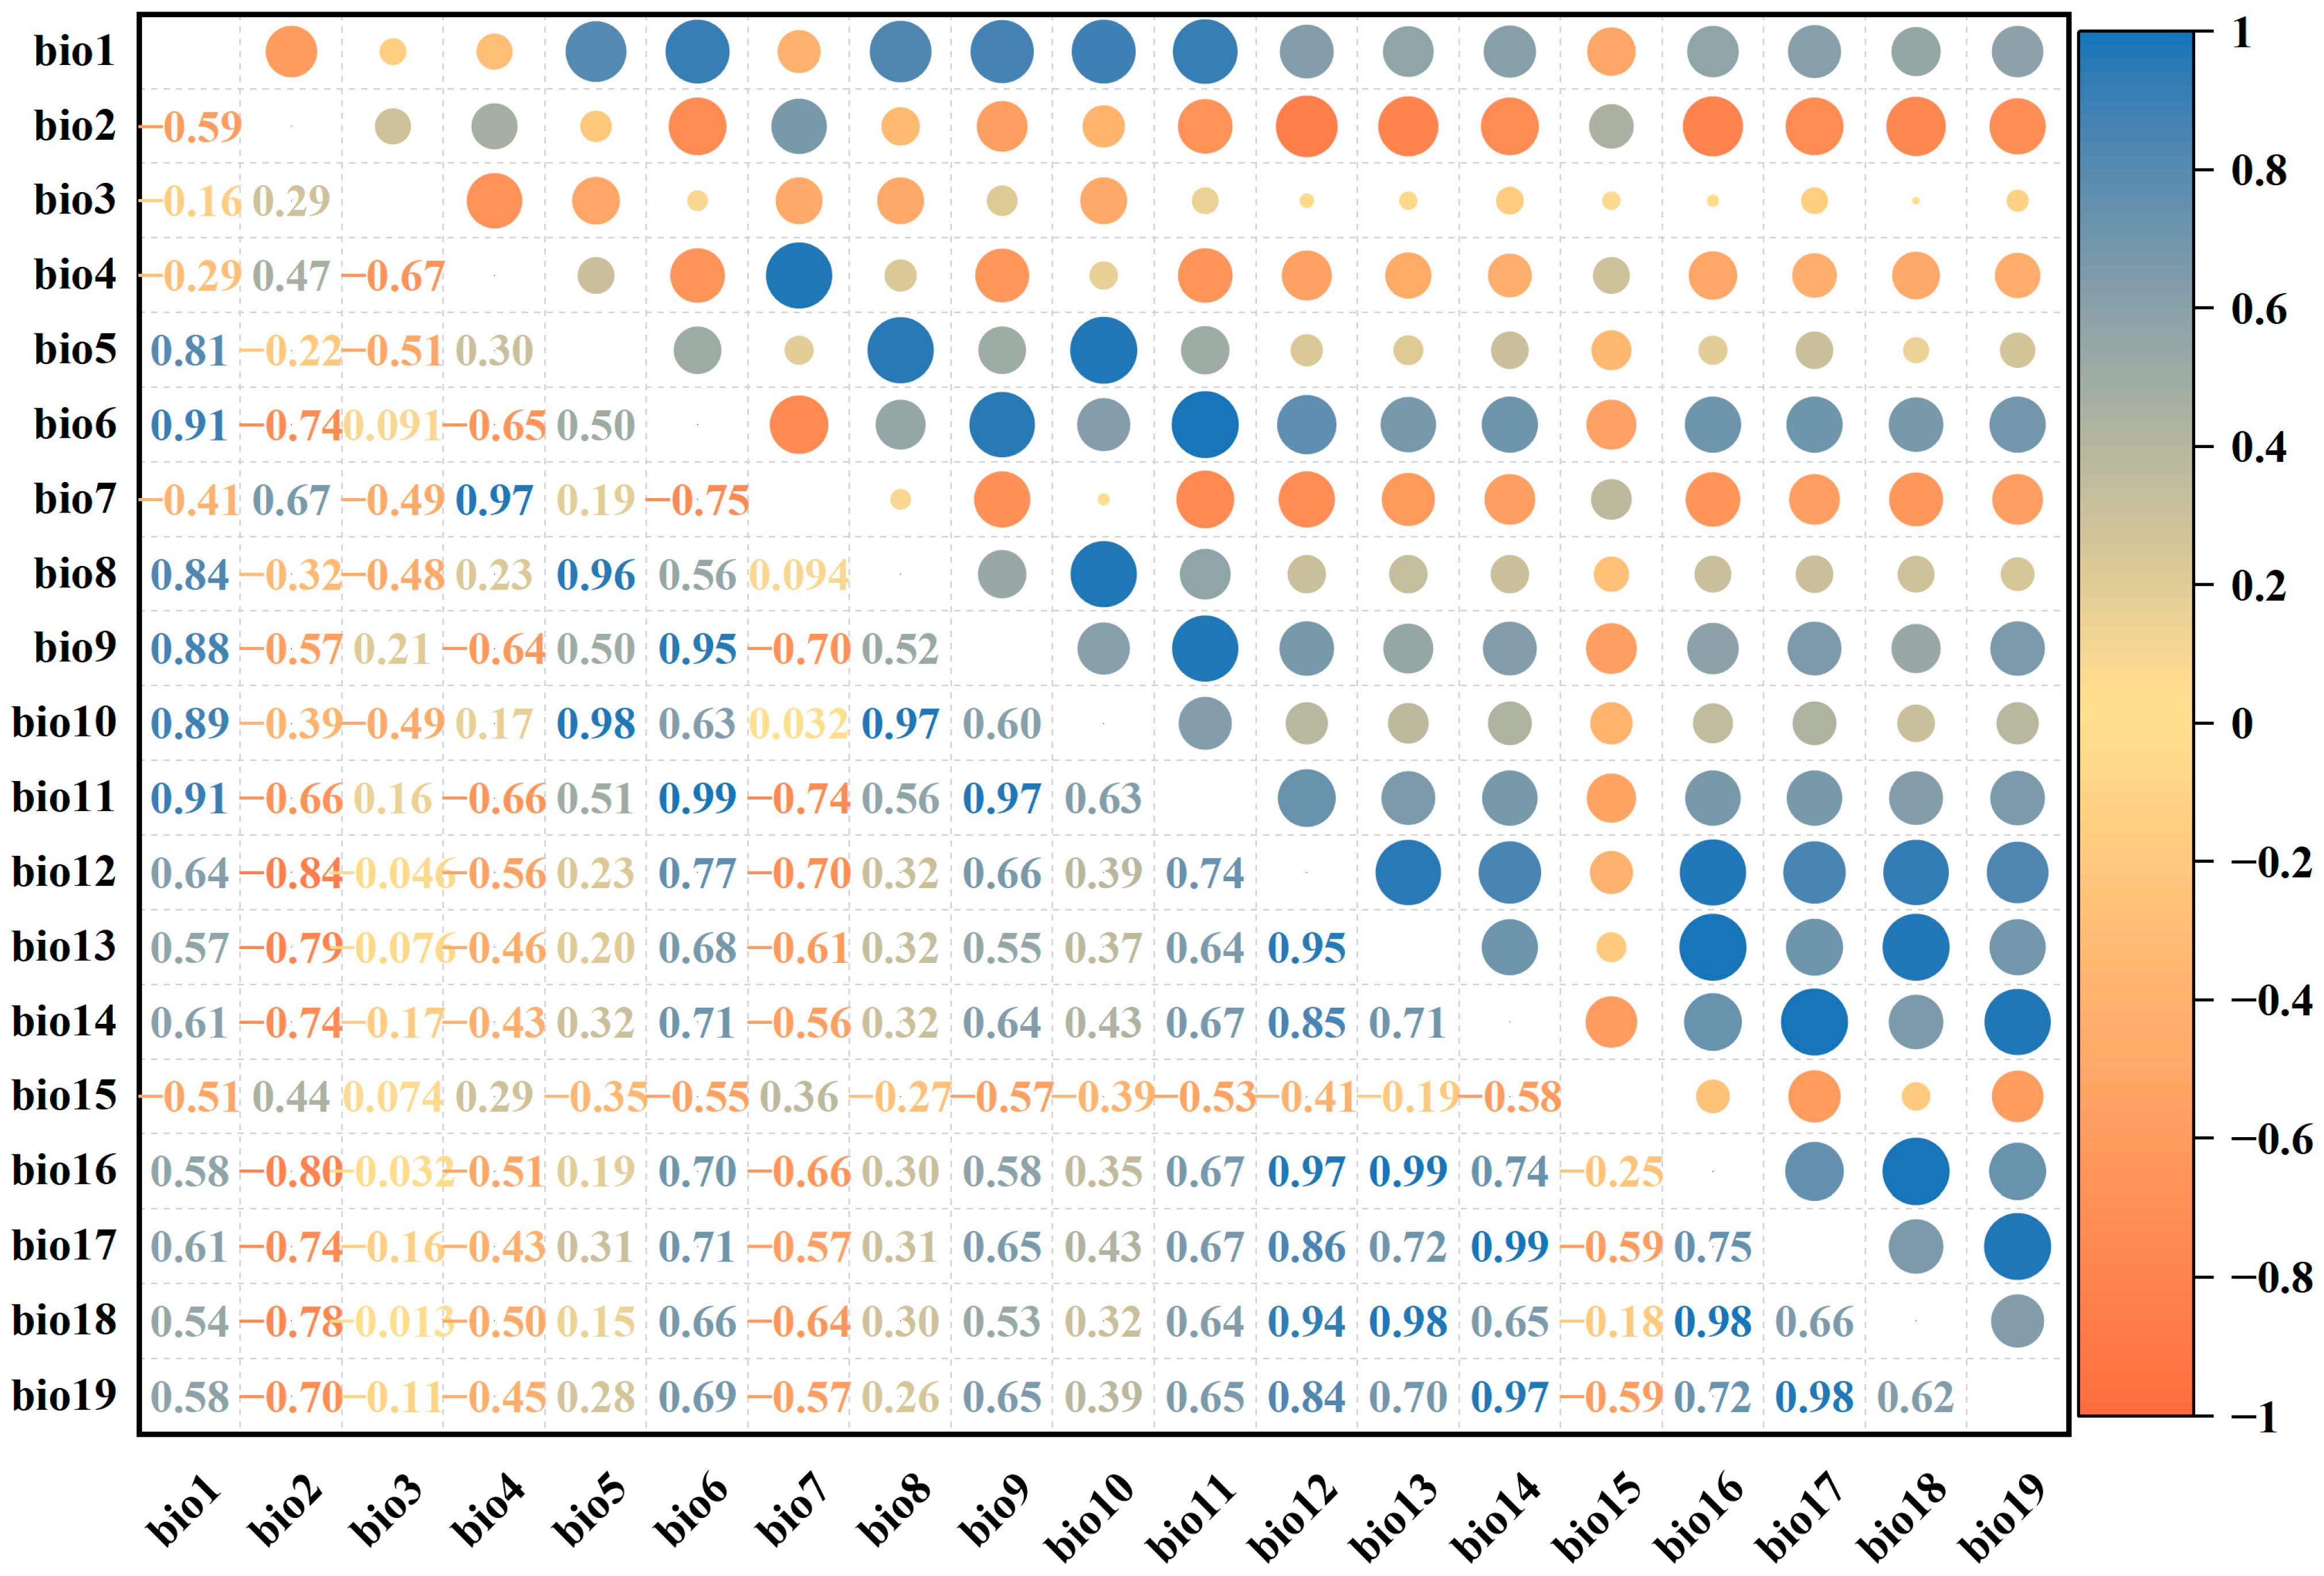
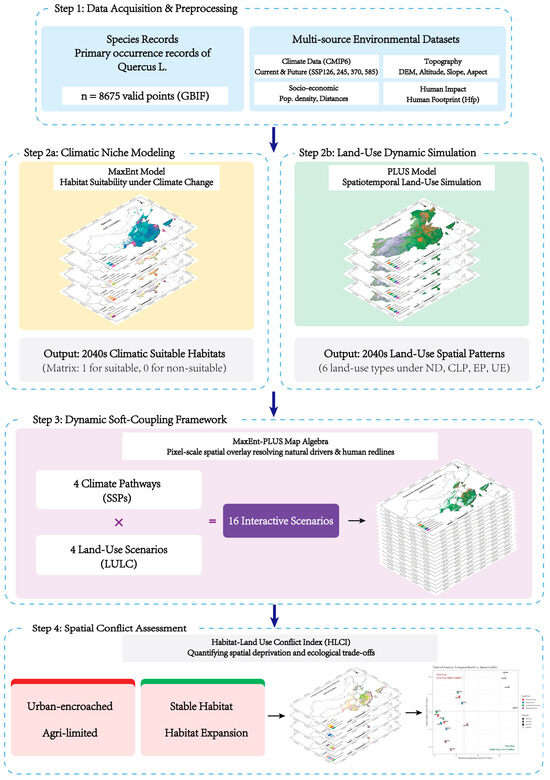
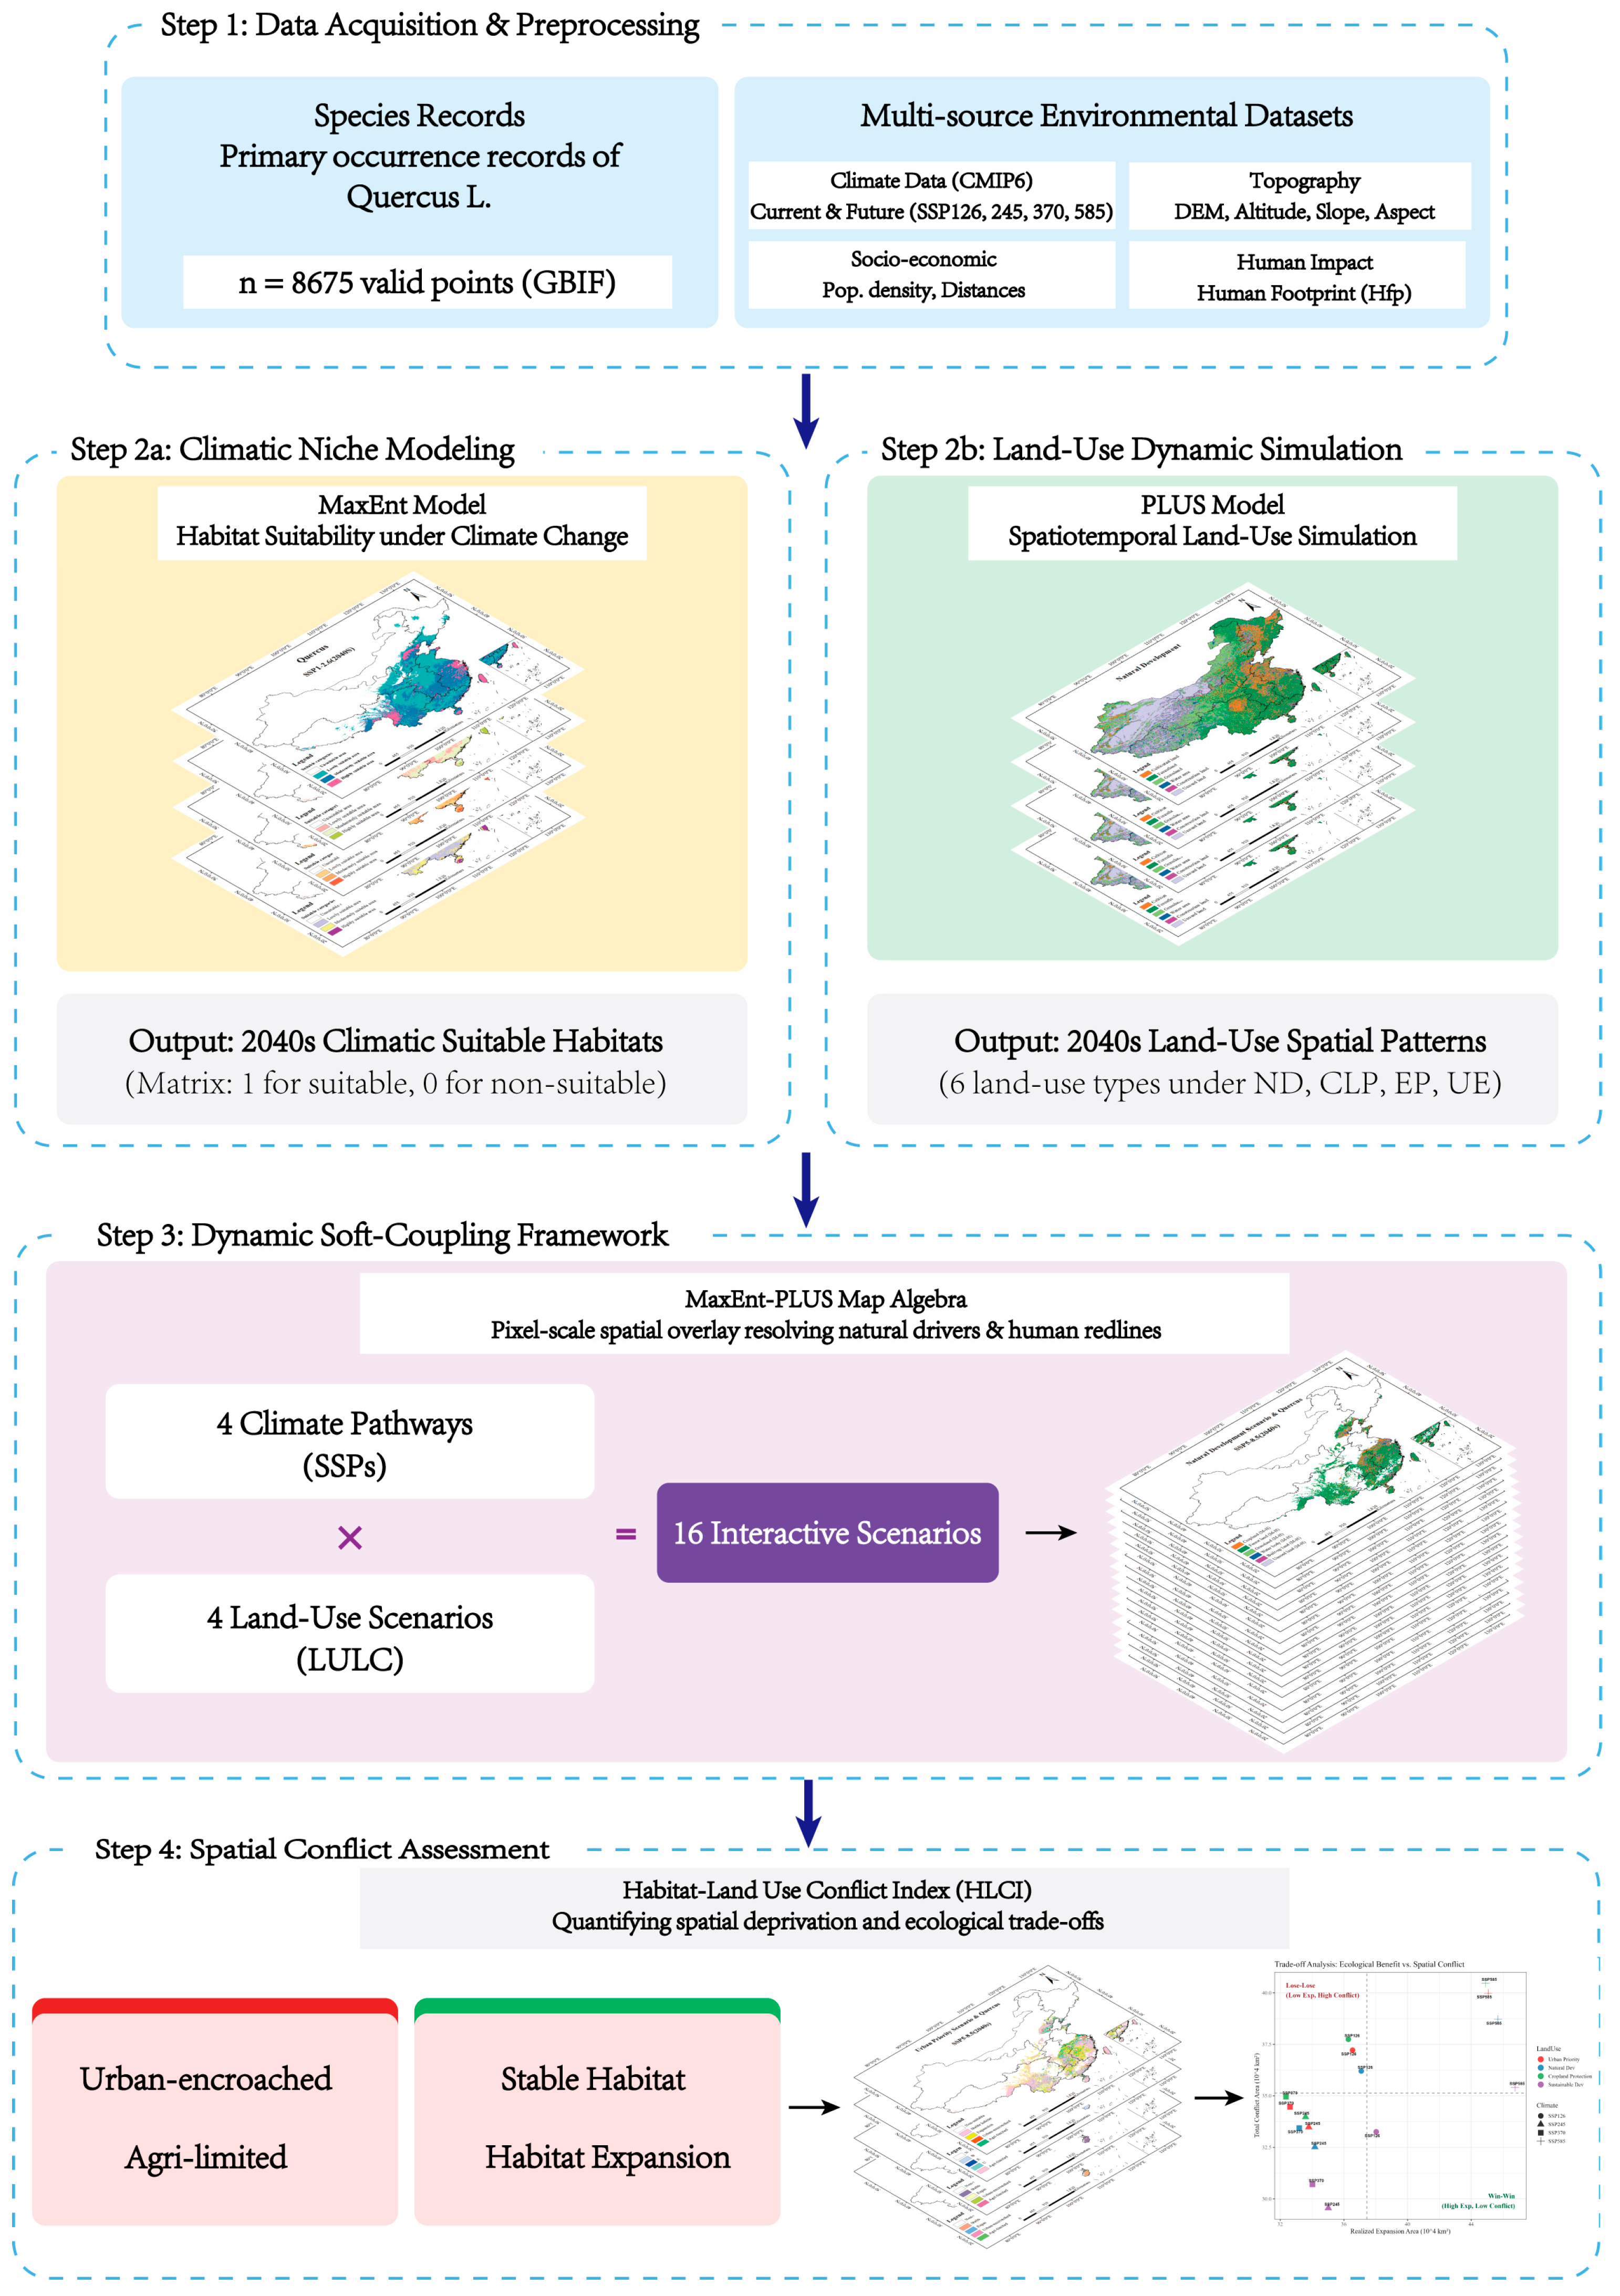
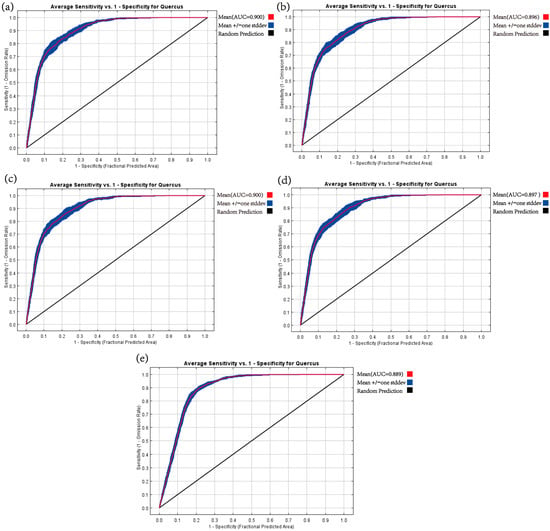
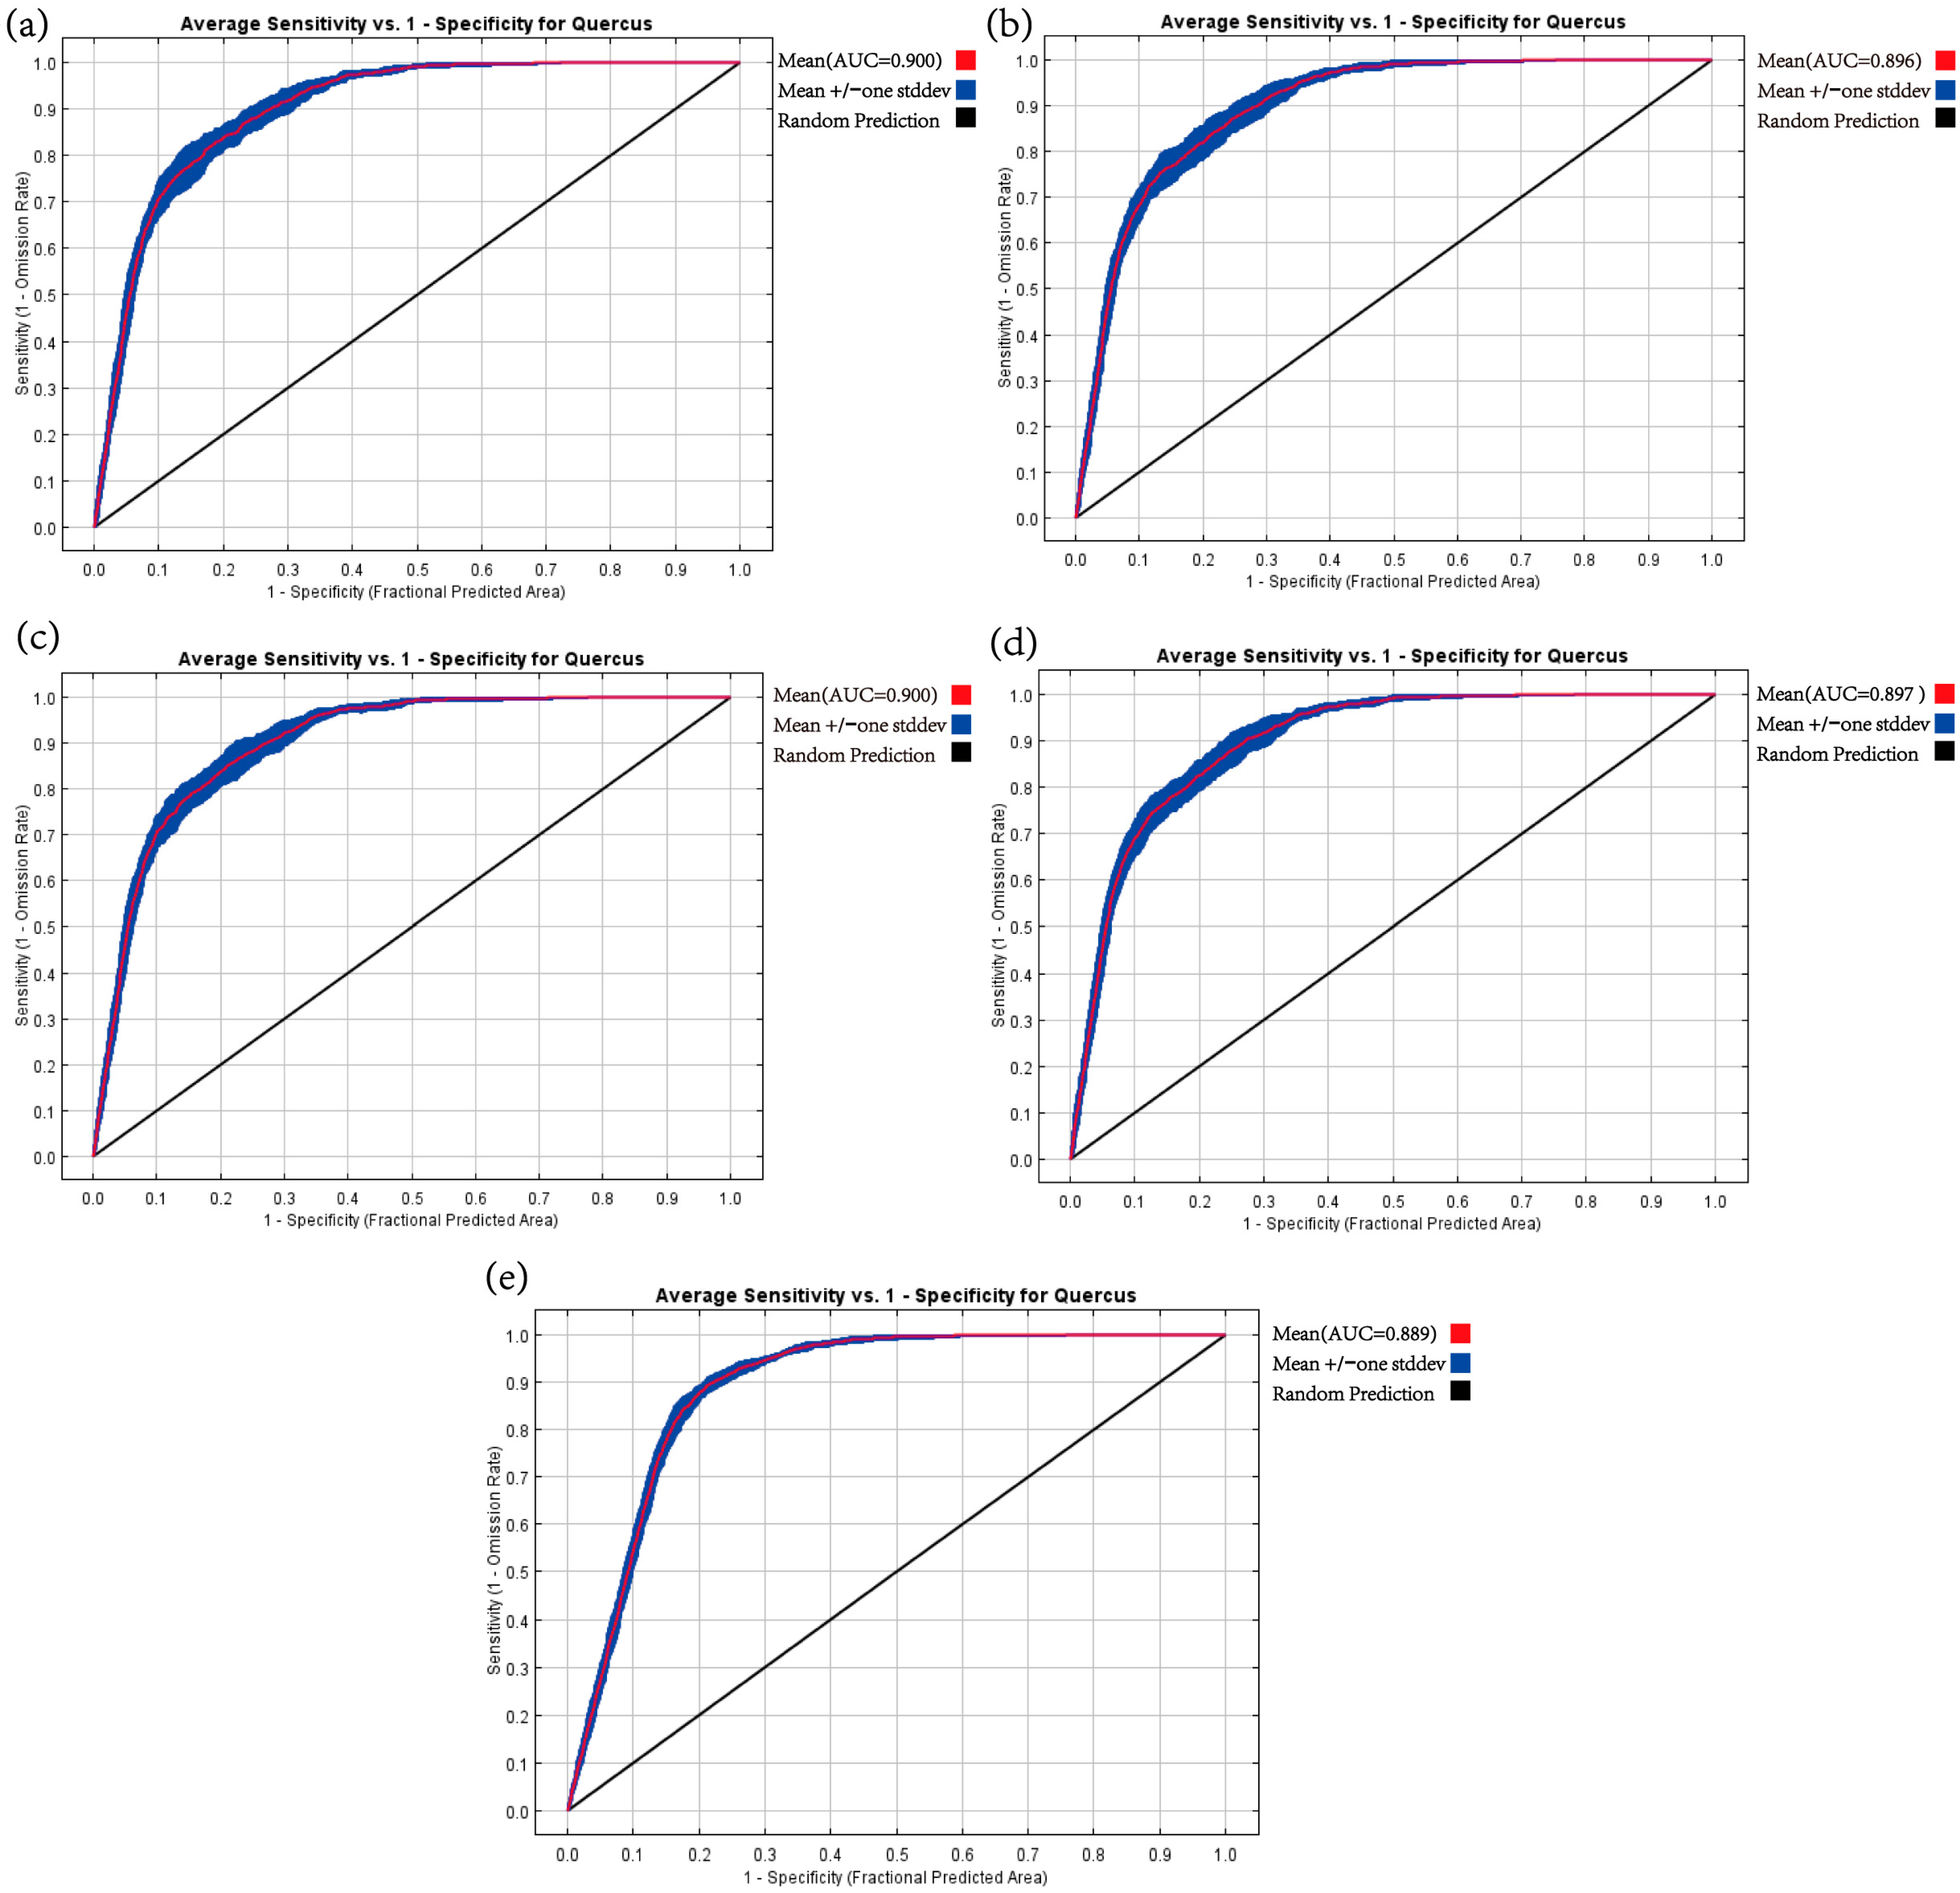
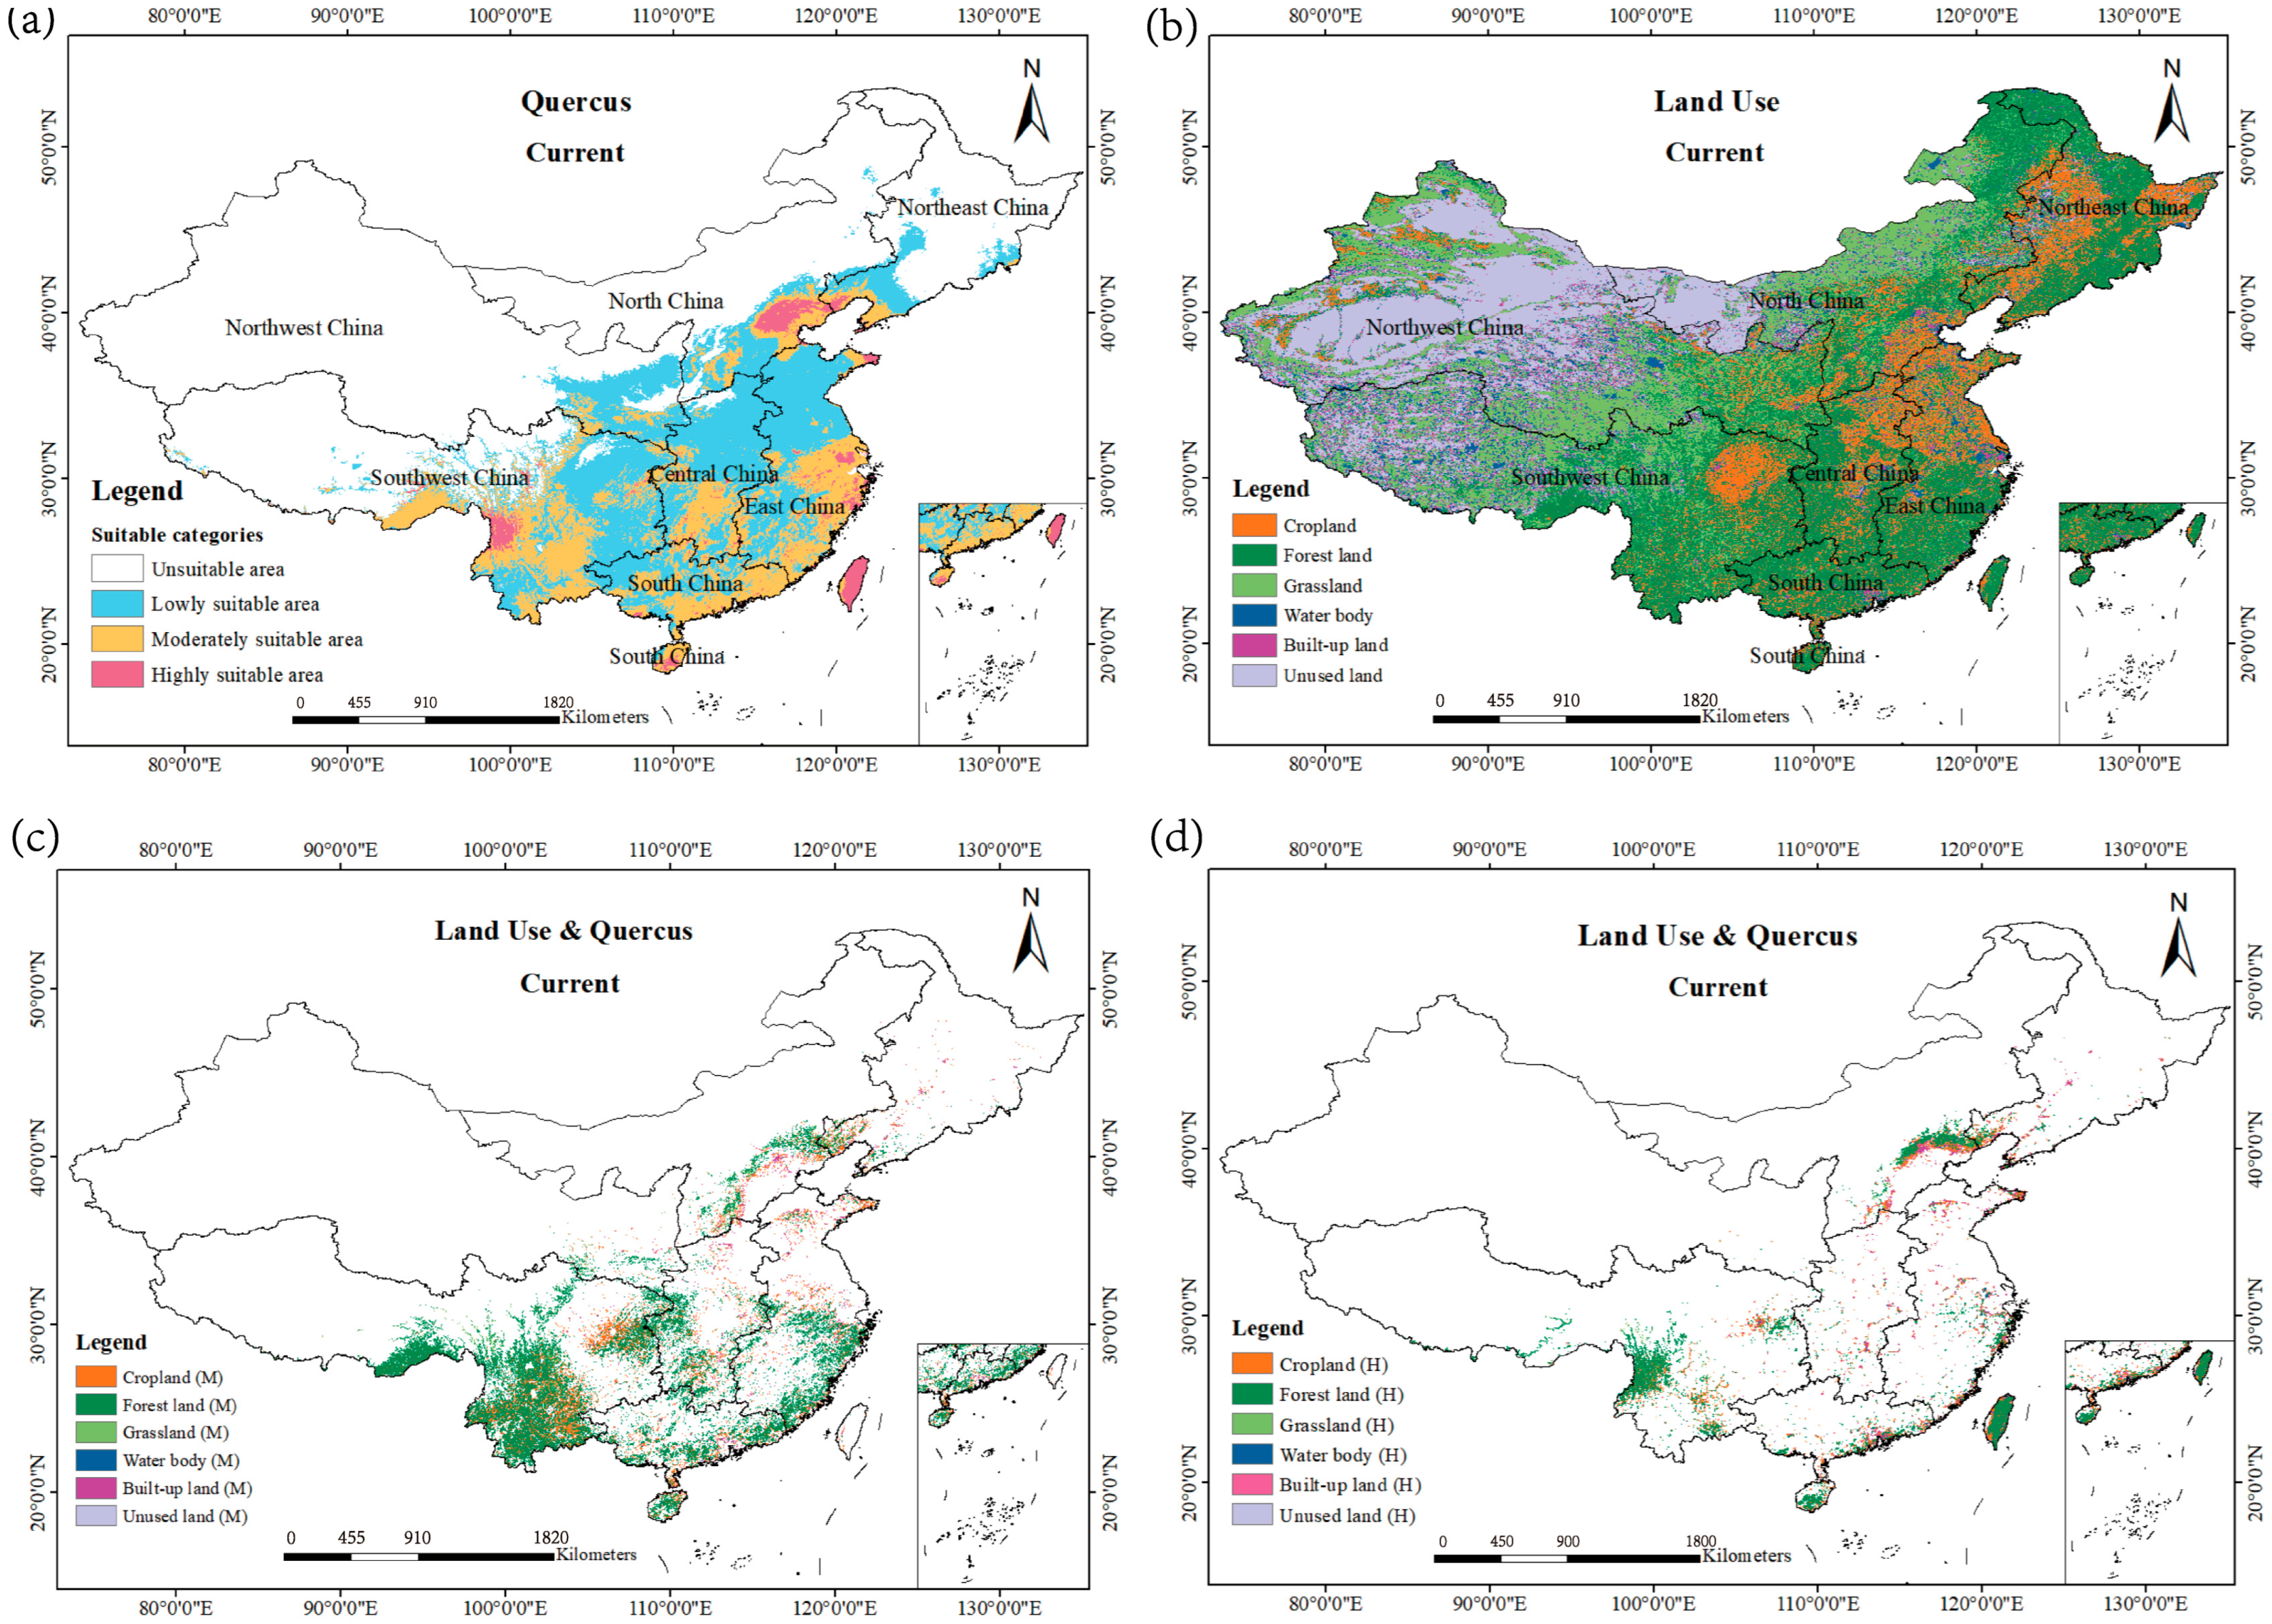
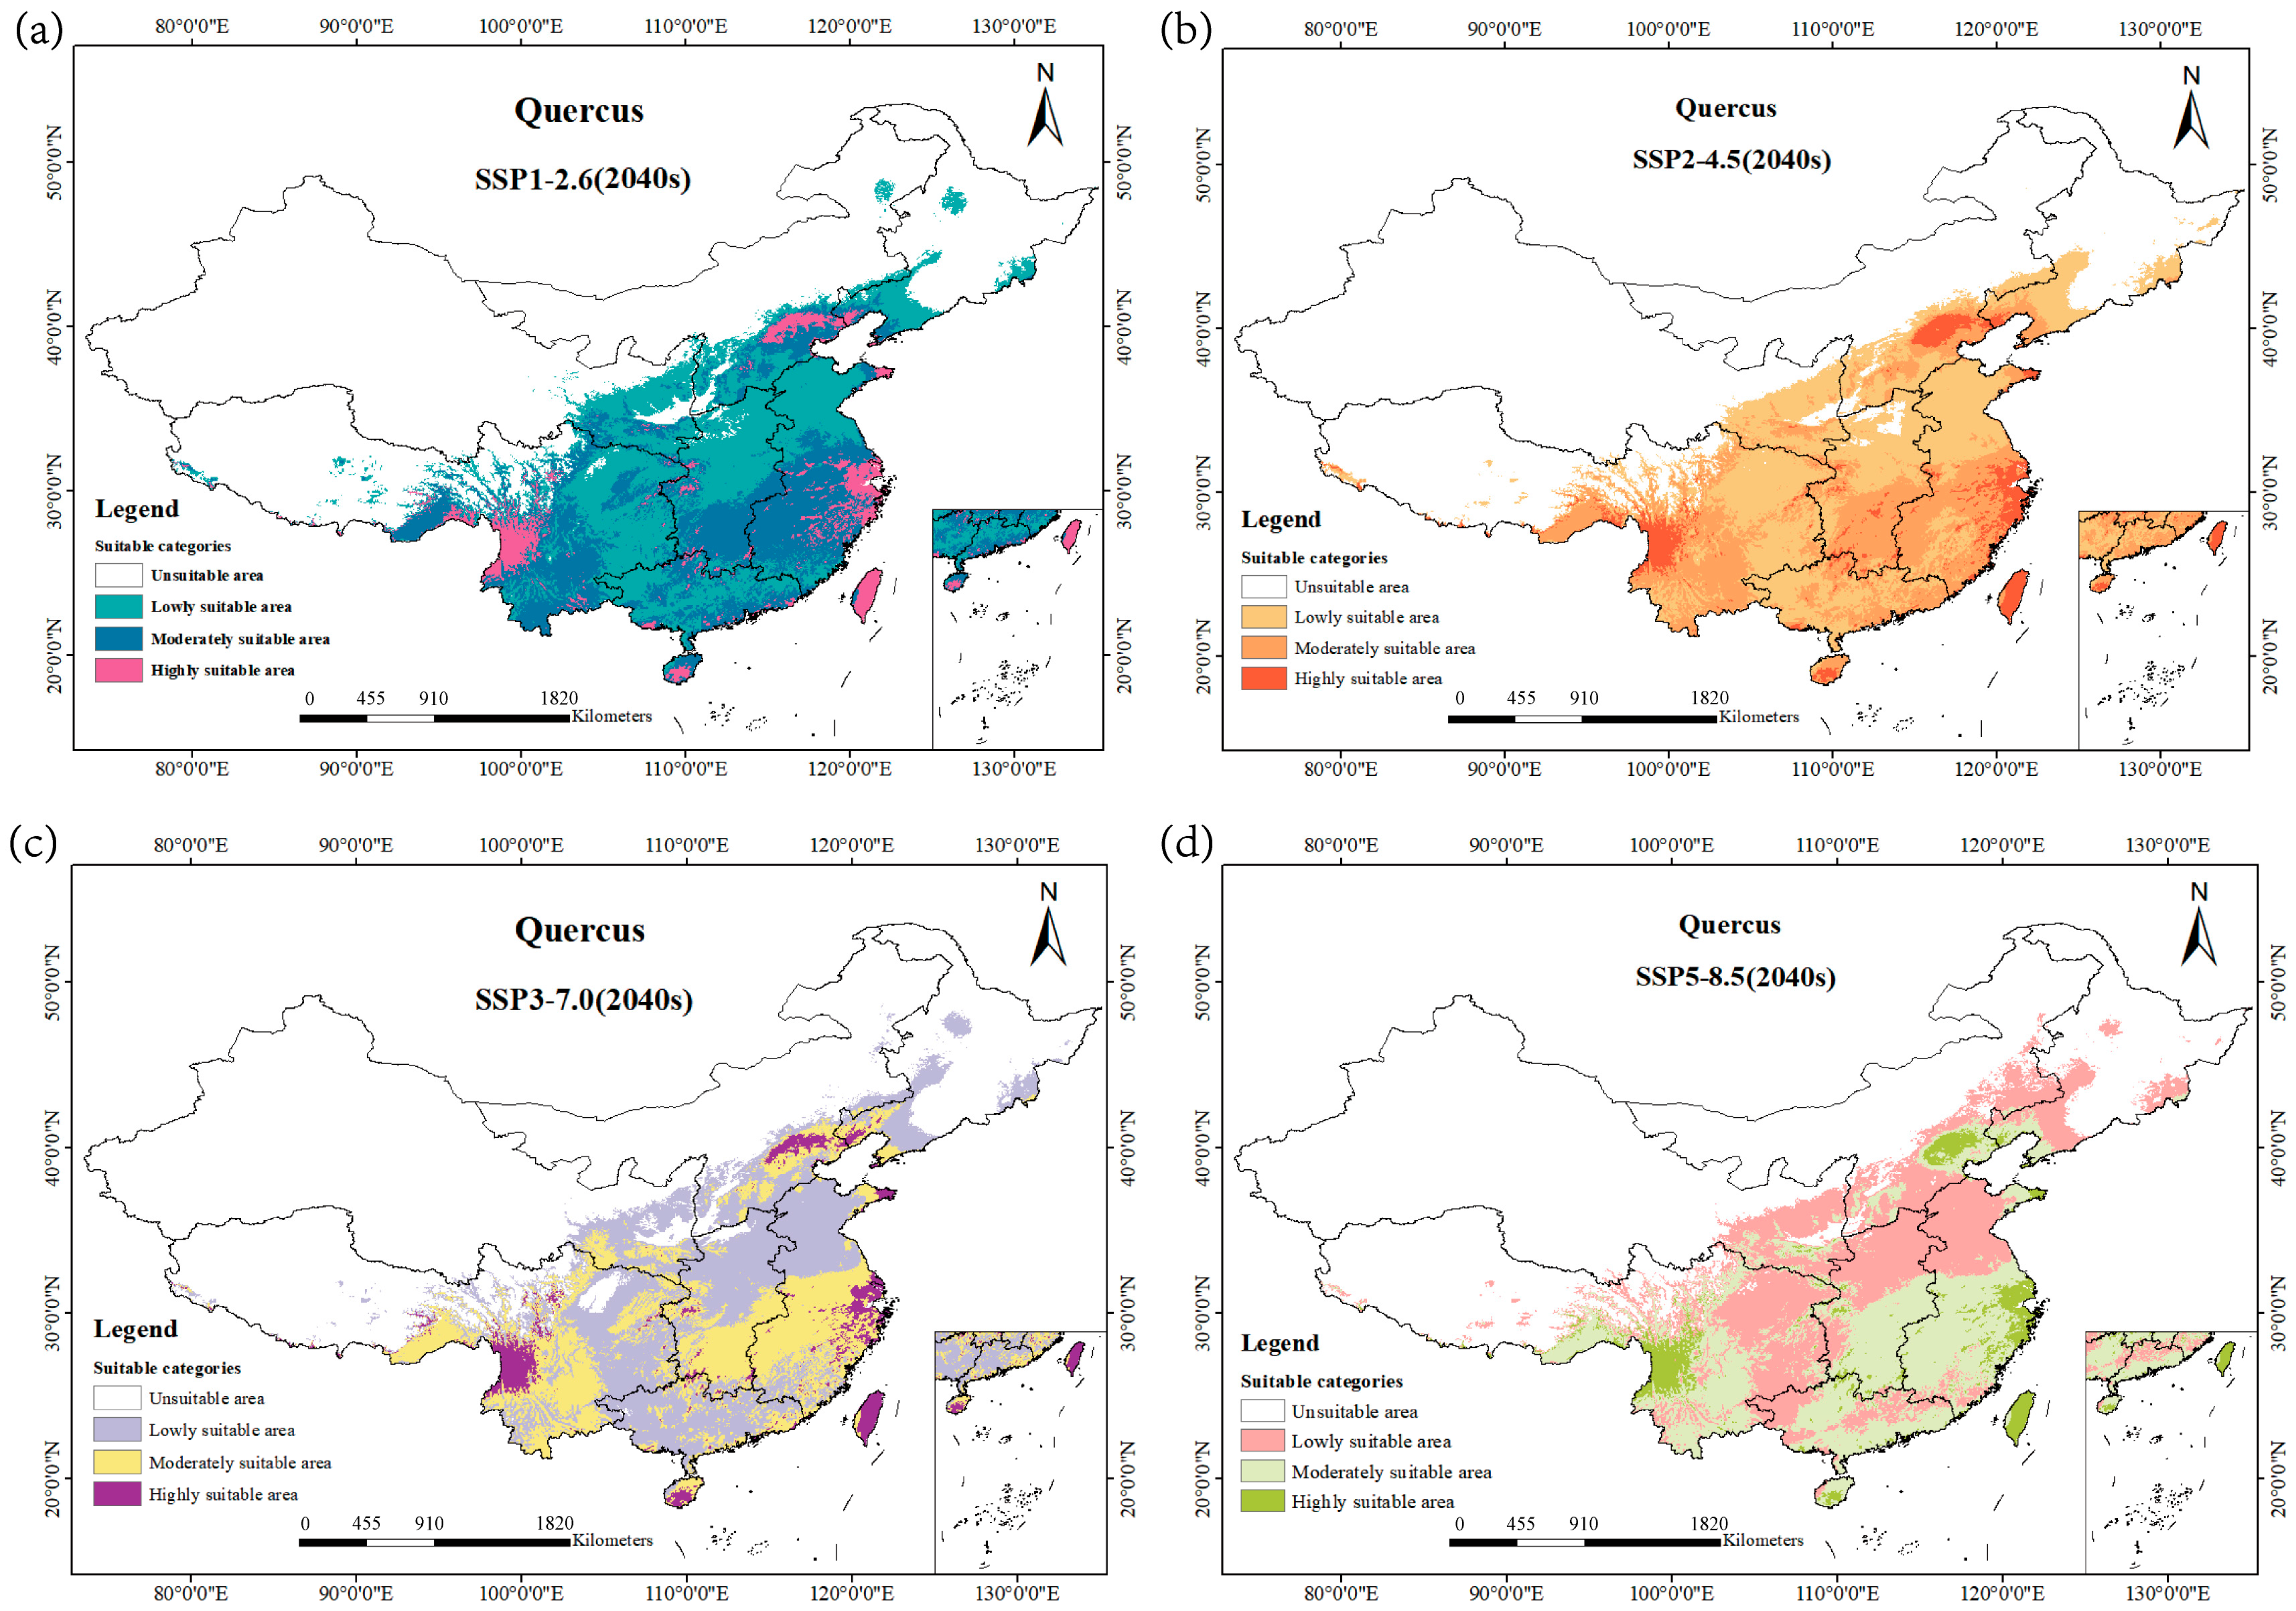
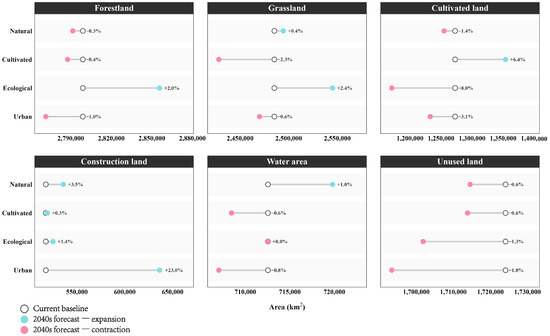
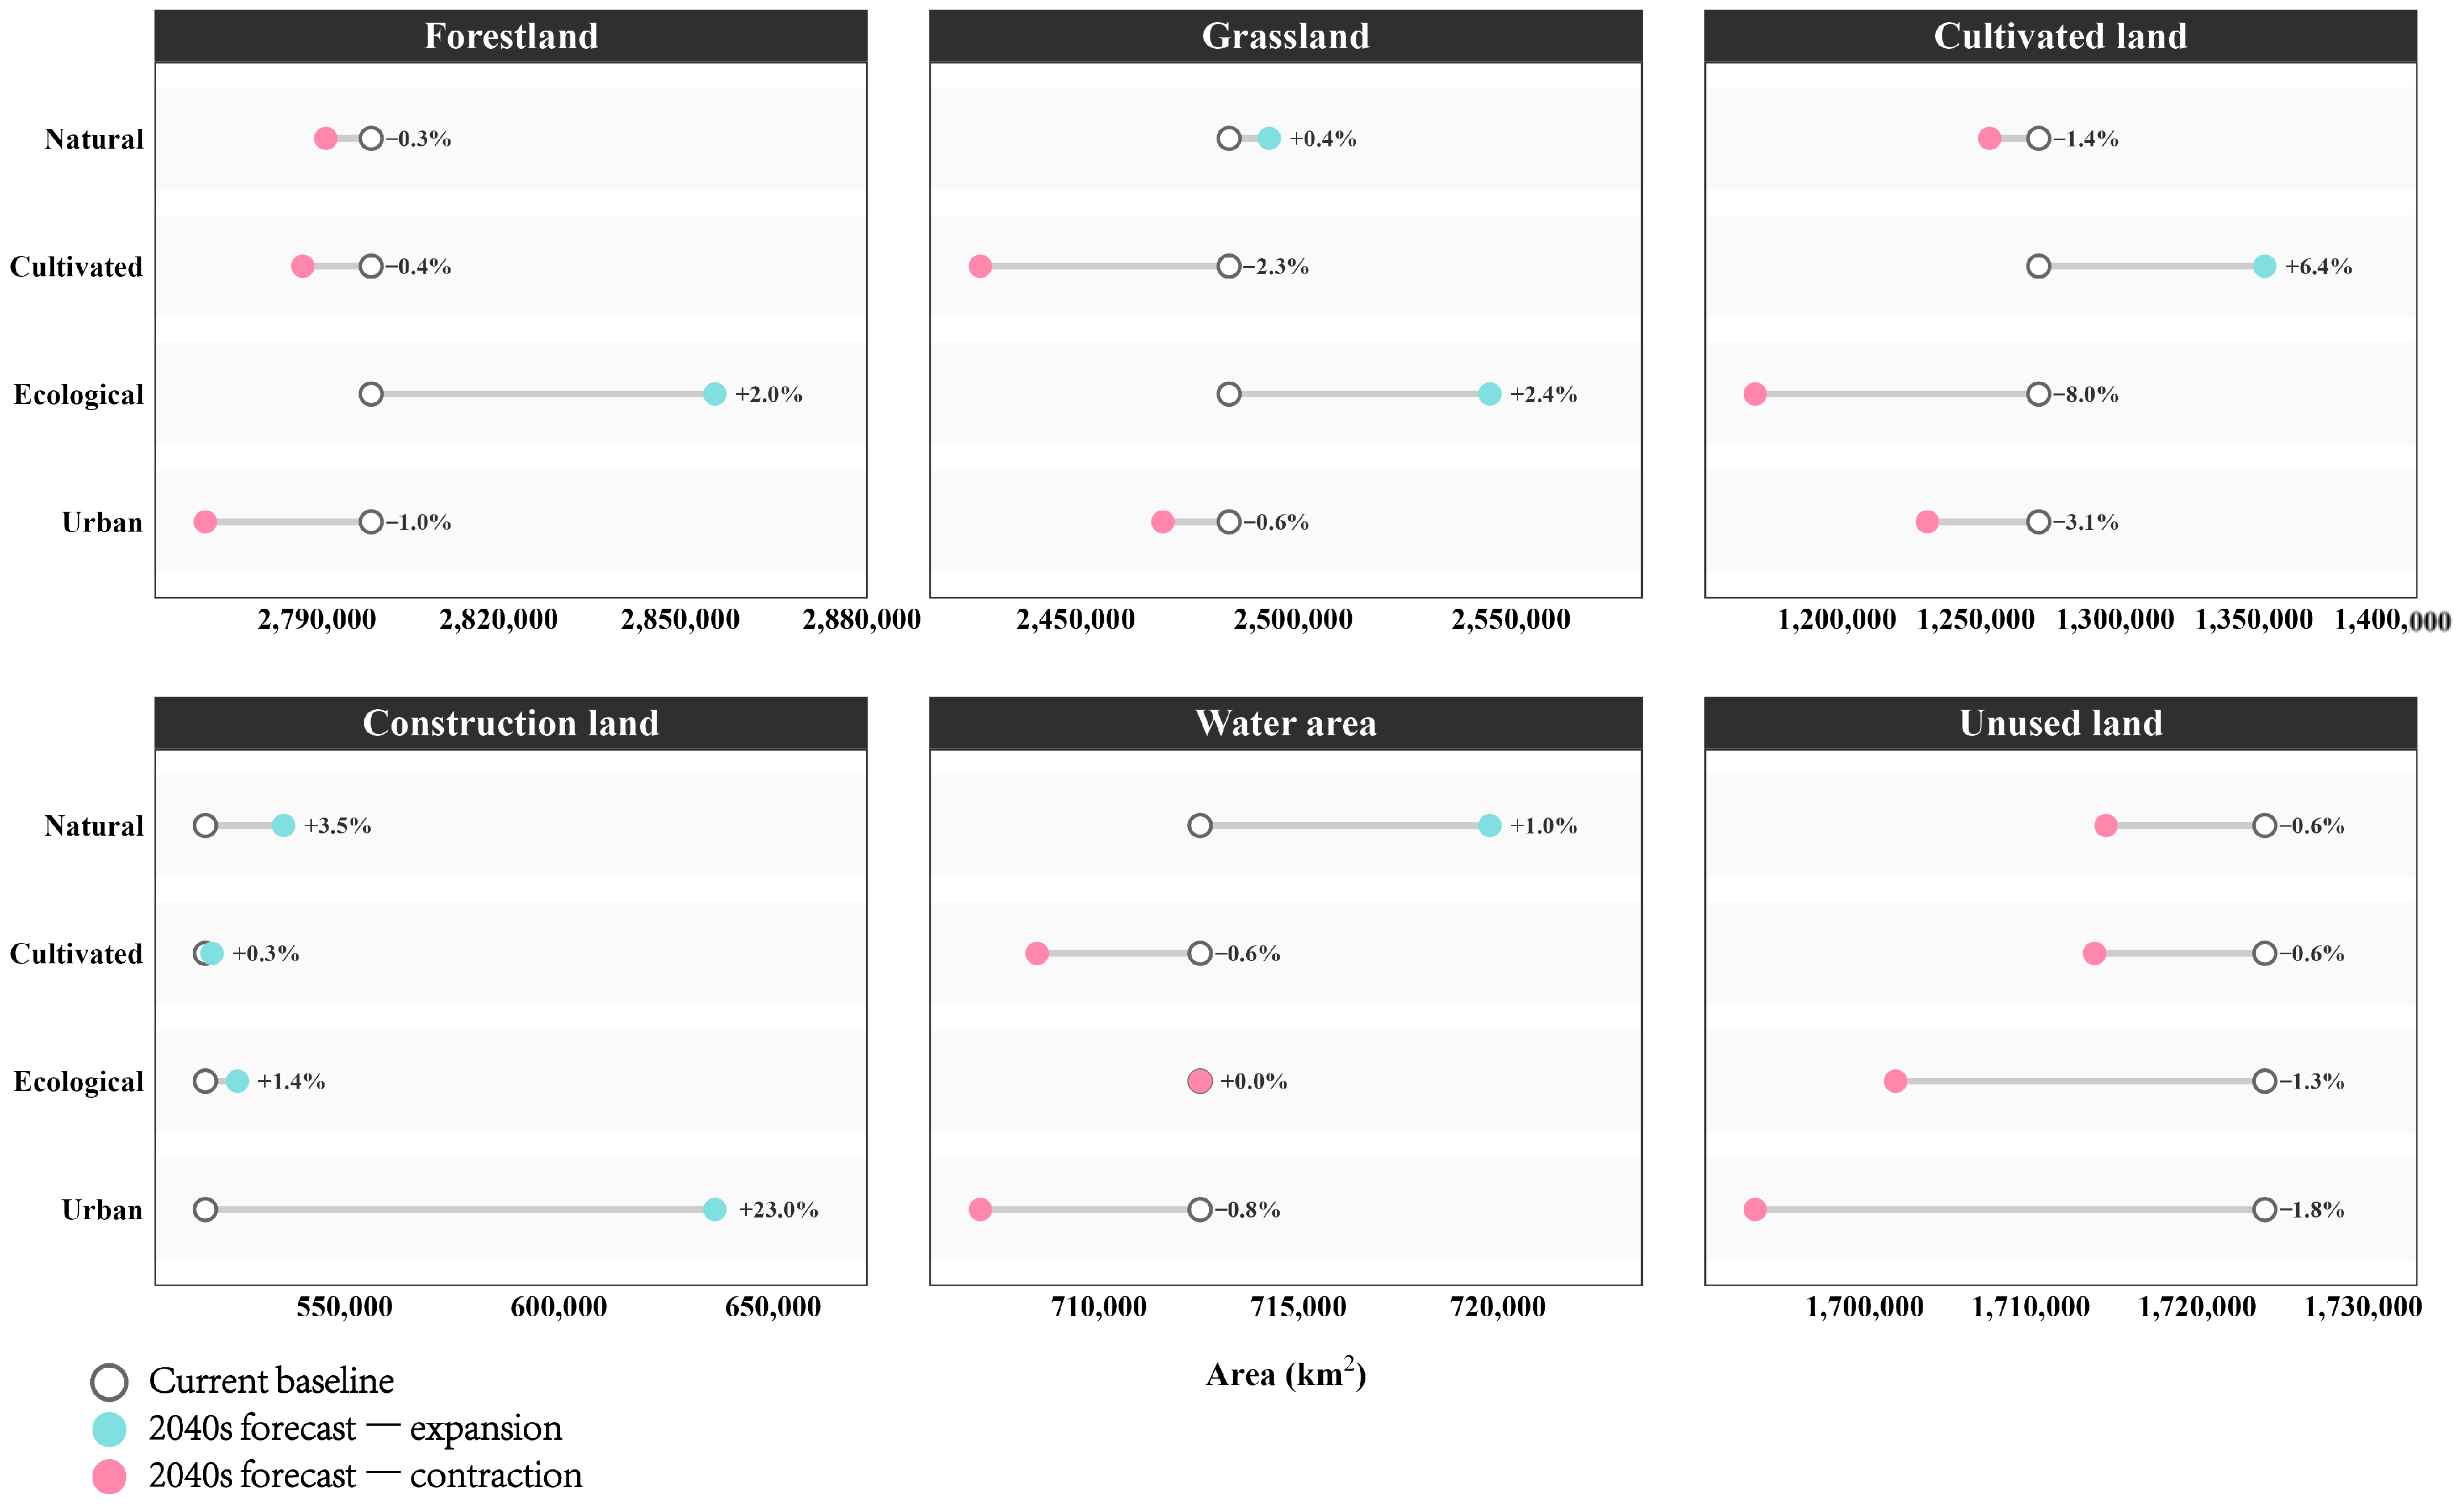
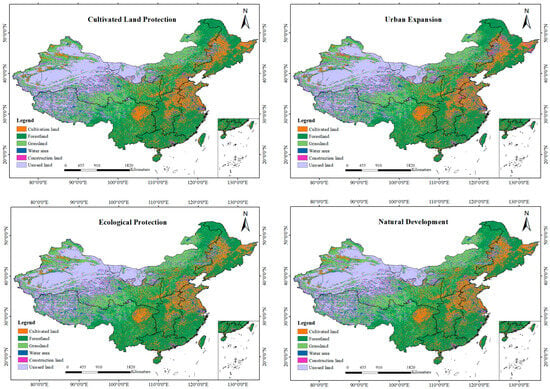
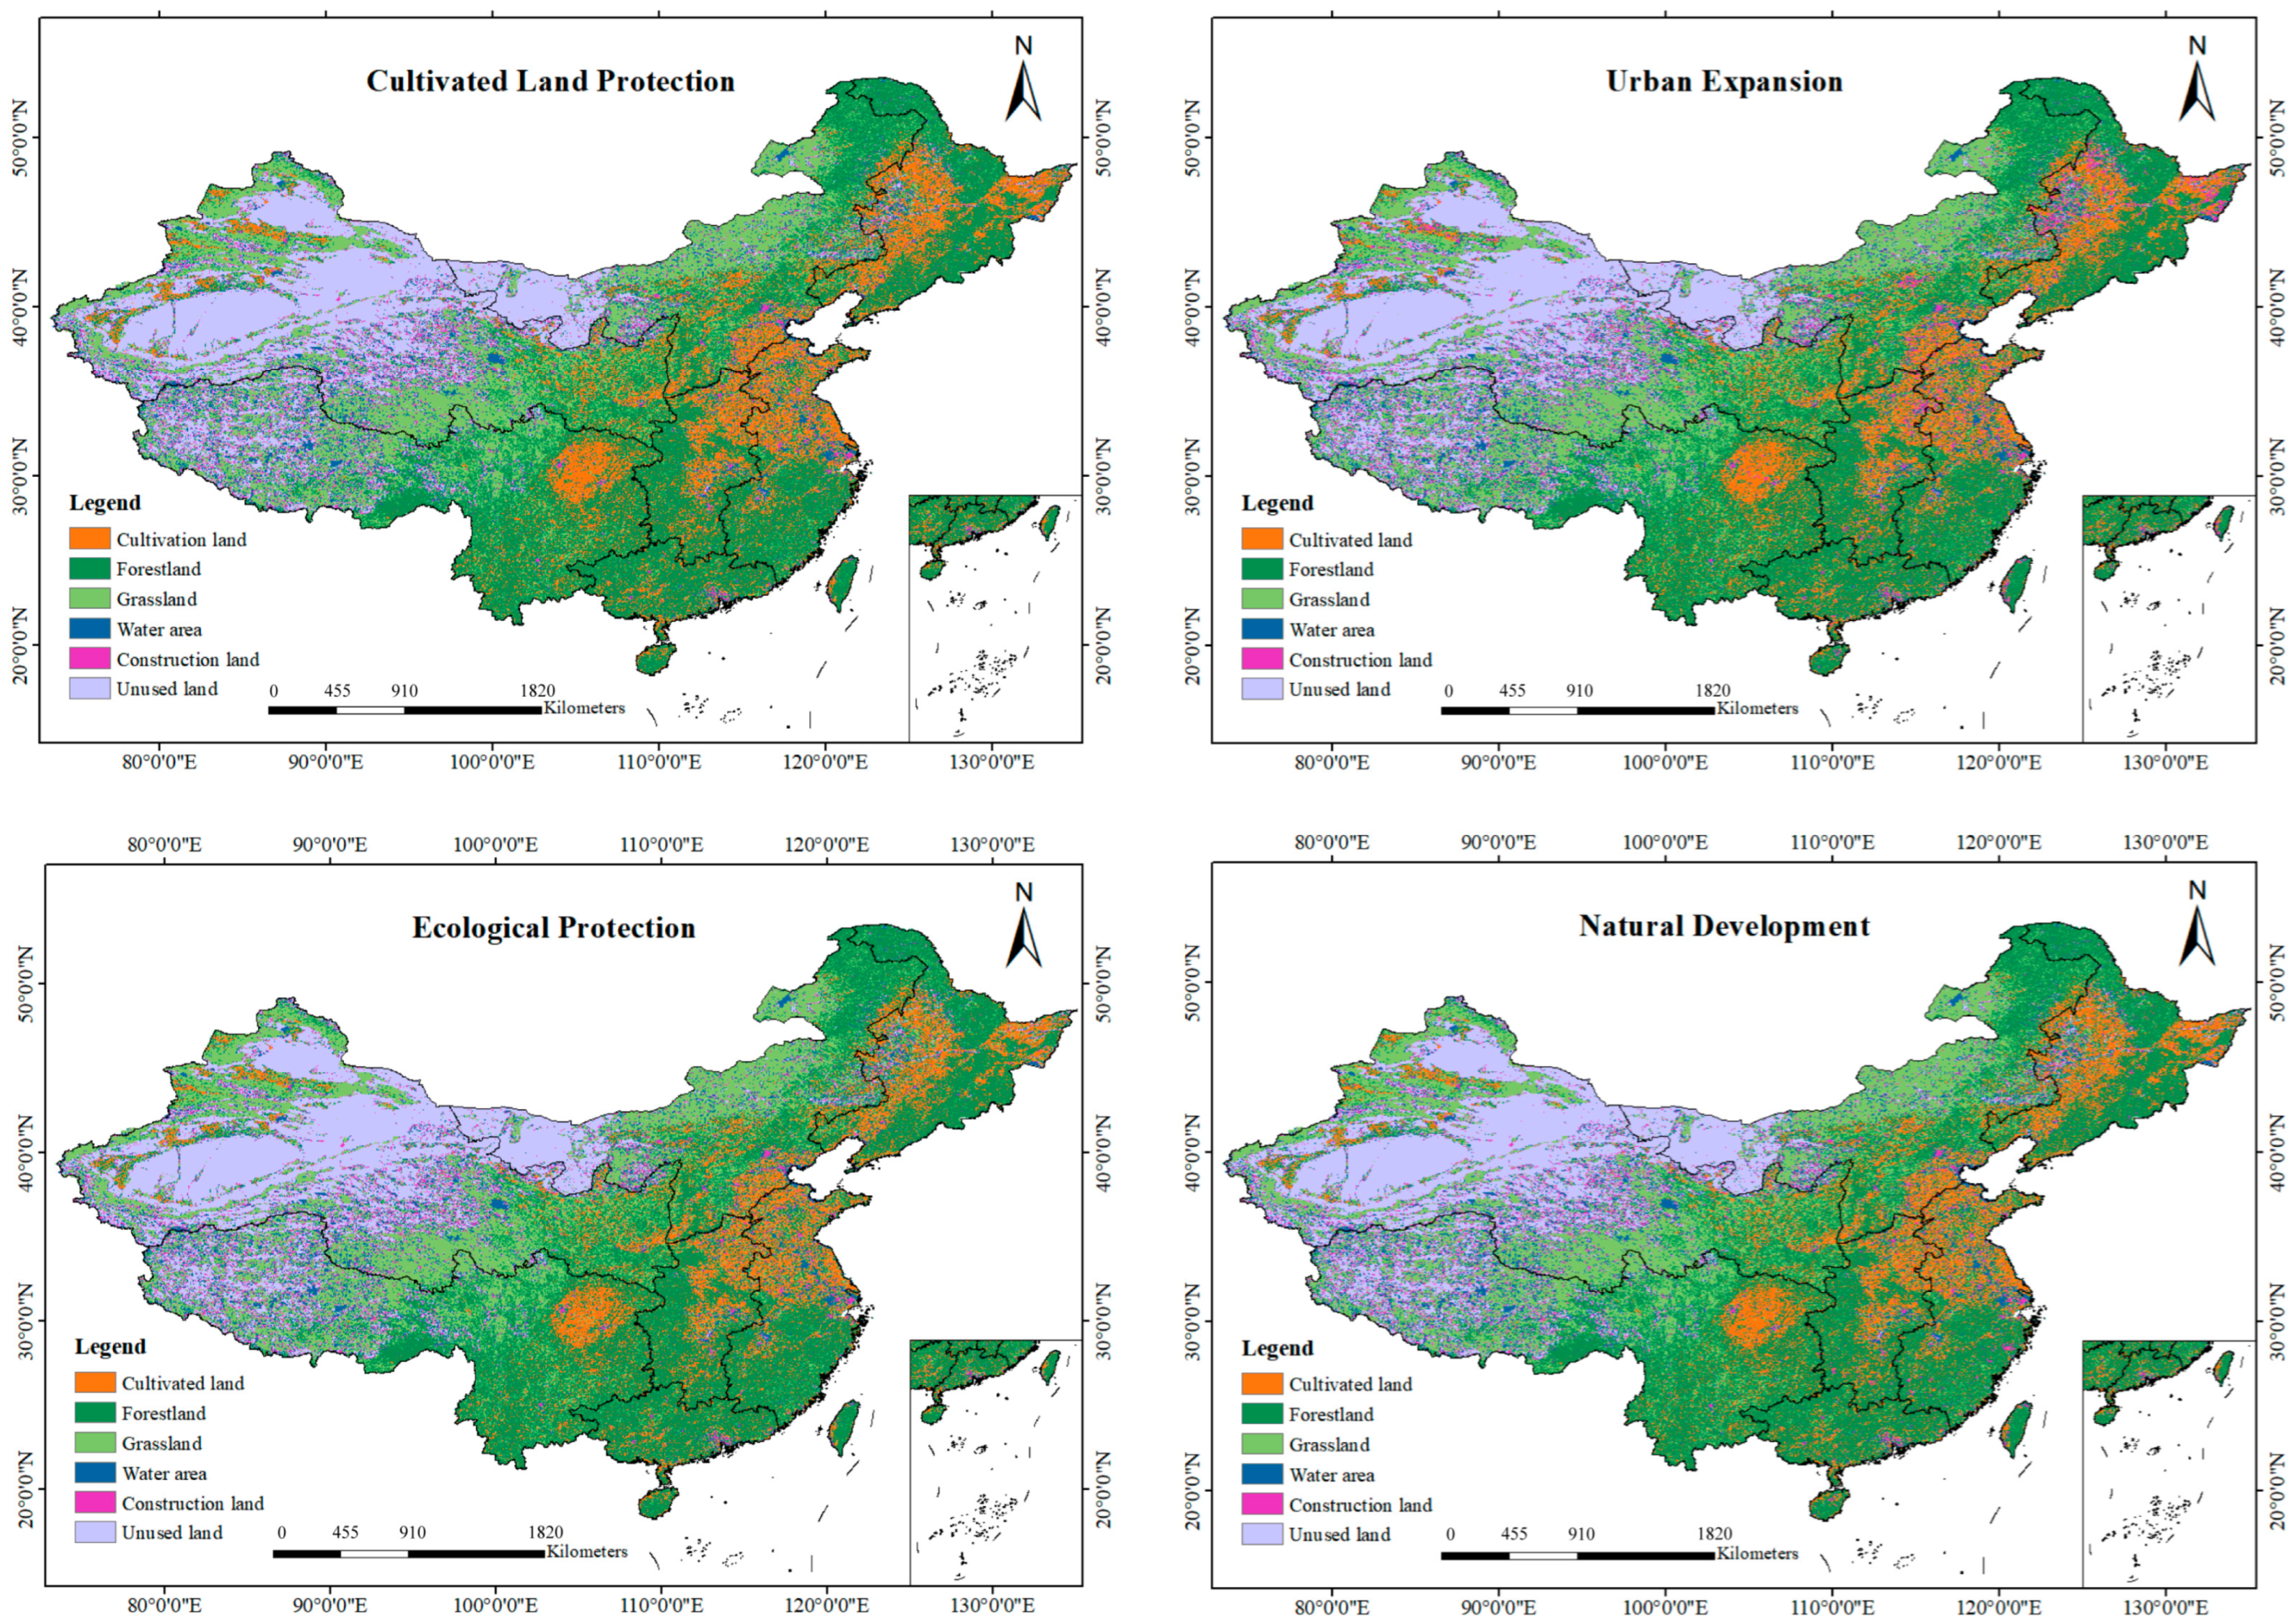
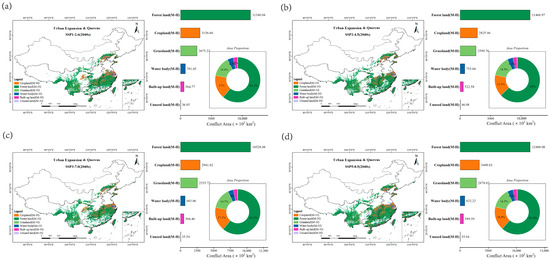
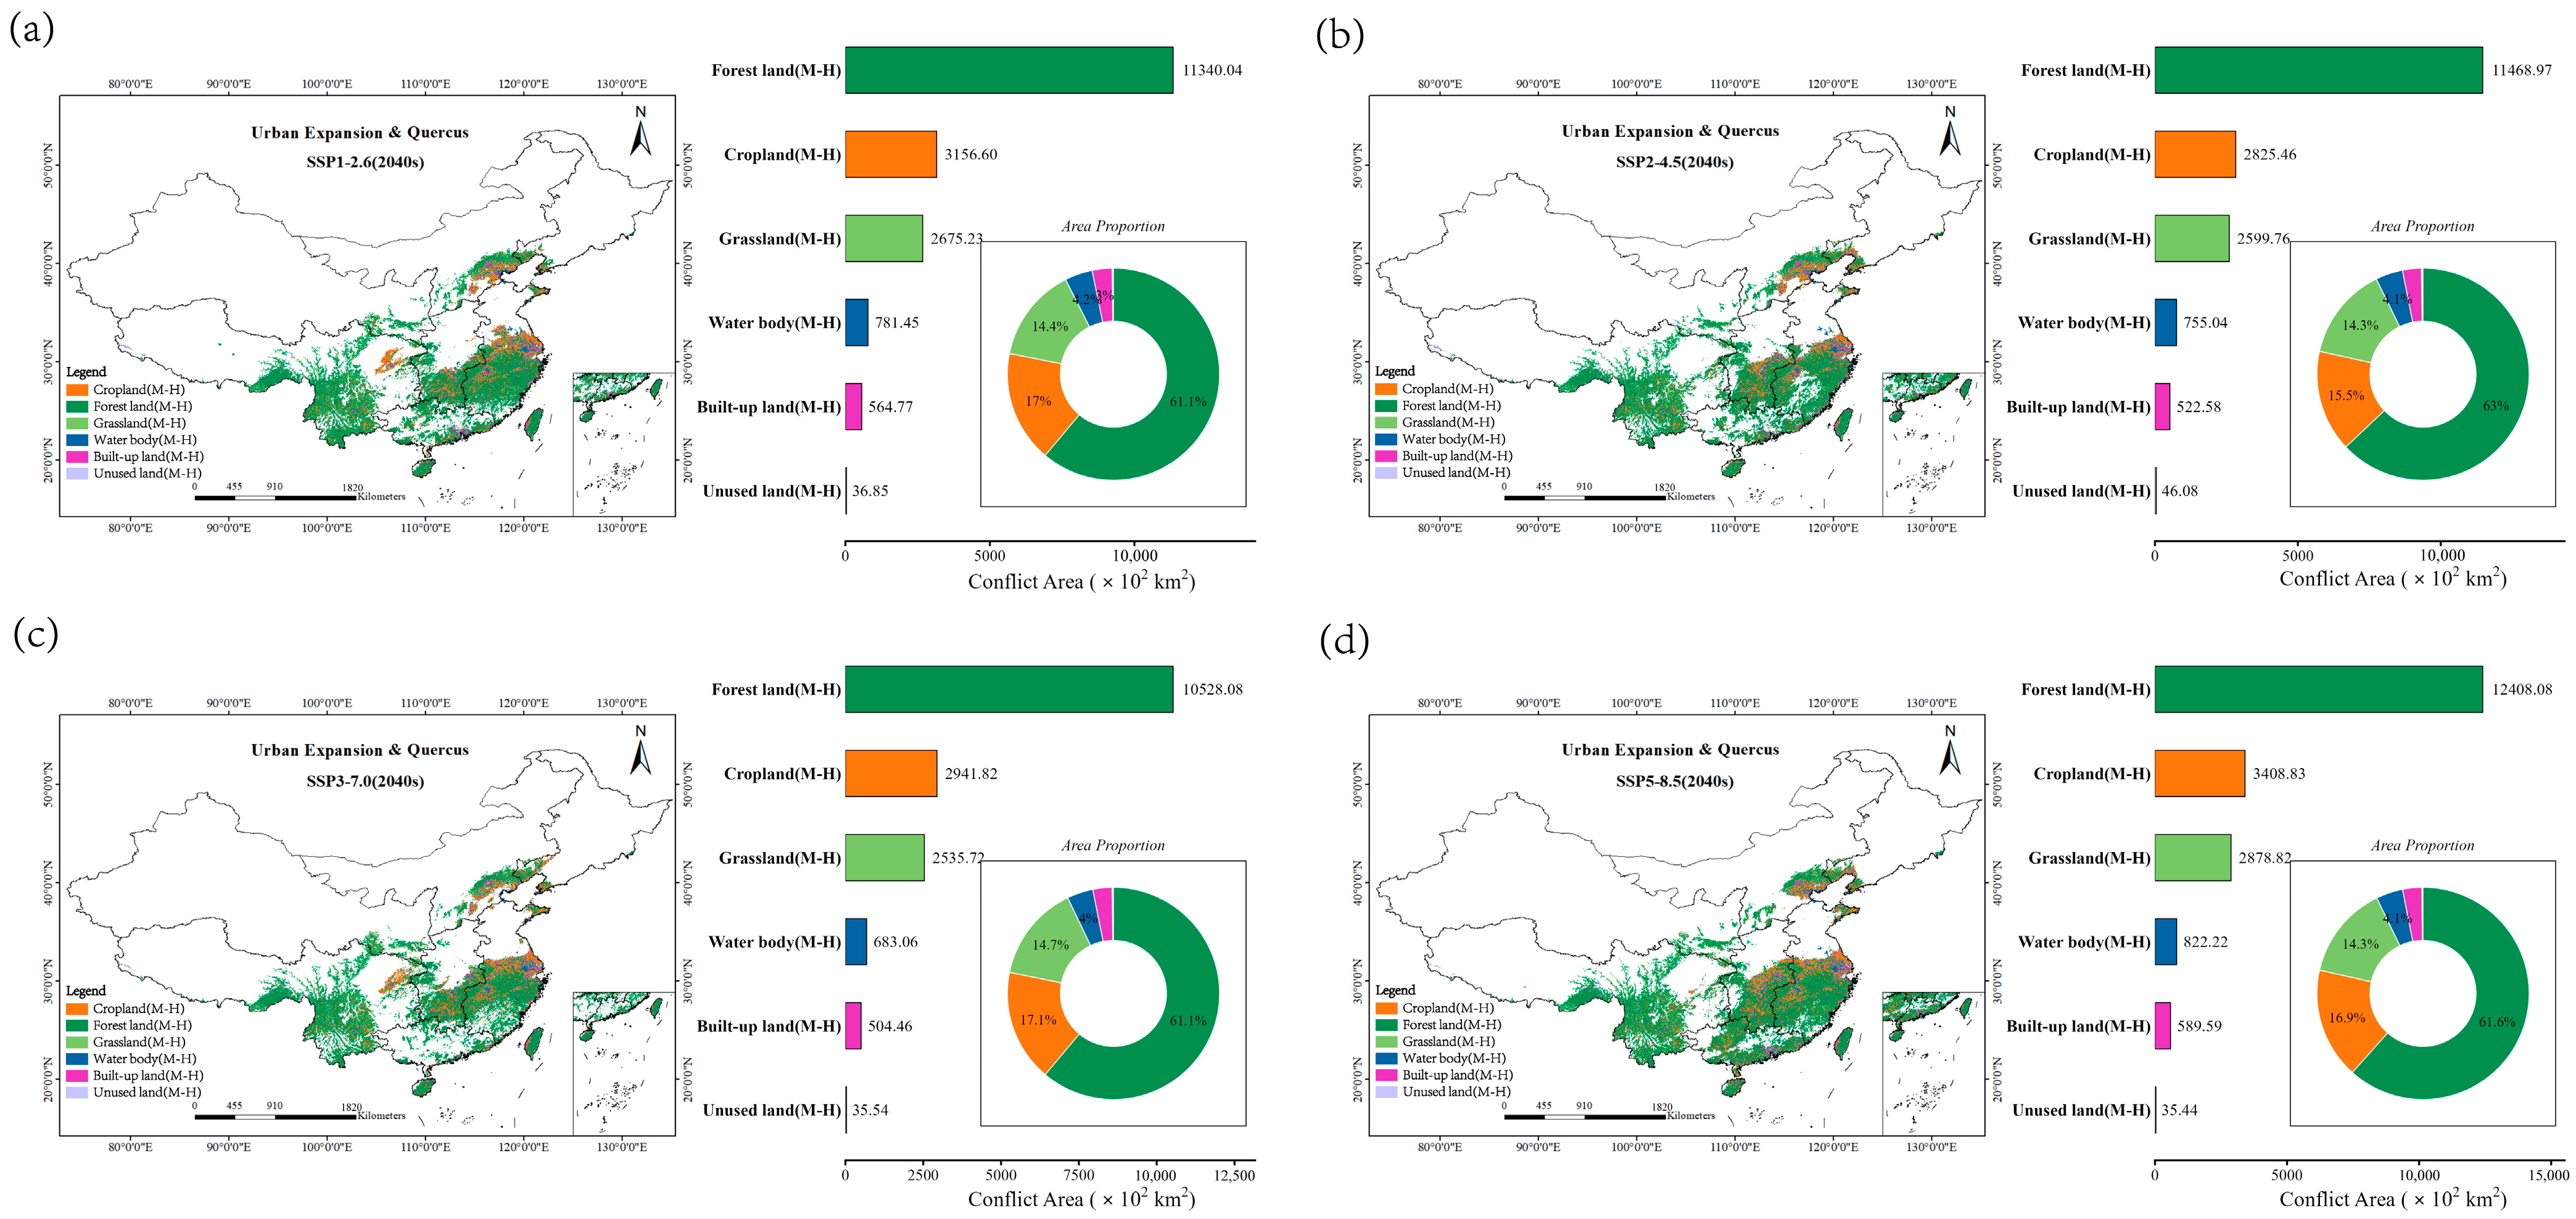
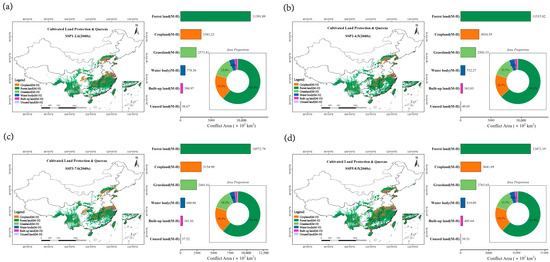
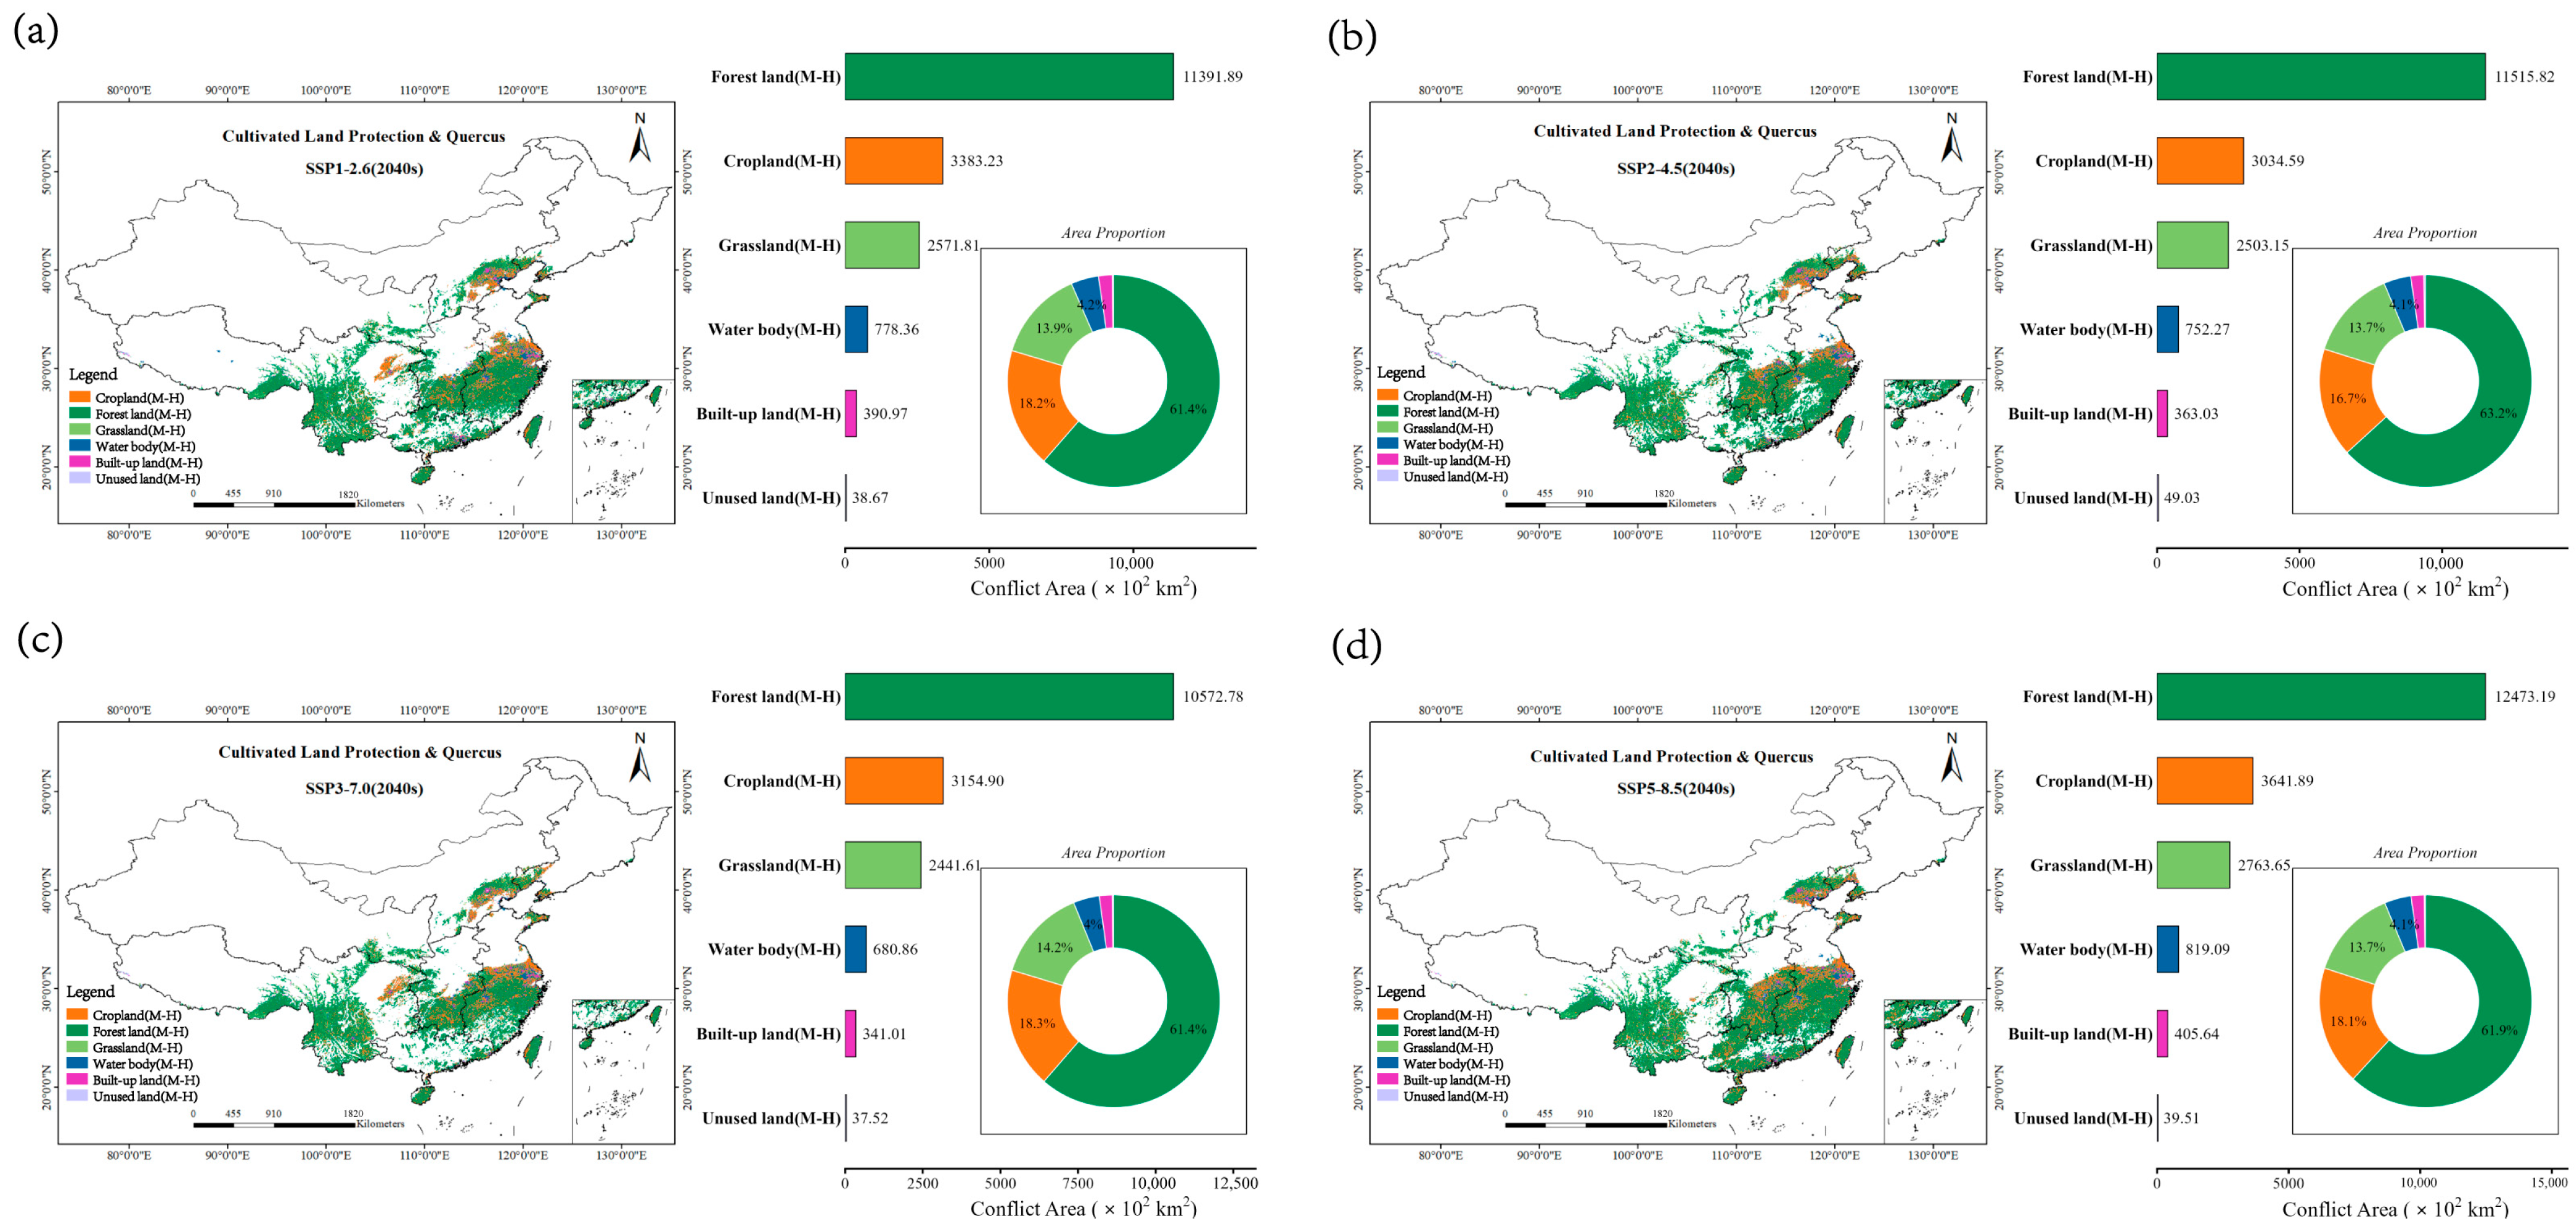
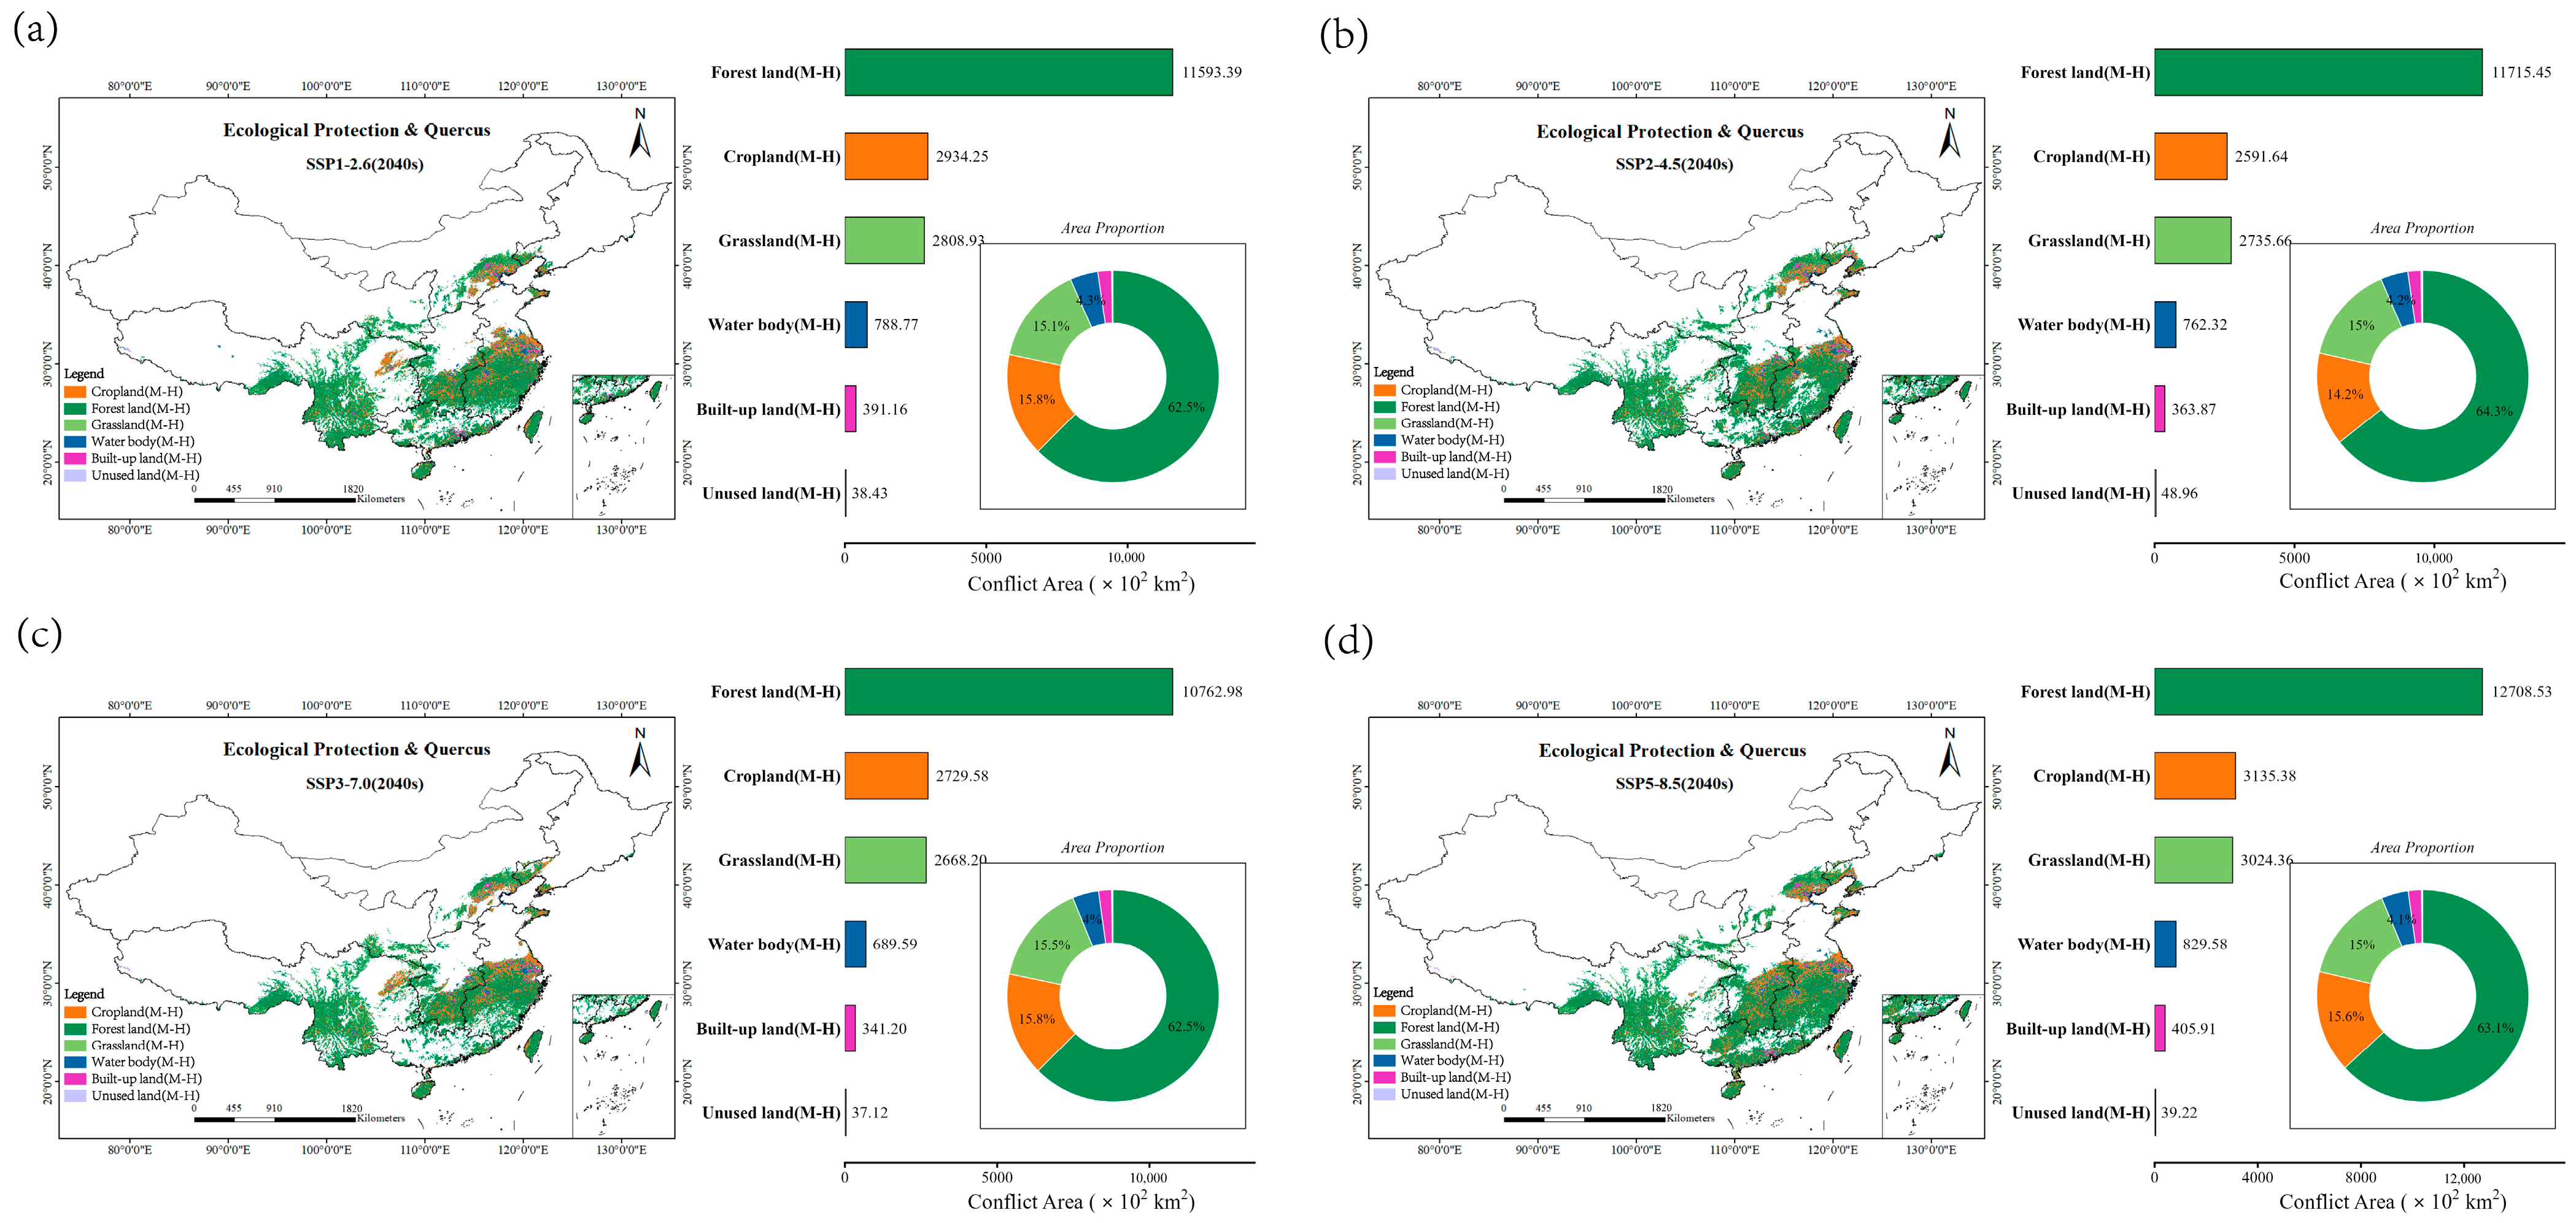
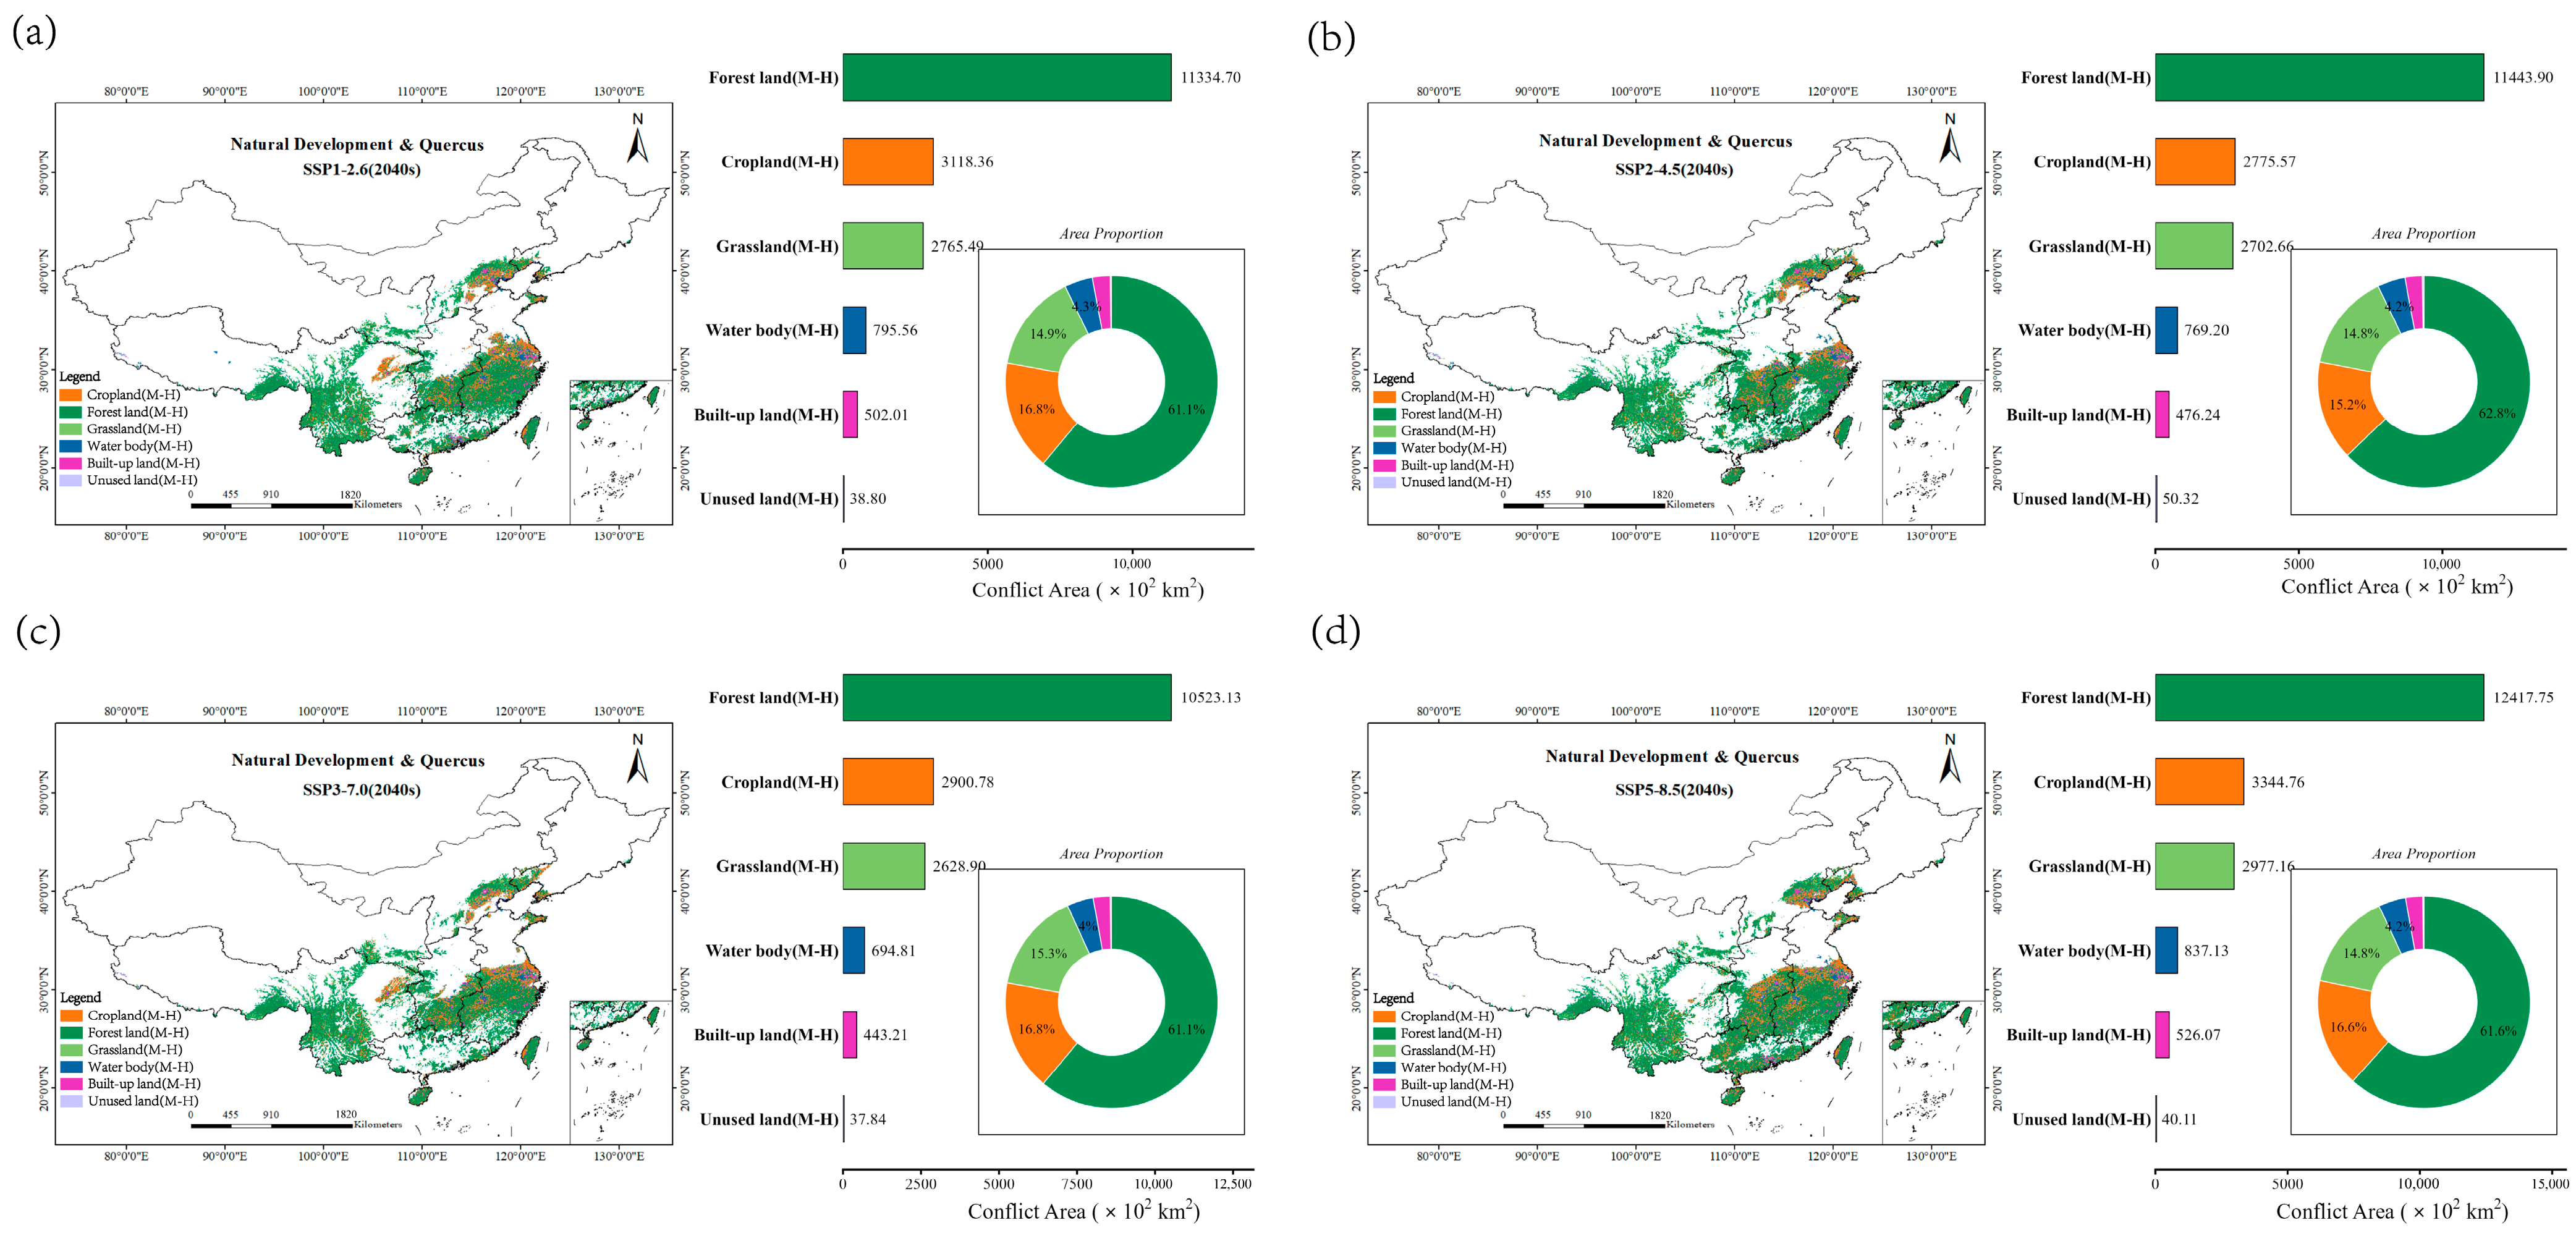
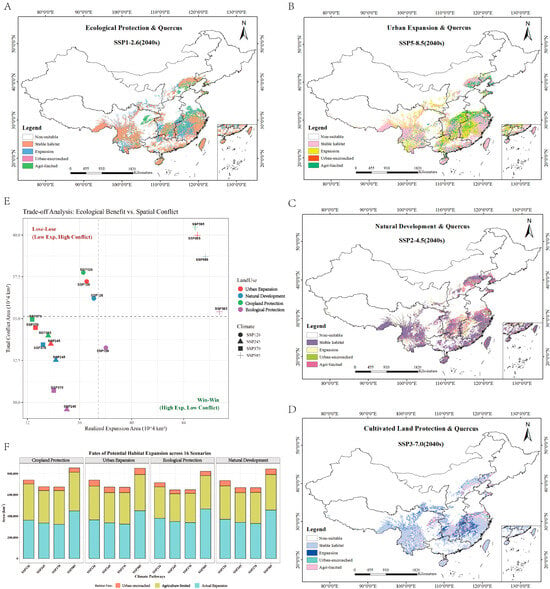
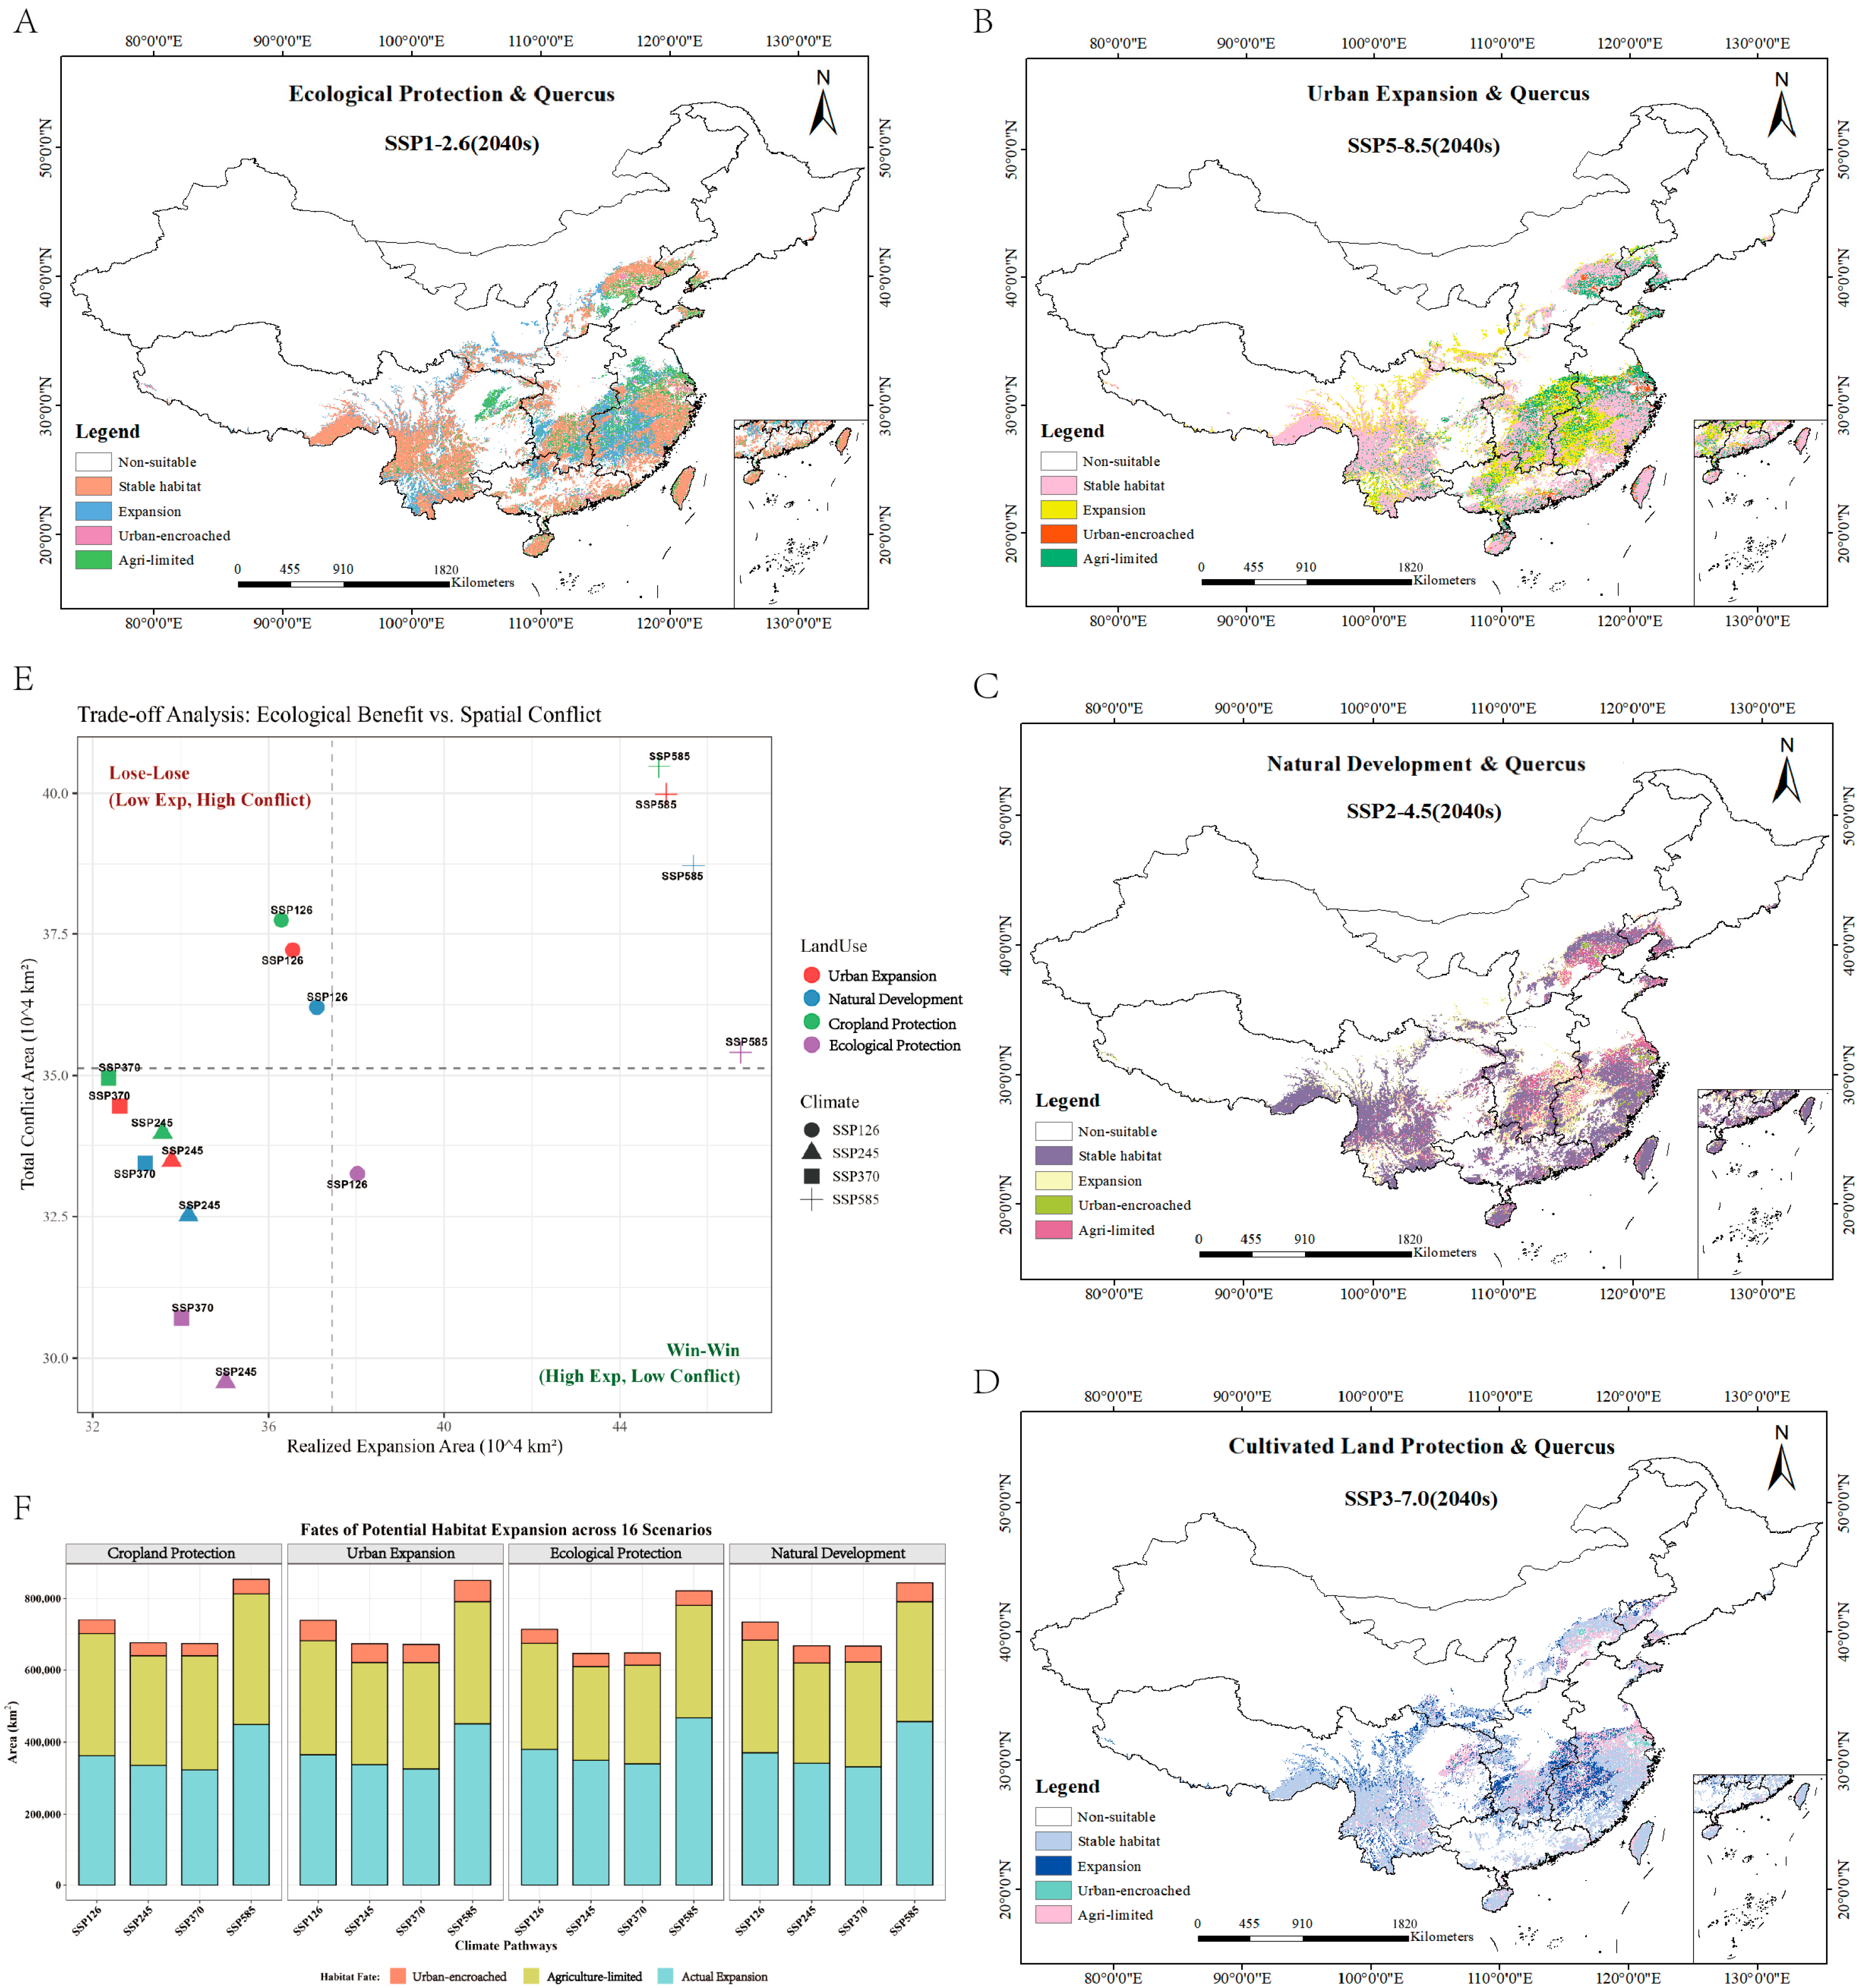

Disclaimer/Publisher’s Note: The statements, opinions and data contained in all publications are solely those of the individual author(s) and contributor(s) and not of MDPI and/or the editor(s). MDPI and/or the editor(s) disclaim responsibility for any injury to people or property resulting from any ideas, methods, instructions or products referred to in the content. |
© 2026 by the authors. Licensee MDPI, Basel, Switzerland. This article is an open access article distributed under the terms and conditions of the Creative Commons Attribution (CC BY) license.