Article

Inundation Monitoring in Rice Fields Using ALOS-2 PALSAR-2: A Case Study of An Giang, the Mekong Delta in Vietnam

1
Ho Chi Minh City Space Technology Application Center, Vietnam National Space Center, Vietnam Academy of Science and Technology, 1 Mac Dinh Chi Street, Sai Gon Ward, Ho Chi Minh City 700000, Vietnam
2
Centre D’Etudes Spatiales de la Biosphère, 31400 Toulouse, France
3
Japan Aerospace Exploration Agency, Tsukuba 305-8505, Japan
*
Author to whom correspondence should be addressed.
Remote Sens. 2026, 18(13), 2190; https://doi.org/10.3390/rs18132190
Submission received: 29 April 2026 / Revised: 10 June 2026 / Accepted: 29 June 2026 / Published: 4 July 2026

Highlights

What are the main findings?
  • A significant relationship was identified between ALOS-2 PALSAR-2 VV-polarized backscatter and the inundation status of rice fields across different phenological stages. L-band SAR demonstrated strong penetration capability through dense canopies, effectively overcoming the signal saturation limitations typical of C-band sensors to distinguish inundation status throughout the growth cycle. Sentinel-1 (C-band) data exhibited high sensitivity to phenology variations, allowing for the estimation of rice age (days after planting—dap).
  • An integrated classification model combining L-band VV backscatter with C-band-derived phenological information achieved an overall accuracy of 81% (Kappa = 0.77), confirming the efficacy of combining L-band and C-band SAR for inundation monitoring in paddy fields.
What are the implications of the main findings?
  • The study validates the complementary strengths of multi-frequency SAR (synthetic aperture radar) data. While L-band signal penetrates the canopy to detect water, C-band data tracks phenology to refine classification thresholds. This fusion allows for operational monitoring where single-frequency approaches often prove difficult.
  • Spatially and temporally explicit inundated rice maps derived from this method provide critical data for Measurement, Reporting, and Verification (MRV) systems. This supports accurate quantification of methane (CH4) emissions under IPCC guidelines and facilitates the scaling of water-saving practices like Alternate Wetting and Drying (AWD) in Vietnam’s Mekong Delta, contributing to both food security and climate change mitigation.

Abstract

Accurate monitoring of inundation in rice paddies is essential for optimizing water use efficiency and mitigating methane emissions; yet, detecting water beneath dense rice canopies remains a major challenge. This study proposed a reliable classification approach applied to the Winter–Spring 2025 season in An Giang province, Vietnam, by integrating multi-temporal ALOS-2 PALSAR-2 (L-band) and Sentinel-1 (C-band) SAR data with in situ field surveys. Time-series Sentinel-1 observations were used to estimate rice phenology (rice age), while multi-polarization backscatter from ALOS-2 PALSAR-2 was analyzed to discriminate inundated from non-inundated conditions across different growth stages. Results demonstrated that L-band signals, particularly in VV polarization, penetrated dense vegetation effectively, enabling classification of inundated vs. non-inundated fields with an overall accuracy of 81% and a Kappa coefficient of 0.77. The resulting multi-date inundation maps revealed distinct flooding regimes consistent with local field survey observations. These findings demonstrated the potential of L-band VV SAR data for characterizing sub-canopy inundation conditions under rice canopies. Crucially, the approach provides essential data for greenhouse gas inventories and supports the verification of low-emission water management practices, such as Alternate Wetting and Drying (AWD). Overall, the study demonstrated the value of multi-frequency SAR integration for advancing agricultural monitoring and climate-smart management in rice-growing regions.

1. Introduction

Rice is a staple food crop sustaining more than half of the world’s population [1] and serves as a primary livelihood source for smallholder farmers in Asia. The Mekong Delta (MD), one of the largest and most productive rice-growing regions in Vietnam, contributes significantly to national food security and rice exports. However, the sustainability of rice production in this region faces increasing water-related challenges, including flooding in the rainy season [2,3], drought and saline intrusion in the dry season [4,5] and hydrological alterations due to upstream dam construction [2,6]. Given its complex hydrological system, the Mekong Delta region is constantly facing fluctuations in water resources, especially flooding during the crop season. These conditions may become more severe under the impact of climate change, land subsidence and sea level rise, increasing the vulnerability of lowland rice ecosystems.
Flooding in rice fields is a critical determinant of rice growth [7,8], water management [9,10] and greenhouse gas (GHG) emissions [11,12]. During cultivation, rice fields are frequently flooded, creating anaerobic conditions that facilitate methane emissions [13]. Since rice acts as a major source of global anthropogenic CH4 emissions (accounting for approximately 11%) [14], effective water management is crucial. Flooding in rice fields can reduce nutrient uptake, affecting plant growth [15]. Flooding can suppress weeds at certain stages, but if prolonged or uncontrolled, it can cause crop damage, reduce yields, and increase methane emissions. Conversely, controlled water management helps save water and limit GHG emissions [12,16]. Therefore, accurate and timely monitoring of the inundation status of rice fields is a prerequisite for optimizing irrigation, improving water use efficiency, and minimizing climate impacts [17].
Existing literature highlights the potential of radar remote sensing to classify flooded and non-flooded areas [18,19,20,21,22], particularly for implementing irrigation-saving measures such as Alternate Wetting and Drying. AWD is defined as a water-management practice where fields are periodically flooded and then allowed to dry to a specific soil-water threshold (usually −15 cm) before being re-flooded, instead of keeping the field continuously submerged. AWD has been shown to be an effective water-saving technique that reduces methane emissions while maintaining or improving rice yields [22,23]. AWD allows the soil to dry temporarily between irrigations, which breaks down anaerobic conditions and reduces methane production. To implement AWD on a large scale, spatial information on the inundation status of rice fields over time and at each growth stage is needed [24]. Traditional monitoring methods based on field surveys are often expensive, limited in scope, and difficult to apply in areas with complex terrain.
Radar remote sensing has proven to be an effective tool for rice monitoring, especially in areas with frequent cloud cover like Vietnam [6]. In contrast to optical sensors, radar systems can penetrate clouds and operate day and night, ensuring continuous data acquisition. While optical indices (e.g., NDWI, MNDWI) can distinguish water from vegetation [19,25,26], they are not adapted to detect water beneath a closed canopy. Many previous studies have demonstrated the effectiveness of SAR data in rice area mapping [27,28], crop growth monitoring [29], L-band Uninhabited Aerial Vehicle Synthetic Aperture Radar (UAVSAR) to map inundated rice [30], Sentinel-1 in inundation detection [18] and AWD deployment detection [22]. Sentinel-1 radar images, with the ability to acquire data regardless of weather conditions, are used to identify flooded areas based on VV and VH polarization scattering [18,20,31]. Although C-band SAR (e.g., Sentinel-1) allows for all-weather monitoring [18,20], its signal often saturates in dense vegetation, making sub-canopy flood detection in mature rice challenging due to high biomass accumulation. This limitation constitutes a major technical challenge in operational monitoring.
From a radar physics perspective, this limitation stems from the interaction between the sensor’s wavelength and the canopy structure. The shorter wavelength of the C-band (~5.6 cm) interacts primarily with the upper elements of the rice canopy (leaves and panicles), leading to strong volume scattering and rapid signal attenuation or saturation as biomass accumulates [32,33]. Consequently, the radar signal loses its ability to reach the underlying surface.
L-band SAR offers a distinct advantage for sub-canopy penetration. The longer wavelength of ALOS-2 PALSAR-2 (L-band) provides stronger penetration capabilities through the rice canopy compared to C- and X-bands [34,35]. Arai et al. used dual polarization ALOS-2 PALSAR-2 data to classify inundation status and integrated it into the evaluating irrigation status model and greenhouse gas emissions [22,36]. ALOS-2 PALSAR-2—Japan’s synthetic aperture radar satellite—stands out for its ability to provide L-band data with high penetration, dual polarization (HH and HV), high spatial resolution, and a short repetition period, which is very suitable for monitoring inundation in agriculture [22,36]. Despite these advances, integrating the penetration capacity of the L-band with the dense time-series capability of the C-band (for phenology tracking) remains an under-explored yet promising avenue for operational monitoring. Specifically, a clear scientific gap remains, as relatively few studies have simultaneously integrated L-band and C-band SAR for combining phenological monitoring with sub-canopy inundation detection. Furthermore, operational studies under humid tropical AWD-managed rice systems remain limited, and synchronized multi-stage validation using multi-temporal ALOS-2 acquisitions is still scarce.
Various methodologies have been applied to identify inundation, including thresholding [20,25], decision trees [37,38], Random Forest [39,40], SVM [41,42], etc. Among these, thresholding remains a commonly applied method due to its operational feasibility, low computational demand, and direct compatibility with cloud computing platforms without the need for intensive training data [43,44]. However, determining dynamic thresholds that account for crop growth stages requires accurate phenological information. To address this challenge and overcome the rigidity of static values, this study adopts an adaptive thresholding approach. This method enables the inundation classification threshold to dynamically adapt to varying crop growth stages, thereby ensuring both physical interpretability and transferability across diverse monitoring sites.
This study selected the research area in An Giang province, which is one of the localities with a large rice-growing area, considered the rice bowl of the Mekong Delta [45], with complex irrigation systems. An Giang typically applies a three-crop rice system [46,47] and has piloted AWD models. Currently, the province is orienting towards large-scale, high-tech agriculture with a focus on methane emission reduction [48]. Therefore, understanding the spatial distribution and temporal variation in inundation in this region is critical for water management and GHG mitigation strategies. In terms of the specific agricultural calendar, this research focuses on the Winter–Spring crop during the dry season. This crop is highly significant for methane-emission research as it represents the largest, most productive, and most controllable rice season in the region, thereby providing an ideal baseline for quantifying emissions and evaluating mitigation practices that can be scaled across the Mekong Delta. Due to resource limitations, this study is currently restricted to this single province and one crop season; extensions to other crop seasons and regions are planned for future investigation.
The study was designed within the framework of the CH4Rice project, using an experimental dataset consisting of multi-temporal ALOS-2 acquisitions over An Giang province and in situ observations collected during a Winter–Spring crop season. Beyond testing the complementary use of C-band and L-band SAR data, the study aims to develop a method for detecting sub-canopy inundations under different rice growth stages and to derive insights into flooding status relevant to methane mitigation. Furthermore, the study discusses the strengths and limitations of the proposed approach and explores pathways toward future operational implementation for large-scale monitoring and MRV applications. The main objectives are to: (a) analyze the relationship between L-band backscatter and field inundation status across different phenological stages; (b) build an inundation classification model fusing radar and field data; and (c) analyzing and evaluating the current inundation status in the field to better understand the rice cultivation model, supporting the implementation of AWD as a smart agricultural solution to adapt to climate change.

2. Materials and Methods

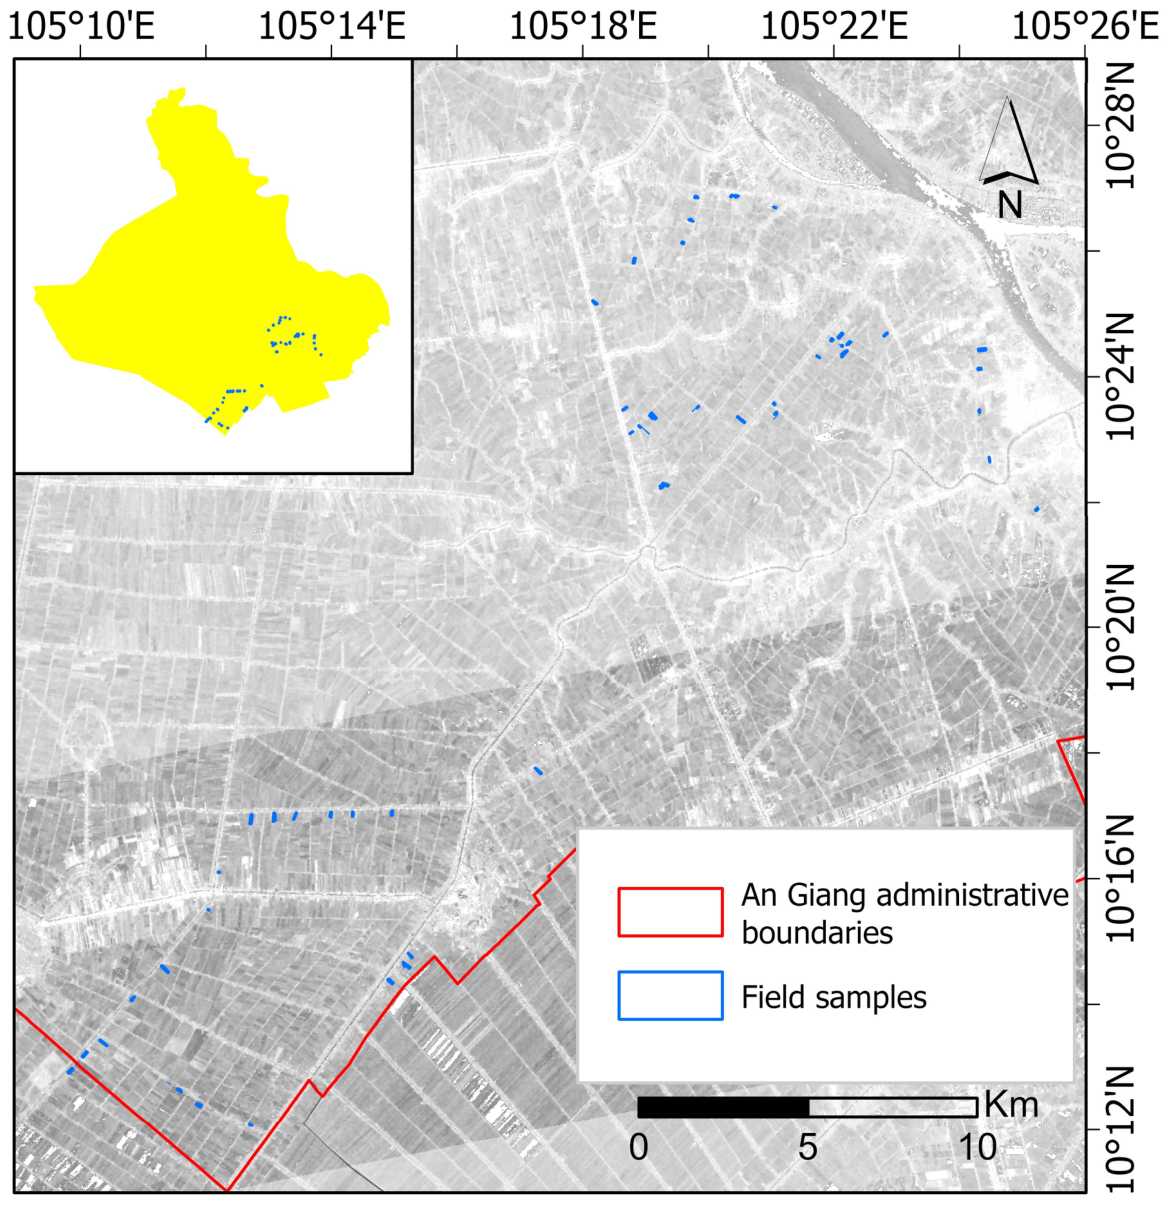
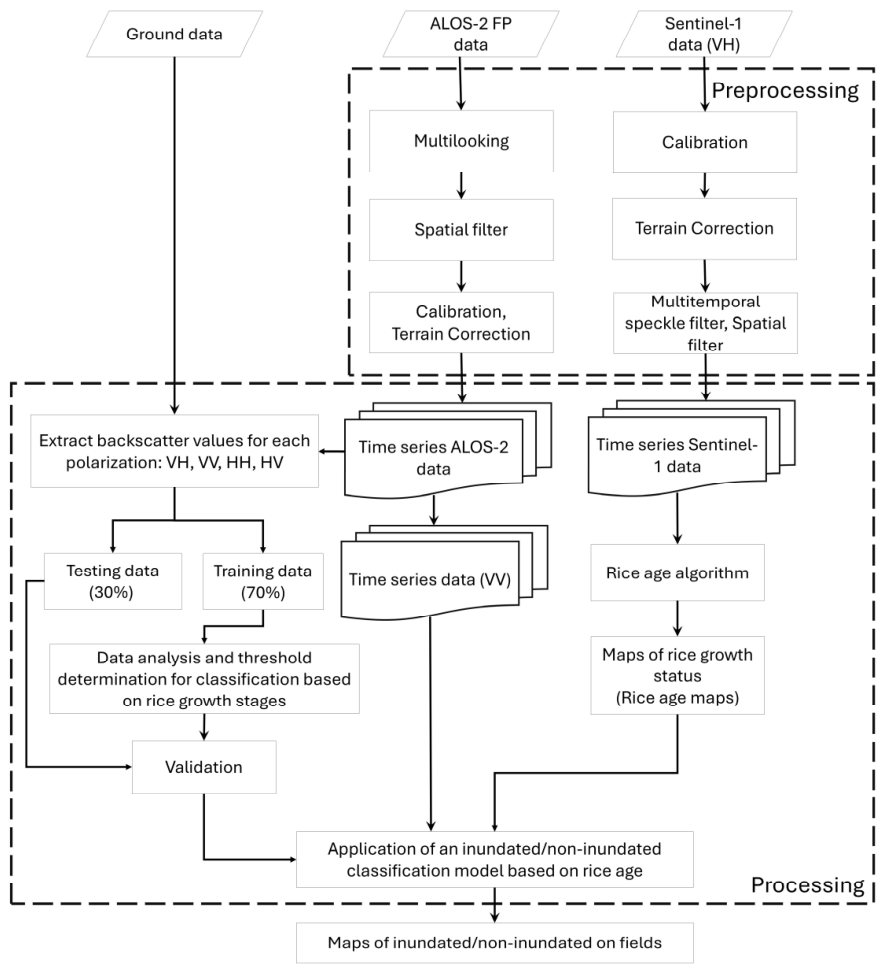
The study utilized satellite data obtained from the ALOS-2 and Sentinel-1 missions. The ALOS-2 PALSAR-2 FP (Full Polarization) imagery covered most of An Giang province (Figure 1) with a swath width of approximately 50 km. This data has a temporal resolution of 14 days and was employed to generate a multi-temporal series of backscatter values at the L-band wavelength, with a pixel resolution of 6 m. Sentinel-1 imagery with a swath width of 250 km covered nearly the entire An Giang province (Figure 1). This product has a temporal resolution of 6 days, and the Sentinel-1A and Sentinel-1C satellites were used to construct a multi-temporal series of backscatter values at the C-band wavelength, with a spatial resolution of 20 m. The data were preprocessed from digital numbers (DN), converted to sigma-naught values, terrain-corrected to eliminate topographic effects, and filtered to reduce noise. Ground reference data, including field measurements, were employed to develop the classification model and to validate the results (Figure 2).

2.1. Data Used

2.1.1. ALOS-2 PALSAR-2 Data

The ALOS-2 PALSAR-2 FP datasets used in this study were provided by the Japan Aerospace Exploration Agency (JAXA) as part of the Assessment of Methane Emission from Rice Paddies and Water Management (CH4Rice) project. The images were acquired in Stripmap mode with full polarizations (HH, HV, VH, VV for transmitted and received at Horizontal (H) and Vertical (V) polarization), featuring an incident angle ranging from 25.6° to 29.7°. The data were processed to level 1.1 (Table 1). The acquisition period spanned from 20 December 2024, to 28 February 2025, resulting in a total of six image dates. These images covered a substantial portion of An Giang province, with a spatial resolution of approximately 6 m (Figure 1).

2.1.2. Sentinel-1 Data

As of 2024, Sentinel-1 is a constellation of two satellites, Sentinel-1A and Sentinel-1C. The data products have a 12-day repeat period. Sentinel-1A was launched on 3 April 2014, while Sentinel-1B was put into orbit two years later, on 25 April 2016 [49]. Since 2016, the image collection cycle in the Mekong Delta has been 6 days. However, this satellite was decommissioned in 2022. In 2024, the Sentinel-1C satellite was launched to replace the Sentinel-1B satellite to ensure 6-day temporal resolution with a spatial resolution of 20 m (Interferometric Wide Scan Mode) and dual-polarization data (VV and VH). In this study, to monitor the growth status of rice in the 2025 Winter-Spring crop, data from 26 August 2024 to 22 February 2025 were collected with a total of 44 images taken by both Sentinel-1A and C satellites in the descending mode. All image data were co-registered based on a reference image so that they had the same WGS-84 coordinate system. This data was calibrated to convert DN values to backscatter coefficients.

2.1.3. Field Data

Field measurements were designed according to the objectives and requirements of monitoring water surface conditions, with appropriate levels of detail and measurement parameters. To construct the training and testing datasets for this study, sample fields were selected to be spatially distributed across the study area and sufficiently distant from one another. The collected field data included information on inundation status (1: inundated fields; 1.1: water level < 5 cm, 1.2: water level ≥ 5 cm; 2: not inundated fields; 2.1: muddy; 2.2: dry), rice growth stages, planting date (sowing/transplanting date), geographic coordinates, and photographs. The study area in An Giang Province consists of sample fields cultivated with a range of rice varieties typical of the Mekong Delta, encompassing both short- and long-duration types (80–120 days). Among these, Nep, OM5451, and DS1 are the most prevalent varieties grown in An Giang [29]. Most rice-growing areas are situated on relatively flat terrain within the upper Mekong Delta region, and rice cultivation in the area is typically characterized by intensive double- or triple-cropping systems annually [28,50].
For the 2025 Winter–Spring crop season, rice parameter measurements were continuously collected in An Giang province at 14-day intervals, synchronized with the acquisition dates of ALOS-2 PALSAR-2 imagery. The Winter–Spring (WS) rice season in An Giang Province is cultivated during the dry season, which typically extends from December to April. Farmers generally sow or transplant rice between late November and December, after the annual floodwaters recede. The crop then grows under relatively dry conditions with irrigation support, and it is usually harvested from March to early April. The study conducted field surveys comprising 90 samples per campaign (Figure 3). Field measurements were conducted on rice fields with sample field sizes ranging from 500 to approximately 30,000 m2. These measurements were carried out between 20 December 2024 and 28 February 2025 (Table 1). A total of six measurement campaigns were performed, thereby capturing changes in rice fields throughout the Winter–Spring season from sowing/transplanting to maturity. Specific agronomic variables such as continuous canopy height, biomass, leaf area index (LAI), and specific rice varieties’ dynamic changes significantly govern SAR backscatter behavior [51,52]. In this study, the influences of these structural and biophysical parameters are implicitly integrated into and represented by the recorded rice growth stages, which directly correlate with the temporal variations in radar scattering mechanisms.
Considering current rice cultivation practices in An Giang, the research team identified Chau Thanh, Long Xuyen, and Thoai Son districts as suitable and accessible areas for field surveys. The spatial distribution of the 90 selected fields during the measurement campaigns is shown in Figure 3. Sample fields were selected based on the following criteria: (a) sample fields should be sufficiently large to minimize noise effects in the analysis of field-based backscatter; if the number of large fields was limited, groups of adjacent sample fields with similar conditions (e.g., water supply, rice variety) were selected, provided that the separating dikes were less than 0.25 m; (b) sample fields should be located away from potential noise sources such as roads, rivers, canals, infrastructure, trees, etc.; (c) sample fields should be accessible to facilitate travel and field data collection.
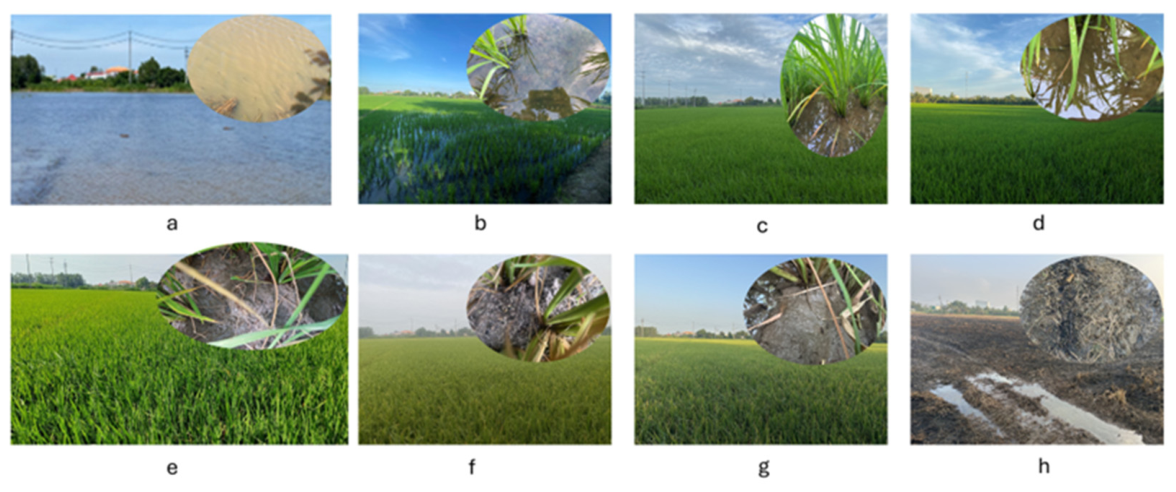
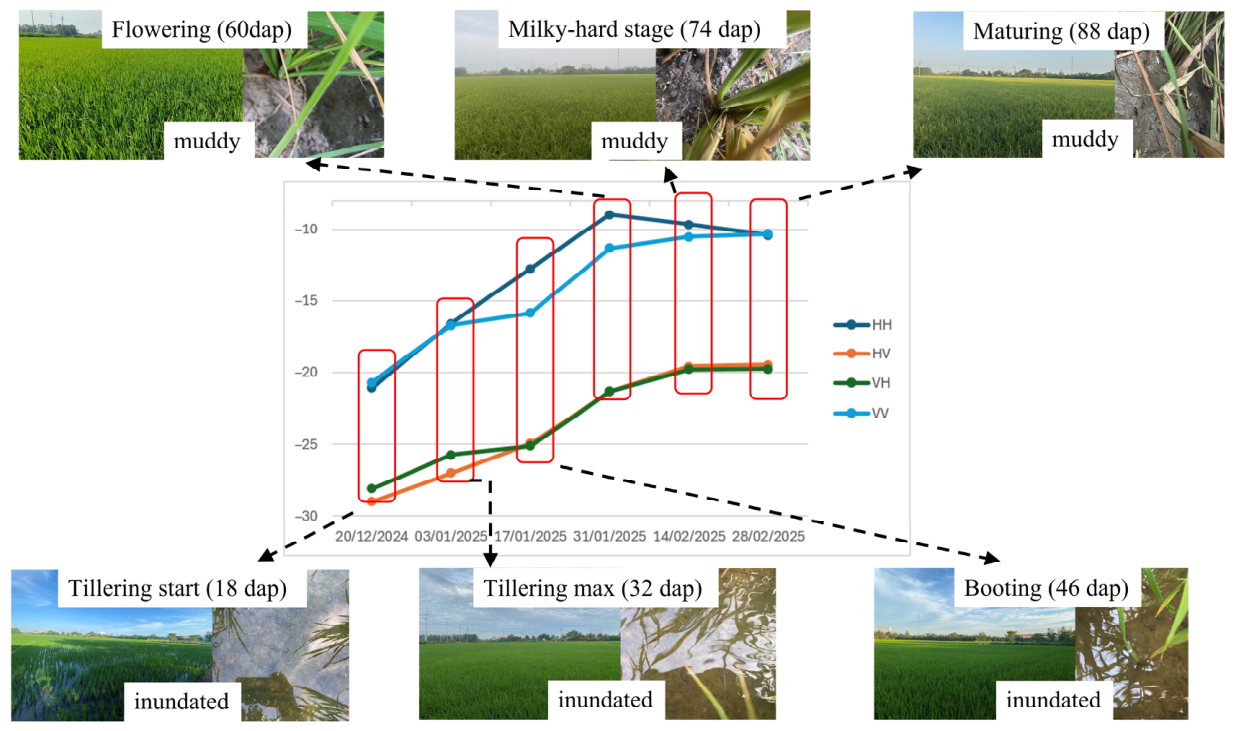
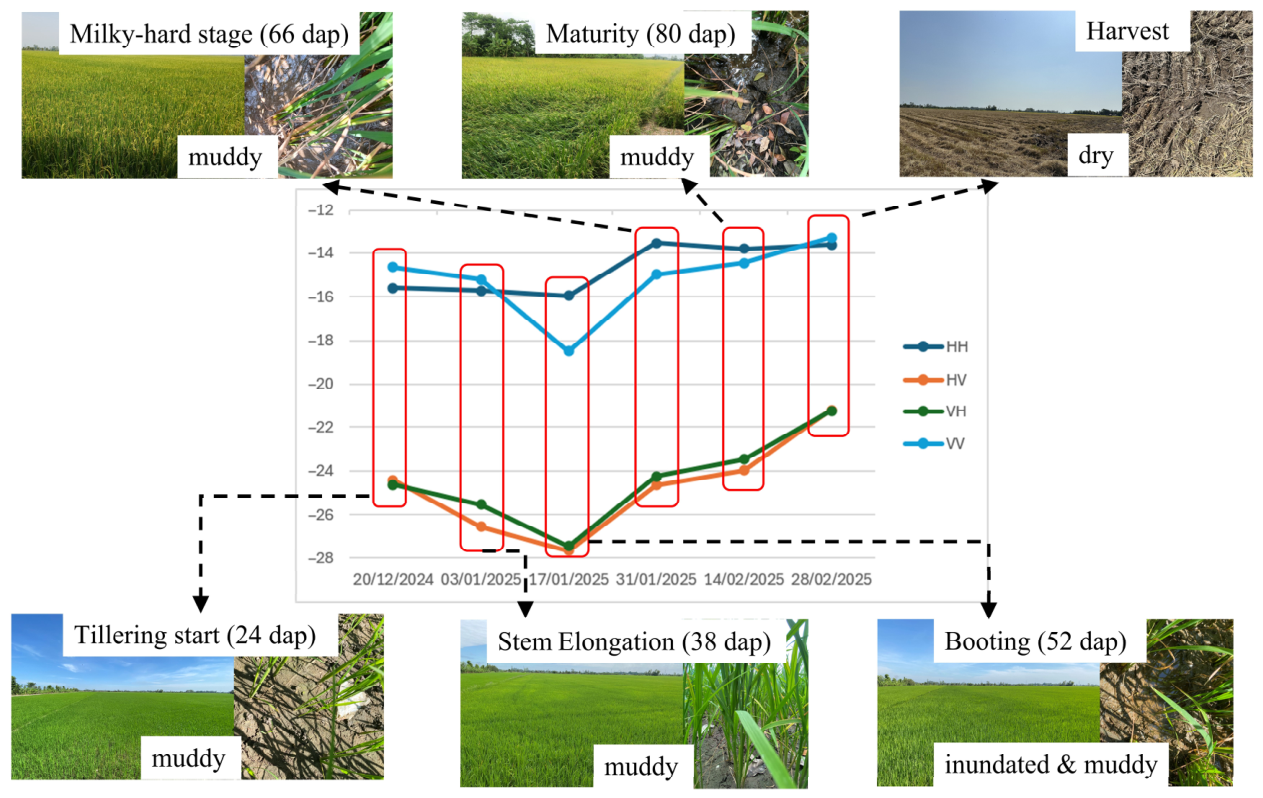
Figure 4 illustrates field images of rice paddies at different growth stages, including panoramic views of the fields and close-up views of the soil surface. Each paddy typically represents a distinct stage of rice development, ranging from sowing to harvest. The growth stages of rice include (1) seeding, (2) 2–3 leaf stage, (3) tillering start, (4) maximum tillering, (5) stem elongation, (6) booting, (7) heading, (8) flowering, (9) milky stage, (10) milky-hard stage, (11) maturing, and (12) maturity [6,53]. Throughout the cultivation cycle, the soil surface is frequently inundated, moist, or occasionally dry, depending on farmers’ practices and the developmental stage of the crop. During the vegetative stages, paddies are generally maintained under inundation or moist conditions. In the reproductive phase, particularly from heading to grain filling, irrigation is applied to sustain adequate soil moisture for optimal growth. As harvest approaches, water is gradually drained to allow the soil to dry, thereby facilitating harvesting operations.

2.2. Method

2.2.1. Image Preprocessing

Sentinel-1 Data Preprocessing
Initially, the Sentinel-1 imagery was radiometrically calibrated to convert raw digital numbers (DN) into physically meaningful sigma-naught (σ0) backscatter coefficients using the standard Look-Up Tables (LUTs) in SNAP (Sentinel Application Platform). Subsequently, terrain correction was applied using the 30 m Digital Elevation Model (DEM) from the Shuttle Radar Topography Mission (SRTM) within the SNAP. This step ensured that geometric distortions due to terrain and geometry on the radar images were minimized, thereby ensuring accurate pixel geolocation. To further enhance the quality of the radar data, multi-temporal speckle filtering [54] and spatial filtering (Lee filter with a 3 × 3 window size) were employed [29]. The temporal filtering method is particularly effective for time-series analysis, as it reduces speckle noise while preserving fine structural details in radar backscatter [29,55]. Speckle noise, caused by constructive and destructive interference of radar signals, degrades image quality and complicates interpretation [56,57]. The Sentinel-1 imagery was resampled to a pixel size of 20 m, providing a balance between spatial resolution and computational efficiency. Collectively, these preprocessing steps ensured that the Sentinel-1 dataset was suitable for quantitative analysis and for monitoring rice growth stages.
ALOS-2 PALSAR-2 Data Preprocessing
The ALOS-2 PALSAR-2 imagery underwent a preprocessing workflow like that applied to Sentinel-1 data but adjusted to the specific characteristics of ALOS-2 L-band acquisitions. The first step involved multilooking to reduce speckle. Due to the longer wavelength of L-band data, speckle filtering was carefully applied to reduce noise while maintaining sensitivity to vegetation, surface water, and soil moisture conditions. To mitigate this, the Lee filter [58] with a 3 × 3 window size was applied, effectively reducing speckles while preserving structural details of rice fields.
Subsequently, the digital numbers (DN) were radiometrically calibrated to convert them into sigma-naught backscatter coefficients (expressed linearly). Terrain correction was performed using the same DEM to remove geometric distortions and align the imagery with geographic coordinates [59,60]. The processed data were then converted into backscatter coefficients (σ0) expressed in decibel (dB) format. Finally, the ALOS-2 PALSAR-2 data were resampled to a spatial resolution of 6 m, providing a clear advantage over the coarser resolution of Sentinel-1 imagery. This finer resolution of ALOS-2 enabled more detailed characterization of rice fields and improved detection of subtle changes during flood stages, while the 20 m Sentinel-1 dataset provided the necessary broad-scale coverage. The preprocessing workflow ensured that both Sentinel-1 and ALOS-2 PALSAR-2 datasets were harmonized and prepared for integration into multi-temporal analyses, thereby enhancing the accuracy of rice field classification.

2.2.2. Rice Age Information Extraction

To extract rice age information, this study employed the rice age algorithm based on Sentinel-1 imagery proposed by Phung et al. [29]. The algorithm enables the derivation of phenological parameters, including the number of days after planting (dap), commonly referred to as rice age. Growth stage information was extracted for each cropping season using multi-temporal data series. Preprocessing steps were applied to the time-series data to effectively reduce speckle noise (Figure 2). Despite noise reduction, multi-temporal backscatter values still revealed significant variability associated with changes in rice canopy and ground surface. Temporal noise reduction and spatial smoothing are generally required when processing time-series data [29]. The temporal estimation of rice growth stages based on days after planting (dap) was implemented using a Python 3.4.0 programming environment [29].
This rice age algorithm is built based on experiments with backscatter models of different rice varieties and growth cycles in the Mekong Delta. Specifically, rice age estimation relied on the VH backscatter time series from Sentinel-1, which is sensitive to surface water and rice canopy structure. The VH backscatter of rice fields follows a characteristic scattering pattern corresponding to rice growth stages: low backscatter values at the beginning of the season, gradual increase as the crop matures, and decline after harvest [29].
To support the analysis and mapping of inundation in rice fields, this study generated rice age maps for six acquisition dates of ALOS-2 PALSAR-2 satellite imagery (Table 1). The Sentinel-1 image time series was preprocessed [29,54]. Subsequently, the Sentinel-1 VH polarization data was processed using the rice age algorithm to extract rice age information and to produce rice age maps.

2.2.3. Building an Inundation Classification Model in Rice Fields

To develop a flooded field classification model capable of distinguishing inundated from non-inundated rice fields, we processed and analyzed both ground survey data and polarimetric backscatter information derived from sample fields during the Winter–Spring 2025 cropping season. The ground survey dataset, as detailed in Section 2.1.3, provided essential information on flooding status, sowing/transplanting dates for estimating rice age, and growth stage. These data were systematically collected across six survey campaigns (Table 1), each covering approximately 90 sample fields in An Giang province. In coordination with these campaigns, backscatter values of the HH, HV, VH, and VV polarizations from ALOS-2 PALSAR-2 imagery were extracted for each sample field. The datasets were then analyzed to investigate the relationship between field inundation conditions and variations in polarimetric backscatter values.
A total of 540 samples were initially extracted from ALOS-2 images across four polarizations. These samples were systematically collected from 90 independent ground truth fields over 6 distinct field campaigns (scheduled at 14-day intervals to synchronize with the ALOS-2 overpass dates, as presented in Table 1). However, 9 sample fields had already been harvested during the survey conducted on 28 February 2025, reducing the effective dataset to 531 samples. The fields are not homogeneous in terms of crop calendar and irrigation practices. These were subsequently divided into two subsets [61]: a training dataset comprising 366 samples (70%) and a validation dataset comprising 165 samples (30%). The training dataset was used to analyze statistical thresholds for inundation classification, while the validation dataset was employed to evaluate model performance. Both training and validation sets consisted of integrated ground survey data and polarimetric backscatter values corresponding to different survey times. To mitigate spatial and temporal autocorrelation, a constrained stratified random sampling scheme [62,63] was applied. The partitioning was stratified based on both the rice growth stages (1–30, 31–60, 61–90, and 91–120 dap) and the actual water status (inundated or non-inundated). Stratified random sampling [62,63] was applied to ensure that the proportions of inundated and non-inundated fields were balanced across both datasets and evenly distributed across rice growth stages.
Based on the training dataset, statistical analyses of backscatter values were conducted for each polarization across different rice growth stages. Due to the limited number of training samples, crop growth was categorized into four principal stages according to rice age: 1–30, 31–60, 61–90, and 91–120 dap. For each stage, statistical parameters—including mean, minimum, maximum, and standard deviation—were calculated separately for inundated and non-inundated fields. To quantitatively evaluate the capability of each polarization in distinguishing between inundated and non-inundated fields, the Jeffries–Matusita (JM) distance was calculated. This study selected the JM distance because it evaluates the classification error probability and offers a reliable, statistically rigorous measure of class separability in remote sensing applications. The JM distance values for the VV, HH, HV, and VH polarizations were 1.51, 1.41, 1.35, and 1.31, respectively. Based on these results, the VV polarization exhibited the highest separability and was selected as the optimal channel for the threshold analysis. By exploiting the statistical differences between the two classes in the VV polarization, an adaptive thresholding method [64,65,66] was applied. Specifically, the optimal threshold for each stage was mathematically determined by maximizing the separability, computed as the midpoint between the mean backscatter values of the inundated and non-inundated training datasets. The final stage-specific threshold values for inundation classification were established as follows: sigma0_VV < −16.9 dB for the 1–30 dap stage, sigma0_VV < −15.2 dB for the 31–60 dap stage, sigma0_VV < −13.8 dB for the 61–90 dap stage, and sigma0_VV < −13.4 dB for the 91–120 dap stage. Statistical analysis includes the calculation of specific parameters (mean, standard deviation, Jeffries–Matusita (JM) distance) using Microsoft Excel software.
To implement the model, preprocessing of ALOS-2 and Sentinel-1 datasets was performed to ensure spatial resolution compatibility. Specifically, Sentinel-1 imagery was first resampled to 20 m spatial resolution to reduce speckle noise and improve the stability of backscatter signals used for rice growth stage estimation [29]. Subsequently, the Sentinel-1-derived rice age maps (originally processed at 20 m to match the sensor’s effective resolution and minimize speckle noise) were upsampled to 6 m using a nearest-neighbor interpolation scheme. It is critical to clarify that this secondary resampling was performed exclusively as a geometric grid alignment prerequisite to enable pixel-level mask operations with the higher-resolution ALOS-2 layers. This step does not improve the effective spatial resolution of the C-band dataset, and spatial boundary interpretation remains limited by the original 20 m resolution of the Sentinel-1 acquisitions. After this harmonization step, the final pixel size used as input for the classification model was 6 m, corresponding to the spatial resolution of ALOS-2 imagery. Finally, the inundation classification model was applied to ALOS-2 imagery, enabling pixel-level classification of inundated versus non-inundated conditions across different growth stages.

2.2.4. Validation

To evaluate the classification results of inundated/non-inundated rice fields across different growth stages, the study employed a validation dataset. The accuracy of the classification outcomes was verified using field data collected concurrently with ALOS-2 image observations. The performance of the inundation classification model was assessed through a confusion matrix [67], which provided measures of cross-validation between the training and validation datasets, overall accuracy, and the Kappa coefficient [68]. Cross-validation methods have been widely applied in similar studies, as they demonstrate the generalization capability of classification models in survey-based research [69].

3. Results

3.1. Analysis of the Backscattering Pattern of Inundated Fields According to Growth Stages

Figure 5 and Figure 6 illustrate the backscatter values of the four polarizations during crop growth for 2 different fields. It can be observed that, as expected, the differences in backscatter between VH and HV polarizations are relatively small, ranging from approximately −1 dB to −3 dB across growth stages. As shown in Figure 5, the backscatter of fields under dry or moist conditions is generally higher than that of inundated fields, particularly in the VV polarization channel.
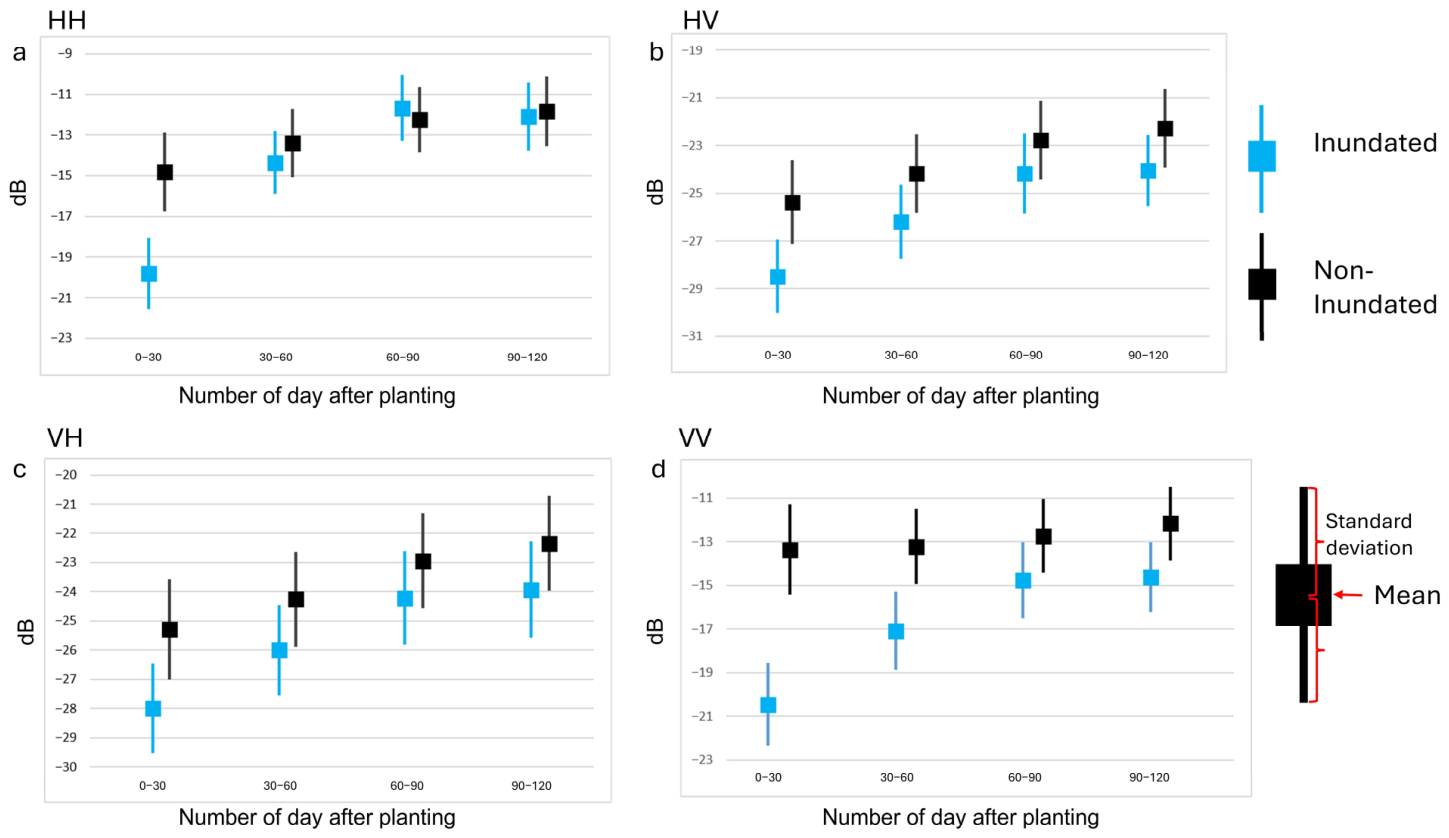
Figure 7 presents the mean values and standard deviations of backscatter coefficients for inundated and non-inundated fields over 531 fields across four growth stages, defined by rice age: 1–30, 31–60, 61–90, and 91–120 dap. Overall, across all four polarizations, the early stage (1–30 days after planting) is the most distinguishable between inundated and non-inundated fields. During this stage, rice plants are small with low biomass, leading to clearly separated mean values of backscatter between the two conditions. In contrast, in the subsequent three stages (31–60, 61–90, and 91–120 dap), the differences in backscatter between inundated and non-inundated fields become less pronounced due to canopy coverage as the rice plants grow and biomass increases.
In Figure 7, the results for HH polarization (Figure 7a), HV polarization (Figure 7b), and VH polarization (Figure 7c) show that the mean backscatter values and standard deviations between inundated and non-inundated fields during the stages of 31–60, 61–90, and 91–120 days after planting exhibit minor differences, particularly in the case of HH polarization. In several cases, the mean values fall within each other’s standard deviation intervals, indicating weak separability between the two conditions. The standard deviation ranges of inundated and non-inundated fields overlap, and in some instances the mean values fall within each other’s standard deviation intervals (as observed for HH polarization). This overlap makes it difficult to distinguish inundated from non-inundated fields when using these polarizations, especially HH.
By contrast, Figure 7d for VV polarization demonstrates a discriminatory capability across growth stages. The separation between the mean backscatter values of inundated and non-inundated fields remains more distinct, while the standard deviation intervals show reduced overlap relative to HH, HV, and VH polarizations, particularly during the 1–30 and 31–60 dap stages. To formalize VV polarization over the others, we have computed a quantitative separability metric using the Jeffries–Matusita (JM) distance. As expected, the quantitative statistical results support the visual analysis in Figure 7, confirming that VV polarization yields the highest separability (JM distance = 1.51) across almost all growth stages compared to HH, HV, and VH. Therefore, backed by both visual separation and statistical validation, VV polarization was selected as the primary dataset for classifying inundated and non-inundated fields in this study.

3.2. Result of Inundated and Non-Inundated Status Map of Rice Fields

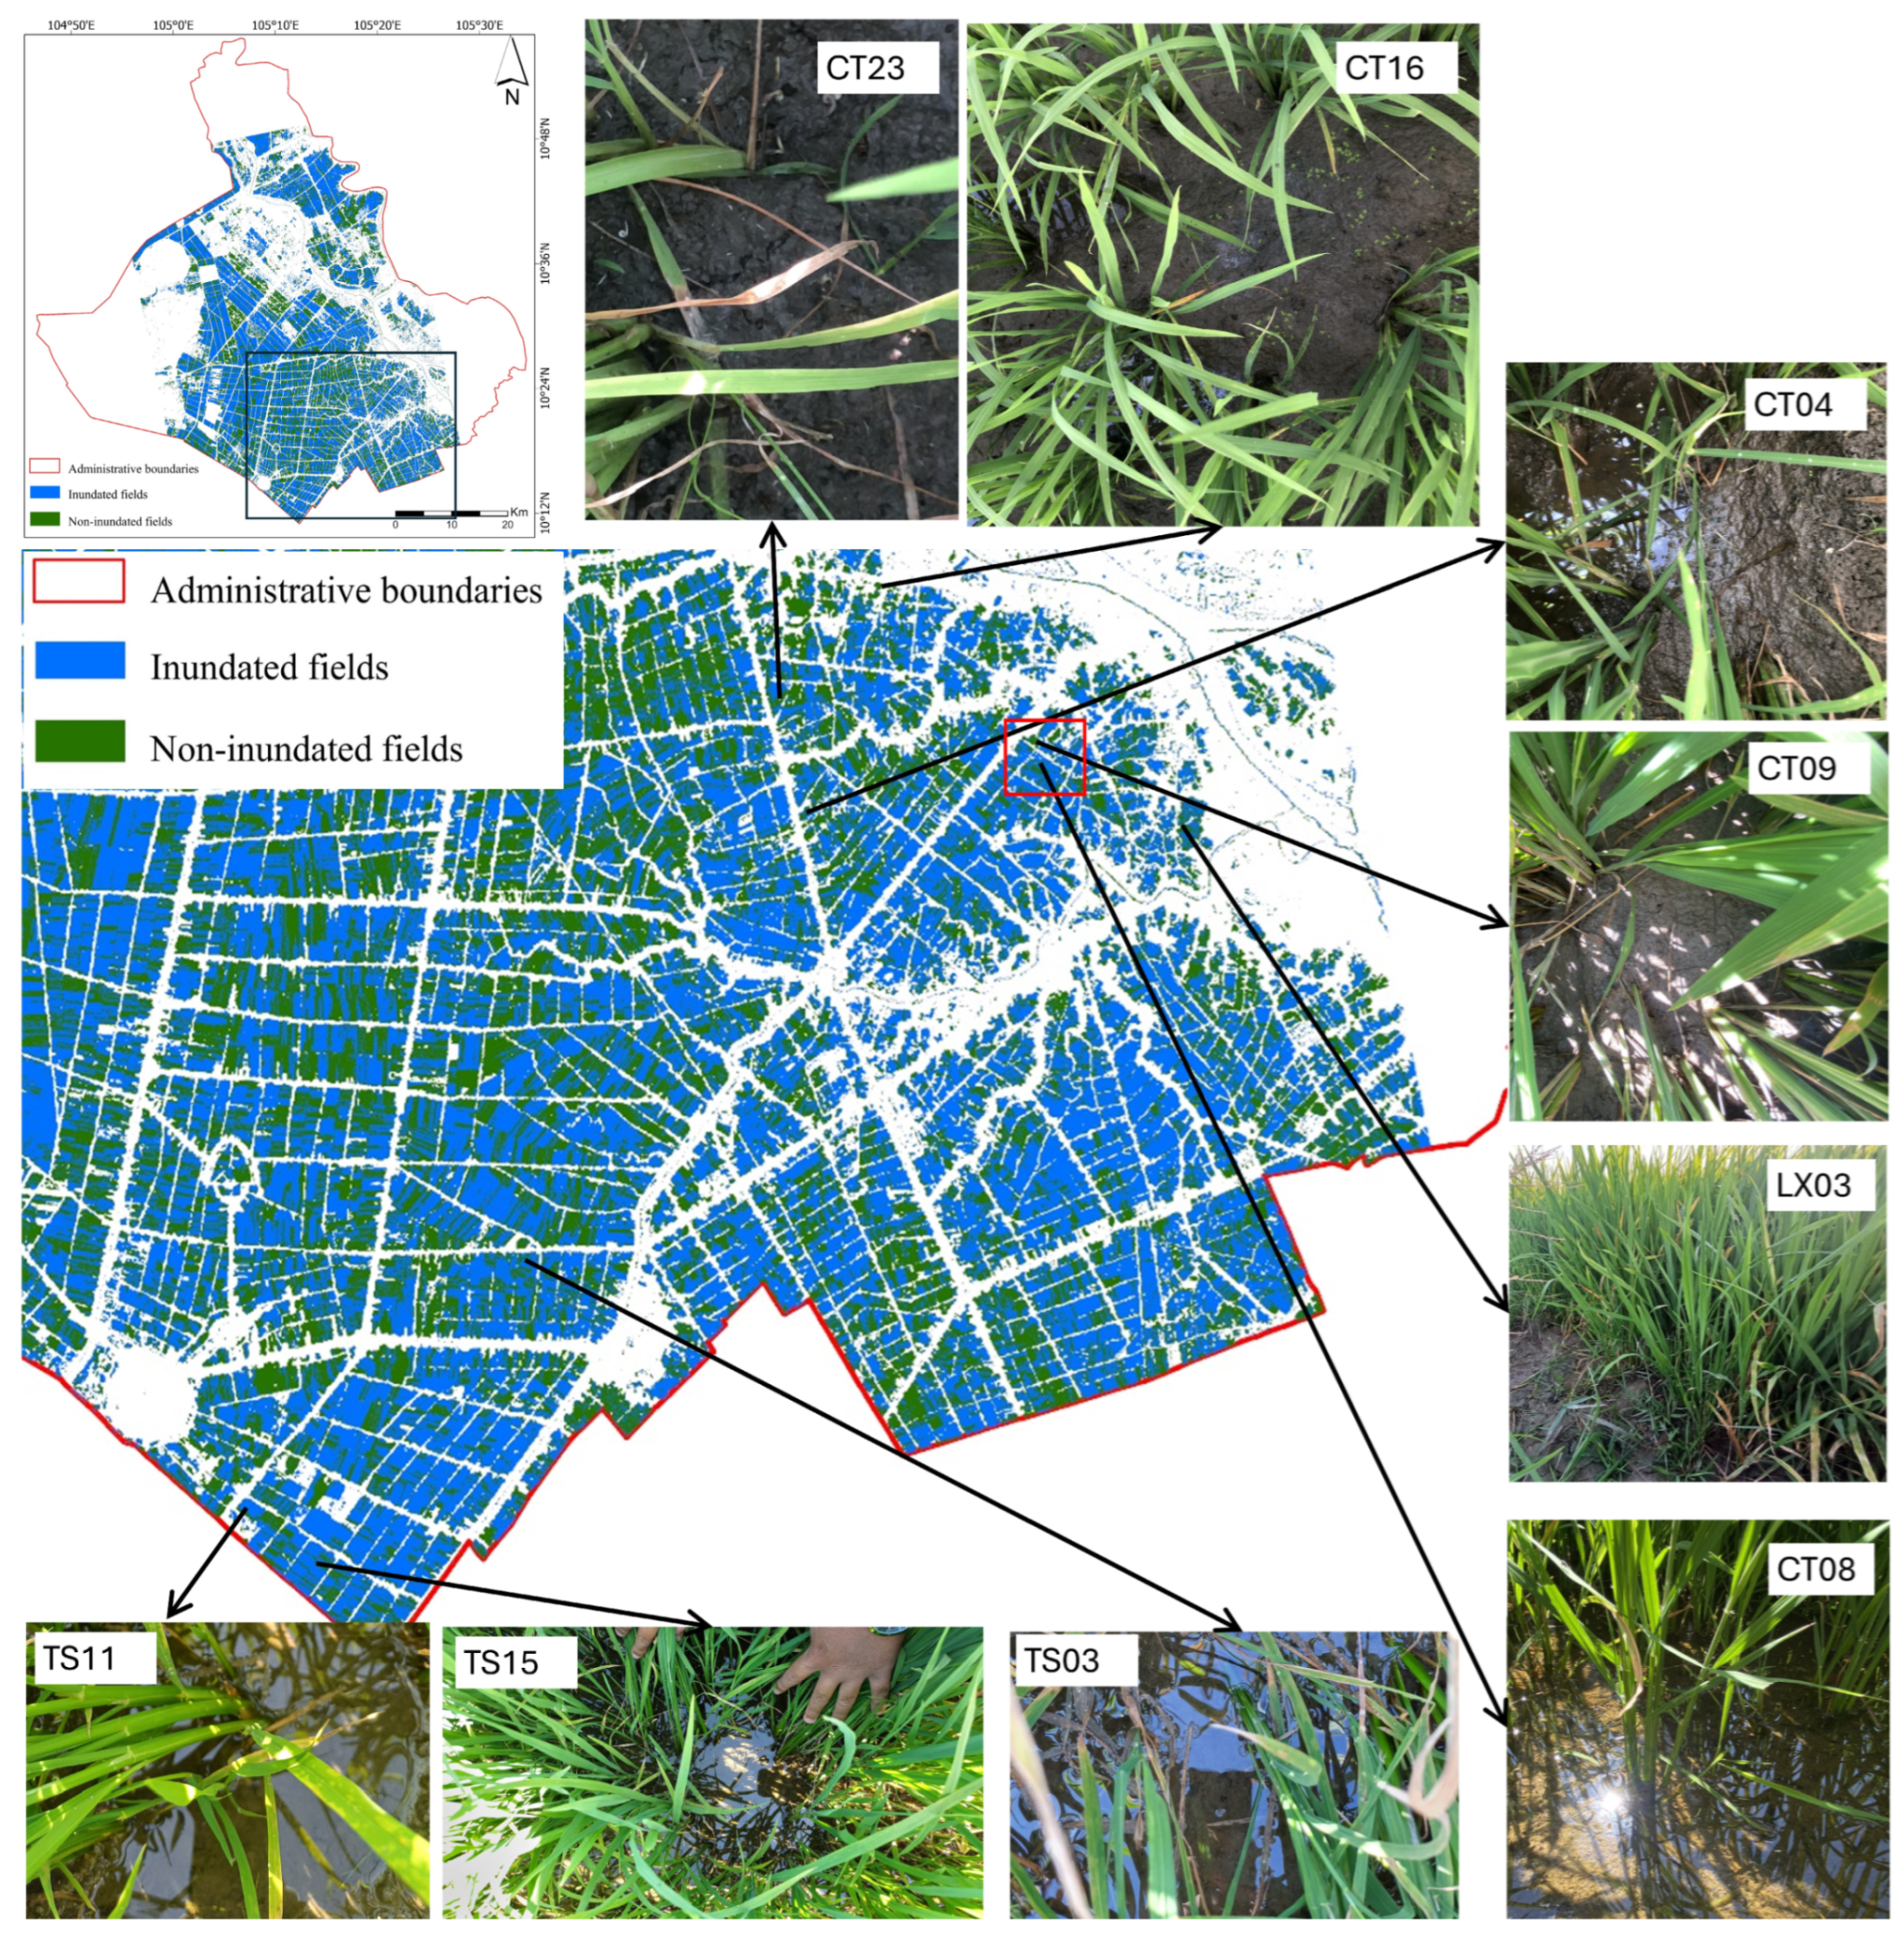
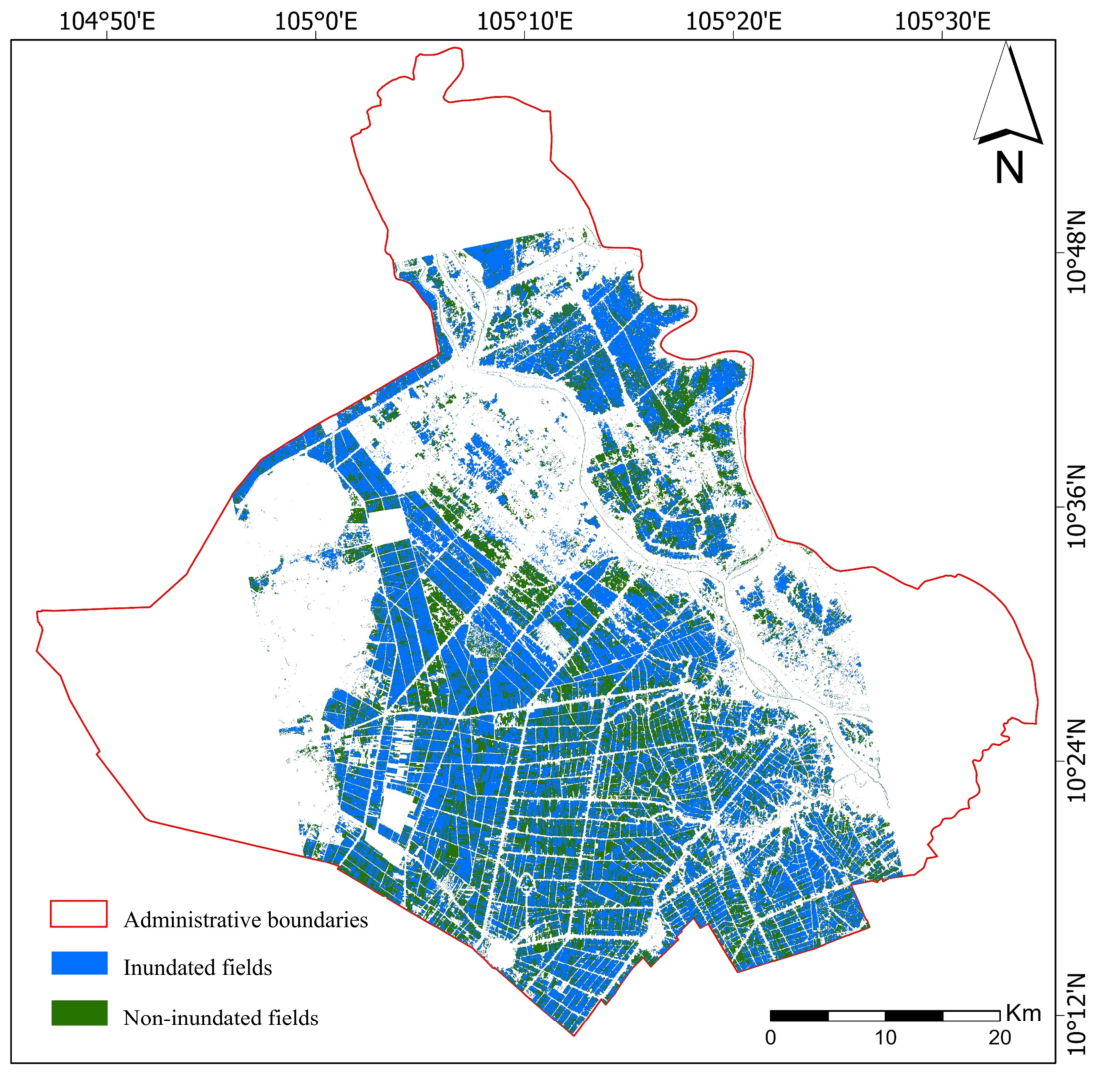
Figure 8 illustrates the classification map of inundated and non-inundated rice fields across growth stages, produced at a 6 m pixel size using a model that integrates ALOS-2 and Sentinel-1 satellite imagery with field survey data. The classification thresholds applied to VV polarization for each rice growth stage were derived from statistical analyses of field survey datasets and VV-polarized backscatter values from ALOS-2 PALSAR-2 imagery, corresponding to rice age. Rice age information was extracted from rice growth maps generated using Sentinel-1 data. The classification results provide a clear delineation between inundated and non-inundated fields throughout the cultivation period. Subsequently, the study integrated the inundated and non-inundated layers from different rice growth stages to generate a map of the inundation status at the time of satellite acquisition on 17 January 2025, within the study area (Figure 9). This demonstrates the robustness of the approach, particularly the effectiveness of combining SAR data from different wavelengths (C-band from Sentinel-1 and L-band from ALOS-2 PALSAR-2) with crop growth information.

3.3. Spatial Distribution of Inundated and Non-Inundated Maps and Rice Age Maps of Rice Fields

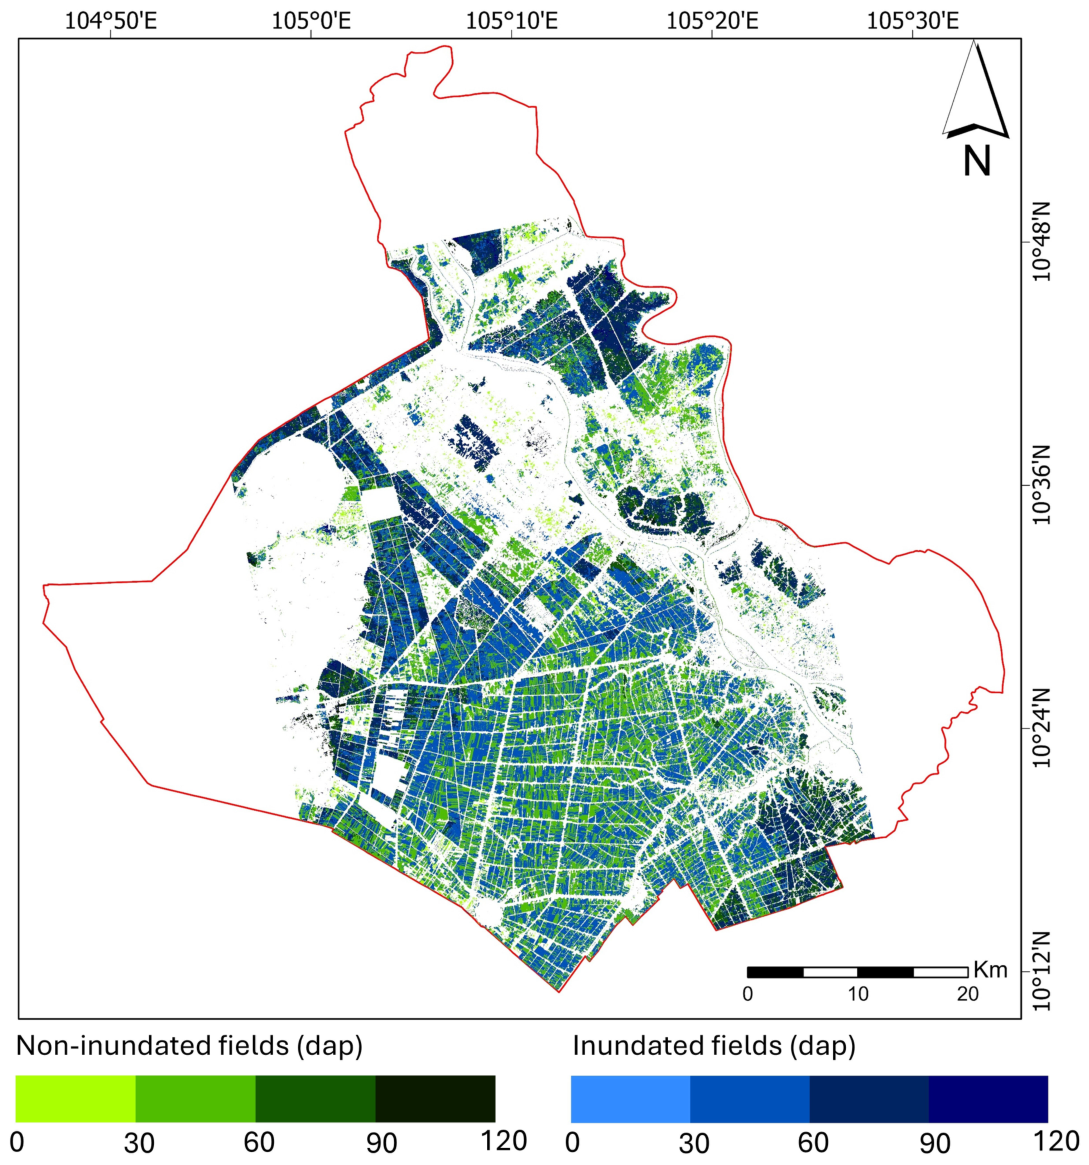
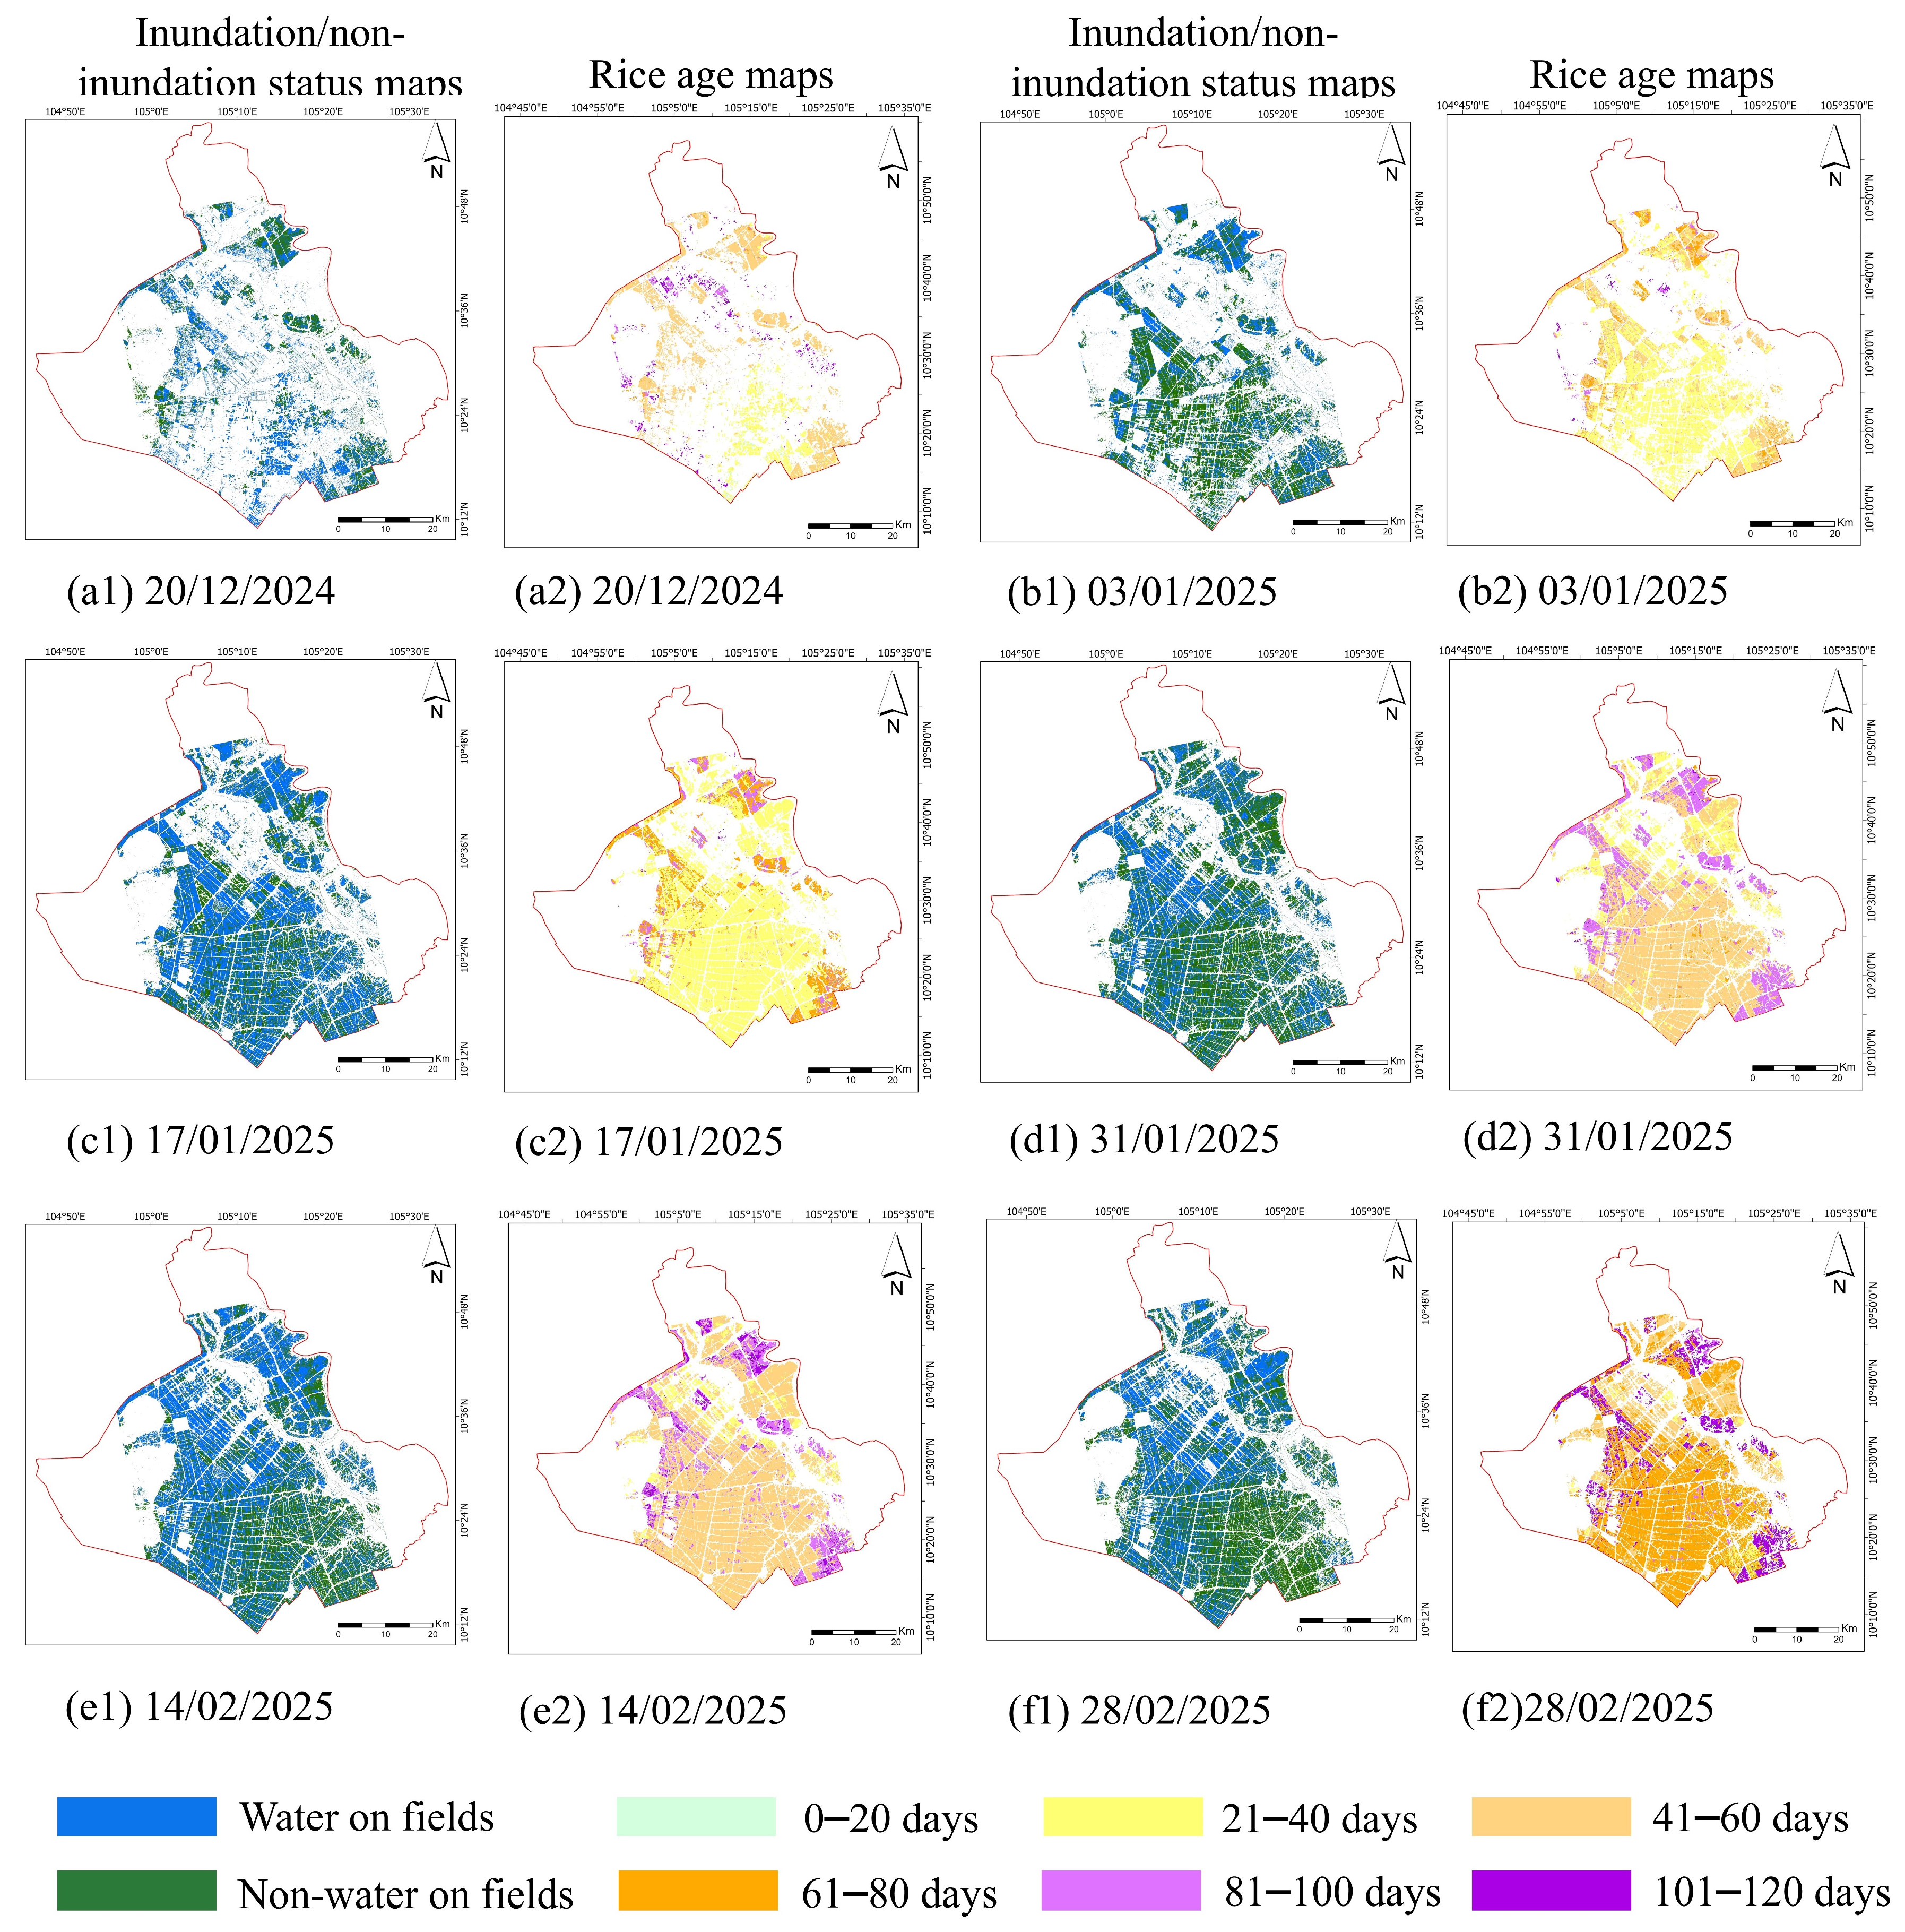
Figure 10 illustrates the spatial distribution of inundated and non-inundated rice fields together with rice age maps for corresponding dates within the study area during the Winter–Spring crop season of 2025. Figure 10(a1–f1) present inundation maps classified using a threshold-based model applied to VV-polarized backscatter from ALOS-2 PALSAR-2 imagery, stratified by rice age—rice growth stages. The rice age maps (Figure 10(a2–f2)) were generated from a time series of Sentinel-1 data spanning 26 August 2024 to 22 February 2025. At each acquisition date, rice age was mapped using imagery collected within the preceding four months, applying the rice age algorithm [29].
Across the study area, the spatial distribution of different growth stages corresponds with the inundation status of rice fields. In An Giang province, farmers commonly adopt water-saving cultivation practices, closely resembling the alternate wetting and drying irrigation method. This is evident in the spatial distribution of inundation conditions during the Winter–Spring season (Figure 10), where most fields exhibit alternating wet and dry states to conserve water during the dry season. In An Giang, authorities advise having multiple drainages in the fields to reduce methane emissions.
Figure 10(a2–f2) further reveal substantial differences of approximately one to two months in sowing/transplanting schedules among regions during the Winter–Spring 2025 crop in An Giang. For example, Figure 10(a2) shows that on 20 December 2024, at the beginning of the season, only a small portion of the area was under rice cultivation. Most fields had not yet been sown or were younger than 20dap (with biomass too low to be detected in Sentinel-1 imagery). Some areas had early sowing with rice aged 21–40 dap and 41–60 dap, while other fields were still part of the preceding Autumn–Winter crop, with rice aged 81–100 dap. At each growth stage, differences in inundation status can be observed even among fields of the same rice age. This indicates that inundation conditions are influenced not only by crop growth cycles but also by the water-saving cultivation practices applied by farmers, particularly the alternate wetting and drying method.

3.4. Evaluation of Inundated and Non-Inundated Maps in Rice Fields

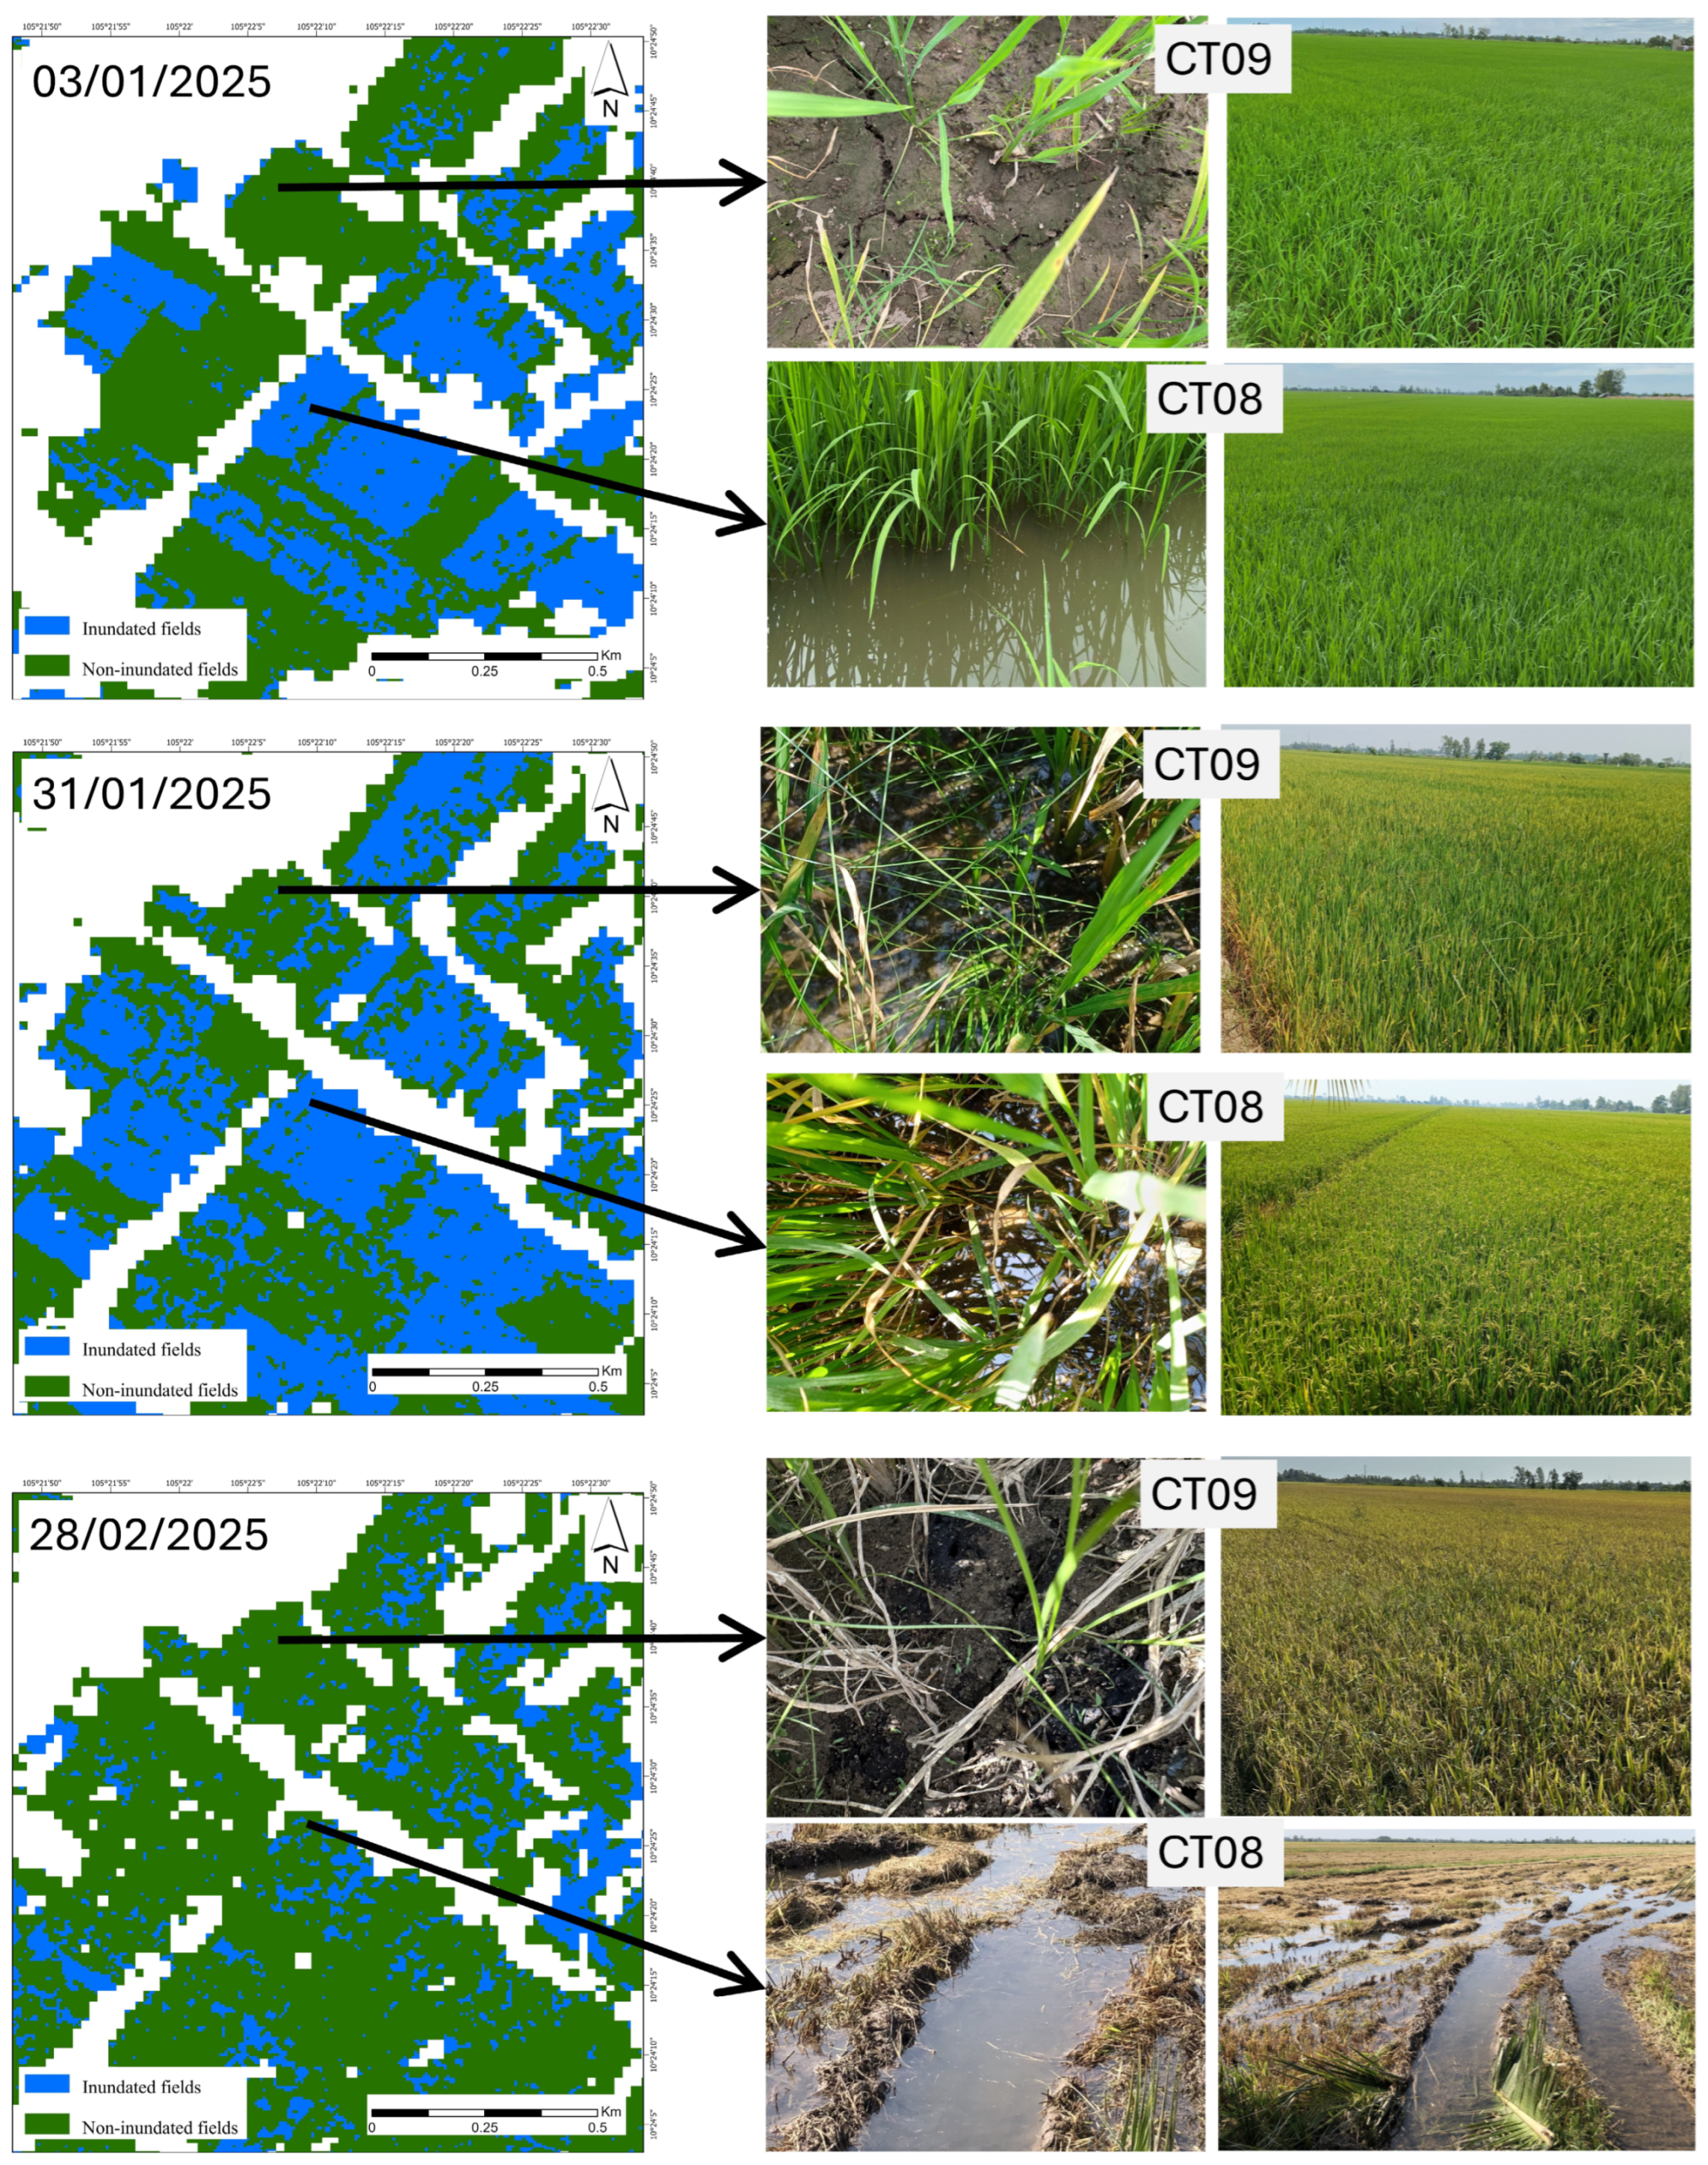
The study produced spatial distribution maps of inundated and non-inundated rice fields according to rice age. Figure 11 presents a comparison between field photographs of inundation conditions and radar-derived inundation maps acquired on 17 January 2025. The classification date coincided with the field survey, and rice fields ranged from approximately 20 to 80 days after planting, reflecting differences in sowing and transplanting schedules. Similarly, Figure 12 presents the comparison results between the established inundation maps and the field data at two sampling sites, CT08 and CT09, across different time points, namely 3 January 2025, 31 January 2025, and 28 February 2025. This comparison demonstrates the capability of ALOS-2 and Sentinel-1 data to accurately classify inundation beneath the rice canopy across different rice age stages.
Table 2 shows the confusion matrix results, indicating the classification accuracy of the inundation model using a validation dataset. For rice fields aged 1–30 dap and 31–60 dap, misclassification rates were low, and inundated versus non-inundated fields were clearly distinguished. In contrast, at later stages (61–90 dap and 91–120 dap), higher misclassification rates were observed, likely due to increased biomass during heading and grain-filling stages, which reduced the penetration capability of VV polarization. Although the total dataset (531 samples) and the validation dataset (165 samples) provide a solid basis for evaluating overall model performance, the limited number of samples in classes 4, 5, 7, and 8 (below 17 samples) represents a limitation and may contribute to increased classification confusion, particularly during the later phenological stages. Future studies with additional samples and expanded spatial coverage would help reduce classification uncertainty and improve model generalizability.
These findings suggest that the classification method based on the integration of L-band SAR data (ALOS-2 PALSAR-2) and C-band SAR data (Sentinel-1) shows good agreement with field observations and is capable of identifying inundated and non-inundated rice fields across different growth stages, although performance varies among phenological stages.

4. Discussion

4.1. Radar Scattering Mechanisms and Inundation Detection Beneath Rice Canopy Using ALOS-2 PALSAR-2

Statistical analysis of 531 in situ samples collected during the 2025 Winter-Spring season in An Giang province reveals a robust correlation between L-band backscatter coefficients and the inundation status of rice paddies across various phenological stages. These findings underscore the distinct physical capability of L-band signals (ALOS-2) over shorter wavelengths, primarily attributed to their enhanced capacity to penetrate dense vegetation canopies and interact with the underlying water surface. This aligns with the established [70,71,72,73] consensus in radar remote sensing that longer wavelengths, such as L-band, are generally preferred for detecting inundation beneath wetland or dense canopies due to their higher transmissivity compared to C- or X-band. Examination of the mean and standard deviation distributions for inundated versus non-inundated samples (Figure 7) demonstrates that the separability between the two classes varies according to the age of the plant and backscatter polarization. Building upon this clear separability observed in the backscatter domain, this study prioritizes the analysis of backscatter intensity from HH, HV, VH, and VV polarizations over complex polarimetric (PolSAR) techniques to optimize efficiency and scalability for large-scale monitoring in regions like the Mekong Delta.
HH polarization: The HH polarization exhibits high sensitivity to water presence during the early stages (1–30 dap, spanning sowing to tillering), facilitating clear discrimination between inundated and non-inundated fields (Figure 7). Inundated fields exhibit specular reflection from the water, resulting in low backscatter at the 25.6°–29.7° local incidence angle. Conversely, non-inundated fields display higher backscatter originating from surface scattering over moist or dry soil. Until the tillering stage, low rice biomass permits radar signal penetration through the sparse canopy to interact directly with the water surface, thereby reducing HH backscatter. Historically, numerous studies on wetland monitoring have advocated for the use of HH polarization, citing its superior ability to penetrate canopy and stronger reflection of water surfaces compared to VV [70,72,74]. However, in subsequent growth stages (31–120 dap), few differences are found between HH backscatter values for inundated and non-inundated fields (Figure 7). This is driven by increased volume scattering from the canopy during the active vegetative, reproductive, and ripening phases, rendering HH polarization less effective for inundation detection in the mid-to-late stages.
VV polarization: Statistical analysis indicates that VV polarization is highly effective in discriminating inundation status in the early 1–30 dap and 31–60 dap phases (Figure 7). In the 61–90 dap and 91–120 dap phases, a partial overlap is observed in the standard deviations of VV backscatter between inundated and non-inundated fields. Nevertheless, VV polarization generally demonstrates separability in these later stages compared to HH, HV, and VH polarizations. This finding presents an interesting contrast to literature regarding forested wetlands, where vertical structures (e.g., trunks) are suggested to utilize HH polarization in mangrove mapping versus VV polarization in relation to the direction of the SAR signal [70,72,74]; generally, HH polarization penetrates the foliage better than VV and, upon impact with the water surface, is reflected more strongly than VV polarization [75]. However, our field data consistently reveal that VV polarization yields better separability for rice paddy inundation in this study. A potential explanation for this behavior could be linked to the specific canopy geometry of rice plants (slender, vertically oriented stems), which induces strong wave attenuation in VV polarization and makes the signal highly sensitive to the structural changes above the water surface. Given that the primary objective of this study focuses on regional-scale inundation classification rather than theoretical scattering modeling, a definitive explanation requires further validation. Future research utilizing advanced polarimetric decomposition or electromagnetic simulations will be necessary to fully clarify these underlying scattering mechanisms in rice canopy environments.
Notably, the mean backscatter and standard deviation of VV polarization for non-inundated fields remain relatively stable within the −10 to −15 dB range throughout the crop cycle (Figure 7). This stability suggests minimal influence from biomass accumulation observed in these non-inundated conditions. For inundated fields (Figure 7), significantly low backscatter is observed in the first stage (1–30 dap), primarily due to specular reflection from the water surface. In the last two stages (61–90 dap, 91–120 dap), backscatter values increase alongside increased volume scattering as the crop enters flowering and grain filling. Previous research indicates that as biomass increases, a saturation point is reached where volume scattering superimposes the double-bounce contribution [72]. The dense biomass and fully developed canopy during these periods attenuate separability, leading to higher classification confusion compared to earlier stages.
Cross-polarizations (HV/VH): Cross-polarized signals effectively reflect volume scattering mechanisms (Figure 7). This aligns with the notion that cross-polarized data are more susceptible to volumetric scattering and depolarization, making them generally less suitable for flood detection than co-polarized data [72,76]. While they can distinguish inundation status during the initial stage (1–30 dap), the standard deviations of inundated and non-inundated classes overlap significantly in later stages due to dense canopy closure (Figure 7), limiting their utility for inundation mapping.
Overall, VV polarization demonstrates strong potential for identifying inundation conditions in rice paddies. However, given the temporal variation in mean and standard deviation values across growth stages, applying a static threshold throughout the entire crop cycle is impractical. Since environmental parameters strongly influence backscatter, defining a static threshold is widely recognized as a critical challenge, often requiring individual determination for specific conditions [64,65,72]. Therefore, this study proposes an inundation classification model using an adaptive thresholding method for VV polarization, adjusted for each specific growth stage (rice age), to achieve optimal classification accuracy.

4.2. Inundation Detection Algorithm Beneath Rice Canopy Across Rice Growth Stages

A pivotal breakthrough of this study lies in the successful exploitation of the synergistic strengths between two complementary sensor systems: Sentinel-1 (C-band) and ALOS-2 (L-band). While C-band data is often constrained by limited penetration depth and signal saturation in dense canopy conditions (high biomass) [77,78], its primary advantage is the high temporal resolution (6-day revisit cycle) [6,33,79]. This facilitates detailed phenological monitoring and highly reliable rice age estimation [29], serving as a prerequisite input for the inundation classification model.
Conversely, findings from VV polarization of ALOS-2 PALSAR-2 confirm the unique suitability of L-band SAR for sub-canopy inundation monitoring. The capacity of L-band signals to penetrate dense rice canopies and interact with the underlying water surface represents a significant advancement over traditional C-band sensors. This aligns with prior literature, which consistently advocates for the prioritization of longer wavelengths (L-band) for detecting inundation beneath forests or dense vegetation [70,71,72] and paddy rice [22,80].
By utilizing Sentinel-1-derived rice age to stratify growth stages, the classification model applied to ALOS-2 data overcomes the critical limitation of using a single “static threshold” for the entire cropping season. Classification thresholds for VV polarization were not fixed but adaptively tuned based on statistical analysis corresponding to specific phenological stages extracted from the Sentinel-1 time series. This stratification is crucial because, as observed in ground surveys in An Giang, the rice plant structure undergoes significant changes—losing its vertical structure at the beginning of tillering and again at booting-heading [6,29,53]. These structural shifts directly impact radar backscatter mechanisms, making stage-dependent thresholds essential for accurate classification. This adaptive thresholding approach was adopted to support the objective of regional-scale and operationally feasible application. By explicitly incorporating radar scattering mechanisms together with locally collected in situ observations, the method provides a physically interpretable framework with relatively low computational requirements, making it suitable for large-area implementation. In comparison, advanced machine learning approaches such as Random Forest, Support Vector Machine (SVM), and XGBoost generally require large and continuously updated training datasets, as well as greater computational resources [43,44], to ensure stable model performance across heterogeneous agricultural conditions. Given the limited number of samples available in this study, the thresholding method was preferred, as machine learning techniques inherently demand dense training datasets to achieve reliable accuracy. Although a quantitative comparison with these machine learning methods was beyond the scope of the present study, future research should include systematic benchmarking to further evaluate the relative advantages and limitations of physically based and data-driven approaches for rice inundation monitoring.
Despite these methodological trade-offs, the integrated Sentinel-1 and ALOS-2 approach achieved an overall accuracy of 81% with a Kappa coefficient of 0.77. The results demonstrate the capability of SAR-based integration for inundation monitoring under the persistent cloud-cover conditions of An Giang Province, where optical remote sensing is often limited during the rainy season. Furthermore, the combined use of Sentinel-1 temporal information and ALOS-2 L-band backscatter improved the discrimination between inundated rice fields, dense vegetation, and non-flooded soil surfaces compared with single-sensor approaches. Performance was robust in the early stages (1–30 and 31–60 days after planting—dap), but misclassification rates increased in later stages (61–120 dap) due to dense biomass effects. A critical observation from the confusion matrix (Table 2) is the reduced accuracy during the reproductive and ripening stages (61–120 dap). This phenomenon is consistent with the physical limitations of SAR signals regarding biomass saturation. Previous studies [77,78,81] have indicated that radar backscatter increases with biomass until a saturation point is reached, after which the underlying water becomes undetectable. In this study, the dense rice canopy formed during heading and grain filling likely caused volume scattering to completely overwhelm the double-bounce contribution from the stem-water interaction. This “reduced separability” suggests that despite the enhanced penetration of L-band, high rice biomass remains a challenge, potentially requiring ancillary data or polarimetric decomposition techniques for mitigation. Nevertheless, these findings reinforce the applicability of ALOS-2 PALSAR-2 for inundation monitoring in rice paddies.
Beyond the confounding effects of rice growth stages, the overall accuracy of the inundation classification was primarily constrained by surface heterogeneity and the inherent limitations of SAR data [82,83]. In the An Giang study area, small-scale bund systems, drainage ditches, and micro-topographic variations introduce localized water level fluctuations within individual fields. Consequently, mixed pixel effects frequently occur along field boundaries during training and validation sampling—an issue exacerbated by the spatial resolution constraints of the ALOS-2 PALSAR-2 imagery used, which lacks the fine-scale detail necessary to completely resolve these microstructures. Furthermore, the classification was inherently challenged by speckle noise, a characteristic artifact in active radar imaging. Although speckle filtering was implemented to mitigate this noise, the resulting spatial smoothing inadvertently compromised local contrast and blurred the backscattering boundaries between inundated and non-inundated fields. This fundamental trade-off in SAR image processing directly contributed to the misclassification of field hydrological statuses, representing a persistent technical challenge in radar-based agricultural monitoring.
The spatiotemporal maps of inundation and rice age clearly reflect the variation in sowing schedules (up to 1–2 months between regions) and, notably, the practice of Alternate Wetting and Drying, where inundation status varies even among fields of the same age (Figure 10). Analysis of data from 90 fields in An Giang confirmed that water-saving farming practices—similar to AWD—are widely implemented, where fields are typically drained about two weeks before harvest [53]. These maps offer significant practical value for Measurement, Reporting, and Verification (MRV) systems [84,85,86] in agriculture, particularly in the context of climate change. Specifically, the derived flooding duration and irrigation regimes constitute the most critical data required as inputs for biogeochemical models or for applying emission factors under IPCC Tier 2 or Tier 3 guidelines [87,88,89].
Accurate identification of continuously inundated hotspots enables managers to identify areas with high potential for methane (CH4) production resulting from prolonged anaerobic decomposition without performing direct emission quantification. Furthermore, this tool facilitates independent verification of large-scale AWD implementation. The clear distinction between wet and dry states across growth stages enhances the transparency of emission reduction efforts, providing essential input data to support the expansion of low-emission rice farming models and carbon credit markets in the Mekong Delta. This serves as a vital premise for establishing an automated and transparent data framework for future national-level greenhouse gas monitoring applications.
Despite promising results, several limitations warrant acknowledgment. While the sample size (n = 531) was sufficient for provincial-level analysis, it may not fully represent the diverse rice varieties and complex farming practices across the entire Mekong Delta. The current research focuses primarily on binary inundation status (flooded/non-flooded), while water depth—a factor strongly influencing methane emissions—has not been quantified. To enhance applicability, future studies should expand field surveys and data collection to various ecological sub-regions of the Mekong Delta.
Furthermore, a notable source of uncertainty stems from the operational integration of the rice age estimation baseline. Although the utilized algorithm provides a robust framework, its documented uncertainty (RMSE = 7.3 days) inherently propagates into the subsequent workflow [29]. This temporal shift can potentially affect the inundation classification results, particularly during transitional phenological phases where the sensitivity of VH backscatter to both developing canopy structures and early-stage surface water overlaps. Addressing this error propagation and quantifying its exact impact on inundation mapping accuracy remains an important area for future optimization.
Another critical limitation concerns the temporal representativeness of radar data integration, particularly for the L-band ALOS-2 imagery. While Sentinel-1 provides a dense time series (44 images) capable of capturing rapid temporal variations, the ALOS-2 dataset was limited to only six acquisition dates between December and February due to its longer 14-day revisit interval and operational acquisition schedule. This temporal sparsity implies that, although the multi-wavelength approach improves spatial and structural classification accuracy, the L-band component primarily serves as a multi-temporal “snapshot” rather than a continuous monitoring system for high-frequency AWD drawdown cycles. Consequently, short-duration or abrupt drainage events may not be fully captured during gaps between L-band acquisitions. This operational limitation underscores the importance of integrating data from new operational L-band systems such as ALOS-4, SAOCOM, and NISAR as well as upcoming radar missions including ROSE-L. Once fully operational, these advanced radar constellations are expected to provide substantially improved temporal coverage and more frequent L-band acquisitions, enabling more effective monitoring of short-term hydrological dynamics throughout the entire rice-growing cycle.
Methodologically, the approach based on multi-wavelength and multi-polarization SAR with in situ training data demonstrates good scalability for An Giang, in the Mekong Delta. However, variations in micro-topography, cropping calendars, and irrigation systems among sub-regions must be considered. Finally, standardizing processing workflows and integrating SAR data into cloud computing platforms (such as Google Earth Engine or national computing infrastructures) will be a crucial step toward real-time rice paddy inundation monitoring, serving both scientific research and sustainable agricultural management.

5. Conclusions

By integrating the high temporal resolution data of Sentinel-1 with the enhanced canopy penetration capabilities observed in ALOS-2 PALSAR-2 data, this study successfully validated a synergistic framework for monitoring inundation conditions beneath rice canopies, overcoming the limitations of single-sensor approaches. Specifically, the results demonstrate the advantage of L-band VV polarization over the traditionally favored HH polarization for sub-canopy hydrology. This promising performance under the observed configurations is attributed to the alignment between the vertical electric field vector and the vertical structure of rice plants, particularly when constrained by crop phenology derived from Sentinel-1. However, further evaluation across diverse agricultural regions and extended timelines is required to confirm these localized trends globally.
Furthermore, the implementation of an adaptive threshold classification method based on rice growth stages effectively disentangled biomass accumulation effects from genuine hydrological signals. Although classification accuracy naturally reduced during peak biomass stages (e.g., flowering, milky stage and maturity) due to volume scattering saturation, the integrated model achieved an overall accuracy of 81%, proving sufficient for regional-scale monitoring.
Beyond technical validation, the capability to quantify multi-date inundation maps provides essential critical data for greenhouse gas inventories. This approach establishes a scalable mechanism to support Measurement, Reporting, and Verification (MRV) systems, facilitating the transparent evaluation of low-emission practices such as Alternate Wetting and Drying (AWD). Consequently, this study contributes directly to national climate resilience strategies and emission reduction targets in Vietnam’s Mekong Delta.

Author Contributions

Conceptualization, P.H.-P. and N.L.-D.; methodology, P.H.-P. and N.L.-D.; software, N.D.-P.-B. and P.H.-P.; validation, N.D.-P.-B. and P.H.-P.; formal analysis, P.H.-P. and N.L.-D.; investigation, N.D.-P.-B. and P.H.-P.; resources, N.L.-D., T.L.-T. and S.S.; data curation, P.H.-P.; writing—original draft preparation, P.H.-P., T.T.-N.-K., N.D.-P.-B. and N.L.-D.; writing—review and editing, P.H.-P., N.L.-D., T.T.-N.-K., T.L.-T. and S.S.; visualization, P.H.-P. and N.D.-P.-B.; supervision, N.L.-D.; project administration, N.L.-D.; funding acquisition, N.L.-D., T.L.-T. and S.S. All authors have read and agreed to the published version of the manuscript.

Funding

Funding for the APC was provided by Dr. Shinichi Sobue, Japan Aerospace Exploration Agency (JAXA); contact: sobue.shinichi@jaxa.jp.

Data Availability Statement

The Sentinel-1 satellite imagery used in this study is openly available free of charge from the European Space Agency (ESA) via the Copernicus Data Space Ecosystem (CDSE) at dataspace.copernicus.eu. Restrictions apply to the availability of the ALOS-2 PALSAR-2 full-polarization data. These data were obtained from the Japan Aerospace Exploration Agency (JAXA) and are available from the authors with the permission of JAXA. Restrictions also apply to the availability of the field data. These data were funded and provided under contractual agreements by the Japan Aerospace Exploration Agency (JAXA) and Remote Sensing Technology Center of Japan (RESTEC), Japan, and the Centre d’Études Spatiales de la Biosphère (CESBIO) and GlobEO, France. Access to these datasets can be requested from the authors, subject to the terms of the respective contracts.

Acknowledgments

The authors gratefully acknowledge the Japan Aerospace Exploration Agency (JAXA) for providing the ALOS-2 PALSAR-2 full-polarization data used in this study. The study conducted field surveys with financial support from the Japan Aerospace Exploration Agency (JAXA) and Remote Sensing Technology Center of Japan (RESTEC), Japan and the Centre D’Etudes Spatiales de la Biosphère (CESBIO) and GlobEO, France. During the preparation of this manuscript, the authors used Google Gemini 3.1, ChatGPT 4, and Microsoft Copilot free version to assist with translation, grammar checking, and text refinement. The authors have reviewed and edited the output and take full responsibility for the content of this publication.

Conflicts of Interest

The authors declare no conflicts of interest. The funders had no role in the design of the study; in the collection, analyses, or interpretation of data; in the writing of the manuscript; or in the decision to publish the results.

Abbreviations

The following abbreviations are used in this manuscript:
AWDAlternate Wetting and Drying
CESBIOCentre d’Études Spatiales de la Biosphère
dapdays after planting
DEMDigital Elevation Model
DNDigital Numbers
FPFull Polarization
GHGGreenhouse Gas
HHtransmitted with Horizontal polarization and received with Horizontal polarization
HVtransmitted with Horizontal polarization and received with Vertical polarization
IPCCIntergovernmental Panel on Climate Change
JAXAJapan Aerospace Exploration Agency
JMJeffries–Matusita
LAILeaf area index
LUTsLook-Up Tables
MDMekong Delta
MNDWIModified Normalized Difference Water Index
MRVMeasurement, Reporting, and Verification
NDWINormalized Difference Water Index
RESTECRemote Sensing Technology Center of Japan
RMSERoot Mean Square Error
SNAPSentinel Application Platform
SRTMShuttle Radar Topography Mission
SVMSupport Vector Machine
UAVSARUninhabited Aerial Vehicle Synthetic Aperture Radar
VHtransmitted with Vertical polarization and received with Horizontal polarization
VVtransmitted with Vertical polarization and received with Vertical polarization

References

  1. Lee, S. Recent Advances on Nitrogen Use Efficiency in Rice. Agronomy 2021, 11, 753. [Google Scholar] [CrossRef]
  2. Quoc Thanh, V.; Quoc Thanh, V.; Roelvink, D.; Van Der Wegen, M.; Reyns, J.; Kernkamp, H.; Van Vinh, G.; Thi Phuong Linh, V. Flooding in the Mekong Delta: The Impact of Dyke Systems on Downstream Hydrodynamics. Hydrol. Earth Syst. Sci. 2020, 24, 189–212. [Google Scholar] [CrossRef]
  3. Le, T.V.H.; Nguyen, H.N.; Wolanski, E.; Tran, T.C.; Haruyama, S. The Combined Impact on the Flooding in Vietnam’s Mekong River Delta of Local Man-Made Structures, Sea Level Rise, and Dams Upstream in the River Catchment. Estuar. Coast. Shelf Sci. 2007, 71, 110–116. [Google Scholar] [CrossRef]
  4. Loan, L.T.K.; Truc, N.T.T.; Khoa, D.D. Impact of Saltwater Intrusion on Poverty in Rural Households in the Mekong Delta, Vietnam. Nurture 2023, 17, 557–570. [Google Scholar] [CrossRef]
  5. Xiao, H.; Tang, Y.; Li, H.; Zhang, L.; Ngo-Duc, T.; Chen, D.; Tang, Q. Saltwater Intrusion into Groundwater Systems in the Mekong Delta and Links to Global Change. Adv. Clim. Change Res. 2021, 12, 342–352. [Google Scholar] [CrossRef]
  6. Hoang-Phi, P.; Lam-Dao, N.; Pham-Van, C.; Chau-Nguyen-Xuan, Q.; Nguyen-Van-Anh, V.; Gummadi, S.; Le-Van, T. Sentinel-1 SAR Time Series-Based Assessment of the Impact of Severe Salinity Intrusion Events on Spatiotemporal Changes in Distribution of Rice Planting Areas in Coastal Provinces of the Mekong Delta, Vietnam. Remote Sens. 2020, 12, 3196. [Google Scholar] [CrossRef]
  7. Bhakta Shrestha, B. Assessment of Flood Hazard and Agriculture Damage Under Climate Change in the Bagmati River Basin of Nepal. Int. J. Environ. 2019, 8, 55–69. [Google Scholar] [CrossRef]
  8. Nguyen, N.Y.; Kha, D.D.; Ichikawa, Y. Developing a Multivariable Lookup Table Function for Estimating Flood Damages of Rice Crop in Vietnam Using a Secondary Research Approach. Int. J. Disaster Risk Reduct. 2021, 58, 102208. [Google Scholar] [CrossRef]
  9. Liersch, S.; Cools, J.; Kone, B.; Koch, H.; Diallo, M.; Reinhardt, J.; Fournet, S.; Aich, V.; Hattermann, F.F. Vulnerability of Rice Production in the Inner Niger Delta to Water Resources Management under Climate Variability and Change. Environ. Sci. Policy 2013, 34, 18–33. [Google Scholar] [CrossRef]
  10. Deng, Y.; Peng, B.; Guan, K.; Runkle, B.R.K.; Moreno-García, B.; Wu, X.; Wang, S.; Zhou, Q.; Reba, M.L. Detecting the Onset of Rice Field Inundation in the Lower Mississippi River Basin via Harmonized Landsat Sentinel-2 (HLS) Satellite Time Series. ISPRS J. Photogramm. Remote Sens. 2025, 228, 28–43. [Google Scholar] [CrossRef]
  11. Srinivasa Rao, C.; Gopinath, K.A.; Prasad, J.V.N.S.; Prasannakumar; Singh, A.K. Climate Resilient Villages for Sustainable Food Security in Tropical India: Concept, Process, Technologies, Institutions, and Impacts. Adv. Agron. 2016, 140, 101–214. [Google Scholar] [CrossRef]
  12. Nihayah, B.; Nugroho, B.D.A.; Hasanah, N.A.I.; Saputra, R. Methane (CH4) Emission Flux Estimation in SRI (System of Rice Intensification) Method Rice Cultivation Using Different Varieties and Fertilization. IOP Conf. Ser. Earth Environ. Sci. 2021, 757, 012001. [Google Scholar] [CrossRef]
  13. Rogers, C.W.; Brye, K.R.; Norman, R.J.; Gbur, E.E.; Mattice, J.D.; Parkin, T.B.; Roberts, T.L. Methane Emissions from Drill-Seeded, Delayed-Flood Rice Production on a Silt-Loam Soil in Arkansas. J. Environ. Qual. 2013, 42, 1059–1069. [Google Scholar] [CrossRef] [PubMed]
  14. Smartt, A.D.; Brye, K.R.; Rogers, C.W.; Norman, R.J.; Gbur, E.E.; Hardke, J.T.; Roberts, T.L. Previous Crop and Cultivar Effects on Methane Emissions from Drill-Seeded, Delayed-Flood Rice Grown on a Clay Soil. Appl. Environ. Soil Sci. 2016, 2016, 9542361. [Google Scholar] [CrossRef]
  15. Aslam, A.; Mahmood, A.; Ur-Rehman, H.; Li, C.; Liang, X.; Shao, J.; Negm, S.; Moustafa, M.; Aamer, M.; Hassan, M.U. Plant Adaptation to Flooding Stress under Changing Climate Conditions: Ongoing Breakthroughs and Future Challenges. Plants 2023, 12, 3824. [Google Scholar] [CrossRef] [PubMed]
  16. Kabange, N.R.; Kwon, Y.; Lee, S.M.; Kang, J.W.; Cha, J.K.; Park, H.; Dzorkpe, G.D.; Shin, D.; Oh, K.W.; Lee, J.H. Mitigating Greenhouse Gas Emissions from Crop Production and Management Practices, and Livestock: A Review. Sustainability 2023, 15, 15889. [Google Scholar] [CrossRef]
  17. Velez, A.F.; Alvarez, C.I.; Navarro, F.; Guzman, D.; Bohorquez, M.P.; Selvaraj, M.G.; Ishitani, M. Assessing Methane Emissions from Paddy Fields through Environmental and UAV Remote Sensing Variables. Environ. Monit. Assess. 2024, 196, 574. [Google Scholar] [CrossRef] [PubMed]
  18. Phan, A.; Ha, D.N.; Man, C.D.; Nguyen, T.T.; Bui, H.Q.; Nguyen, T.T.N. Rapid Assessment of Flood Inundation and Damaged Rice Area in Red River Delta from Sentinel 1A Imagery. Remote Sens. 2019, 11, 2034. [Google Scholar] [CrossRef]
  19. Wang, L.C.; Hoang, D.V.; Liou, Y.A. Quantifying the Impacts of the 2020 Flood on Crop Production and Food Security in the Middle Reaches of the Yangtze River, China. Remote Sens. 2022, 14, 3140. [Google Scholar] [CrossRef]
  20. Sukojo, B.M.; Azizah, L.; Sanjaya, H. Flood Disaster Monitoring Application in the National Rice Granary Area Based on Sentinel-1 Imagery (Case Study: Laren Disctrict, Lamongan Regency). In Proceedings of the 2023 IEEE International Conference on Aerospace Electronics and Remote Sensing Technology, ICARES 2023, Bali, Indonesia, 26–27 October 2023. [Google Scholar]
  21. Hsiao, Y.Y.; Chen, C.F.; Chiang, S.H.; Son, N.T. Analysis of Damaged Rice Fields and Rice Restoration after the Great East Japan Tsunami Using Time-Series MODIS Data. In Proceedings of the ACRS 2015—36th Asian Conference on Remote Sensing: Fostering Resilient Growth in Asia, Proceedings, Quezon City, Philippines, 24–28 October 2015. [Google Scholar]
  22. Arai, H.; Takeuchi, W.; Oyoshi, K.; Nguyen, L.D.; Inubushi, K. Estimation of Methane Emissions from Rice Paddies in the Mekong Delta Based on Land Surface Dynamics Characterization with Remote Sensing. Remote Sens. 2018, 10, 1438. [Google Scholar] [CrossRef]
  23. Wassmann, R.; Neue, H.; Lantin, R.S.; Buendia, L.V.; Rennenberg, H. Methane Emissions from Major Rice Ecosystems in Asia; Springer: Dordrecht, The Netherlands, 2000. [Google Scholar] [CrossRef]
  24. Chen, Z.; Lin, H.; Balasus, N.; Hardy, A.; East, J.D.; Zhang, Y.; Runkle, B.R.K.; Hancock, S.E.; Taylor, C.A.; Du, X.; et al. Global Rice Paddy Inventory (GRPI): A High-Resolution Inventory of Methane Emissions From Rice Agriculture Based on Landsat Satellite Inundation Data. Earths Future 2025, 13, e2024EF005479. [Google Scholar] [CrossRef]
  25. Kordelas, G.A.; Manakos, I.; Aragonés, D.; Díaz-Delgado, R.; Bustamante, J. Fast and Automatic Data-Driven Thresholding for Inundation Mapping with Sentinel-2 Data. Remote Sens. 2018, 10, 910. [Google Scholar] [CrossRef]
  26. Tivianton, T.A.; Barus, B.; Purwanto, M.Y.J.; Anwar, S.; Widiatmaka; Laudiansyah, R. Temporal NDVI Analysis to Detect the Effects of Seawater Intrusion on Rice Growth in Coastal Areas. IOP Conf. Ser. Earth Environ. Sci. 2021, 662, 012021. [Google Scholar] [CrossRef]
  27. Chang, L.; Chen, Y.; Wang, J.; Chang, Y. Rice-Field Mapping with Sentinel-1A SAR Time-Series Data. Remote Sens. 2020, 13, 103. [Google Scholar] [CrossRef]
  28. Phung, H.P.; Nguyen, L.D. Rice Crop Monitoring in the Mekong Delta, Vietnam Using Multi-Temporal Sentinel-1 Data with C-Band. In ICSCEA 2019; Lecture Notes in Civil Engineering; Reddy, J.N., Wang, C.M., Luong, V.H., Le, A.T., Eds.; Springer Nature: Singapore, 2020; pp. 979–986. ISBN 9789811551437. [Google Scholar]
  29. Phung, H.-P.; Nguyen, L.-D.; Thong, N.-H.; Thuy, L.-T.; Apan, A.A. Monitoring Rice Growth Status in the Mekong Delta, Vietnam Using Multitemporal Sentinel-1 Data. J. Appl. Remote Sens. 2020, 14, 014518. [Google Scholar] [CrossRef]
  30. Huang, X.; Runkle, B.R.K.; Isbell, M.; Moreno-García, B.; McNairn, H.; Reba, M.L.; Torbick, N. Rice Inundation Assessment Using Polarimetric UAVSAR Data. Earth Space Sci. 2021, 8, e2020EA001554. [Google Scholar] [CrossRef] [PubMed]
  31. Sukowati, K.A.D.; Kusratmoko, E. Analysis of the Distribution of Flood Area in Karawang Regency Using SAR Sentinel 1A Image. IOP Conf. Ser. Earth Environ. Sci. 2019, 311, 012085. [Google Scholar] [CrossRef]
  32. Lopez-Sanchez, J.M.; Vicente-Guijalba, F.; Ballester-Berman, J.D.; Cloude, S.R. Polarimetric Response of Rice Fields at C-Band: Analysis and Phenology Retrieval. IEEE Trans. Geosci. Remote Sens. 2014, 52, 2977–2993. [Google Scholar] [CrossRef]
  33. McNairn, H.; Brisco, B. The Application of C-Band Polarimetric SAR for Agriculture: A Review. Can. J. Remote Sens. 2004, 30, 525–542. [Google Scholar] [CrossRef]
  34. Arii, M.; Nishimura, T. Sensitivity Analysis of L-Band SAR to Inundated Area. In Proceedings of the International Geoscience and Remote Sensing Symposium (IGARSS), Beijing, China, 10–15 July 2016. [Google Scholar]
  35. Pierdicca, N.; Chini, M.; Pulvirenti, L. Enhanced Land Cover and Flood Mapping at C- and L-BAND. In Proceedings of the International Geoscience and Remote Sensing Symposium (IGARSS), Waikoloa, HI, USA, 26 September–2 October 2020. [Google Scholar]
  36. Arai, H.; Le Toan, T.; Takeuchi, W.; Oyoshi, K.; Fumoto, T.; Inubushi, K. Evaluating Irrigation Status in the Mekong Delta through Polarimetric L-Band SAR Data Assimilation. Remote Sens. Environ. 2022, 279, 113139. [Google Scholar] [CrossRef]
  37. Pham, B.T.; Jaafari, A.; Van Phong, T.; Yen, H.P.H.; Tuyen, T.T.; Luong, V.V.; Nguyen, H.D.; Le, H.V.; Foong, L.K. Improved Flood Susceptibility Mapping Using a Best First Decision Tree Integrated with Ensemble Learning Techniques. Geosci. Front. 2021, 12, 101105. [Google Scholar] [CrossRef]
  38. Costache, R.; Arabameri, A.; Costache, I.; Crăciun, A.; Islam, A.R.M.T.; Abba, S.I.; Sahana, M.; Pandey, M.; Tin, T.T.; Pham, B.T. Flood Hazard Potential Evaluation Using Decision Tree State-of-the-Art Models. Risk Anal. 2024, 44, 439–458. [Google Scholar] [CrossRef] [PubMed]
  39. Farhadi, H.; Najafzadeh, M. Flood Risk Mapping by Remote Sensing Data and Random Forest Technique. Water 2021, 13, 3115. [Google Scholar] [CrossRef]
  40. Tan, X.Z.; Li, Y.; Wu, X.X.; Dai, C.; Zhang, X.L.; Cai, Y.P. Identification of the Key Driving Factors of Flash Flood Based on Different Feature Selection Techniques Coupled with Random Forest Method. J. Hydrol. Reg. Stud. 2024, 51, 101624. [Google Scholar] [CrossRef]
  41. Youssef, A.M.; Pourghasemi, H.R.; Mahdi, A.M.; Matar, S.S. Flood Vulnerability Mapping and Urban Sprawl Suitability Using FR, LR, and SVM Models. Environ. Sci. Pollut. Res. 2023, 30, 16081–16105. [Google Scholar] [CrossRef] [PubMed]
  42. Zehra, N. Prediction Analysis of Floods Using Machine Learning Algorithms (NARX & SVM). Int. J. Sci. Basic Appl. Res. 2020, 49, 24–34. [Google Scholar]
  43. Benos, L.; Tagarakis, A.C.; Dolias, G.; Berruto, R.; Kateris, D.; Bochtis, D. Machine Learning in Agriculture: A Comprehensive Updated Review. Sensors 2021, 21, 3758. [Google Scholar] [CrossRef] [PubMed]
  44. Liakos, K.G.; Busato, P.; Moshou, D.; Pearson, S.; Bochtis, D. Machine Learning in Agriculture: A Review. Sensors 2018, 18, 2674. [Google Scholar] [CrossRef] [PubMed]
  45. Dang, H.D.; Pham, T.T. Risk Perceptions and Management Strategies of Rice Smallholders in the Mekong Delta, Vietnam. Pol. J. Environ. Stud. 2022, 31, 637–651. [Google Scholar] [CrossRef]
  46. Minh, H.V.T.; Avtar, R.; Mohan, G.; Misra, P.; Kurasaki, M. Monitoring and Mapping of Rice Cropping Pattern in Flooding Area in the Vietnamese Mekong Delta Using Sentinel-1A Data: A Case of An Giang Province. ISPRS Int. J. Geoinf. 2019, 8, 211. [Google Scholar] [CrossRef]
  47. Bouvet, A.; Thuy, L.T.; Lam-Dao, N. Monitoring of the Rice Cropping System in the Mekong Delta Using ENVISAT/ASAR Dual Polarization Data. IEEE Trans. Geosci. Remote Sens. 2009, 47, 517–526. [Google Scholar] [CrossRef]
  48. Prime Minister Decision No. 1490/QD-TTg of the Prime Minister: Approving the Project “Sustainable Development of One Million Hectares of High-Quality and Low-Emission Rice Cultivation Associated with Green Growth in the Mekong Delta by 2030”. Available online: https://vanban.chinhphu.vn/?pageid=27160&docid=209054 (accessed on 17 October 2025).
  49. Lilienthal, H.; Gerighausen, H.; Schnug, E. First Experiences with the European Remote Sensing Satellites Sentinel-1A/-2A for Agricultural Research. In Proceedings of the 13th International Conference on Precision Agriculture, St. Louis, MI, USA, 31 July–4 August 2016. [Google Scholar]
  50. Nguyen, C.T.H.; Febriamansyah, R.; Pham, V.H.T.; Tran, H.V. Factors Affecting the Change of Agricultural Livelihoods of Farmers Adapting to Water Resource Reduction in the Highland Area in An Giang Province, Vietnam. IOP Conf. Ser. Earth Environ. Sci. 2024, 1349, 012036. [Google Scholar] [CrossRef]
  51. Paloscia, S. An Empirical Approach to Estimating Leaf Area Index from Multifrequency SAR Data. Int. J. Remote Sens. 1998, 19, 359–364. [Google Scholar] [CrossRef]
  52. Ndikumana, E.; Minh, D.H.T.; Nguyen, H.T.D.; Baghdadi, N.; Courault, D.; Hossard, L.; Moussawi, I. El Estimation of Rice Height and Biomass Using Multitemporal SAR Sentinel-1 for Camargue, Southern France. Remote Sens. 2018, 10, 1394. [Google Scholar] [CrossRef]
  53. Phan, H.; Le Toan, T.; Bouvet, A. Understanding Dense Time Series of Sentinel-1 Backscatter from Rice Fields: Case Study in a Province of the Mekong Delta, Vietnam. Remote Sens. 2021, 13, 921. [Google Scholar] [CrossRef]
  54. Quegan, S.; Le Toan, T.; Yu, J.J.; Ribbes, F.; Floury, N. Multitemporal ERS SAR Analysis Applied to Forest Mapping. IEEE Trans. Geosci. Remote Sens. 2000, 38, 741–753. [Google Scholar] [CrossRef]
  55. Quegan, S.; Yu, J.J. Filtering of Multichannel SAR Images. IEEE Trans. Geosci. Remote Sens. 2001, 39, 2373–2379. [Google Scholar] [CrossRef]
  56. Qazi, W.A.; Baig, S.; Gilani, H.; Waqar, M.M.; Dhakal, A.; Ammar, A. Comparison of Forest Aboveground Biomass Estimates from Passive and Active Remote Sensing Sensors over Kayar Khola Watershed, Chitwan District, Nepal. J. Appl. Remote Sens. 2017, 11, 026038. [Google Scholar] [CrossRef]
  57. Smitha, A.; Jidesh, P. A Nonlocal Deep Image Prior Model to Restore Optical Coherence Tomographic Images from Gamma Distributed Speckle Noise. J. Mod. Opt. 2021, 68, 1002–1017. [Google Scholar] [CrossRef]
  58. Lee, J. Sen Polarimetric SAR Speckle Filtering and Its Implication for Classification. IEEE Trans. Geosci. Remote Sens. 1999, 37, 2363–2373. [Google Scholar] [CrossRef]
  59. Wiederkehr, N.C.; Gama, F.F.; Mura, J.C.; Dos Santos, J.R.; da Conceição Bispo, P.; Sano, E.E. Analysis of the Target Decomposition Technique Attributes and Polarimetric Ratios to Discriminate Land Use and Land Cover Classes of the TapajÓs Region. Bol. Cienc. Geod. 2019, 25, e2019002. [Google Scholar] [CrossRef]
  60. Mitchell, A.L.; Williams, M.L.; Milne, A.K. Forest and Forest Changemapping Using Sar Data and a Robust Classification Methodology. In Proceedings of the 32nd Asian Conference on Remote Sensing 2011, ACRS 2011, Taipei, Taiwan, 3–7 October 2011; Volume 2. [Google Scholar]
  61. Demir, S.; Sahin, E.K. Comparison of Tree-Based Machine Learning Algorithms for Predicting Liquefaction Potential Using Canonical Correlation Forest, Rotation Forest, and Random Forest Based on CPT Data. Soil Dyn. Earthq. Eng. 2022, 154, 107130. [Google Scholar] [CrossRef]
  62. Liu, Z.; Pontius, R.G. The Total Operating Characteristic from Stratified Random Sampling with an Application to Flood Mapping. Remote Sens. 2021, 13, 3922. [Google Scholar] [CrossRef]
  63. Nguyen, T.D.; Shih, M.H.; Srivastava, D.; Tirthapura, S.; Xu, B. Stratified Random Sampling from Streaming and Stored Data. Distrib. Parallel Databases 2021, 39, 665–710. [Google Scholar] [CrossRef]
  64. Chan, F.H.Y.; Lam, F.K.; Zhu, H. Adaptive Thresholding by Variational Method. IEEE Trans. Image Process. 1998, 7, 468–473. [Google Scholar] [CrossRef] [PubMed]
  65. Yan, F.; Zhang, H.; Kube, C.R. A Multistage Adaptive Thresholding Method. Pattern Recognit. Lett. 2005, 26, 2690. [Google Scholar] [CrossRef]
  66. Tan, J.; Tang, Y.; Liu, B.; Zhao, G.; Mu, Y.; Sun, M.; Wang, B. A Self-Adaptive Thresholding Approach for Automatic Water Extraction Using Sentinel-1 SAR Imagery Based on OTSU Algorithm and Distance Block. Remote Sens. 2023, 15, 2690. [Google Scholar] [CrossRef]
  67. Stehman, S.V. Selecting and Interpreting Measures of Thematic Classification Accuracy. Remote Sens. Environ. 1997, 62, 77–89. [Google Scholar] [CrossRef]
  68. Cohen, J. A Coefficient of Agreement for Nominal Scales. Educ. Psychol. Meas. 1960, 20, 37–46. [Google Scholar] [CrossRef]
  69. Arlot, S.; Celisse, A. A Survey of Cross-Validation Procedures for Model Selection. Stat. Surv. 2010, 4, 40–79. [Google Scholar] [CrossRef]
  70. Sang, H.; Zhang, J.; Lin, H.; Zhai, L. Multi-Polarization ASAR Backscattering from Herbaceous Wetlands in Poyang Lake Region, China. Remote Sens. 2014, 6, 4621. [Google Scholar] [CrossRef]
  71. Refice, A.; Zingaro, M.; D’addabbo, A.; Chini, M. Integrating C- and l-Band Sar Imagery for Detailed Flood Monitoring of Remote Vegetated Areas. Water 2020, 12, 2745. [Google Scholar] [CrossRef]
  72. Tsyganskaya, V.; Martinis, S.; Marzahn, P.; Ludwig, R. SAR-Based Detection of Flooded Vegetation–a Review of Characteristics and Approaches. Int. J. Remote Sens. 2018, 39, 2255–2293. [Google Scholar] [CrossRef]
  73. Ramsey, E.; Rangoonwala, A.; Bannister, T. Coastal Flood Inundation Monitoring with Satellite C-Band and L-Band Synthetic Aperture Radar Data. J. Am. Water Resour. Assoc. 2013, 49, 1239–1260. [Google Scholar] [CrossRef]
  74. Kasischke, E.S.; Smith, K.B.; Bourgeau-Chavez, L.L.; Romanowicz, E.A.; Brunzell, S.; Richardson, C.J. Effects of Seasonal Hydrologic Patterns in South Florida Wetlands on Radar Backscatter Measured from ERS-2 SAR Imagery. Remote Sens. Environ. 2003, 88, 423–441. [Google Scholar] [CrossRef]
  75. Pierdicca, N.; Pulvirenti, L.; Chini, M.; Guerriero, L.; Candela, L. Observing Floods from Space: Experience Gained from COSMO-SkyMed Observations. Acta Astronaut. 2013, 84, 122–133. [Google Scholar] [CrossRef]
  76. Marti-Cardona, B.; Lopez-Martinez, C.; Dolz-Ripolles, J.; Bladè-Castellet, E. ASAR Polarimetric, Multi-Incidence Angle and Multitemporal Characterization of Doñana Wetlands for Flood Extent Monitoring. Remote Sens. Environ. 2010, 114, 2802–2815. [Google Scholar] [CrossRef]
  77. Uppala, D.; Somepalli, V.; Venkata, R.K.; Rama, S.S.M.V. Identification of Optimal Single Date for Rice Crop Discrimination and Relationships between Backscatter and Biophysical Parameters Using RISAT-1 Hybrid Polarimetric SAR Data. Geocarto Int. 2021, 36, 2010–2022. [Google Scholar] [CrossRef]
  78. Ribbes, F.; Le, T.; Le Toan, T. Rice Parameter Retrieval and Yield Prediction Using Radarsat Data. In Proceedings of the International Symposium in Digital Earth, Beijing, China, 29 November–2 December 1999; pp. 1–7. [Google Scholar]
  79. Phung, H.P.; Nguyen, L.D.; Van Anh Vu, N.; Thanh, N.K.; Trung, L.V. Application of Multi-Temporal Sentinel-1 SAR Data for Yield Estimation of Rice Crops in An Giang, Vietnam. IOP Conf. Ser. Earth Environ. Sci. 2022, 964, 012007. [Google Scholar] [CrossRef]
  80. Mirandilla, J.R.F.; Yamashita, M.; Yoshimura, M. Phenological Monitoring and Discrimination of Rice Ecosystems Using Multi-Temporal and Multi-Sensor Polarimetric SAR. Remote Sens. 2025, 17, 4007. [Google Scholar] [CrossRef]
  81. Aziz, M.A.; Haldar, D.; Danodia, A.; Chauhan, P. Use of Time Series Sentinel-1 and Sentinel-2 Image for Rice Crop Inventory in Parts of Bangladesh. Appl. Geomat. 2023, 15, 407–420. [Google Scholar] [CrossRef]
  82. Faraji, I.; Dimarco, N.A.; Boulaassal, H.; Wahbi, M.; Maatouk, M.; Aalaoui, O.Y.; El Kharki, O. AI-Driven Flood Mapping and Precision Rice Monitoring in Morocco Using Sentinel Satellite Data. E3S Web Conf. 2025, 676, 01008. [Google Scholar] [CrossRef]
  83. Gella, G.W.; Bijker, W.; Belgiu, M. Mapping Crop Types in Complex Farming Areas Using SAR Imagery with Dynamic Time Warping. ISPRS J. Photogramm. Remote Sens. 2021, 175, 171–183. [Google Scholar] [CrossRef]
  84. Laporte, N.; Goetz, S.J.; Baccini, A.; Walker, W.S.; Ndunda, P.; Mekui, P.; Kellndorfer, J.M.; Knight, D. Building Capacity for National Level Carbon Measurement, Reporting, and Verification (MRV) Systems for a “Reduction of Emissions from Deforestation and Degradation” (REDD)s. In AGU Fall Meeting Abstracts; American Geophysical Union: Washington, DC, USA, 2010. [Google Scholar]
  85. Köhl, M.; Neupane, P.R.; Mundhenk, P. REDD+ Measurement, Reporting and Verification—A Cost Trap? Implications for Financing REDD+MRV Costs by Result-Based Payments. Ecol. Econ. 2020, 168, 106513. [Google Scholar] [CrossRef]
  86. Yang, H.; Song, M.; Son, H.; Kim, R.; Choi, E. Evaluating REDD+ Readiness: High-Potential Countries Based on MRV Capacity. Forests 2025, 16, 67. [Google Scholar] [CrossRef]
  87. IPCC. IPCC, 2014: Climate Change 2014: Mitigation of Climate Change. In Proceedings of the Contribution of Working Group III to the Fifth Assessment Report of the Intergovernmental Panel on Climate Change, Munich, Germany, 13 November 2014. [Google Scholar]
  88. Peter, C.; Fiore, A.; Nendel, C.; Xiloyannis, C. Improving the Accounting of Land-Based Emissions in Carbon Footprint of Agricultural Products: Comparison between IPCC Tier 1, Tier 2 and Tier 3 Approaches. In Proceedings of the 9th International Conference on Life Cycle Assessment in the Agri-Food Sector (LCA Food 2014), San Francisco, CA, USA, 8–10 October 2014. [Google Scholar]
  89. Ouatahar, L.; Amon, B.; Bannink, A.; Amon, T.; Zentek, J.; Deng, J.; Janke, D.; Hempel, S.; Beukes, P.; van der Weerden, T.; et al. An Integral Assessment of Carbon and Nitrogen Emissions in Dairy Cattle Production Systems: Comparing Dynamic Process-Based Greenhouse Gas Emissions Factors with IPCC Tier 1 and Tier 2 Approaches in Confinement and Pasture-Based Systems. J. Clean. Prod. 2025, 486, 144479. [Google Scholar] [CrossRef]
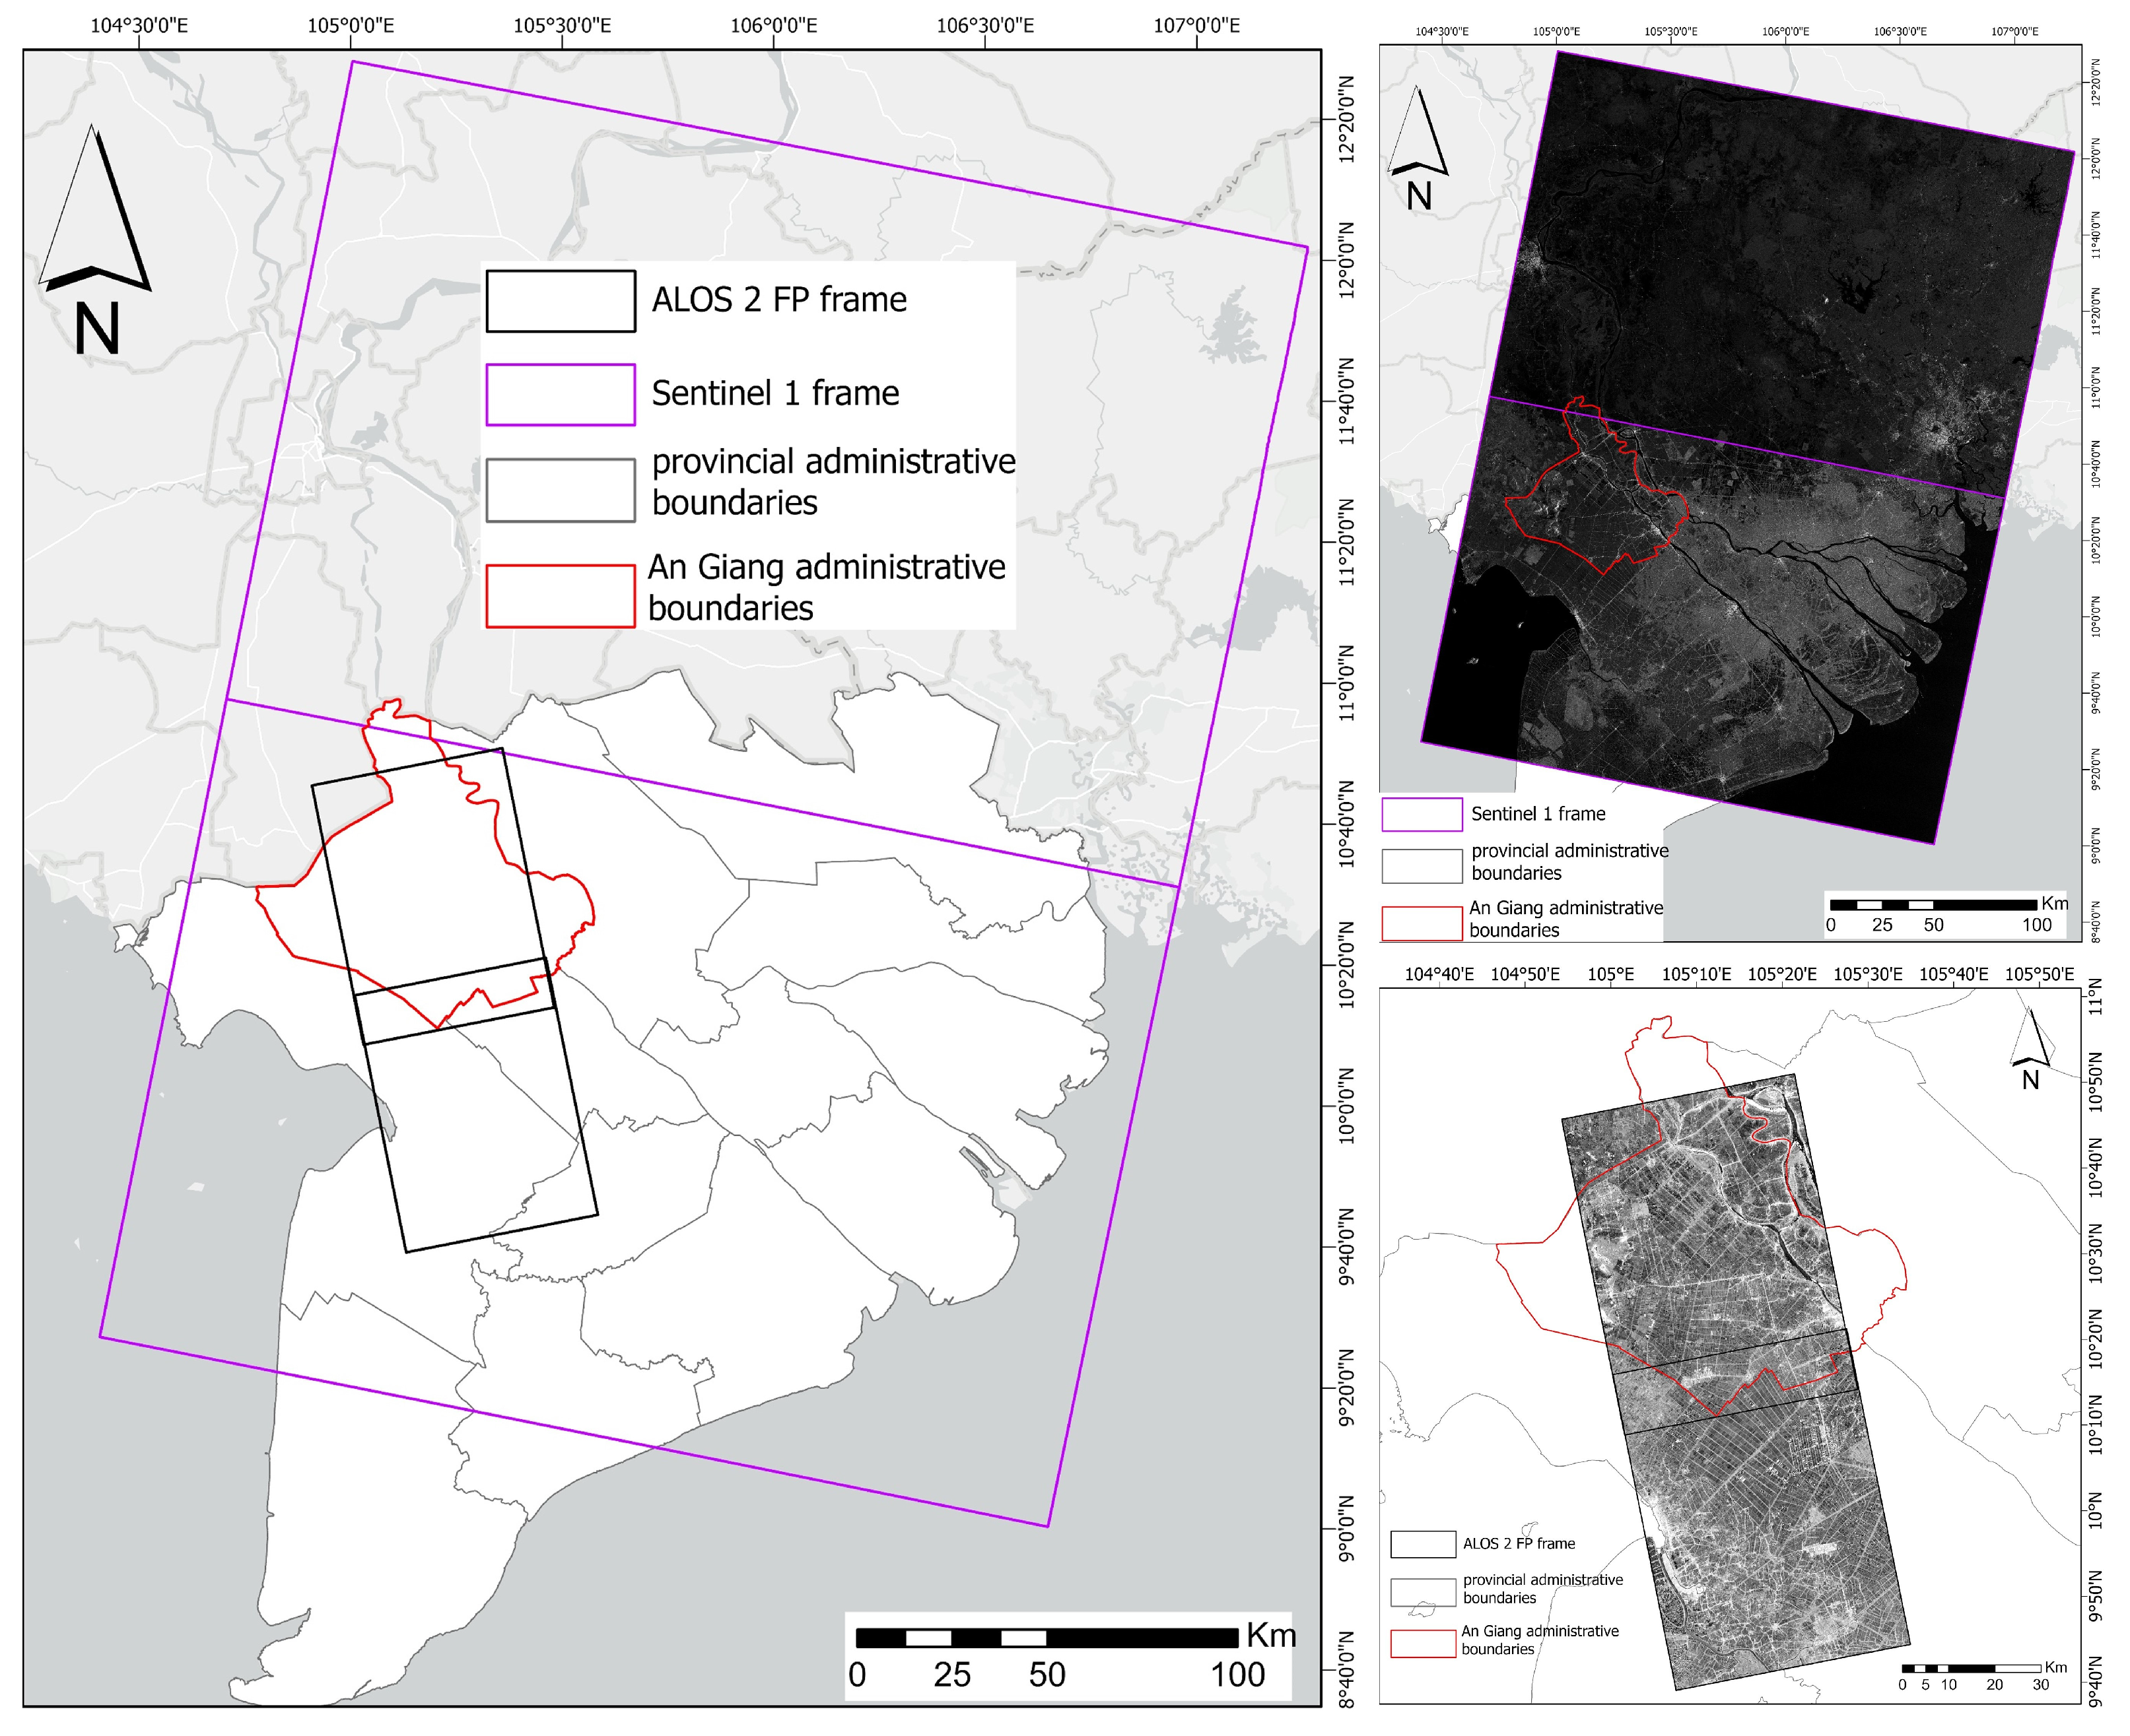
Figure 1. Location of the study area in An Giang province, image scene, and quick look of ALOS-2 FP (bottom right) and Sentinel-1 (top right).
Remotesensing 18 02190 g001
Figure 2. Study design flowchart for extracting inundation information from ALOS-2 PALSAR-2 and Sentinel-1 images.
Remotesensing 18 02190 g002
Figure 3. Distribution of rice fields for data collection in the An Giang province (yellow area).
Remotesensing 18 02190 g003
Figure 4. Field images of rice paddies at different growth stages, from seedling to harvest, showing panoramic and close-up views of soil surface conditions: (a) seeding, (b) tillering start, (c) tillering max, (d) booting, (e) flowering, (f) milky-hard stage, (g) maturing, (h) harvested.
Remotesensing 18 02190 g004
Figure 5. The chart illustrates the temporal variation in backscatter values for polarizations HH, HV, VH, and VV (values at the same time are shown in the red squares) during the 2025 Winter–Spring season, along with corresponding field photographs showing inundated or non-inundated conditions at each observation time for the sample rice field coded CT01, which was row-seeded on 2 December 2024.
Remotesensing 18 02190 g005
Figure 6. The chart illustrates the temporal variation in backscatter values for polarizations HH, HV, VH, and VV (values at the same time are shown in the red squares) during the 2025 Winter–Spring season, along with corresponding field photographs showing inundated or non-inundated conditions at each observation time for the sample rice field coded CT10, which was direct seeding on 26 November 2024.
Remotesensing 18 02190 g006
Figure 7. The charts illustrate the mean values and standard deviations of backscatter for polarizations HH (a), HV (b), VH (c), and VV (d) in inundated and non-inundated sample rice fields during the growth stages of 1–30, 31–60, 61–90, and 91–120 dap.
Remotesensing 18 02190 g007
Figure 8. Classification map of inundated and non-inundated rice field status across growth stages (rice age—days after planting—dap) on 17 January 2025, using ALOS-2 PALSAR-2 and Sentinel-1 imagery in An Giang province.
Remotesensing 18 02190 g008
Figure 9. Inundated and non-inundated maps of rice fields on 17 January 2025 using ALOS-2 PALSAR-2 and Sentinel-1 imagery in An Giang province.
Remotesensing 18 02190 g009
Figure 10. Maps of inundated and non-inundated rice field status and rice age during the 2025 Winter–Spring season in An Giang province, presented for 20 December 2024 (a1,a2), 3 January 2025 (b1,b2), 17 January 2025 (c1,c2), 31 January 2025 (d1,d2), 14 February 2025 (e1,e2), and 28 February 2025 (f1,f2).
Remotesensing 18 02190 g010
Figure 11. Classification map of inundated and non-inundated classification with corresponding field photographs on 17 January 2025 in An Giang province.
Remotesensing 18 02190 g011
Figure 12. Enlarged views of inundated and non-inundated classification maps and field photographs on 3 January 2025, 31 January 2025, and 28 February 2025 in An Giang province.
Remotesensing 18 02190 g012
Table 1. List of ALOS-2 image observation dates used and field data collection dates in An Giang province.
Image Observation DatePolarizationOrbit DirectionLook DirectionPixel Size (m)Product LevelField Data Collection Date
20 December 2024HH, HV, VH, VVAscendingRight61.120 December 2024
3 January 2025HH, HV, VH, VVAscendingRight61.13 January 2025
17 January 2025HH, HV, VH, VVAscendingRight61.117 January 2025
31 January 2025HH, HV, VH, VVAscendingRight61.131 January 2025
14 February 2025HH, HV, VH, VVAscendingRight61.114 February 2025
28 February 2025HH, HV, VH, VVAscendingRight61.128 February 2025
Table 2. Confusion matrix of inundated and non-inundated classification results for rice fields across growth stages (rice age) in An Giang province during the Winter–Spring 2025 season using ALOS-2 PALSAR-2 and Sentinel-1 imagery.
Classified Data
Class(1)(2)(3)(4)(5)(6)(7)(8)TotalUser Accuracy (%)
Reference data1–30 dapInundated (1)267 3379
Non-inundated (2)214 1688
31–60 dapInundated (3) 264 3087
Non-inundated (4) 513 1872
61–90 dapInundated (5) 112 1385
Non-inundated (6) 623 2979
91–120 dapInundated (7) 71888
Non-inundated (8) 5131872
Total2821311717251214165
Producer Accuracy (%)9367847665925893
Disclaimer/Publisher’s Note: The statements, opinions and data contained in all publications are solely those of the individual author(s) and contributor(s) and not of MDPI and/or the editor(s). MDPI and/or the editor(s) disclaim responsibility for any injury to people or property resulting from any ideas, methods, instructions or products referred to in the content.