Article

Multi-Level Classification of Urban Green Space Using Multi-Source Remote Sensing and Geospatial Data


1
College of Oceanography and Space Informatics, China University of Petroleum (East China), Qingdao 266580, China
2
Key Laboratory of Natural Resources Monitoring in Tropical and Subtropical Area of South China, Ministry of Natural Resources, Guangzhou 510063, China
*
Author to whom correspondence should be addressed.
Remote Sens. 2026, 18(13), 2192; https://doi.org/10.3390/rs18132192
Submission received: 21 April 2026 / Revised: 25 June 2026 / Accepted: 1 July 2026 / Published: 4 July 2026

Highlights

What are the main findings?
  • A multi-level urban green space (UGS) classification framework integrates multi-source remote sensing data derived from physical greenness with functional geospatial big data, enabling alignment between the physical distribution of green spaces and their urban functional zoning.
  • The proposed method improves both the functional and physical mapping accuracy of UGSs in the two tested cities, especially with stronger performance for fragmented/low-vegetation areas.
What are the implications of the main findings?
  • The framework bridges “what green space looks like” and “what it is for”, enabling more decision-relevant UGS inventories that support differentiated ecological governance and planning-oriented analysis.
  • The results and technical pipeline may be adapted after local recalibration for various urban management applications, such as vegetation monitoring, green infrastructure planning, ecological assessment, and sustainable urban development.

Abstract

Urban Green Spaces (UGSs) monitoring usually focuses on the extraction of vegetation in the physical layer, while neglecting their functional attributes. This renders the monitoring results unable to objectively reflect the rationality of UGS planning. To address these issues, this study proposes a multi-level classification method integrating multi-source remote sensing and geospatial big data to bridge the semantic gap between the physical layer and the functional layer. In this method, a strategy of prior knowledge injection and semantic reconstruction was developed through the fine-tuning of a BERT model with cross-mapping rules. This strategy aims to classify the urban area into 24 functional categories, generating the social-functional basemap in a functional layer, based on Point of Interest (POI), OpenStreetMap (OSM), and Global Urban Boundary (GUB). Meanwhile, a novel deep learning architecture, namely the Multi-Shape and Spectral Aware Network (MSSANet), was designed for precise vegetation classification of UGSs in the physical layer. Finally, a “function-first, vegetation-second” coupling paradigm containing three functional attribute layers, referring to the Code for Classification of UGS in China (CJJ/T 85-2017), was established. This paradigm integrates the social-functional basemap with physical vegetation patches to build a multi-level UGS classification framework, i.e., the 5 major UGS categories, 11 intermediate UGS categories, and 24 fine-grained UGS sub-categories. Experiments conducted in Jinan and Qingdao, China, demonstrate the efficacy of the proposed method for refined multi-level UGS mapping.

1. Introduction

Urban Green Space (UGS), as a core component of the urban ecosystem [1,2], not only plays a key role in regulating the microclimate and mitigating the heat island effect [3,4] but also is an important carrier for residents’ daily leisure and physical and mental recovery [5]. Nowadays, China’s urbanization process has entered the next stage, and the focus of urban construction has shifted from quantitative growth to quality improvement [6]. In the context of park city construction and urban renewal actions [7], simply pursuing the growth of quantitative indicators such as green space rate and per capita park green space area can no longer meet the needs of high-quality living environment construction. City managers need to know not only how much green space there is, but also more detailed questions like where the green space is [8,9]. However, the existing green space monitoring system often lacks simultaneous consideration of the internal structure and social service attributes of green space, making it difficult for monitoring results to effectively support refined, human-oriented green space system planning and evaluation [10]. Therefore, constructing a classification system that can describe the physical form and functional attributes of green spaces has become an urgent need to improve urban ecological governance capabilities [11,12].
Traditional remote sensing provides a vital spatial foundation for mapping the physical land cover of urban environments [13,14,15]. However, characterizing Urban Green Space (UGS) solely through optical imagery faces two fundamental limitations. First, fine-grained vegetation extraction is technically constrained by spectral confusion, particularly between trees and grass [16]. Additionally, complex building shadows in high-density urban areas induce severe spatial fragmentation during large-scale mapping [17,18]. More importantly, remote sensing captures merely the physical cover of the earth’s surface, remaining inherently blind to the socioeconomic attributes and human activities occurring within these spaces [19,20]. This creates a critical semantic gap between physical monitoring and the actual management functions required by urban planning departments, causing traditional academic classification schemes to frequently deviate from statutory norms, such as China’s Standard for Classification of UGS (CJJ/T 85-2017) [21].
To bridge this semantic gap, parsing the social-functional basemap is an essential prerequisite [22,23]. Integrating geospatial big data, specifically Points of Interest (POI), is highly necessary because POIs encapsulate rich human activity semantics that cannot be captured by optical imagery [24,25]. However, raw POI data universally suffer from brief texts, irregular naming, and semantic ambiguity [12]. Traditional keyword matching or shallow learning methods struggle to extract deep semantic information from massive, unstructured commercial texts [26,27]. Consequently, the integration of a deep semantic model like BERT becomes imperative [28]. Therefore, integrating BERT-based semantic inference with high-resolution remote sensing offers a structured approach to capture both natural morphology and social utility.
To address these dual limitations in social functional parsing and physical entity extraction, this study develops a multi-level UGS classification framework integrating multi-source remote sensing imagery and geospatial big data. The core of our approach lies in a “function-first, vegetation-second” coupling paradigm. This sequence is adopted because discrete POI data points, despite their rich semantics, cannot directly assign unambiguous functional labels to continuous, irregularly shaped, and boundary-blurred vegetation patches. Consequently, it is technically imperative to first utilize road networks (obtained from OpenStreetMap, OSM), urban boundary (obtained from Global Urban Boundary, GUB), and BERT-based semantic reconstruction to build a continuous, full-coverage social-functional basemap. Subsequently, the high-precision vegetation patches extracted by our proposed Multi-Shape and Spectral Aware Network (MSSANet) are projected onto this basemap. This strategy ensures the precise coupling of physical patches with their respective social attributes, overcoming the bottleneck of misaligned structures and functions in complex urban environments. Strictly adhering to the National Standard for Classification of UGS (CJJ/T 85-2017), we achieved a transition from monolithic physical monitoring to multi-level green space mapping that captures both natural and social dimensions.
In summary, our main contributions are as follows:
(1)
A prior knowledge injection and semantic reconstruction strategy was proposed to adapt natural language processing models for the classification of urban functional zones. By fine-tuning a pre-trained BERT model and constructing rigorous cross-mapping rules based on POI, OSM, and GUB, the urban area is classified into 24 functional categories. This strategy effectively bridges the semantic gap between physical land cover and statutory planning functions.
(2)
A novel deep learning architecture, termed MSSANet, was developed for precise physical feature extraction in complex urban environments. By integrating morphological and spectral features, the model effectively distinguishes trees from low vegetation. A pixel-level weighted voting mechanism was further introduced to fuse multi-source land-cover products and automatically generate high-confidence prior labels for training.
(3)
A systematic framework for hierarchical UGS mapping was constructed by establishing a “function-first, vegetation-second” multi-level coupling paradigm based on the National Standard of China (CJJ/T 85-2017). Through the integration of a 24-category social-functional basemap and physical vegetation basemaps, the framework enables three-level classification of UGS in complex urban environments.

2. Study Area and Data

2.1. Study Area

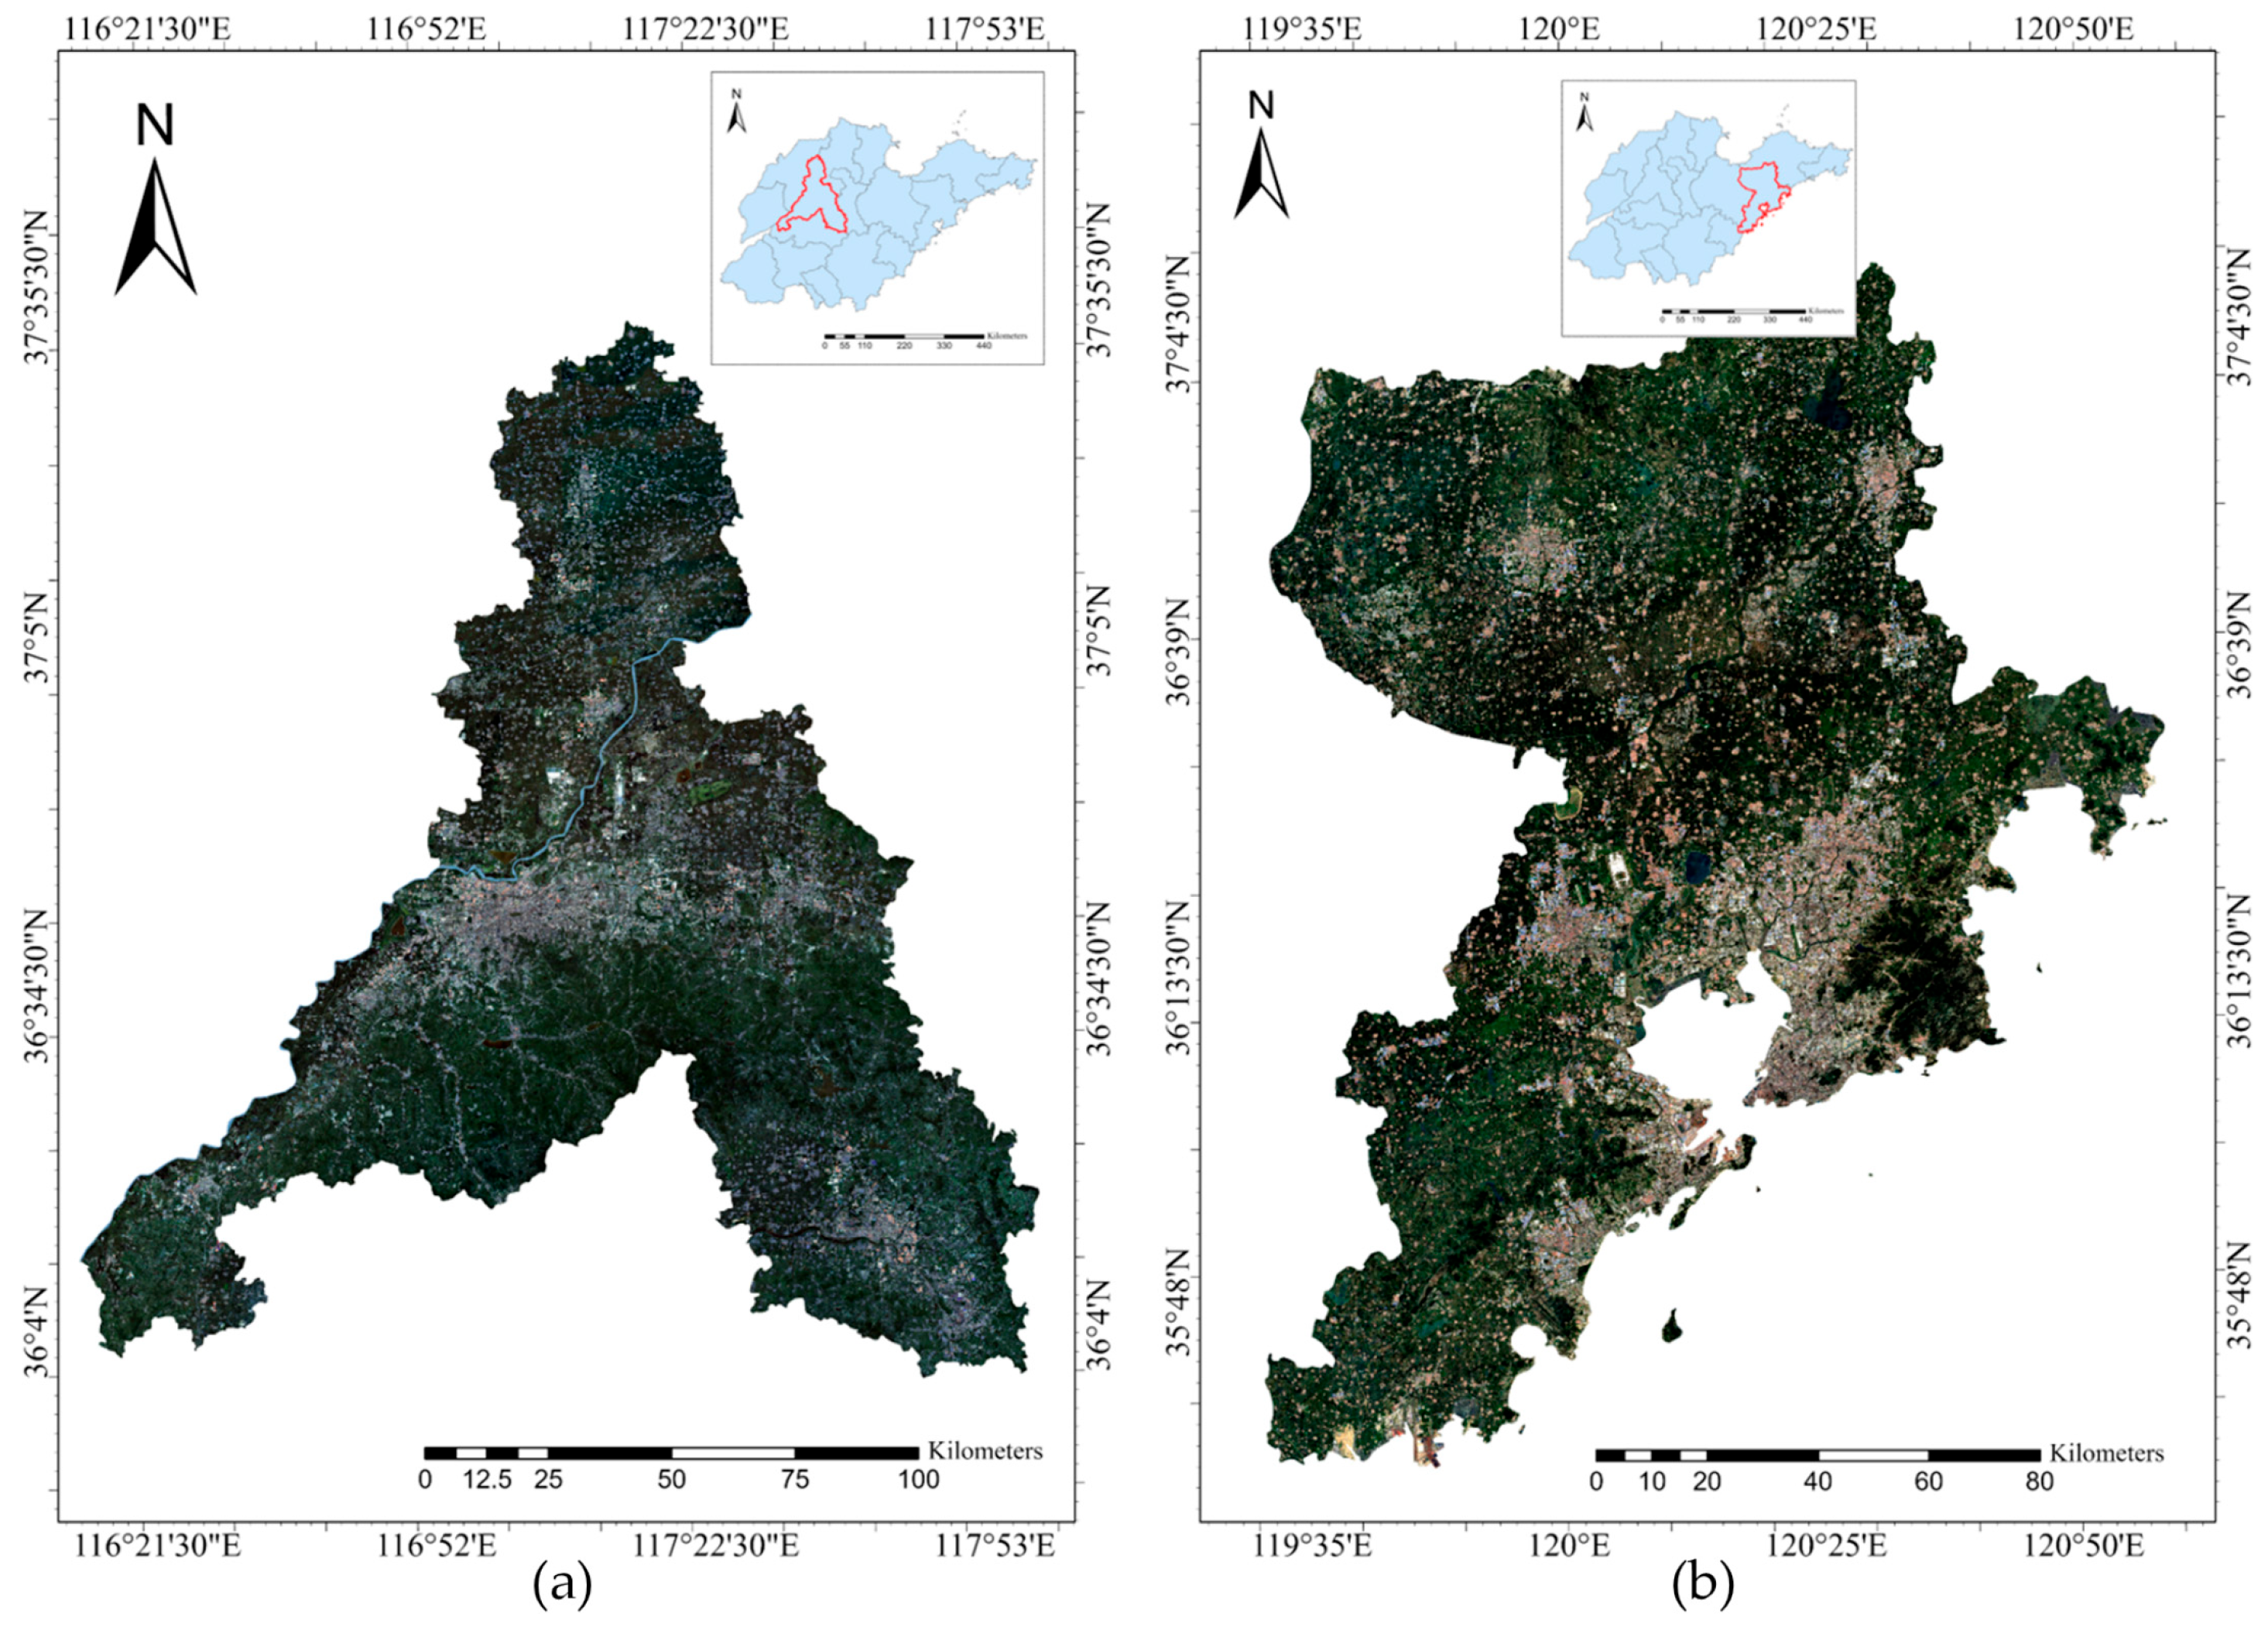
This study selects Jinan and Qingdao, Shandong, China, as representative study areas to leverage their pronounced disparities in geospatial distribution, urban morphology, and UGS configurations. As illustrated in Figure 1, Jinan is a typical inland valley city characterized by concentric expansion, high building density, severe shadow interference, and abundant historical parks [29]. Conversely, Qingdao is a coastal hilly city featuring a polycentric structure and topography-driven mountain-to-sea green belts [30]. Despite both being designated as “National Garden Cities”, their distinct natural endowments generate significant heterogeneities in built-up density, vegetation coverage, and spatial layout. This dual-city comparative design effectively captures the representative UGS patterns of North China’s inland and coastal cities, providing a feasible platform to systematically evaluate the model’s adaptability and generalization across heterogeneous environments.

2.2. Data

2.2.1. POI Data

This study extracted approximately 200,000 nationwide POI records via the Amap (https://www.amap.com/ (accessed on 1 March 2025)) application programming interface in 2023 to train the BERT model for functional zone classification. This national dataset constituted the primary training set. We subsequently applied the localized POI dataset to the final spatial prediction and classification tasks. The Qingdao dataset provided 67,700 records. The Jinan dataset provided 78,130 records.

2.2.2. OSM Road Network Data

The OSM road network data for the year 2023 was acquired from the official OpenStreetMap website (https://www.openstreetmap.net.cn/ (accessed on 15 July 2025)). OSM is an open-access geographic platform that supports collaborative data editing and updates. While the raw datasets encompass 27 distinct road categories, this study applied a hierarchical filtering process to ensure high data quality and focus on the primary urban morphological skeleton. Specifically, we retained expressways, arterial roads, primary roads, and secondary roads, while excluding other auxiliary or minor road types.

2.2.3. GUB Data

The GUB data offers high-resolution geographic products that enable the delineation of the physical extents of global urban areas across multiple decades [31]. Specifically, the GUB dataset provides multi-temporal urban boundary layers at a 30-m spatial resolution. Given that GUB is only used to delimit the boundaries of the study area and does not exert a critical influence on the attribute characteristics of POIs, this study adopts the latest 2018 GUB data to extract urban built-up areas and excludes non-urban administrative regions.

2.2.4. Multi-Source Land-Cover Products

This study employs four multi-source land-cover products to extract UGS across the selected research regions. These products include ESA WorldCover (2020) [32], Dynamic World (2022) [33], Esri Land Cover (2021) [34], and GLC_FCS10 (2025) [35]. This multi-source integration provides the necessary classification information for the final UGS identification.

3. Method

3.1. Overall Methodological Framework

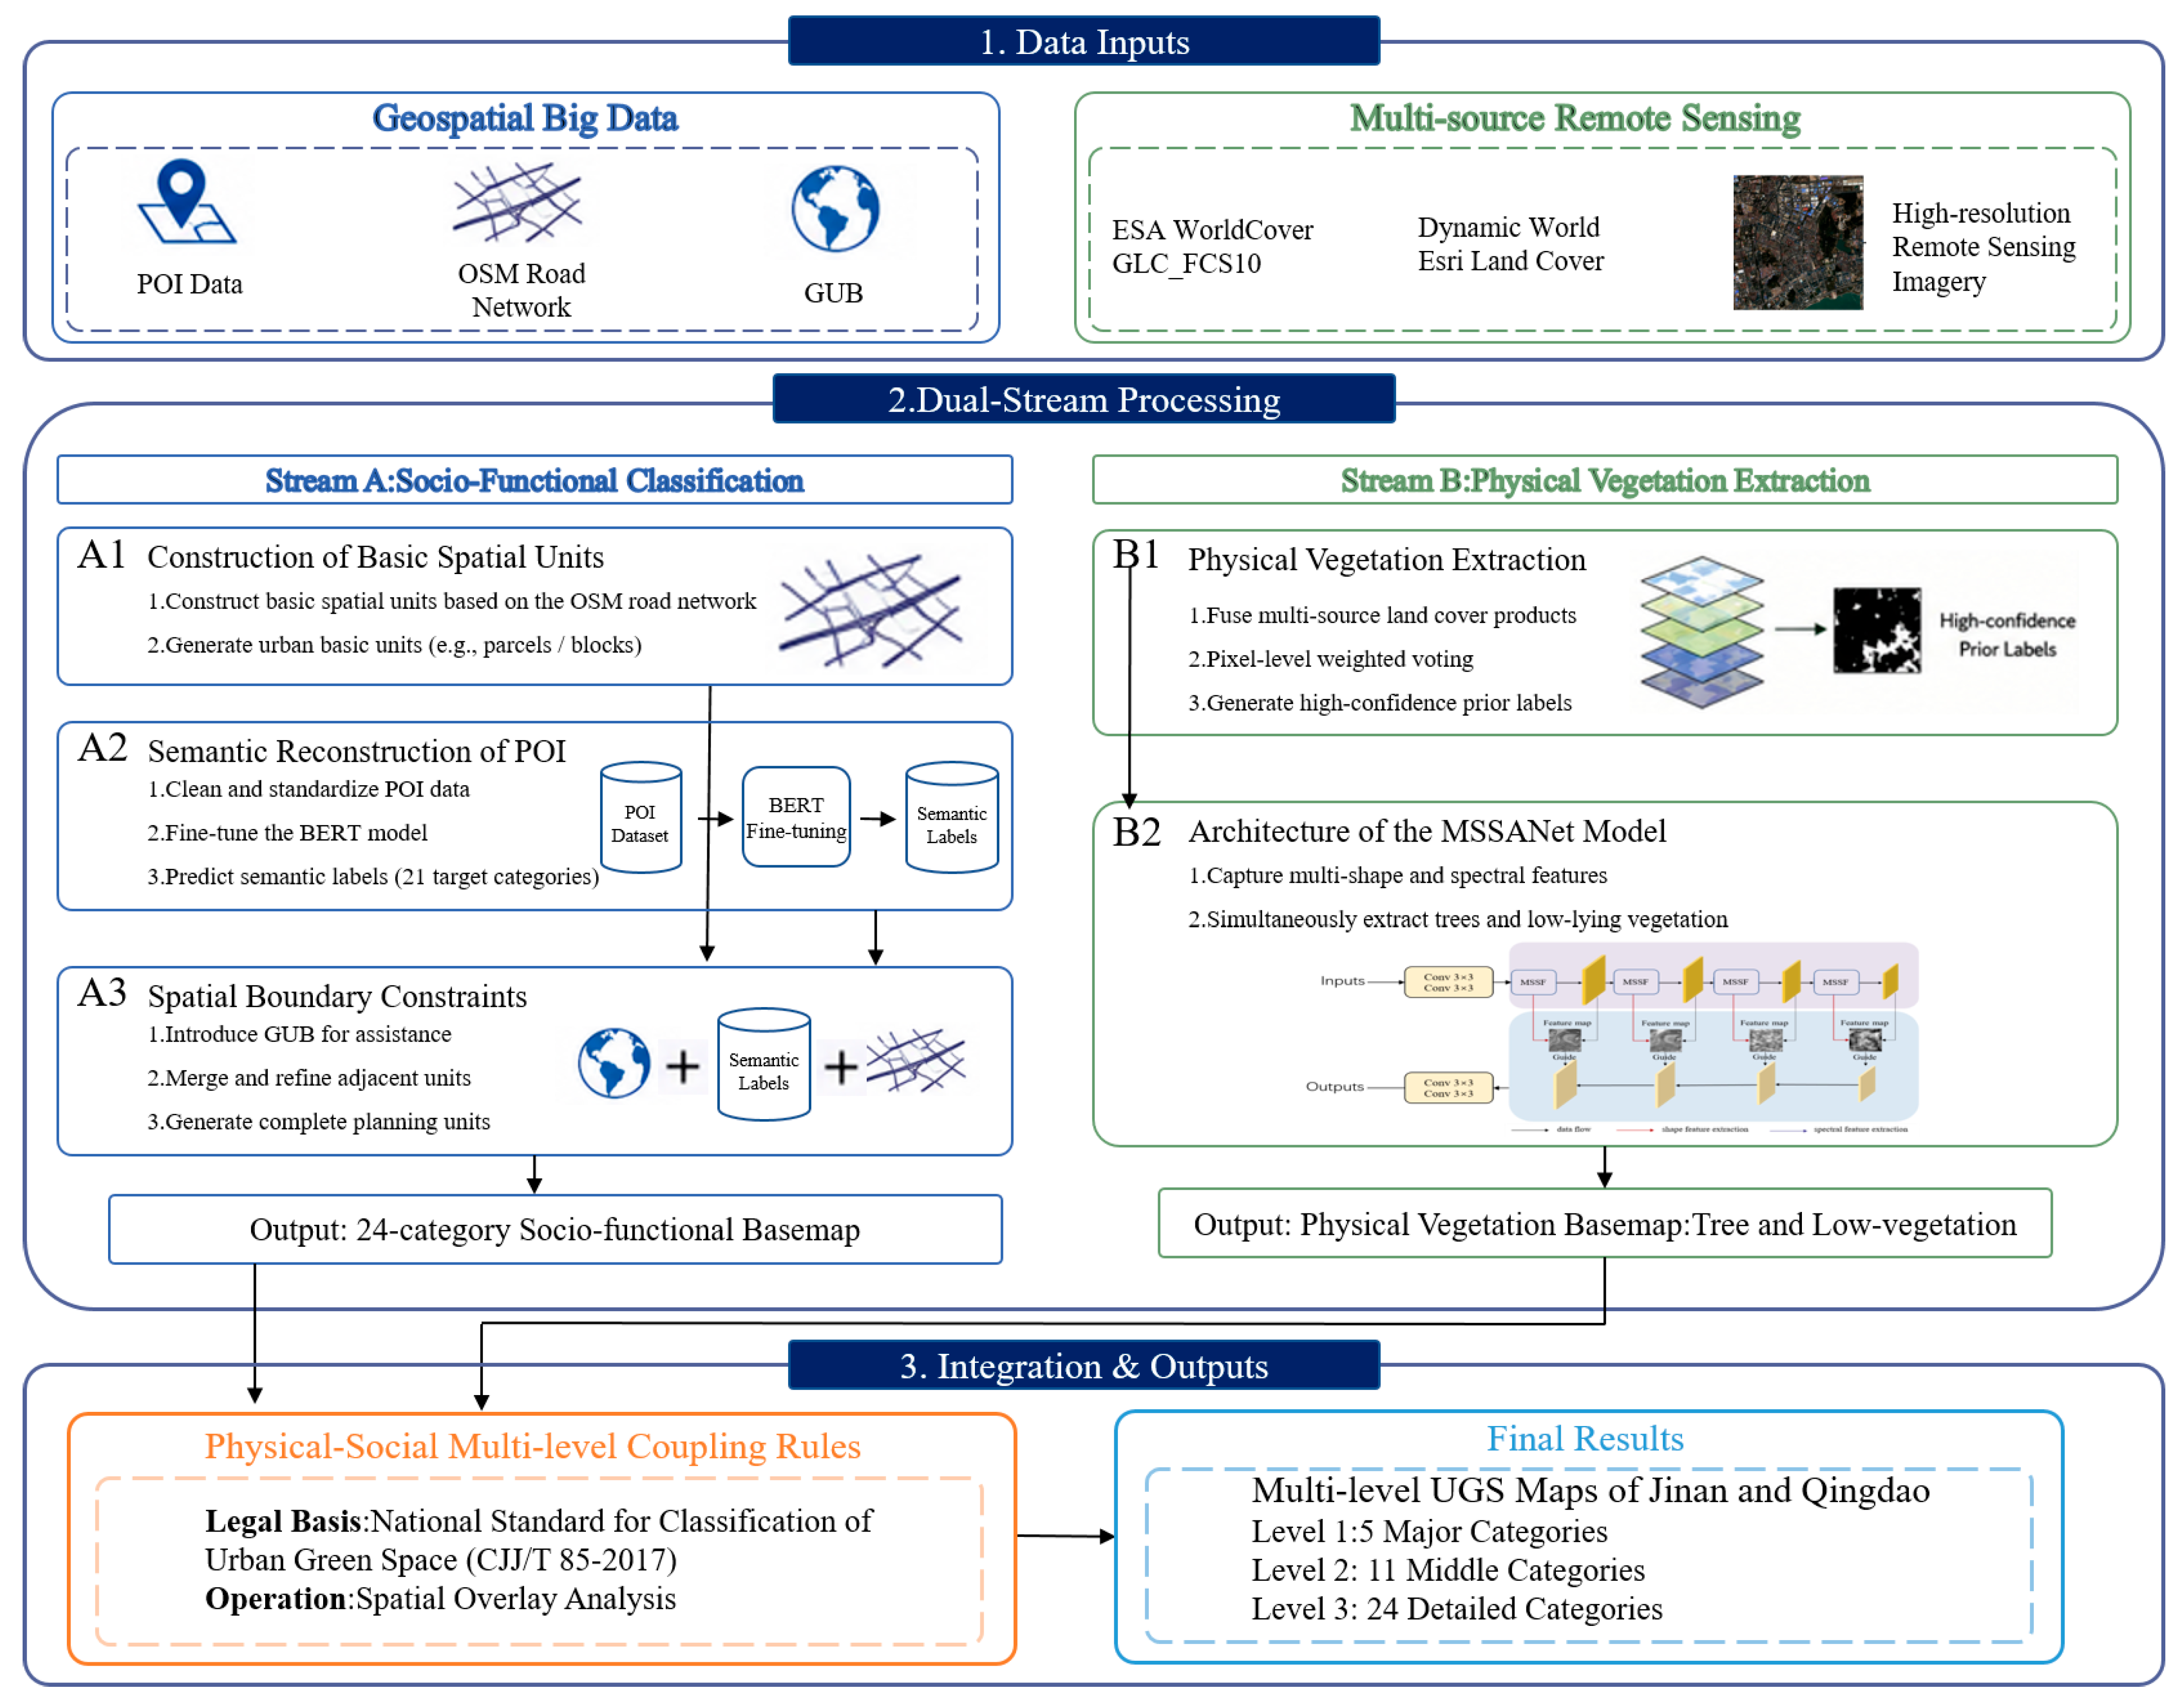
To bridge the semantic gap between physical land cover and statutory planning functions, this study proposes a dual-stream methodological framework as shown in Figure 2. The workflow consists of three main modules:
First, Data Inputs integrate geospatial big data (POI, OSM, GUB) with multi-source remote sensing imagery. Second, the Dual-Stream Processing phase executes two parallel tasks. Stream A constructs a 24-category social-functional basemap by fine-tuning a BERT model for POI semantic reconstruction. Specifically, the 24 functional categories are Comprehensive Park, Community Park, Zoo, Botanical Garden, Heritage Park, Other Parks, Pocket Park, Protective Green Space, Square Green Space, Residential, Public Service, Commercial, Industrial, Logistics and Warehouse, Transportation Facility, Public Utility, Scenic Area, Forest Park, Wetland Park, Country Park, Ecological Protection Green Space, Regional Protective Green Space, Production Green Space, and Road Green Space (RoadGS). Concurrently, Stream B extracts a high-precision physical vegetation basemap (trees and low vegetation) using a customized MSSANet guided by pixel-level multi-source voting. Finally, the Integration and Outputs module synergizes these parallel streams. Through spatial overlay analysis anchored in the National Standard (CJJ/T 85-2017), physical vegetation patches are seamlessly coupled with their functional attributes. This generates the multi-level UGS maps for Jinan and Qingdao, with specific details elaborated in the following subsections.

3.2. Fine-Grained Identification of Urban Social Functional Zones

To decipher the complex socio-spatial heterogeneity of urban environments, this study proposes an integrated identification framework leveraging multi-source geospatial big data, including OSM, POI, and GUB.

3.2.1. Construction of Basic Spatial Units

To delineate the fundamental spatial units for Jinan and Qingdao, OSM road networks were employed as the morphological skeleton. Following re-projection (WGS 1984 Web Mercator), the network was hierarchically filtered to retain only major urban arteries, including expressways, arterial roads, primary roads, and secondary roads. Crucially, to preserve original geometric widths for subsequent transportation land extraction, traditional center-line collapsing was bypassed; instead, only fundamental topological errors (e.g., dangles) were repaired. This refined skeleton was then buffered to partition the study areas into seamlessly contiguous, road-bounded parcels for functional zoning. The specific buffer formulation strategy is as follows: a single-side 40 m buffer is generated for expressways and arterial roads, and a single-side 20 m buffer is applied for primary roads and secondary roads. Subsequently, the generated road buffer layers are merged and uniformly identified as road land to construct a hierarchical urban road network.

3.2.2. Semantic Reconstruction and Basic Classification of POI

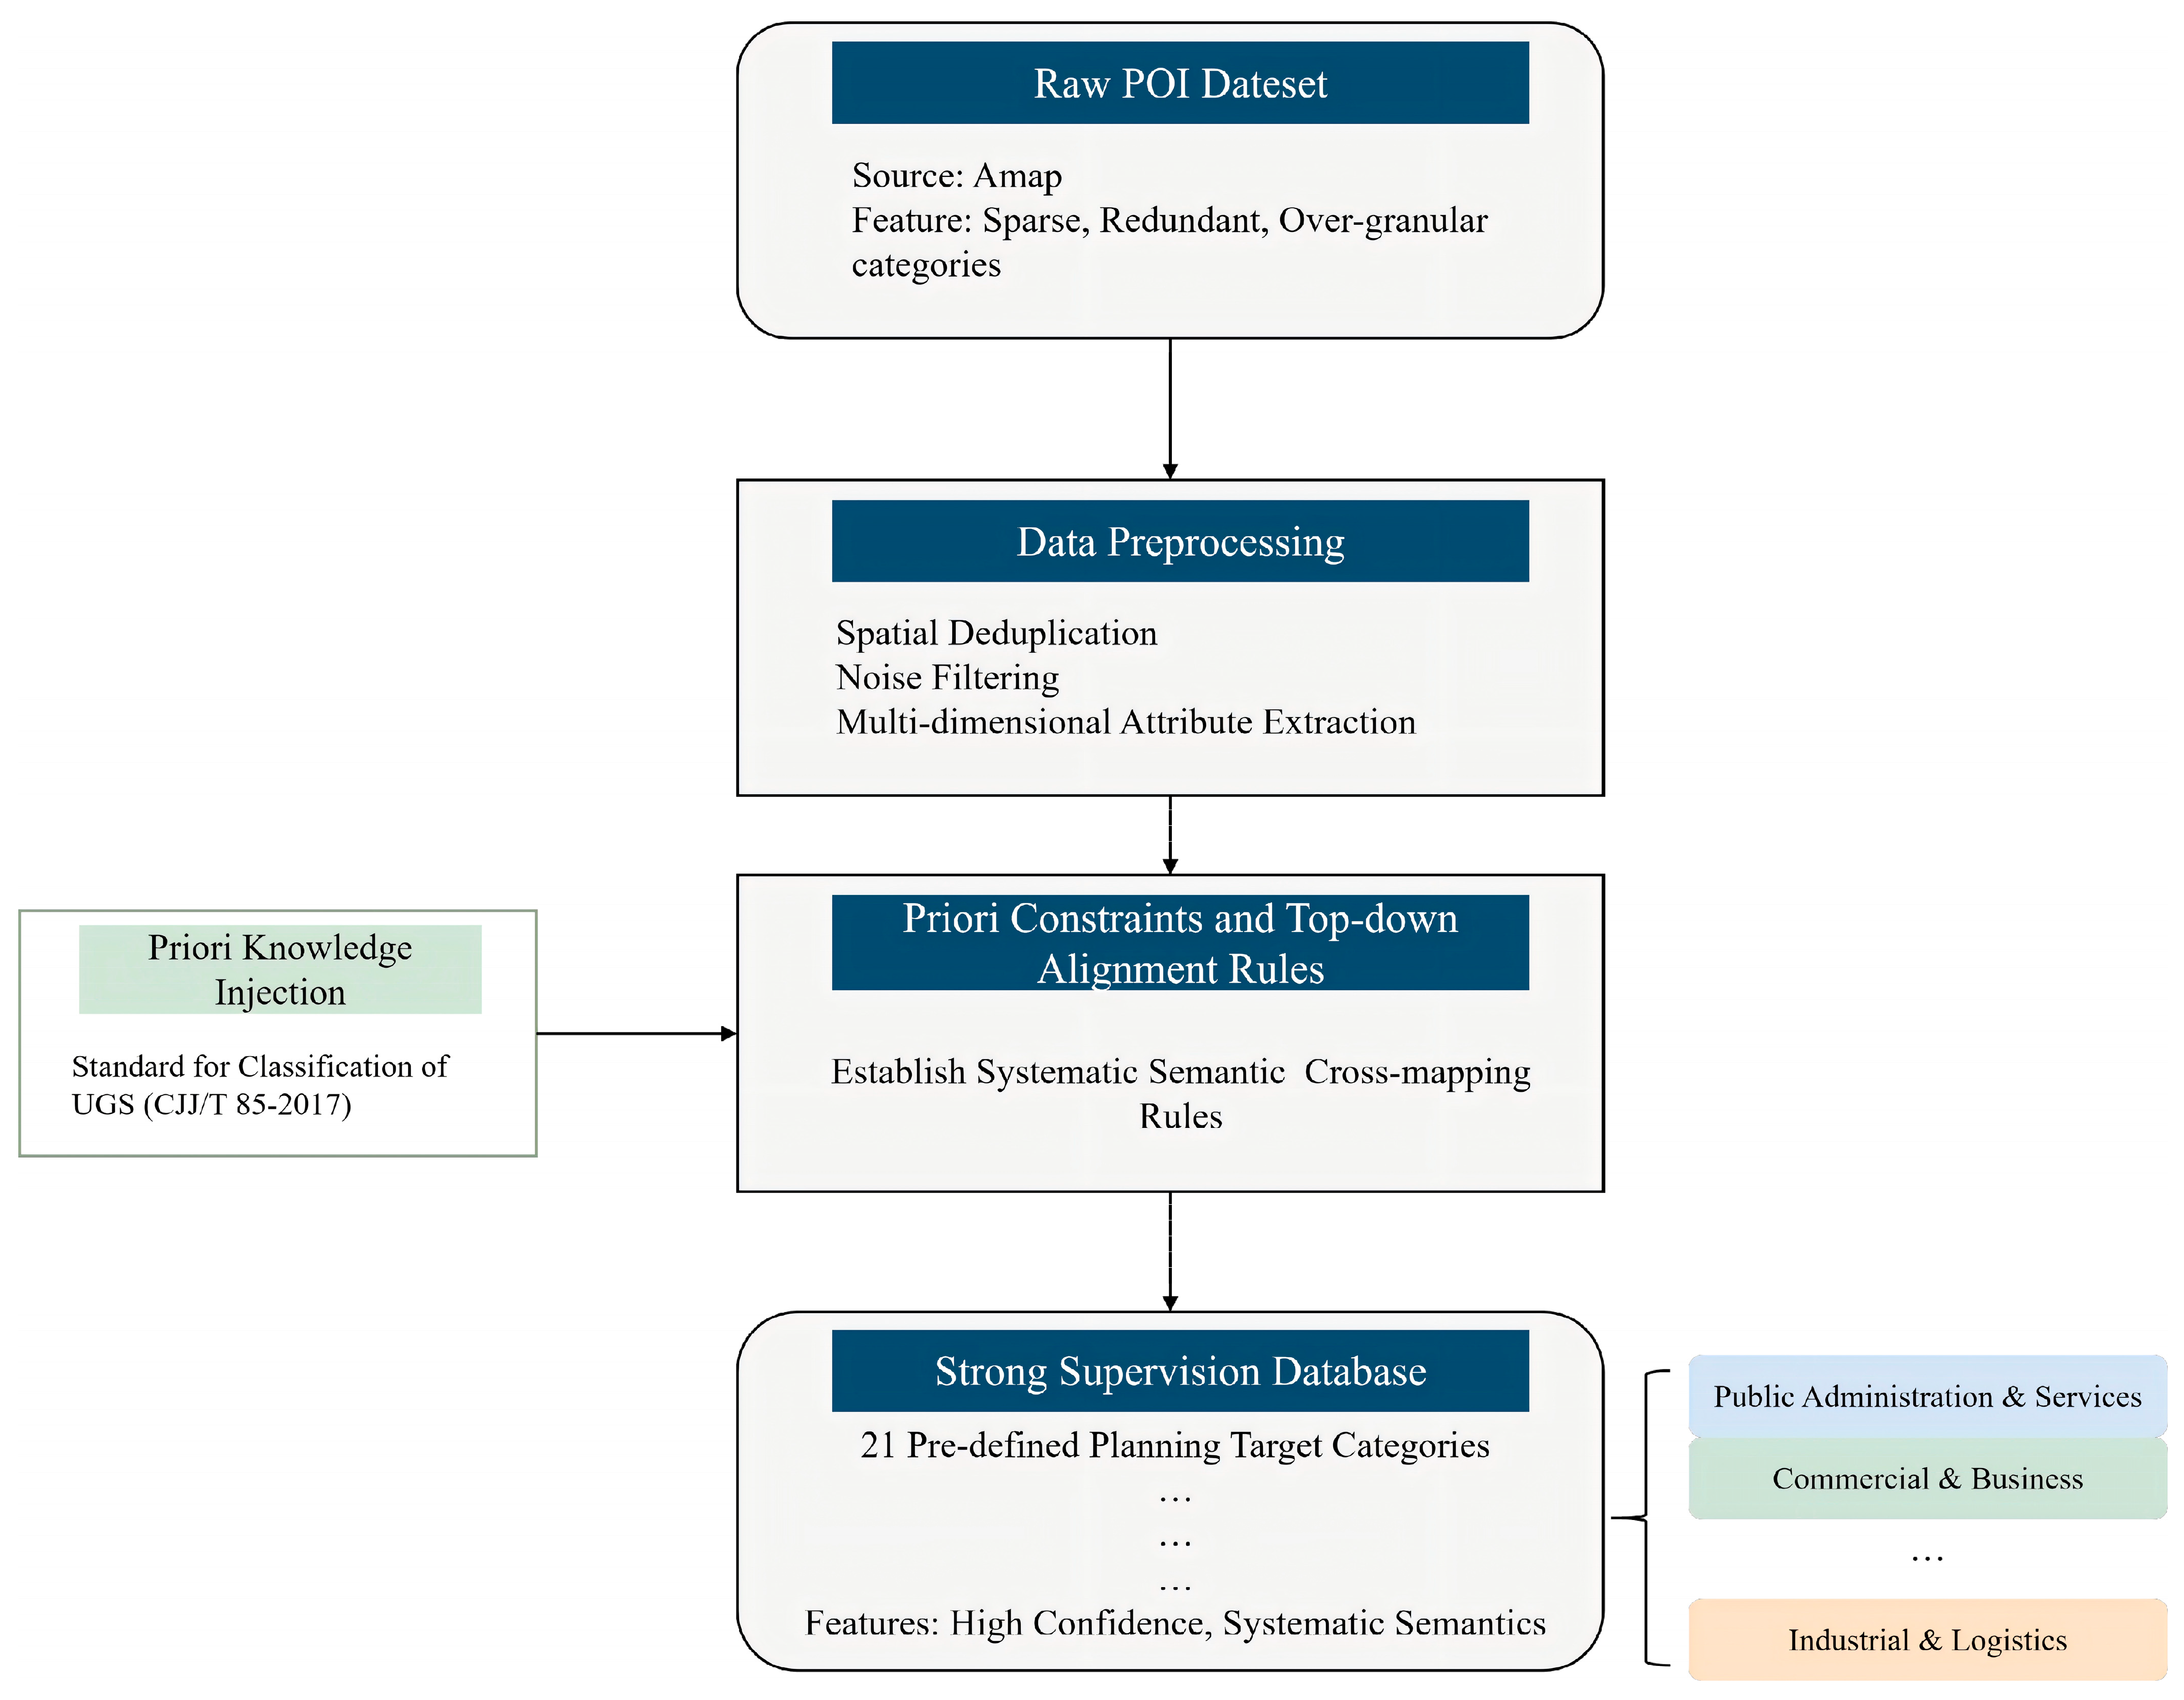
The foundational POI data for this study were acquired from Amap. As a prominent commercial Location-Based Services (LBS) platform, its native classification system that is primarily tailored for public navigation and consumer behavior. This orientation introduces a significant ontological divergence and semantic mismatch when juxtaposed with macro-spatial governance frameworks and official planning typologies, such as the Standard for Classification of UGS (CJJ/T 85-2017). In complex urban environments, directly utilizing raw LBS labels for spatial clustering inevitably precipitates semantic confusion and attribute distortion of underlying functional zones, particularly concerning fine-grained green space categories. To bridge this gap, we propose a synergistic framework named “Prior Knowledge Injection and Semantic Reconstruction”, as shown in Figure 3.
Initially, following the spatial deduplication and noise filtration of massive raw POI datasets, cross-system semantic alignment rules were constructed based on national spatial planning standards. By extracting multi-dimensional attributes (e.g., native industry categories and entity names) from the raw data, rigorous top-down cross-mapping rules were established. To elucidate this semantic alignment process, representative examples of these cross-mapping rules are presented in Table 1. This procedure systematically downscaled loosely structured, overly granular commercial labels, converging them into 21 pre-defined planning target categories (semantic categories) as shown in Figure 3, excluding Regional Protective Green Space, Production Green Space, and Road Green Space (RoadGS). The three categories were excluded because there was almost no corresponding POI data available. They are extracted using a spatial buffering and rule-based method as introduced in Section 3.2.3. These expert-driven rule constraints effectively filtered out redundancy and structural ambiguity inherent in the original system, thereby yielding a localized, strongly supervised corpus with high label confidence and broad representativeness.
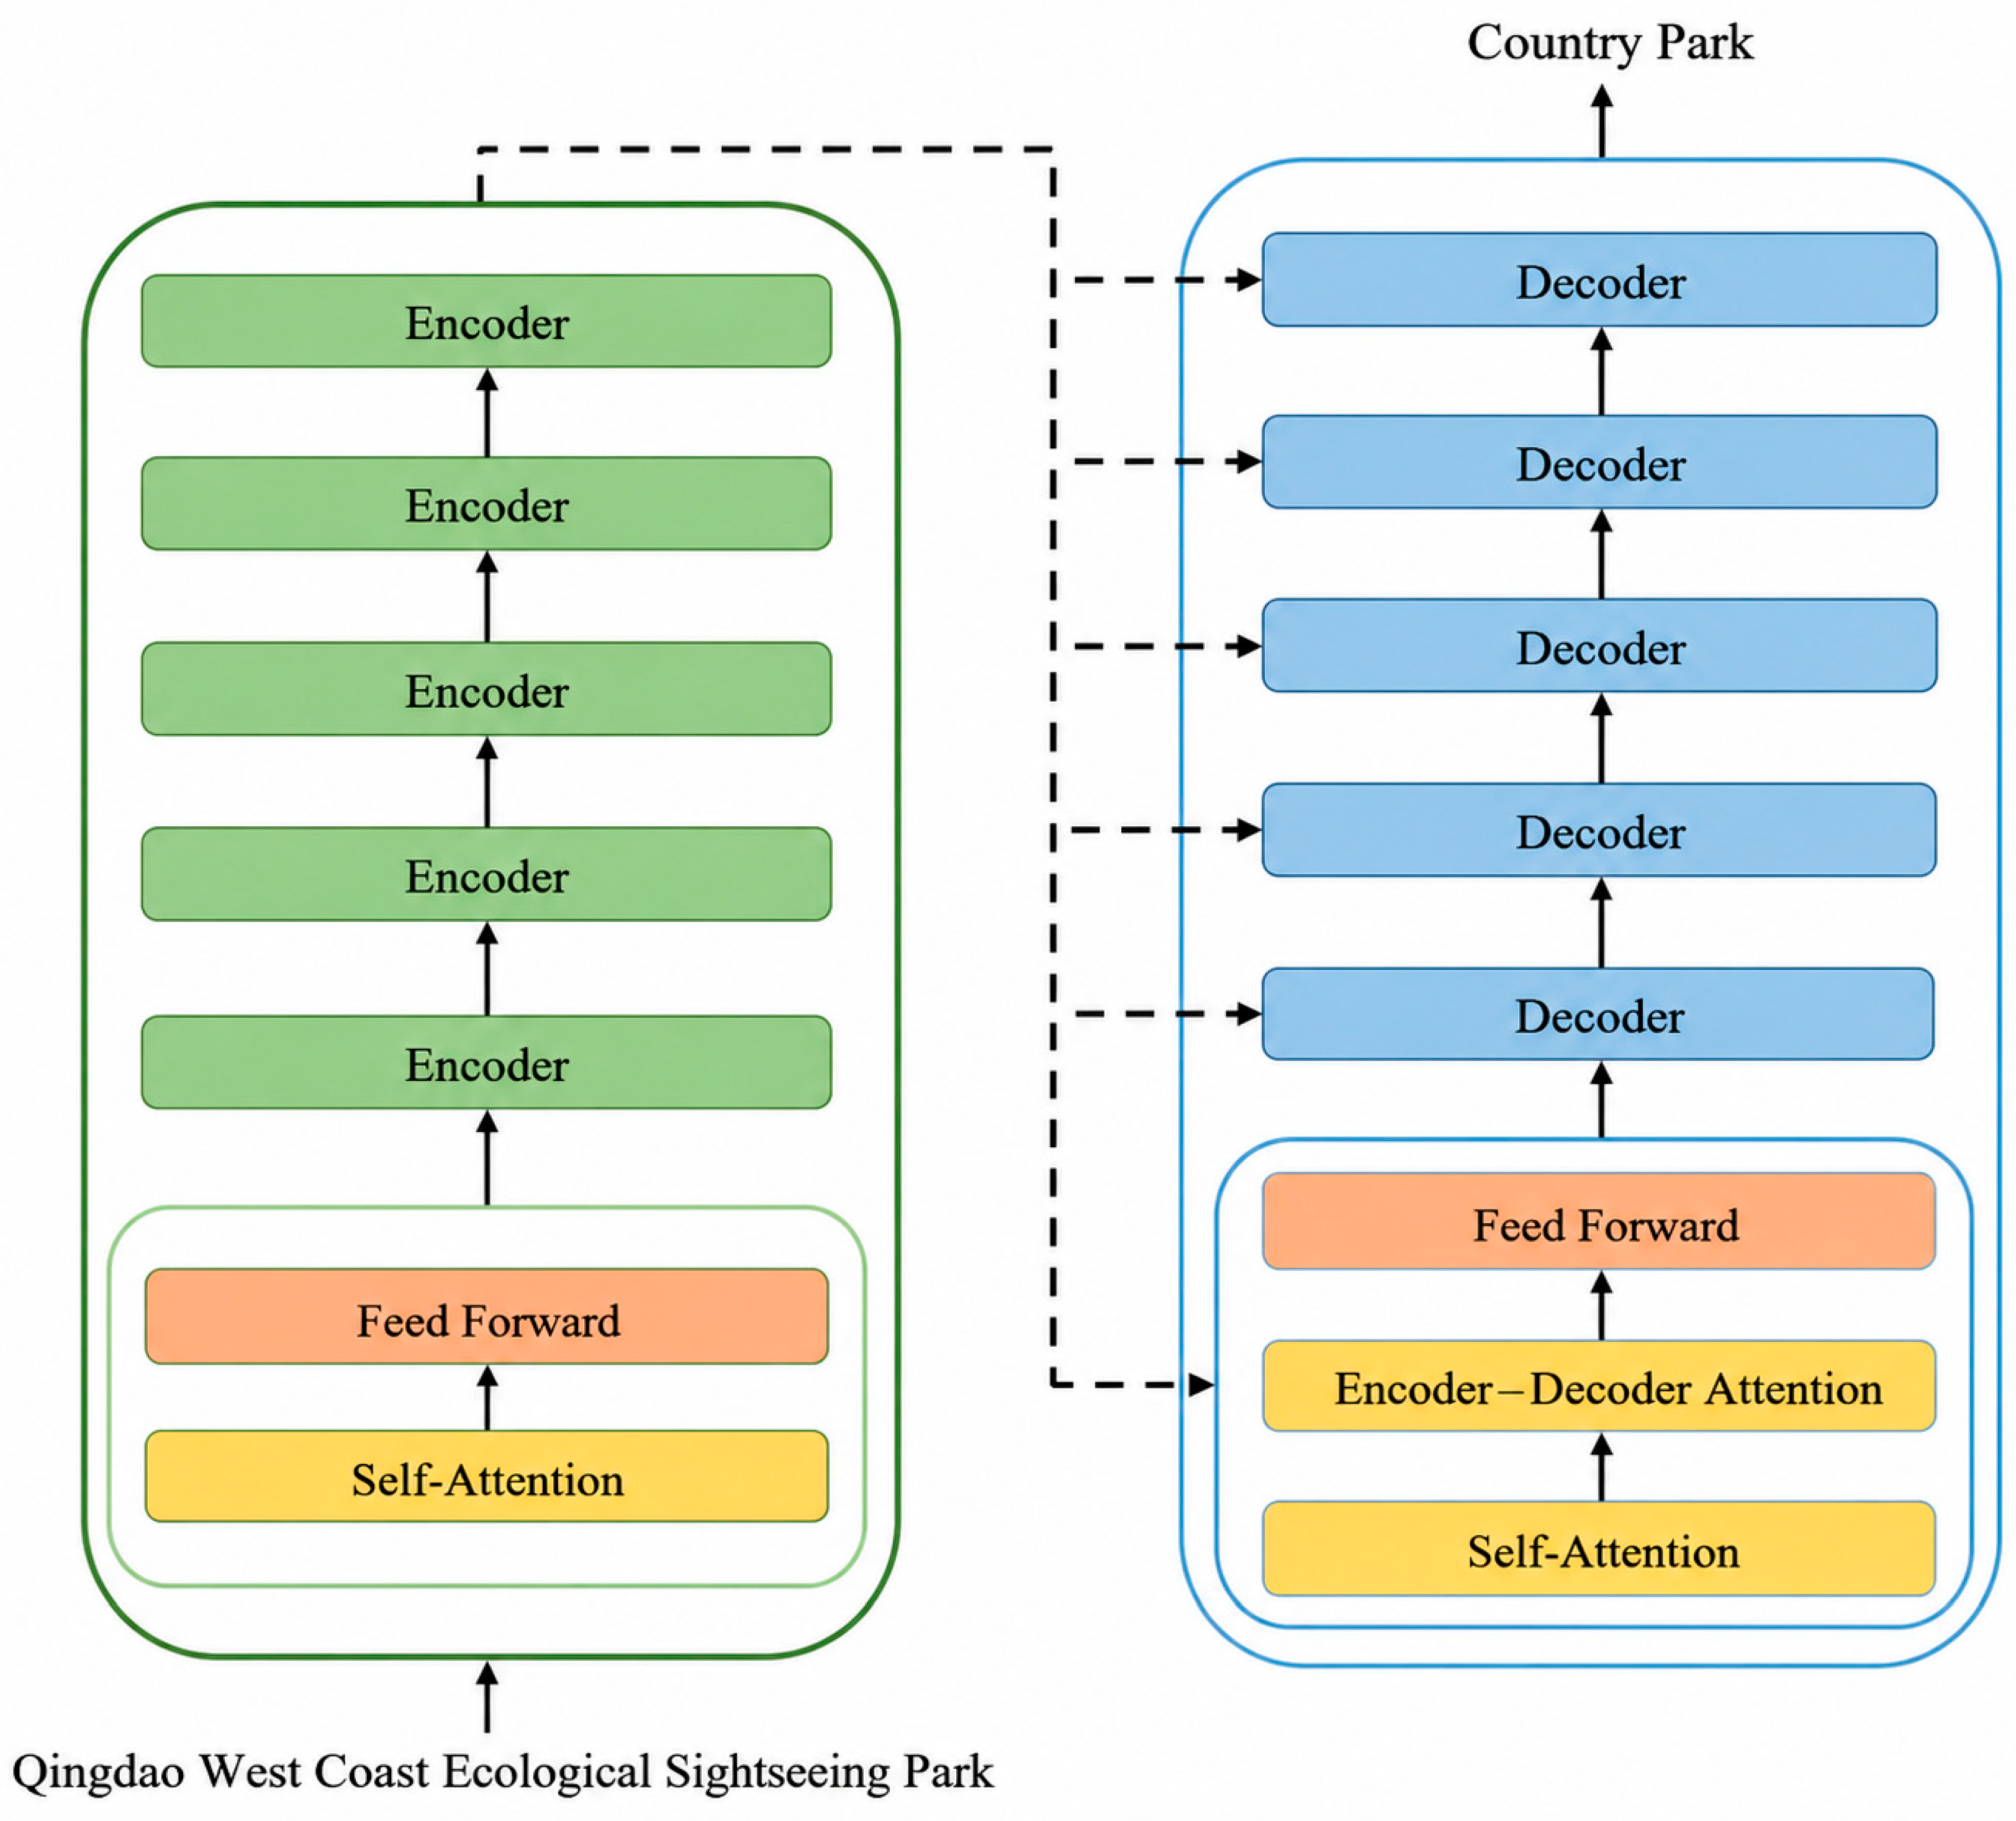
The semantically reconstructed POI database was first utilized to fine-tune the pre-trained BERT model, as shown in Figure 4. This allows the model to learn the specific mapping relationships between POI attributes and standardized planning categories. After the fine-tuning process, the optimized BERT model was deployed to classify all POI data within the study area. This workflow successfully transformed raw, heterogeneous data into a high-precision functional dataset, providing a consistent semantic foundation for subsequent spatial analysis.
To accurately capture the deep semantic relationships between raw POI attributes and standardized planning categories, we explicitly fine-tuned the pre-trained BERT-base-Chinese model rather than adopting it directly. The fine-tuning experiments were conducted on a Windows 10 workstation equipped with an NVIDIA GeForce RTX 3060 GPU. During the training phase, we set the maximum sequence length (pad_size) to 32 and utilized a mini-batch size of 128. The network weights were optimized using the BertAdam optimizer with an initial learning rate of 5 × 10⁻⁵ and a warm-up proportion of 0.05. We trained the model for 3 epochs, employing Cross-Entropy Loss as the objective function to calculate the discrepancy between the predicted labels and the 21 pre-defined planning target categories. Furthermore, an early stopping mechanism was implemented to halt training if no performance improvement was observed over 1000 consecutive batches, effectively preventing model overfitting. Meanwhile, to quantitatively evaluate the semantic reconstruction performance of this fine-tuned BERT model, we established an independent validation set and utilized Precision, Recall, and the F1-score as our primary evaluation metrics.

3.2.3. Spatial Boundary Constraints and Category Refinement

To overcome the spatial limitations of point-source POI data in delineating linear corridors and macro-ecological buffers, multi-dimensional geographic boundary constraints were introduced to augment the 21 semantic categories. The spatial buffering of high-precision vector road networks was applied to extract “Road Green Spaces”, “Protective Green Spaces”, and “Regional Protective Green Spaces”. Firstly, the vegetation patches situated within the 10 m buffer zones on both sides of the primary roads and secondary roads were assigned as linear “Road Green Spaces”. Secondly, using the GUB as a macro-spatial baseline, isolation ecological spaces were partitioned into “Protective Green Spaces” and “Regional Protective Green Spaces” based on their interior-exterior topological relationships. Finally, the spatial mosaicking of these three geometrically constrained zones with the 21 semantic parcels resulted in a seamless, fine-grained social-functional basemap comprising 24 distinct categories.

3.3. Extraction of UGS

3.3.1. Label Construction of UGS

The precise extraction of large-scale UGS physical entities serves as the essential spatial foundation for multi-level classification and attribute integration. Conventional global land-cover products are frequently constrained by specific algorithmic architectures or phenological timing, often resulting in spectral confusion and classification uncertainties within complex, densely built-up urban environments. To transcend these single-source limitations, this study develops a Pixel-level Weighted Voting Mechanism grounded in multi-source prior knowledge. By synthesizing multiple high-resolution land-cover datasets, we automatically generate a physical green space basemap characterized by high spatial robustness.
Four internationally recognized 10-m resolution open-source products—ESA WorldCover (ESA), GLC_FCS10 (GLC), Dynamic World (DW), and Esri Land Cover—were utilized as the primary inputs. Recognizing the performance heterogeneities of these products in intricate urban landscapes, differential voting weights were assigned. Based on the empirical literature reviews and preliminary regional accuracy assessments, ESA WorldCover exhibited superior performance in delineating urban vegetation contours and was subsequently assigned the primary weight w U G S = 0.4 . The remaining three products, acting as complementary sources of multi-temporal information and distinct algorithmic perspectives, shared the remaining weight ( w k = 0.2 ) equally. For any given pixel i, the weighted probability scores S c ( i ) for Trees ( c = T r e e ) and low vegetation ( c = L o w ) were calculated as follows, as shown in Equation (1):
S c ( i ) = k ( E S A , G L C ,   D W , E s r i ) w k · I ( L k ( i ) Ω c , k )
where k denotes the various data sources; L k ( i ) represents the original categorical label assigned by the data source k at pixel i ; Ω c , k signifies the set of target categories corresponding to each data source; and I is the indicator function that returns 1 if the condition is met and 0 otherwise.
Leveraging the integrated probability scores, a dual-threshold decision-making mechanism was employed to determine the ultimate classification of each pixel:
Y ( i ) = 1 ( Tree ) ,                                                                         if ( S T r e e ( i ) + S L o w ( i ) ) > τ     and S T r e e ( i ) > S L o w ( i )     2 ( Low _ V e g e t a t i o n ) ,                           if   ( S T r e e ( i ) + S L o w ( i ) ) > τ   a n d   S T r e e ( i ) S L o w ( i )                       0 ( B a c k g r o u n d ) ,                                               o t h e r w i s e                                                                                                                      
where τ represents the vegetation decision threshold (assigned a value of 0.5 in this study). This logic stipulates that a pixel is classified as vegetation only if it is validated by the dominant product (ESA) in conjunction with at least one auxiliary source, or alternatively, by a consensus of at least three auxiliary sources. This rigorous criterion ensures that the derived spatial labels are confined to regions exhibiting high cross-source consistency, thereby effectively mitigating classification artifacts and transient noise inherent in individual data products.

3.3.2. Architecture of the MSSANet Model

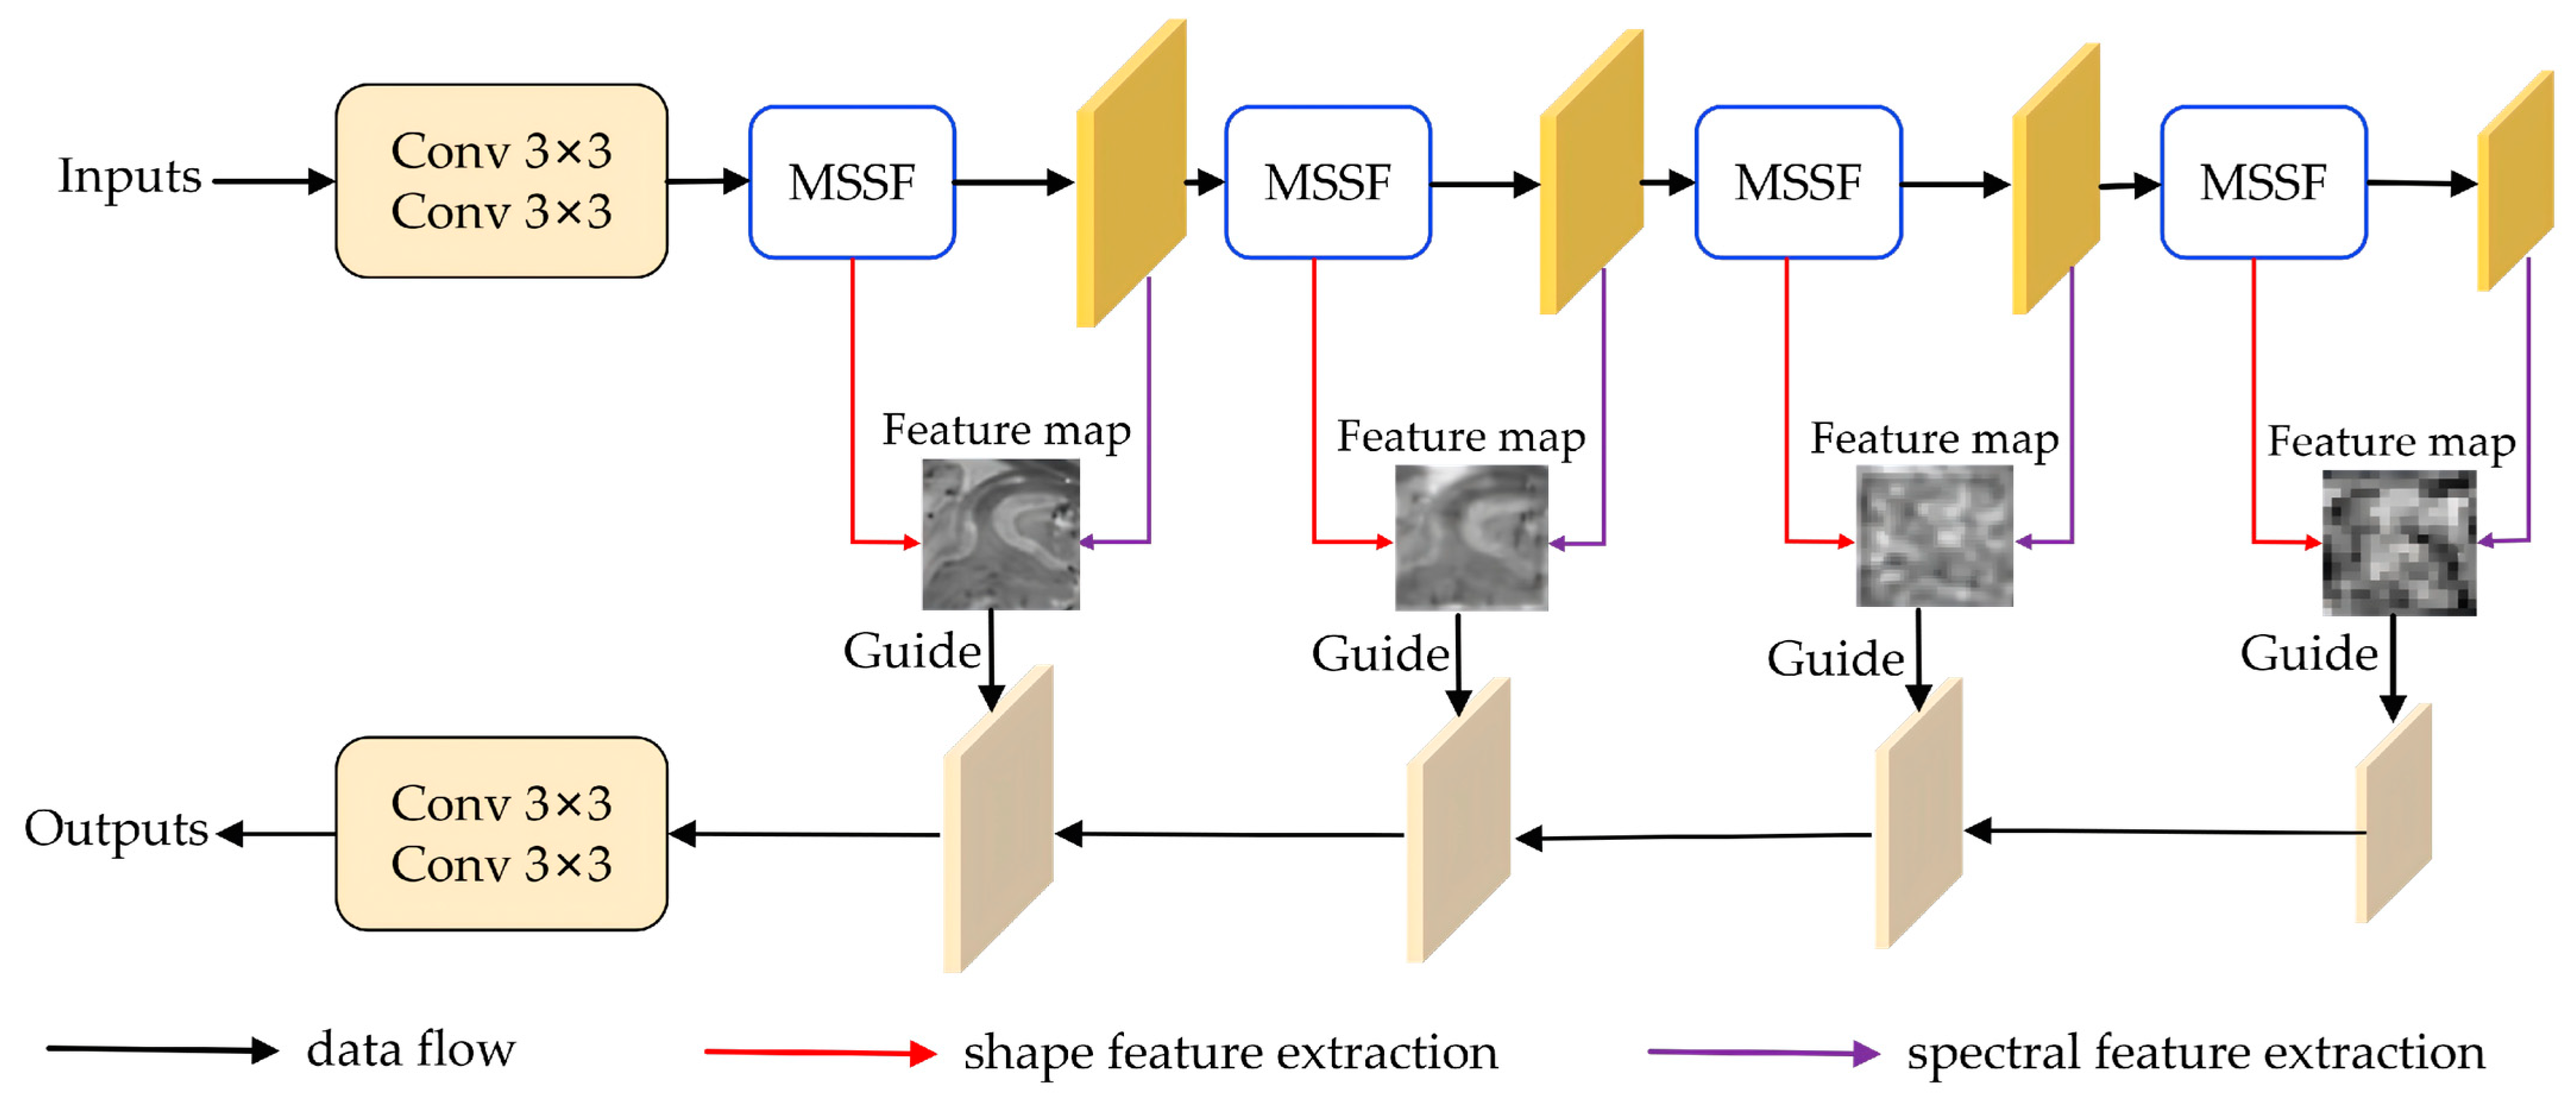
To achieve fine-grained extraction of large-scale UGS from heterogeneous urban environments, we specifically designed a novel deep learning architecture named MSSANet. As illustrated in Figure 5, the network adopts a specialized encoder–decoder framework designed to independently extract and synergistically capture shape and spectral characteristics.
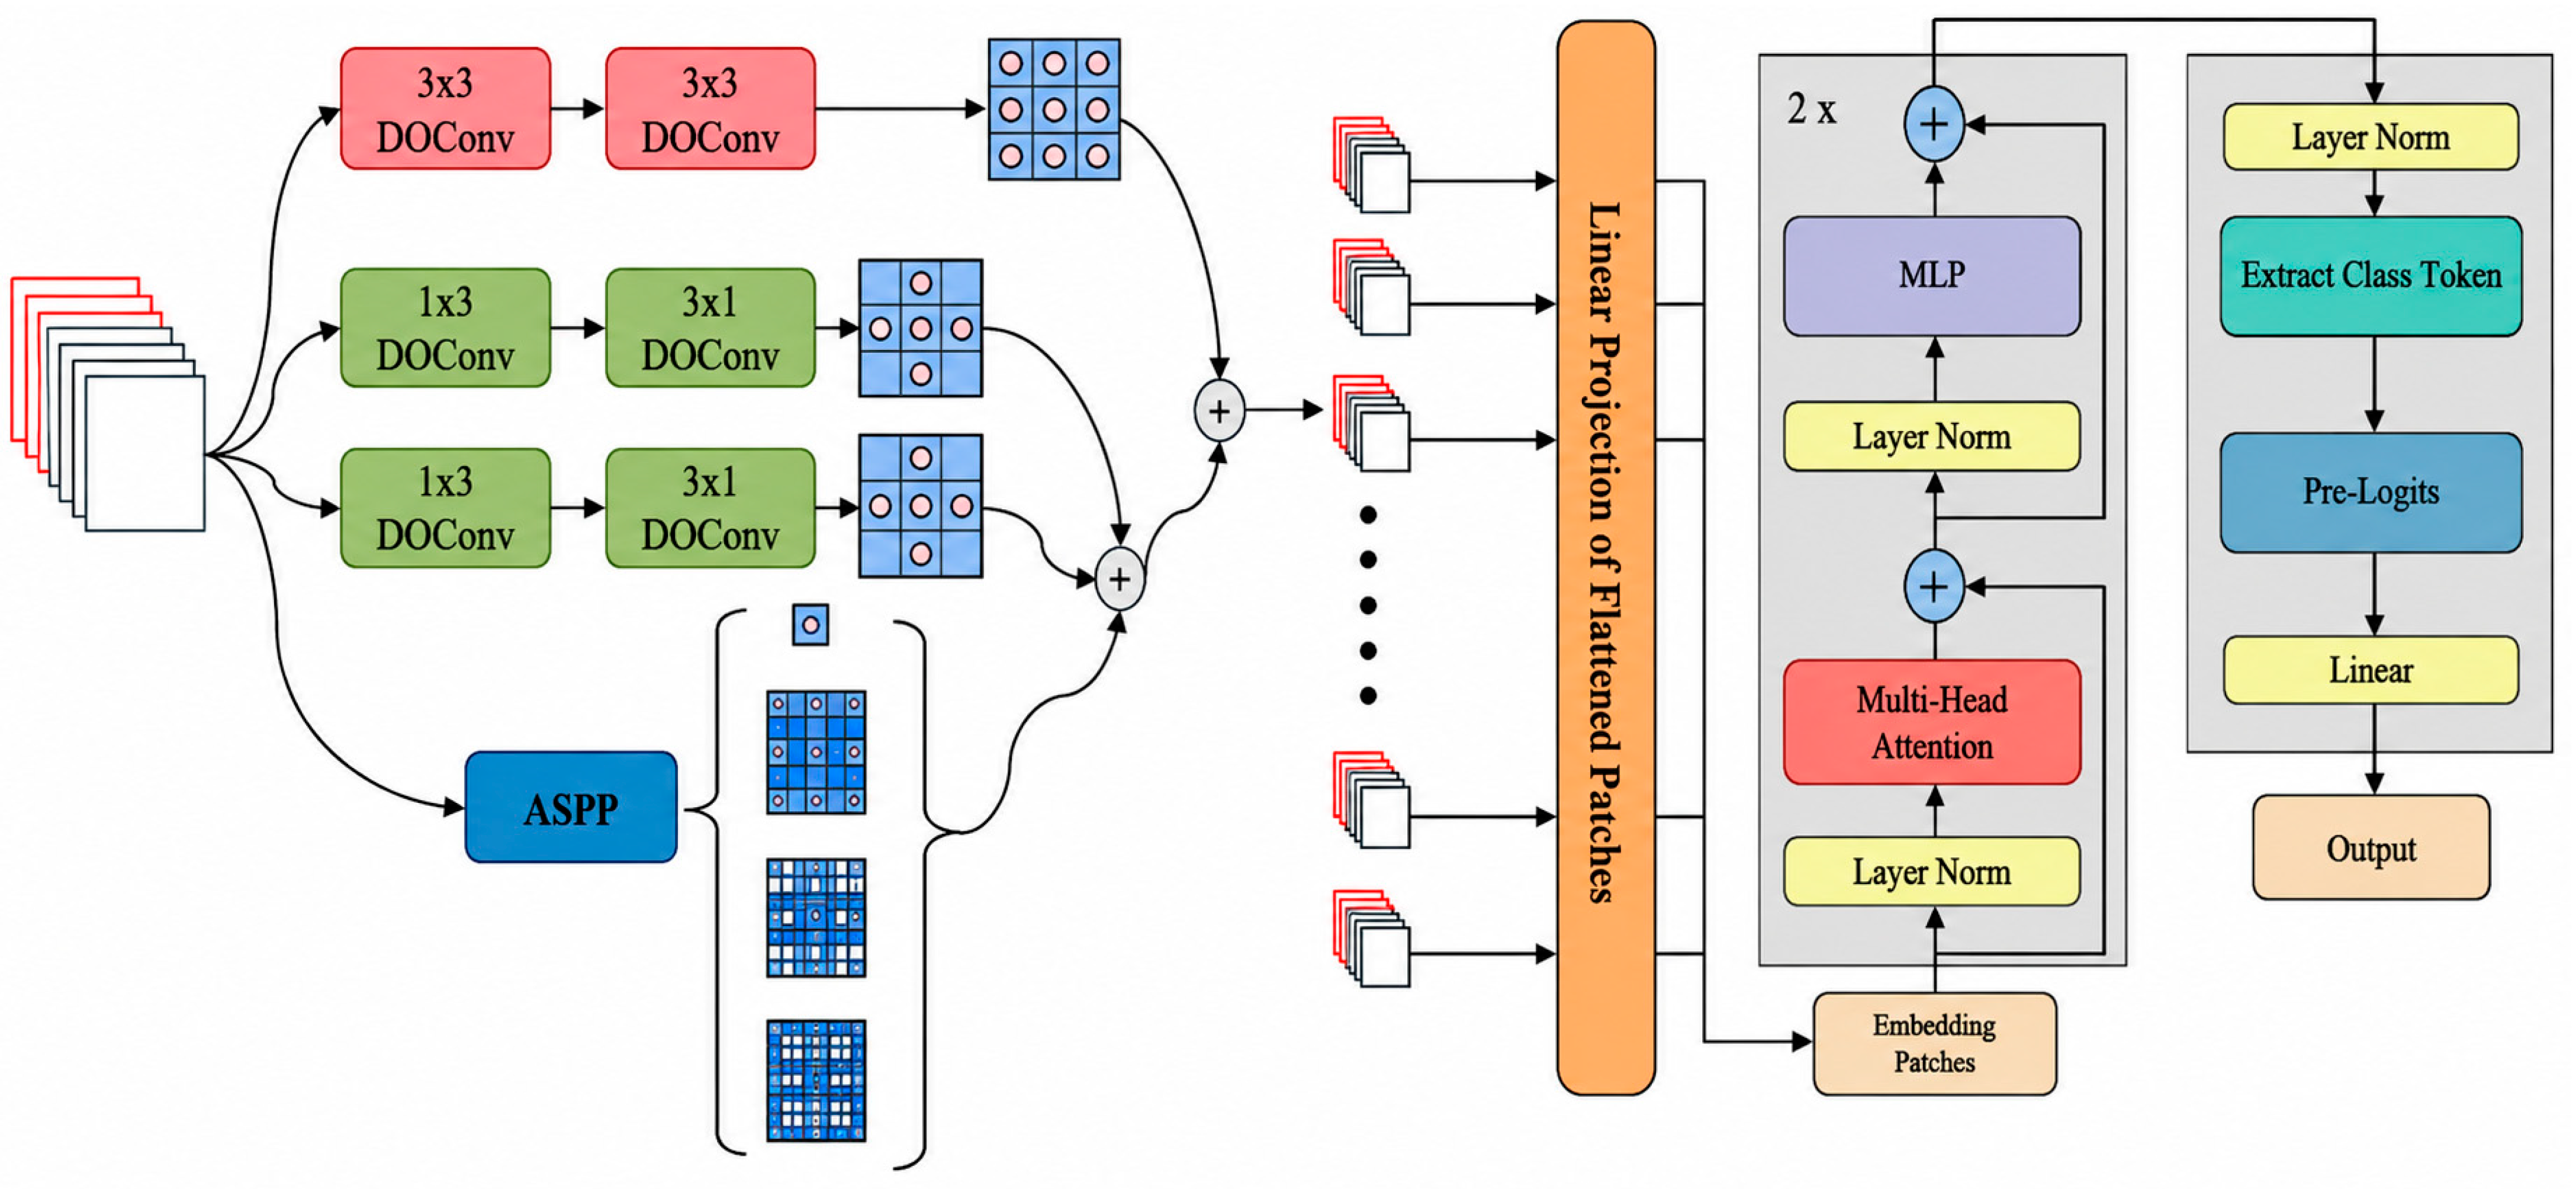
The MSSF-Encoder, as shown in Figure 6, is engineered to synergize localized morphological extraction with global spectral-spatial dependencies. The front-end utilizes a four-branch parallel module incorporating Depthwise Over-parameterized Convolutions (DOConv) to enhance the capture of fine vegetation textures and edge gradients while maintaining inference efficiency [36]. To specifically address the directional features of urban strip-like green spaces, asymmetric 1 × 3 and 3 × 1 DOConv are integrated to reduce parameter redundancy and improve extraction precision. This is complemented by an enhanced Atrous Spatial Pyramid Pooling (ASPP) mechanism [37], which expands the effective receptive field to mitigate classification fragmentation within tree canopies. Furthermore, a Vision Transformer (ViT) is deployed to model long-range dependencies through a multi-head self-attention mechanism [38]. By aggregating global spectral distribution patterns, the ViT back-end effectively resolves localized semantic ambiguities, resulting in a deep feature representation characterized by both geometric integrity and global consistency.
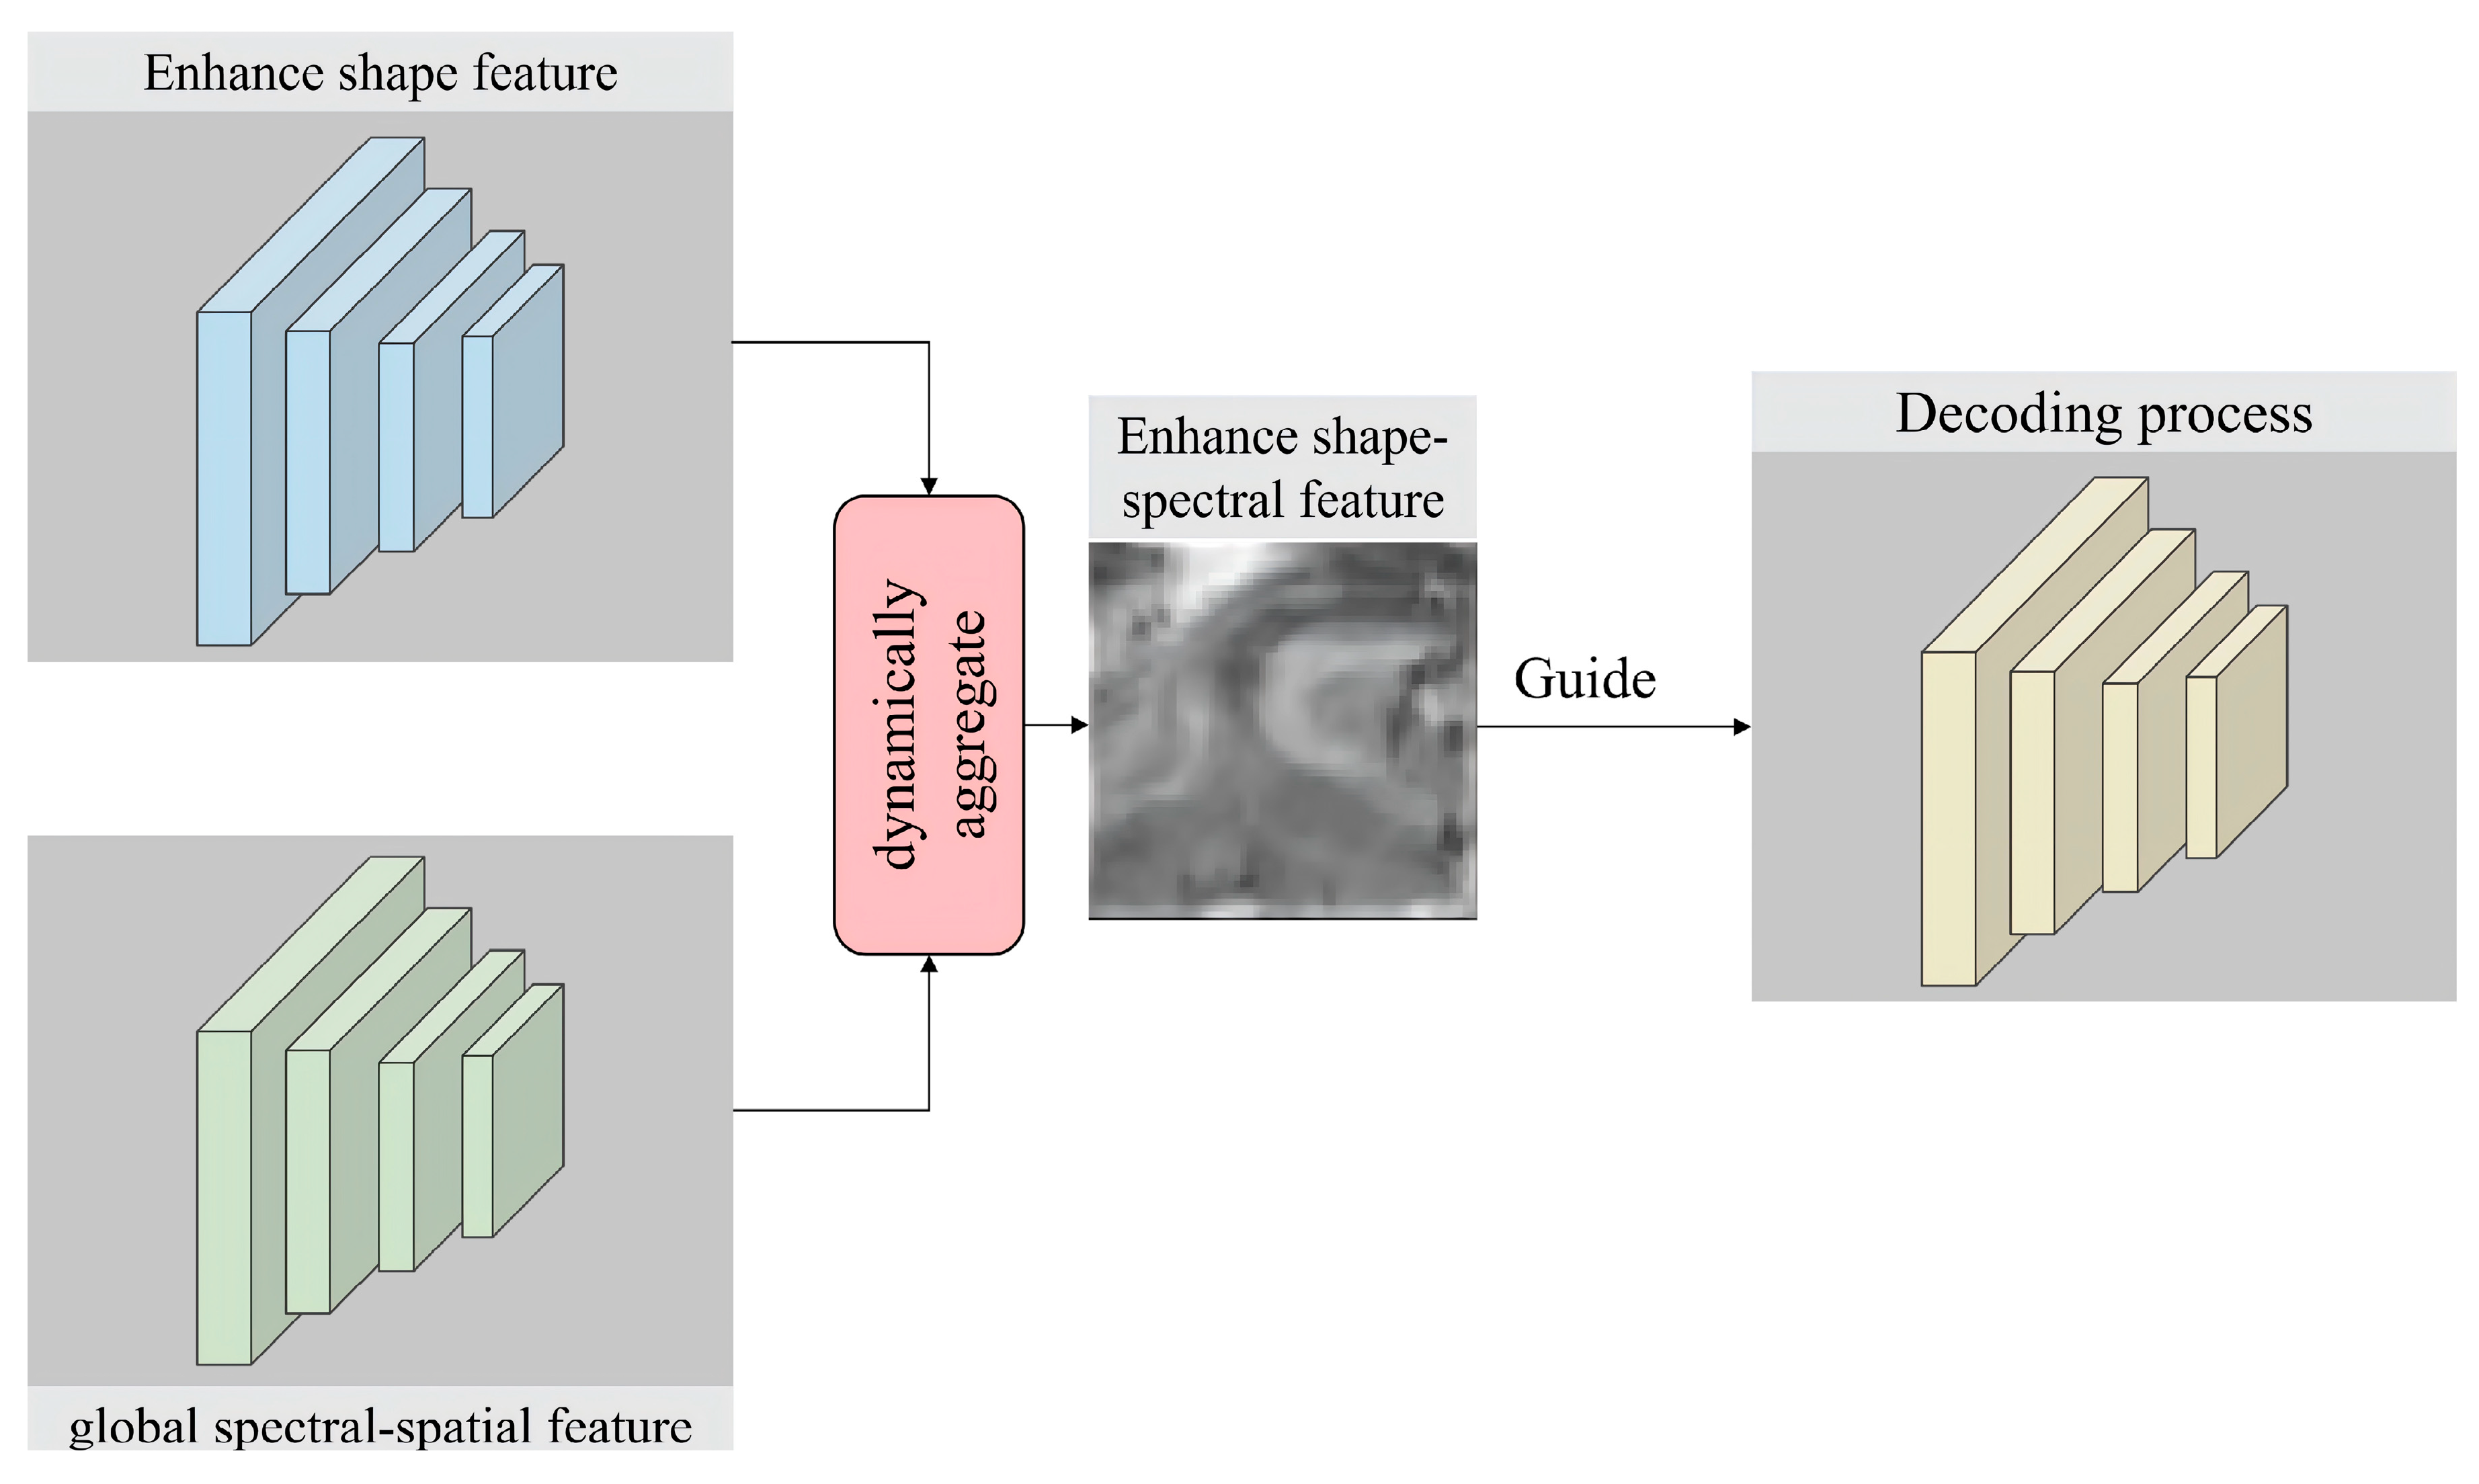
To overcome the limitations of static feature fusion in conventional decoders, we propose a novel decoder based on an adaptive weight allocation mechanism. Unlike standard skip connections that treat morphological and semantic features as equally contributory, this module dynamically integrates localized shape features and global spectral-spatial features from the MSSF-Encoder, as illustrated in Figure 7.
Subsequently, learnable dynamic weight parameters are introduced to recalibrate feature streams from diverse sources, yielding enhanced shape-spectral features through dynamic aggregation. The formulation of this dynamic weighting mechanism is presented in Equation (3).
W t o t a l = α × W s h a p e + β × W s p e c t r a l ( α , β [ 0 ,   1 ] )
where W t o t a l guides progressive upsampling by dynamically weighting W s h a p e and W s p e c t r a l Learnable parameters α and β adaptively prioritize these streams: increasing α sharpens boundaries for tree crowns and narrow green belts via high-frequency geometric details, while increasing β leverages global spectral consistency to resolve classification ambiguities in shaded or texture-poor regions.

3.4. “Physical-Social” Multi-Level Coupling Rules

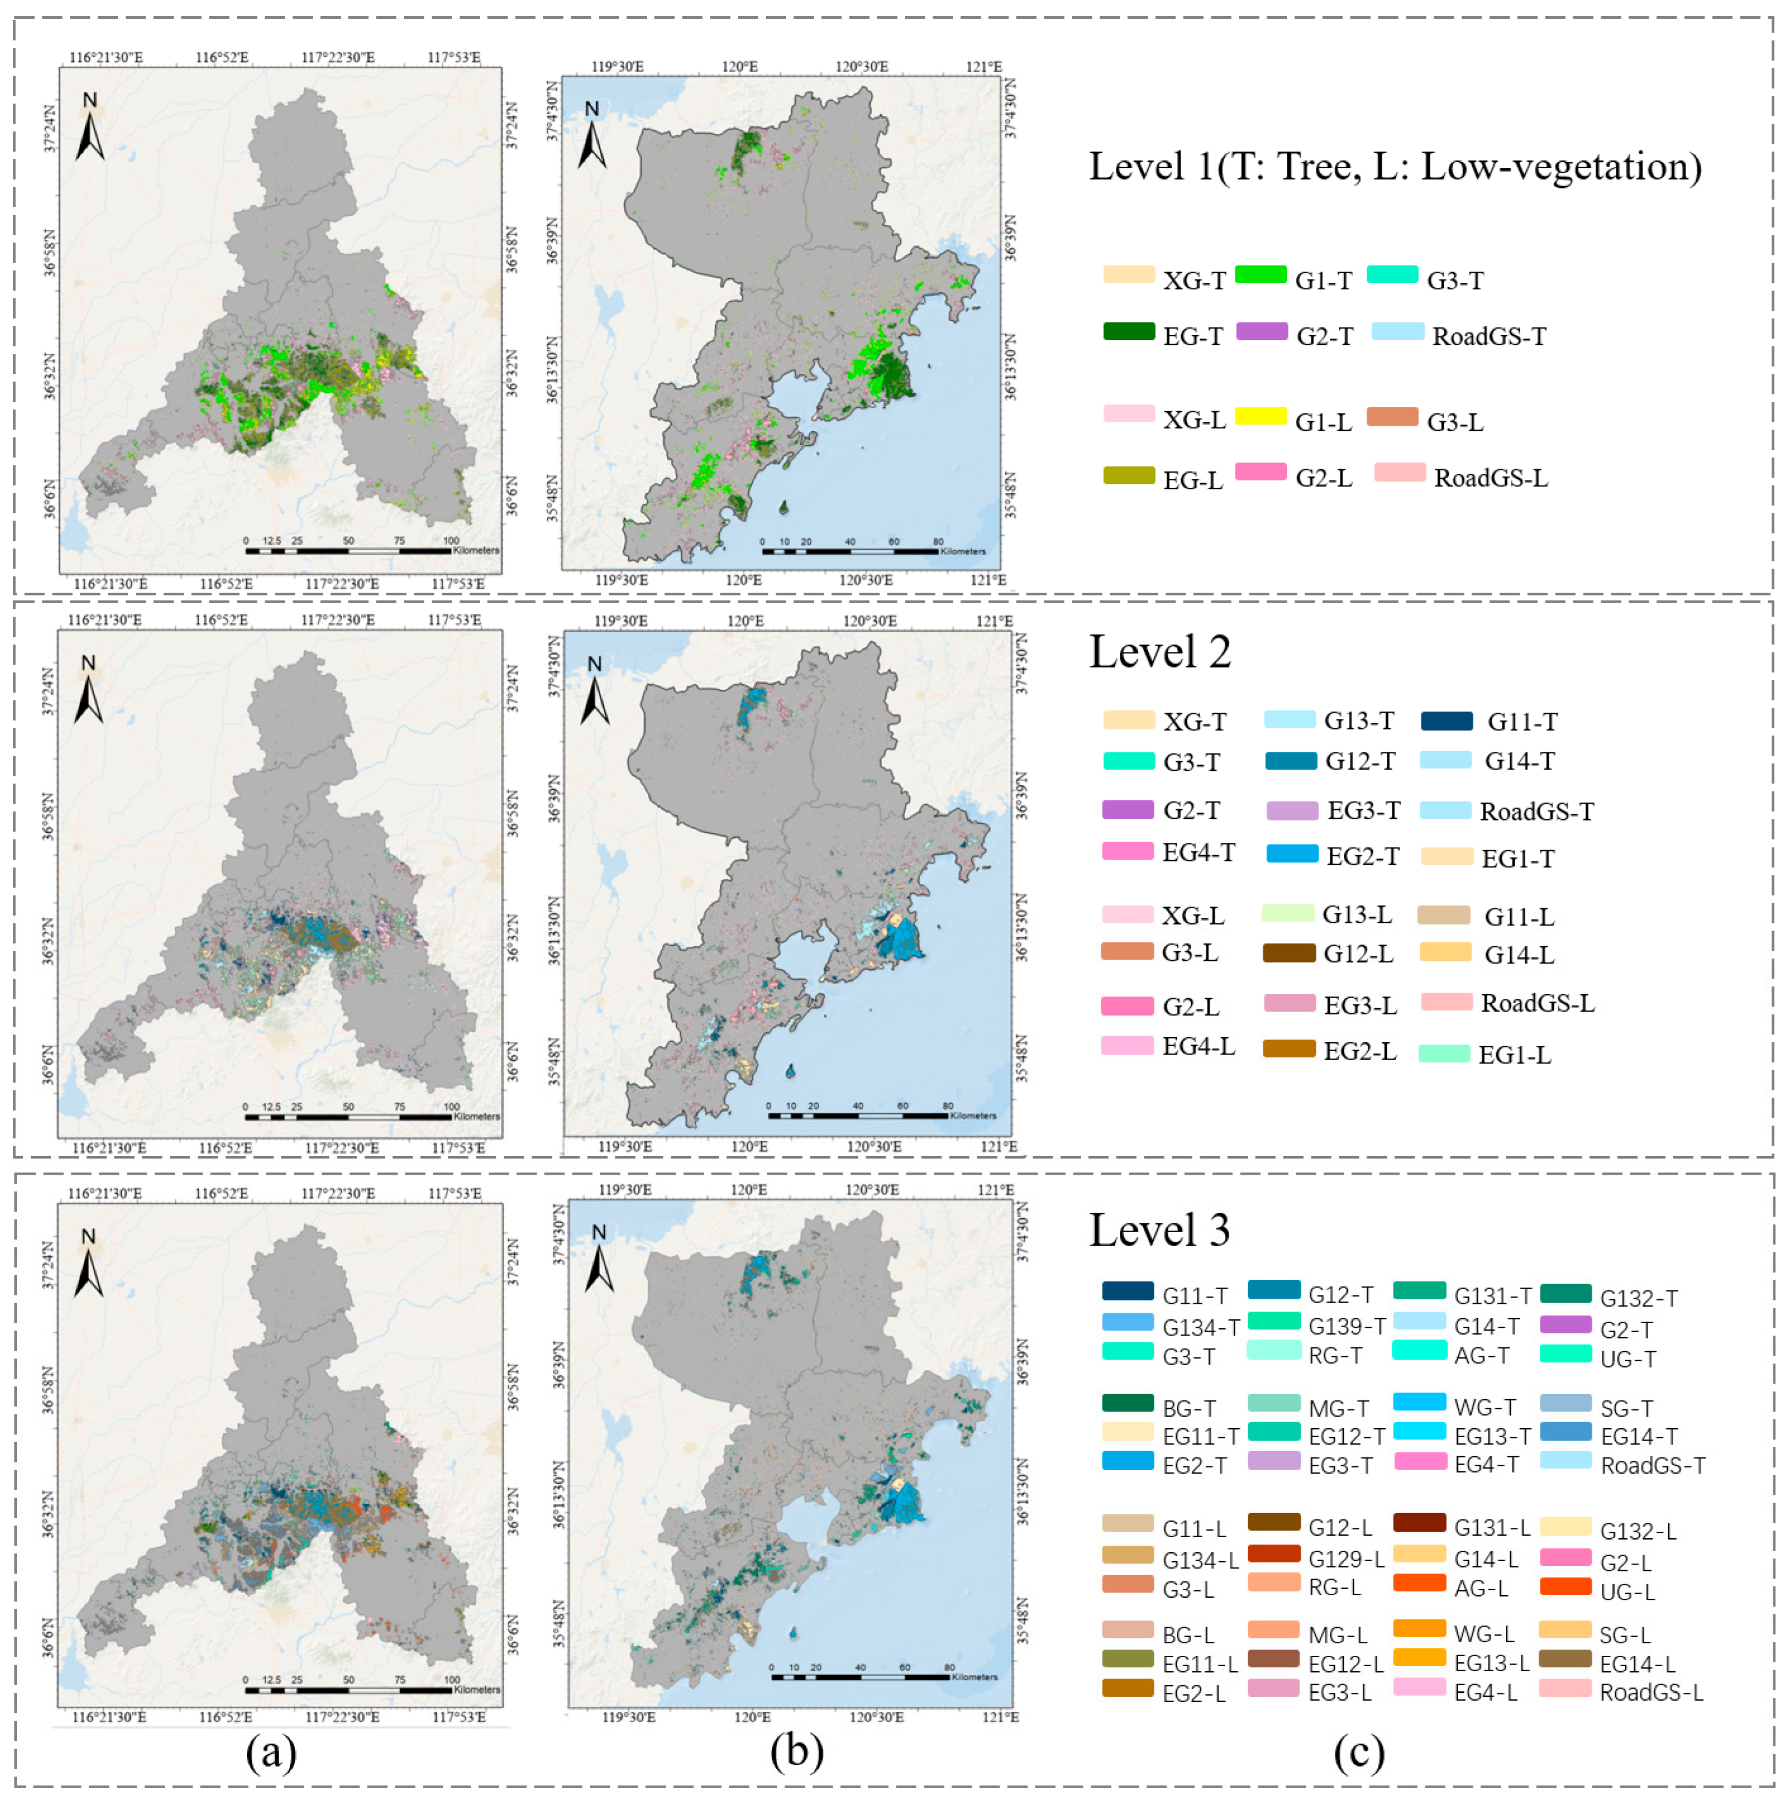
UGS represents more than mere natural substrates for ecosystem services. UGS is characterized by profound social attributes and intrinsic spatial dependency. Adhering to the standard for classification of UGS (CJJ/T 85-2017) and integrating the 24-category social-functional basemap derived from multi-source big data, this study established a classification framework guided by the principles of “function-orientation, hierarchical progression, and semantic compatibility”. By deeply coupling the physical spatial attributes of vegetation cover with the social service attributes of land use, a three-level classification architecture was formulated, comprising 5 major UGS categories (Park, Protective, Square, Attached, and Regional Green Space), 11 intermediate UGS categories, and 24 fine-grained UGS sub-categories as shown in Table 2. Logically, the Level-1 classification delineates five fundamental categories based on core functions, establishing the macro-structural skeleton of urban ecological space. Level-2 classification builds upon this by refining attached and regional green spaces, aiming to reveal the symbiotic relationship between vegetation and diverse urban functional zones (e.g., residential, commercial, industrial). Level-3 classification further focuses on specialized parks and specific recreational spaces, precisely identifying micro-ecological hotspots with unique cultural or conservation value.
To operationalize this hierarchical system spatially, a cross-mapping rule in which vegetation defines space and function defines attributes was devised. In practice, GIS-based spatial overlay analysis was employed to link the multi-source “physical vegetation basemap” (capturing tree/low-vegetation features) with the “social-functional basemap” on a patch-wise basis. If a vegetation patch falls within independent functional zones, such as parks, squares, or peripheral ecological conservation areas, it directly inherits the corresponding Level-1 attributes. Conversely, if located within non-green-space-dominant developed land, it follows the dependency principle, mapping downward into Level-2 or Level-3 attached green space categories based on the dominant social function of the parcel. This coupling mechanism not only clarifies the social management jurisdiction of each green space level but also preserves the three-dimensional morphology of natural vegetation, achieving a precise synthesis of physical coverage and multi-level social semantics.

4. Results

4.1. Accuracy and Spatial Patterns of Urban Social Functional Zones

4.1.1. Accuracy of POI Reclassification

Empowered by the rigorous noise reduction and cross-system label mapping applied to approximately 200,000 nationwide POI records, the fine-tuned BERT model demonstrated exceptional classification performance on the independent validation set, as listed in Table 3. Note that since “Other Parks” refers to parks without clearly defined specific functions, this category involves relatively high uncertainty and is therefore of limited value for evaluation. Accordingly, it was excluded from the accuracy assessment during model training. As a result, the table reports the quantitative evaluation results for only 20 semantic categories. As shown in Table 3, the F1-scores for all 20 semantic categories consistently exceeded 0.84, firmly validating the efficacy of the antecedent data optimization and corpus construction strategies. Notably, the model achieved extremely high recognition accuracy (F1 > 0.95) for specialized green spaces with distinct semantic features, such as botanical gardens and heritage parks. More crucially, when confronting complex categories characterized by highly mixed functions and noisy native texts, such as residential (F1 = 0.841) and industrial lands (F1 = 0.846), the model maintained highly competitive precision and recall rates. This demonstrates that a deep language model, when calibrated with a high-quality, domain-specific corpus, can effectively overcome the inherent semantic ambiguity of commercial LBS data.
Leveraging this predictive model, we successfully executed the automated semantic parsing and categorization of the comprehensive POI datasets for Jinan and Qingdao. This pivotal step effectively extracted the latent functional attributes from massive discrete spatial points, establishing a high-confidence semantic foundation for the subsequent generation of the 24-category social-functional basemap via geometric boundary constraints.

4.1.2. Evaluation Results of Urban Social Functional Zones

To comprehensively validate the reliability of the social-functional basemap, a mixed quantitative-qualitative evaluation was conducted using an independent set of 310 representative parcels. Note that “Roadside Green Space (RoadGS)” was excluded from the 310 representative parcels because vegetation patches situated within the 10 m buffer zones on both sides of the primary roads and secondary roads were pre-defined as “Roadside Green Space”. This rule-based classification requires no accuracy verification, so this category is not validated. The 310 parcels were selected through a spatially stratified random sampling approach, ensuring that the 23 fine-grained functional categories (excluding the RoadGS) were adequately represented across the study areas. To establish accurate ground truth, the reference labels were visually interpreted by independent researchers, who cross-verified the functional attributes using high-resolution Google Earth imagery. The results are listed in Table 4. As shown in Table 4, although several of the Producer’s Accuracy (PA) and User’s Accuracy (UA) are lower than 80%, most of the functional zones are correctly divided. The Overall Accuracy (OA) and Kappa coefficient ( κ ) gained 92.9% and 0.861, respectively. The model achieved exceptionally high recognition rates for categories with distinct morphological and semantic signatures, such as industrial and logistics lands. Although minor misclassifications occurred among semantically overlapping recreational spaces, such as specialized parks, the incorporated POI-weighting mechanism helped mitigate statistical biases inherent in the long-tail distribution of urban functions, thereby improving the stability of the classification results in the two case-study cities.
Table 5 displays the visualization results for selected functional zones. As shown in Table 5, the model demonstrates strong boundary delineation capabilities for large ecological and production areas. For instance, the boundaries of the Qingdao West Coast Sightseeing Eco-Park and the production green spaces align closely with the actual geographic features seen in the corresponding Google Earth imagery. This confirms the method’s effectiveness in extracting irregular natural landscapes and filtering out surrounding noise. In high-density built-up areas, the model effectively parses complex urban textures. For commercial, logistics and warehouse, and industrial zones, the generated vector boundaries accurately enclose dense building clusters. The results present regular geometric shapes that match actual planning layouts, proving the model can overcome shadow and texture interference in densely built environments.
Furthermore, the method excels at decoupling mixed-use blocks and addressing fine-grained classification problems. The model successfully separates internal spatial structures, such as commercial, residential, community park, and public service zones within a single block. At a micro-scale, it accurately differentiates the Jianlian Traditional Chinese Medicine Clinic from the adjacent community park. It also effectively separates square, residential, and public utility zones that are tightly packed together. This indicates that the proposed method is highly valuable not only for macro-scale zoning but also for the fine-grained parsing of micro-urban spatial structures.
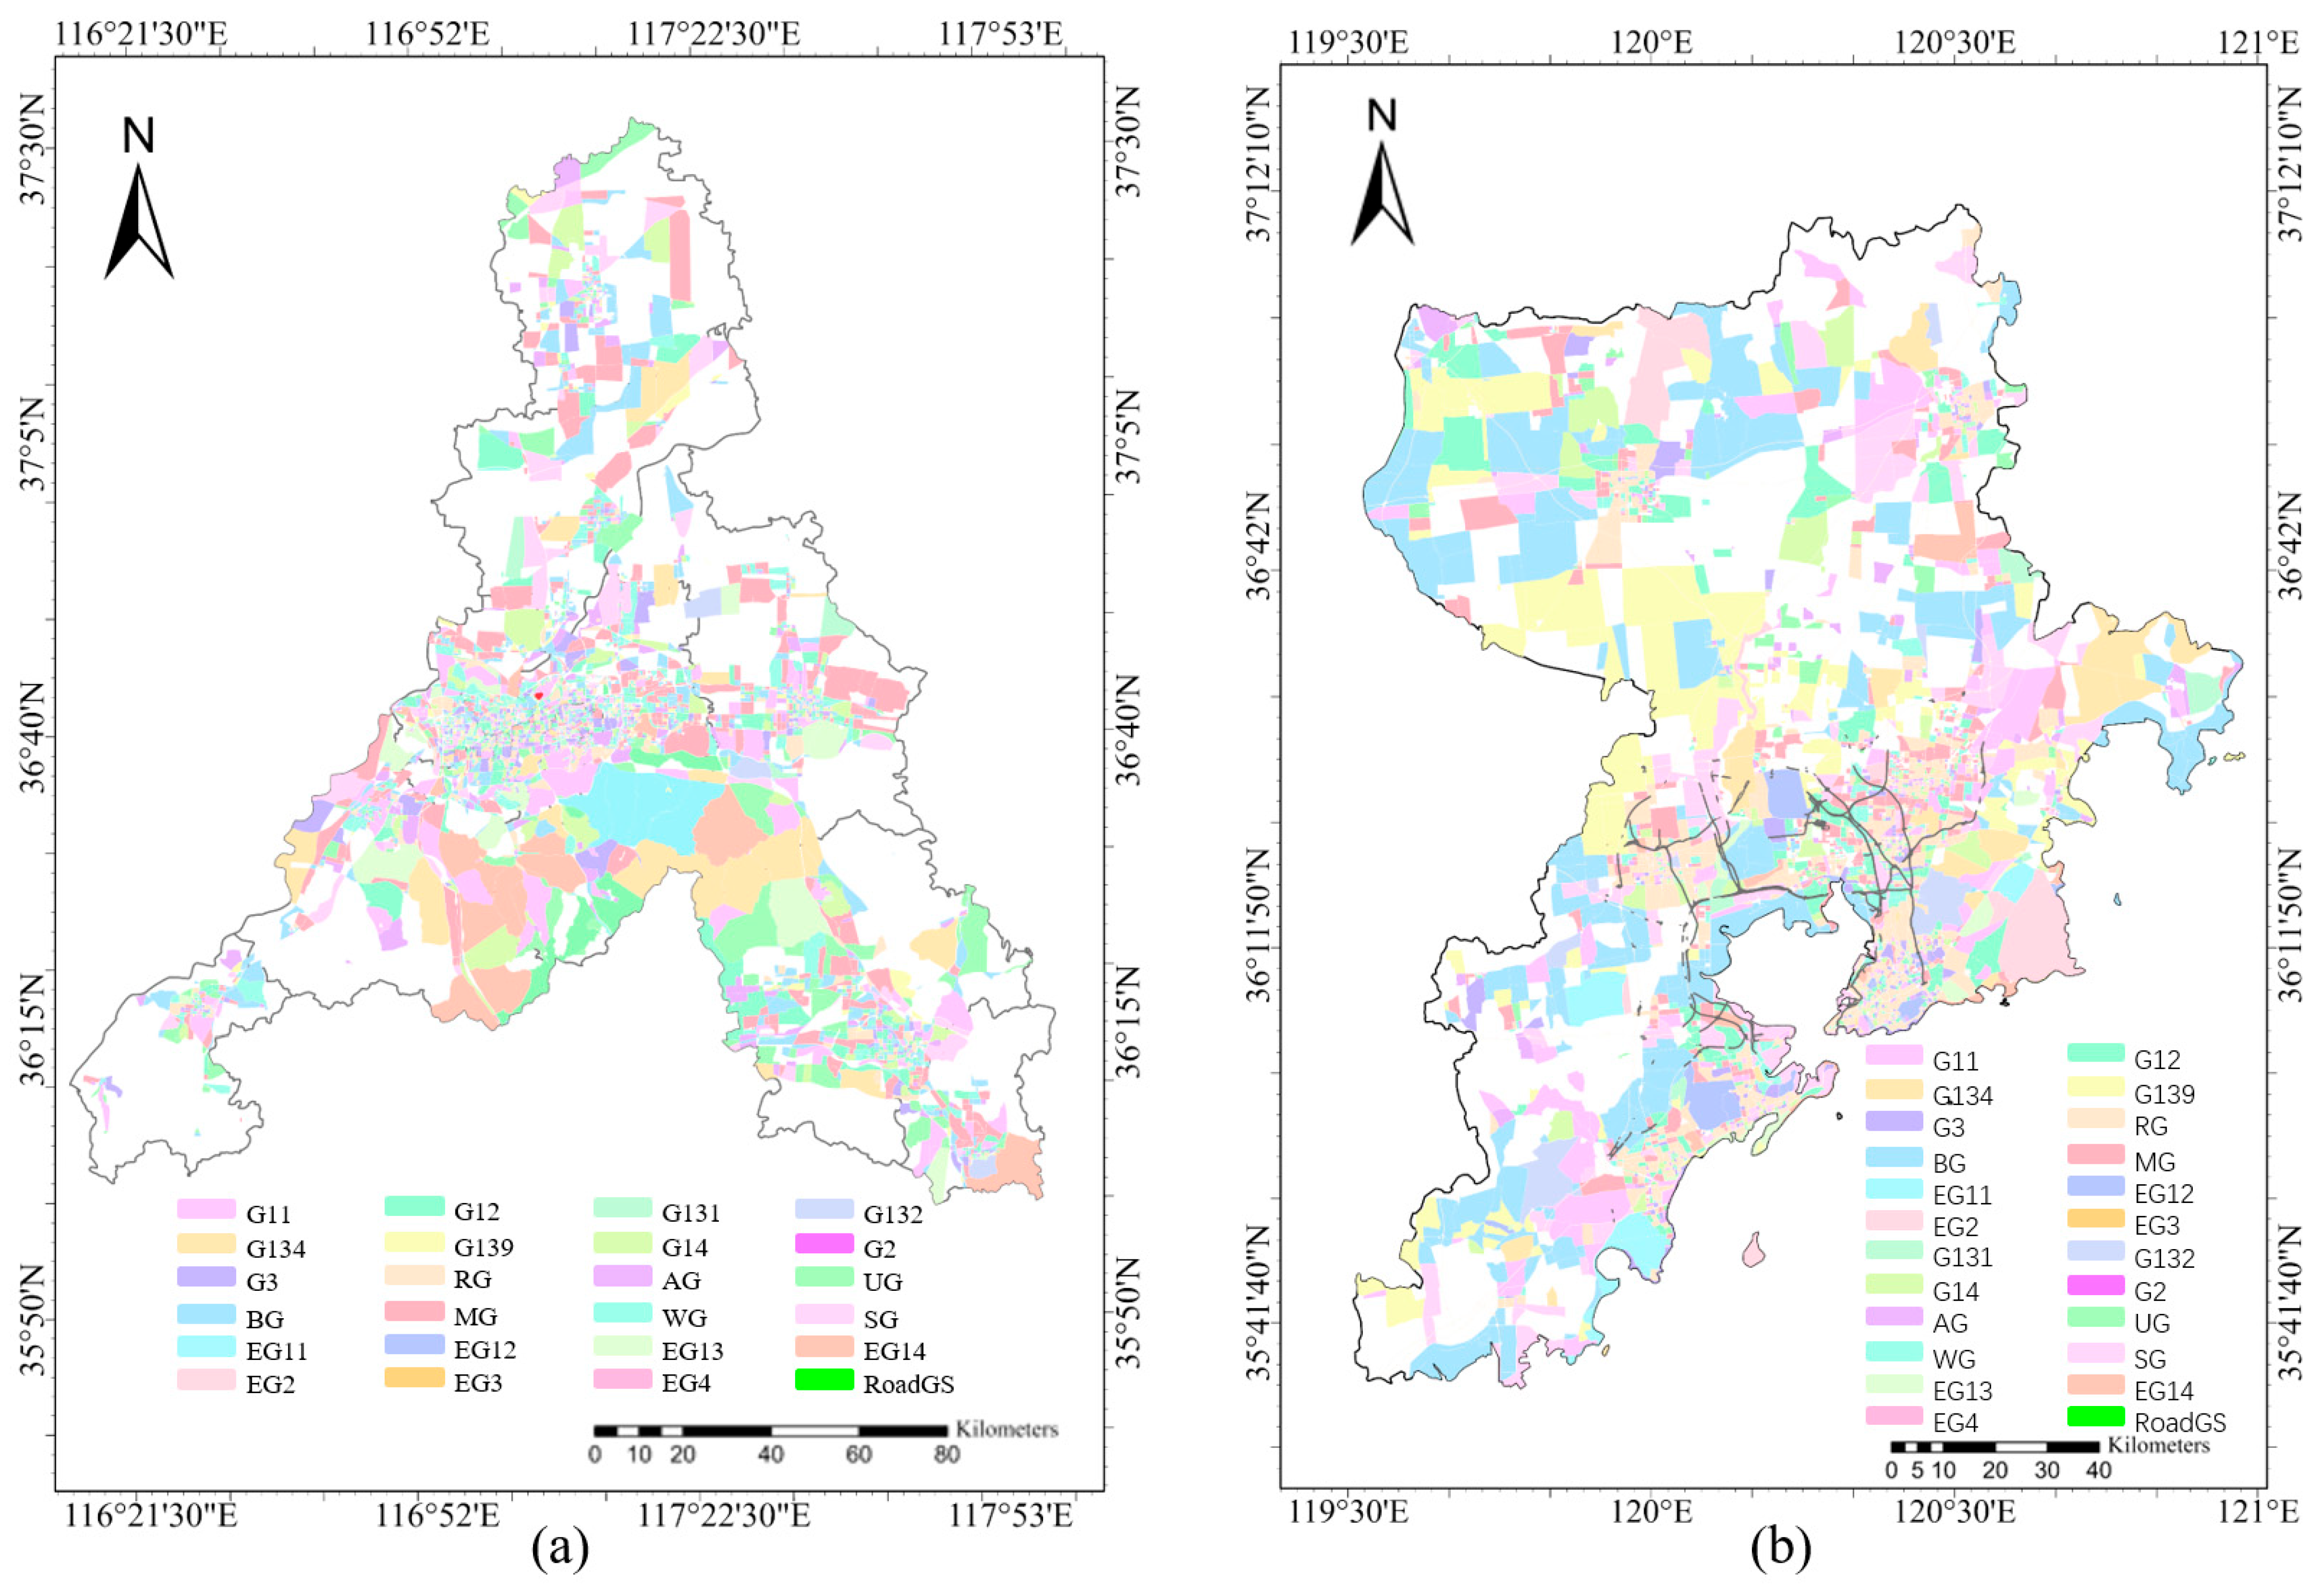
Building upon the proposed framework, the 24-category social-functional basemaps of Jinan and Qingdao were obtained, as shown in Figure 8a and Figure 8b, respectively. The macroscopic mapping objectively delineates two distinct urban spatial skeletons: Jinan exhibits a concentric pattern radiating from dense commercial and residential cores, while Qingdao demonstrates a polycentric, clustered distribution constrained by its coastal and mountainous topography.

4.1.3. Error and Confusion Matrix Analysis

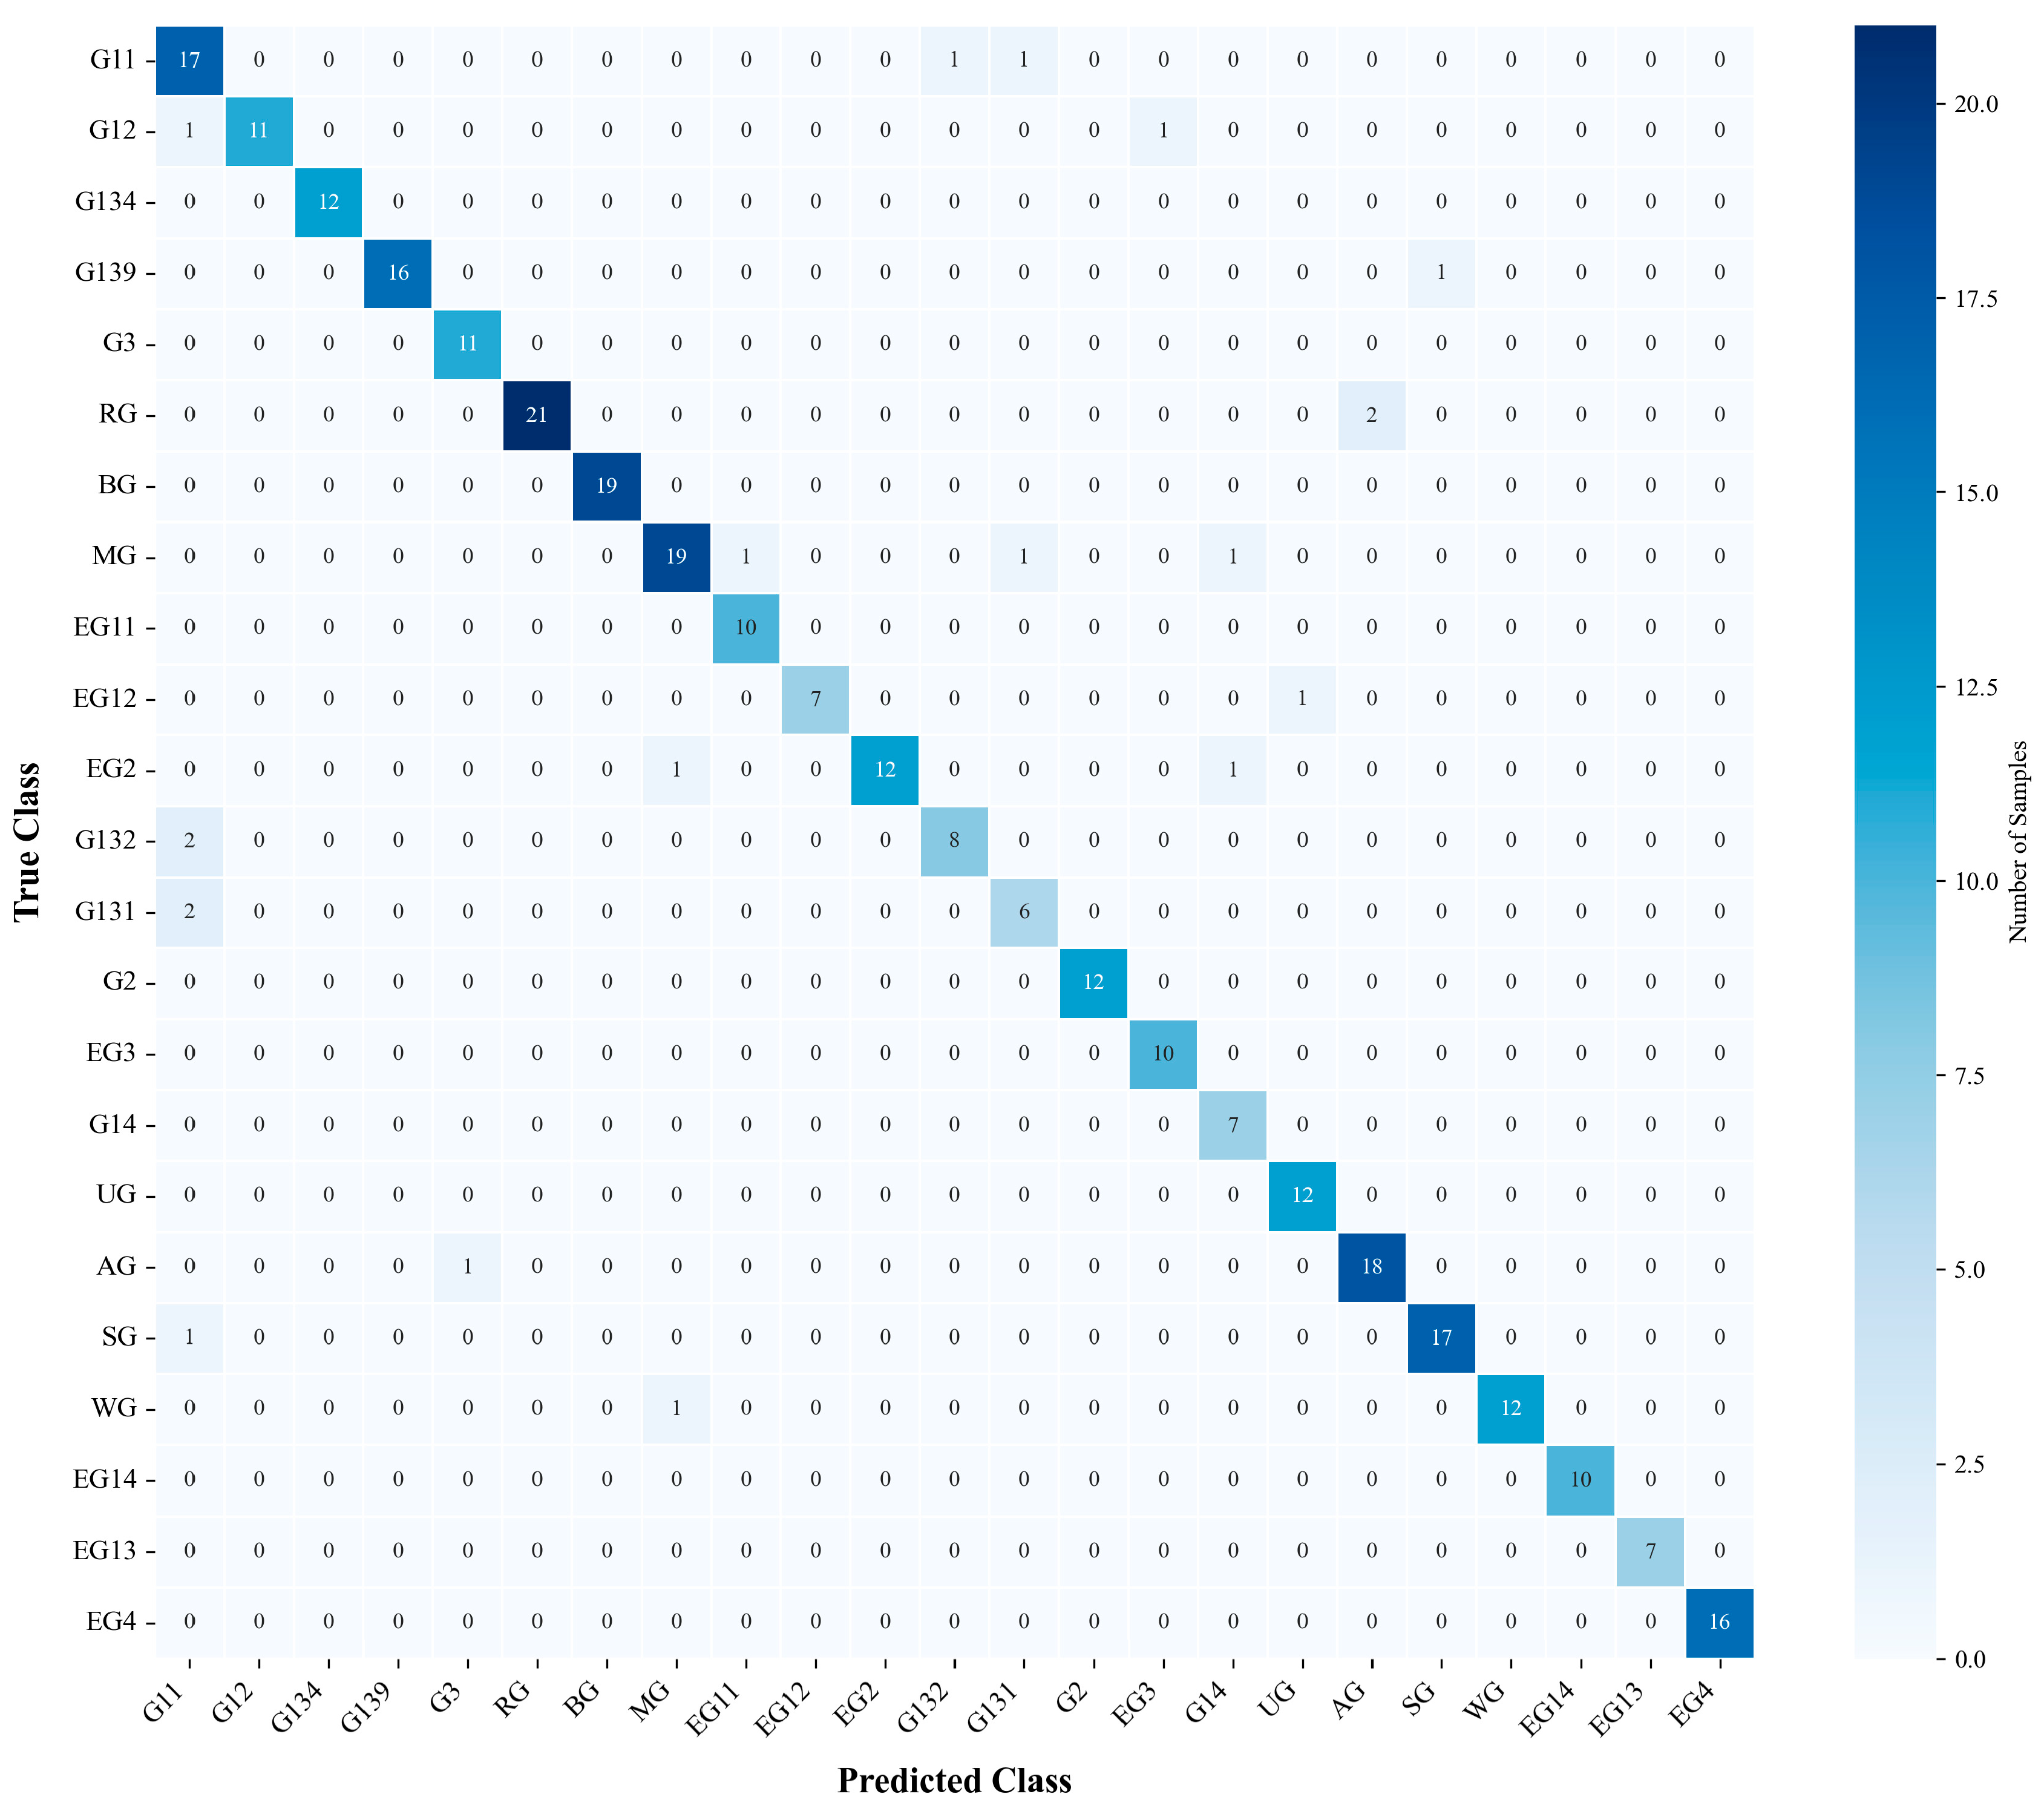
While the overall accuracy (92.9%) listed in Table 4 shows the effectiveness of the proposed method, the confusion matrix shown in Figure 9 reveals minor misclassification among semantically overlapping categories, notably between Comprehensive Parks (G11) and Specialized Parks (e.g., G131, G132). This confusion is fundamentally driven by POI semantic ambiguity. In complex urban contexts, specialized parks are frequently spatially nested within comprehensive parks, and user-generated tags often employ generic descriptors (e.g., “park”), making it challenging for the BERT model to completely disentangle them based solely on textual features.
Notably, the confusion matrix reveals occasional misclassification between Comprehensive Parks (G11) and Specialized Parks, such as Botanical Gardens (G132) and Zoos (G131). This specific confusion is fundamentally rooted in the semantic ambiguity and spatial nesting of commercial POI data. In complex urban contexts, specialized parks are frequently nested within the boundaries of larger comprehensive parks. Furthermore, user-generated LBS tags often employ generic descriptors (e.g., simply labeling a location as a “park” rather than a “botanical garden”). Consequently, despite the rigorous fine-tuning of the BERT model, completely disentangling these nested functions based solely on textual attributes remains challenging.
Furthermore, it is crucial to distinguish these semantic-driven errors from misclassification induced by spectral similarity in remote sensing imagery. Under our proposed “function-first, vegetation-second” coupling paradigm, socio-functional attributes are exclusively determined by Stream A (POI semantic reconstruction via BERT), while physical vegetation morphology is extracted by Stream B (MSSANet). Therefore, the functional misclassification observed in Figure 9 is entirely independent of spectral interference. Spectral confusion—such as the overlap between tree canopies and shaded low vegetation—primarily affects the boundary completeness and fragmentation of the physical vegetation basemap in Stream B, rather than altering the top-level functional management labels.

4.2. Extraction Results of UGS

To evaluate the model’s predictive performance, an independent validation set of 5000 sample points was established via visual interpretation of high-resolution imagery. The comparative evaluation includes two types of baselines: standard deep learning models using single-date optical imagery, and global land-cover products utilizing multi-temporal or multi-sensor data. The comparison results were listed in Table 6. As shown in Table 6, the proposed MSSANet achieved an OA of 93.2% and a Kappa coefficient of 0.853. Specifically, the accuracy for the “low-vegetation” and “tree” classes was 76.5% and 94.1%, respectively. This indicates that the proposed architecture—leveraging multi-scale structural geometries and dynamic aggregation for global context—effectively mitigates the limitations associated with single-date data inputs.
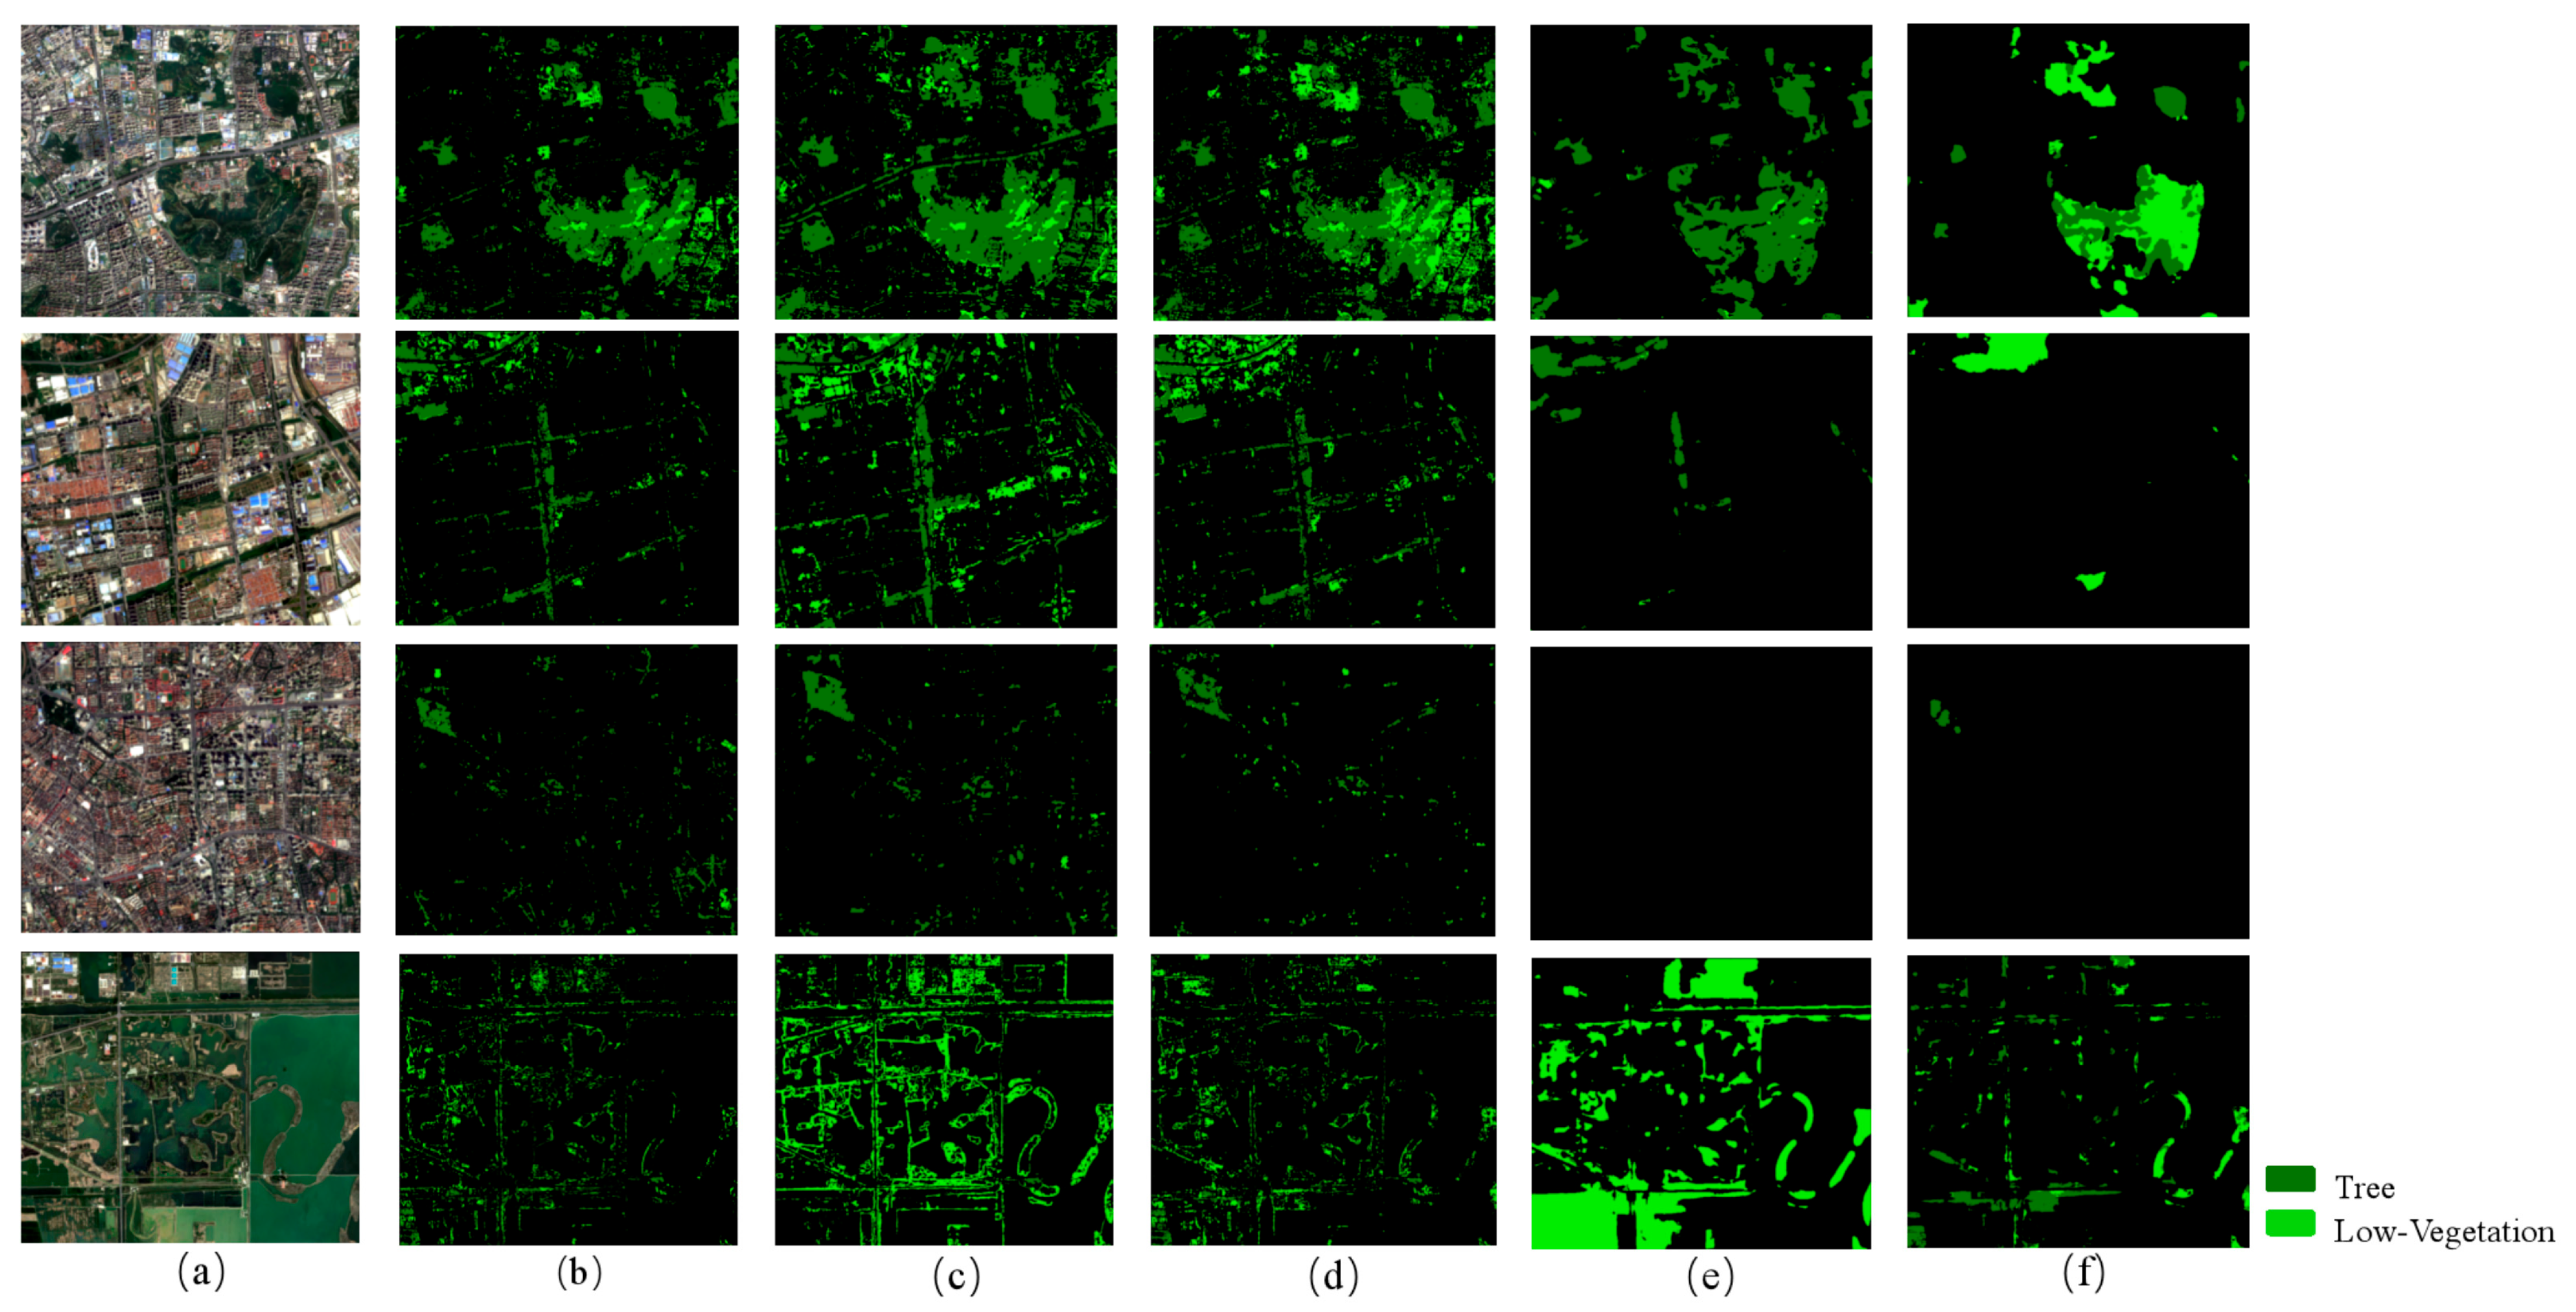
Qualitatively, as shown in Figure 10, by leveraging cross-product spatial consistency validation, the proposed method effectively neutralized the classification biases of individual datasets. Compared to existing products that suffer from spectral interference (causing boundary inflation) or semantic limitations (conflating trees and grass), our fused results achieved a fine-grained decoupling of “trees” and “low-vegetation” while preserving internal micro-textures like paved pathways. Despite the inherent 10-m mixed-pixel effect of the baseline imagery, the spatial connectivity and structural richness were substantially enhanced.
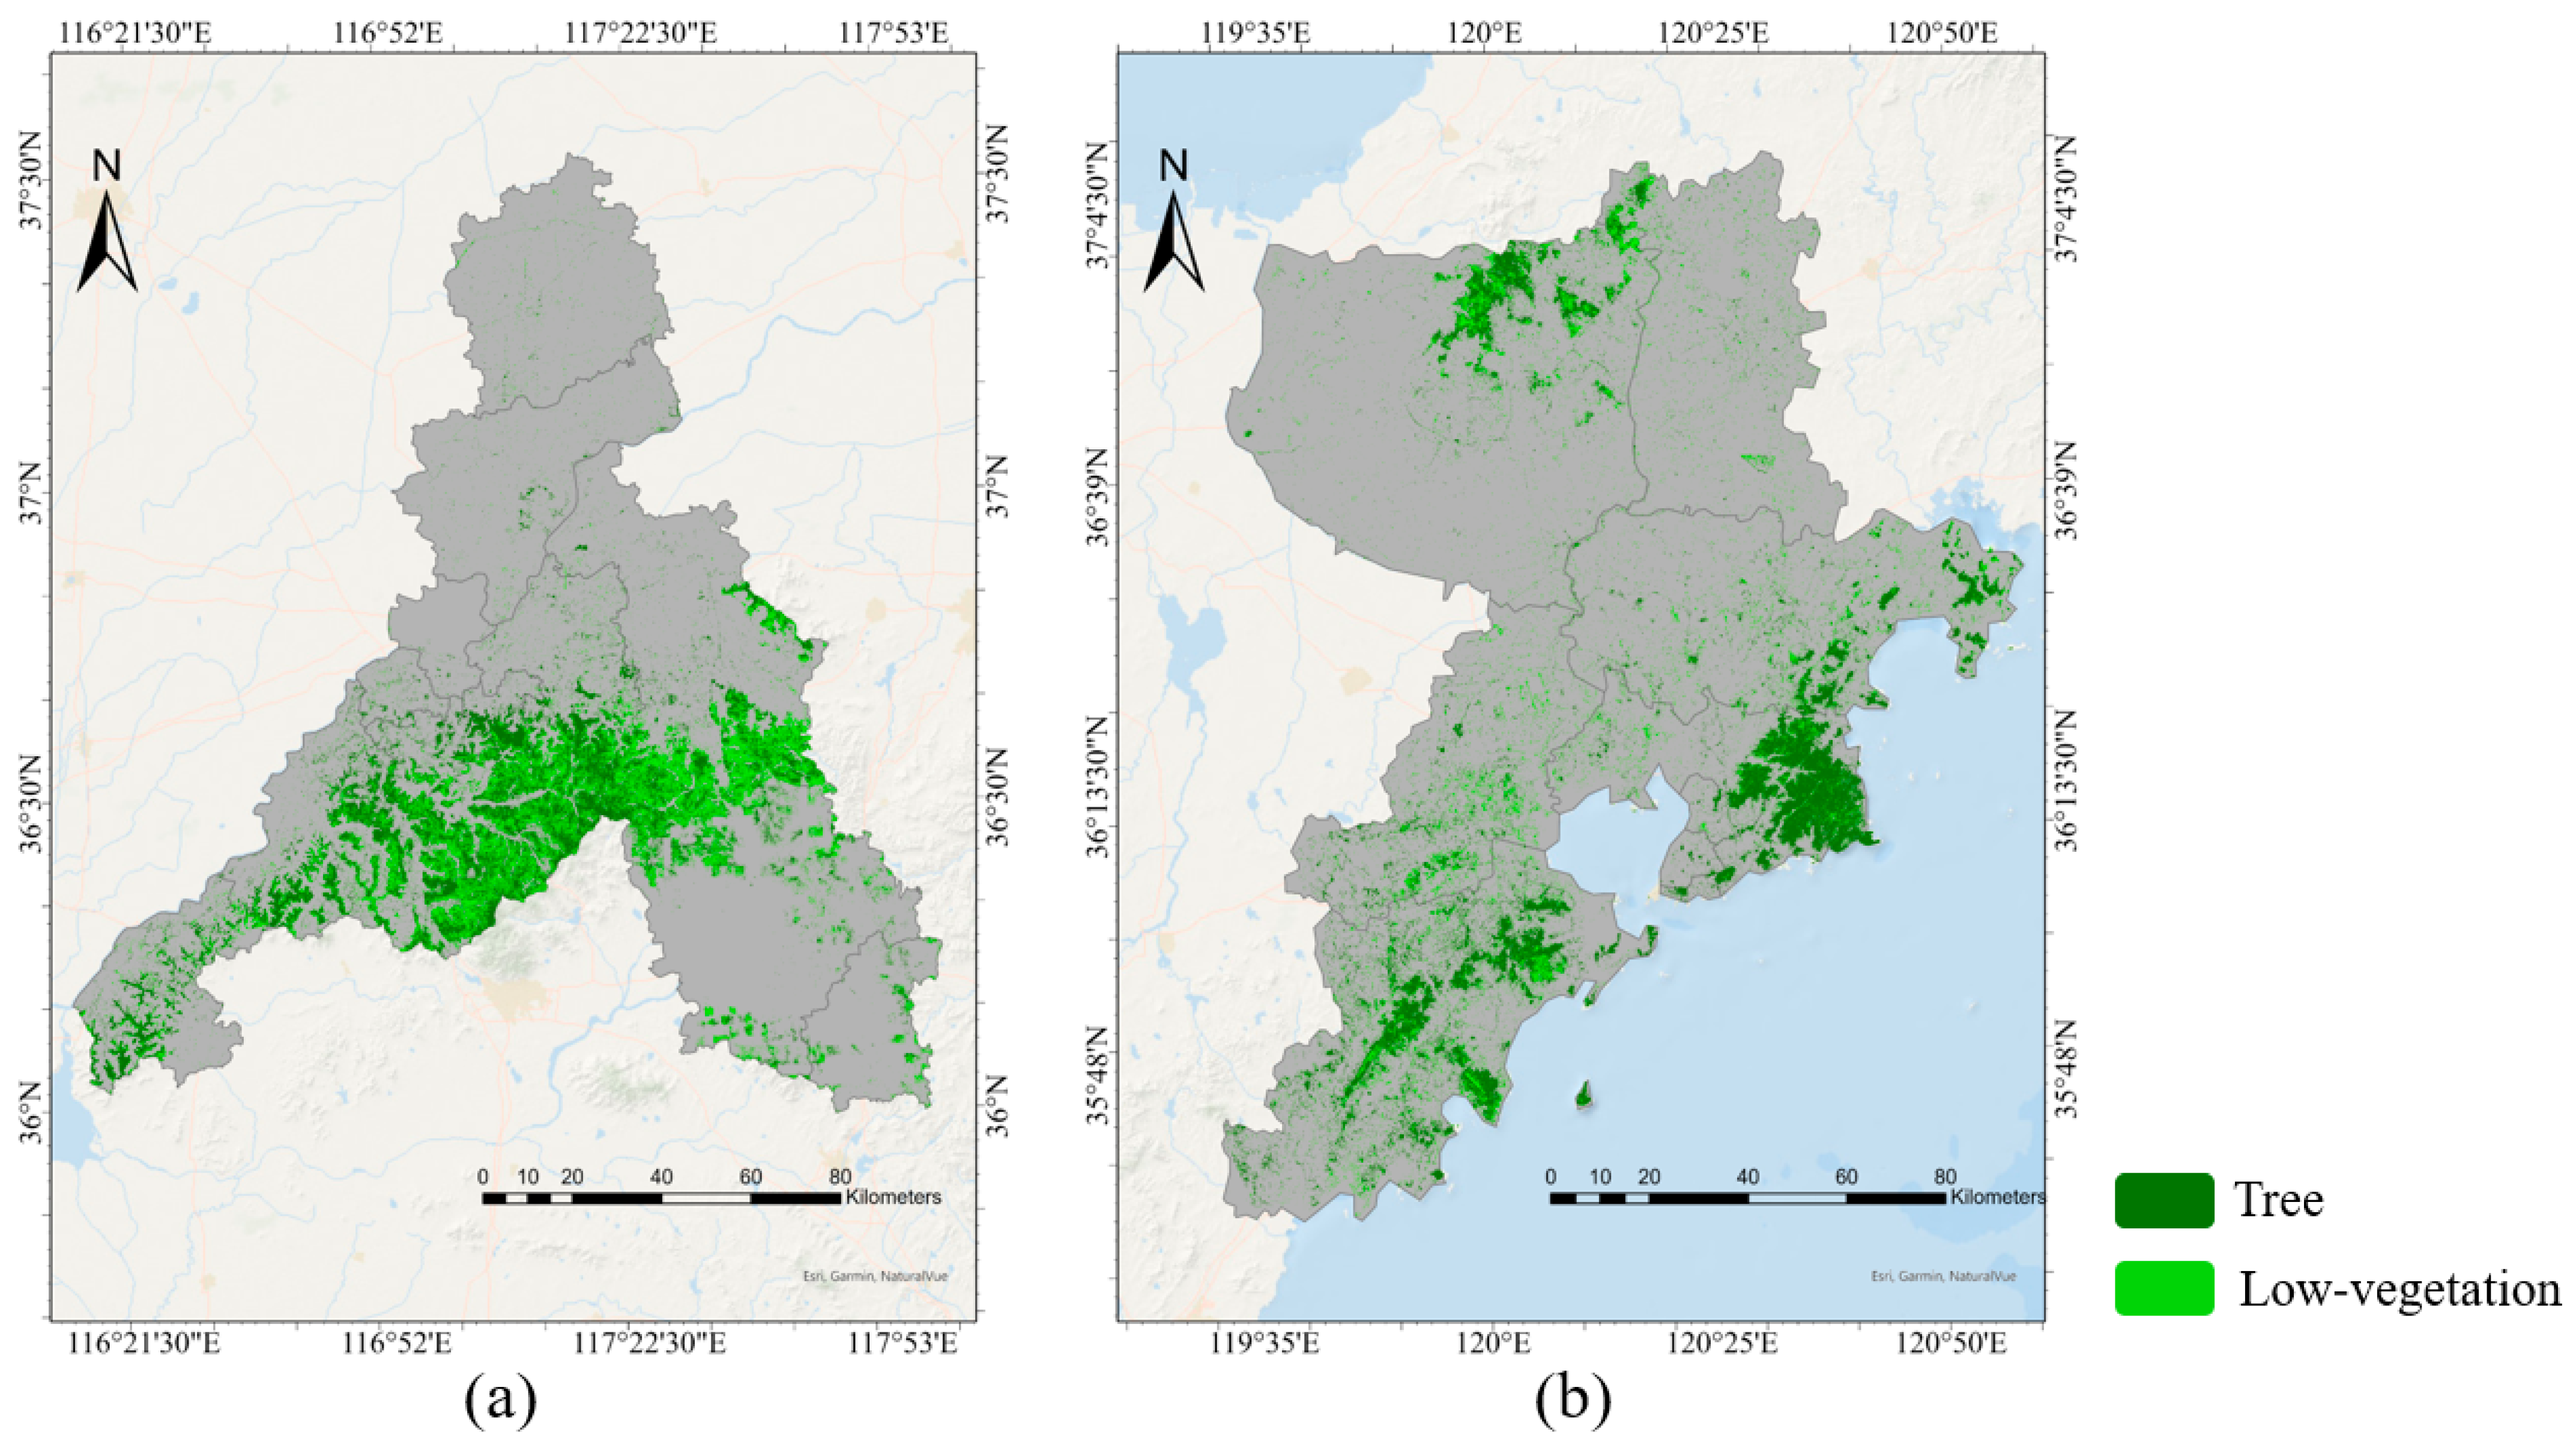
Leveraging this framework, we generated comprehensive physical green space basemaps for Jinan and Qingdao, as shown in Figure 11. Macroscopically, the spatial patterns reflect their divergent natural topographies: Jinan exhibits a highly asymmetrical “dense-south, sparse-north” distribution, while Qingdao’s tree resources cluster along its intertwined “mountain-sea-city” landscape. These high-fidelity physical basemaps provide a highly precise spatial carrier for the subsequent multi-dimensional coupling with urban functional zones.

4.3. Multi-Level Mapping Results of UGS

Leveraging the “physical–social” multi-dimensional coupling rules established in the preceding text, this study precisely projected high-resolution physical green spaces (comprising trees and low vegetation) onto 24 categories of urban social-functional spaces, thereby successfully generating comprehensive, multi-tiered, and finely classified basemaps of UGS for the entire territories of Jinan and Qingdao.

4.3.1. Spatial Pattern and Configuration of UGS

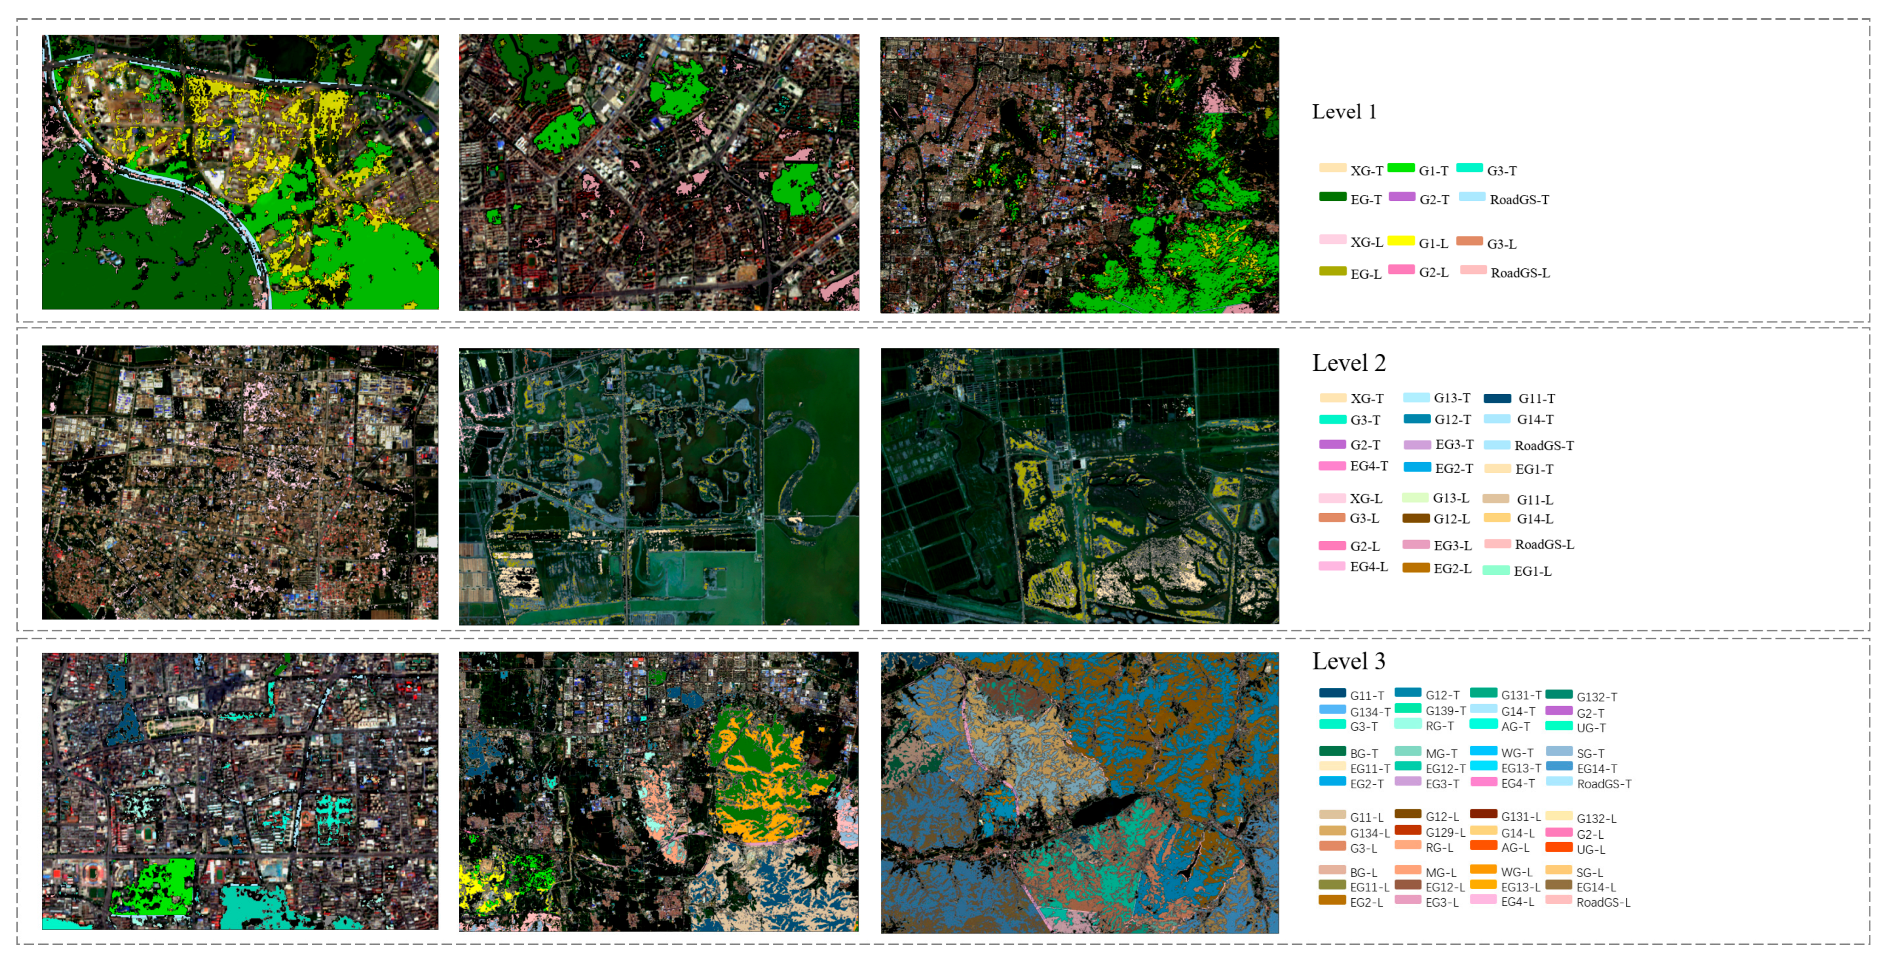
Strictly adhering to national standards, we mapped a nested UGS framework spanning three hierarchical levels (5 major, 11 intermediate, and 24 sub-categories), as shown in Figure 12. This multi-level mapping objectively elucidates the pronounced spatial heterogeneity in UGS allocation between the two cities. From Figure 12, we can find that at the macro-scale (Level 1 and Level 2), Jinan and Qingdao exhibit divergent spatial paradigms. Jinan’s regional green spaces (EG; e.g., ecological conservation EG2) are heavily agglomerated in its southern mountainous terrain, establishing a dominant scale advantage. Conversely, its high-density urban core is dominated by attached (XG) and protective green spaces (G2), manifesting as highly fragmented point-network distributions. In contrast, driven by its dual “mountain-sea” environment, Qingdao exhibits a more balanced configuration. Its scenic recreational spaces (EG1) and comprehensive parks (G11) form a “polycentric, networked” mosaic along coastlines and secondary inland mountains. Ultimately, these macro-level mappings inherently echo the specific topographical contexts and urbanization histories of both municipalities.

4.3.2. Results of Functional UGS

A major contribution of this study is the fine-grained mapping of Level-3 sub-categories (24 categories) within complex urban environments, as shown in Figure 13. While traditional remote sensing typically classifies urban vegetation as generic green space without capturing its social context, our semantic coupling framework successfully assigns highly reliable functional attributes to these spectral indistinguishable patches. In high-density mixed-use blocks, the model achieves an intricate decoupling of “attached green spaces” (XG). Spatially adjacent vegetation patches are rigorously partitioned into residential (RG), commercial (BG), public service (AG), and road facility (SG) green spaces. Furthermore, it accurately resolves the fine-grained boundaries of semantically confusable specialized parks, such as zoos (G131), botanical gardens (G132), and heritage parks (G134). Ultimately, this micro-scale anchoring of “pixel-level vegetation to object-level semantics” bridges the persistent technical gap between physical land cover and social functionality. Consequently, it provides a highly granular and multi-dimensional spatial foundation for micro-habitat evaluation and green space equity assessments.

5. Discussion

5.1. Fine-Grained Spatial Patterns and Geomorphological Constraints of Urban Functional Zones

Jinan and Qingdao exemplify two contrasting urban spatial paradigms shaped by the interaction between topographical constraints and strategic planning interventions. Jinan’s “latitudinal ribbon-like” morphology reflects a typical “urban–rural–mountain” structure, where urban expansion is strongly constrained by the southern mountainous watershed and the northern agricultural matrix. While this pattern has effectively preserved critical ecological corridors and reduced disorderly sprawl, it has also intensified east–west development polarization and fragmented the continuity of public green space within densely urbanized zones. In contrast, Qingdao exhibits a highly heterogeneous “Mountain–Sea–Bay–City” configuration characterized by circum-bay agglomeration and the strategic “Westward Shift and Northward Expansion” across coastal plains. Although this coastal-oriented expansion enhances economic connectivity and waterfront accessibility, it simultaneously increases pressure on fragile coastal ecosystems and reinforces spatial inequalities between newly developed districts and older urban cores. Despite these morphological differences, both cities attempt to maintain a dynamic socio-spatial equilibrium by integrating hierarchical green space systems with natural ecological barriers, such as the Tai Mountain foothills and the Laoshan Mountains. However, the results also suggest that current green space governance remains influenced by growth-oriented planning priorities, where ecological preservation and social accessibility are not always balanced across rapidly transforming urban landscapes.

5.2. Spatial Patterns and Topographic Constraints of Multi-Level UGS

At the macro scale, the hierarchical mapping results reveal distinct UGS distribution patterns under different topographical conditions. In Jinan, the southern ecological belt, composed of multi-level green spaces, demonstrates strong topographical continuity and confirms the framework’s capacity to capture mountain–urban ecological gradients. However, the severe fragmentation observed in the urban core exposes a critical socio-spatial imbalance: high-density development has continuously compressed public green spaces into isolated patches and linear riparian corridors. This pattern reflects a broader tendency in rapidly urbanizing flatland cities, where ecological functions are subordinated to land-development priorities, leading to the gradual erosion of green space connectivity and accessibility. In Qingdao, the interwoven “mountain–city” morphology exhibits a pronounced dependence on natural terrain, producing a more permeable integration between built-up areas and ecological landscapes. Yet this terrain-driven configuration also generates ambiguous functional transitions, particularly between residential green spaces and mountainous ecological zones, resulting in semantic “bleeding” across planning boundaries. Such heterogeneity challenges the assumptions of conventional zoning and buffer-based planning approaches, which often impose rigid spatial categories onto inherently fluid ecological systems. The results therefore suggest that UGS governance in topographically complex cities should shift from static land-use partitioning toward more adaptive and landscape-sensitive planning strategies.

5.3. Limitations and Future Perspectives

Despite the effectiveness of the proposed framework in capturing the spatial configurations of Jinan and Qingdao, several methodological limitations and uncertainty sources remain. Firstly, the quantitative–qualitative evaluation was limited to 310 representative parcels, and the proposed framework may therefore face challenges in more complex urban scenarios. A primary challenge arises from the semantic ambiguity inherent in POI data. Although the BERT-based semantic reconstruction substantially improves the interpretability of raw commercial tags, it cannot fully resolve the issue of “functional nesting” in mixed-use urban complexes. For instance, large commercial centers frequently integrate recreational, residential, and public service functions that are not explicitly differentiated within existing LBS datasets. Such semantic uncertainty reflects a broader limitation of crowd-sourced geospatial data when applied to statutory planning and fine-grained functional analysis.
In addition to socio-semantic uncertainty, the physical extraction pipeline is constrained by the limitations of two-dimensional remote sensing observations. While MSSANet effectively integrates optical features, the reliance on 2D imagery restricts its ability to capture the vertical structure of urban vegetation. In dense urban environments, building shadows and overlapping tree canopies often obscure understory vegetation, leading to omission errors in the identification of fragmented shrubs and grass patches within residential areas. This limitation highlights a persistent challenge in accurately resolving complex three-dimensional urban ecological structures using conventional Earth observation data.
Beyond these technical constraints, the framework also faces challenges regarding institutional and geographical generalizability. The semantic cross-mapping rules and the “function-first, vegetation-second” coupling paradigm were developed primarily in accordance with the Chinese National Standard (CJJ/T 85-2017) and localized LBS classification systems. Consequently, the applicability of the proposed framework to international urban contexts with different planning regulations, land-use ontologies, and POI ecosystems remains uncertain. This dependency on region-specific standards may limit the direct transferability of the framework and suggests the need for adaptive semantic reconstruction strategies in future cross-regional applications.

6. Conclusions

This study proposed a refined multi-level UGS classification framework that integrates physical vegetation characteristics with a social–functional basemap. This framework effectively addresses the longstanding disparity between remote sensing-based land-cover mapping and planning-oriented green-space management. The core contribution of this framework is the establishment of a “function-first, vegetation-second” paradigm, which combines the semantic reconstruction of functional information with high-precision physical vegetation extraction. In this framework, a BERT-based prior-knowledge injection strategy is first developed to convert the data into 21 semantic categories. Then, the OSM and GUB datasets are combined to extend the semantic category by a cross-mapping rule, and consequently, the urban area can be classified into 24 functional categories. Meanwhile, we develop a MSSANet architecture to extract the UGS in the physical layer. The coupling of the functional zones and vegetation extraction map produces a multi-level classification of UGS, including 5 major UGS categories, 11 intermediate UGS categories, and 24 fine-grained UGS sub-categories. The effectiveness of the proposed framework is substantiated not only by its quantitative performance but also by its consistent ability to capture distinct urban spatial patterns across diverse topographical contexts, as evidenced in Jinan and Qingdao. The results indicate that the framework can effectively characterize the interactions among ecological structure, urban morphology, and functional organization, providing a more comprehensive basis for refined UGS planning and governance.
Future research will focus on integrating multi-dimensional data sources to further improve the accuracy and applicability of the proposed framework. In particular, the incorporation of 3D structural data, such as airborne LiDAR, can improve the characterization of urban vegetation by mitigating the influence of canopy occlusion and improving the identification of understory vegetation. In addition, dynamic social sensing data, including mobile signaling and human mobility trajectories, can provide valuable insights into the actual utilization and accessibility of urban green spaces, thereby supplementing the static functional information derived from POI data. These developments will support the shift from conventional physical monitoring to more dynamic and human-centered UGS management and planning.

Author Contributions

Conceptualization, A.Z. and J.C.; methodology, A.Z., J.C. and X.S.; software, A.Z. and J.C.; validation, J.C. and W.Z.; formal analysis, A.Z. and X.S.; investigation, A.Z. and X.S.; resources, A.Z. and G.S.; data curation, A.Z., J.C. and W.Z.; writing—original draft preparation, A.Z., J.C. and W.Z.; writing—review and editing, G.S.; visualization, A.Z.; supervision, G.S.; project administration, A.Z. and G.S.; funding acquisition, A.Z. and G.S. All authors have read and agreed to the published version of the manuscript.

Funding

This research was funded by the National Natural Science Foundation of China (grant numbers: 42271347, 42371350, and 41971292), the Shandong Provincial Natural Science Foundation (grant numbers: ZR2024MD095 and ZR2024MD030), and the Key Laboratory of Natural Resources Monitoring in Tropical and Subtropical Area- of South China, Ministry of Natural Resources (grant number: 2024NRMK03).

Data Availability Statement

The multi-source land-cover products and GUB data can be obtained from the corresponding cited articles. The POI, OSM, semantic mapping rules, code, model parameters, validation samples, and processed outputs are available from the corresponding author on reasonable requests.

Acknowledgments

We thank the editors and anonymous reviewers for their comments and suggestions, which improved this paper.

Conflicts of Interest

The authors declare that they have no known competing financial interests or personal relationships that could have appeared to influence the work reported in this paper.

References

  1. Pinto, L.V.; Inácio, M.; Ferreira, C.S.S.; Ferreira, A.D.; Pereira, P. Ecosystem Services and Well-Being Dimensions Related to Urban Green Spaces—A Systematic Review. Sustain. Cities Soc. 2022, 85, 104072. [Google Scholar] [CrossRef]
  2. Paudel, S.; States, S.L. Urban Green Spaces and Sustainability: Exploring the Ecosystem Services and Disservices of Grassy Lawns versus Floral Meadows. Urban For. Urban Green. 2023, 84, 127932. [Google Scholar] [CrossRef]
  3. Zhou, W.; Yu, W.; Zhang, Z.; Cao, W.; Wu, T. How Can Urban Green Spaces Be Planned to Mitigate Urban Heat Island Effect under Different Climatic Backgrounds? A Threshold-Based Perspective. Sci. Total Environ. 2023, 890, 164422. [Google Scholar] [CrossRef] [PubMed]
  4. Sun, G.; Dong, Z.; Cai, M.; Guo, Y.; Chen, Y.; Chen, J. Differentiated Impacts of Urban Morphology on Land Surface Temperature across Local Climate Zones: Interaction and Seasonality. IEEE J. Sel. Top. Appl. Earth Obs. Remote Sens. 2025, 18, 26446–26462. [Google Scholar] [CrossRef]
  5. Astell-Burt, T.; Hartig, T.; Putra, I.G.N.E.; Walsan, R.; Dendup, T.; Feng, X. Green Space and Loneliness: A Systematic Review with Theoretical and Methodological Guidance for Future Research. Sci. Total Environ. 2022, 847, 157521. [Google Scholar] [CrossRef] [PubMed]
  6. Ma, Q.; Shi, F. New Urbanization and High-Quality Urban and Rural Development: Based on the Interactive Coupling Analysis of Industrial Green Transformation. Ecol. Indic. 2023, 156, 111044. [Google Scholar] [CrossRef]
  7. Jo, H.S.; Kim, C.H. Analyzing Changes in Park Accessibility and Spatial Inequality Due to Urban Renewal Projects and the Seoul Community Plan: A Case Study of the Ahyeon Community Zone. Cities 2026, 174, 107106. [Google Scholar] [CrossRef]
  8. Xu, S.; Li, J.; Gao, X.; Zhao, H.; Hu, J.; Yuan, S. Framework for Analyzing the Relationship between Supply, Demand, and Flow of Recreational Services in Urban Park Green Spaces. Ecol. Indic. 2024, 166, 112403. [Google Scholar] [CrossRef]
  9. Li, L.; Zheng, Y.; Ma, S. Links of Urban Green Space on Environmental Satisfaction: A Spatial and Temporarily Varying Approach. Env. Dev. Sustain. 2023, 25, 3469–3501. [Google Scholar] [CrossRef]
  10. Belaire, J.A.; Higgins, C.; Zoll, D.; Lieberknecht, K.; Bixler, R.P.; Neff, J.L.; Keitt, T.H.; Jha, S. Fine-Scale Monitoring and Mapping of Biodiversity and Ecosystem Services Reveals Multiple Synergies and Few Tradeoffs in Urban Green Space Management. Sci. Total Environ. 2022, 849, 157801. [Google Scholar] [CrossRef] [PubMed]
  11. Xiong, S.; Zhang, X.; Wang, H.; Lei, Y.; Tan, G.; Du, S. Mapping the First Dataset of Global Urban Land Uses with Sentinel-2 Imagery and POI Prompt. Remote Sens. Environ. 2025, 327, 114824. [Google Scholar] [CrossRef]
  12. Hu, Y.; Han, Y. Identification of Urban Functional Areas Based on POI Data: A Case Study of the Guangzhou Economic and Technological Development Zone. Sustainability 2019, 11, 1385. [Google Scholar] [CrossRef]
  13. Martinez, A.d.l.I.; Labib, S.M. Demystifying Normalized Difference Vegetation Index (NDVI) for Greenness Exposure Assessments and Policy Interventions in Urban Greening. Environ. Res. 2023, 220, 115155. [Google Scholar] [CrossRef] [PubMed]
  14. Kranjčić, N.; Medak, D.; Župan, R.; Rezo, M. Support Vector Machine Accuracy Assessment for Extracting Green Urban Areas in Towns. Remote Sens. 2019, 11, 655. [Google Scholar] [CrossRef]
  15. Lin, J.; Qiu, S.; Tan, X.; Zhuang, Y. Measuring the Relationship between Morphological Spatial Pattern of Green Space and Urban Heat Island Using Machine Learning Methods. Build. Environ. 2023, 228, 109910. [Google Scholar] [CrossRef]
  16. Pang, Q.; Yuan, Z.; Mi, X.; Yang, J.; Du, W.; Zhang, J.; Zhang, J.; Du, K.; Guo, Z. Vegetation Mapping in Heterogeneous Forest–Shrub–Grass Ecosystems Using Fused High-Resolution Optical and SAR Data. Remote Sens. 2026, 18, 1373. [Google Scholar] [CrossRef]
  17. Alavipanah, S.K.; Karimi Firozjaei, M.; Sedighi, A.; Fathololoumi, S.; Zare Naghadehi, S.; Saleh, S.; Naghdizadegan, M.; Gomeh, Z.; Arsanjani, J.J.; Makki, M.; et al. The Shadow Effect on Surface Biophysical Variables Derived from Remote Sensing: A Review. Land 2022, 11, 2025. [Google Scholar] [CrossRef]
  18. Wang, Q.; Peng, L.L.H.; Jiang, W.; Yin, S.; Feng, N.; Yao, L. Urban Form Affects the Cool Island Effect of Urban Greenery via Building Shadows. Build. Environ. 2024, 254, 111398. [Google Scholar] [CrossRef]
  19. Fikadu, G.; Olika, G. Impact of Land Use Land Cover Change Using Remote Sensing with Integration of Socio-Economic Data on Rural Livelihoods in the Nashe Watershed, Ethiopia. Heliyon 2023, 9, e13746. [Google Scholar] [CrossRef] [PubMed]
  20. Jia, Y.; Ge, Y.; Ling, F.; Guo, X.; Wang, J.; Wang, L.; Chen, Y.; Li, X. Urban Land Use Mapping by Combining Remote Sensing Imagery and Mobile Phone Positioning Data. Remote Sens. 2018, 10, 446. [Google Scholar] [CrossRef]
  21. CJJ/T 85-2017; Classification Standard of Urban Green Space. China Architecture & Building Press: Beijing, China, 2018.
  22. Peng, Y.; Qiu, H.; Wang, X. The Influence of Spatial Functions on the Public Space System of Traditional Settlements. Sustainability 2023, 15, 8632. [Google Scholar] [CrossRef]
  23. Liu, X.; He, J.; Yao, Y.; Zhang, J.; Liang, H.; Wang, H.; Hong, Y. Classifying Urban Land Use by Integrating Remote Sensing and Social Media Data. Int. J. Geogr. Inf. Sci. 2017, 31, 1675–1696. [Google Scholar] [CrossRef]
  24. Luo, G.; Ye, J.; Wang, J.; Wei, Y. Urban Functional Zone Classification Based on POI Data and Machine Learning. Sustainability 2023, 15, 4631. [Google Scholar] [CrossRef]
  25. Pan, C.; Wu, S.; Li, E.; Li, H.; Liu, X. Identification of Urban Functional Zones in Macau Peninsula Based on POI Data and Remote Information Sensors Technology for Sustainable Development. Phys. Chem. Earth Parts A/B/C 2023, 131, 103447. [Google Scholar] [CrossRef]
  26. Devlin, J.; Chang, M.-W.; Lee, K.; Toutanova, K. BERT: Pre-Training of Deep Bidirectional Transformers for Language Understanding. In Proceedings of the 2019 Conference of the North American Chapter of the Association for Computational Linguistics: Human Language Technologies; Volume 1 (Long and Short Papers); Burstein, J., Doran, C., Solorio, T., Eds.; Association for Computational Linguistics: Minneapolis, MN, USA, 2019; pp. 4171–4186. [Google Scholar]
  27. Minaee, S.; Kalchbrenner, N.; Cambria, E.; Nikzad, N.; Chenaghlu, M.; Gao, J. Deep Learning--Based Text Classification: A Comprehensive Review. ACM Comput. Surv. 2021, 54, 62:1–62:40. [Google Scholar] [CrossRef]
  28. Cao, S.; Zhao, X.; Du, S. Multi-Type and Fine-Grained Urban Green Space Function Mapping Based on BERT Model and Multi-Source Data Fusion. Int. J. Digit. Earth 2024, 17, 2308723. [Google Scholar] [CrossRef]
  29. Zhao, J.; Hao, X.; Yang, Y. Research on Urban Sustainability Indicators Based on Urban Grain: A Case Study in Jinan, China. Sustainability 2023, 15, 13320. [Google Scholar] [CrossRef]
  30. Zhang, M.; Rasiah, R. Qingdao. Cities 2013, 31, 591–600. [Google Scholar] [CrossRef]
  31. Li, X.; Gong, P.; Zhou, Y.; Wang, J.; Bai, Y.; Chen, B.; Hu, T.; Xiao, Y.; Xu, B.; Yang, J. Mapping Global Urban Boundaries from the Global Artificial Impervious Area (GAIA) Data. Environ. Res. Lett. 2020, 15, 094044. [Google Scholar] [CrossRef]
  32. Zanaga, D.; Van De Kerchove, R.; De Keersmaecker, W.; Souverijns, N.; Brockmann, C.; Quast, R.; Wevers, J.; Grosu, A.; Paccini, A.; Vergnaud, S.; et al. ESA WorldCover 10 m 2020 V100 2021; Zenodo: Geneva, Switzerland, 2021. [Google Scholar]
  33. Brown, C.F.; Brumby, S.P.; Guzder-Williams, B.; Birch, T.; Hyde, S.B.; Mazzariello, J.; Czerwinski, W.; Pasquarella, V.J.; Haertel, R.; Ilyushchenko, S. Dynamic World, Near Real-Time Global 10 m Land Use Land Cover Mapping. Sci. Data 2022, 9, 251. [Google Scholar] [CrossRef]
  34. Karra, K.; Kontgis, C.; Statman-Weil, Z.; Mazzariello, J.C.; Mathis, M.; Brumby, S.P. Global Land Use/Land Cover with Sentinel 2 and Deep Learning. In Proceedings of the 2021 IEEE International Geoscience and Remote Sensing Symposium IGARSS; IEEE: Washington, DC, USA, 2021; pp. 4704–4707. [Google Scholar]
  35. Zhang, X.; Liu, L.; Zhao, T.; Zhang, W.; Guan, L.; Bai, M.; Chen, X. GLC_FCS10: A Global 10-m Land-Cover Dataset with a Fine Classification System from Sentinel-1 and Sentinel-2 Time-Series Data in Google Earth Engine. Earth Syst. Sci. Data Discuss. 2025, 17, 4039–4062. [Google Scholar] [CrossRef]
  36. Cao, J.; Li, Y.; Sun, M.; Chen, Y.; Lischinski, D.; Cohen-Or, D.; Chen, B.; Tu, C. DO-Conv: Depthwise Over-Parameterized Convolutional Layer. IEEE Trans. Image Process. 2022, 31, 3726–3736. [Google Scholar] [CrossRef] [PubMed]
  37. Chen, L.-C.; Zhu, Y.; Papandreou, G.; Schroff, F.; Adam, H. Encoder-Decoder with Atrous Separable Convolution for Semantic Image Segmentation. In European Conference on Computer Vision (ECCV); Springer: Berlin/Heidelberg, Germany, 2018; pp. 801–818. [Google Scholar]
  38. Dosovitskiy, A.; Beyer, L.; Kolesnikov, A.; Weissenborn, D.; Zhai, X.; Unterthiner, T.; Dehghani, M.; Minderer, M.; Heigold, G.; Gelly, S.; et al. An Image Is Worth 16x16 Words: Transformers for Image Recognition at Scale. arXiv 2020, arXiv:2010.11929. [Google Scholar]
Figure 1. Study Area. (a) Jinan; (b) Qingdao.
Remotesensing 18 02192 g001
Figure 2. Flowchart for the Multi-level Classification of Urban Green Spaces.
Remotesensing 18 02192 g002
Figure 3. Workflow of POI semantic reconstruction.
Remotesensing 18 02192 g003
Figure 4. Workflow of the BERT Model.
Remotesensing 18 02192 g004
Figure 5. MSSANet Structure.
Remotesensing 18 02192 g005
Figure 6. MSSF-Encoder Structure.
Remotesensing 18 02192 g006
Figure 7. Feature Dynamic Aggregation Indicator Module.
Remotesensing 18 02192 g007
Figure 8. Results map of fine classification of function zones. (a) Jinan; (b) Qingdao.
Remotesensing 18 02192 g008
Figure 9. Confusion matrix of the fine-grained urban functional zone classification results.
Remotesensing 18 02192 g009
Figure 10. Detailed comparison with some existing datasets. (a) Sentinel image; (b) MSSANet; (c) ESA WorldCover; (d) GLC_FCS10; (e) Dynamic World; (f) Esri Land Cover.
Remotesensing 18 02192 g010
Figure 11. UGS Classification Results. (a) Jinan; (b) Qingdao.
Remotesensing 18 02192 g011
Figure 12. The multi-level UGS map. (a) Jinan; (b) Qingdao. (c) Legend for each level.
Remotesensing 18 02192 g012
Figure 13. Visualization results of local multi-level UGS.
Remotesensing 18 02192 g013
Table 1. Representative examples of semantic mapping from raw POI categories to target planning categories.
Raw POI Category
(Native LBS Label)
POI Name
(Semantic Content)
Target Planning Category (CJJ/T 85-2017)
Shandong CuisineChengnan RestaurantCommercial
General HospitalQilu Hospital
Jianlian TCM Clinic
Public Service
CommunityLuneng Lingxiu City
SDNU Dormitory
Residential
ParkBaotu Spring ParkComprehensive Park
FactorySinotruk FactoryIndustrial
TransportationJinan West Railway Station
Jingshi Road Bus Stop
Transportation Facility
World HeritageMount Tai AreaScenic Area
ZooJinan ZooZoo
UniversityUPCPublic Service
Logistics; ExpressSF Express CenterLogistics and Warehouse
Table 2. Multi-level UGS rules.
Level 1Level 2Level 3
Park Green Space (G1)Comprehensive Park (G11)Comprehensive Park (G11)
Community Park (G12)Community Park (G12)
Specialized Park (G13)Zoo (G131)
Botanical Garden (G132)
Heritage Park (G134)
Other Parks (G139)
Pocket Park (G14)Pocket Park (G14)
Protective Green Space (G2)Protective Green Space (G2)Protective Green Space (G2)
Square Green Space (G3)Square Green Space (G3)Square Green Space (G3)
Attached Green Space (XG)Attached Green Space (XG)Residential (RG)
Public Service (AG)
Commercial (BG)
Industrial (MG)
Logistics and Warehouse (WG)
Transportation Facility (SG)
Public Utility (UG)
Regional Green Space (EG)Scenic Recreational Green Space (EG1)Scenic Area (EG11)
Forest Park (EG12)
Wetland Park (EG13)
Country Park (EG14)
Ecological Conservation Green Space (EG2)Ecological Protection Green Space (EG2)
Regional Protective Green Space (EG3)Regional Protective Green Space (EG3)
Production Green Space (EG4)Production Green Space (EG4)
Road Green Space (RoadGS)
Table 3. Classification results of 20 semantic categories using the POI-based BERT model.
LabelPredictionRecallF1-Score
G110.8480.8720.861
G120.9030.8400.873
G1310.8820.9740.926
G1320.9790.9690.974
G1340.9460.9790.962
G140.8660.8390.852
G30.8590.8390.849
RG0.8370.8450.841
AG0.9120.9600.935
BG0.8680.9020.885
MG0.8370.8560.846
WG0.8670.9500.907
SG0.8320.8510.842
UG0.8730.8440.858
EG110.8600.8900.875
EG120.8650.8600.863
EG130.8310.9710.895
EG140.8780.8440.861
EG20.9320.9730.952
EG40.8720.9130.901
Table 4. Results of the functional zones.
LabelPA (%)UA (%)Sample Size
G11100.090.519.0
G1292.392.313.0
G13491.7100.012.0
G13994.1100.017.0
G3100.0100.011.0
RG95.795.723.0
BG94.794.719.0
MG95.595.522.0
EG1190.9100.011.0
EG1287.5100.08.0
EG2100.093.314.0
G13290.075.010.0
G13171.483.37.0
G2100.0100.012.0
EG3100.0100.010.0
G14100.077.87.0
UG100.0100.012.0
AG89.594.419.0
SG83.388.218.0
WG100.0100.013.0
EG14100.083.310.0
EG1385.785.77.0
EG487.5100.016.0
RoadGS100.0100.0/
OA = 92.9%    κ = 0.861
Table 5. Visualization results for selected functional zones.
Land-Use TypeClassification ResultGoogle Earth MapRemarks
BGRemotesensing 18 02192 i001Remotesensing 18 02192 i002
WGRemotesensing 18 02192 i003Remotesensing 18 02192 i004
G12
AG
Remotesensing 18 02192 i005Remotesensing 18 02192 i006Jianlian Traditional Chinese Medicine Clinic
EG14Remotesensing 18 02192 i007Remotesensing 18 02192 i008Qingdao West Coast Sightseeing Eco-Park
G3
RG
UG
Remotesensing 18 02192 i009Remotesensing 18 02192 i010
MGRemotesensing 18 02192 i011Remotesensing 18 02192 i012
EG4Remotesensing 18 02192 i013Remotesensing 18 02192 i014
Table 6. Experimental Results Compared with Other Products.
DatasetsOverall ResultPA (%)
OA (%)KappaTreeLow-Vegetation
ViT73.60.52995.437.7
HRNet77.50.58284.550.1
SegNet78.70.59792.752.8
PSPNet78.80.60586.253.4
Deeplabv3+83.50.67890.360.2
SegFormer83.90.68295.851.7
Esri Land Cover84.30.69392.463.3
Dynamic World86.50.73193.365.2
GLC_FCS91.20.81690.370.1
ESA WorldCover91.60.82189.271.3
MSSANet93.20.85394.176.5
Disclaimer/Publisher’s Note: The statements, opinions and data contained in all publications are solely those of the individual author(s) and contributor(s) and not of MDPI and/or the editor(s). MDPI and/or the editor(s) disclaim responsibility for any injury to people or property resulting from any ideas, methods, instructions or products referred to in the content.