


Highlights
What are the main findings?
- Northeast China’s monthly mean total ozone column (TOC) is 25 DU higher than the zonal mean and reaches its annual extremes earlier than NH mid-latitudes.
- A distinct NE–SW TOC gradient is found in winter–spring. The regional TOC is strongly correlated with the lower-stratospheric and surface ozone (r ≥ 0.8). The Longfengshan dataset matches the MSR-2 dataset well.
What are the implications of the main findings?
- Northeast China is a transition zone, where winter–spring TOC field is formed due to QSW pattern and BDC-associated transport.
- The identified regional patterns and variability of TOC improve East Asian mid-latitude ozone research. Validated Longfengshan data are a reliable regional TOC proxy.
Abstract
Based on the Multi-Sensor Reanalysis Version 2 (MSR-2) and ERA5 datasets, variations in monthly mean total ozone column (TOC) over Northeast China (40–53°N, 115–135°E) from 2015 to 2024 are analyzed. Local ground-based observations at the regional WMO/GAW Longfengshan Station are also used. The aim is to investigate regional seasonality in TOC pattern and the relationship between TOC and ozone concentration and air temperature in the stratosphere and at the surface. No statistically significant linear trend was found for TOC; however, the annual mean TOC in the study region exceeds the zonal mean TOC by 25 DU (7.4%), and the annual maximum in February and minimum in August are observed one and two months earlier, respectively, than in the Northern Hemisphere mid-latitudes. A climatological decrease in TOC from the northeastern (~415 DU) to southwestern (~330 DU) parts of Northeast China was found. We also found a strong correlation, approaching |r| = 0.8–0.9, between TOC and ozone concentration (positive) and temperature (negative) at the surface. The time series from Longfengshan Station for 2015–2022 closely match the MSR-2 data averaged over Northeast China: the monthly mean difference varies within ±15 DU (±4.2%), validating the reliability of the station data as a representative proxy for regional TOC variability. The role of the Brewer–Dobson circulation, quasi-stationary waves, and the Northeast China cold vortex in the detected patterns and quantitative associations of TOC is discussed. The findings of this work can be applied to analyze the ozone observations, TOC variability, and stratosphere–troposphere coupling in East Asia.
1. Introduction
Ozone is a critical component of Earth’s atmosphere, functioning as a natural barrier that efficiently absorbs harmful solar shortwave ultraviolet radiation (UV-B, 280–315 nm) [1]. Its variations directly regulate global climate systems, atmospheric circulation, and ecological balance, while profoundly impacting human health; excessive UV exposure is linked to increased risks of skin cancer and cataracts [2,3].
The Brewer–Dobson circulation (BDC) is a quasi-steady meridional circulation centered in the stratosphere. It drives ascent in the tropical lower stratosphere, poleward transport, and descent in the extratropical stratosphere, shaping the distribution of stratospheric tracers such as ozone and water vapor [4]. Not radiatively driven, it relies on angular momentum from dissipating tropospheric waves, including Rossby and gravity waves. Synoptic-scale Rossby waves dissipate in the subtropical lower stratosphere while planetary-scale ones dissipate in the winter polar vortex periphery. Both drive poleward flow via negative drag [4]. The intensification of BDC peaks in the Northern Hemisphere (NH) winter months of December, January, and February (DJF) is linked to stronger subtropical jet and wave drag changes. In contrast, during the summer months of June, July and August (JJA), weaker wave activity and BDC are observed due to a change in the zonal wind in the stratosphere from westerly to easterly [4,5,6]. If BDC-driven transport generates winter–spring ozone maximum, then strong solar radiation in summer intensifies NOx-catalytic cycle of stratospheric ozone destruction and intense photochemical reactions reduce ozone content, resulting in a net decrease in TOC to its annual minimum [4,6].
Geographically, ozone exhibits distinct latitudinal variations: near the equator, TOC is the lowest, with the vertical ozone peak occurring at ~25 km [7]. Total ozone reaches the highest level in the polar region, while both total ozone and vertical structure in mid-latitudes fall between those of the equatorial and polar regions with the peak ozone altitude at ~20 km [7,8]. Driving part of this distribution is the hemispheric BDC, which transports stratospheric ozone from its tropical source to the extratropics [9].
Tropical TOC variations exhibit distinct temporal phases, with TOC showing a strong negative trend before 1998 and an insignificant trend after 1998 [10]; mid-latitude TOC continued to decline until around 2000 [7], and high-latitude TOC is regulated by teleconnection and climatic indices and decreased till about 2016 [11].
Since the discovery of the Antarctic ozone hole in 1985, ozone depletion and recovery have remained a core focus of the global environmental community [12]. In the late 20th century, widespread emissions of ozone-depleting substances (ODSs) such as CFCs caused significant global ozone layer thinning [8,13,14]. However, the global implementation of the Montreal Protocol and its amendments has effectively curbed ODS emissions, driving a gradual recovery of stratospheric ozone in mid-latitudes worldwide since the early 21st century [15,16,17]. Arctic springtime ozone depletion continues to weaken, with declining halogenated ozone-depleting substances (hODSs) and Arctic ozone shows a trend toward future recovery in models [18]. Overall, recent observations indicate a recovery of the ozone layer in both the Northern and Southern Hemispheres [19,20].
Global-scale stratospheric ozone research has laid a solid foundation for understanding macro patterns and core driving mechanisms. The slowing of the NH ozone depletion after 1998 significantly reduced the stratospheric cooling rate, highlighting the climate feedback effects of ozone changes [21]. Ozone variations regulate planetary wave activity and exert differential impacts on polar vortex intensity across the Northern and Southern Hemispheres [22,23]. Notably, global ozone recovery exhibits substantial regional and seasonal variety [24]. TOC in East Asia showed an upward trend of ~1% per decade from 1997 to 2017 [25], and ozone levels in the lower troposphere also continued to increase from 2002 by 3–7 ppb per decade [26].
Rossby Wave Breaking (RWB) is a core process driving stratosphere–troposphere exchange in the NH, with significant differences in transport efficiency between RWB types [27]. Intense cutoff low events over East Asia trigger deep stratospheric intrusion via tropopause folding, elevating tropospheric ozone concentrations [28]. Subsequent studies further refined this understanding by linking RWB, the Northeast (NE) China cold vortex, and stratosphere-to-troposphere transport to surface ozone increases in eastern China [29,30].
The stratospheric polar vortex strength and shifts regulate stratospheric ozone changes through a “dynamic + chemical” dual mechanism [31,32], and Eurasia may be one of the regions with the latest ozone recovery in the NH due to combined effects of ODS emission reduction and climate system changes [32]. The dynamic changes in the Arctic polar vortex affect mid- to high-latitude ozone distribution, but its specific role in Eurasian ozone loss remains unclear [32]. Under the high-emission scenario, future climate warming will alter stratosphere–troposphere ozone transport and tropospheric ozone lifetime, with upper tropospheric ozone showing significant increases and the stratospheric contribution to tropospheric ozone further enhancing [33].
On a national scale, the TOC trend in China shows distinct temporal cycles and spatial patterns, and it is significantly correlated with anthropogenic emissions [34]. However, existing research on ozone in NE China has obvious gaps: most studies either focus on surface ozone, or cover only short-term periods, or analyze individual events [35,36,37,38], failing to address the critical 2015–2024 decade—a pivotal phase for global ozone recovery. As a key mid-high latitude region sensitive to polar vortex dynamics and stratosphere–troposphere exchange processes, the long-term trend, seasonal characteristics, consistency with mid-latitude patterns, and key driving factors of the total ozone column in NE China remain insufficiently resolved [39]. This gap hinders a comprehensive understanding of regional ozone recovery dynamics and the linkages between large-scale climate processes and local ozone variability.
This study focuses on the TOC changes over NE China (40–53°N, 115–135°E), where the effects of atmospheric circulation inherent in the East Asian region are observed [24,28,32]. Using the 2015–2024 Multi-Sensor Reanalysis Version 2 (MSR-2) [40] and ERA5 [41] dataset, we aim to clarify the study region’s TOC characteristics compared to the mid-latitude zone 40–53°N, which lies between the high and low TOC in polar and subtropical latitudes [42], and to provide baseline data for East Asian mid-latitude ozone dynamics. Section 2 describes the dataset, study area, and analytical methods; Section 3 presents the key results of TOC variations; Section 4 provides a discussion; and Section 5 draws conclusions from the study.
2. Materials and Methods
2.1. Study Area
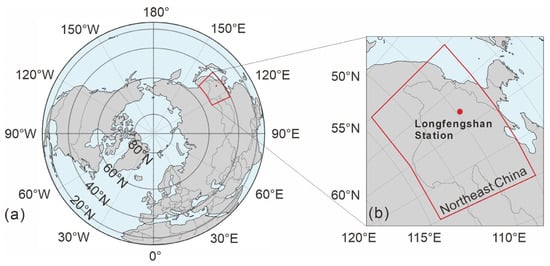
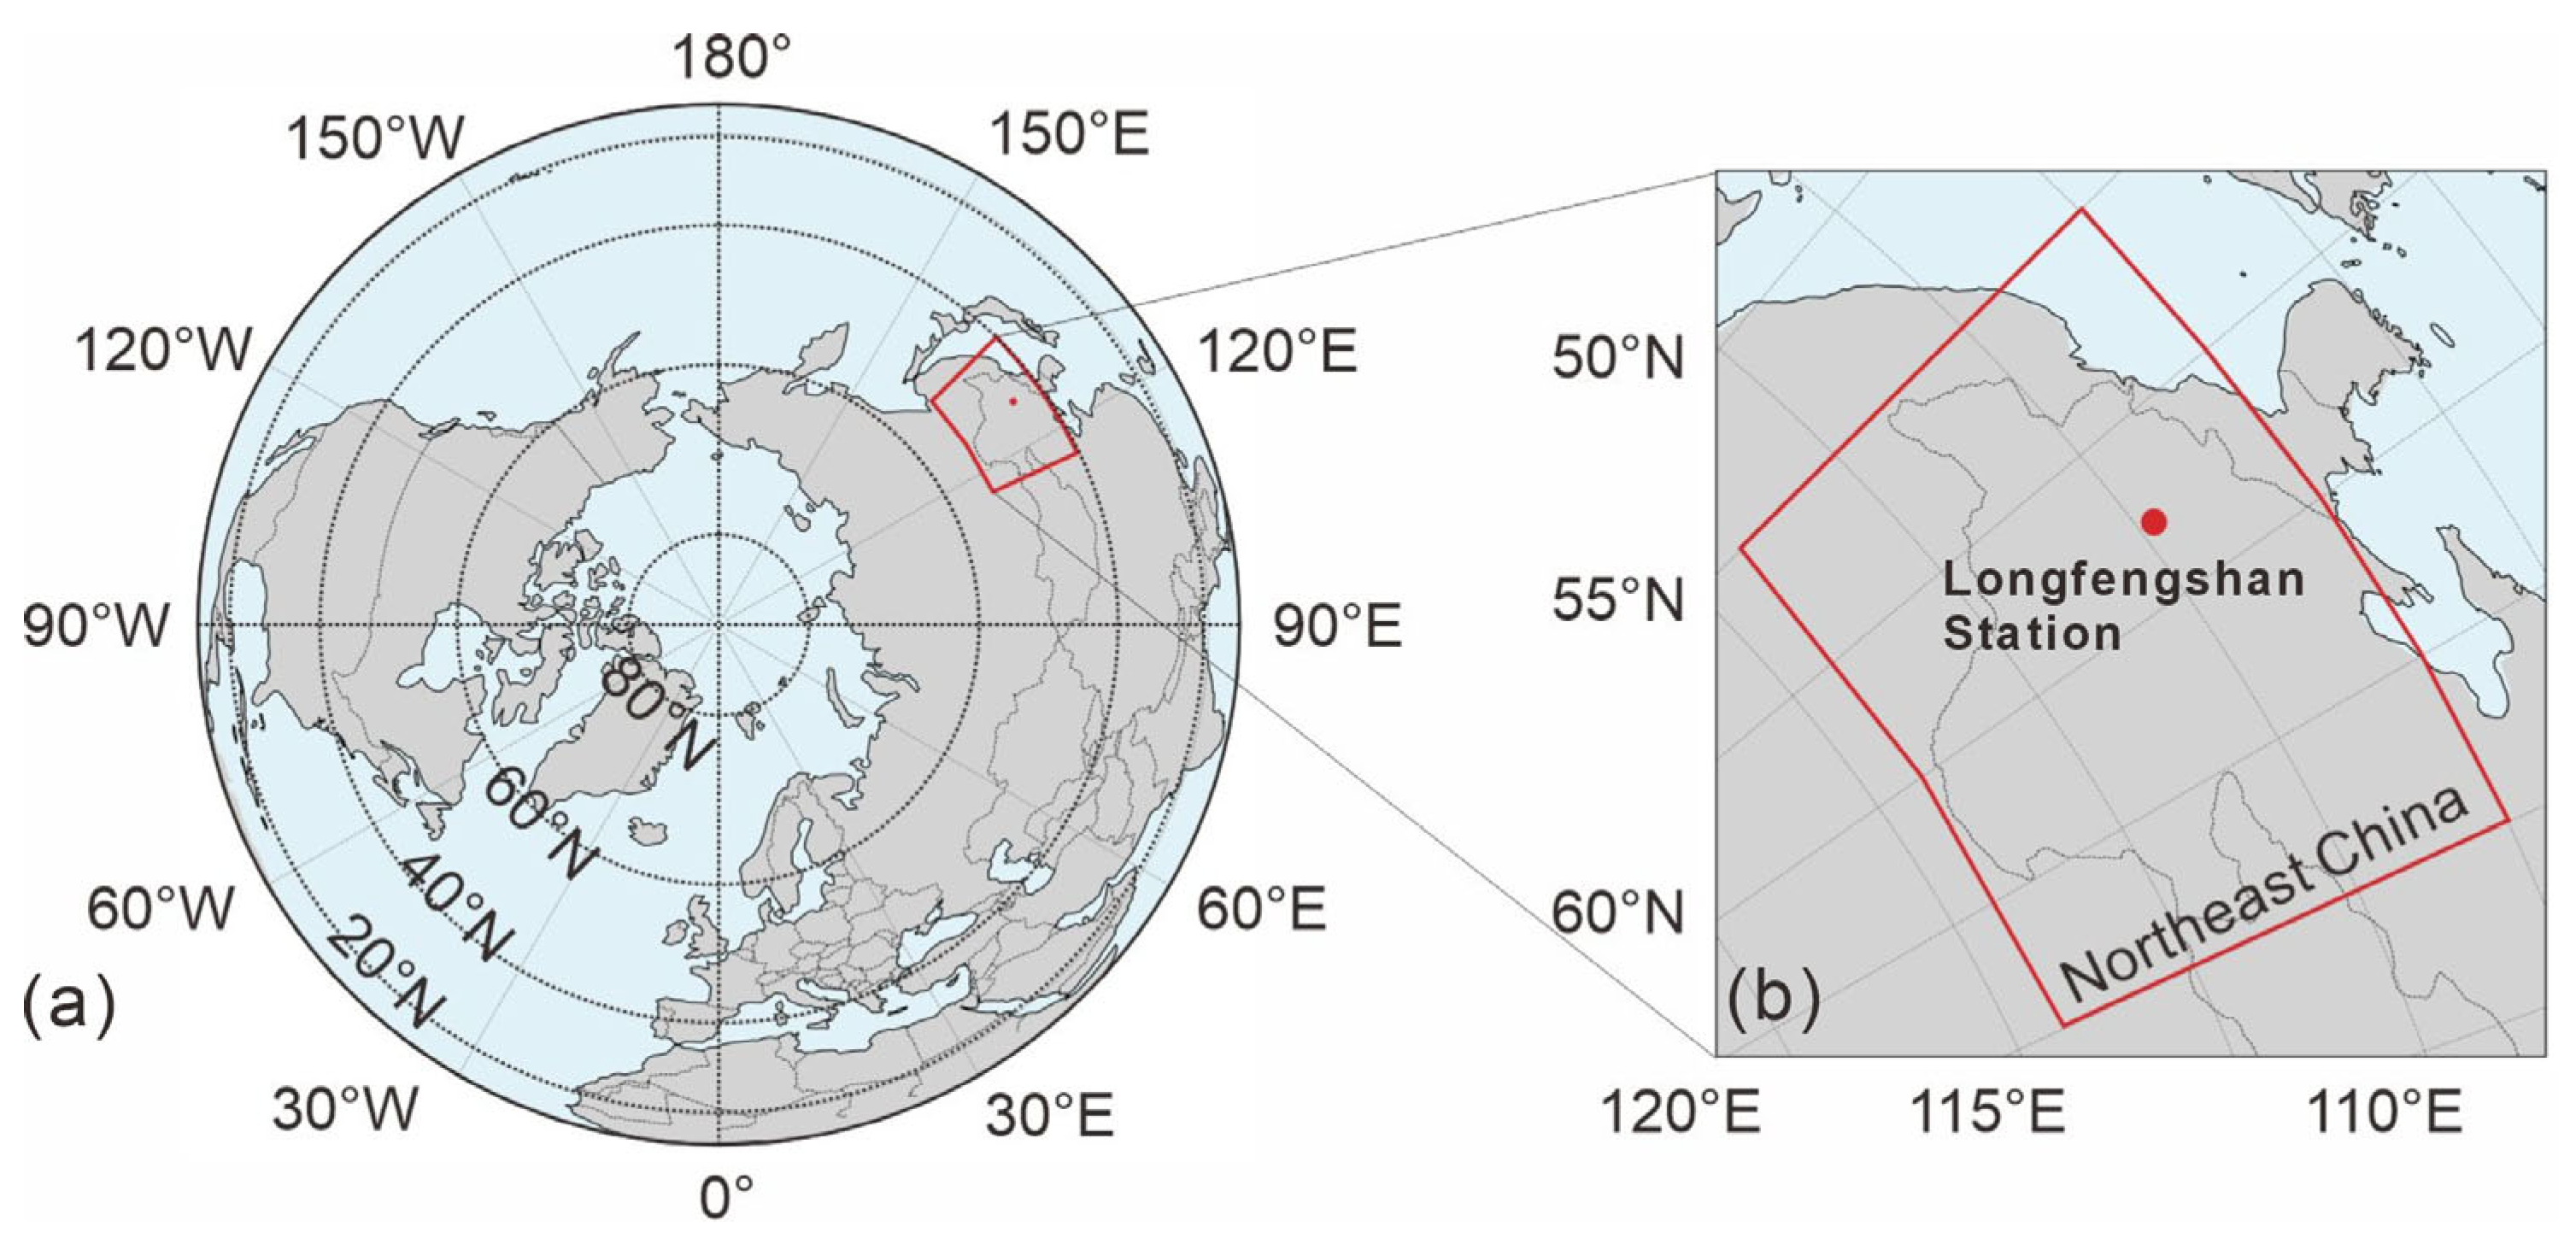
The study area covers the Northeast (NE) China domain, defined by the latitude range 40–53°N and longitude range 115–135°E, as shown in Figure 1. This region includes three provincial administrative regions (Liaoning, Jilin, and Heilongjiang) and parts of the Inner Mongolia Autonomous Region. Topographically, it features diverse landscapes, including plains, mountains, and plateaus, with an average elevation ranging from 50 to 1500 m above sea level. Climatologically, the region features a temperate continental monsoon climate, with cold, dry winters and warm, humid summers. The distinct seasonal climate may influence stratospheric–tropospheric exchange processes and, in turn, indirectly affect TOC distribution.
Figure 1.
Map of the research area in the Northeast China domain (40–53°N, 115–135°E); (a) global view, (b) Northeast China domain, the red dot represents the Longfengshan Station (44.7°N, 127.6°E).
2.2. Data Source
This study adopts the Multi-Sensor Reanalysis Version 2 (MSR-2) as the main dataset [40], available at https://www.temis.nl/protocols/o3field/o3mean_msr2.php, accessed on 31 May 2026. Developed by the Royal Netherlands Meteorological Institute (KNMI), this global total ozone column (TOC) reanalysis product, expressed in Dobson Units (DUs), is specially tailored for analyzing long-term ozone trends. Spanning from 1970 to the present, MSR-2 combines measurements from numerous satellite sensors and ground stations via optimal interpolation. Its primary input sources comprise total ozone retrievals from GOME (1995–2003), SCIAMACHY (2002–2012), OMI (2004–2021), TROPOMI (2017–present) and GOME-2A/B. Additionally, observational records from over 150 ground-based Brewer and Dobson stations worldwide are employed for bias correction and cross-validation ([40], https://www.temis.nl/protocols/o3field/o3mean_msr2.php, accessed on 31 May 2026).
The development of MSR-2 consists of three major steps: first, radiometric calibration and cloud filtering for data from individual sensors; second, bias correction against climatological background fields to remove inter-sensor systematic deviations; third, optimal interpolation on a 0.5° × 0.5° grid to produce monthly mean datasets. The monthly mean MSR-2 data covering 2015–2024 (time series length of N = 120) used in this research have been fully quality-controlled, and are reliable for investigating regional ozone variations.
Time–pressure profiles of ozone concentration and temperature in this study are derived from ERA5 reanalysis data (https://cds.climate.copernicus.eu/datasets/reanalysis-era5-pressure-levels?tab=overview, accessed on 7 February 2026). Developed by the European Centre for Medium-Range Weather Forecasts (ECMWF), ERA5 is a popular global atmospheric reanalysis product featuring a horizontal resolution of 0.25° × 0.25°, equivalent to roughly 31 km × 31 km at the equator [41]. It comprises 37 standard pressure levels spanning from 1000 hPa near the surface to 1 hPa in the upper stratosphere. The ozone fields within ERA5 are produced via a combined framework of model simulation and satellite data assimilation based on the Integrated Forecast System (IFS) Cycle 41r2, which is equipped with a full chemical transport module covering both the stratosphere and troposphere. This framework explicitly depicts stratospheric ozone photochemical generation and depletion associated with key chemical families including Ox, NOx, ClOx and BrOx, and adopts parameterized dry deposition and photochemical processes to describe tropospheric ozone. A semi-Lagrangian advection scheme is applied to precisely reproduce the meridional and vertical transport of ozone modulated by large-scale circulations like BDC. Meanwhile, its four-dimensional variational (4D-Var) assimilation system ingests ozone profile measurements from satellites such as Aura MLS (https://mls.jpl.nasa.gov/eos-aura-mls/, accessed on 10 March 2026), MetOp GOME-2 (https://www.ospo.noaa.gov/products/atmosphere/gome/, accessed on 10 March 2026), whose observation records date back to 2004 and 2007, respectively, and cover the full atmospheric column from the surface to 1 hPa.
MSR-2 and ERA5 share partial satellite ozone observation data (e.g., OMI, MLS), but their core construction logics are essentially different. MSR-2 is a univariate reanalysis specifically designed for total ozone column, prioritizing the accuracy of TOC. In contrast, ERA5 is a comprehensive atmospheric reanalysis, where ozone fields must maintain dynamic consistency with other variables such as temperature and wind fields. The high consistency between the two datasets (Section 3.4) indirectly verifies the reliability of the MSR-2 data used in this study over NE China.
The monthly sample variance is computed as
where xi is the monthly mean TOC in the i-th year, is the 10-year mean TOC for that specific month, and n = 10 is the number of years in the study period. In the difference between the monthly maximum and minimum TOC values, the range R is mathematically defined as
In addition, this study employs the TOC data from Longfengshan Station (marked as a red dot on the map in Figure 1b, a regional background station located in NE China (44.7°N, 127.6°E, 331 m a.s.l.), approximately 175 km NE of Harbin City. As a Regional Station of the Global Atmosphere Watch (GAW) under World Meteorological Organization (WMO) Region II (Asia) with GAW ID: LFS and WOUDC Station ID: 326 [43], the station’s data is publicly archived and accessible via the World Ozone and Ultraviolet Radiation Data Centre (WOUDC) platform (access link: https://woudc.org/en/data/stations/?id=326&lang=en, accessed on 12 February 2026), with data provision ceasing after March 2022. Good agreement between ozone products observed and obtained from AURA OMI/MLS was found [43]. The dataset used in this study covers the period from January 2015 to March 2022. Managed by the Institute of Atmospheric Chemistry, Chinese Academy of Meteorological Sciences, the station’s long-term observational records provide reliable data support for the analysis of regional ozone variability.
3. Results
In Section 3, we analyze the temporal trends, variability, and climatology of TOC in Northeast China using the MSR-2 data. Stratospheric ozone concentration and temperature relationships are derived from the ERA5 dataset. The ground-based TOC measurements from the Brewer MKII spectrophotometer at Longfengshan Station are used in comparison with TOC averaged over the NE China region. The Brewer MKII is a standard ultraviolet spectrophotometer operated by the WMO Global Atmosphere Watch (GAW) network, which measures total ozone column with an accuracy of ±1–2% under clear-sky conditions [44].
3.1. Long-Term Trend in TOC
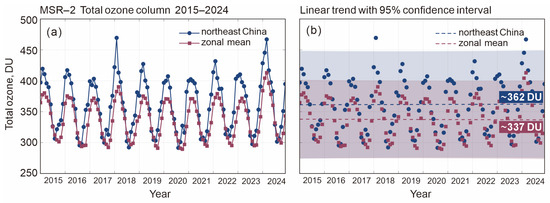
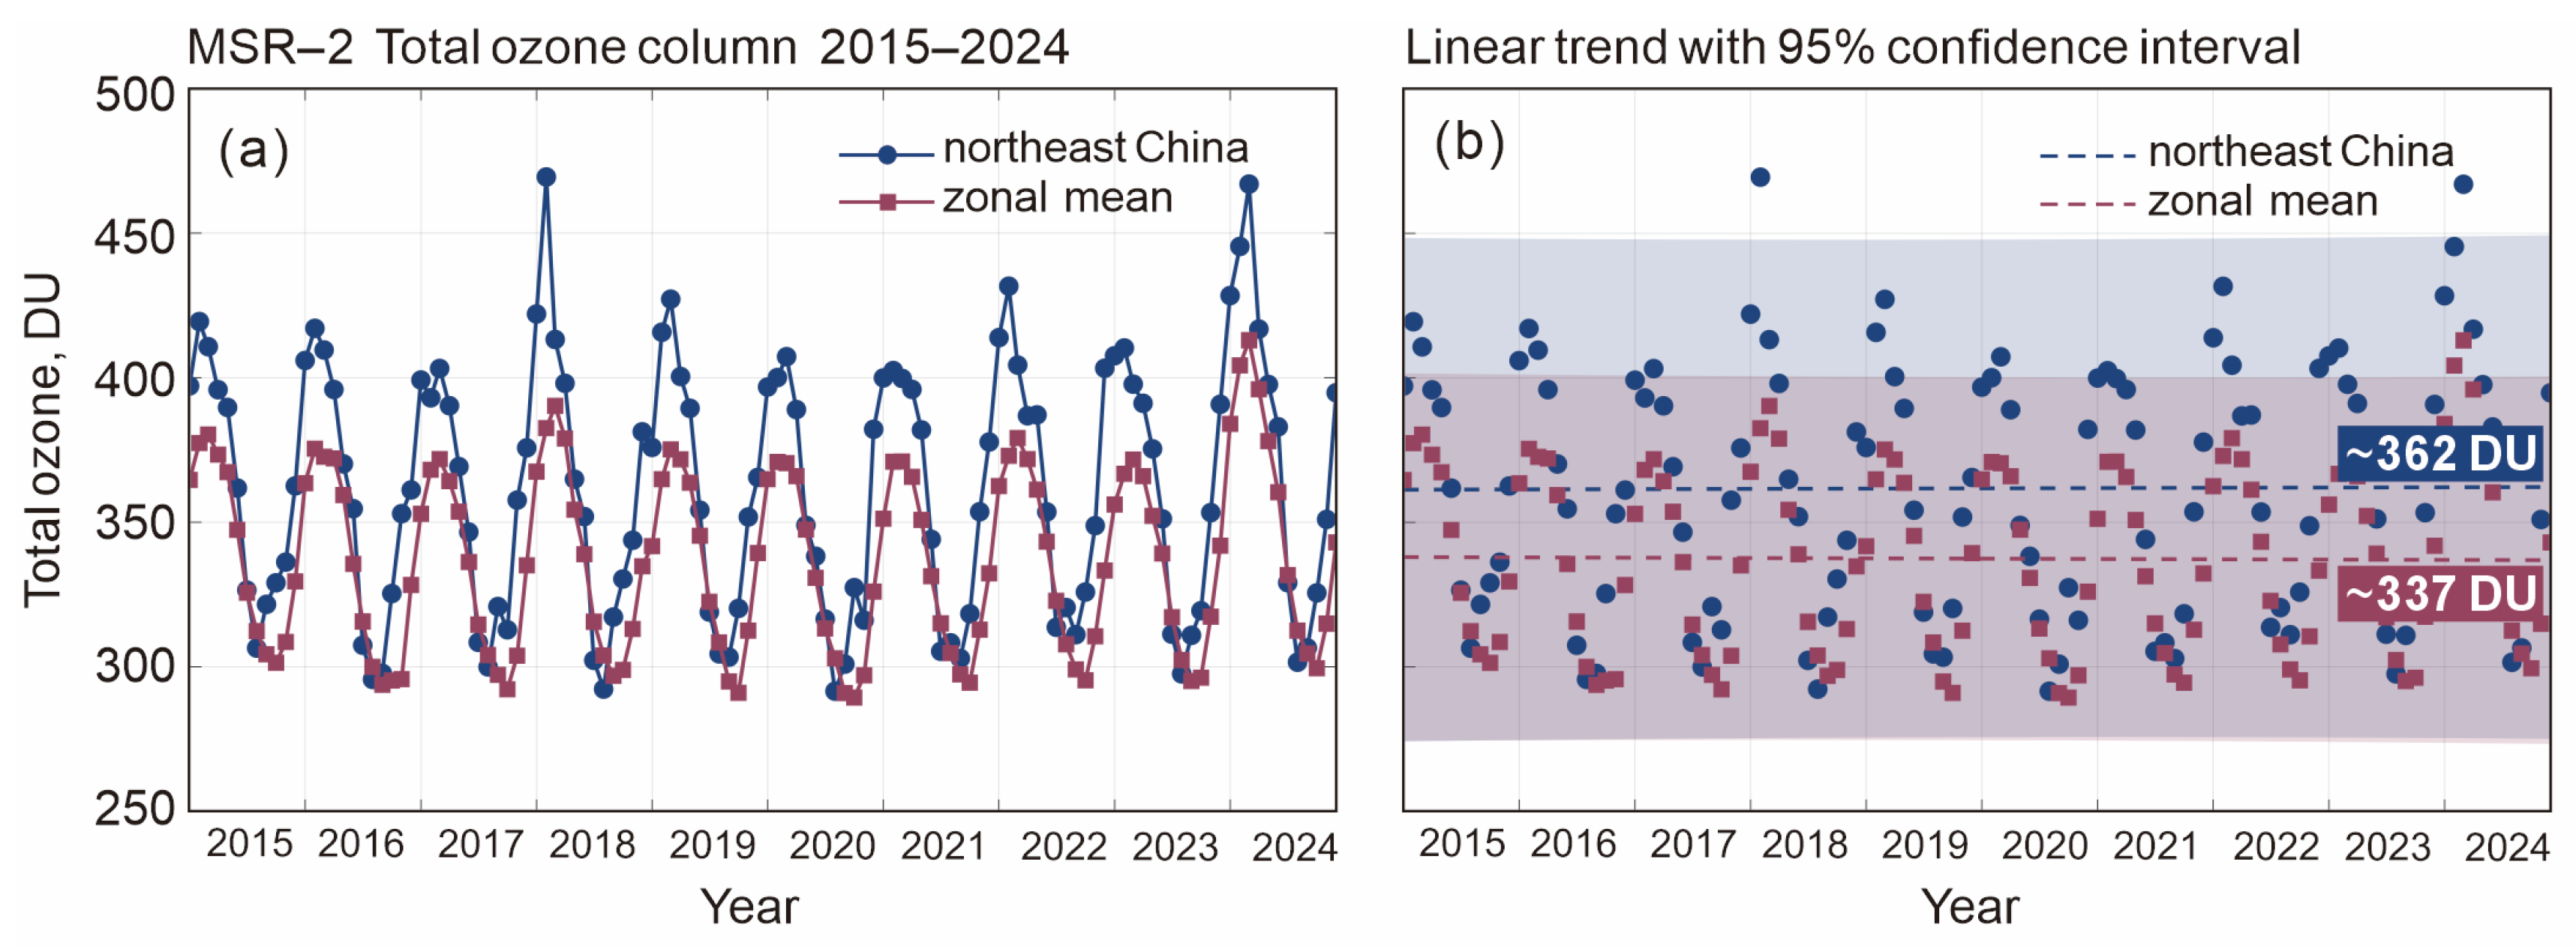
Figure 2 presents the 10-year (2015–2024) total ozone column time series over NE China (40–53°N, 115–135°E) and the zonal mean TOC across the same latitude band (40–53°N, 180°W–180°E). In Figure 2a, blue-filled circles denote the monthly mean TOC of NE China, while rose-red-filled squares represent the zonal mean TOC. Figure 2b shows linear trends (dashed lines in corresponding colors) with semi-transparent shaded areas indicating 95% confidence intervals. All data are derived from HDF datasets, with non-physical values (<0) excluded as NaN. Notably, the TOC over NE China shows no upward trend throughout the period, and it is consistently higher than the zonal mean TOC at the same latitude. The excess is approximately 25 DU (7.4%) and is contributed mainly by the higher winter TOC values in NE China than in the zonal means (blue and red symbols, respectively, at their maximum levels in Figure 2). The minimum TOC values in summer are close and do not affect the difference.
Figure 2.
(a) Total ozone column in Northeast China and the full longitude band; (b) linear trend with 95% confidence interval.
Though NE China’s TOC lacks an upward trend, mathematical signal analysis reveals a strong positive correlation between the TOC variation signal of NE China and the full longitude band, with r = 0.91. This consistency suggests that annual TOC dynamics in NE China are mainly dominated by zonal-scale atmospheric processes that are reflected in regional processes. Subsequent work will focus on correlation characteristics across different latitude circles to further clarify the spatial consistency of ozone variations.
3.2. Seasonal Variability in TOC
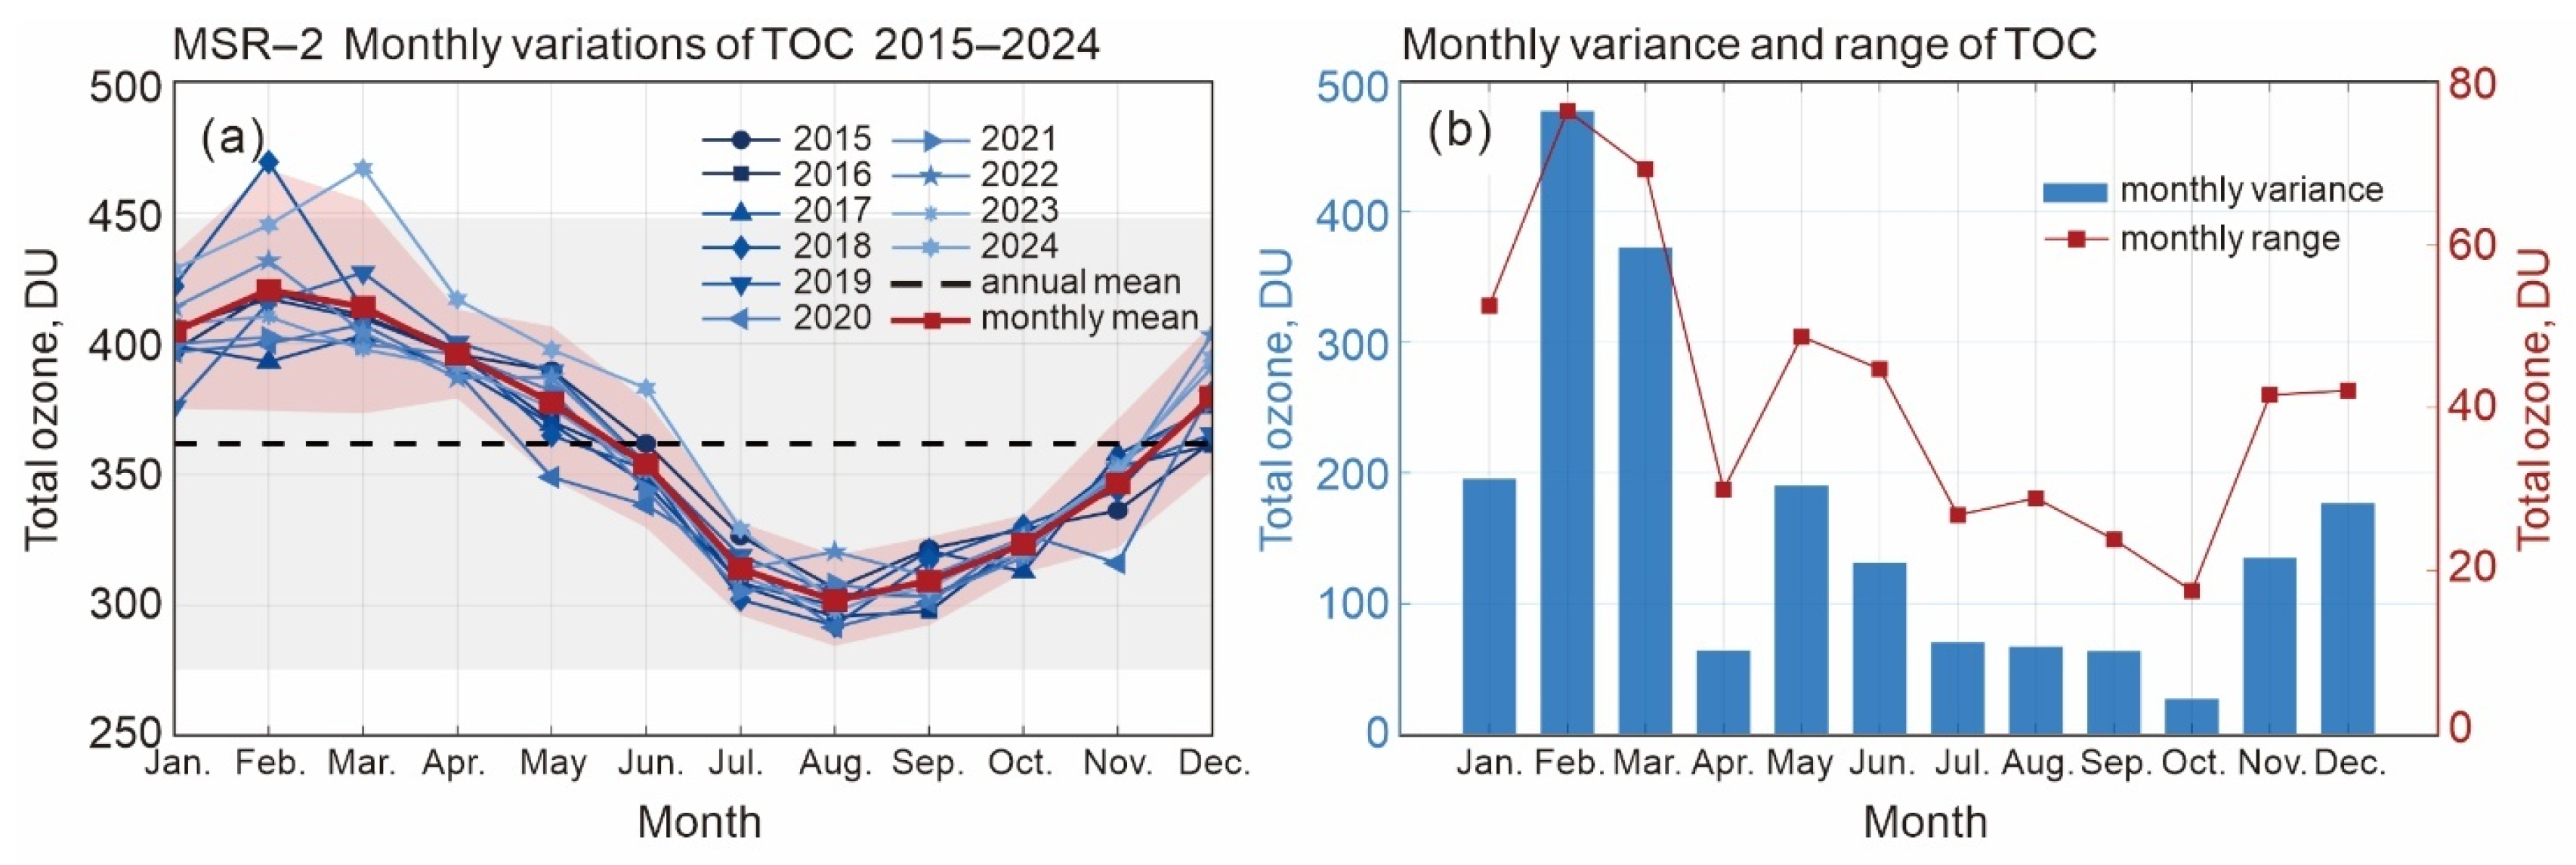
Figure 3a presents the monthly variations in TOC in NE China from 2015 to 2024. The blue curves of different shades are the monthly means for each year, the red curve is the 10-year monthly mean, and the dashed line is the 10-year annual mean. The overlapping blue curves show how monthly TOC varies between years, and notably, February 2018 and March 2024 stood out as periods of anomaly. This phenomenon underscores the inherent instability of winter atmospheric dynamics and planetary waves [4,26]. The red curve highlights the consistent seasonal pattern of TOC over the decade with a maximum in February and a minimum in August, which are one month earlier and two months earlier, respectively, than usual in the NH mid-latitudes [4].
Figure 3.
MSR-2 data for (a) monthly variations in TOC during 2015–2024 (blue) with monthly mean (±2σ, red) and annual mean (±2σ, gray); (b) monthly variance and range in TOC in NE China.
Figure 3b quantifies TOC’s monthly volatility (variance s2) and dispersion (range R) via a dual-Y-axis layout. The blue bar plot corresponds to the variance, which characterizes the temporal variability in monthly distinct peaks in February, indicating substantial interannual variability in TOC during this month. Conversely, monthly TOC values exhibit minimal fluctuations in July, August, September, and October, resulting in comparatively low variance during these months. The red curve quantifies the range of the difference between the monthly maximum and minimum TOC values; mathematically, this range is denoted as R in Equation (2) (Section 2.2). Consistent with the variance pattern, the TOC range is notably larger across winter–spring months, while it remains substantially smaller throughout the summer–autumn season.
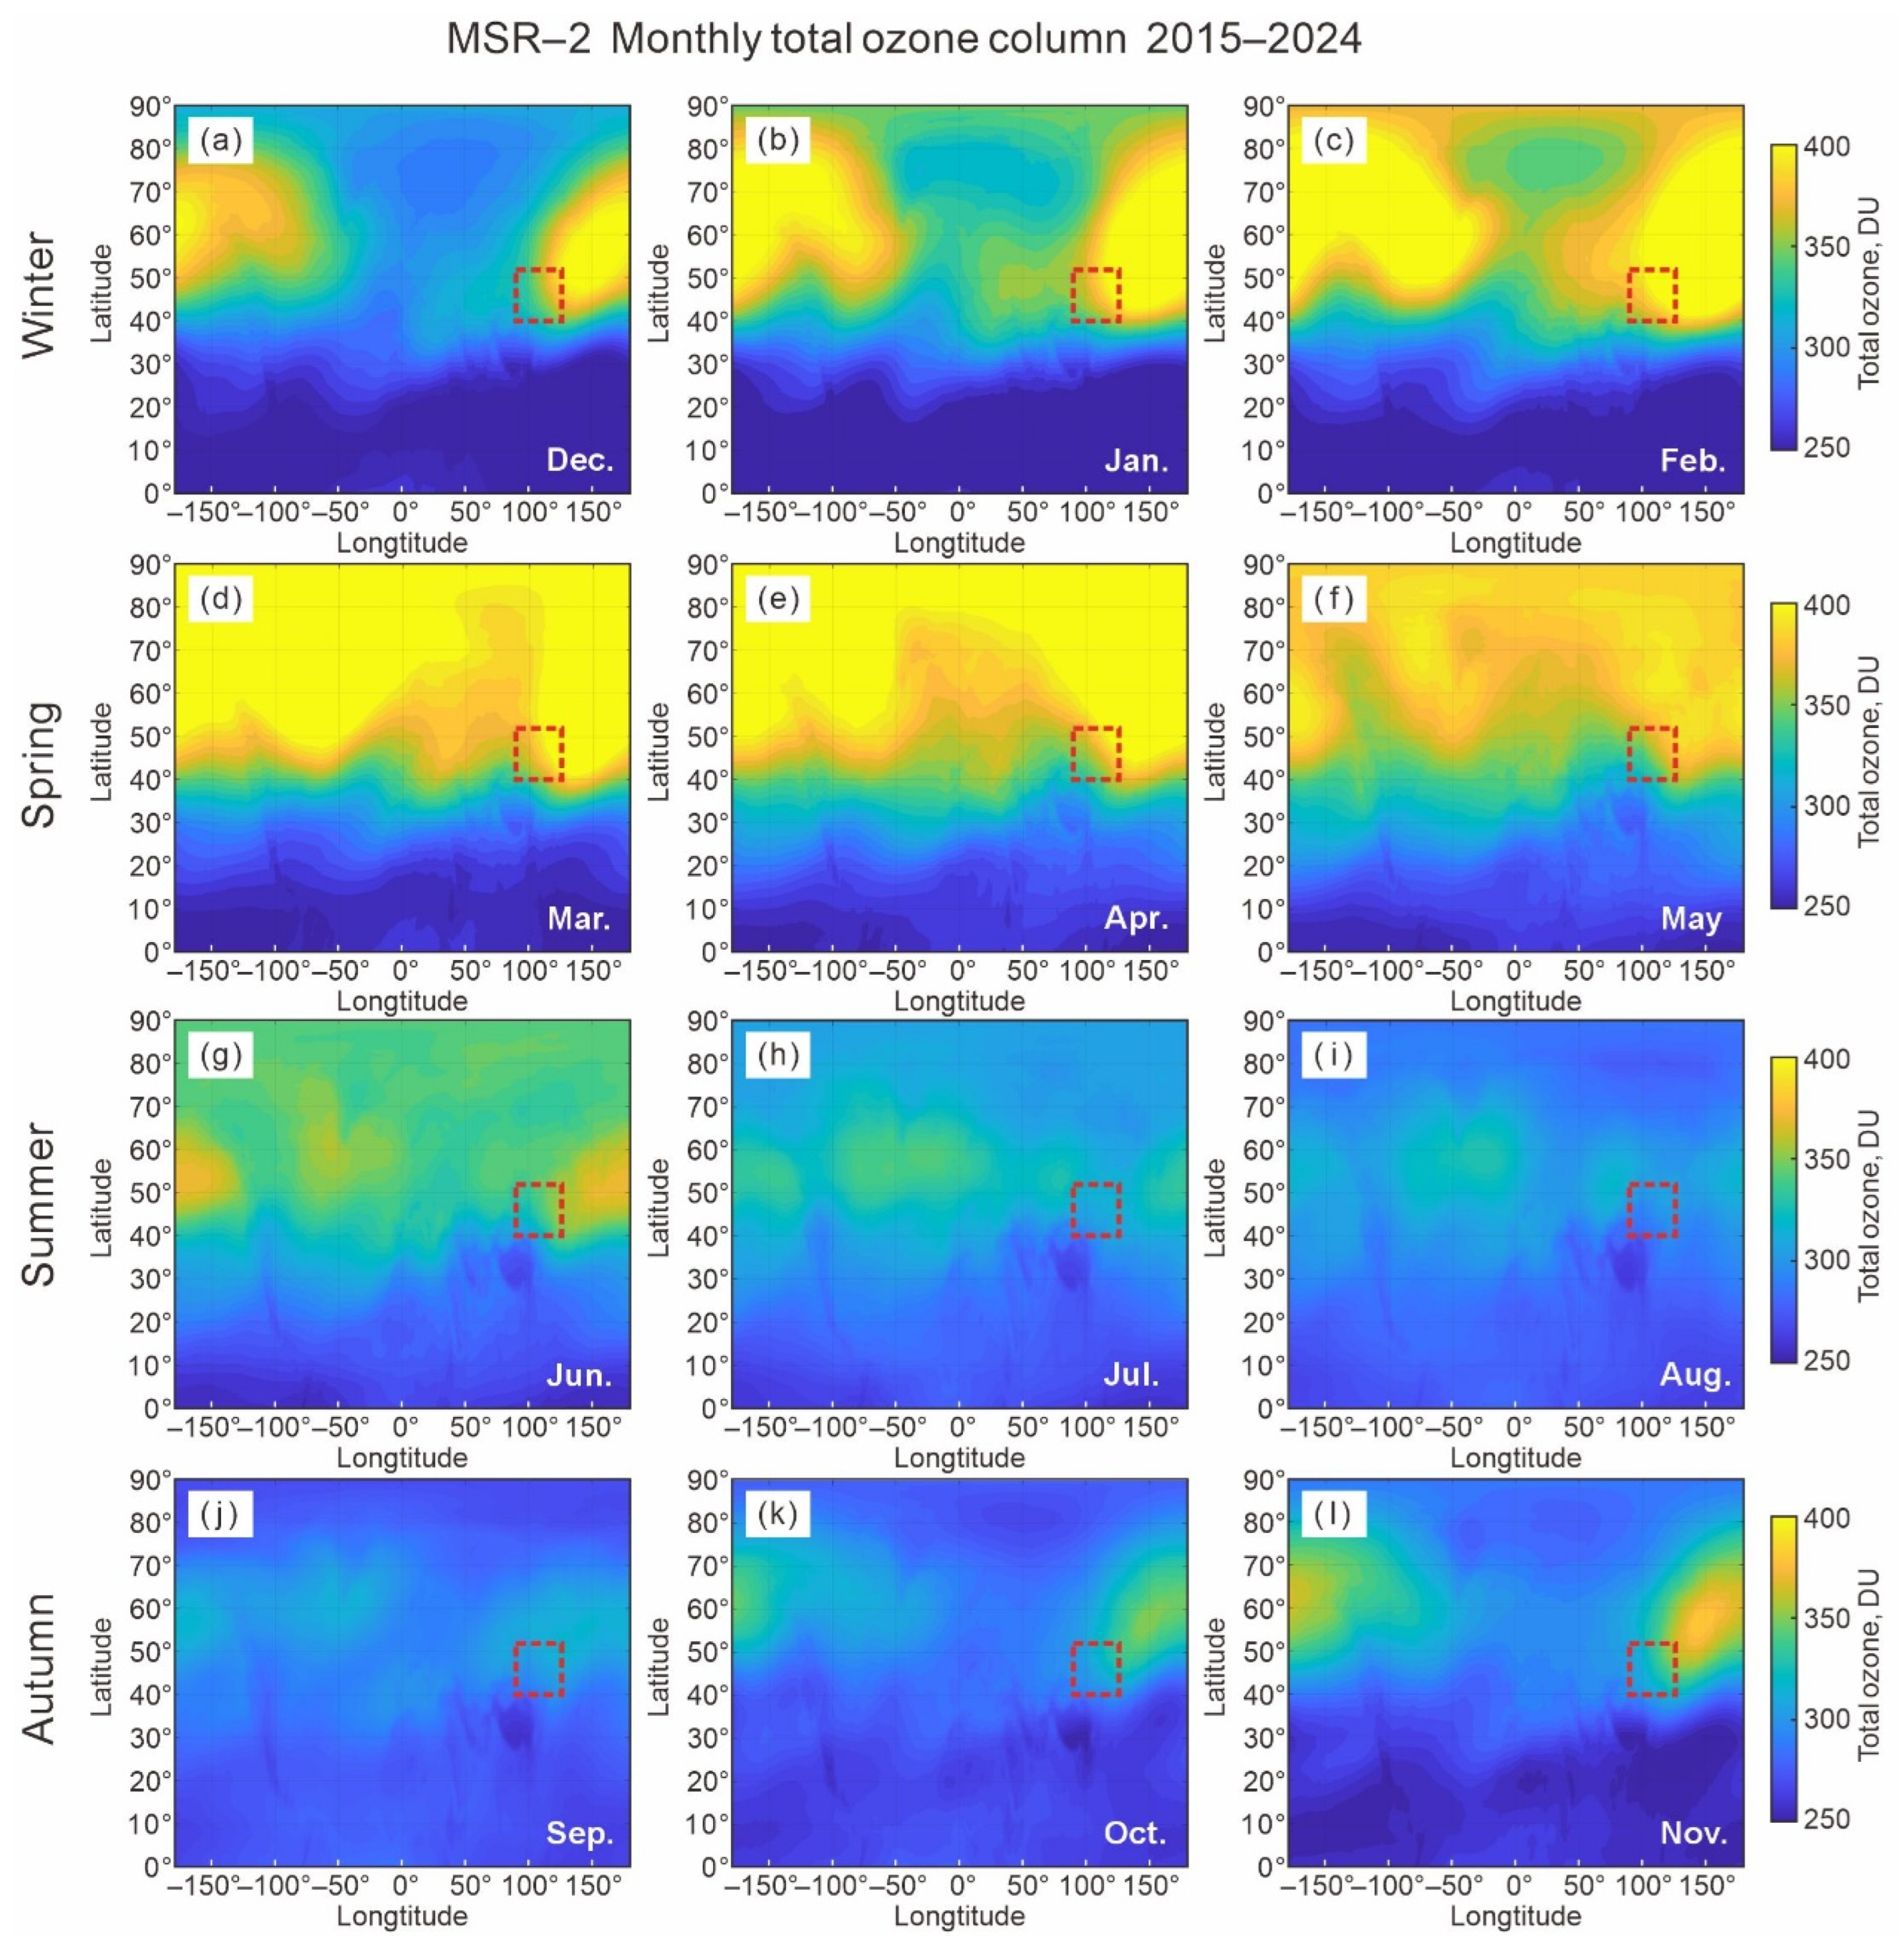
Building on the prior analysis of long-term TOC trend and annual cycle (Figure 2 and Figure 3), Figure 4 displays the monthly mean NH TOC spatial distribution across 2015–2024.
Figure 4.
Total ozone column in the Northern Hemisphere from 2015 to 2024; the red box indicates the boundaries of the Northeast China domain, 40–53°N, 115–135°E. (a–c) December–February, (d–f) March–May, (g–i) June–August, (j–l) September–November.
Figure 4 is organized by seasons: winter (December–February, a–c), spring (March–May, d–f), summer (June–August, g–i), and autumn (September–November, j–l).
The red dashed box in each panel demarcates the NE China domain. Mid- and high-latitude regions (≥40°N) exhibit elevated TOC values in winter and spring (Figure 4a–f), while TOC decreases broadly in summer (Figure 4g–i) before gradually recovering in autumn (Figure 4j–l). Within this pattern, as shown in Figure 3a, NE China (red box) shows relatively high TOC in winter and spring (Figure 4a–f), transitions to low values in summer with a minimum in July–September (Figure 4h–j), and the regional TOC undergoes a partial rebound in autumn (October–November, Figure 4k,l). This seasonal spatial pattern reveals that TOC in NE China aligns with typical mid-latitude ozone dynamics: higher winter/spring TOC is tied to enhanced Brewer–Dobson circulation (BDC), and lower TOC in summer is driven by increased photochemical destruction of stratospheric ozone and weaker transport [4]. Notably, the TOC minimum in NE China and in the 40–53°N latitude band does not differ in summer (Figure 2), indicating regional ozone levels are representative of mid-latitude conditions rather than extreme regional depletion.
Figure 4 provides a foundational context for subsequent analyses by clearly showing the position of NE China in the TOC field of the entire Northern Hemisphere across all seasons. Specifically, it visually demonstrates that NE China lies at the undulatory mid-latitude edge of the high-ozone belt in winter–spring, which is directly linked to the equatorward extension of the polar high-TOC region driven by quasi-stationary waves (QSWs). This spatial context is essential for understanding why regional TOC is consistently higher than the zonal mean (Figure 2) and why it exhibits unique seasonal phase characteristics (Figure 3a). The TOC maximum in winter fills the mid-latitudes unevenly and is concentrated in the region around 180°E, providing TOC increase in NE China (Figure 4a–c, red box). A significantly more complete filling of the mid-latitudes with the high TOC levels occurs in spring (Figure 4d–f), resulting in a delay in reaching the zonal mean seasonal maximum/minimum until March/October [4] compared to February/August in the NE China region (Figure 3a).
3.3. 10-Year Climatology of TOC
In this study, the 10-year climatology of TOC refers to the average TOC value for each calendar month over the 2015–2024 period, which represents the typical mean state of TOC during this decade. This is a standard method in atmospheric science for characterizing long-term average conditions based on the World Meteorological Organization (WMO)’s definition, which has been widely used in previous studies of ozone climatology [4,25]. In general, the climatological averages are calculated by averaging each monthly mean TOC value over any specified period of time (WMO Climatological Normals, https://community.wmo.int/site/knowledge-hub/programmes-and-initiatives/climate-services/wmo-climatological-normals, accessed on 15 February 2026).
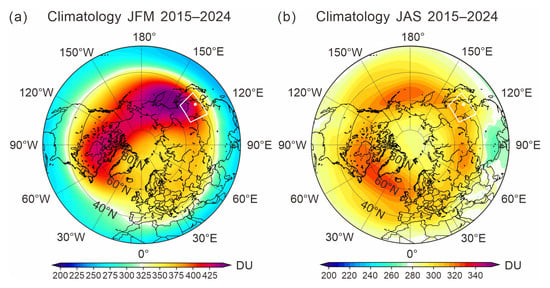
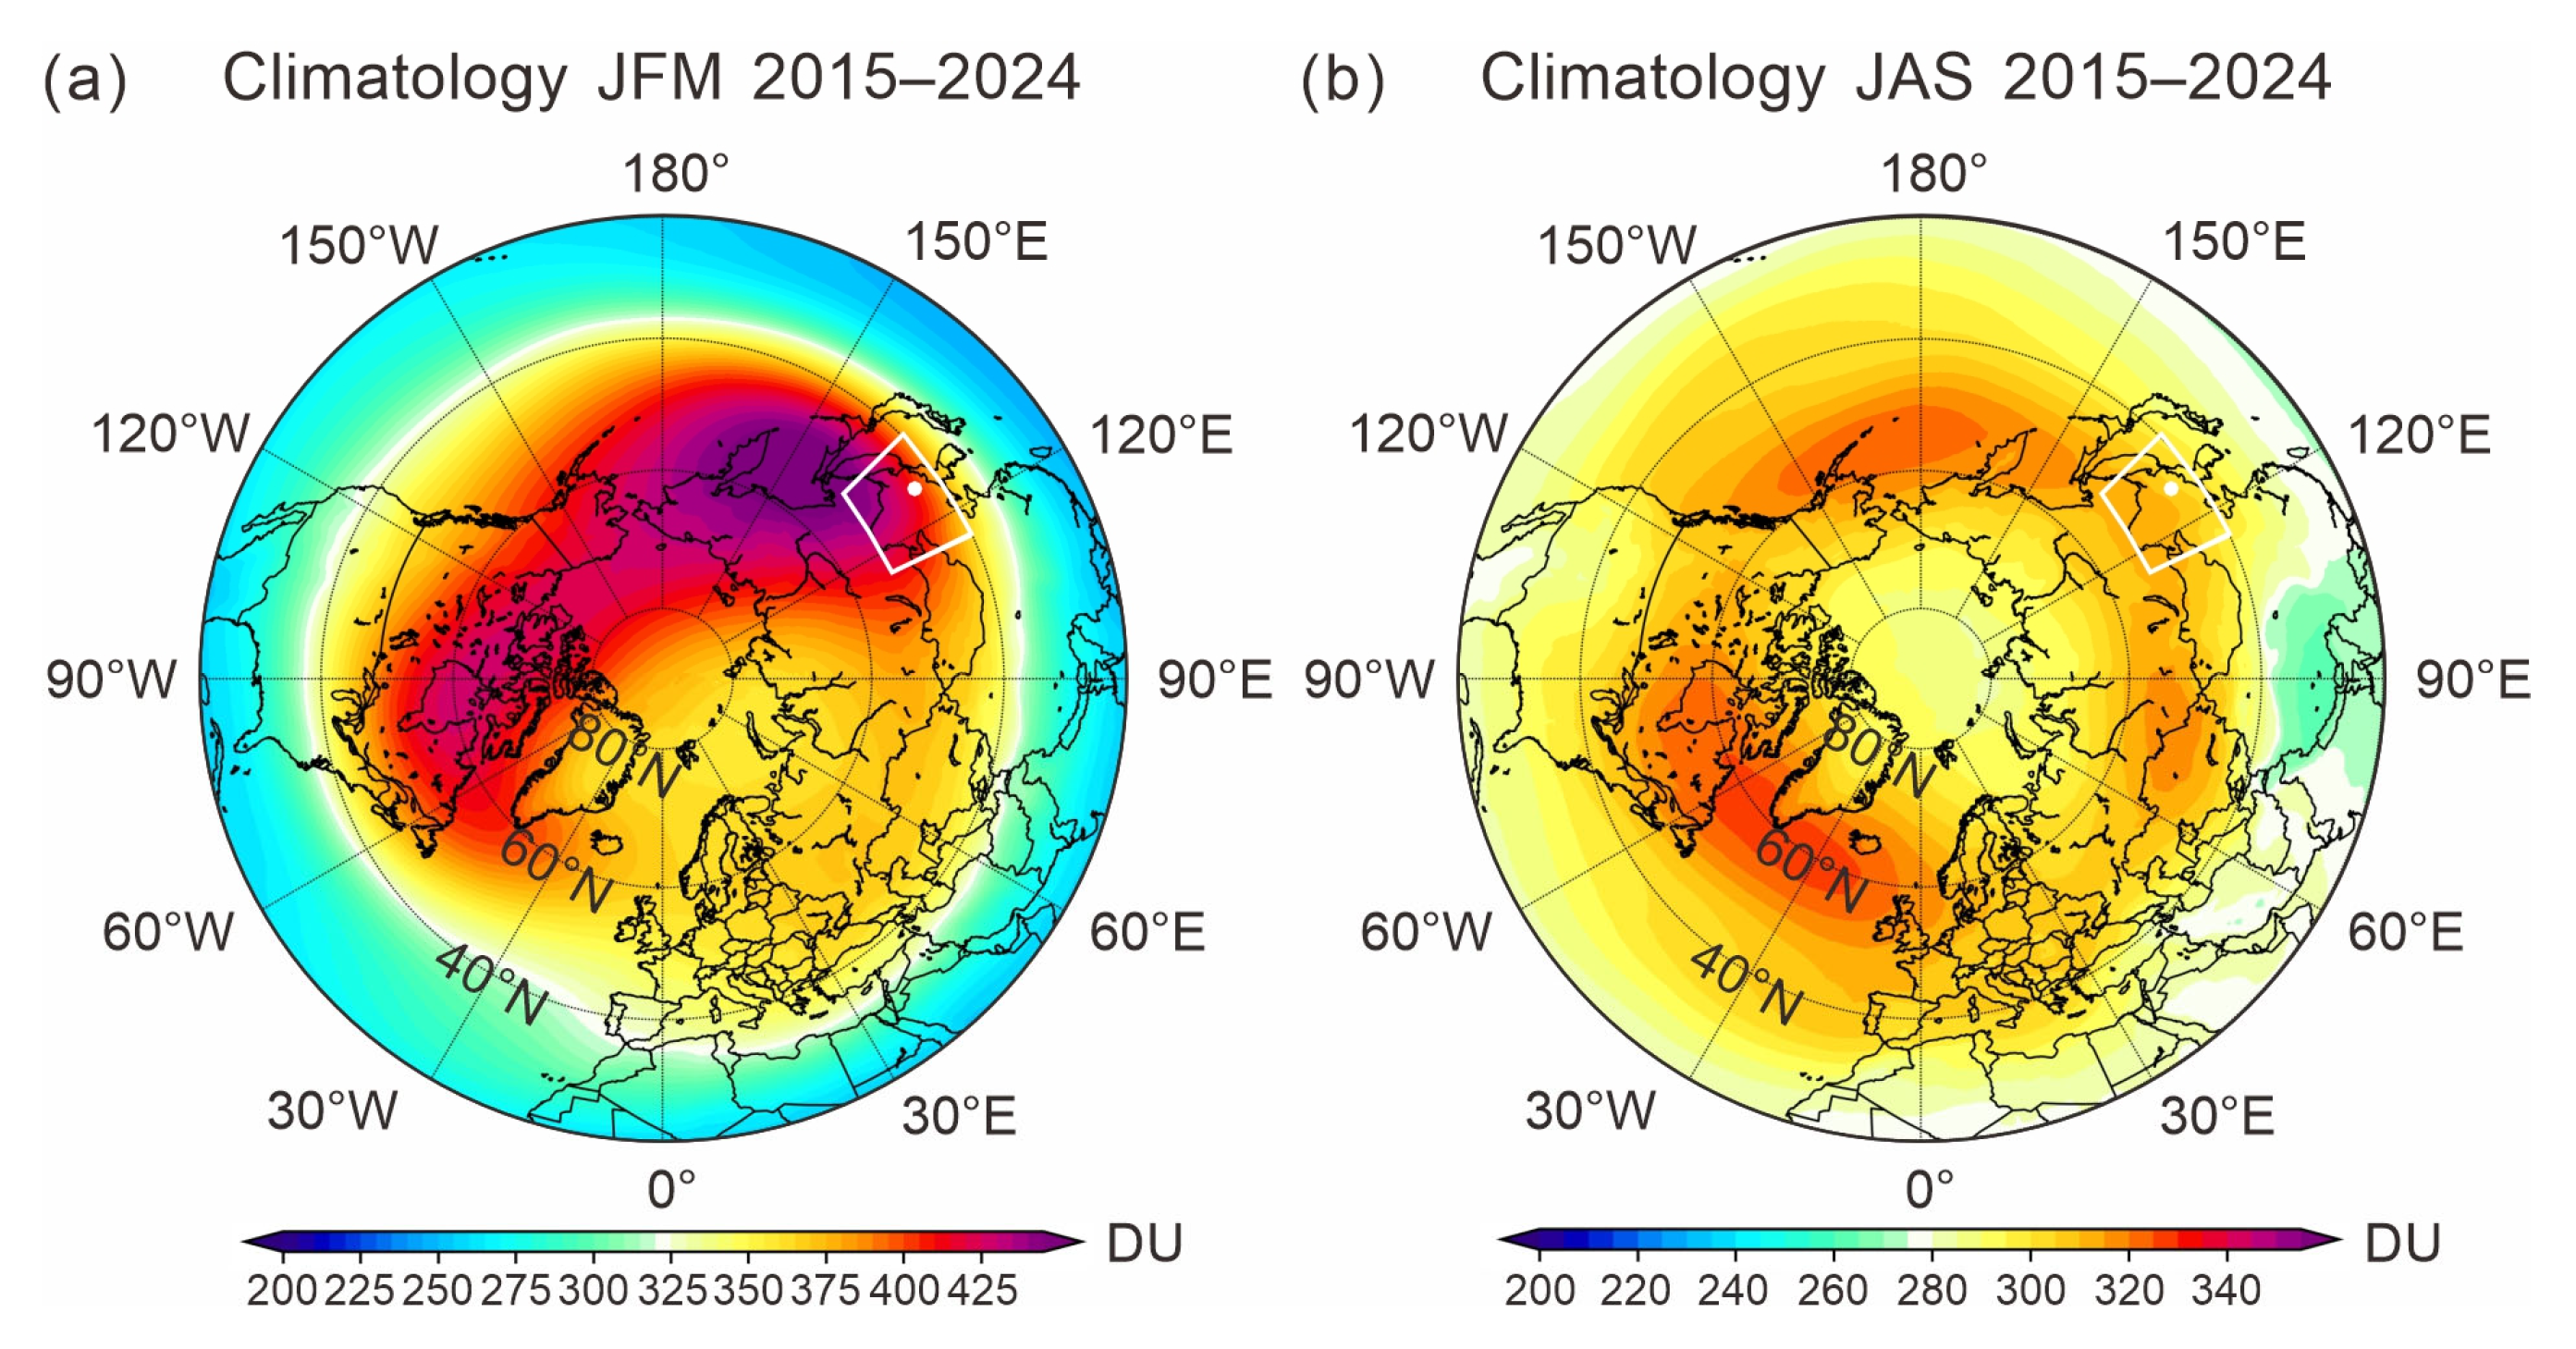
Figure 5a presents the 2015–2024 climatology of TOC over the Northern Hemisphere for the JFM (January–March) season, with the TOC maximum over NE China (Figure 4b–d) and the color scale spanning 200 to 450 Dobson Units (DUs). A prominent polar-level TOC maximum (exceeding 400 DU) dominates the Arctic region, and this high-ozone area, related to the enhanced BDC, extends to NE China in JFM (see red curve in Figure 3a). Here, NE China in Figure 5a functions as a transition zone: its northeastern section aligns with the polar high-ozone levels of ~415 DU, while the southwestern part shows a lower TOC of ~330 DU, closer to subtropical ozone levels (~300 DU; [42]). The uneven TOC distribution in NE China during JFM, which combines polar and subtropical levels, is noteworthy. Figure 5b displays the corresponding 2015–2024 TOC climatology for the JAS (July–September) season, with a compressed color scale (200 to 340 DU) that reflects the seasonal ozone minimum (red curve in Figure 3a). During JAS, TOC across NE China is notably more uniform than during JFM, with TOC stabilizing around 300 DU, which is near the minimum level among the mid-latitude regions (Figure 3b). This creates a stark seasonal contrast: JFM marks the regional ozone maximum associated with BDC, while JAS represents the regional ozone minimum due to weakened ozone transport and enhanced photochemical loss.
Figure 5.
Ten-year climatology TOC for JFM and JAS in the Northern Hemisphere; the white dot represents the Longfengshan Station. The white area indicates the Northeast China domain (40–53°N, 115–135°E)
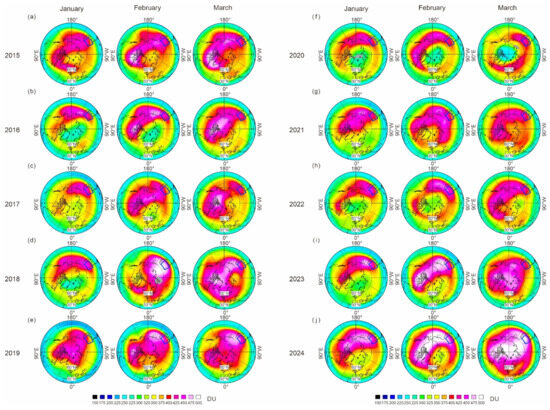
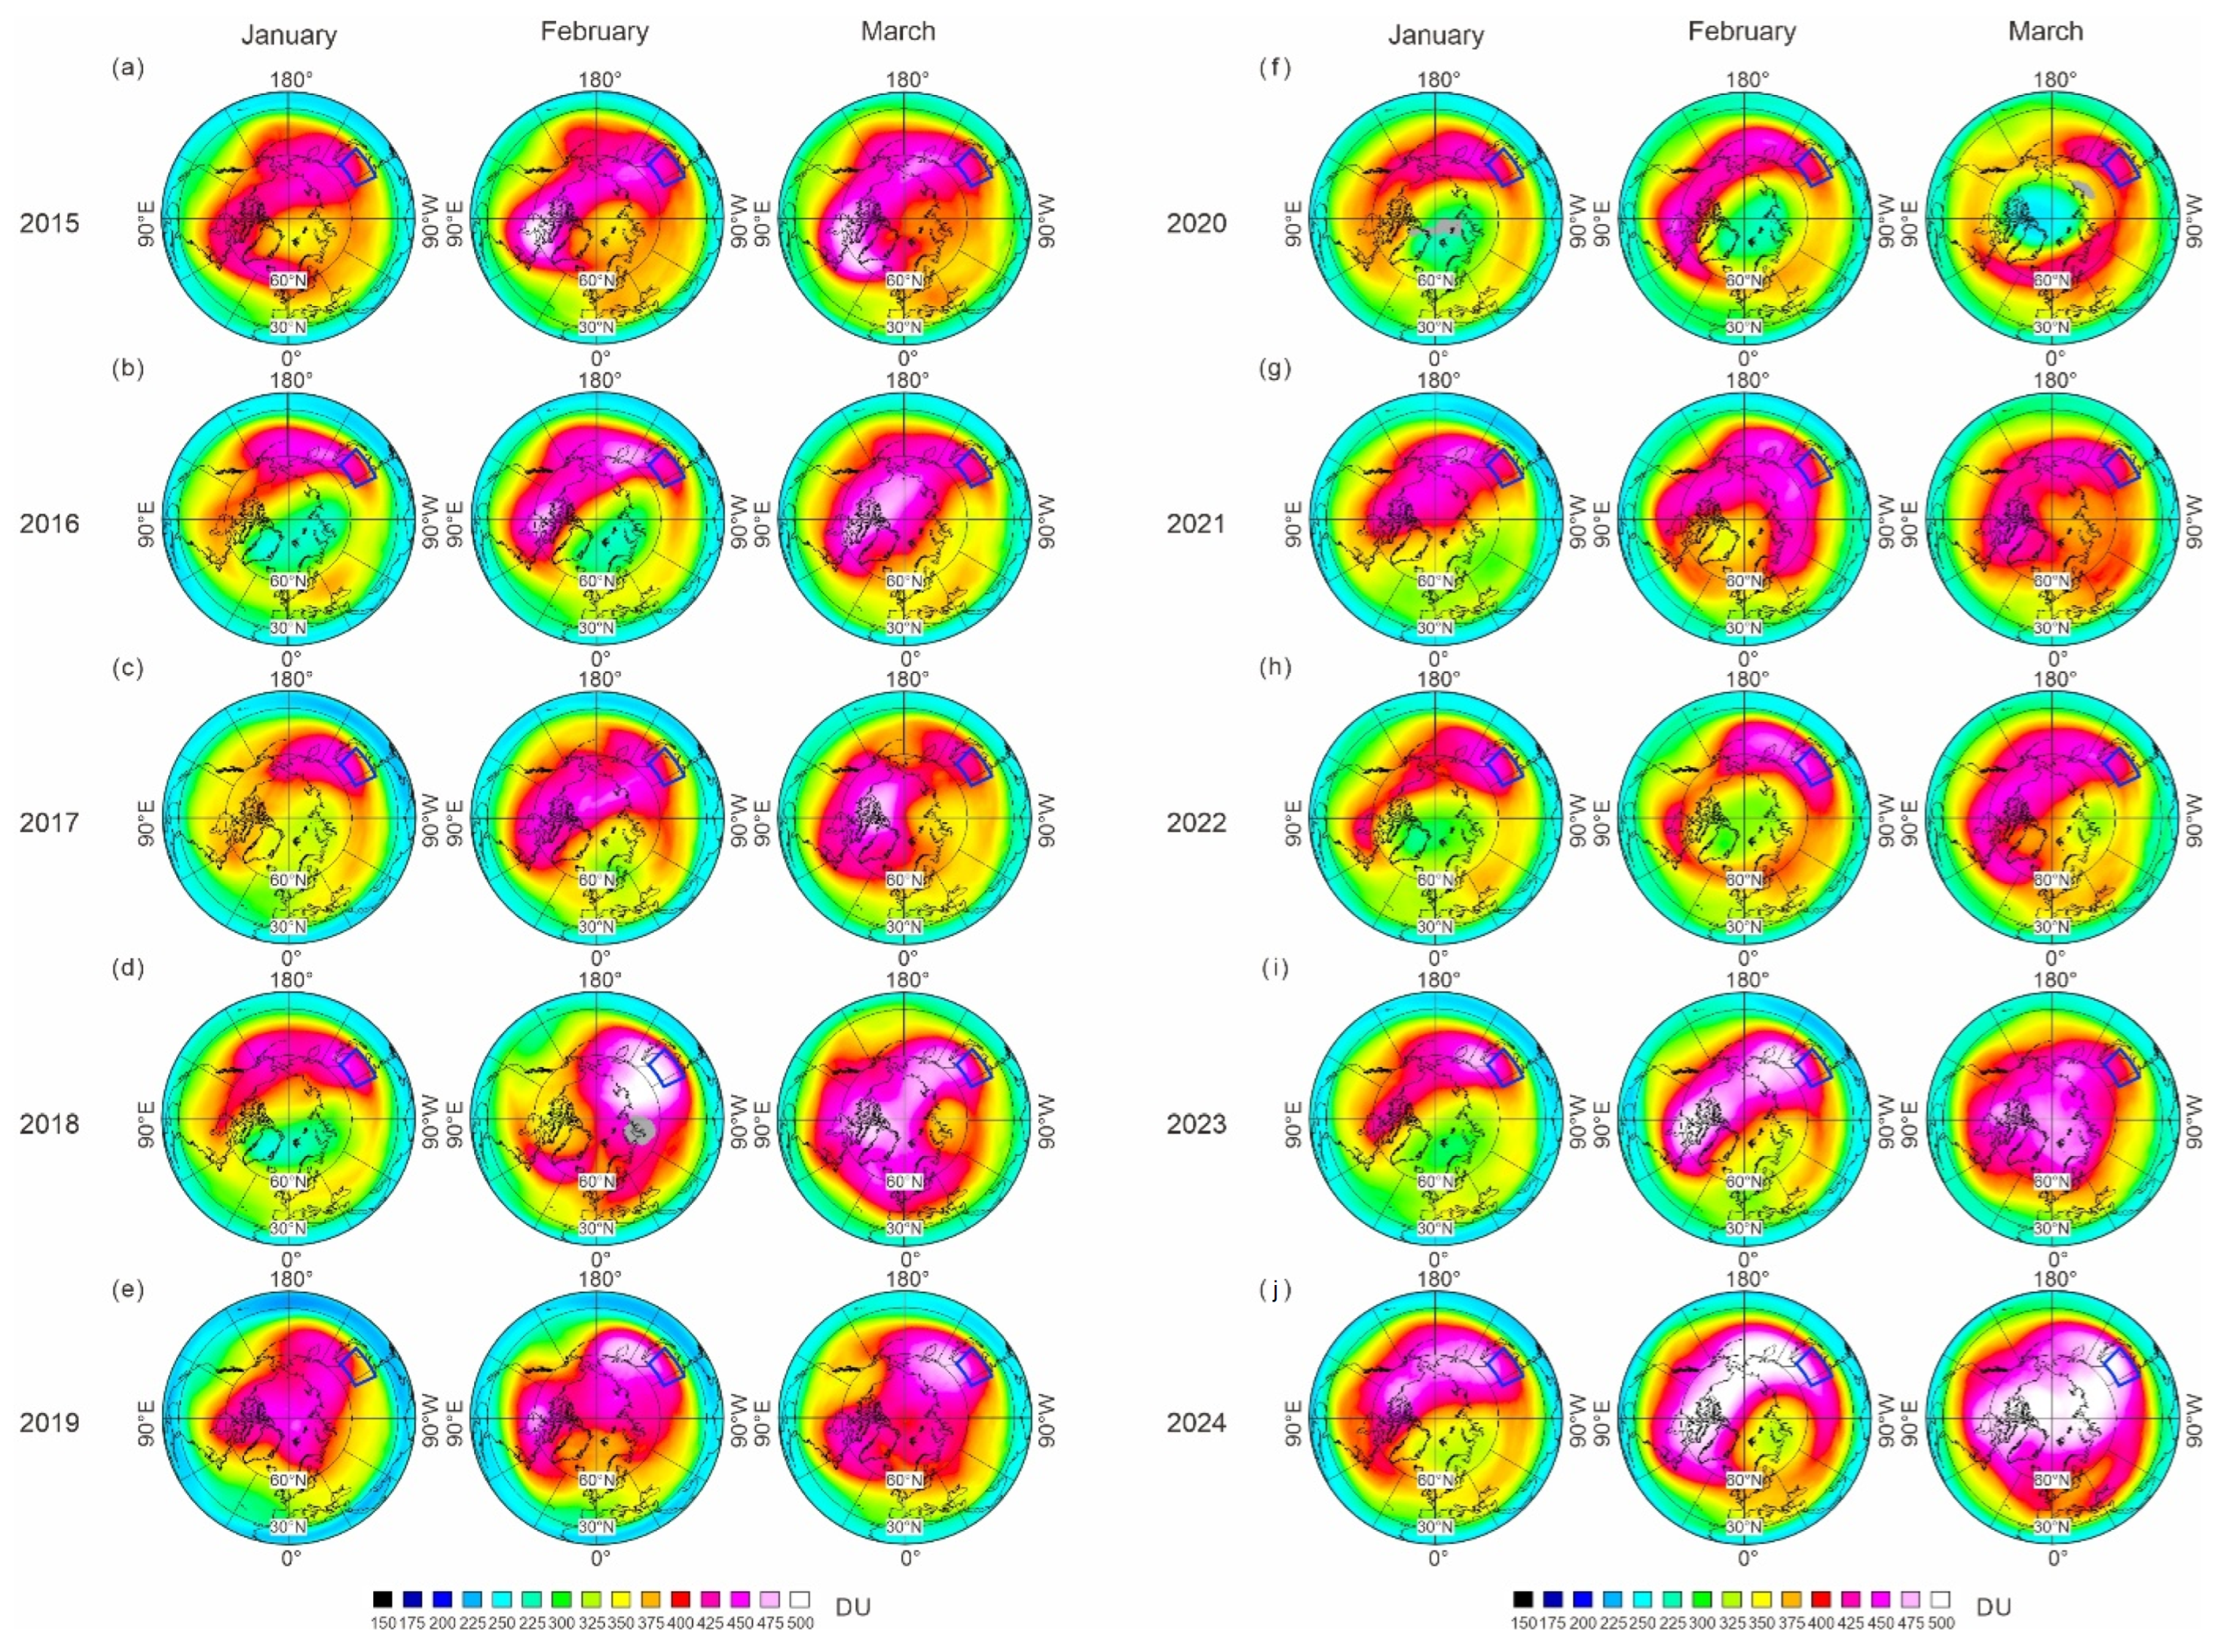
Figure 6 displays the spatial distribution of NH TOC for January, February, and March of each year from 2015 to 2024, with the blue box delineating NE China (consistent with the regional boundary defined in prior analyses). Across all these January–March panels, the TOC within the NE China domain consistently falls within the higher TOC range (typically ≥400 DU per the color scale), consistent with the conclusion that JFM represents the annual peak in ozone levels for this region (Figure 3a). This high TOC level is maintained despite the overall high variability in the TOC pattern over mid- and high-latitudes (Figure 6). In contrast, localized areas (e.g., parts of the Arctic) exhibit far more pronounced interannual variability in TOC distribution, with some years showing distinct low-ozone patches (2016, 2020, and 2022; see Figure 6).
Figure 6.
Total ozone column (January–March) in the Northern Hemisphere from 2015 to 2024. (a–e) 2015–2019, (f–j) 2020–2024.
Despite the interannual fluctuations in ozone distribution across surrounding or remote regions, the maximum TOC levels in NE China remain relatively stable throughout the 2015–2024 January–March period. With no substantial deviations from its typical high TOC state, this contrasts with the low-TOC appearance in the Arctic noted above. The consistent, high-stability TOC in this region during JFM is mainly associated with the TOC maximum pattern in the high-latitudes, driven by the intense BDC and its persistent penetration into NE China.
This condition further serves as a critical seasonal baseline for subsequent investigations into the large-scale and regional drivers of NE China’s ozone dynamics.
3.4. Longfengshan Station
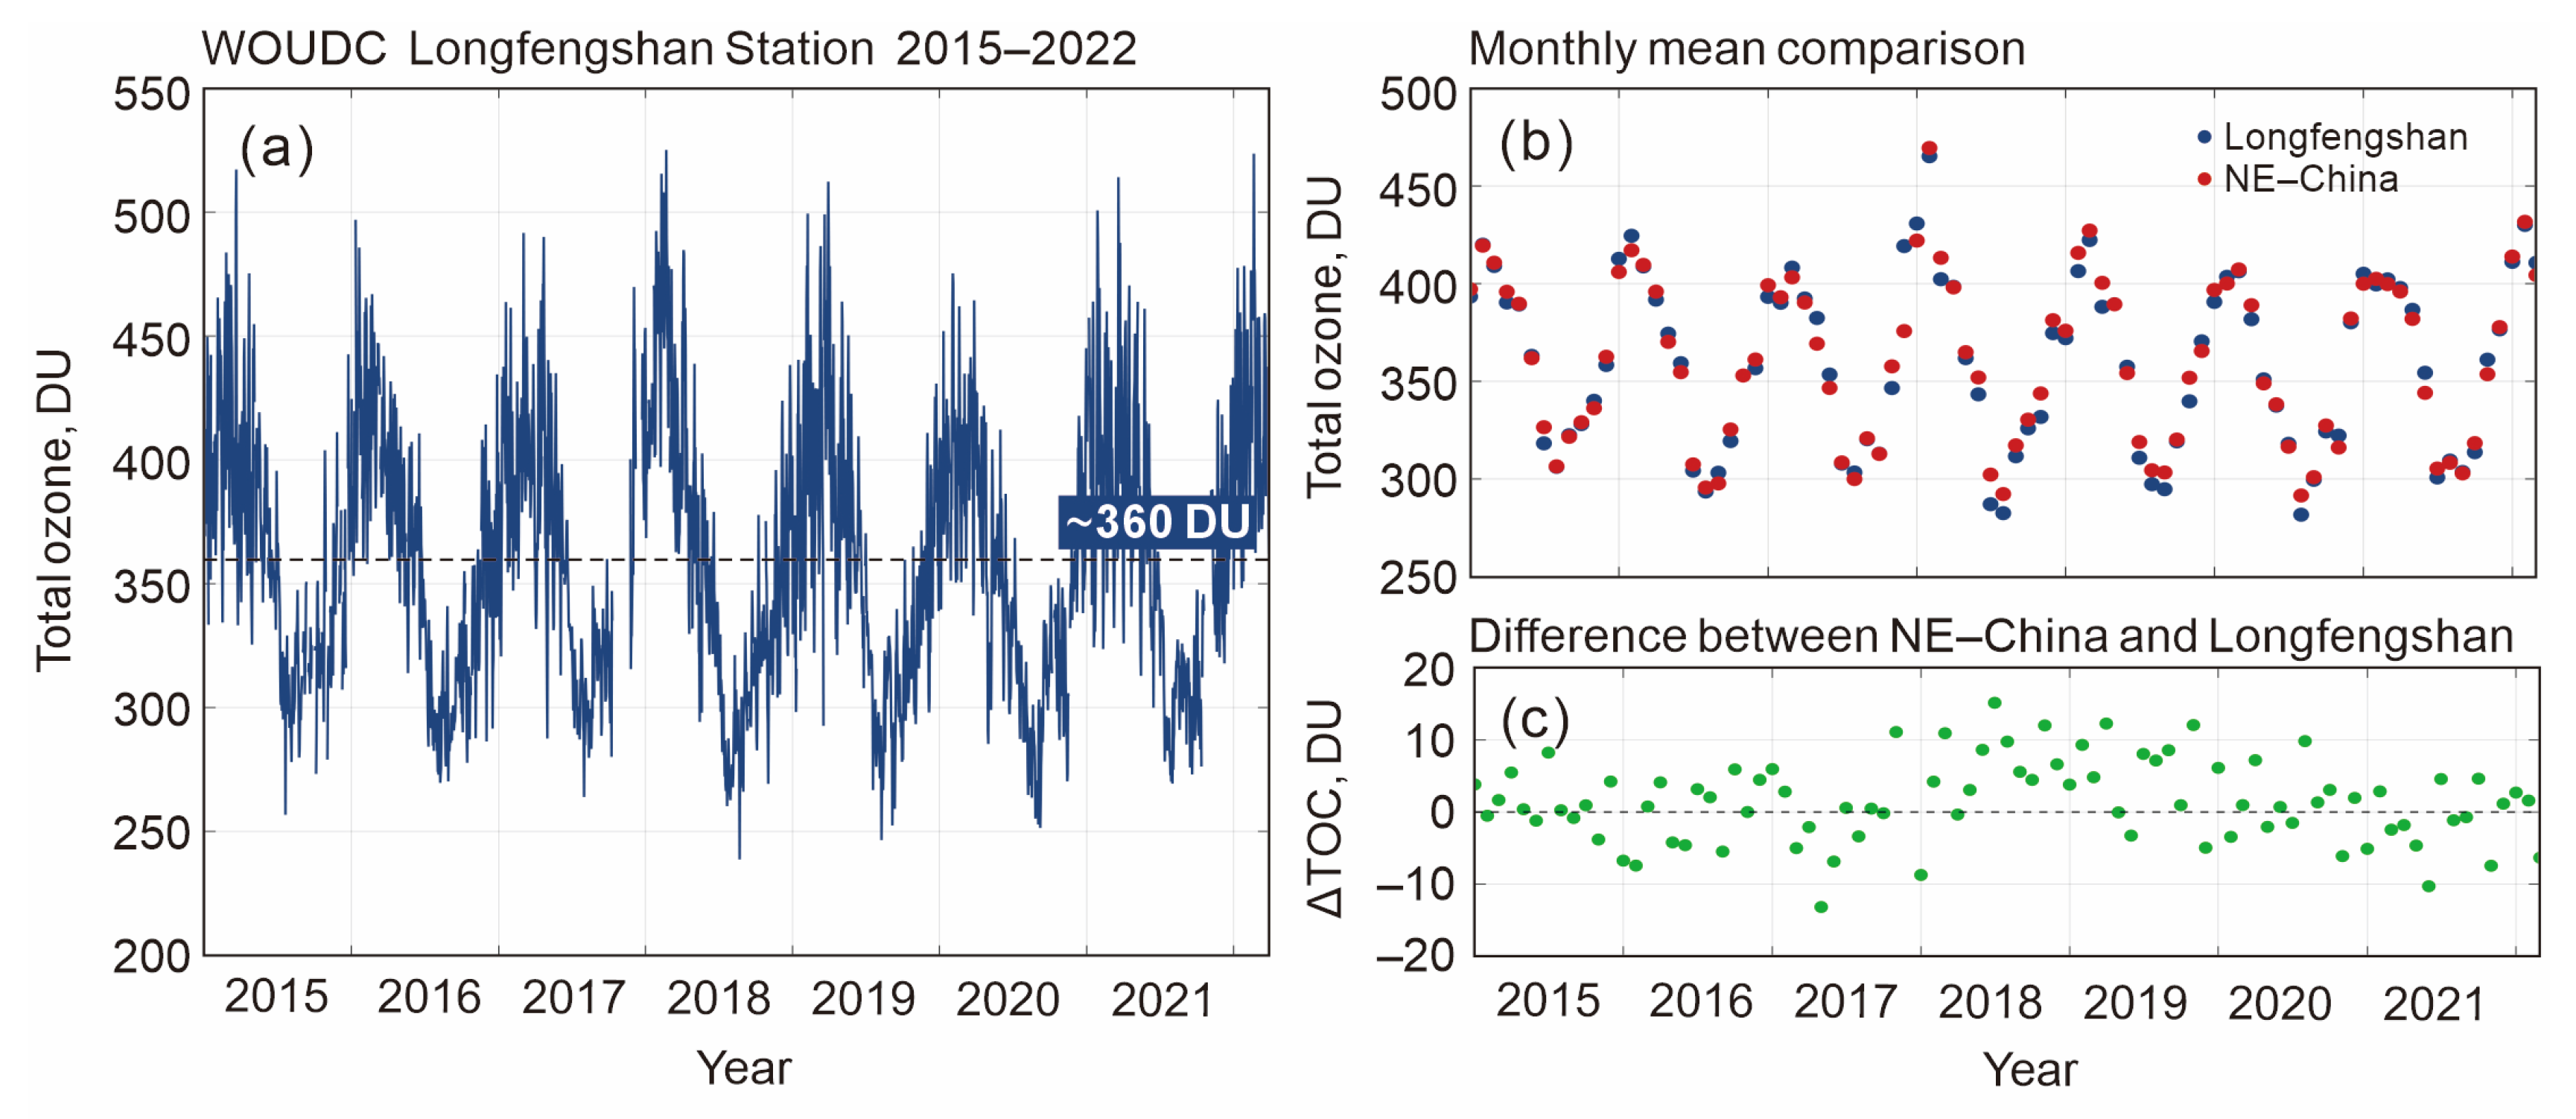
The TOC data from Longfengshan Station (44.7°N, 127.6°E, 334 m a.s.l.), a NE China-based site [43], (marked with a red dot in Figure 1) were retrieved from the WOUDC platform. Figure 7 illustrates TOC variability and regional representativeness at this station from January 2015 to March 2022: Figure 7a depicts daily TOC fluctuations, showing high-frequency variability (200–550 DU) and clear seasonal peaks/troughs over the 7-year period; Figure 7b compares monthly mean TOC values (blue dots, Longfengshan; red dots, NE China regional average); and Figure 7c quantifies the monthly difference between NE China and Longfengshan as green dots, with a dashed zero line to highlight deviation direction.
Figure 7.
(a) TOC at Longfengshan Station from January 2015 to March 2022 from the WOUDC data; (b) monthly mean TOC of Longfengshan Station (blue dots) and NE China (red dots) from the MSR-2 data; and (c) monthly difference between the regional and station-based monthly means. The dot lines at (a,c) represent mean data.
Consistent with the broader NE China region (dashed line in Figure 7), Longfengshan Station’s TOC data exhibit a high degree of quantitative coincidence in overall temporal variations. A pronounced seasonal cycle is evident across all datasets, with elevated TOC values in winter and spring and depressed values in summer and autumn. Notably, the monthly mean differences between the target region and Longfengshan Station remain within ±15 DU (±4.2%) of a 7-year annual mean throughout the study period (Figure 7c), validating the station’s reliability as a representative proxy for regional TOC levels.
Figure 7a,b show that TOC at Longfengshan Station and in Northeast China exhibits stable seasonal cycles, with peaks in winter and troughs in summer, in consistency with Figure 3a. However, the difference between the two datasets (ΔTOC, Figure 7c) shows no obvious seasonal fluctuations, indicating its independence of seasons. Notably, a period dominated by positive deviations (ΔTOC ≈ +5 to +15 DU) occurred in 2018–2019. Most likely, this reflects the emergence of aerosol anomalies due to biomass burning during this period [45], which could have affected the overestimation of regional reanalysis data over local ground-based observations.
Over the 7-year span, no significant long-term increasing or decreasing trend is detected in either the station or regional TOC data, indicating that natural interannual and seasonal variability dominates the observed fluctuations.
To further verify the reliability of MSR-2 data, we derived ERA5 TOC by integrating ozone concentration profiles from 1000 hPa to 1 hPa and compared it with MSR-2 TOC. The results show that the correlation coefficient between monthly mean ERA5 TOC and MSR-2 TOC over NE China during 2015–2024 is as high as r = 0.96, with an average bias of −8.2 DU (−2.4%) and a root mean square error of 12.5 DU, indicating excellent consistency between the two datasets.
3.5. Ozone Concentration
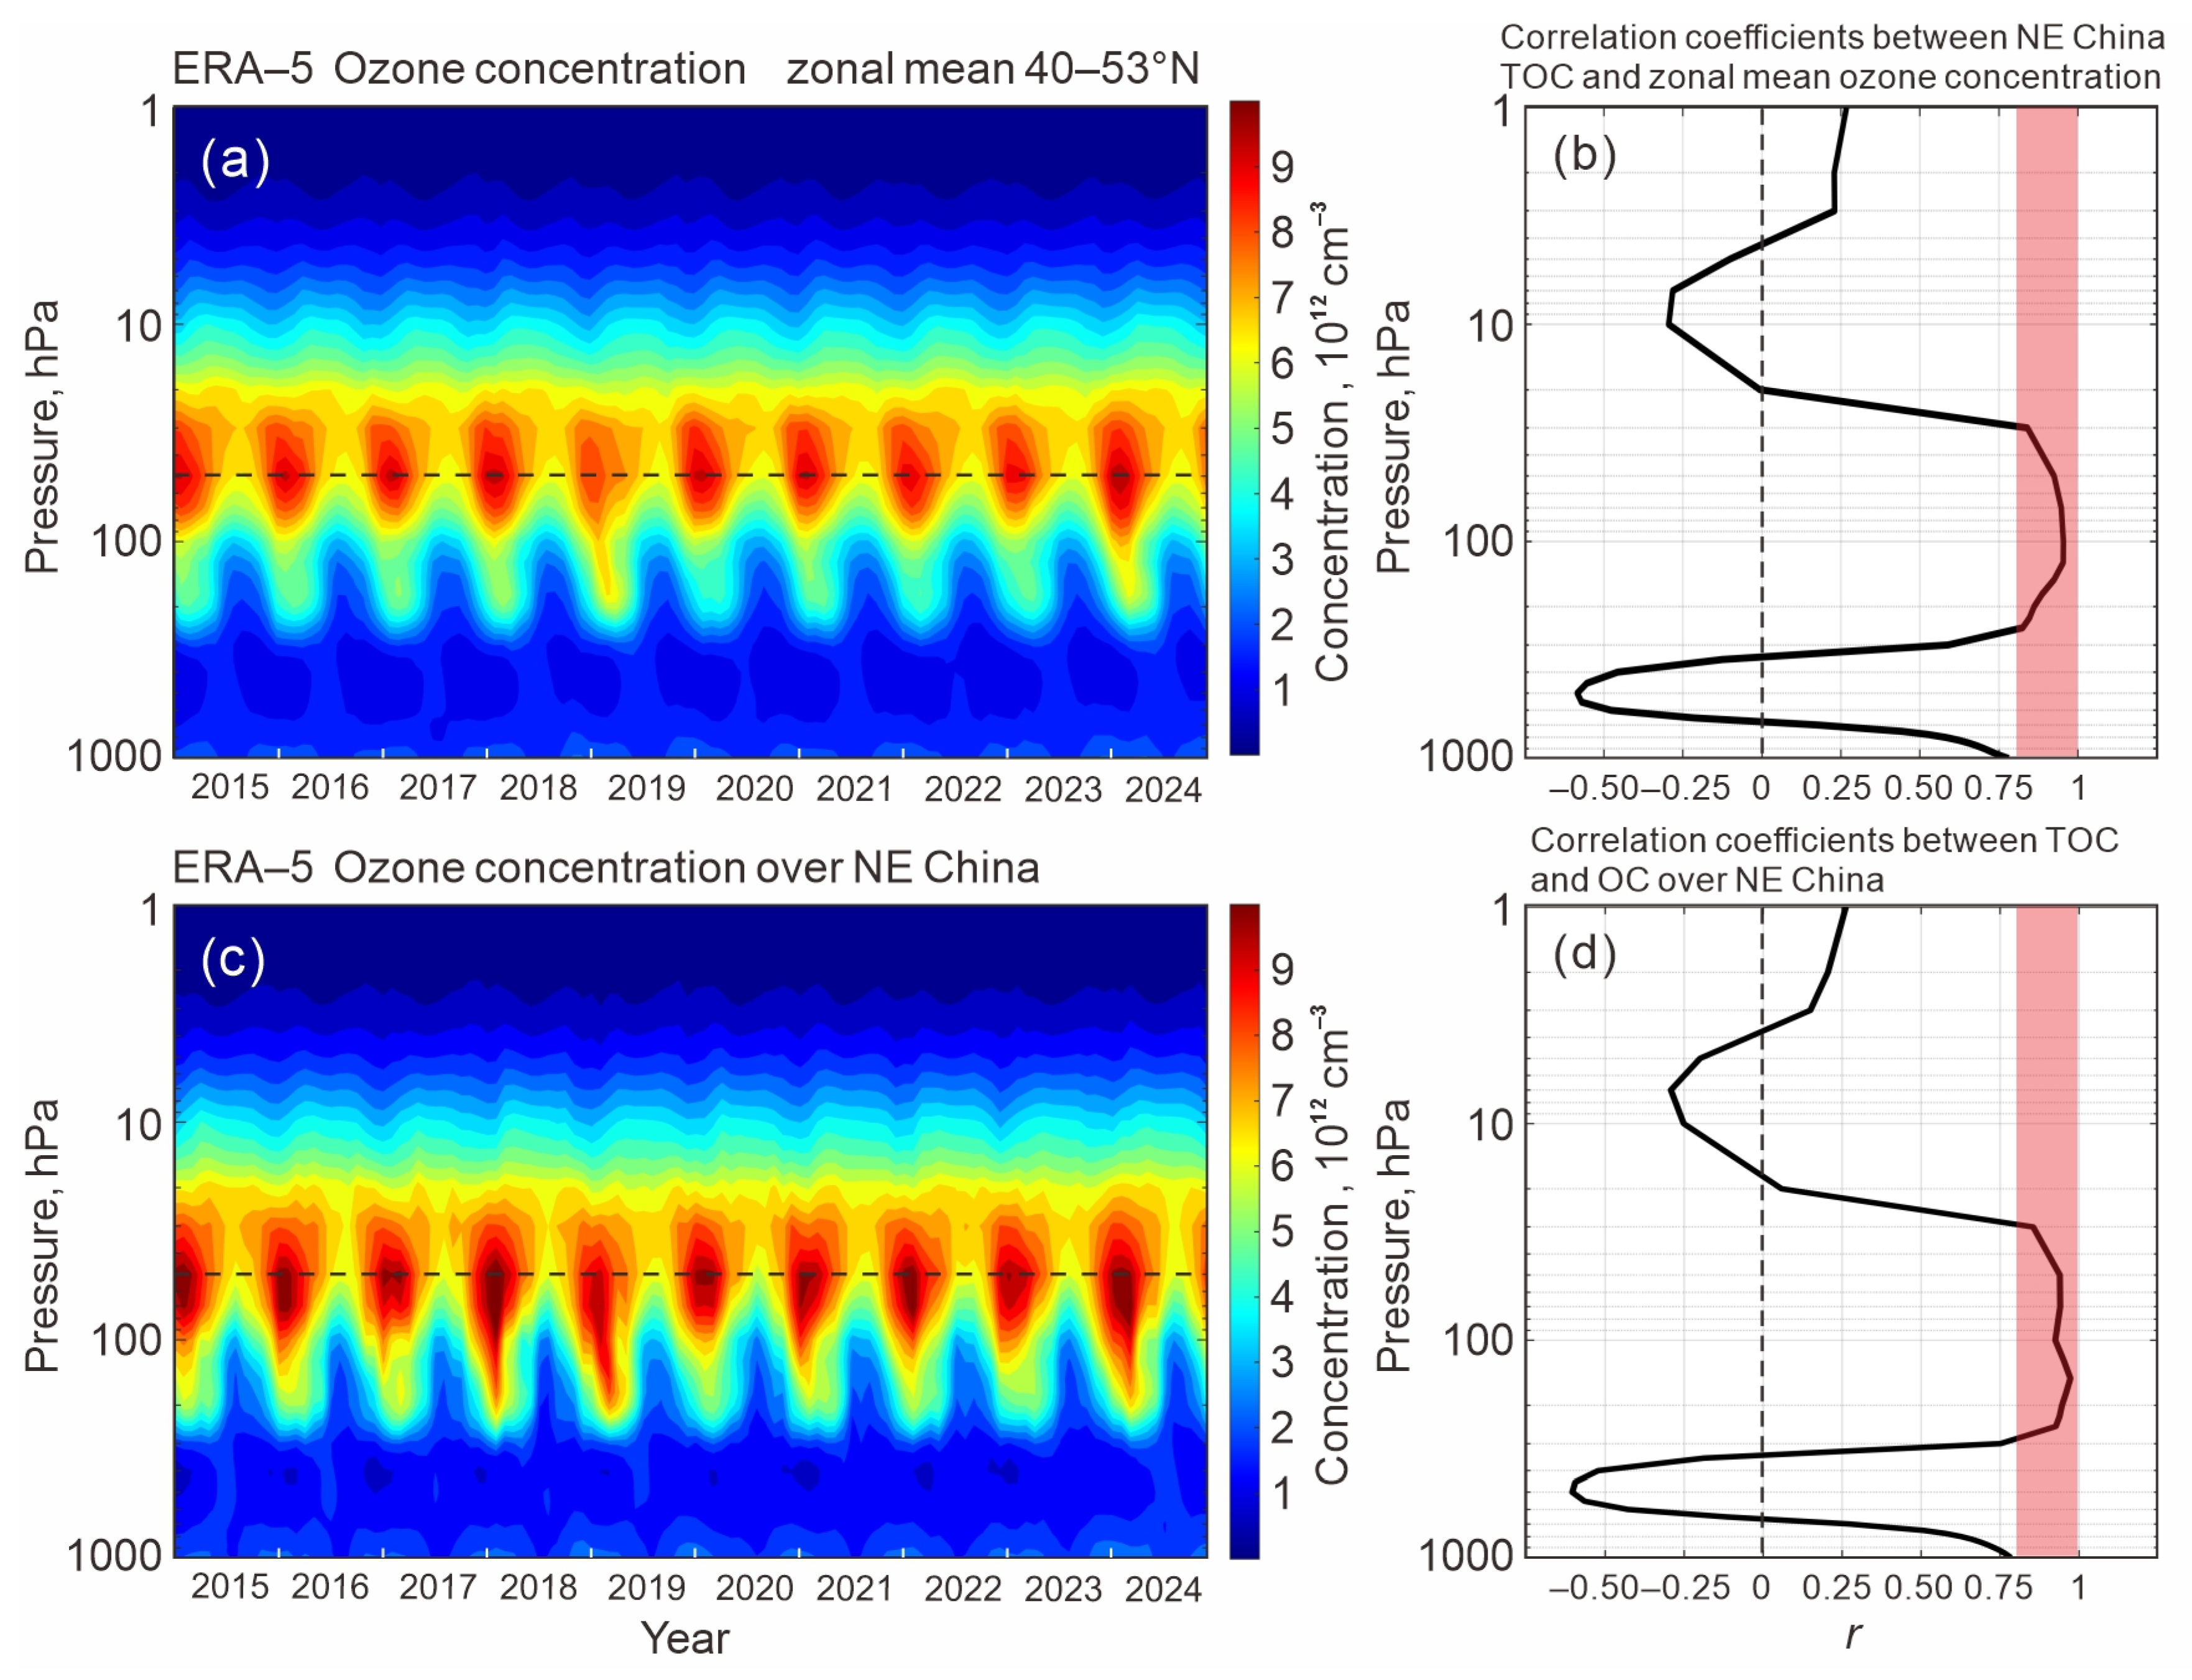
Figure 8a,c display the pressure–time cross-sections of ozone concentration from the ERA5 dataset for the zonal mean at 40–53°N and the NE China region, respectively. The horizontal axis spans 2015 to 2024, while the vertical axis represents pressure (ranging from 1 to 1000 hPa, on a logarithmic scale), with the color bar quantifying ozone concentration (units: 1012 cm−3). A dashed horizontal line marks the 50 hPa stratospheric level: across all years, ozone concentration peaks near this 50 hPa level. The concentration peaks are higher over NE China (larger than 9 × 1012 cm−3, Figure 8c), compared to zonal mean (8 × 1012 cm−3 to 9 × 1012 cm−3, Figure 8a), in agreement with Figure 2. Relatively low concentrations (typically 1 ÷ 2 × 1012 cm−3) are found in the lower tropospheric range (approximately 1000 hPa) and at the stratopause level (near 1 hPa), revealing a distinct vertical stratification of ozone distribution.
Figure 8.
The ozone concentration at (a) the zonal mean 40–53°N region and (b) over NE China region in the pressure–time section between 2015 and 2024. Dashed horizontal lines mark the stratosphere level at 50 hPa (black, maximum level). Variation in Pearson correlation coefficients between TOC and (c) zonal mean and (d) NE China ozone concentrations with pressure. The red area represents high positive correlation (>0.8).
Figure 8b,d illustrate the variation in Pearson correlation coefficients r between NE China TOC and zonal mean and regional ozone concentrations, respectively, with pressure. The vertical axis also uses pressure, and the horizontal axis spans r-values from −0.75 to 1, with the red shaded area denoting a strong positive correlation (r > 0.8). The two correlation profiles are almost identical. The correlation coefficient fluctuates between about r = −0.5 and r = 0.7 in the tropospheric pressure range (e.g., 300–1000 hPa), but rises sharply to exceed r = 0.8 in the lower-stratospheric pressure region (corresponding to the red area, about 30–200 hPa), indicating a significant and strong positive linkage between TOC and ozone concentration in this stratospheric pressure range. Note that regional TOC correlates with regional ozone concentration in the lower stratosphere at slightly higher r-values (Figure 8d) than with the zonal mean concentration (Figure 8b).
The correlation weakens in the middle and upper stratosphere at the pressure levels < 30 hPa to values near r = −0.25 and r = 0.25 in annual variations (Figure 8b,d), but is statistically significant at the 99% confidence level (r = −0.29 for TOC–OC10 and r = 0.27 for TOC–OC1 in Table 1).
Table 1.
Pearson correlation coefficients between NE China TOC and zonal mean ozone concentration (OC). Correlations are statistically significant at the 99% confidence level when |r| ≥ 0.23 for annual data (N = 120) and |r| ≥ 0.46 for seasonal data (N = 30). The values significant at the 99% confidence level are in bold.
Table 1 displays the Pearson correlation coefficients (r) between NE China TOC and zonal mean ozone concentration (OC) at distinct vertical levels (from 1 hPa in the upper stratosphere to the surface) and seasons. Note the different criteria for the significance testing in the annual and seasonal variations due to different time series lengths. The 99% confidence level corresponds to r = 0.23 for N = 120 (Figure 8b) and r = 0.46 for N = 30 (Table 1), respectively. OC50 and OC100 make the largest contribution to interannual variations in TOC, with correlation coefficients between r = 0.63 and r = 0.95. The role of OC50 looks somewhat weaker (r = 0.63 to r = 0.92) than OC100 (r = 0.72 to r = 0.95), although OC50 is at the peak concentration by height (Figure 8a,c). Overall, the winter correlation coefficients are generally smaller than those observed in other seasons. Notably, the lowest correlation (TOC–OC100) with r = 0.72 is reached in winter, increases to r = 0.91–0.93 in spring–autumn, and reaches an annual maximum of r = 0.95.
Regarding the tropospheric and surface ozone concentrations, the correlation coefficient with TOC in Table 1 in winter is negligible (only r = 0.04 for TOC–OC500 and r = 0.06 for TOC–OCsurf). However, the response of OCsurf to TOC noticeably increases in spring (r = 0.60), summer (r = 0.83), autumn (r = 0.76), and annually (r = 0.78). Although the tropospheric ozone gives small contribution to TOC (Figure 8a,c), it is an important air pollutant that affects air quality in NE China [30,35,43]. The strong correlation of OCsurf with TOC in warm seasons and annually (Table 1) indicates its close coupling with maximum ozone levels in the lower stratosphere over the region (Figure 8d). At 10 hPa and 1 hPa, in the middle and upper stratosphere, respectively, variable r-values between TOC and OC10 and OC1, in both sign and magnitude, are observed. This phenomenon, along with the connection between OCsurf and TOC, warrants further study into seasonal variability.
3.6. Correlation Between Ozone and Temperature
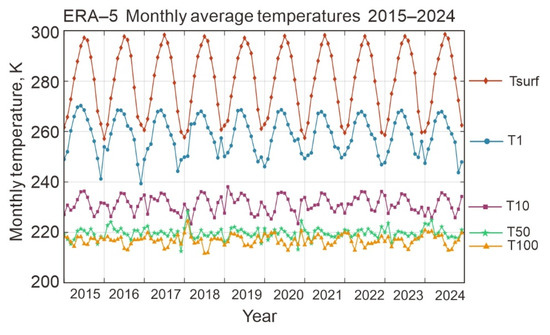
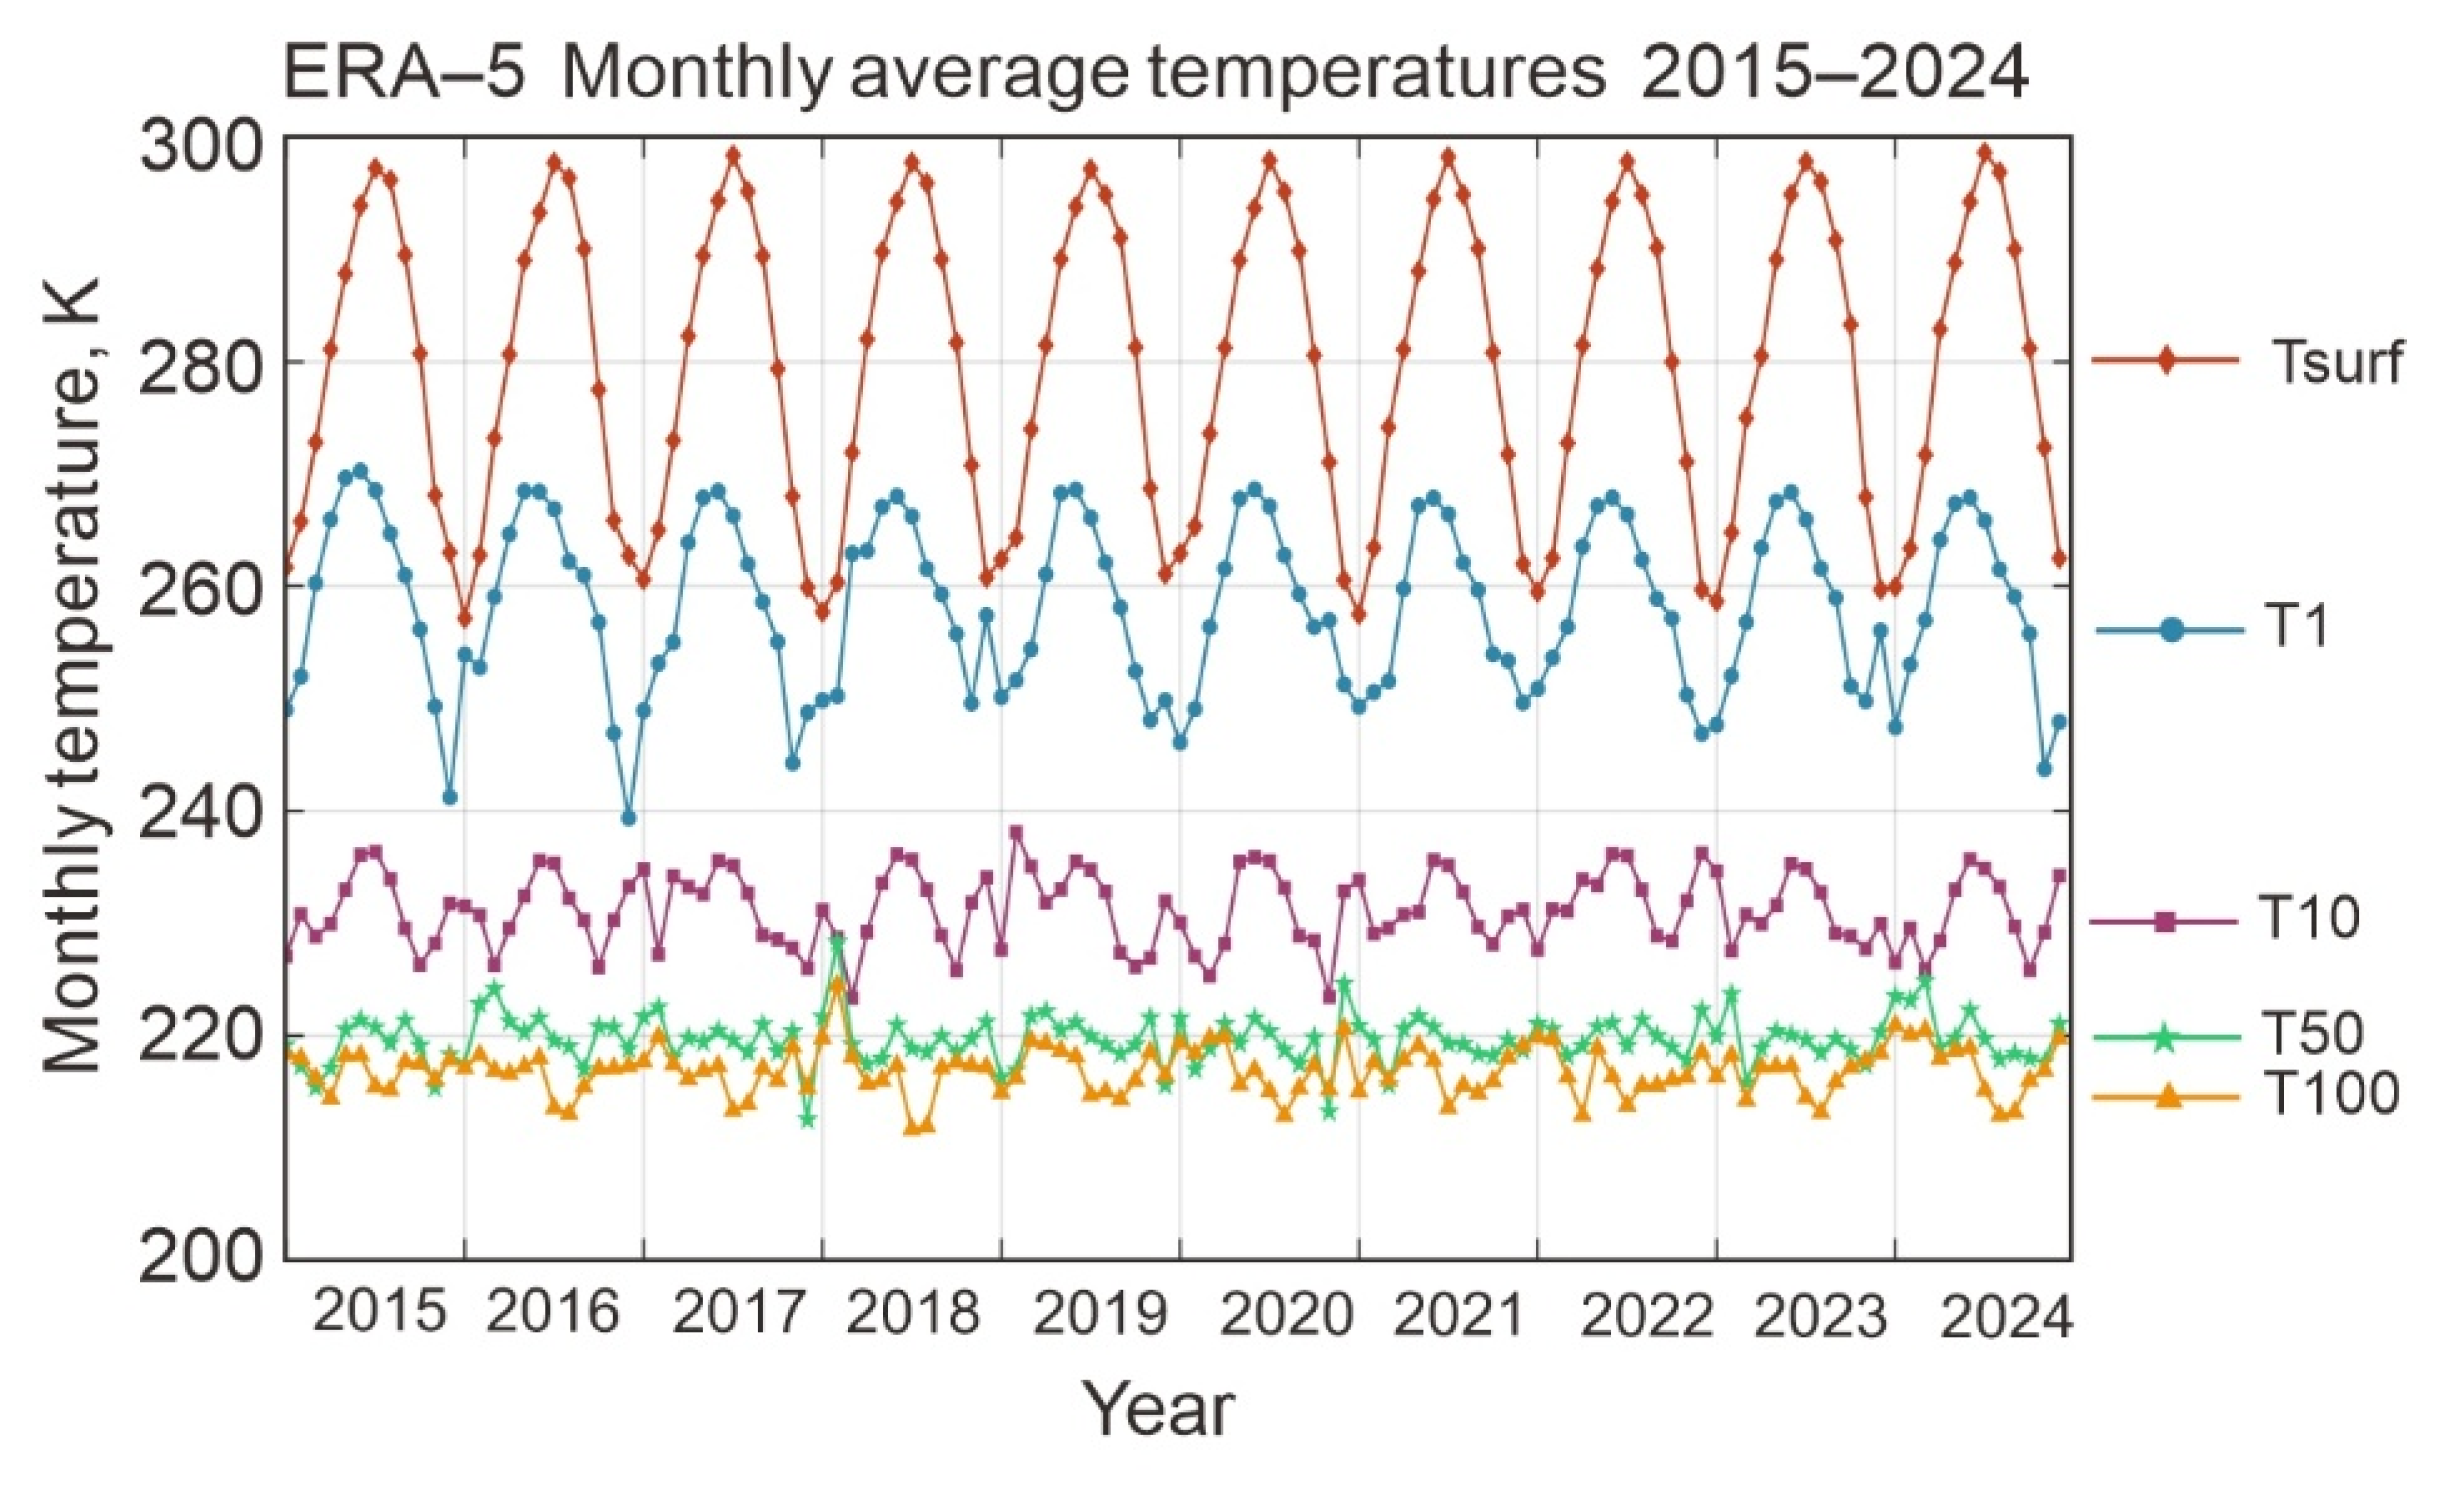
Figure 9 shows the monthly average temperatures across four atmospheric layers (1 hPa, 10 hPa, 100 hPa, and the surface) over the NE China domain during 2015–2024. The surface temperature Tsurf (reddish-orange curve in Figure 9) is the highest compared with the pressure levels presented and fluctuates most broadly (~260 K to ~300 K). The 1 hPa temperature T1 (blue curve) varies between ~240 K and ~270 K, and the 10 hPa temperature T10 (purple curve) stays relatively stable around ~230 K. The 50 and 100 hPa temperatures, T50 and T100 (green and orange curves), are the lowest (~220 K). With the exception of T50 and T100, the temperature series exhibit clear annual seasonal fluctuations with periodic peaks and troughs matching the region’s climatic cycles.
Figure 9.
Variations in monthly average temperatures at 1 hPa, 10 hPa, 50hPa, 100 hPa, and the surface (T1, T10, T50, T100, Tsurf) over the NE China region, 40–53°N, 115–135°E, during 2015–2024.
Table 2 presents Pearson correlation coefficients between the TOC and temperatures at 1 hPa, 10 hPa, 50 hPa, 100 hPa, and at the surface Tsurf, shown in Figure 9, as well as between Tsurf and stratospheric temperatures, across annual and seasonal (winter, spring, summer, autumn) time scales.
Table 2.
Pearson correlation coefficients between TOC and temperature over Northeast China. The values significant at the 99% confidence level are in bold.
The correlation results, paired with the layered temperature ranges, underscore altitude-dependent dynamics. The T50 and T100 temperatures represent the coldest lower-stratospheric layers (Figure 9) and show a moderate to strong positive correlation with TOC, in agreement with Table 1 for ozone concentration at these levels. The role of T100 in TOC variations in certain seasons, as shown in Table 2, appears to be somewhat more significant (r = 0.59 to r = 0.92) than T50 (r = 0.58 to r = 0.88), as does OC100 compared to OC50 in Table 1. T1 and T10 show variable r-values in both sign and magnitude, similar to OC1 and OC2 in Table 1. Since 100 hPa and 50 hPa are at the ozone maximum in the ozone vertical profile (Figure 8a,c), and the lower-stratospheric temperature is primarily regulated by ozone changes [21], the strong covariation of ozone and temperature at these pressure levels with TOC (Table 1 and Table 2) is crucial for the variability of TOC. Although statistically significant correlations are also found at lower and higher layers (Figure 8d and Table 1 and Table 2), they are less important in TOC variability due to very low ozone concentrations (Figure 8a,c).
Except for winter, there is a strong correlation with TOC–Tsurf in Table 2, but, in contrast to TOC–OCsurf in Table 1, it is negative in all seasons, and Tsurf is negatively correlated with the lower-stratospheric temperatures T100 and T50 as well. Thus, in warm seasons of spring–autumn, OCsurf and Tsurf in NE China are in positive and negative relations to TOC, respectively; that is of particular importance, given the diversity of processes affecting tropospheric and surface ozone in this region [30,35,36,37,43]. Winter stands out for its weak, statistically insignificant correlations, r = 0.06 for TOC–OCsurf (Table 1), r = −0.04 for TOC–Tsurf, and r = −0.03÷−0.19 for Tsurf with stratospheric temperatures (Table 2), making winter the season with the lowest coherence between the analyzed variables.
4. Discussion
Based on MSR-2 satellite reanalysis data, ERA5 reanalysis data, and ground-based observation data from Longfengshan Station during 2015–2024, this study systematically analyzed the long-term trend, seasonal variation, and climatological characteristics of total ozone column (TOC) in NE China (40–53°N, 115–135°E), as well as its vertical correlation with ozone concentration and temperature. It reveals the key driving mechanisms and regional particularities of ozone distribution in mid- to high-latitude regions.
4.1. Spatiotemporal Characteristics of TOC
There was no significant long-term trend in TOC over NE China from 2015 to 2024, but it remained consistently higher than the zonal average at the same latitude (40–53°N). This regional difference of approximately 25 DU (7.4%) was mainly contributed to by the high values in winter (Figure 2). This phenomenon stems from large-scale regulation of ozone circulation in mid- to high-latitude regions. In winter, the Northern Hemisphere BDC intensifies, transporting high-concentration ozone meridionally through tropical upwelling and extratropical downwelling and influencing the vertical profile of stratospheric ozone and temperature [4]. As a transition zone between mid- and high-latitudes, NE China is more prominently affected by this circulation. The high TOC patterns in the NH mid-latitudes in winter–spring are formed by quasi-stationary waves with the presence of zonal wave 1 and wave 2 [39]. NE China, in terms of longitude and latitude, falls within the climatologically extended TOC maximum over East Asia, reaching up to 450 DU (Figure 5a). At the same time, a large mid-latitude sector of 30°W–90°E is filled with relatively low TOC levels of approximately 370–380 DU (Figure 5a). The latter circumstance lowers zonal mean values relative to regionally averaged values, explaining the 25 DU excess of the NE China TOC over the zonal mean TOC in Figure 2b.
The correlation coefficient between TOC in NE China and the zonal average of the same latitude zone reaches r = 0.91 (Section 3.1). This indicates that interannual variations in both time series are mainly driven by global-scale atmospheric processes associated with BDC and QSW, which are reflected in regional processes. However, there are obvious seasonal differences: TOC in summer is close to the zonal average level (Figure 2). The large-scale circulation anomaly in winter, which causes a zonally asymmetric pattern of the TOC maximum (Figure 5a), is significantly weakened in summer, leading to a more zonally uniform TOC field (Figure 5b). Following the cessation of the BDC and related ozone transport into the extratropical stratosphere, the photochemical loss in summer–autumn reduces stratospheric ozone levels [4], and TOC approaches its annual minimum in both NE China (Figure 3a and Figure 4, bottom two panels) and throughout the NH mid-latitudes [7,44].
We emphasize that NE China lies in the transition zone between the polar high-ozone region and the subtropical low-ozone region (Figure 4, Figure 5 and Figure 6). Affected by the latitude gradient and circulation partitioning, which resulted in the QSW structure in TOC in winter, the spatial heterogeneity is significant. TOC in the NE can reach 415 DU under the influence of the polar TOC expansion due to the QSW structure, while that in the southwestern part is close to the subtropical level of 330 DU (Figure 5a). This is a climatological regional property in the TOC pattern, which has not previously been distinguished. During summer and autumn (JAS), TOC across the entire region is uniformly stable at approximately 300 DU (Figure 5b), mainly due to the cessation of BDC and photochemical ozone loss, as noted above.
The seasonal fluctuations in the TOC pattern further reflect the influence of atmospheric dynamics (Figure 4 and Figure 6). The variance and amplitude ranges in NE China are the largest in February (Figure 3b), corresponding to intense planetary wave activities in winter [4]. In addition, the abnormally high TOC values in NE China in February 2018 and March 2024 (indicated by the corresponding curves in Figure 3a) increased by approximately 50 DU compared to the 10-year average. This is consistent with the estimate for March 2024, when Arctic TOC was 60 DU higher than the 1979–2023 average, based on Microwave Limb Sounder (MLS) data [26]. The MLS data show that this record ozone anomaly was concentrated in the lower stratosphere and can be linked to extreme planetary wave events that forced poleward and downward ozone advection into that layer [26]. The overall consistency of mid-latitude and polar TOC anomalies confirms the special connection between NE China and higher latitudes through wave activity and the QSW structure in TOC.
The variance is smallest from July to October (Figure 3b), indicating a limitation on upward wave propagation due to stable easterly stratospheric circulation during these months [4]. This speculation needs to be further verified by combining more observational and model data.
During 2015–2022, the local ground-based observation data from Longfengshan Station were highly consistent with the satellite-derived average TOC in NE China (Figure 7b), with monthly average differences always within ±15 DU (Figure 7c), verifying the reliability of MSR-2 satellite data in this region. The consistency between station and satellite data demonstrates the effective characterization of satellite reanalysis data of spatiotemporal variation in regional ozone. However, there are subtle seasonal differences: the regional average TOC in winter is slightly higher than the observed value at Longfengshan Station, while it is close to or slightly lower in summer (Section 3.4). This may be due to the station’s location relative to the climatological TOC field, which tends to seasonally redistribute the TOC level in NE China (Figure 5).
4.2. Correlations Between TOC, Ozone Concentration, and Temperature
The vertical structure of ozone shows that ozone concentration averaged over both zones 40–53°N and the NE China domain reaches a peak in the stratosphere at 50 hPa (dashed line in Figure 8a,c). Annually, this peak, as well as the TOC peak (Figure 2, Figure 3a, Figure 7a,b and Figure 8a,b) are reached in winter. This is consistent with the photochemical mechanism of stratospheric ozone formation [46] and the winter increase in lower-stratosphere ozone concentration driven by the strong intensification in the BDC and associated enhanced winter ozone transport [4]. The TOC is significantly positively correlated with ozone concentration in the stratospheric region of 30–200 hPa (r = 0.8–0.9, Figure 8b,d), confirming that TOC variation is mainly contributed by the lower-stratospheric ozone. The contribution ranges from 64% to 81% of the TOC variability.
The correlation between ozone concentration and TOC shows obvious dependence on altitude with variable sign and magnitude: if the lower-stratospheric ozone is significantly positively correlated with TOC, then the mid-tropospheric ozone at 400–600 hPa becomes negatively correlated, reaching r = −0.5, and is again in positive coupling with r = 0.75 near the surface (Figure 8b,d). The correlation in the middle stratosphere is lower (r = −0.25) and opposite in sign to that in the upper stratosphere (r = 0.25), but, as noted in Section 3.5, remains statistically significant at the 99% confidence level. Both tropospheric and mid/upper-stratospheric ozone variations make rather small contributions to TOC variations, as the corresponding ozone levels are much lower than in the lower stratosphere (Figure 8a,c). Based on these properties of the vertical ozone profile and r-values in Table 1, the determining indicator of TOC variability in NE China is the variability of ozone concentrations OC50 and OC100.
According to Chipperfield et al. [47], time series of ozone anomalies for 1998–2017, averaged from 60°S to 60°N, show approximately twice as much variation in the lower stratosphere as in the middle and upper stratosphere. A similar difference in ozone anomalies between 50 hPa and 125 hPa was observed over Europe in 1979–2004 [48]. It should be noted that the relative role of the lower-stratosphere pressure levels in the TOC variations has not previously been addressed. The relationship between the correlations in Table 1 and Table 2 indicates that the ozone maximum at 50 hPa (6–9 × 1012 cm−3) is a smaller contributor to TOC variations than ozone at 100 hPa (3–6 × 1012 cm−3, Figure 8a,c).
Most changes in the lower-stratospheric ozone are associated with dynamic processes [47]; however, their relative importance may differ at 50 hPa and 100 hPa. The 50 hPa level (near 20 km) may be more sensitive to ozone variability associated with downward transport from upper levels, driven by BDC [4]. In contrast, the 100 hPa level (16 km) is closer to the tropopause, which, through the evolution of tropospheric pressure systems, can elevate or descend within ±2 km around ~10 km [49] and affect ozone abundance here. The tropopause shift effect weakens with altitude and becomes negligible above ~25 km [50]. This may lead to the difference in the relative contribution of OC100 and OC50 to TOC variations in Table 1: the tropopause effect near 100 hPa may be relatively larger than the BDC effect near 50 hPa. Note that both pressure levels show maximum correlation in summer (r = 0.92–0.93, Table 1). The BDC activity is extremely weak in summer and prevailing tropospheric sources of variability may result in closer consistency in TOC–OC50/OC100 variations in summer. Because of such seasonal change in dynamical disturbances (e.g., winter–spring BDC intensification and change in cyclone–anticyclone frequency), the details of dominant patterns in correlative coupling between TOC and OC50/OC100 in all seasons cannot be fully explained in this limited discussion. It should include a more thorough analysis of the altitudinal differences in contributing sources.
Correlations between surface and stratospheric temperatures in Table 2 indicate significant negative coupling at 100 hPa and 50 hPa. This type of temperature interaction was analyzed in the recent case studies of the stratosphere’s impact on extreme weather events [51,52]. Our results, presented in Table 1 and Table 2, show that the surface and stratosphere in the NE China can be interdependent, with statistically significant correlations in the monthly mean time series over 2015–2024. This finding suggests additional opportunities for studying differences in regional weather and climate change.
The insignificant correlation of TOC–OCsurf/Tsurf in winter (Table 1 and Table 2) can mean that stratospheric intrusions play a negligible role in modulating surface ozone and temperature levels over NE China, even though winter peaks are usually observed in both TOC (Figure 2a) and intrusions [29,53]. Since TOC variability is dominated by ozone at 50 hPa and 100 hPa, the wintertime lower stratosphere cannot be regarded as a primary source for surface ozone and temperature variations. This winter decoupling between the stratosphere and the surface indicates that the tropospheric rather than stratospheric influence prevails in winter surface temperature and ozone variations. Under conditions of low winter temperatures (the average temperature in NE China in winter is 21 °C lower than that in summer) and low sunshine duration, surface insolation is minimal, the thermal threshold for triggering photochemical ozone synthesis is not reached [37], and temperature ceases to be a factor influencing ozone fluctuations [8]. Uncoupled from the stratosphere and surface temperature, winter OCsurf seems to vary mainly with anthropogenic emissions, such as increased NOx and CO, and their regional transport [54].
In contrast, surface ozone exhibits a pronounced seasonal maximum in spring and summer mainly driven by in situ photochemical production and regional air transfer [8,37]. In warm seasons, higher surface temperatures accelerate ozone production efficiency [35] and the ozone pollution episodes are correlated with high temperature and long sunshine duration [38]. The prominent maximum correlation coefficients in Table 1 during spring–autumn likely reflect the combined effects of intensified photochemical activity and favorable meteorological conditions for ozone formation, while not excluding stratosphere–troposphere exchange during these seasons, as documented in previous studies [29,30,36].
As the TOC level is determined by the prevailing contribution of the lower-stratospheric ozone (Figure 8a,c), the positive correlation of TOC-OCsurf in spring–autumn in Table 1 implies that higher ozone level in the lower stratosphere may be associated with higher ozone level at the surface through vertical transport [29,30]. At the same time, the negative correlation of TOC–Tsurf in Table 2 may most likely reflect the association of positive ozone anomalies in the lower stratosphere with negative anomalies in the surface temperature due to the tropopause descent [51,52]. This process is accompanied by a shift in colder air downward, as observed in cold cyclonic systems [30,55]. The NE China cold vortex (NCCV) is more active in spring–summer and is associated with deep stratospheric intrusions and abnormal surface ozone concentrations [30,36,43,55]. Anomalies in the wind field in the NCCV region induce a downward motion, leading to an increase in the surface ozone concentration. The NCCV events bringing high ozone and cold air to the surface can contribute to the positive/negative association between TOC and OCsurf/Tsurf.
The novelty of this study is as follows: we have quantified for the first time the difference in the strength of the lower stratosphere–surface coupling over NE China in different seasons, finding that the coupling is extremely weak in winter, but strongest in summer. The summer stratosphere is dominated by easterly winds, which, unlike winter westerly winds, strongly suppress the upward propagation of planetary waves [4] and make downward forcing from the stratosphere less likely. Nevertheless, the strong negative correlation between temperatures in the lower stratosphere and at the surface (Table 2) indicates that thermal coupling between these layers may be significantly present in NE China in summer. The possible mechanism can be related to variability in the NCCV intensity and frequency [30,36,43,55].
Our results indicate that (1) unlike the conventional understanding that stratosphere–troposphere exchange is more active in winter [4,53], the lower stratosphere in NE China is closely coupled with the surface in summer, and (2) the connection is evident not only in surface ozone, but also in surface temperature. This provides a new regional perspective for understanding seasonal cycle in stratosphere–troposphere interactions in East Asian mid-latitudes.
5. Conclusions
This study analyzes the variations and trends in total ozone column (TOC), ozone concentration and air temperature over Northeast (NE) China spanning 2015 to 2024 and using the Multi-Sensor Reanalysis Version 2 (MSR-2) and ERA5 datasets. Data from local ground-based observations at the WMO/GAW Longfengshan Station in 2015–2022 are also used. The key findings are closely linked to the Brewer–Dobson circulation (BDC), the structure of quasi-stationary waves (QSWs) and the coupling between the lower stratosphere and the surface. It is shown that the TOC over NE China in winter remains consistently higher than the zonal mean within the same latitude band. This pattern is likely shaped by the BDC-related poleward transport of ozone-rich air, persistent expansion of the high polar TOC into the mid-latitudes, and the position of the study region in the TOC field formed by the QSW. The weakening of wave activity and BDC due to easterly circulation in the stratosphere, combined with photochemical ozone loss, results in an annual TOC minimum in summer and early autumn, consistent with previous studies. The correlative relationships indicate seasonally dependent coupling between the lower-stratospheric and surface ozone and temperature.
The main findings in this work can be summarized as follows:
- (1)
- The TOC over NE China shows no statistically significant linear trend throughout the 2015–2024 period. The excess of annual mean TOC in the study region relative to the zonal mean TOC is approximately 25 DU (7.4%). It is contributed mainly by the higher winter TOC values, which is a result of the location of NE China in the BDC/QSW-induced TOC field. In contrast, the minimum TOC values in summer, both regional and zonal means, are close to each other, which indicates the cessation of high BDC/QSW intensity and leveling of TOC levels along the studied latitudinal zone. The strong correlation between the regional and zonal mean TOC (r = 0.91) suggests that the annual TOC dynamics in NE China are mainly driven by large-scale atmospheric processes.
- (2)
- Seasonal cycle demonstrates TOC maximum and minimum in February and August, respectively, occurring one month and two months earlier than typical in the NH mid-latitudes. This time shift is because the high TOC levels fill more completely mid-latitudes later (in spring) than in the NE China region (in winter) due to seasonal evolution of the BDC intensity and QSW structure. TOC field maps also show that a similar delay occurs in reaching the annual minimum: in summer and autumn, respectively.
- (3)
- As a transition zone between the polar and subtropical latitudes, NE China in climatology for January–March 2015–2024 combines the highest TOC levels of ~415 DU in the NE part of the region and the lowest TOC of ~330 DU in the southwestern (SW) part. The NE–SW direction of significant TOC decrease is a characteristic feature of the TOC distribution over NE China in winter and spring, which should be taken into account when analyzing ozone observations and studying the stratosphere–troposphere coupling.
- (4)
- The ground-based observations at Longfengshan Station in 2015–2022 closely match MSR-2 data averaged over NE China. The monthly mean difference varies within ±15 DU (±4.2% of a 7-year annual mean), validating the station’s reliability as a representative proxy for regional TOC variability.
- (5)
- The stratospheric ozone concentrations (OCs) at 50 hPa and 100 hPa are the main contributors to monthly mean TOC variability over NE China in 2015–2024. The correlations of TOC with the 50 hPa OC maximum (OC50) is systematically lower than with OC100 in all four seasons. The highest difference is in spring, with r = 0.63 and r = 0.91, respectively. The distinct importance of the two close pressure levels in the TOC variations may indicate a weaker contribution of ozone downwelling variability above 50 hPa due to the BDC, compared to the change in the partial ozone column below 100 hPa due to the tropopause effect associated with tropospheric pressure systems.
- (6)
- It has been found that the surface ozone concentration (OCsurf) in the region is negligibly correlated with TOC in winter (only r = 0.06). Since TOC is mainly supplied by lower-stratospheric ozone, the low TOC–OCsurf correlation suggests insignificant association between lower-stratospheric and surface ozone concentrations in NE China in winter. In contrast, significant correlation is observed in spring (r = 0.60), summer (r = 0.83), autumn (r = 0.76), and annually (r = 0.78), indicating a close connection between the lower stratosphere and the surface.
- (7)
- In agreement, the surface temperature (Tsurf) shows a similarly significant but negative relationship with TOC in spring (r = −0.74), summer (r = −0.59, and autumn (r = −0.87), as well as annually (r = −0.68), and negligible in winter (r = −0.04), which again indicates a close lower stratosphere−surface connection during the warm seasons and which has been poorly investigated in the study region previously.
The processes accompanying the Northeast China cold vortex (NCCV) phenomenon may play an important role in the revealed relations (6) and (7). NCCV is a persistent weather system unique to the climate of Northeast China, which is more active in spring and summer. It is associated with the tropopause folding and deep stratospheric intrusions that carry cold air and high ozone concentrations to the surface. At the same time, the tropopause descent results in TOC increase. Therefore, the NCCV events bringing high ozone and cold air to the surface can be an important factor in the positive/negative association between TOC and OCsurf/Tsurf.
These findings enrich understanding of the dynamics of ozone distribution in mid-latitudes of East Asia and the interaction between the stratosphere and the surface in terms of the relationship between TOC, ozone concentration and air temperature. The results of this work highlight how the effects of BDC and QSW may underpin the unique traits of the TOC pattern and seasonality in NE China relative to the zonal mean counterparts. However, the specific ways in which different factors interact over the region to provide significant stratosphere–surface coupling remain to be explored. Future research will combine more site-based observational data with a reanalysis dataset to investigate the underlying mechanisms in depth, including refined analysis of links among, in particular, Longfengshan Station data, regional TOC, BDC transport processes, QSW patterns, and the tropopause response to tropospheric pressure anomalies. Such efforts will provide more robust support for a comprehensive understanding of ozone dynamics in East Asian mid-latitudes.
Author Contributions
Conceptualization, Y.S., O.E., and G.M.; data curation, Y.S. and O.E.; formal analysis, Y.S.; investigation, Y.S., O.E., and G.M.; methodology, Y.S., O.E., and G.M.; project administration, G.M.; software, Y.S. and O.E.; supervision, G.M.; validation, Y.S. and G.M.; visualization, Y.S. and O.E.; writing—original draft, Y.S., O.E., and G.M.; writing—review and editing, Y.S., O.E., and G.M. Each author contributed to the interpretation and discussion of the results and edited the manuscript. All authors have read and agreed to the published version of the manuscript.
Funding
This research was funded by Heilongjiang University, Harbin, China, grant number 2025-KYYWF-ZR0422, 2025.
Data Availability Statement
Data will be made available on request.
Acknowledgments
The authors thank three anonymous reviewers for helpful comments, remarks and suggestions. Monthly mean TOC data are from the Multi-Sensor Reanalysis Version 2 (MSR-2) at https://www.temis.nl/protocols/o3field/o3mean_msr2.php, accessed on 31 May 2026. Ozone concentration and air temperature at selected pressure levels are derived from the European Centre for Medium-Range Weather Forecasts (ECMWF) ERA5 dataset (https://cds.climate.copernicus.eu/datasets/reanalysis-era5-pressure-levels?tab=overview, accessed on 7 February 2026). The Longfengshan Station data are used from the World Ozone and Ultraviolet Radiation Data Centre (WOUDC) platform (https://woudc.org/en/data/stations/?id=326&lang=en, accessed on 12 February 2026).
Conflicts of Interest
The authors declare no conflicts of interest.
Abbreviations
The following abbreviations are used in this manuscript:
| TOC | Total Ozone Column |
| BDC | Brewer–Dobson Circulation |
| QSW | Quasi-Stationary Wave |
| DU | Dobson Units |
| ERA5 | ECMWF Reanalysis Version 5 |
| MSR-2 | Multi-Sensor Reanalysis Version 2 |
| NE China | Northeast China |
| NH | Northern Hemisphere |
| OC | Ozone Concentration |
| DJF | December, January, and February |
| JJA | June, July, and August |
| JFM | January, February, and March |
| JAS | July, August, and September |
References
- Grant, W.B. Solar Ultraviolet Radiation and Mortality from Skin Cancer: An Ecological Study. Science 1988, 242, 1111–1112. [Google Scholar] [CrossRef] [Scilit] [PubMed]
- Diffey, B.L. Climate Change, Ozone Depletion and the Impact on Ultraviolaet Exposure of Human Skin. Phys. Med. Biol. 2004, 49, R1–R11. [Google Scholar] [CrossRef] [Scilit] [PubMed]
- Lucas, R.M.; Takizawa, Y.; Rhodes, L.E.; Yazar, S.; Young, A.R.; Norval, M.; de Gruijl, F.R.; Sinclair, C.A.; Neale, R.E. Human Health in Relation to Exposure to Solar Ultraviolet Radiation Under Changing Stratospheric Ozone and Climate. Photochem. Photobiol. Sci. 2019, 18, 641–680. [Google Scholar] [CrossRef] [Scilit] [PubMed]
- Shepherd, T.G. Transport in the Middle Atmosphere. J. Meteor. Soc. Jpn. 2007, 85, 165–191. [Google Scholar] [CrossRef] [Scilit]
- Wang, Y.; He, Y.; Sheng, Z.; Sun, J.; Qin, Z.; Tao, Y. Vertical Ozone Transport by Rossby Wave Breaking in Upper Troposphere-Lower Stratosphere Is Weakening. Atmos. Environ. 2025, 343, 120999. [Google Scholar] [CrossRef] [Scilit]
- Shepherd, T.G.; McLandress, C. A Robust Mechanism for Strengthening of the Brewer–Dobson Circulation in Response to Climate Change. J. Atmos. Sci. 2011, 68, 784–797. [Google Scholar] [CrossRef] [Scilit]
- Bozhkova, V.; Liudchik, A.; Umreiko, S. Long-Term Trends of Total Ozone Content Over Mid-Latitudes of the Northern Hemisphere. Int. J. Remote Sens. 2019, 40, 5216–5229. [Google Scholar] [CrossRef] [Scilit]
- Chen, Z.; Xie, Y.; Liu, J.; Shen, L.; Cheng, X.; Han, H.; Yang, M.; Shen, Y.; Zhao, T.; Hu, J. Distinct Seasonality in Vertical Variations of Tropospheric Ozone Over Coastal Regions of Southern China. Sci. Total Environ. 2023, 874, 162423. [Google Scholar] [CrossRef] [Scilit] [PubMed]
- Diallo, M.; Ern, M.; Ploeger, F. The Advective Brewer–Dobson Circulation in the ERA5 Reanalysis: Climatology, Variability, and Trends. Atmos. Chem. Phys. 2021, 21, 7515–7544. [Google Scholar] [CrossRef] [Scilit]
- Kumar, C.; Dogra, A.; Yadav, S.; Tandon, A.; Attri, A.K. Apportionment of Long-Term Trends in Different Sections of Total Ozone Column Over Tropical Region. Environ. Monit. Assess. 2022, 194, 298. [Google Scholar] [CrossRef] [Scilit] [PubMed]
- Boccacci, G.; Bertolin, C.; Cavazzani, S.; Siani, A.M. Multi-year Total Ozone Column Variability at Three Norwegian Sites: Influence of Northern Hemisphere Climatic Indices. Atmos. Environ. 2023, 310, 119966. [Google Scholar] [CrossRef] [Scilit]
- Farman, J.C.; Gardiner, B.G.; Shanklin, J.D. Large Losses of Total Ozone in Antarctica Reveal Seasonal ClO–NOₓ Interaction. Nature 1985, 315, 207–210. [Google Scholar] [CrossRef] [Scilit]
- Hossaini, R.; Chipperfield, M.P.; Montzka, S.A.; Leeson, A.A.; Dhomse, S.S.; Pyle, J.A. The Increasing Threat to Stratospheric Ozone from Dichloromethane. Nat. Commun. 2017, 8, 15962. [Google Scholar] [CrossRef] [Scilit] [PubMed]
- Zeng, G.; Morgenstern, O.; Williams, J.H.T.; O’Connor, F.M.; Griffiths, P.T.; Keeble, J.; Deushi, M.; Horowitz, L.W.; Naik, V.; Emmons, L.K.; et al. Attribution of Stratospheric and Tropospheric Ozone Changes Between 1850 and 2014 in CMIP6 Models. J. Geophys. Res. Atmos. 2022, 127, e2022JD036452. [Google Scholar] [CrossRef] [Scilit]
- Velders, G.J.M.; Andersen, S.O.; Daniel, J.S.; Fahey, D.W.; McFarland, M. The Importance of the Montreal Protocol in Protecting Climate. Proc. Natl. Acad. Sci. USA 2007, 104, 4814–4819. [Google Scholar] [CrossRef] [Scilit] [PubMed]
- Chipperfield, M.P.; Bekki, S.; Dhomse, S.; Harris, N.R.P.; Hassler, B.; Hossaini, R.; Steinbrecht, W.; Thiéblemont, R.; Weber, M. Detecting Recovery of the Stratospheric Ozone Layer. Nature 2017, 549, 211–218. [Google Scholar] [CrossRef] [Scilit] [PubMed]
- Egorova, T.; Sedlacek, J.; Sukhodolov, T.; Karagodin-Doyennel, A.; Zilker, F.; Rozanov, E. Montreal Protocol’s Impact on the Ozone Layer and Climate. Atmos. Chem. Phys. 2023, 23, 5135–5158. [Google Scholar] [CrossRef] [Scilit]
- Friedel, M.; Chiodo, G.; Sukhodolov, T.; Rozanov, E.; Egorova, T. Weakening of Springtime Arctic Ozone Depletion with Climate Change. Atmos. Chem. Phys. 2023, 23, 10235–10254. [Google Scholar] [CrossRef] [Scilit]
- Sofieva, V.F.; Szelag, M.E.; Kramarova, N.; Damadeo, R.; Steinbrecht, W.; Petropavlovskikh, I.; Vigouroux, C.; Maillard Barras, E.; Zawada, D.; Tourpali, K.; et al. Updated Global and Regional Trends of Stratospheric Ozone Profiles. EGUsphere 2025. preprint. [Google Scholar] [CrossRef] [Scilit]
- Kuttippurath, J.; Kumar, P.; Nair, P.J.; Pandey, P.C. Emergence of Ozone Recovery Evidenced by Reduction in the Occurrence of Antarctic Ozone Loss Saturation. npj Clim. Atmos. Sci. 2018, 1, 42. [Google Scholar] [CrossRef] [Scilit]
- Zhou, L.; Xia, Y.; Zhao, C. Influence of Stratospheric Ozone Changes on Stratospheric Temperature Trends in Recent Decades. Remote Sens. 2022, 14, 5364. [Google Scholar] [CrossRef] [Scilit]
- Hu, D.Z.; Tian, W.S.; Xie, F.; Wang, C.X.; Zhang, J.K. Impacts of Stratospheric Ozone Depletion and Recovery on Wave Propagation in the Boreal Winter Stratosphere. J. Geophys. Res. Atmos. 2015, 120, 8299–8317. [Google Scholar] [CrossRef] [Scilit]
- Lozitsky, V.; Grytsai, A.; Klekociuk, A.; Milinevsky, G. Influence of Planetary Waves on Total Ozone Column Distribution in Northern and Southern High Latitudes. Int. J. Remote Sens. 2011, 32, 3179–3186. [Google Scholar] [CrossRef] [Scilit]
- Coldewey-Egbers, M.; Loyola, D.G.; Lerot, C.; Van Roozendael, M. Global, Regional and Seasonal Analysis of Total Ozone Trends Derived from the 1995–2020 GTO-ECV Climate Data Record. Atmos. Chem. Phys. 2022, 22, 6861–6878. [Google Scholar] [CrossRef] [Scilit]
- Shin, D.; Oh, Y.-S.; Seo, W.; Chung, C.-Y.; Koo, J.-H. Total Ozone Trends in East Asia from Long-Term Satellite and Ground Observations. Atmosphere 2021, 12, 982. [Google Scholar] [CrossRef] [Scilit]
- Newman, P.A.; Lait, L.R.; Kramarova, N.A.; Coy, L.; Frith, S.M.; Oman, L.D.; Dhomse, S.S. 2024 Arctic Total Column Ozone. Geophys. Res. Lett. 2024, 51, e2024GL110924. [Google Scholar] [CrossRef] [Scilit]
- Jing, P.; Banerjee, S. Rossby Wave Breaking and Isentropic Stratosphere-Troposphere Exchange During 1981–2015 in the Northern Hemisphere. J. Geophys. Res. Atmos. 2018, 123, 9011–9025. [Google Scholar] [CrossRef] [Scilit]
- Li, D.; Bian, J.C.; Fan, Q.J. A Deep Stratospheric Intrusion Associated with an Intense Cutoff Low Event Over East Asia. Sci. China Earth Sci. 2015, 58, 116–128. [Google Scholar] [CrossRef] [Scilit]
- Wang, H.Y.; Wang, W.K.; Shangguan, M.; Wang, T.Y.; Hong, J.; Zhao, S.Y.; Zhu, J.T. The Stratosphere-to-Troposphere Transport Related to Rossby Wave Breaking and Its Impact on Summertime Ground-Level Ozone in Eastern China. Remote Sens. 2023, 15, 2647. [Google Scholar] [CrossRef] [Scilit]
- Zhu, F.R.; Luo, J.L.; Wang, Z.H.; Jin, H.; Zhao, Q.F.; Wang, Z.T.; Luo, F.H.; Gu, M.Z. The Impact of Stratosphere-to-Troposphere Transport Associated with the Northeast China Cold Vortex on Surface Ozone Concentrations in Eastern China. J. Appl. Meteorol. Climatol. 2024, 63, 1241–1253. [Google Scholar] [CrossRef] [Scilit]
- Park, J.-H.; Lee, S.-J.; Lee, T.; Park, S.S.; Kwak, K.-H.; Kim, J.; Shin, U.; Son, J.-H.; Yeh, S.-W.; Kug, J.-S.; et al. Variability of Upper Troposphere-Low Stratosphere Ozone over the East Asia from a Perspective of Atmospheric Stationary Waves. Environ. Res. Lett. 2025, 20, 044051. [Google Scholar] [CrossRef] [Scilit]
- Zhang, J.; Tian, W.; Xie, F.; Chipperfield, M.P.; Feng, W.; Son, S.-W.; Abraham, N.L.; Archibald, A.T.; Bekki, S.; Butchart, N.; et al. Stratospheric Ozone Loss Over the Eurasian Continent Induced by the Polar Vortex Shift. Nat. Commun. 2018, 9, 206. [Google Scholar] [CrossRef] [Scilit] [PubMed]
- Collins, W.J.; Derwent, R.G.; Garnier, B.; Johnson, C.E.; Sanderson, M.G.; Stevenson, D.S. Effect of Stratosphere-Troposphere Exchange on the Future Tropospheric Ozone Trend. J. Geophys. Res. Atmos. 2003, 108, 8528. [Google Scholar] [CrossRef] [Scilit]
- Tang, C.; Zhu, F.; Wei, Y.; Tian, X.; Yang, J.; Zhao, F. Study of Time-Frequency Domain Characteristics of the Total Column Ozone in China Based on Wavelet Analysis. Atmosphere 2023, 14, 941. [Google Scholar] [CrossRef] [Scilit]
- Meng, X.; Jiang, J.; Chen, T.; Zhang, Z.; Lu, B.; Liu, C.; Xue, L.; Chen, J.; Herrmann, H.; Li, X. Chemical Drivers of Ozone Change in Extreme Temperatures in Eastern China. Sci. Total Environ. 2023, 874, 162424. [Google Scholar] [CrossRef] [Scilit] [PubMed]
- Meng, K.; Zhao, T.L.; Bai, Y.Q.; Wu, M.; Cao, L.; Hou, X.W.; Luo, Y.H.; Jiang, Y.C. Tracing the Origins of Stratospheric Ozone Intrusions: Direct vs. Indirect Pathways and Their Impacts on Central and Eastern China in Spring–Summer 2019. Atmos. Chem. Phys. 2024, 24, 12623–12642. [Google Scholar] [CrossRef] [Scilit]
- Chen, J.; Sun, L.; Jia, H.; Li, C.; Ai, X.; Zang, S. Effects of Seasonal Variation on Spatial and Temporal Distributions of Ozone in Northeast China. Int. J. Environ. Res. Public Health 2022, 19, 15862. [Google Scholar] [CrossRef] [Scilit] [PubMed]
- Gao, C.; Xiu, A.; Zhang, X.; Chen, W.; Liu, Y.; Zhao, H.; Zhang, S. Spatiotemporal Characteristics of Ozone Pollution and Policy Implications in Northeast China. Atmos. Pollut. Res. 2020, 11, 357–369. [Google Scholar] [CrossRef] [Scilit]
- Zhang, C.; Evtushevsky, O.; Milinevsky, G.; Klekociuk, A.; Andrienko, Y.; Shulga, V.; Han, W.; Shi, Y. The Annual Cycle in Mid-Latitude Stratospheric and Mesospheric Ozone Associated with Quasi-Stationary Wave Structure by the MLS Data 2011–2020. Remote Sens. 2022, 14, 2309. [Google Scholar] [CrossRef] [Scilit]
- van der A, R.J.; Allaart, M.A.F.; Eskes, H.J. Extended and Refined Multi Sensor Reanalysis of Total Ozone for the Period 1970–2012. Atmos. Meas. Tech. 2015, 8, 3021–3035. [Google Scholar] [CrossRef] [Scilit]
- Hersbach, H.; Bell, B.; Berrisford, P.; Hirahara, S.; Horányi, A.; Muñoz-Sabater, J.; Nicolas, J.; Peubey, C.; Radu, R.; Schepers, D.; et al. The ERA5 Global Reanalysis. Q. J. R. Meteorol. Soc. 2020, 146, 1999–2049. [Google Scholar] [CrossRef] [Scilit]
- Coldewey-Egbers, M.; Loyola, D.G.; Labow, G.; Frith, S.M. Comparison of GTO-ECV and Adjusted MERRA-2 Total Ozone Columns from the Last 2 Decades and Assessment of Inter-Annual Variability. Atmos. Meas. Tech. 2020, 13, 1633–1654. [Google Scholar] [CrossRef] [Scilit]
- Zhang, X.Y.; Sun, J.M.; Lin, W.L.; Xu, W.Y.; Zhang, G.; Wu, Y.L.; Dai, X.; Zhao, J.R.; Yu, D.J.; Xu, X.B. Long-Term Variations in Surface Ozone at the Longfengshan Regional Atmosphere Background Station in Northeast China and Related Influencing Factors. Environ. Pollut. 2024, 348, 123748. [Google Scholar] [CrossRef] [Scilit] [PubMed]
- Silva, A.A. Ground-Based Total Ozone Column Measurements and Their Diurnal Variability. J. Geophys. Res. Atmos. 2013, 118, 7344–7349. [Google Scholar] [CrossRef] [Scilit]
- Cheng, Y.; Yu, Q.; Liu, J.; Cao, X.; Zhong, Y.; Du, Z.; Liang, L.; Geng, G.; Ma, W.; Qi, H.; et al. Dramatic Changes in Harbin Aerosol during 2018–2020: The Roles of Open Burning Policy and Secondary Aerosol Formation. Atmos. Chem. Phys. 2021, 21, 15199–15211. [Google Scholar] [CrossRef] [Scilit]
- Dütsch, H.U. The Ozone Distribution in the Atmosphere. Can. J. Chem. 1974, 52, 1491–1504. [Google Scholar] [CrossRef] [Scilit]
- Chipperfield, M.P.; Dhomse, S.; Hossaini, R.; Feng, W.; Santee, M.L.; Weber, M.; Burrows, J.P.; Wild, J.D.; Loyola, D.; Coldewey-Egbers, M. On the Cause of Recent Variations in Lower Stratospheric Ozone. Geophys. Res. Lett. 2018, 45, 5718–5726. [Google Scholar] [CrossRef] [Scilit]
- Terao, Y.; Logan, J.A. Consistency of time series and trends of stratospheric ozone as seen by ozonesonde, SAGE II, HALOE, and SBUV(/2). J. Geophys. Res. Atmos. 2007, 112, D06310. [Google Scholar] [CrossRef] [Scilit]
- Wirth, V. Cyclone–Anticyclone Asymmetry Concerning the Height of the Thermal and the Dynamical Tropopause. J. Atmos. Sci. 2001, 58, 26–37. [Google Scholar] [CrossRef] [Scilit]
- Steinbrecht, W.; Claude, H.; Köhler, U.; Hoinka, K.P. Correlations Between Tropopause Height and Total Ozone: Implications for Long-Term Changes. J. Geophys. Res. 1998, 103, 19183–19192. [Google Scholar] [CrossRef] [Scilit]
- Xiong, X.; Liu, X.; Wu, W.; Knowland, K.E.; Yang, F.; Yang, Q.; Zhou, D.K. Impact of Stratosphere on Cold Air Outbreak: Observed Evidence by CrIS on SNPP and Its Comparison with Models. Atmosphere 2022, 13, 876. [Google Scholar] [CrossRef] [Scilit]
- Shi, Y.; Evtushevsky, O.; Milinevsky, G.; Yu, R.; Grytsai, A.; Sun, X.; Wang, X.; Novosyadlyj, B. Extreme cooling in Northeast China in January and concurrent maximum in the lower stratospheric temperature and ozone: Case studies. Atmos. Environ. 2025, 342, 120938. [Google Scholar] [CrossRef] [Scilit]
- Holton, J.R.; Haynes, P.H.; McIntyre, M.E.; Douglass, A.R.; Rood, R.B.; Pfister, L. Stratosphere–Troposphere Exchange. Rev. Geophys. 1995, 33, 403–439. [Google Scholar] [CrossRef] [Scilit]
- Wang, H.; Ding, K.; Huang, X.; Wang, W.; Ding, A. Insight into Ozone Profile Climatology over Northeast China from Aircraft Measurement and Numerical Simulation. Sci. Total Environ. 2021, 785, 147308. [Google Scholar] [CrossRef] [Scilit] [PubMed]
- Fang, Y.; Hua, J.; Yu, Y.; Lin, Y.; Zhao, C. The Climate Characteristics of the Northeast China Cold Vortex against the Background of Global Warming. Sustainability 2022, 14, 8982. [Google Scholar] [CrossRef] [Scilit]

Disclaimer/Publisher’s Note: The statements, opinions and data contained in all publications are solely those of the individual author(s) and contributor(s) and not of MDPI and/or the editor(s). MDPI and/or the editor(s) disclaim responsibility for any injury to people or property resulting from any ideas, methods, instructions or products referred to in the content. |
© 2026 by the authors. Licensee MDPI, Basel, Switzerland. This article is an open access article distributed under the terms and conditions of the Creative Commons Attribution (CC BY) license.