


Highlights
What are the main findings?
- We developed an automated global urban extraction framework that fuses VIIRS-DNB nighttime lights with MODIS NDVI through the Nightlight-Vegetation Rectified Index (NVRI).
- A multi-scale Kneedle-based adaptive thresholding strategy, combined with arid-grid switching and spatiotemporal post-processing, generated a consistent annual global urban extent product for 2012–2024.
What are the implications of the main findings?
- The proposed framework improves agreement with established urban products and reduces blooming-related overestimation, especially in highly arid and heterogeneous regions.
- The resulting NTL Urban dataset provides a reproducible and scalable proxy for analyzing global urban expansion and its links to GDP and population dynamics.
Abstract
Accurate long-term global urban monitoring is essential for understanding socio-economic dynamics. To overcome limitations of single-source data at macroscopic scales, this study proposes an automated framework that fuses nighttime light (VIIRS-DNB) and vegetation indices (MODIS NDVI). We develop the Nightlight-Vegetation Rectified Index (NVRI) to suppress blooming effects in vegetated regions and amplify urban–rural contrasts. An adaptive arid grid identification mechanism further mitigates the desert blooming issue. A local adaptive thresholding strategy based on multi-scale grids and the Kneedle algorithm replaces conventional global thresholds. With spatiotemporal post-processing, we generate an annual global urban extent product (NTL Urban, 2012–2024). National-scale validation shows high agreement with MGUP and MODIS urban products. Urban extents also exhibit stronger linear correlations with GDP and population than traditional optical products, highlighting their value for macro socio-economic analysis. Despite residual limitations from blooming effects, lighting preferences, and sensor resolution, our framework offers a reproducible, scalable approach for global urban monitoring and NTL-based socio-economic research.
1. Introduction
Accurate mapping of urban areas is fundamental for understanding global urbanization processes, evaluating the intensity of human activities, and analyzing the evolution of socio-economic spatial patterns [1,2]. As global urbanization continues to advance, the expansion of urban spaces not only reshapes land-use patterns but also exerts profound and long-term impacts on ecological environments, resource allocation, and population migration [3,4]. Therefore, developing urban zoning data products with temporal consistency and spatial comparability at the global scale has become a core research proposition in urban geography and remote sensing. It is worth noting that a universally accepted definition of “urban area” currently does not exist; in practice, urban regions are typically represented as impervious surfaces or administrative urban districts. Consequently, data products derived from different definitions often exhibit significant discrepancies in spatial extents and statistical metrics [5,6].
Nighttime Light (NTL) data, which directly reflects the intensity of human nocturnal illumination and socio-economic activities, is widely regarded as one of the most representative remote sensing indicators for characterizing urban spatial distribution and human activities [7,8,9]. Compared to traditional urban identification methods relying on daytime optical imagery, NTL data can reveal urban spatial structures from a functional activity perspective, offering unique advantages in identifying actual areas of human activity [10,11,12]. Early studies extensively utilized data from the Operational Linescan System onboard the Defense Meteorological Satellite Program (DMSP-OLS) for urban boundary extraction [13,14], urban expansion monitoring, and light pollution research [15,16]. However, these data suffer from inherent limitations such as a lack of cross-sensor radiometric calibration, severe pixel saturation, and relatively low spatial resolution. Furthermore, the DMSP-OLS time series ended in 2013, making it inadequate to support the continuous monitoring of recent rapid urbanization processes [17,18,19]. Since 2012, the release of the Day/Night Band (DNB) of the Visible Infrared Imaging Radiometer Suite (VIIRS) has provided a new data foundation for NTL research. VIIRS-DNB data significantly outperforms DMSP-OLS products in radiometric calibration performance, dynamic range, and spatial resolution [20,21,22]. It effectively mitigates the saturation problem in highly lit areas and better characterizes internal urban brightness gradients as well as medium-to-low brightness regions, thereby substantially improving the identification capability for small-to-medium-sized cities and urban fringe areas. With the continuous accumulation of long-term data, VIIRS NTL has become a crucial data source for conducting global urban expansion studies.
Threshold-based NTL urban extraction methods have been widely adopted due to their simplicity and high computational efficiency [23,24,25]. These methods identify urban and non-urban areas by leveraging differences in NTL pixel brightness, where the selection of the threshold directly determines the reliability and applicability of the extraction results. However, NTL signals exhibit significant spatial heterogeneity at the global scale; varying economic development levels, energy consumption patterns, and land surface background environments across different regions make it difficult for a single global threshold to balance omission and commission errors simultaneously. To address these challenges, researchers have increasingly turned to region-adaptive thresholding strategies, namely partitioning the study area into several sub-regions and subsequently determining the local optimal threshold within each sub-region, to improve extraction robustness and reliability at large scales [26,27]. Various implementation approaches and typical applications exist in this direction. Some studies employ manual partitioning based on socio-economic or image features, combined with statistical or optimization methods, to calculate the optimal threshold for each partition. For example, the local optimal threshold method proposed by Chen et al. for mainland China obtained regional thresholds through regional division combined with the maximum variance ratio and particle swarm optimization [26]. Another category of methods first identifies candidate urban units based on image clustering or potential urban agglomeration detection, and then applies local thresholds or gradient analysis within each urban cluster to achieve fine segmentation. For instance, Zhao et al. adopted this strategy in their study of Southeast Asia, generating annual urban time series through temporal consistency checks [28]. Other studies attempt to fuse data from different NTL sensors with urban boundary samples derived from Gaofen (GF) satellite imagery as references, learning or selecting the optimal threshold in a data-driven manner. For example, Liu et al. constructed a threshold selection function by comparing DMSP-OLS, NPP-VIIRS, and Luojia1-01 data with the aid of urban boundary samples extracted from GF imagery [8].
Meanwhile, machine learning and deep learning methods have also made progress in the field of urban extraction [29,30,31]. Multi-source data fusion classifiers typically enhance pixel-level performance significantly; however, these methods rely heavily on annotated samples and incur high computational costs, posing ongoing challenges in cross-regional transferability and long-term consistency. To compensate for the limitations of single-source data, several studies have incorporated auxiliary information—such as points of interest (POIs), population, or road networks—into the identification process to improve the distinguishability of urban-rural boundaries [32,33,34]. Duan et al. combined NTL, POIs, and Landsat 8 Collection 2 Level imagery to construct a Comprehensive Urban-Rural Fringe Index (CUFI), verifying the effectiveness of multi-source fusion in boundary extraction using Tangshan, Hebei as an experimental area [35]. Similarly, Dai et al. improved the recognition reliability of large town boundaries in the Wen-Tai region by fusing GlobeLand30 image data, road network, NTL, and POI data [36]. Nevertheless, such data suffer from uneven spatial coverage and insufficient temporal consistency on a global scale, limiting their application in long-term global urbanization monitoring. Clustering-based methods, which group pixels or regions with similar nighttime-light characteristics, and object-level methods, which extract urban patches as spatial objects rather than individual pixels, have also been widely applied; for example, Yu et al. adopted an object-oriented approach coupled with a minimum spanning tree to achieve automatic detection of urban clusters [37], while Zhu et al. delineated urban-rural gradient mutation points through dual spatial clustering, both of which can identify local urban areas relatively accurately [38].
It is worth noting that relying solely on NTL intensity is still susceptible to interference from the natural land surface background. For instance, low-brightness urban areas, urban-rural transition zones, and agricultural activity areas often exhibit radiation characteristics similar to those of cities, thereby leading to misclassification. Therefore, recent studies have increasingly emphasized constraining the urban identification process from the perspective of multi-dimensional land surface features. Among these, the Normalized Difference Vegetation Index (NDVI) can stably characterize land surface vegetation coverage, whereas urban areas typically exhibit low vegetation coverage. Previous studies have further shown that combining NTL with NDVI can effectively suppress non-urban background interference and improve the delineation of urban-rural boundaries, while logarithmic transformation can enhance the numerical contrast between urban and suburban pixels [39,40]. Building on these studies, this research proposes a Nightlight-Vegetation Rectified Index (NVRI), which integrates NDVI with logarithmically transformed NTL signals to enhance the performance of NTL-based urban area extraction.
Although existing methods have made significant progress in urban extraction, several critical issues remain for large-scale, long-term global monitoring. First, single or static extraction strategies struggle to reconcile extreme spatial heterogeneity; particularly in sparsely vegetated arid regions, they are highly prone to severe desert blooming and area overestimation caused by high-reflectance backgrounds and non-urban light sources. Second, most studies focus on static urban extent identification and do not fully consider spatial continuity or temporal consistency during long-term expansion. In addition, developing an automated and generalizable urban extraction method without relying on large training samples remains challenging. In response, this study develops a fully automated global urban area extraction framework using VIIRS-DNB NTL data as the core source, together with MODIS NDVI and a water body mask. The method introduces an adaptive arid grid identification mechanism that dynamically switches between the Nightlight-Vegetation Rectified Index (NVRI) and de-noised NTL data to reduce background overfitting in extremely arid environments. Based on a multi-scale grid and the Kneedle inflection point detection algorithm, it achieves data-driven calculation of the local optimal thresholds. Combined with spatiotemporal consistency post-processing, the approach generates an annual global urban extent dataset (NTL Urban) for 2012–2024 at 500 m spatial resolution. In this study, NTL Urban is defined as a gridded representation of persistent human nighttime activity derived from VIIRS-DNB radiance, constrained by NDVI and water masks, and extracted through adaptive thresholding and temporal consistency rules, representing functional nighttime activity areas rather than a strict physical or impervious surface extent. The extraction results are further validated through multi-scale comparisons with land-cover products and socio-economic data, including national-scale correlations with other urban products, GDP and population, as well as national- and city-scale visual and quantitative assessments, providing a reliable basis for socio-economic analysis and global urbanization studies using NTL as a proxy.
2. Materials and Methods
2.1. Materials
This study synergistically extracts global urban areas using the annual VIIRS-DNB composite products (v2.1 and v2.2) from 2012 to 2024 as the primary indicator of human activity (https://eogdata.mines.edu/nighttime_light/annual/, accessed on 17 May 2026), combined with MODIS NDVI data (Google Earth Engine) to constrain natural vegetation backgrounds and mitigate misclassifications in low-brightness or mixed land cover regions. To prevent anomalous radiation and reflection interference, the Global Water Body Map (https://global-surface-water.appspot.com/, accessed on 17 May 2026) is applied for a unified water mask. Furthermore, multiple auxiliary datasets are introduced to comprehensively cross-validate the extraction results: the MODIS MCD12Q1 land cover product (Google Earth Engine) [41] and MGUP [42] (https://www.researchgate.net/publication/339873537_MGUP_annual_global_2001_2018, accessed on 17 May 2026.) are utilized to assess the spatial rationality of boundaries; LandScan population distribution data [43,44] independently verify consistency with actual human agglomeration (https://landscan.ornl.gov/, accessed on 17 May 2026); and national-scale GDP and population statistics from the World Bank (https://data.worldbank.org/, accessed on 17 May 2026) are used to statistically evaluate the socio-economic consistency of the NTL-derived urban extents at macroscopic levels. All datasets used in this study are annual products, and the latest download date was 15 March 2026. The datasets used in this study are detailed in Table 1.
Table 1.
Dataset used in this study.
2.2. Methods
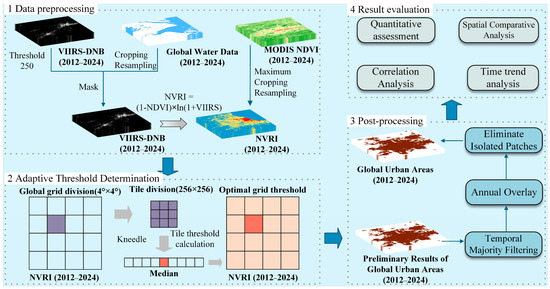
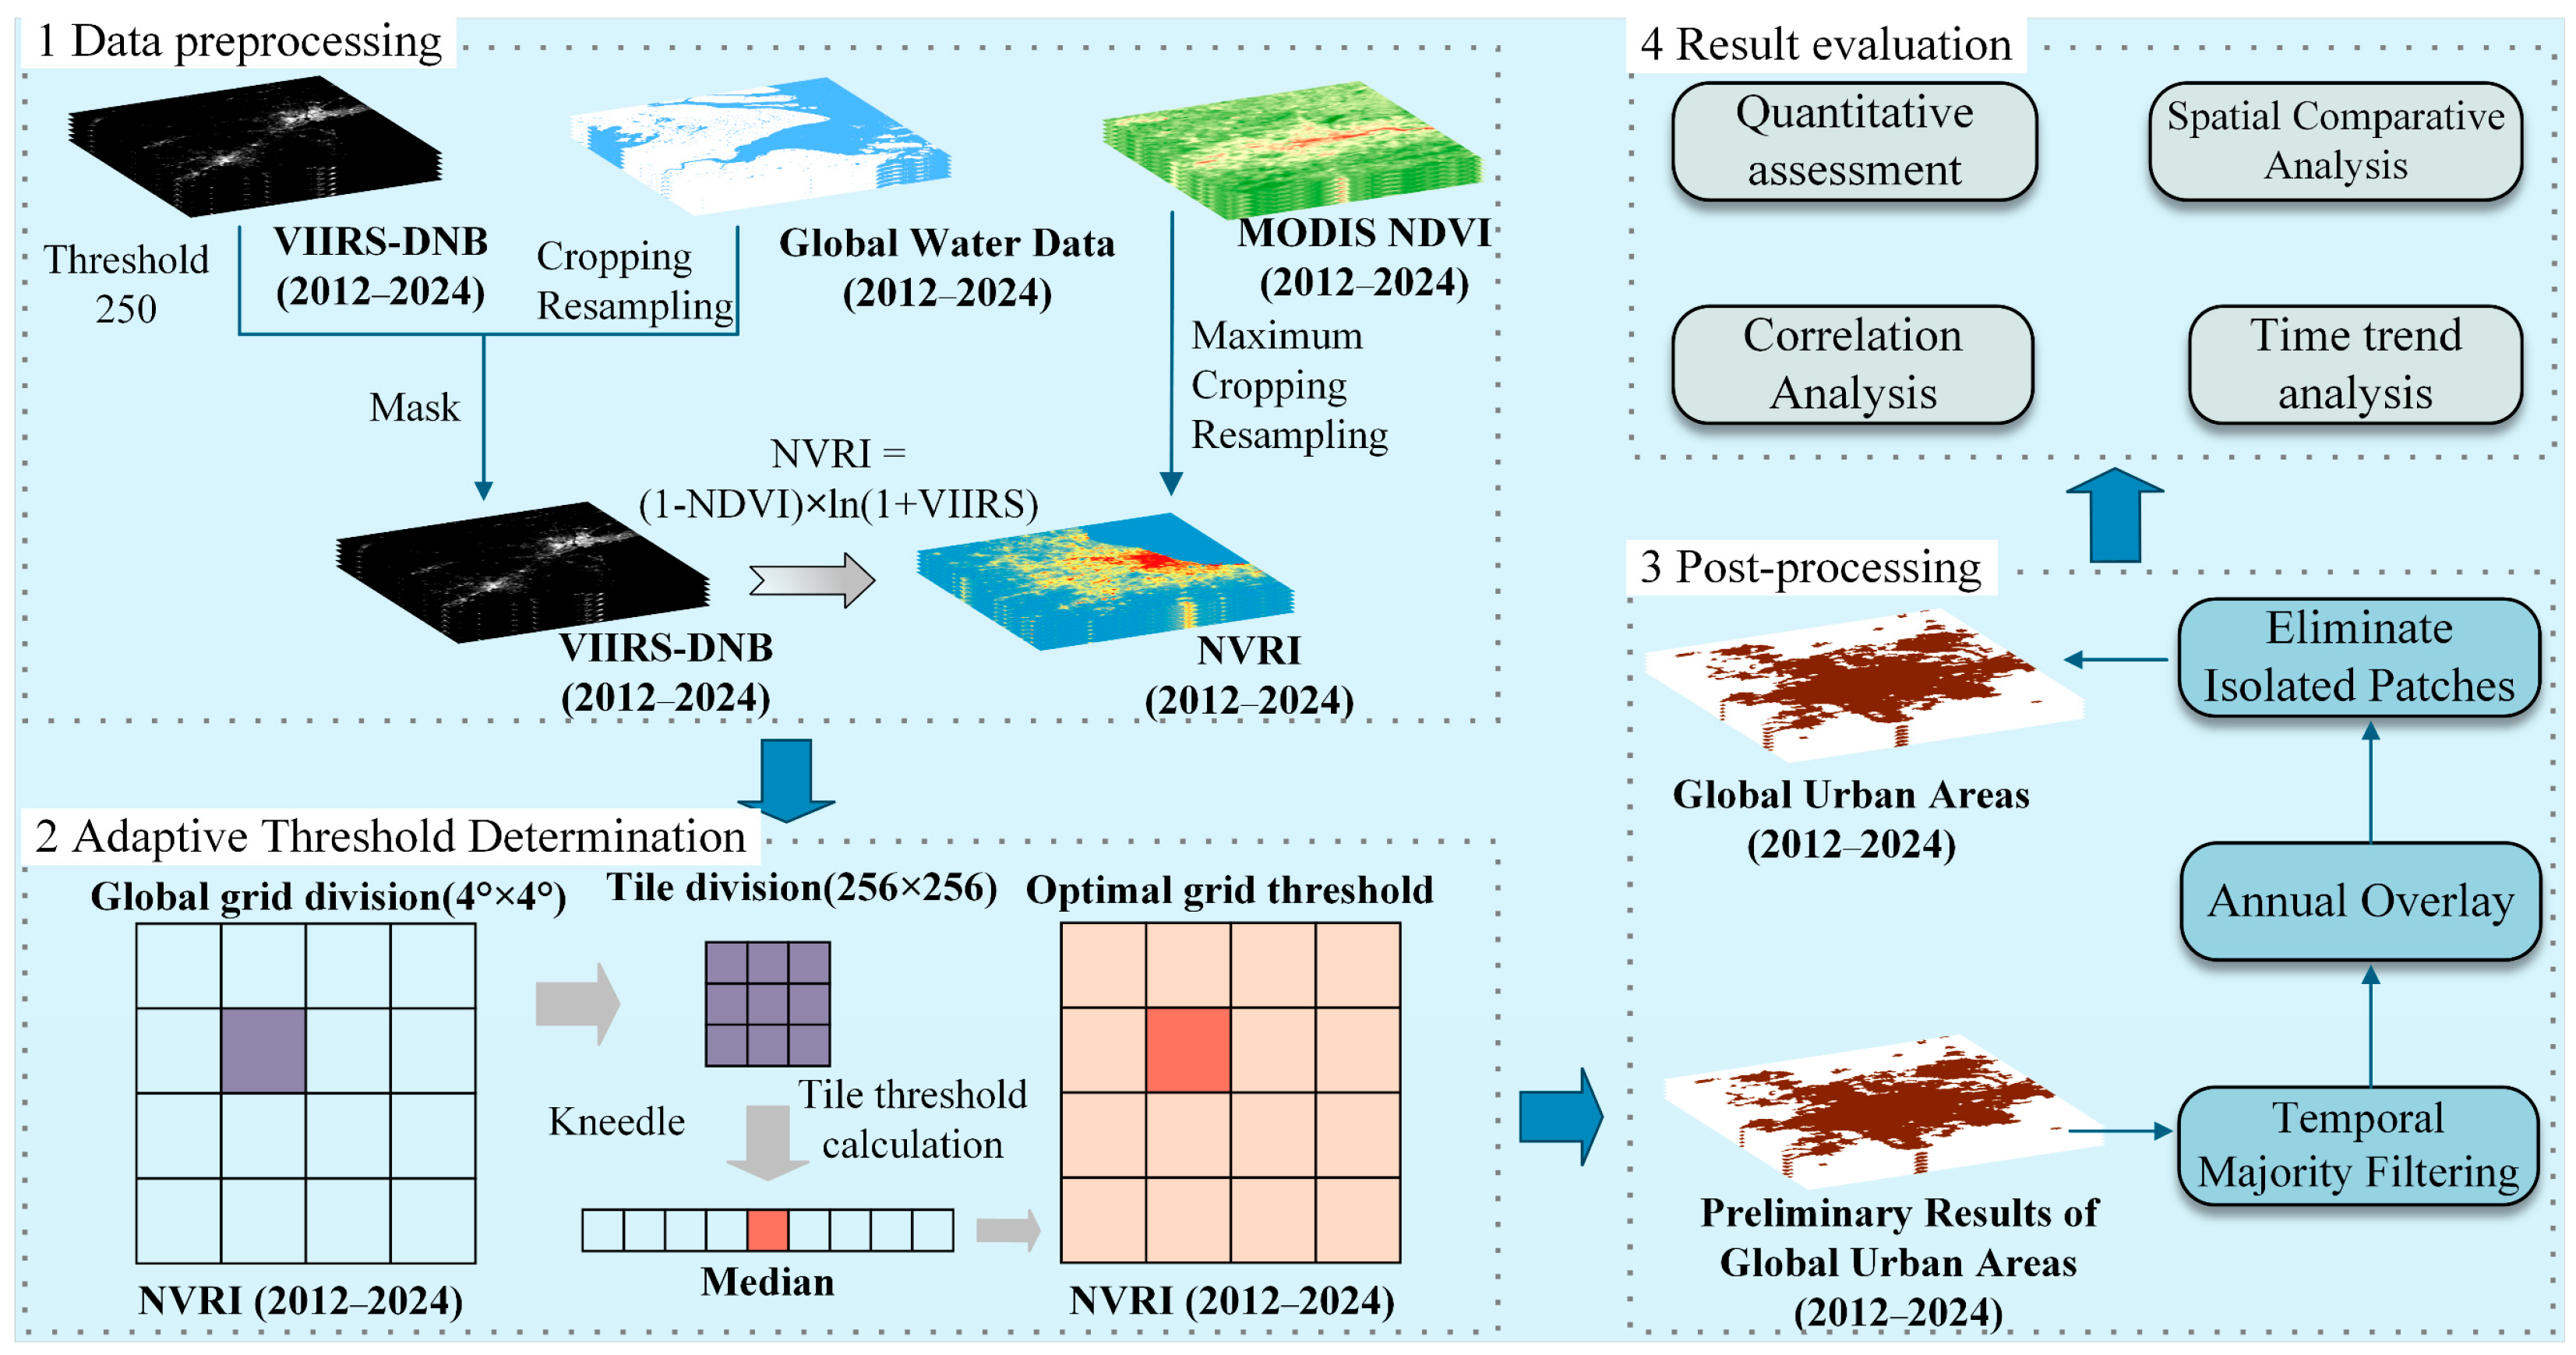
To address the spatial heterogeneity of nighttime light signals, this study combines VIIRS-DNB with MODIS NDVI and a global water mask, and applies a block-based thresholding framework driven by the Kneedle inflection point detection algorithm. Within each tile, candidate thresholds are first derived and screened, and then aggregated at the grid scale to determine a stable local threshold. The Nightlight-Vegetation Rectified Index (NVRI) is introduced to reduce blooming effects and enhance the contrast between urban and non-urban pixels, thereby improving urban area extraction. In this framework, it is expected that arid grid identification and data source switching can effectively mitigate light saturation effects in extremely dry regions, while a series of spatiotemporal post-processing procedures further contribute to generating a more consistent and realistic NTL-derived urban extent product in both spatial and temporal dimensions. The overall workflow is shown in Figure 1.
Figure 1.
The processing workflow for extracting global urban areas based on nighttime light data.
2.2.1. Data Preprocessing
To ensure the spatial and numerical consistency of multi-source data, the following preprocessing steps were applied to the raw data. First, considering that extreme high values in the VIIRS-DNB composite products may still interfere with threshold estimation, this study truncated the upper bound of pixels exceeding 250 nW·cm−2·sr−1 in the annual “average_masked” images to 250 nW·cm−2·sr−1. This restricts the observed dynamic range to the 0–250 nW·cm−2·sr−1 interval, thereby reducing the influence of rare high values and enhancing the robustness of threshold estimation [17,45]. Second, the MODIS NDVI and global water body data were cropped, reprojected to align with the VIIRS data, and resampled to a spatial resolution of 500 m. We used bilinear interpolation for resampling because it preserves spatial continuity while providing a smooth and efficient transformation of continuous raster data, making it suitable for multi-source nighttime light and NDVI alignment [46]. Subsequently, a pixel-level masking was performed on the VIIRS imagery using the global water body mask, where the NTL values of water pixels were set to 0. This step avoids misclassification in urban extraction caused by reflected light from coastal or surface waters. The preprocessing was carried out in ArcGIS 10.8.
2.2.2. Proposal of the Nightlight-Vegetation Rectified Index (NVRI)
Building on these previous studies, this study proposes a Nightlight-Vegetation Rectified Index (NVRI) that combines NDVI with logarithmically transformed NTL signals to enhance the performance of NTL-based urban area extraction. It is defined as:
Compared with previous vegetation-adjusted nighttime light indices primarily developed for mitigating saturation effects in DMSP-OLS data, NVRI is a VIIRS-oriented composite index designed to enhance urban–suburban contrast by jointly incorporating vegetation suppression and logarithmically transformed nighttime light intensity. Although NVRI is designed to improve urban-rural separation in most vegetation-covered regions, its vegetation constraint may become weak in extremely arid or large desert regions (for example, parts of the Middle East and North Africa) where surface NDVI approaches or falls below 0. In such cases, the multiplier in Equation (1) approaches 1, and the index may reduce to a log-transformed NTL signal with limited vegetation-based discrimination. Because bare soil and sand in arid regions can exhibit high reflectance and are often accompanied by strong non-urban light sources such as oil and gas flares, these areas require special handling in the subsequent thresholding module. Therefore, this study introduces an adaptive arid-grid identification and dynamic data-source switching mechanism in the following section.
2.2.3. Urban Area Extraction Based on Kneedle Inflection Point Detection
Threshold-based index methods play a pivotal role in urban extent extraction. However, their core challenge lies in how to automatically and robustly determine the “optimal threshold” that accommodates extreme global spatial heterogeneity. Based on statistical features such as pixel brightness and vegetation distribution, the proposed method automatically identifies the structural inflection points of local data distributions within a multi-scale grid architecture, and specifically designs an adaptive extraction strategy tailored for arid environments.
To balance global computational efficiency and the representation of spatial heterogeneity, this study adopts a multi-scale processing strategy incorporating block reading and regular gridding. First, the study area is partitioned into regular 4° × 4° latitude-longitude grids. A 0.1° overlapping buffer is established between adjacent grids to ensure spatial continuity and a smooth transition of the thresholds. Prior to local threshold calculation, this study introduces an Adaptive Arid Grid Identification mechanism. The 90th percentile of NDVI pixels within the grid is utilized as a macroscopic proxy for regional vegetation abundance. If this value falls below a predefined aridity threshold (e.g., 0.15), which was determined empirically through preliminary trials and sensitivity analysis, the grid is classified as an extremely arid region, indicating the local failure of the NVRI’s vegetation constraint and triggering a switch to preprocessed VIIRS-DNB to avoid desert blooming. Conversely, for regular grids identified as non-arid, the NVRI data continues to be utilized to maintain high-precision differentiation of urban-rural boundaries.
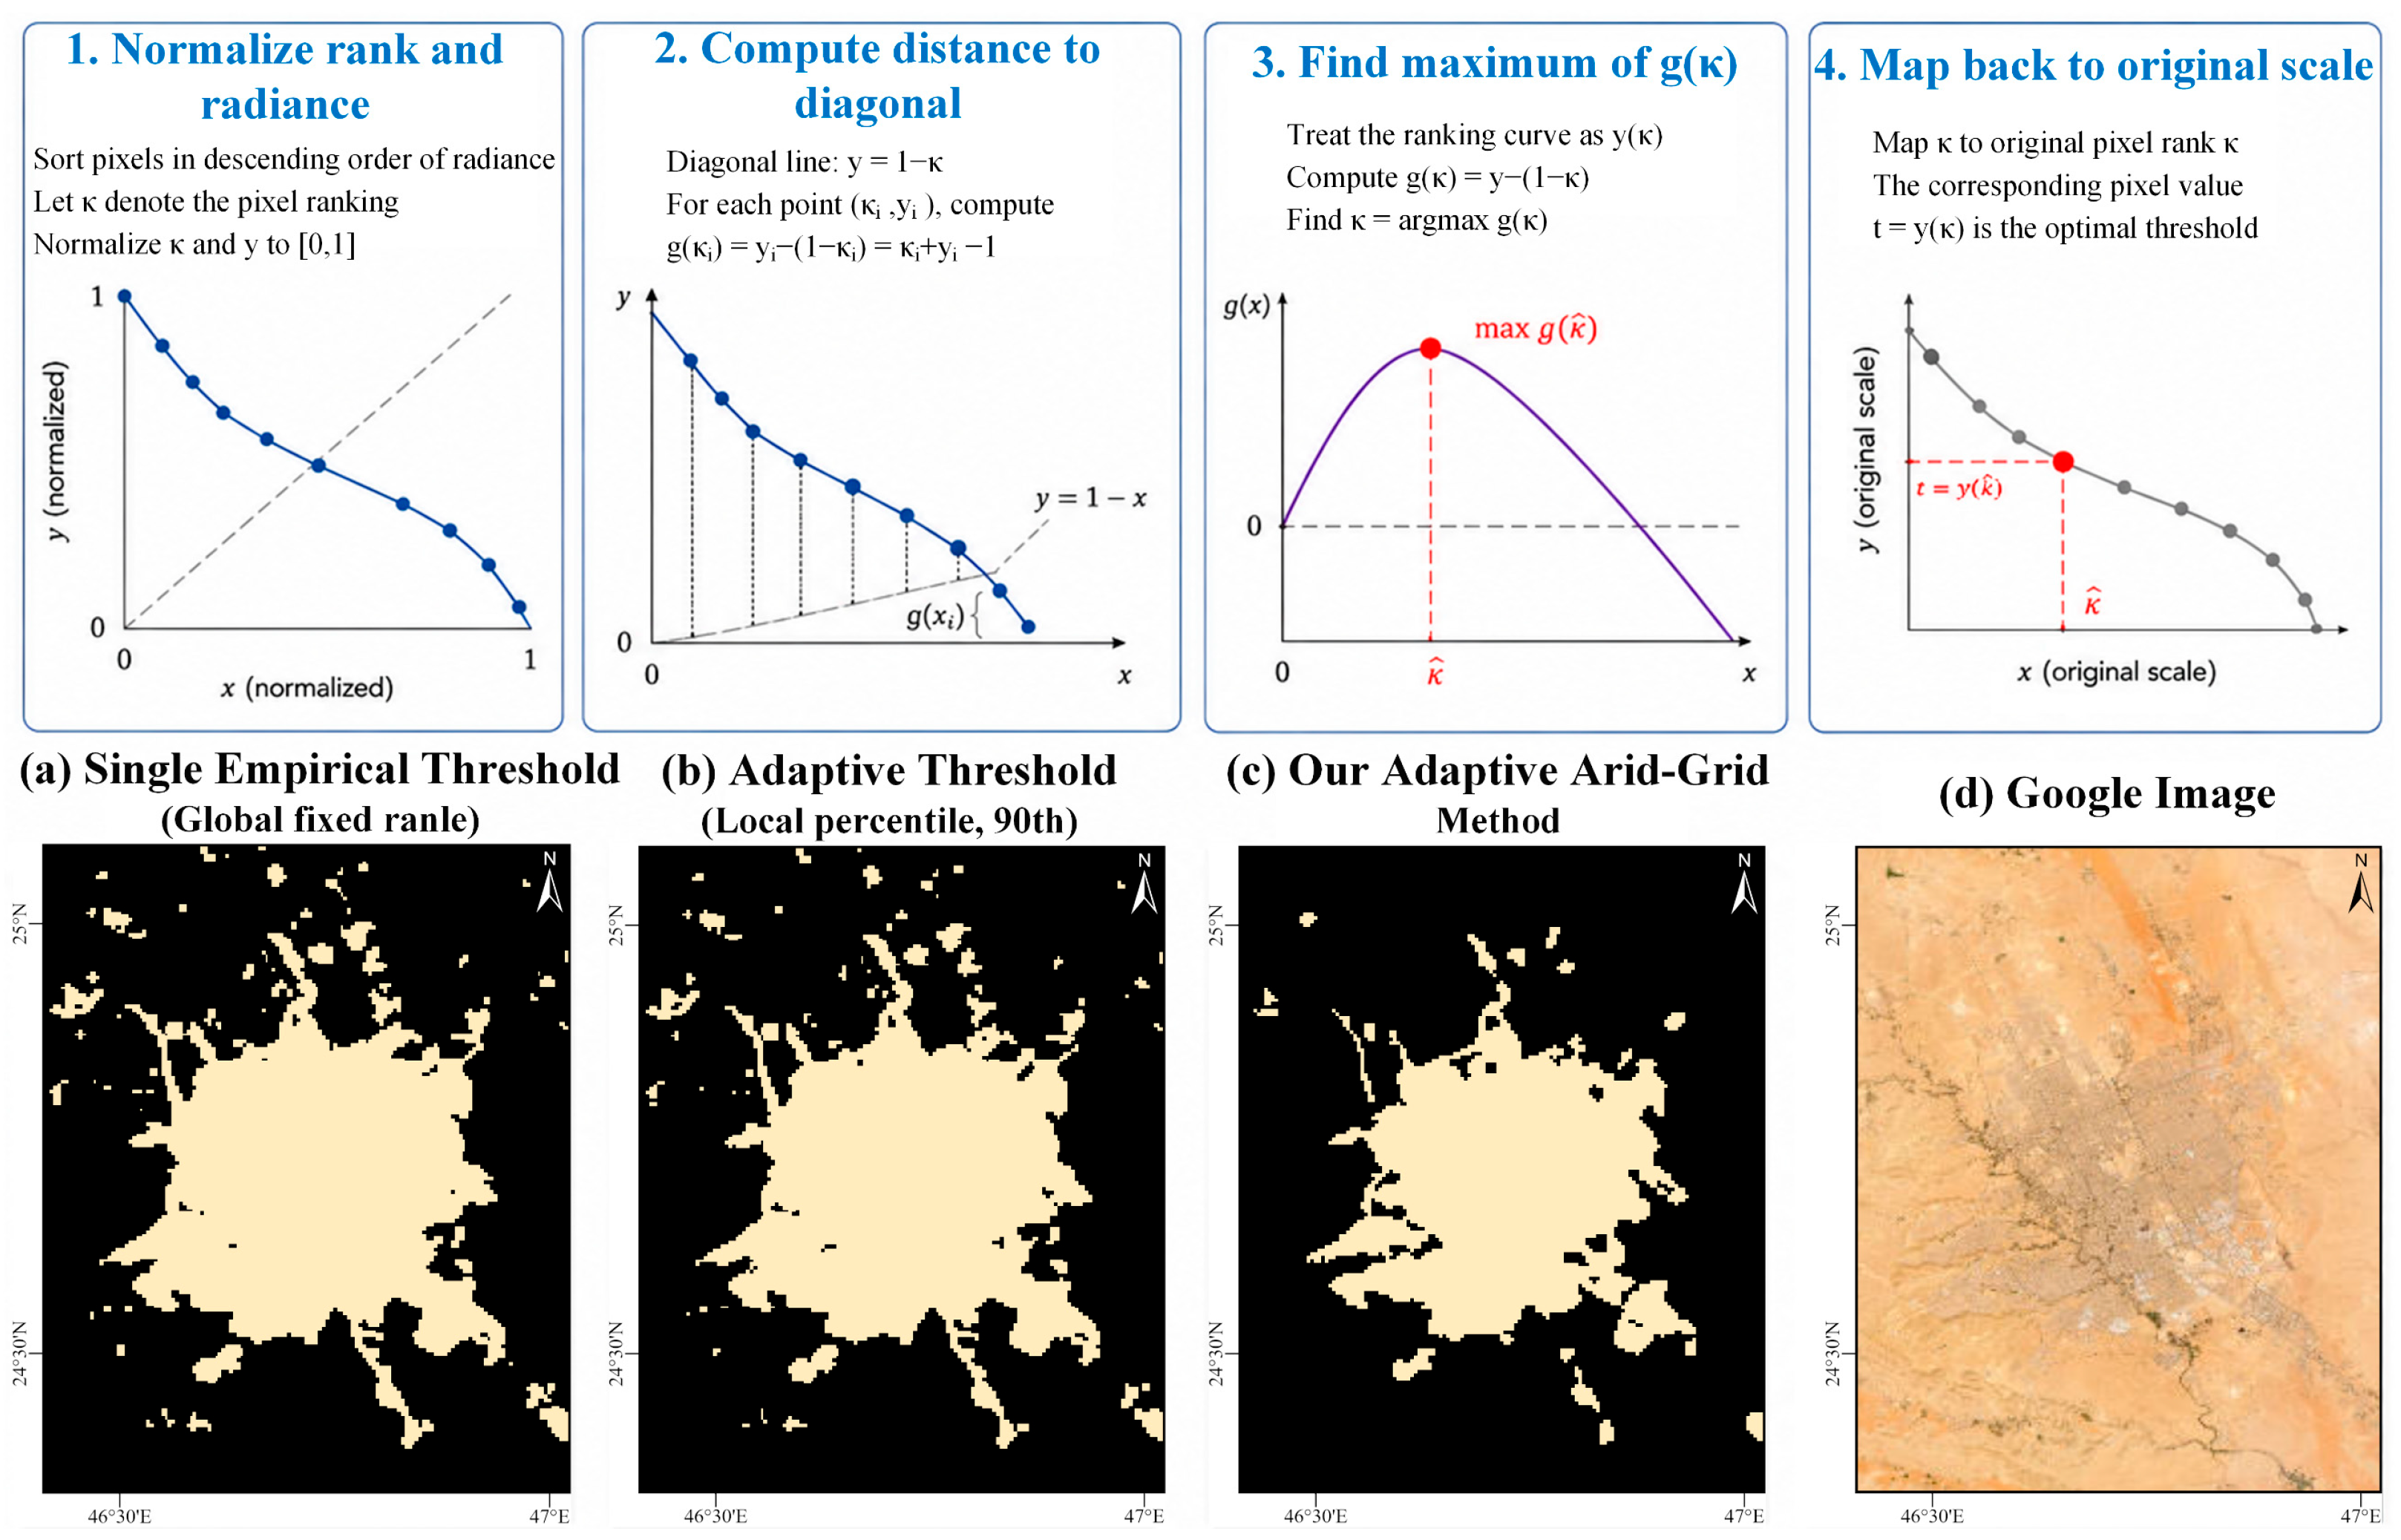
After determining the optimal data source (NVRI or VIIRS-DNB) for each 4° × 4° grid, the grid is further subdivided into local tiles of 256 × 256 pixels, with a sliding step overlap of 64 pixels. During tile-level processing, invalid tiles dominated by dark backgrounds are discarded, and the valid pixels are sorted in descending order based on their brightness values. To filter out extremely low invalid values induced by non-urban background dominance, the candidate threshold for the tile is restricted to be above the 90th percentile of global non-zero pixels. Theoretically, the spatial distribution of NTL pixel intensity exhibits a long-tail pattern, where a small number of high-intensity pixels coexist with a massive amount of low-intensity pixels. This study employs the Kneedle inflection point detection algorithm to automatically locate the structural turning point of this brightness ranking curve via geometric methods. By treating the ranking curve as a parameterized function y(k), the algorithm calculates its curvature and extracts the pixel value corresponding to the maximum curvature as the candidate optimal threshold for the tile, which inherently aligns with the semantics of the urban background [47,48]. This method adaptively identifies the “bright-dark” boundary without the need for manual local threshold configuration, making it particularly suitable for extracting urban boundaries from NVRI data that have been corrected by NDVI and masked for water bodies. In remote sensing land-cover clustering, image segmentation, and land-use classification, the Kneedle algorithm is commonly used to automatically identify the elbow point of the K-means curve, thereby selecting the optimal number of clusters while reducing subjective manual judgment [49].
where denotes the pixel ranking. The curvature is calculated within the normalized index space. The elbow point corresponds to the point of maximum curvature. Subsequently, and are normalized as follows:
By treating the sequence as a parameterized curve with respect to parameter , we define:
For any parameterized curve, the curvature is given by:
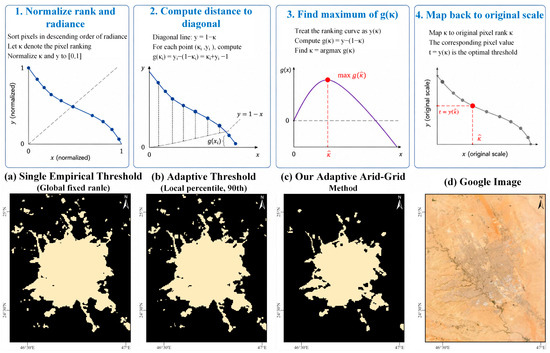
The point is extracted, and its corresponding pixel value is designated as the threshold . The principle of the proposed method is illustrated in Figure 2.
Figure 2.
Subpanels 1–4 illustrate the Kneedle inflection-point detection principle, and subpanels a–d show the results of different thresholding methods in the typical arid city of Riyadh, together with a comparison against satellite imagery.
After completing the tile-level calculation, all valid tile candidate thresholds are aggregated at the 4° × 4° grid scale, and their median is taken as the initial optimal threshold for that grid. To alleviate threshold instability caused by sparse local data, a spatial distance-based neighborhood extended search strategy is introduced: when there are fewer than three valid thresholds within a grid, thresholds from surrounding grids are sequentially borrowed to calculate the median, if this condition is still not met, a global secure fallback mechanism is triggered. Finally, for each 4° × 4° grid, local pixels are classified in parallel using the selected data source (NVRI or VIIRS-DNB) and its corresponding robust grid threshold. The binary results from all grids are then mosaicked into a global urban map, and continuity along grid boundaries is ensured by applying feathering weights within the overlapping buffer zones, which reduces seam artifacts and produces a smooth spatial transition between adjacent tiles. Ultimately, a complete, preliminary global urban binarization image is generated and subsequently fed into the spatiotemporal post-processing module.
2.2.4. Data Post-Processing
To obtain more reasonable and stable urban extraction results, a three-step post-processing procedure was performed on the preliminary binarization results. To extract more accurate and consistent urban areas based on NTL data, it is crucial to fully utilize the temporal information within the NTL time series. First, a block-based sliding time window strategy is employed to perform temporal majority filtering on each raster tile. Within a 5-year sliding window, a pixel is retained as an urban pixel only if it is classified as “urban” at least three times, thereby significantly suppressing single-year noise and transient anomalous observations. Second, following the physical logic that urban areas typically exhibit “unidirectional expansion” or “irreversibility” at macroscopic time scales, urban pixels from the previous year are prioritized and inherited to the subsequent year. When necessary, missing values are filled by backtracking candidate pixels, thereby ensuring the continuity and logical rationality of urban expansion in its temporal evolution. Finally, a 3 × 3 neighborhood window is used to detect and merge connected pixels across tile boundaries to eliminate seamline artifacts caused by block processing. Subsequently, isolated connected components (isolated patches) with an area of less than 8 pixels are strictly removed, treating them as local noise rather than functional urban patches [10,50]. The meticulous post-processing described above not only accounts for the consistency of the time series but also improves the rationality and overall robustness of the spatial boundaries through local merging and small patch filtering, ultimately yielding the annual urban area extraction results based on VIIRS NTL imagery for 2012–2024. The post-processing was implemented in Python 3.13. The parameters used in this study and their corresponding functions are summarized in Table 2.
Table 2.
Summary of empirical parameters and their roles in the proposed framework.
3. Results
3.1. Analysis of Urban Extent Extraction Results
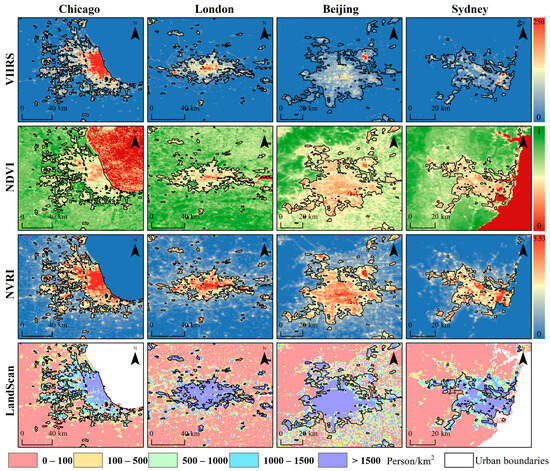
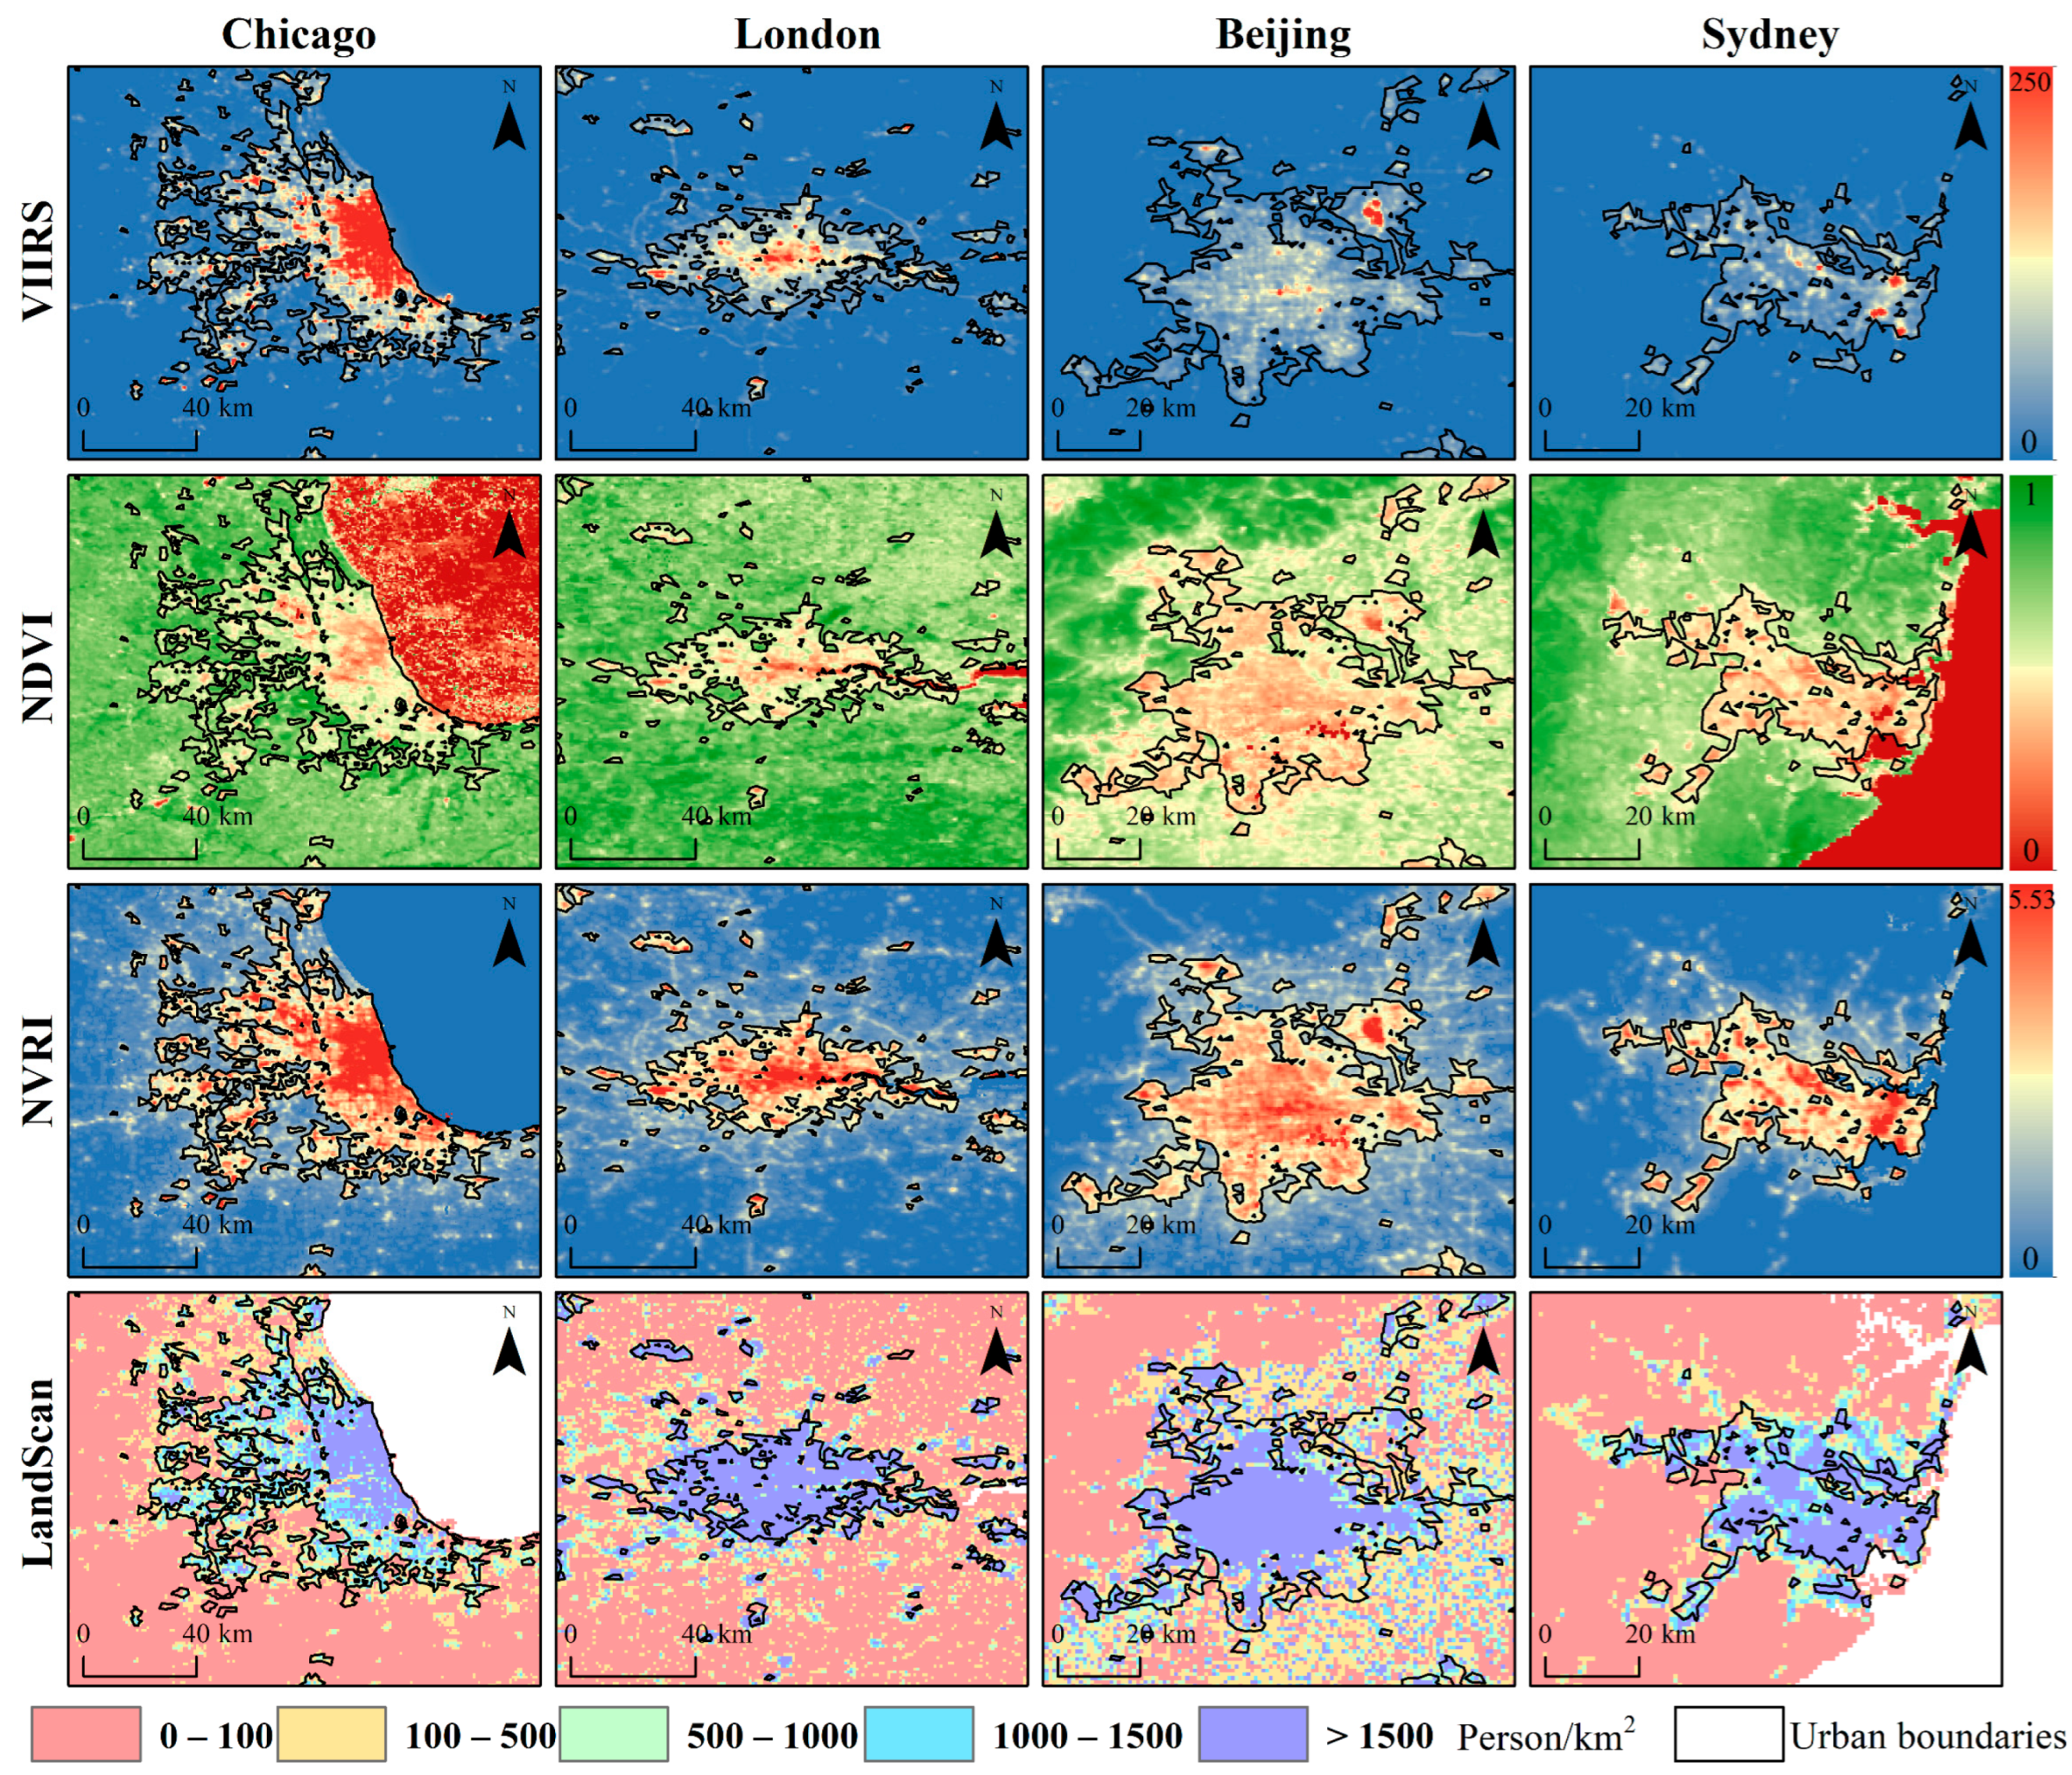
To evaluate the performance of the proposed method, this study selected four representative cities, including Chicago, London, Beijing, and Sydney, to compare the VIIRS, NDVI, NVRI, LandScan population distribution, and the urban boundaries extracted in this study for the year 2012 (Figure 3). Some studies suggest that a population density exceeding 500 persons/km2 can be considered an urban area, and exceeding 1500 persons/km2 as an urban core area [51]. Therefore, we categorized the LandScan population distribution data using thresholds of 100, 500, 1000, and 1500 persons/km2 to distinguish regions with different population densities. Generally, pixels with low NDVI and high brightness were identified as target urban pixels. The extraction results covered the high-brightness urban areas in VIIRS and exhibited good spatial overlap with the high-population-density regions (>1500 persons/km2) in LandScan. Specifically, the extraction results for Chicago largely aligned with regions >500 persons/km2, whereas London and Sydney matched more closely with high-density regions >1500 persons/km2. The results for Beijing showed a relative deviation from the population distribution map but still fundamentally encompassed the high-population-density patches. These discrepancies not only reflect the differences in urban morphology and the relationship between NTL and population across different countries and regions, but may also stem from modeling errors and statistical time lags in LandScan data. Overall, the NVRI generated based on VIIRS and MODIS NDVI effectively suppresses blooming effects in highly vegetated areas, yielding clearer urban structures and urban-rural boundaries. The extracted urban patches demonstrate robust spatial consistency with population density data, indicating suitable for large-scale urbanization and socio-economic dynamic analyses.
Figure 3.
Comparison of VIIRS, NDVI, NVRI, LandScan data, and extracted urban extents for Chicago, London, Beijing, and Sydney in 2012.
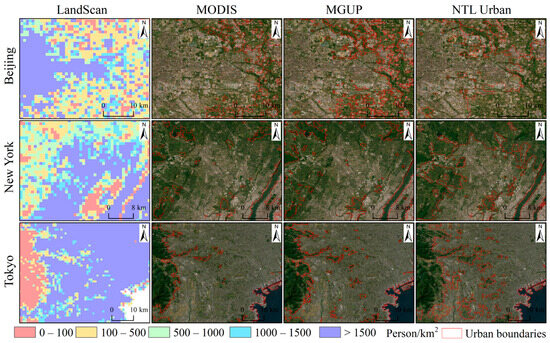
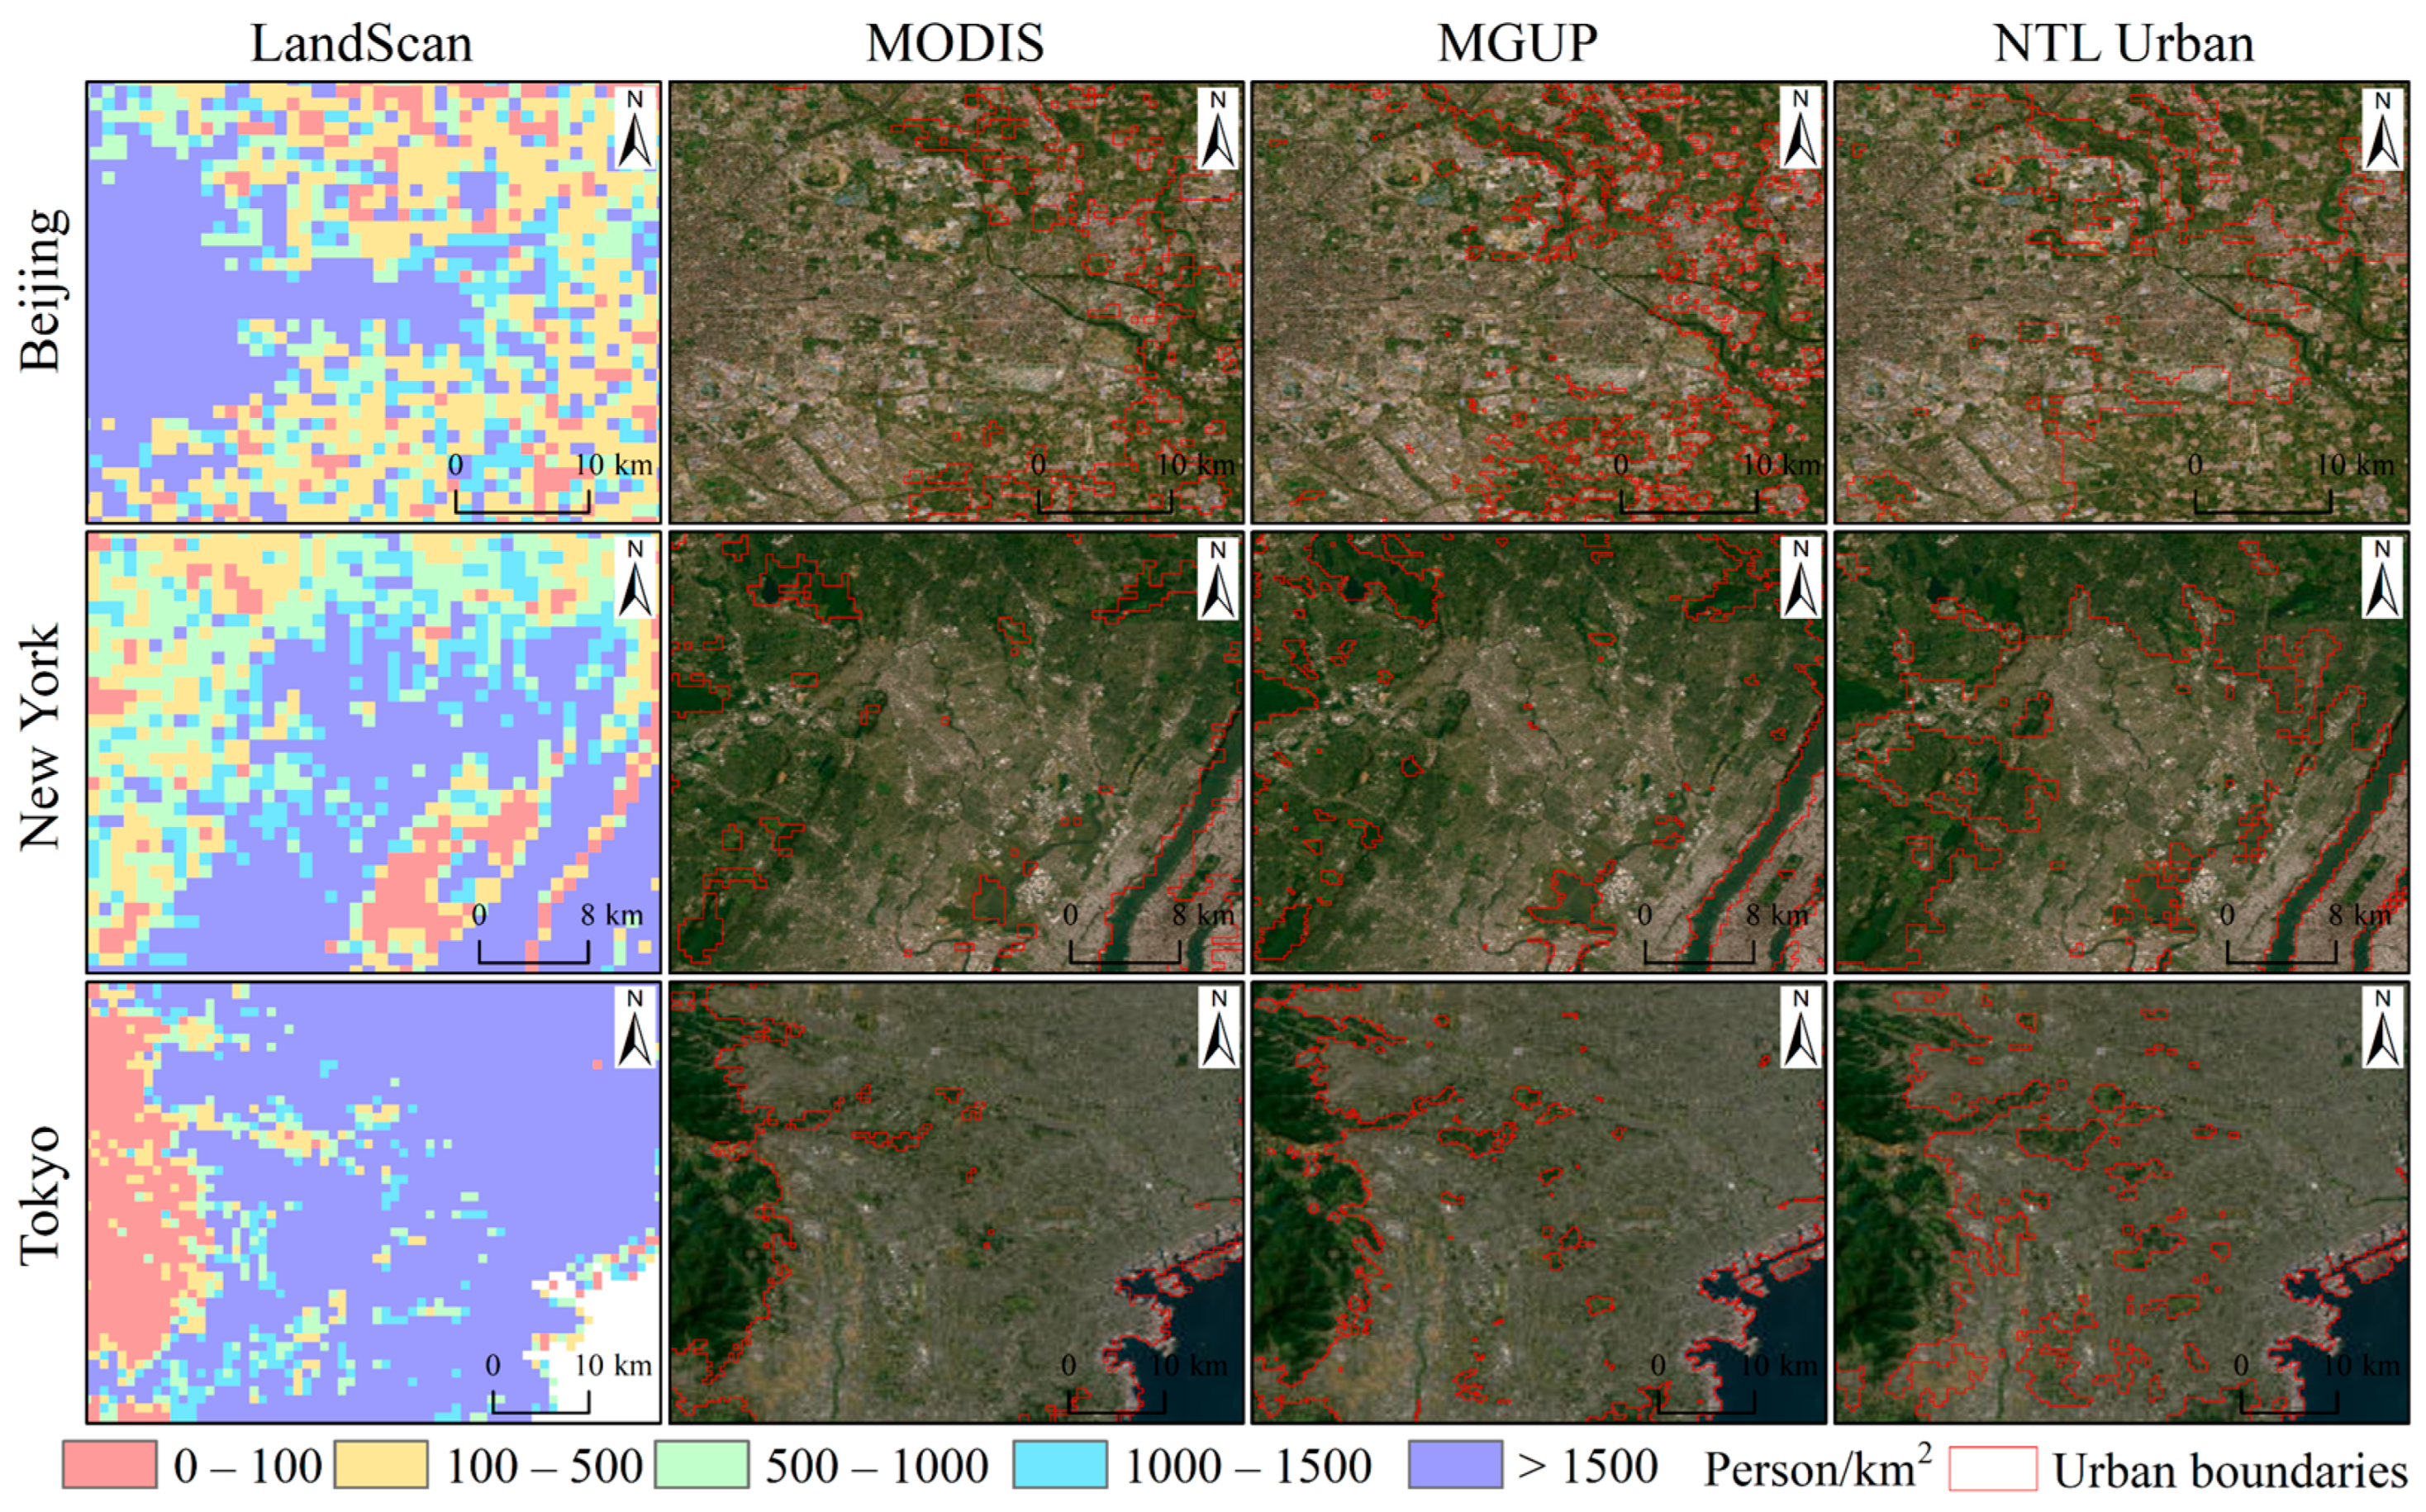
To further evaluate the performance and rationality of the urban product generated in this study, we selected three representative megacities, including Beijing, New York, and Tokyo, to conduct a comparative analysis between our NTL Urban results for 2012 and gridded global population maps as well as two global urban boundary datasets. These include the MODIS-derived urban area data, the MGUP (MODIS global urban area product) data, and the LandScan population distribution data (Figure 4). The MGUP dataset is based on MODIS imagery and extracts global urban samples through an automated approach with a spatial resolution of 250 m, its reliability has been validated in multiple studies and is widely utilized in global urban research [42]. As observed from the locally magnified spatial comparisons, compared to the MODIS and MGUP urban extent product, the NTL Urban product derived in this study is generally more convergent in spatial extent and relatively smaller in area. This discrepancy arises because not all impervious surfaces or urban areas exhibit stable and sufficiently strong light signals at night. Certain regions failed to meet the NTL threshold due to low nocturnal activity intensity or insufficient illumination, and thus were not identified as urban pixels. Further analysis reveals that the discrepant regions marked in red in the figure largely correspond to zones with significant changes in population density, indicating that the NTL Urban product possesses higher sensitivity to population agglomeration and human activity intensity. It can more effectively characterize differences in internal urban functional zones and spatial heterogeneity during the urbanization process. This also corroborates, from a lateral perspective, that urban extents extracted based on NTL data offer unique advantages in reflecting actual socio-economic activities.
Figure 4.
Comparison of LandScan, MODIS, MGUP, and NTL Urban data for Beijing, New York, and Tokyo in 2012.
3.2. Consistency Assessment
To validate the effectiveness of the proposed algorithm, we first calculated pixel-level consistency metrics between different products and mature remote sensing urban extent products (MODIS and MGUP). The results indicate that the average overall accuracy (OA) and Kappa coefficients for the Urban entity product, which refers to the global urban areas automatically extracted from VIIRS using a K-means-based thresholding approach [50], range from 72.49% to 94.31% and 0.482 to 0.844, respectively. In contrast, for the NTL Urban product fusing NDVI, the average OA and Kappa coefficients improve to 79.39–94.56% and 0.595–0.863, respectively (see Table 3). This demonstrates that introducing NDVI and the grid-based adaptive thresholding strategy effectively enhances consistency with urban extent product (MODIS), bringing NTL-extracted urban boundaries semantically closer to urban areas defined by land cover.
Table 3.
Consistency assessment results between multi-source data and MODIS data for typical cities.
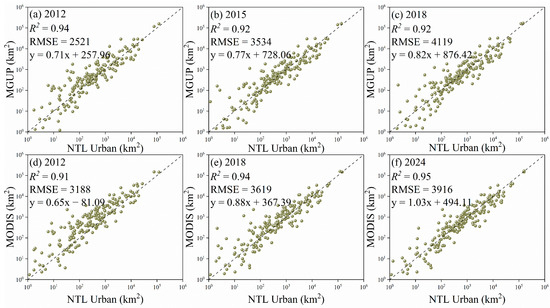
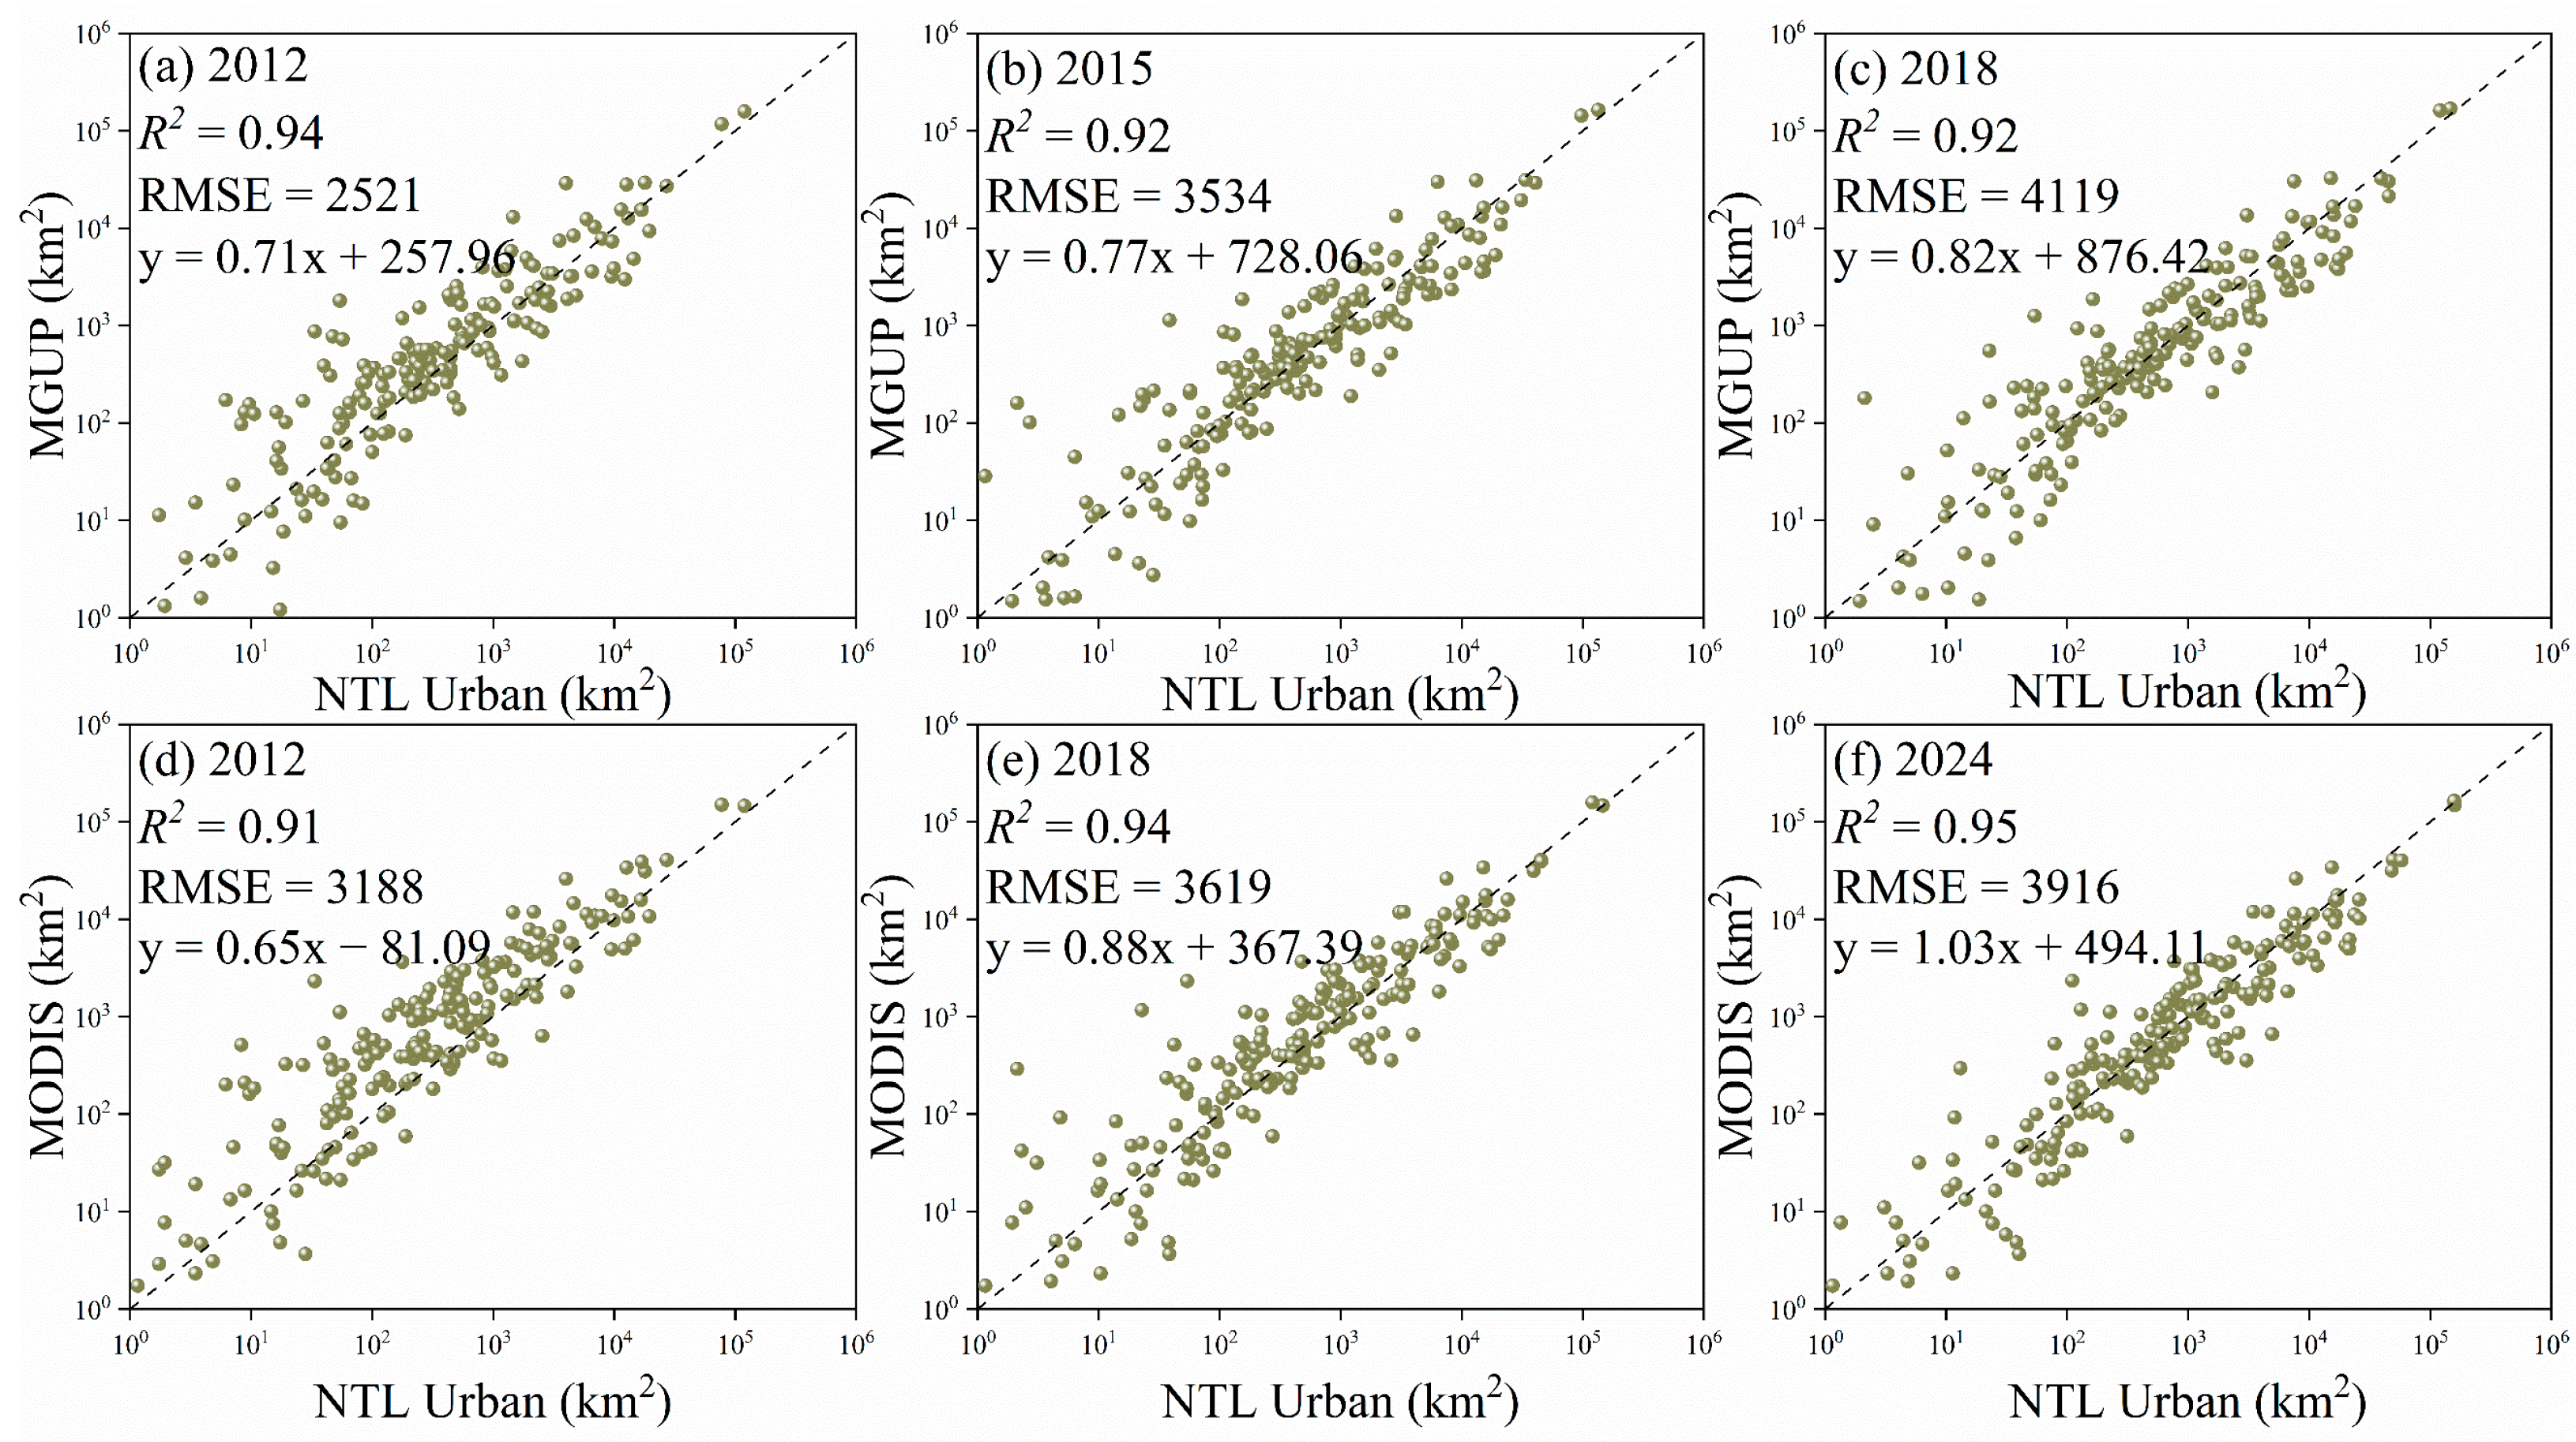
For the comparison of total urban areas at the national scale, we conducted a linear regression analysis between our results and the MGUP (2012, 2015, and 2018) and MODIS (2012, 2018, and 2024) products (Figure 5). The results show that NTL Urban is highly consistent with the MGUP product, with the coefficient of determination (R2) ranging from 0.92 to 0.94 and the root mean square error (RMSE) between 2521 and 4119. The comparison with the MODIS product also exhibits a strong correlation, with R2 reaching 0.91 to 0.95 and RMSE between 3188 and 3916. The vast majority of scatter points are tightly clustered around the 1:1 reference line, indicating that this method can stably and reliably characterize the areal evolution of urban areas at the national scale, possessing excellent cross-dataset comparability. All linear regression analyses in this study were conducted in Origin.
Figure 5.
Linear regression results of total urban areas at the national scale derived from NTL Urban with MGUP and MODIS from 2012 to 2024.
Furthermore, using LandScan population density data (threshold > 1500 persons/km2) as a reference, we evaluated the spatial correlation between each product and the referenced population distribution. The results reveal that NTL-based products (Urban entity and NTL Urban) significantly outperform optical products based solely on land cover (MODIS and MGUP) in reflecting population agglomeration. Specifically, the OA and Kappa coefficients for the NTL Urban product stabilize at 74–91.85% and 0.455–0.826, respectively (see Table 4). Overall, although fusing vegetation information provides limited improvement in population correlation metrics compared to pure NTL extraction, it still consistently outperforms land use products. This not only confirms that NTL data can more directly capture the spatial patterns of human activities and population agglomeration, but also demonstrates that fusing vegetation indices can effectively improve the semantic alignment of urban boundaries without compromising population representation capabilities.
Table 4.
Consistency assessment results between multi-source data and LandScan population density data for typical cities.
3.3. Correlation with Socio-Economic Data
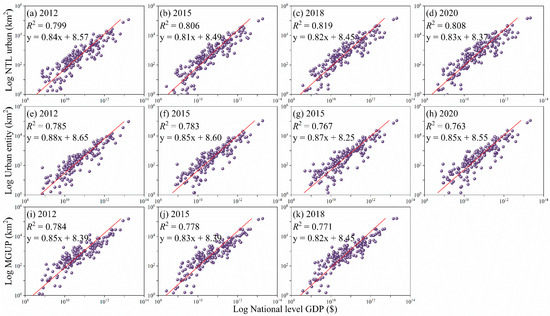
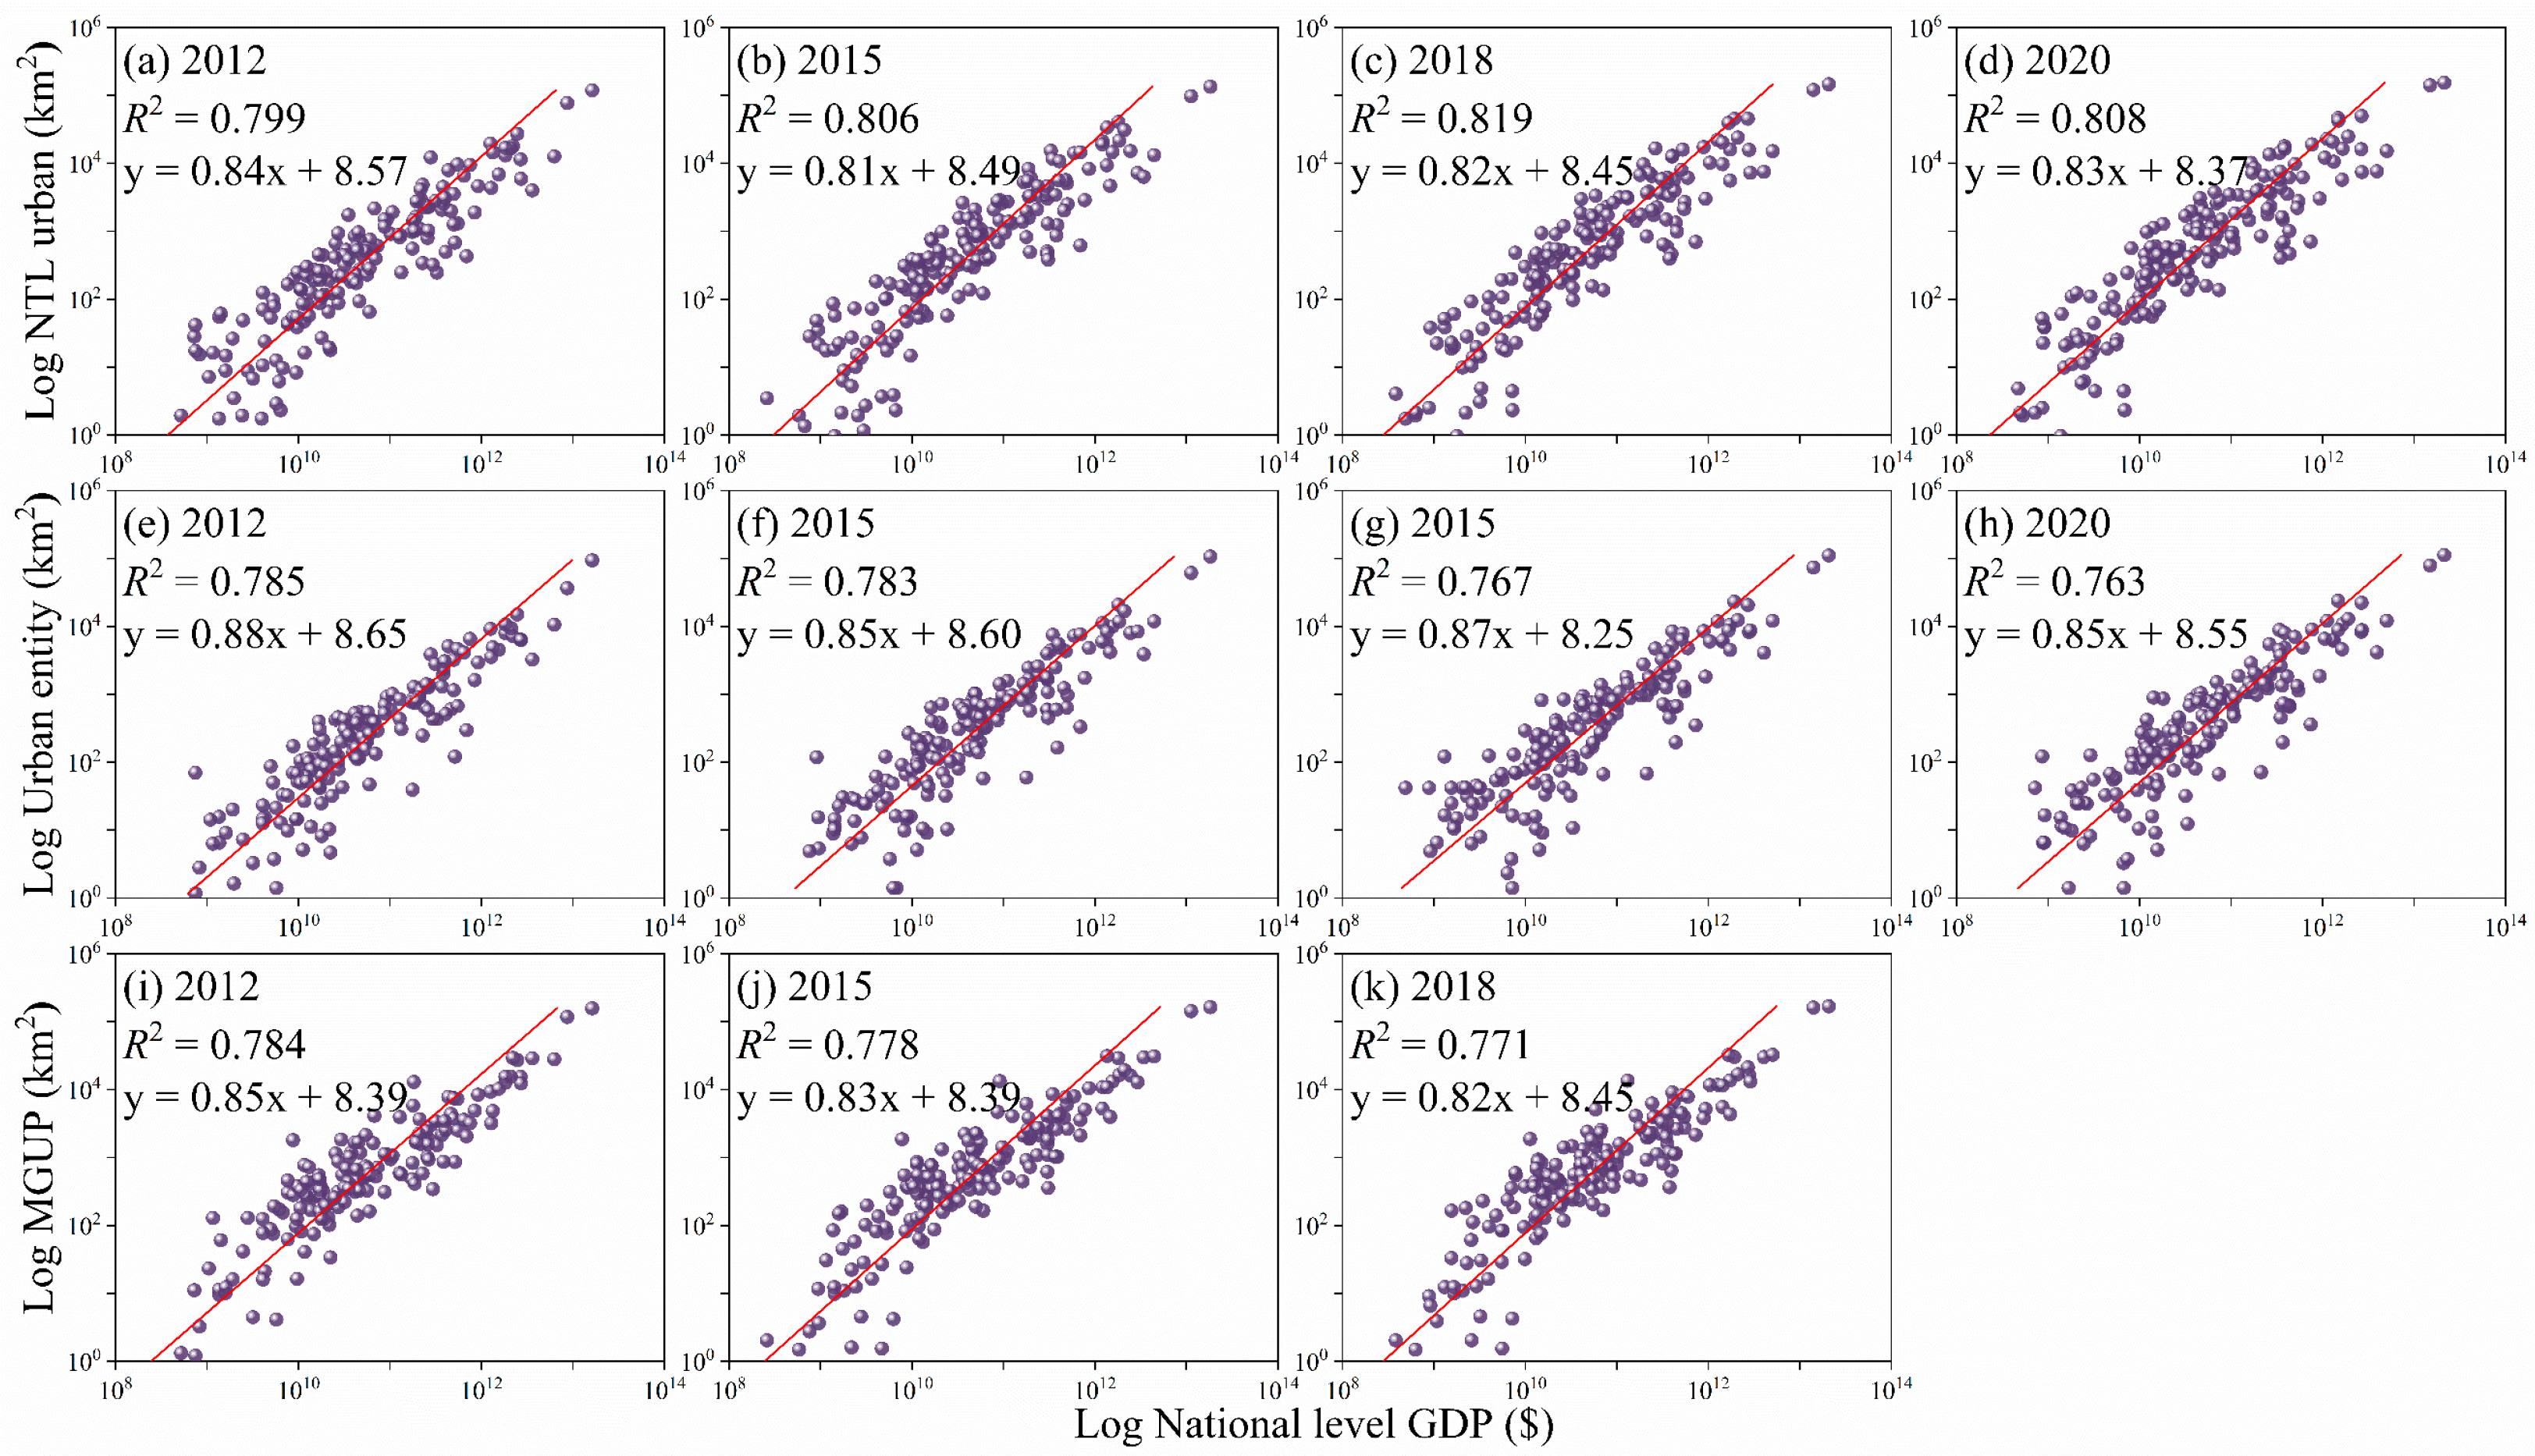
Figure 6 compares three indicators: the NTL Urban proposed in this study, the NTL-based Urban entity, and the remote sensing-derived MGUP. NTL Urban exhibits a higher goodness-of-fit across all years, with its coefficient of determination (R2) ranging from 0.799 to 0.819 and regression slopes approximately between 0.81 and 0.84. In contrast, the R2 for Urban entity ranges from 0.763 to 0.785, and for MGUP, it ranges from 0.771 to 0.784. Consequently, NTL Urban demonstrates a stronger linear correlation with national-level GDP, and the data points exhibit less dispersion around the fitted line, indicating that NTL Urban possesses better explanatory power in characterizing economic scale at the national level. The reasons for this outcome can be summarized into two aspects. First, the NVRI preprocessing and the block-based adaptive threshold extraction strategy introduced in this study effectively suppress the blooming effect and noise caused by vegetation and water bodies, thereby enhancing the signal consistency between radiance and human activities. Second, the logarithmic transformation mitigates the impact of extreme values in the regression analysis, prominently and robustly reflecting the correlation between lit areas and economic scale. Overall, these results indicate that NTL Urban has more stable and stronger explanatory capability in reflecting national-level economic activities.
Figure 6.
Linear regression results between national-level GDP and total urban areas derived from NTL Urban, MGUP, and MODIS from 2012 to 2020.
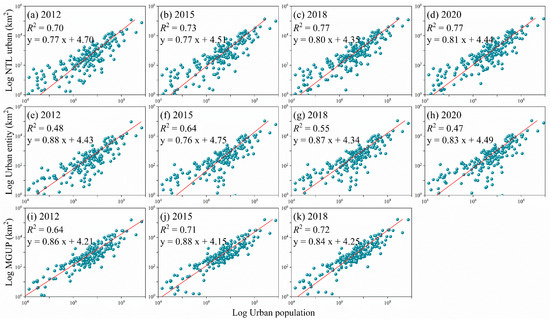
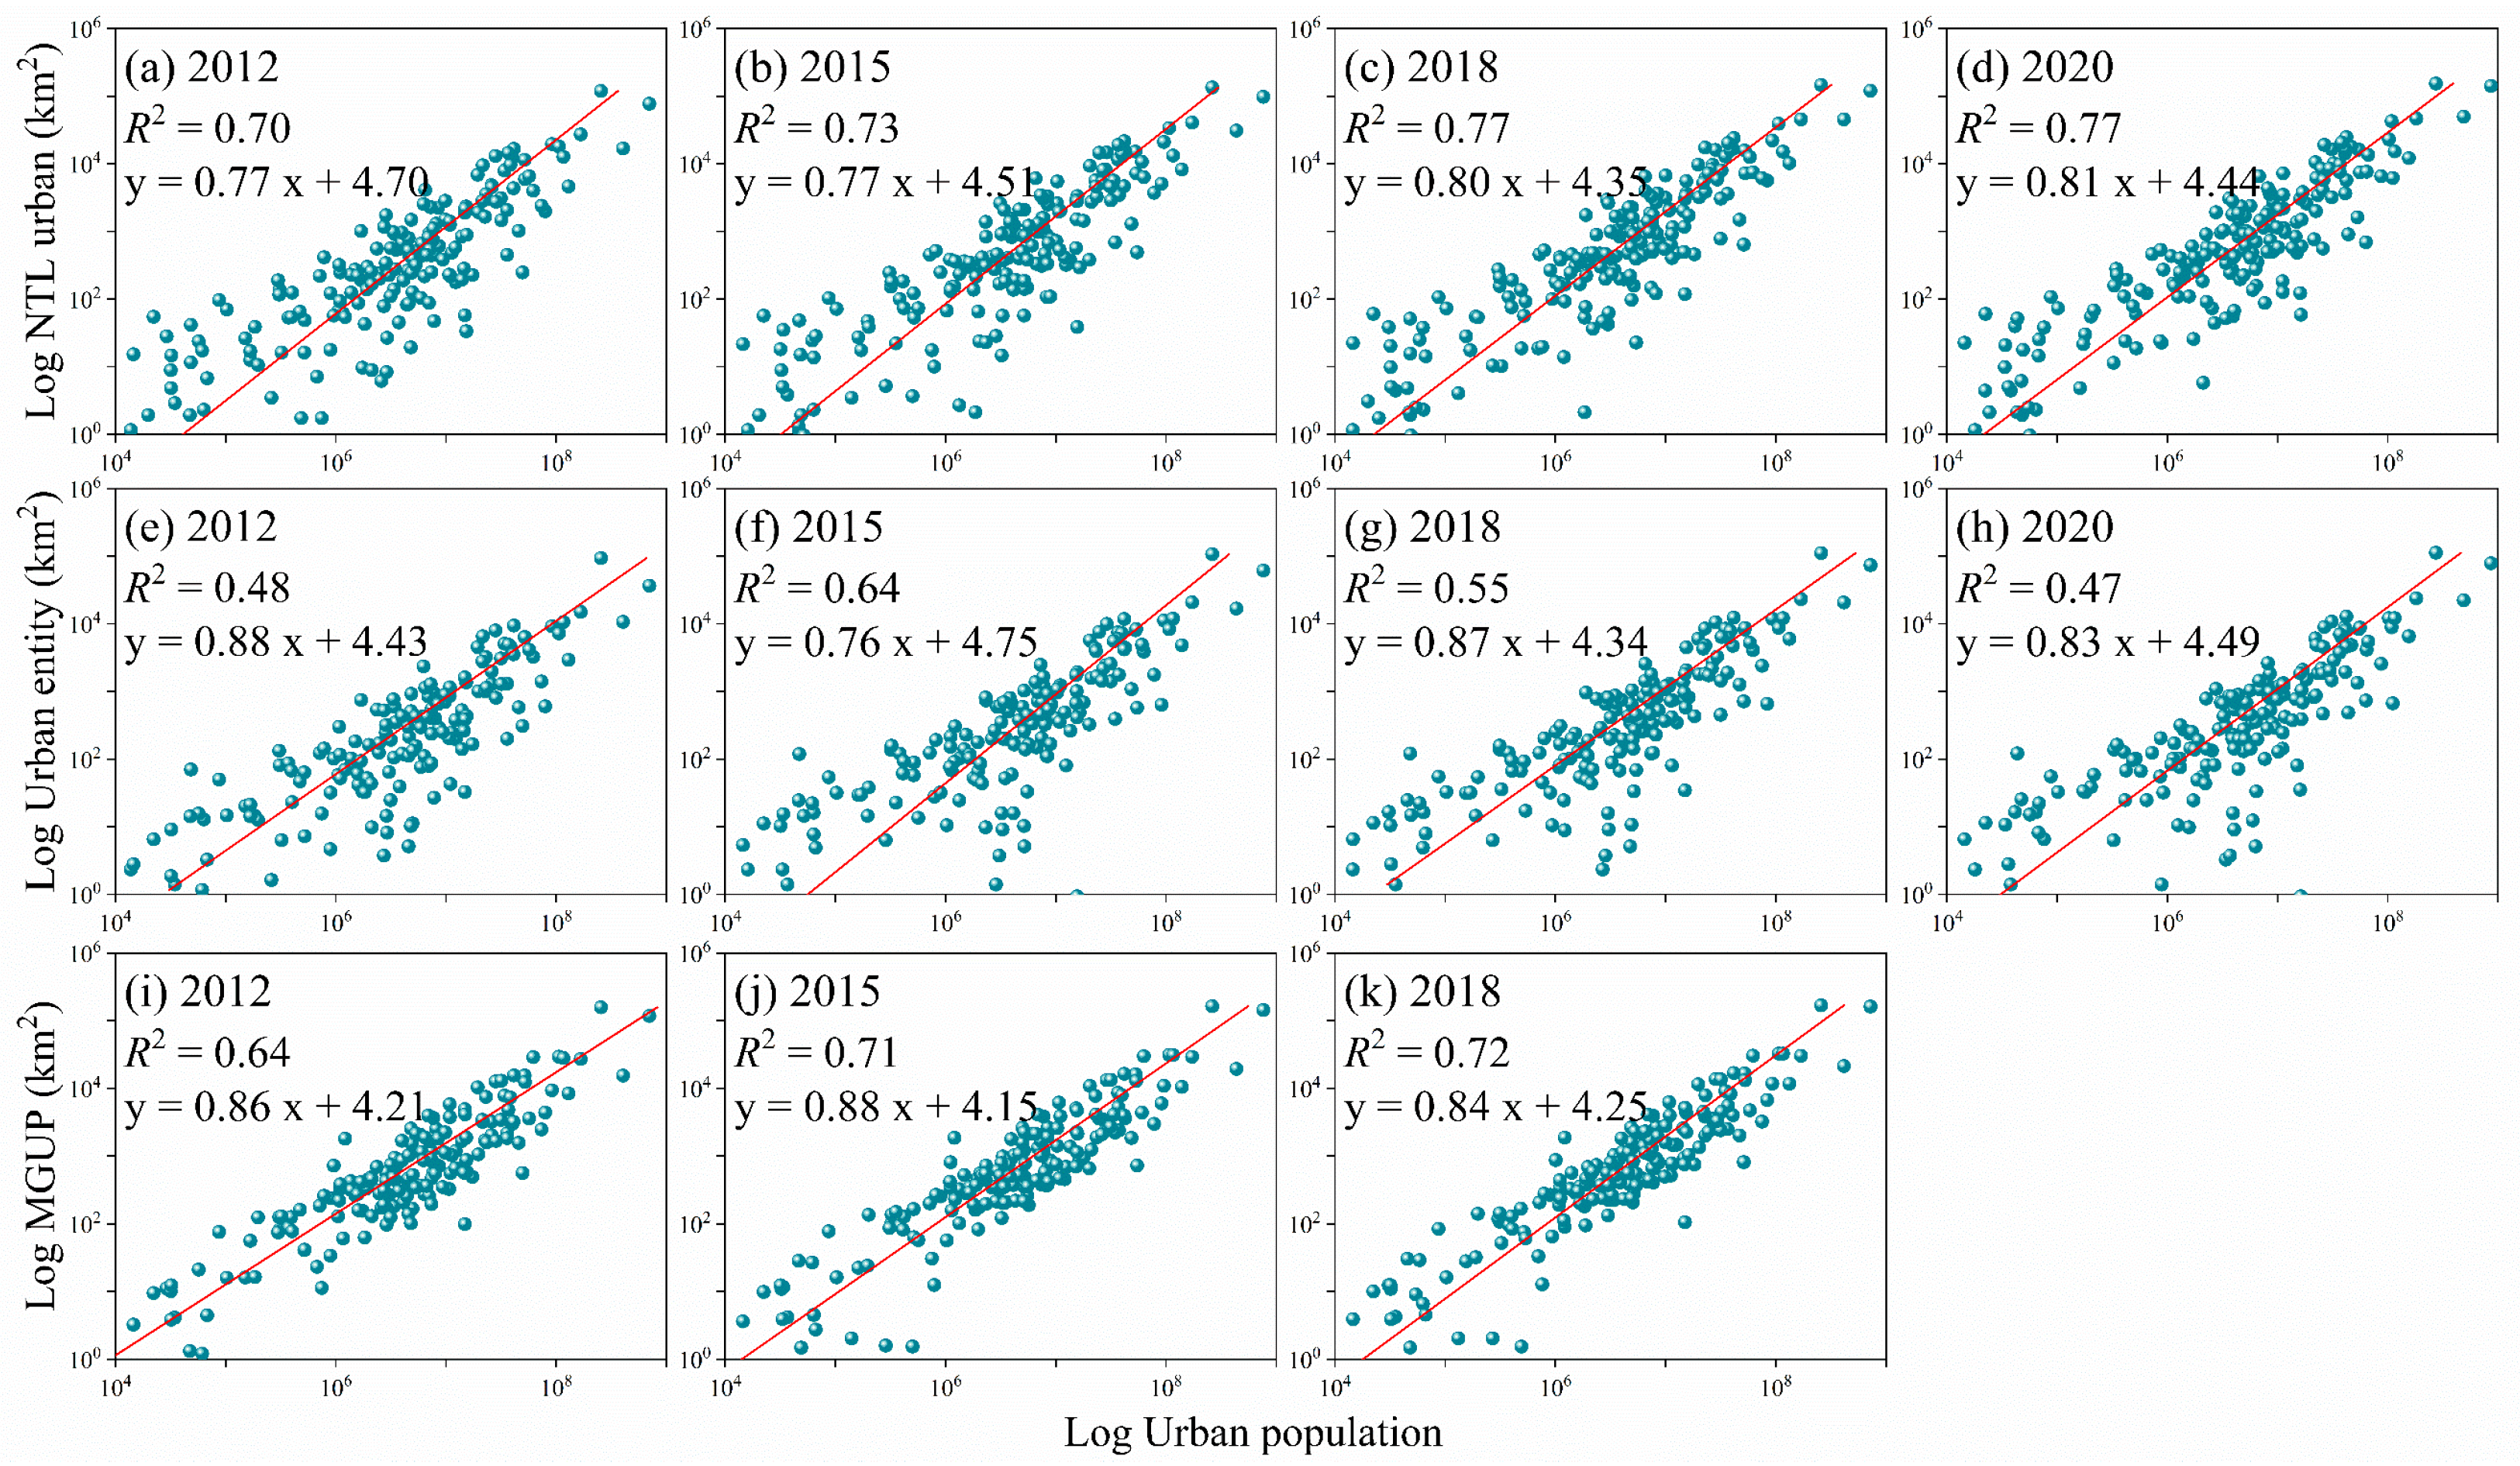
Figure 7 performs a linear fitting between the national-level total urban population and the three urban area indicators in logarithmic coordinates, providing regression statistics to compare method performance. Specifically, the NTL Urban proposed in this study exhibits the highest fitting quality across all years, with its R2 values ranging from 0.70 to 0.77 for the years 2012, 2015, 2018, and 2020, and regression slopes ranging from 0.77 to 0.81. In comparison, the Urban entity obtained directly from NTL intensity thresholding performs more unstably and is generally weaker, with R2 ranging from 0.47 to 0.64 and regression slopes distributed between 0.76 and 0.88. The MGUP, automatically extracted based on four urban data products, falls in the middle, with R2 between 0.64 and 0.72 and regression slopes roughly between 0.84 and 0.88. Taking 2018 as an example, the R2 of NTL Urban is approximately 0.77 with a slope of 0.80, whereas the R2 of Urban entity is about 0.55 with a slope of 0.87, and the R2 of MGUP is roughly 0.72 with a slope of 0.84. In summary, the NTL Urban area shows higher consistency with population growth, and the smaller dispersion of data points around the fitted line indicates that this indicator is more stable for cross-scale comparisons among different countries. Conversely, the fit of Urban entity fluctuates significantly and is overall lower, indicating that the urban boundaries extracted directly from VIIRS NTL data are more profoundly affected by blooming effects and background noise when reflecting population distribution. Although MGUP originates from multi-source urban extent products and possesses good land cover consistency, its correlation with population in certain years remains slightly inferior to that of NTL Urban processed with NVRI and adaptive thresholding. This demonstrates that the NVRI preprocessing and the block-based adaptive threshold extraction method effectively enhance the signal consistency between NTL and population, thereby improving the correlation of NTL urban area as a proxy variable for population and economic activities.
Figure 7.
Linear regression results between national-level population data and total urban areas derived from NTL Urban, MGUP, and MODIS from 2012 to 2020.
3.4. Analysis of Global Urban Expansion
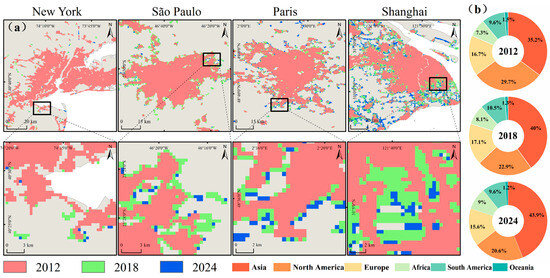
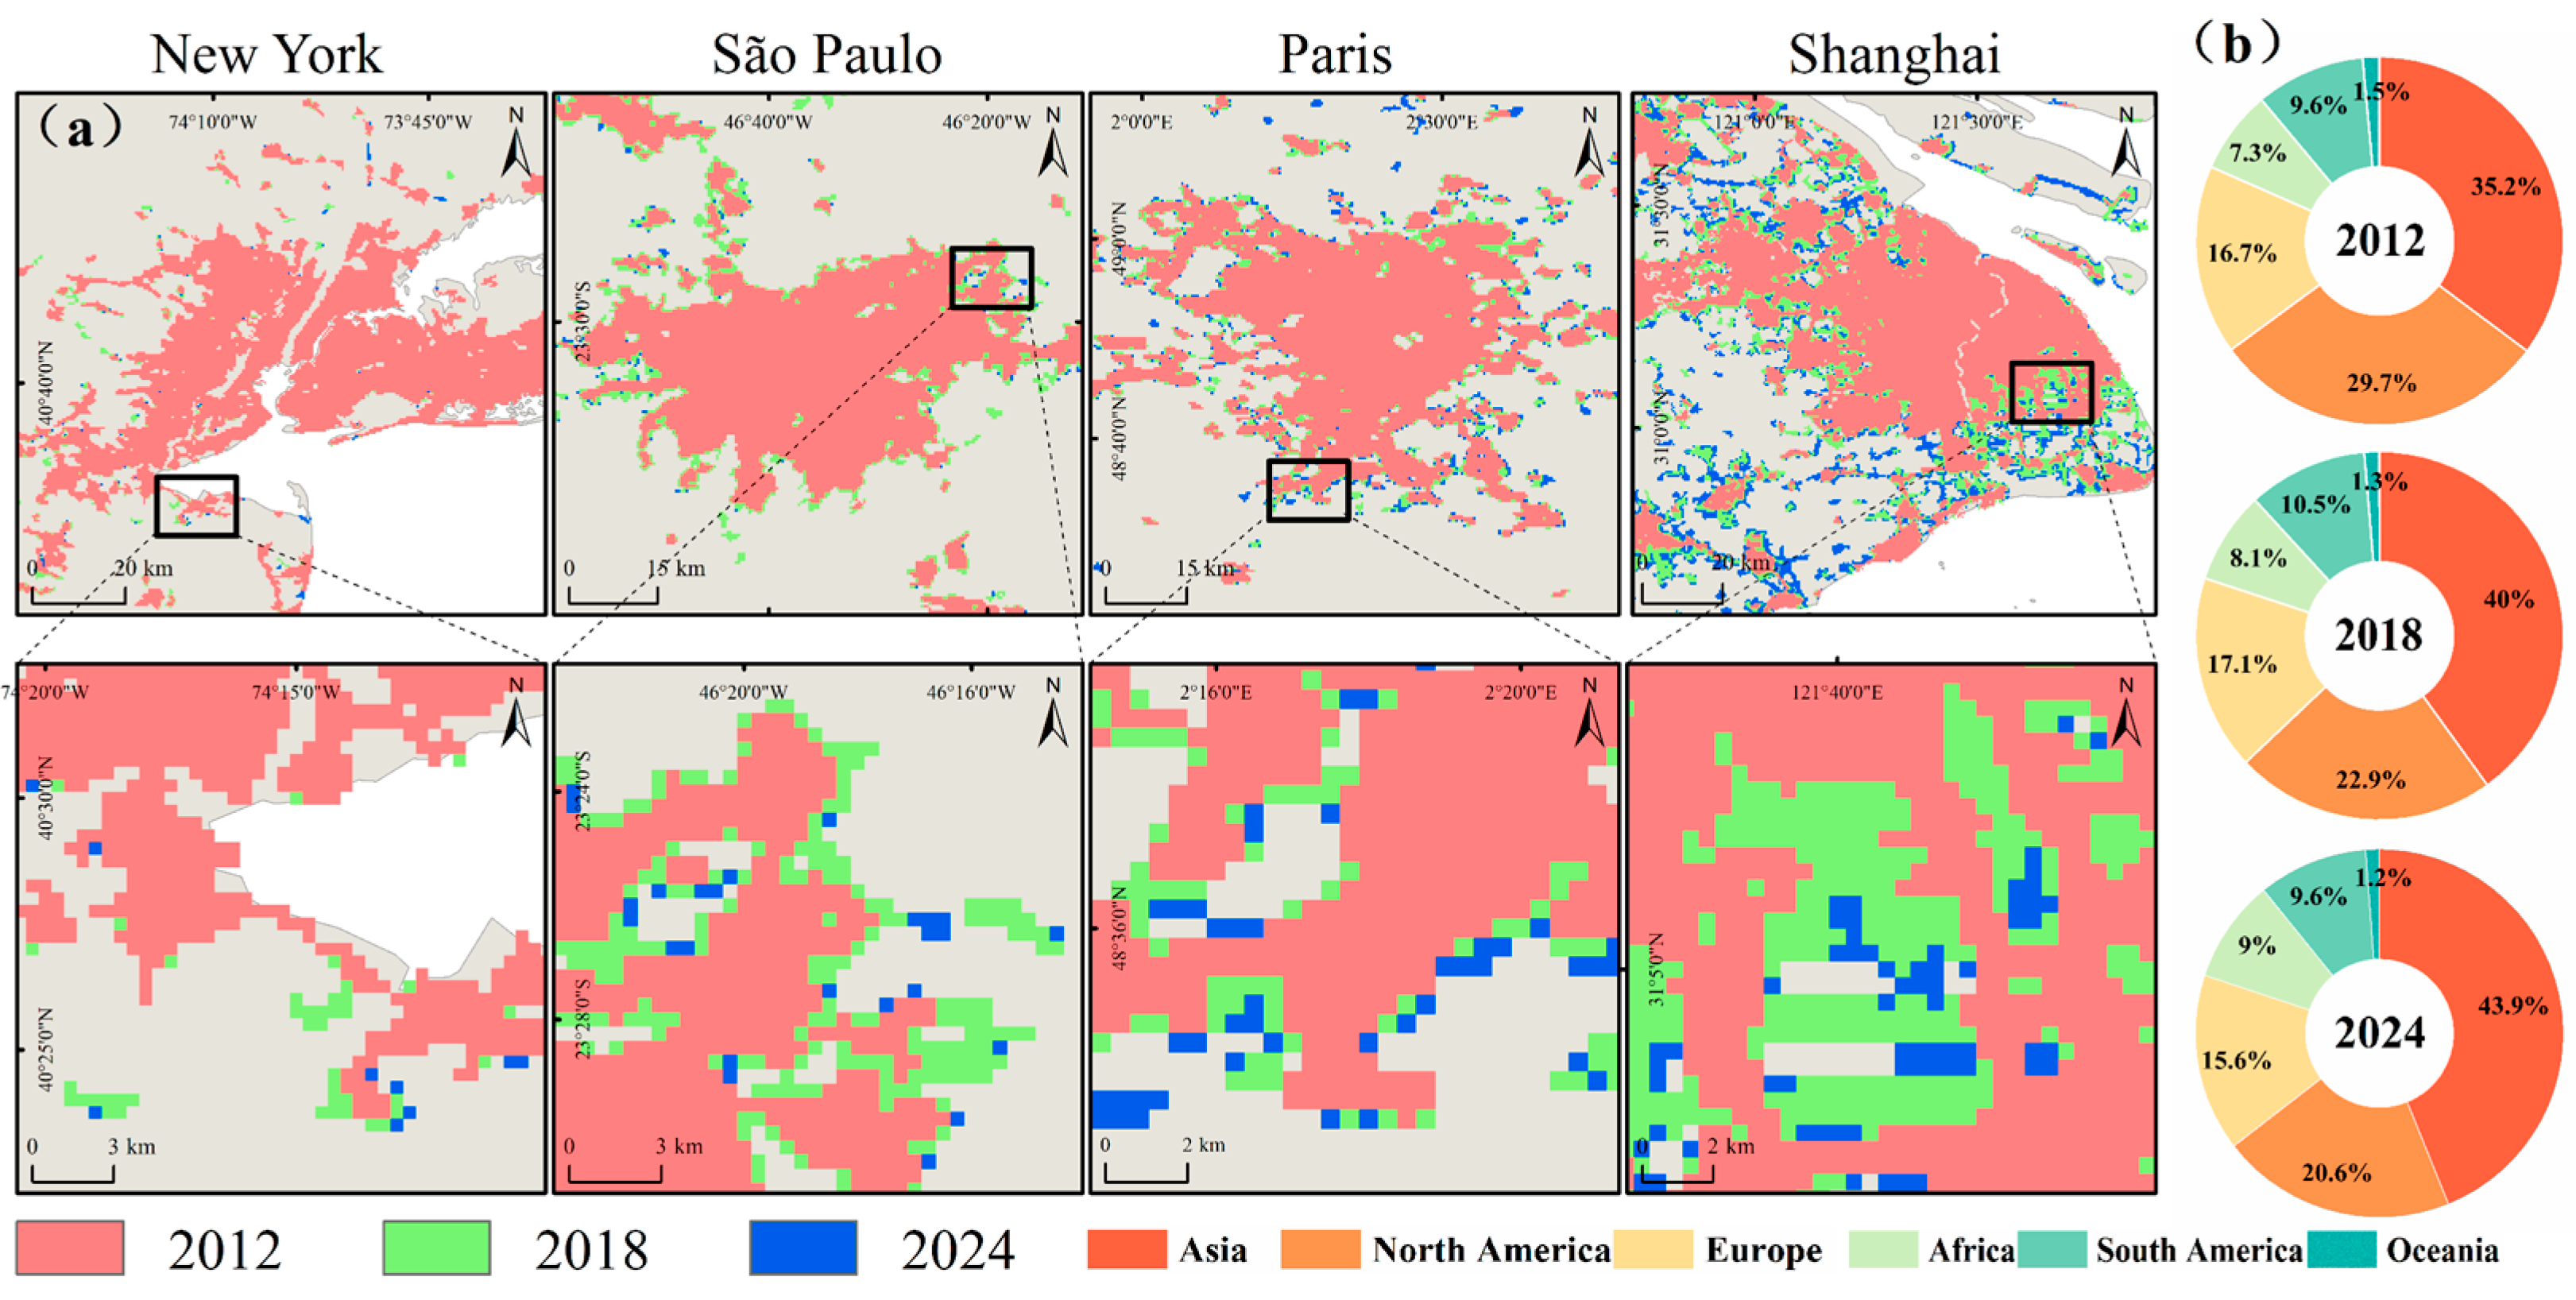
This study selects New York, São Paulo, Paris, and Shanghai as four representative sample regions, using locally magnified maps to illustrate the urban expansion characteristics of different regions from 2012 to 2024 (Figure 8a). The local comparison results reveal that the NTL coverage extent of New York changed minimally during the observation period, with an increase of only 1.14 km2, both São Paulo and Paris exhibit moderate peripheral expansion, with area increases of 16.88 km2 and 0.97 km2, respectively, primarily reflected in the contiguous growth of satellite city belts and suburban zones. Shanghai shows the most pronounced expansion, increasing by 153.42 km2, with its NTL boundaries extending significantly towards the suburbs and coastal new areas, reflecting rapid urban development and land expansion. Based on global-scale statistics, we calculated the proportion of total urban area for each continent in 2012, 2018, and 2024, and plotted them as pie charts (Figure 8b). The statistical results indicate that Asia’s share continued to rise during the study period, increasing roughly from 35% to nearly 40%, and further advancing to approximately 44%, making it the dominant region driving global urban area growth. The share of North America declined, Europe’s share decreased slightly, while the shares of Africa and South America maintained minor fluctuations. Overall, the regional differences among the sample cities align with the large-scale changes in continental proportions, indicating that Asia’s rapid urbanization has occupied an increasingly important position in the global urbanization landscape in recent years.
Figure 8.
(a) Urban expansion of New York, São Paulo, Paris, and Shanghai, and (b) the proportion of urban areas across continents in 2012, 2018, and 2024.
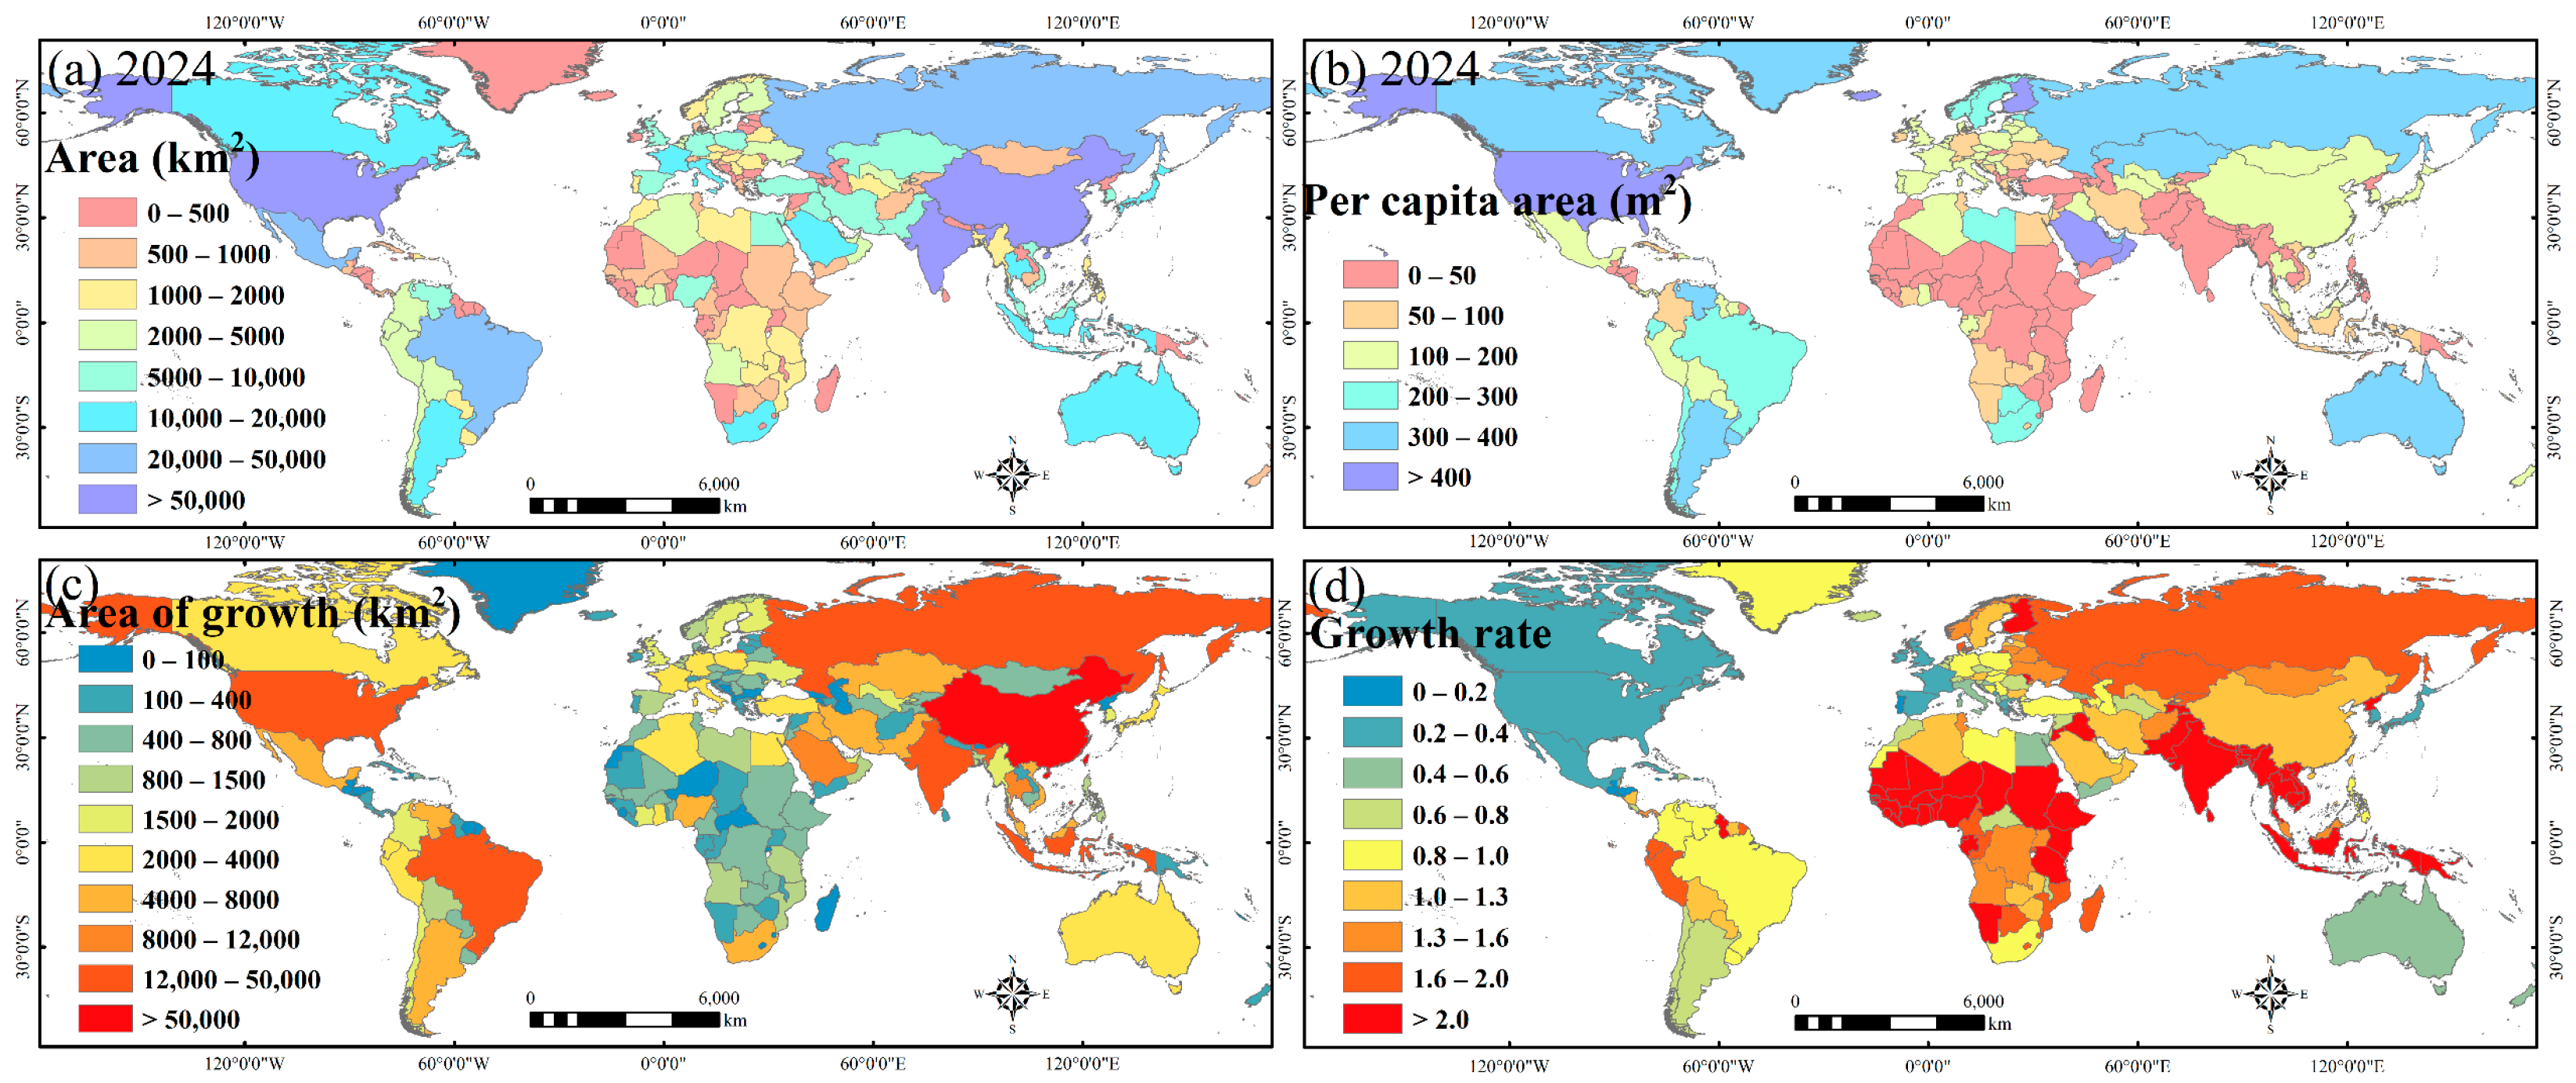
Figure 9 portrays the spatial heterogeneity of global urban expansion (2012–2024) across four dimensions: total and per capita urban areas, expansion increments, and growth rates. In terms of total area, a distinct Asia-dominated pattern emerges. Centered on China and India, Asia constitutes the primary agglomeration belt driving global urban land expansion. Conversely, North America and Europe rely on long-accumulated, mature urban networks, characterized by massive baselines but stable increments. Per capita urban areas further highlight divergent land-use efficiencies and urbanization typologies. Sparsely populated developed nations (e.g., North America, Russia, and Australia) exhibit high per capita extents, reflecting low-density, horizontal-sprawl models. In contrast, densely populated Asian and African nations present significantly lower per capita metrics, embodying population-driven, spatially intensive development paths. Finally, juxtaposing absolute increments with relative growth rates distinguishes global driving mechanisms. Asia leads in absolute expansion volumes, while North American and European nations are largely undergoing slow stock adjustments. Meanwhile, developing nations in South Asia, Southeast Asia, and Sub-Saharan Africa exhibit the highest relative growth rates, demonstrating robust catch-up urbanization momentum. This contrast underscores the varying pressures exerted on land resources and ecosystems by “large-volume continuous growth” versus “small-baseline fast growth” trajectories.
Figure 9.
Global distributions of (a) total urban area in 2024, (b) per capita urban area in 2024, (c) expansion increments, and (d) growth rates by country.
3.5. Method Evaluation
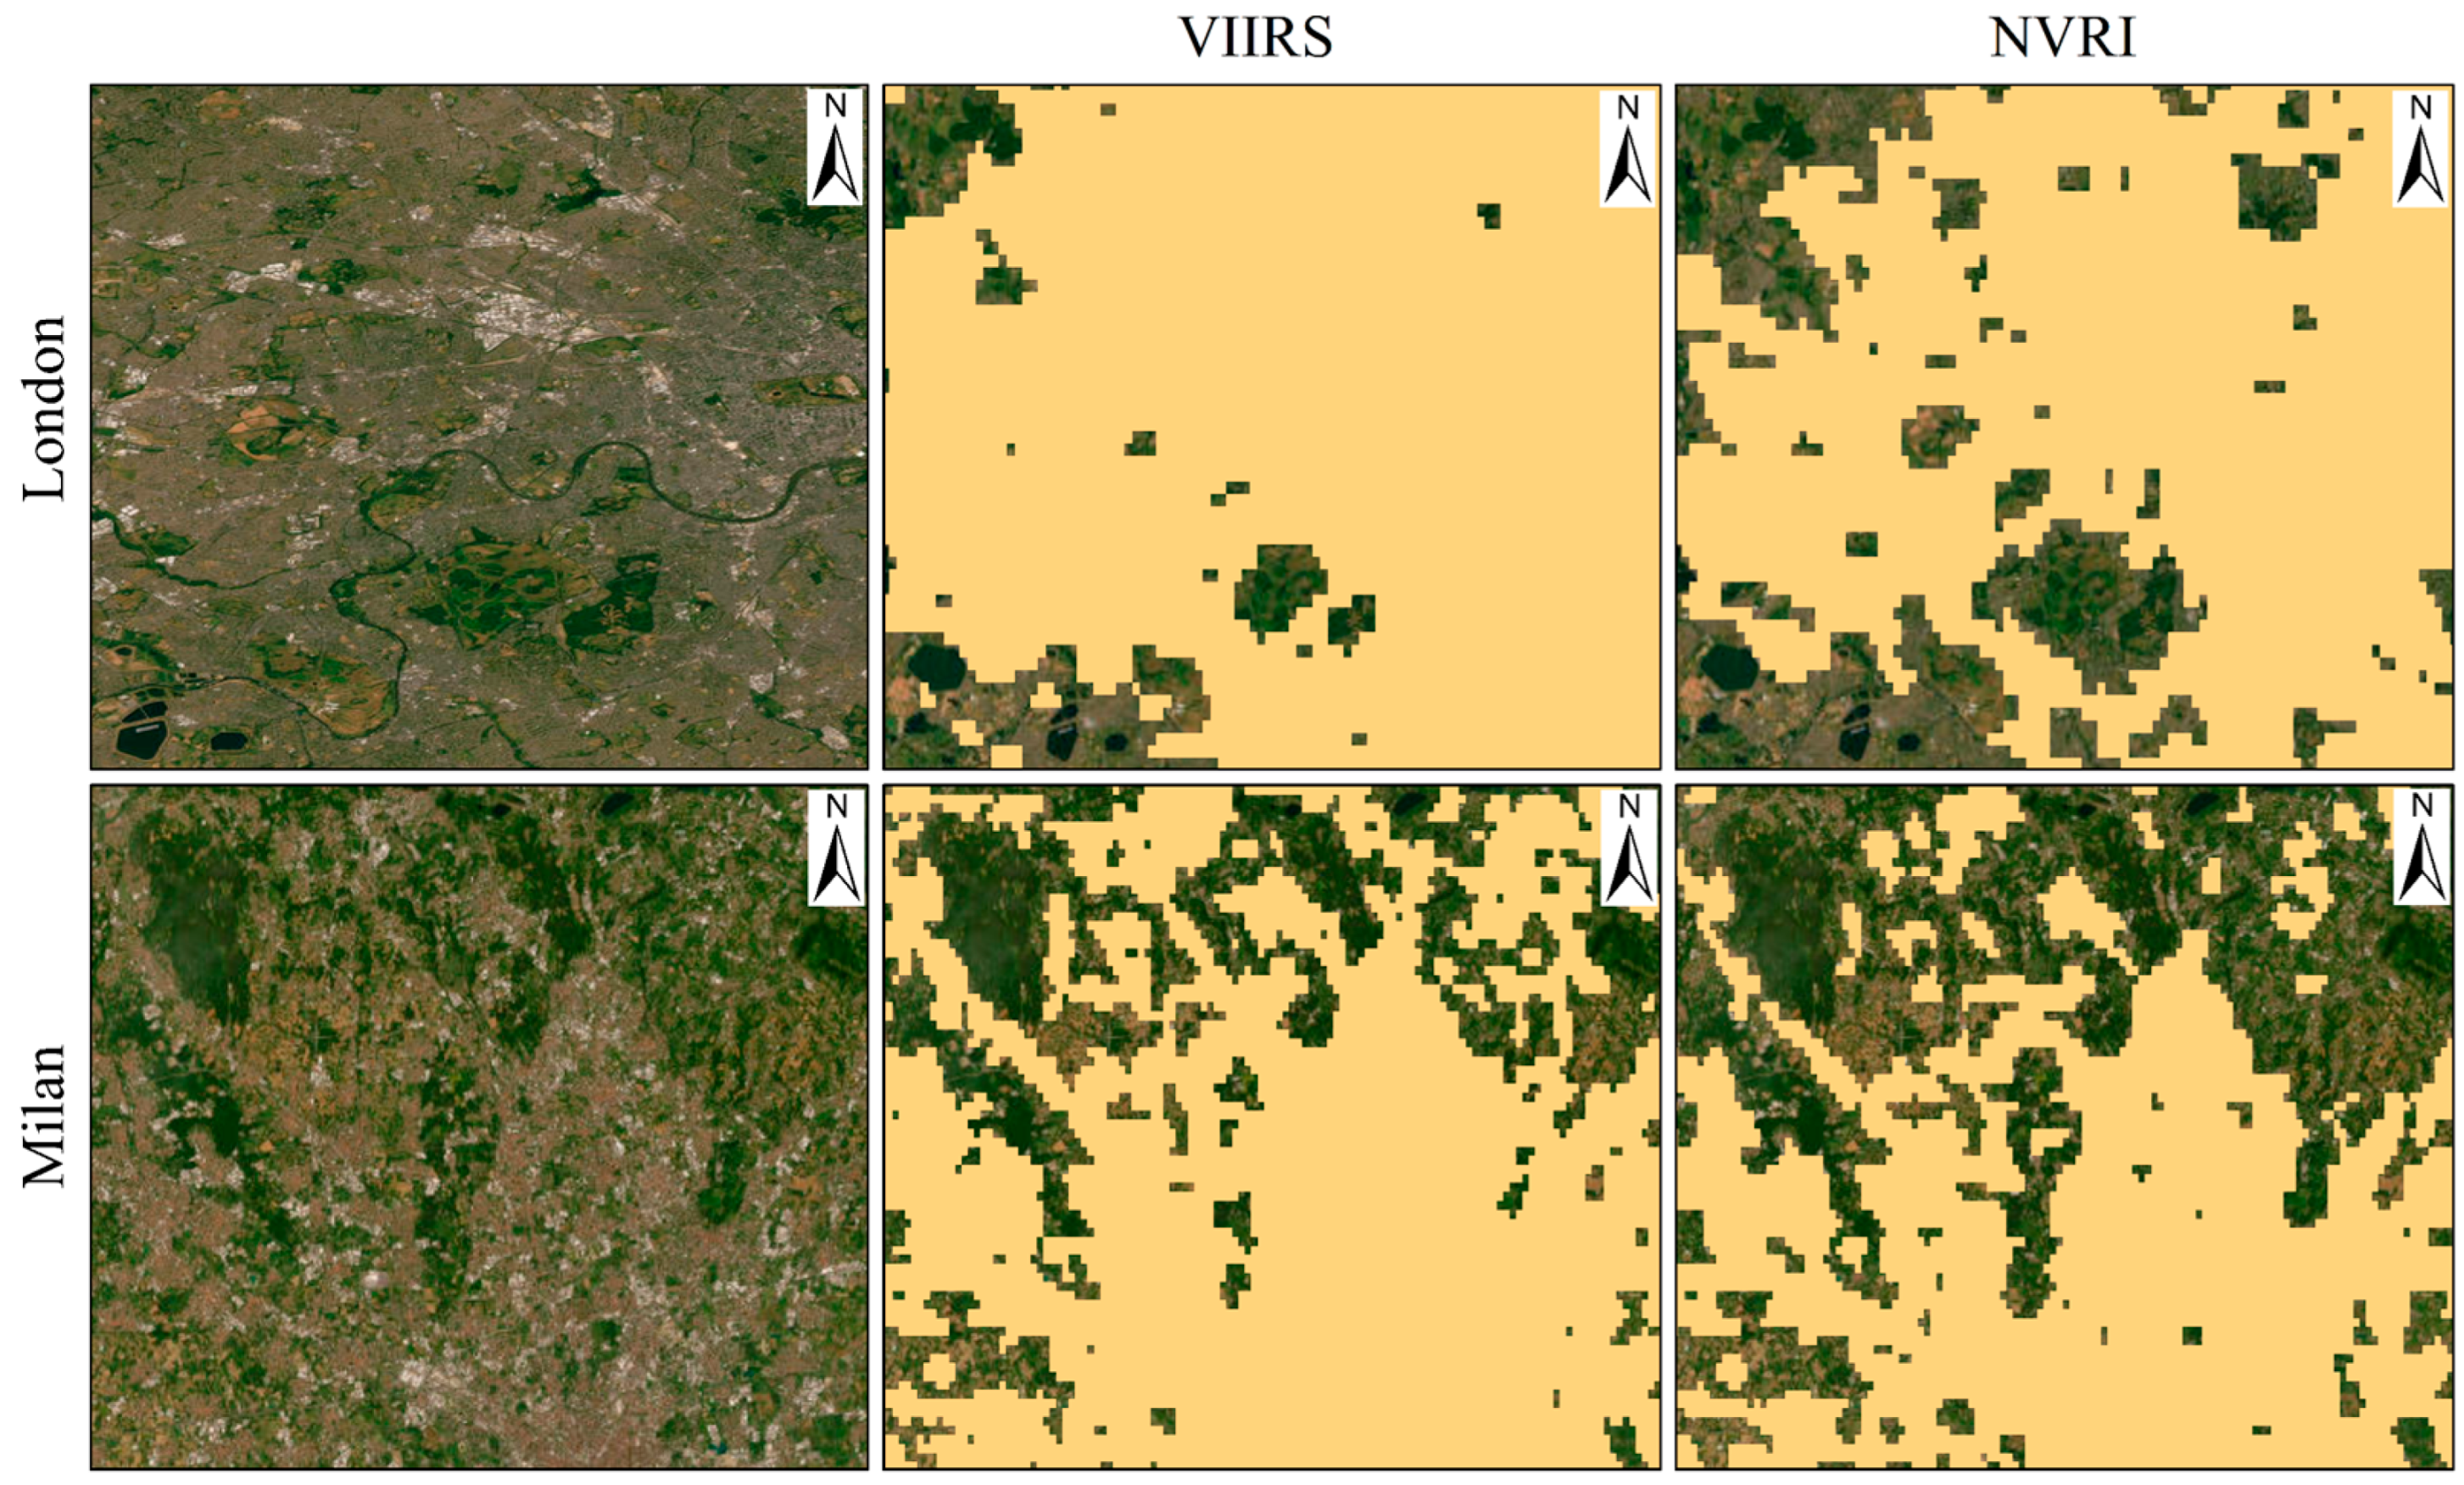
The comparison for London and Milan in Figure 10 visually demonstrates the practical value of the fusion strategy. Threshold segmentation based solely on VIIRS suffers from blooming effects in certain areas, manifesting as oversized urban extents and the misidentification of bare land and highly vegetated patches within cities as urban areas. Conversely, after adopting fusion variables like NVRI, the internal urban structure becomes more reasonable, and the boundaries of urban-rural transition zones become clearer, indicating that fusing vegetation information can effectively suppress misclassifications caused by non-urban light sources and background discrepancies.
Figure 10.
Comparison of urban area extraction results using single VIIRS data versus the fused NVRI variable. The yellow areas denote the extracted urban extents.
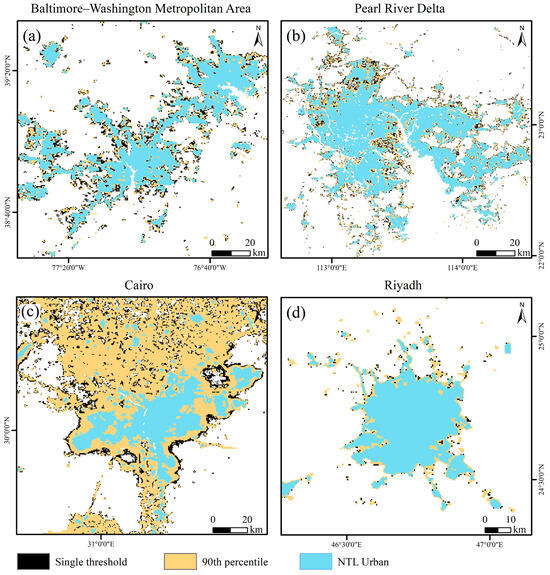
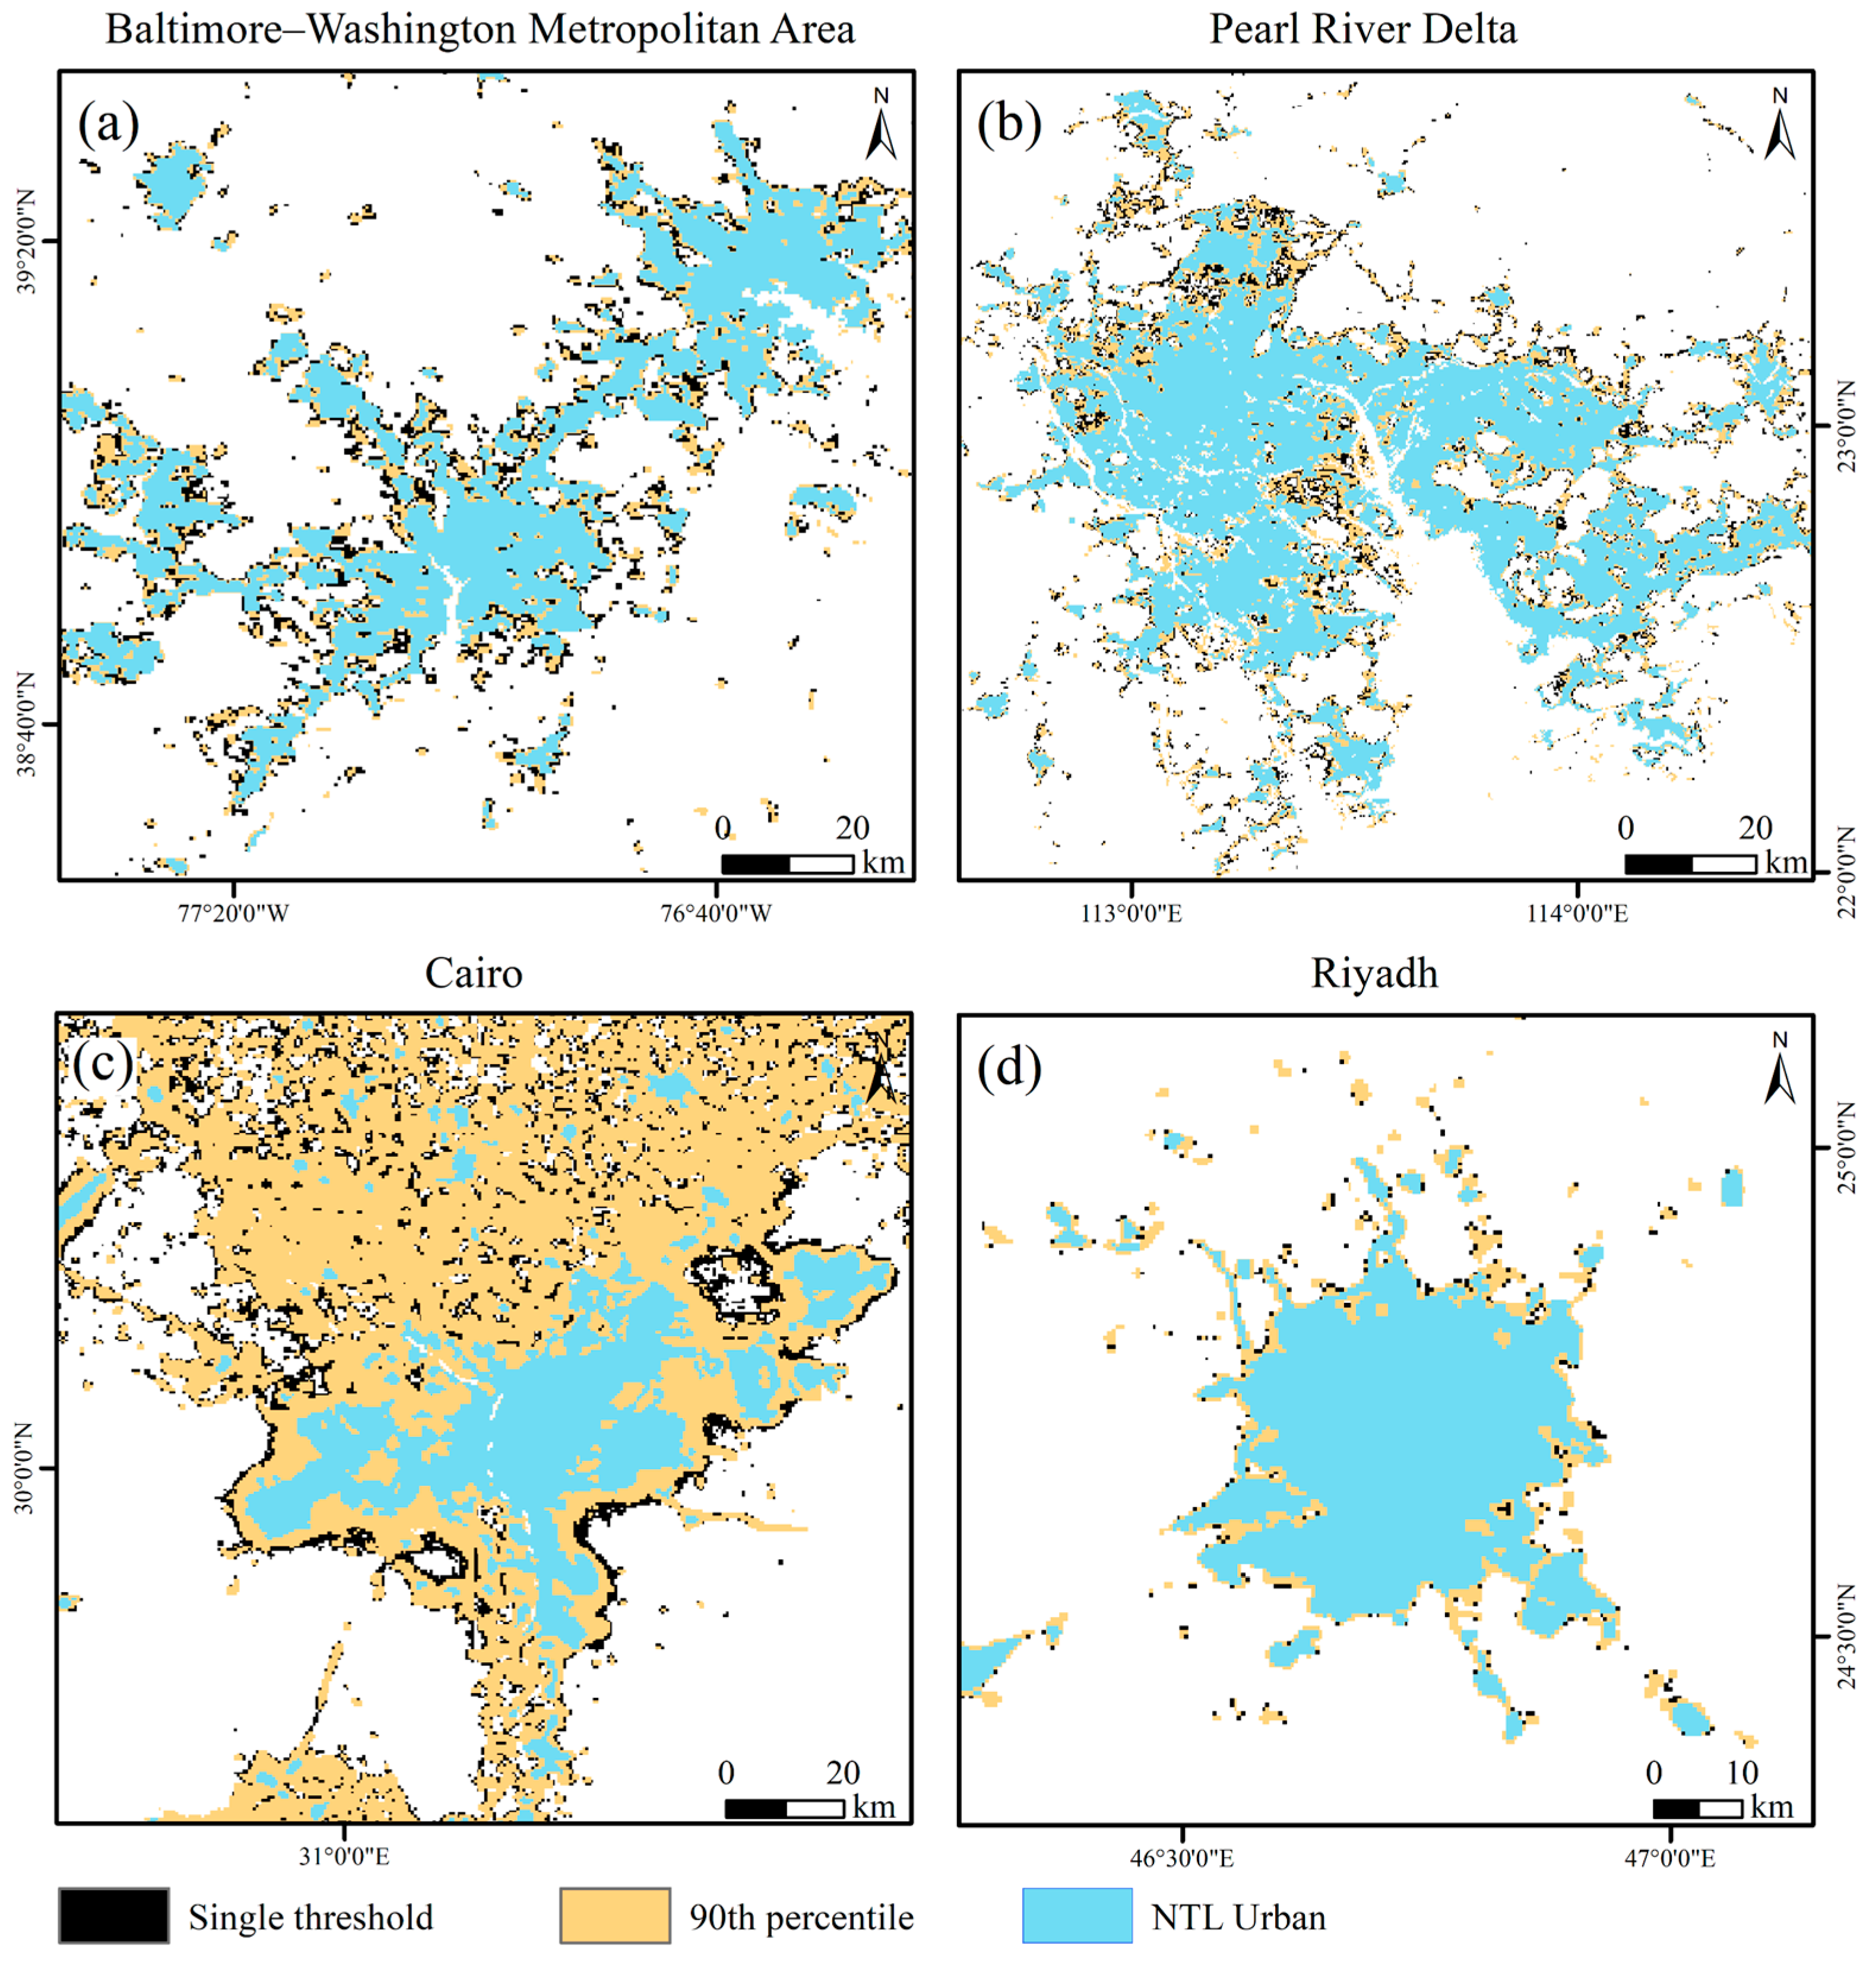
To further validate the spatial robustness of the proposed multi-scale adaptive extraction framework in complex global surface environments, this study selected four representative typical urban agglomerations to conduct an intuitive comparative analysis between the urban product generated in this study (NTL Urban, light blue) and urban areas extracted based on a global single threshold (black) and a global 90th percentile threshold (yellow) (Figure 11). The comparative regions encompass normal vegetation coverage areas (e.g., the Baltimore–Washington Metropolitan Area in the US and the Pearl River Delta in China) and typical extremely arid regions (e.g., Cairo and Riyadh in the Middle East). The comparison results profoundly reveal the severe limitations of traditional global fixed thresholds when dealing with large-scale spatial heterogeneity. In normal vegetation coverage areas like Baltimore–Washington and the Pearl River Delta (Figure 11a,b), both the global single threshold and the high-percentile threshold exhibit varying degrees of boundary expansion and noise misidentification in urban-rural fringe zones. In contrast, the local optimal grid threshold based on the Kneedle algorithm adopted in this study (NTL Urban) fully utilizes the vegetation constraint information in NVRI, effectively suppressing suburban blooming and rendering the extracted boundaries of urban entities more convergent and consistent with actual urban spatial topologies.
Figure 11.
Spatial comparison of urban extraction results using the global single threshold (black), the 90th percentile threshold (yellow), and the local adaptive threshold (light blue) in normal vegetation coverage areas (Baltimore–Washington Metropolitan Area (a), Pearl River Delta (b)) and arid regions (Cairo (c), Riyadh (d)).
In extremely arid regions like Cairo and Riyadh (Figure 11c,d), traditional thresholding methods lacking spatial adaptability expose severe “desert blooming” defects. Particularly in Cairo (Figure 11c), it can be observed that the global 90th percentile threshold (yellow) erroneously classifies large areas of non-urban desert as urban areas. The physical mechanism behind this phenomenon is that the surface NDVI in arid regions is generally close to 0, causing the vegetation suppression in the NVRI formula to fail, forcibly applying a globally uniform index threshold at this point easily leads to overfitting to extreme light sources such as highly reflective desert backgrounds and oil and gas fields. Relying on the introduced arid grid adaptive identification and data source switching strategy, the NTL Urban product of this study can automatically filter out extremely arid grids through local NDVI statistical features and dynamically switch the underlying data to preprocessed VIIRS data to avoid excessive amplification of background signals. As seen from the light blue areas in the figure, this strategy effectively filters out the false expansion of desert backgrounds and reliably delineates the urban extent contours along the Nile River and the urban core of Riyadh. In summary, the adaptive extraction framework proposed in this study not only utilizes vegetation information to significantly refine the results of urban-rural boundaries under conventional landforms but also effectively overcomes the challenge of severe area overestimation in arid regions through a mechanism-switching approach, demonstrating global generalization capability and mapping performance.
4. Discussion
Urban extents can be defined from multiple perspectives, such as administrative boundaries, demographic and statistical indicators, land cover types, and functional indicators based on human activities. Unlike land cover or administrative boundaries, NTL-based urban extraction focuses on the intensity of human nocturnal activities, providing a means to characterize urban spatial distribution from a functional perspective. This study combines NTL remote sensing with auxiliary data such as vegetation indices, aiming to construct an urban product that reflects the actual intensity of nocturnal and economic activities, thereby compensating for the limitations of coverage-based data in reflecting urban functional attributes.
The NTL-vegetation fusion extraction framework constructed in this study possesses evident advantages in several aspects. First, from a functional perspective, NTL directly responds to lighting and energy use activities. Therefore, it can more directly reflect the spatial distribution of population agglomeration and economic activities, making it more representative than pure land cover indicators. Second, modern NTL sensors (represented by VIIRS) significantly outperform early data in radiometric calibration and dynamic range. This enables clearer differentiation of internal urban brightness gradients, small towns with medium-low brightness, and urban fringe zones, thereby improving the detection rate of small- and medium-scale urban units. Third, NTL data possess excellent temporal continuity, facilitating long-term time-series monitoring and change detection, when NTL information is used synergistically with auxiliary data such as NDVI and global water masks, it can effectively suppress the misclassification of non-urban backgrounds like water bodies and dense vegetation, enhancing the stability and rationality of the extraction results.
We acknowledge that extracting urban areas based on fused NTL indices still has inherent limitations. NTL signals originate not only from urban lighting but can also be interfered with by non-urban scenes (e.g., port operations, fishing boat lights, industrial point sources, or natural light pollution), leading to misclassification, masking or post-processing can only mitigate this interference. In arid or widely distributed bare land regions, low vegetation coverage may induce a “blooming” effect in the NTL-vegetation correction, thereby enlarging urban boundaries. Furthermore, NTL signals from remote small towns and rural settlements are often weak and easily omitted by thresholding processes, affecting the completeness of the product. Additionally, the spatial resolution of NTL data remains limited and cannot replace the capability of high-resolution urban remote sensing products (typically finer than 30 m) in fine morphological characterization. Therefore, applications requiring high-precision boundaries or micro-scale planning still necessitate calibration and fusion with high-resolution imagery or ground data. A full sensitivity analysis of the model parameters was not performed in this study due to scope limitations, which is recognized as a limitation of this work. We also note that the superior correlation of NTL Urban with GDP and population may partly reflect its inherent association with the nighttime-light source itself; however, this does not weaken the value of the method. On the contrary, compared with raw NTL data, our framework reduces blooming and noise while preserving genuine NTL-derived urban extent, thereby achieving better consistency with nighttime activity area without sacrificing correlation strength. This reflects the core value of the proposed approach.
5. Conclusions
Accurately capturing the spatiotemporal evolution of global urban areas is crucial for understanding human socio-economic dynamics. To address the challenges of background interference and extreme spatial heterogeneity in macro-scale extraction, this study proposes a fully automated framework fusing VIIRS-DNB and MODIS NDVI, producing an annual global urban extent dataset (NTL Urban) for 2012–2024. By constructing the Nightlight-Vegetation Rectified Index (NVRI) and innovatively introducing an adaptive arid grid identification mechanism, this method mitigates the desert blooming challenge in extremely arid regions. Simultaneously, coupling a multi-scale grid with Kneedle inflection point detection enables a data-driven calculation of local optimal thresholds. Cross-product comparison suggest that NTL Urban maintains high consistency with mainstream optical remote sensing products at the national scale and exhibits relatively stronger and more stable log-linear correlations with GDP and population distribution. These results indicate that the product can effectively capture spatial patterns associated with intense human activities.
Although objectively constrained by the inherent NTL blooming effect and sensor resolution, the proposed automated framework provides a reproducible and scalable technical paradigm for consistent global urbanization monitoring, offering highly explanatory data support for macroscopic socio-economic empirical research. Future studies can further integrate high-resolution remote sensing data to achieve finer investigations into 3D urban structures and internal functional zoning.
Author Contributions
W.G. and G.S. conceived the experiments, analyzed the data and wrote the paper; X.C. and X.Z. performed review and editing; W.D., Q.L. and H.Y. edited the paper. All authors have read and agreed to the published version of the manuscript.
Funding
This research was funded by the National Natural Science Foundation of China (No. 42571426; 52274169), the Zhejiang Province R&D Breakthrough Program (2024C03137), the Innovation training program for College Students at China University of Mining and Technology-Beijing (202502033; 202602031).
Data Availability Statement
Testing of the dataset is open to all parties interested in our research. Data will be made available from the following website: https://doi.org/10.7910/DVN/9A6BP2 (accessed on 27 March 2026).
Conflicts of Interest
The authors declare no conflicts of interest.
References
- Gong, P.; Li, X.; Wang, J.; Bai, Y.; Chen, B.; Hu, T.; Liu, X.; Xu, B.; Yang, J.; Zhang, W.; et al. Annual maps of global artificial impervious area (GAIA) between 1985 and 2018. Remote Sens. Environ. 2020, 236, 111510. [Google Scholar] [CrossRef] [Scilit]
- Bai, M.; Zhang, X.; Ai, W.; Jing, X.; Liu, L. A high-resolution global annual city and town boundaries dataset (2000–2022) derived from GLC_FCS30D product. Sci. Data 2025, 13, 50. [Google Scholar] [CrossRef] [Scilit] [PubMed]
- Zheng, Q.; Seto, K.C.; Zhou, Y.; You, S.; Weng, Q. Nighttime light remote sensing for urban applications: Progress, challenges, and prospects. ISPRS J. Photogramm. Remote Sens. 2023, 202, 125–141. [Google Scholar] [CrossRef] [Scilit]
- Zhu, Z.; Zhou, Y.; Seto, K.C.; Stokes, E.C.; Deng, C.; Pickett, S.T.A.; Taubenböck, H. Understanding an urbanizing planet: Strategic directions for remote sensing. Remote Sens. Environ. 2019, 228, 164–182. [Google Scholar] [CrossRef] [Scilit]
- Burian, J.; Paszto, V.; Langrova, B.; Sgem. Possibilities of the definition of city boundaries in gis—The case study of a medium-sized city. In Proceedings of Geoconference on Informatics, Geoinformatics and Remote Sensing; Curran Associates, Inc.: Red Hook, NY, USA, 2014; Volumn 3, pp. 777–784. [Google Scholar]
- Cang, J.; Wu, P.; Lin, S. Redefining the boundaries of Chinese cities—Analysis based on multisource geographical big data. Cities 2024, 149, 104984. [Google Scholar] [CrossRef] [Scilit]
- Guo, W.; Liu, J.; Zhao, X.; Hou, W.; Zhao, Y.; Li, Y.; Sun, W.; Fan, D. Spatiotemporal dynamics of population density in China using nighttime light and geographic weighted regression method*. Int. J. Digit. Earth 2023, 16, 2704–2723. [Google Scholar] [CrossRef] [Scilit]
- Liu, X.; Ning, X.; Wang, H.; Wang, C.; Zhang, H.; Meng, J. A Rapid and Automated Urban Boundary Extraction Method Based on Nighttime Light Data in China. Remote Sens. 2019, 11, 1126. [Google Scholar] [CrossRef] [Scilit]
- Liu, S.; Wang, C.; Chen, Z.; Li, Q.; Wu, Q.; Li, Y.; Wu, J.; Yu, B. Enhancing nighttime light remote Sensing: Introducing the nighttime light background value (NLBV) for urban applications. Int. J. Appl. Earth Obs. Geoinf. 2024, 126, 103626. [Google Scholar] [CrossRef] [Scilit]
- Hu, X.; Qian, Y.; Pickett, S.T.A.; Zhou, W. Urban mapping needs up-to-date approaches to provide diverse perspectives of current urbanization: A novel attempt to map urban areas with nighttime light data. Landsc. Urban Plan. 2020, 195, 103709. [Google Scholar] [CrossRef] [Scilit]
- Zhou, Y.; Smith, S.J.; Zhao, K.; Imhoff, M.; Thomson, A.; Bond-Lamberty, B.; Asrar, G.R.; Zhang, X.; He, C.; Elvidge, C.D. A global map of urban extent from nightlights. Environ. Res. Lett. 2015, 10, 054011. [Google Scholar] [CrossRef] [Scilit]
- Ma, T. An Estimate of the Pixel-Level Connection between Visible Infrared Imaging Radiometer Suite Day/Night Band (VIIRS DNB) Nighttime Lights and Land Features across China. Remote Sens. 2018, 10, 723. [Google Scholar]
- Zhou, Y.; Li, X.; Asrar, G.R.; Smith, S.J.; Imhoff, M. A global record of annual urban dynamics (1992–2013) from nighttime lights. Remote Sens. Environ. 2018, 219, 206–220. [Google Scholar] [CrossRef] [Scilit]
- Cao, X.; Chen, J.; Imura, H.; Higashi, O. A SVM-based method to extract urban areas from DMSP-OLS and SPOT VGT data. Remote Sens. Environ. 2009, 113, 2205–2209. [Google Scholar] [CrossRef] [Scilit]
- Mander, S.; Alam, F.; Lovreglio, R.; Ooi, M. How to measure light pollution—A systematic review of methods and applications. Sustain. Cities Soc. 2023, 92, 104465. [Google Scholar] [CrossRef] [Scilit]
- Levin, N.; Kyba, C.C.M.; Zhang, Q.; Sánchez de Miguel, A.; Román, M.O.; Li, X.; Portnov, B.A.; Molthan, A.L.; Jechow, A.; Miller, S.D.; et al. Remote sensing of night lights: A review and an outlook for the future. Remote Sens. Environ. 2020, 237, 111443. [Google Scholar] [CrossRef] [Scilit]
- Guo, W.; Zhao, Y.; Kyba, C.C.M.; Zhao, X.; Cui, X.; Liu, J.; Gao, X.; Chao, M.; Wei, X.; Liu, H.; et al. Using a deep learning method to establish 500 m resolution non-saturation nighttime light time series from 1992 to 2022. Int. J. Appl. Earth Obs. Geoinf. 2025, 143, 104771. [Google Scholar] [CrossRef] [Scilit]
- Li, X.; Zhou, Y. A Stepwise Calibration of Global DMSP/OLS Stable Nighttime Light Data (1992–2013). Remote Sens. 2017, 9, 637. [Google Scholar] [CrossRef] [Scilit]
- Letu, H.; Hara, M.; Tana, G.; Nishio, F. A Saturated Light Correction Method for DMSP/OLS Nighttime Satellite Imagery. IEEE Trans. Geosci. Remote Sens. 2012, 50, 389–396. [Google Scholar] [CrossRef] [Scilit]
- Guo, W.; Li, Y.; Cui, X.; Zhao, X.; Teng, Y.; Rienow, A. Mapping Spatiotemporal Dynamic Changes in Urban CO2 Emissions in China by Using the Machine Learning Method and Geospatial Big Data. Remote Sens. 2025, 17, 611. [Google Scholar] [CrossRef] [Scilit]
- Ji, M.; Xu, Y.; Yan, Y.; Zhu, S. Evaluation of the light pollution in the nature reserves of China based on NPP/VIIRS nighttime light data. Int. J. Digit. Earth 2024, 17, 2347442. [Google Scholar] [CrossRef] [Scilit]
- Liu, S.; So, C.W.; Pun, C.S. Analyzing the Sources and Variations of Nighttime Lights in Hong Kong from VIIRS Monthly Data. Remote Sens. 2025, 17, 1447. [Google Scholar] [CrossRef] [Scilit]
- Cheng, Y.; Zhao, L.; Wan, W.; Li, L.; Yu, T.; Gu, X. Extracting urban areas in China using DMSP/OLS nighttime light data integrated with biophysical composition information. J. Geogr. Sci. 2016, 26, 325–338. [Google Scholar] [CrossRef] [Scilit]
- Guo, W.; Zhao, C.; Zhang, Y.; Gao, S. Mapping Impervious Surface Distribution and Dynamics in an Arid/Semiarid Area-A Case Study in Ordos, China. IEEE Access 2021, 9, 19659–19673. [Google Scholar] [CrossRef] [Scilit]
- Jiang, S.; Li, J.; Duan, P.; Wei, Y. An image layer difference index method to extract light area from NPP/VIIRS nighttime light monthly data. Int. J. Remote Sens. 2019, 40, 4839–4855. [Google Scholar] [CrossRef] [Scilit]
- Li, C.; Duan, P.; Wang, M.; Li, J.; Zhang, B. The Extraction of Built-up Areas in Chinese Mainland Cities Based on the Local Optimal Threshold Method Using NPP-VIIRS Images. J. Indian Soc. Remote Sens. 2021, 49, 233–248. [Google Scholar] [CrossRef] [Scilit]
- Dou, Y.Y.; Liu, Z.F.; He, C.Y.; Yue, H.B. Urban Land Extraction Using VIIRS Nighttime Light Data: An Evaluation of Three Popular Methods. Remote Sens. 2017, 9, 175. [Google Scholar] [CrossRef] [Scilit]
- Zhao, M.; Zhou, Y.; Li, X.; Cheng, W.; Zhou, C.; Ma, T.; Li, M.; Huang, K. Mapping urban dynamics (1992–2018) in Southeast Asia using consistent nighttime light data from DMSP and VIIRS. Remote Sens. Environ. 2020, 248, 111980. [Google Scholar] [CrossRef] [Scilit]
- Wang, L.; Ye, C.; Chen, F.; Wang, N.; Li, C.; Zhang, H.; Wang, Y.; Yu, B. CG-CFPANet: A multi-task network for built-up area extraction from SDGSAT-1 and Sentinel-2 remote sensing images. Int. J. Digit. Earth 2024, 17, 2310092. [Google Scholar] [CrossRef] [Scilit]
- Chen, Y.F.; He, C.K.; Guo, W.; Zheng, S.Q.; Wu, B.X. Mapping Urban Functional Areas Using Multisource Remote Sensing Images and Open Big Data. IEEE J. Sel. Top. Appl. Earth Obs. Remote Sens. 2023, 16, 7919–7931. [Google Scholar] [CrossRef] [Scilit]
- Hu, P.; Cheng, J.; Li, P.; Wang, Y. Automatic extraction of built-up areas in Chinese urban agglomerations based on the deep learning method using NTL data. Geocarto Int. 2023, 38, 2246939. [Google Scholar] [CrossRef] [Scilit]
- Xie, Z.; Yuan, M.; Zhang, F.; Chen, M.; Tian, M.; Sun, L.; Su, G.; Liu, R. A Structure Identification Method for Urban Agglomeration Based on Nighttime Light Data and Railway Data. Remote Sens. 2023, 15, 216. [Google Scholar]
- He, X.; Zhu, Y.; Chang, P.; Zhou, C. Using Tencent User Location Data to Modify Night-Time Light Data for Delineating Urban Agglomeration Boundaries. Front. Environ. Sci. 2022, 10, 860365. [Google Scholar] [CrossRef] [Scilit]
- Wu, Z.; Wei, X.; He, X.; Gao, W. Identifying Urban Built-Up Areas Based on Spatial Coupling between Nighttime Light Data and POI: A Case Study of Changchun. Buildings 2024, 14, 19. [Google Scholar]
- Duan, H.; Du, F.; Zhang, Y.; Jiang, X.; Chen, B. An urban-rural Fringe extraction method based on Combined Urban-rural Fringe Index (CUFI). Geocarto Int. 2024, 39, 2311211. [Google Scholar] [CrossRef] [Scilit]
- Dai, X.; Jin, J.; Chen, Q.; Fang, X. On Physical Urban Boundaries, Urban Sprawl, and Compactness Measurement: A Case Study of the Wen-Tai Region, China. Land 2022, 11, 1637. [Google Scholar] [CrossRef] [Scilit]
- Yu, B.; Shu, S.; Liu, H.; Song, W.; Wu, J.; Wang, L.; Chen, Z. Object-based spatial cluster analysis of urban landscape pattern using nighttime light satellite images: A case study of China. Int. J. Geogr. Inf. Sci. 2014, 28, 2328–2355. [Google Scholar] [CrossRef] [Scilit]
- Zhu, J.; Lang, Z.; Yang, J.; Wang, M.; Zheng, J.; Na, J. Integrating Spatial Heterogeneity to Identify the Urban Fringe Area Based on NPP/VIIRS Nighttime Light Data and Dual Spatial Clustering. Remote Sens. 2022, 14, 6126. [Google Scholar] [CrossRef] [Scilit]
- Ma, Q.; He, C.; Wu, J.; Liu, Z.; Zhang, Q.; Sun, Z. Quantifying spatiotemporal patterns of urban impervious surfaces in China: An improved assessment using nighttime light data. Landsc. Urban Plan. 2014, 130, 36–49. [Google Scholar] [CrossRef] [Scilit]
- Yu, B.; Tang, M.; Wu, Q.; Yang, C.; Deng, S.; Shi, K.; Peng, C.; Wu, J.; Chen, Z. Urban Built-Up Area Extraction From Log- Transformed NPP-VIIRS Nighttime Light Composite Data. IEEE Geosci. Remote Sens. Lett. 2018, 15, 1279–1283. [Google Scholar] [CrossRef] [Scilit]
- Sulla-Menashe, D.; Gray, J.M.; Abercrombie, S.P.; Friedl, M.A. Hierarchical mapping of annual global land cover 2001 to present: The MODIS Collection 6 Land Cover product. Remote Sens. Environ. 2019, 222, 183–194. [Google Scholar] [CrossRef] [Scilit]
- Huang, X.; Huang, J.; Wen, D.; Li, J. An updated MODIS global urban extent product (MGUP) from 2001 to 2018 based on an automated mapping approach. Int. J. Appl. Earth Obs. Geoinf. 2021, 95, 102255. [Google Scholar] [CrossRef] [Scilit]
- Bright, E.; Rose, A.; Urban, M. LandScan Global 2012, version 2012; Oak Ridge National Laboratory: Oak Ridge, TN, USA, 2013. [Google Scholar] [CrossRef] [PubMed]
- Rose, A.; McKee, J.; Sims, K.; Bright, E.; Reith, A.; Urban, M. LandScan Global 2020, version 2020; Oak Ridge National Laboratory: Oak Ridge, TN, USA, 2021. [Google Scholar] [CrossRef]
- Chen, Z.; Yu, B.; Yang, C.; Zhou, Y.; Yao, S.; Qian, X.; Wang, C.; Wu, B.; Wu, J. An extended time series (2000–2018) of global NPP-VIIRS-like nighttime light data from a cross-sensor calibration. Earth Syst. Sci. Data 2021, 13, 889–906. [Google Scholar] [CrossRef] [Scilit]
- Li, S.; Cao, X.; Zhao, C.; Jie, N.; Liu, L.; Chen, X.; Cui, X. Developing a Pixel-Scale Corrected Nighttime Light Dataset (PCNL, 1992–2021) Combining DMSP-OLS and NPP-VIIRS. Remote Sens. 2023, 15, 3925. [Google Scholar]
- Satopaa, V.; Albrecht, J.; Irwin, D.; Raghavan, B. Finding a “Kneedle” in a Haystack: Detecting Knee Points in System Behavior. In Proceedings of the 2011 31st International Conference on Distributed Computing Systems Workshops, Minneapolis, MN, USA, 20–24 June 2011; pp. 166–171. [Google Scholar]
- Onumanyi, A.J.; Molokomme, D.N.; Isaac, S.J.; Abu-Mahfouz, A.M. AutoElbow: An Automatic Elbow Detection Method for Estimating the Number of Clusters in a Dataset. Appl. Sci. 2022, 12, 7515. [Google Scholar] [CrossRef] [Scilit]
- Ali, I.; Rehman, A.U.; Khan, D.M.; Khan, Z.; Shafiq, M.; Choi, J.-G. Model Selection Using K-Means Clustering Algorithm for the Symmetrical Segmentation of Remote Sensing Datasets. Symmetry 2022, 14, 1149. [Google Scholar] [CrossRef] [Scilit]
- Shi, K.; Wu, Y.; Liu, S.; Chen, Z.; Huang, C.; Cui, Y. Mapping and evaluating global urban entities (2000–2020): A novel perspective to delineate urban entities based on consistent nighttime light data. GIScience Remote Sens. 2023, 60, 2161199. [Google Scholar] [CrossRef] [Scilit]
- Henderson, J.V.; Nigmatulina, D.; Kriticos, S. Measuring urban economic density. J. Urban Econ. 2021, 125, 103188. [Google Scholar] [CrossRef] [Scilit]

Disclaimer/Publisher’s Note: The statements, opinions and data contained in all publications are solely those of the individual author(s) and contributor(s) and not of MDPI and/or the editor(s). MDPI and/or the editor(s) disclaim responsibility for any injury to people or property resulting from any ideas, methods, instructions or products referred to in the content. |
© 2026 by the authors. Licensee MDPI, Basel, Switzerland. This article is an open access article distributed under the terms and conditions of the Creative Commons Attribution (CC BY) license.