Article

Portable Side-Scan Sonar System for Acoustic Remote Sensing of Ultra-Shallow Seafloor: Design and Field Validation


by
Artur Grządziel
1,* and
Filip Grządziel
2
1
Department of Navigation and Marine Hydrography, Faculty of Navigation and Naval Weapon, Polish Naval Academy, 81-127 Gdynia, Poland
2
Faculty of Architecture (Spatial Development), Gdansk University of Technology, Narutowicza 11/12, 80-233 Gdansk, Poland
*
Author to whom correspondence should be addressed.
Remote Sens. 2026, 18(13), 2113; https://doi.org/10.3390/rs18132113
Submission received: 23 April 2026 / Revised: 17 June 2026 / Accepted: 25 June 2026 / Published: 1 July 2026

Highlights

What are the main findings?
  • A compact inflatable-boat-based platform enables high-resolution side-scan sonar mapping in ultra-shallow and confined inland and coastal waters.
  • Rigid pole-mounted SSS configuration allows reliable detection of small (<0.5 m3), point, linear, and low-reflectivity seabed objects including artificial targets, fish and anthropogenic debris.
What are the implications of the main findings?
  • The proposed system provides a low-cost, highly mobile alternative to traditional towed sonar setups for rapid hydrographic surveys in ports, lakes, and restricted areas, reducing dependence on large vessels and divers for routine seabed inspection.
  • Under the tested survey configuration, the highest target detectability was observed at intermediate slant-range coverage (0.3–0.6 R), indicating a potential guideline for survey planning that requires further validation.

Abstract

Ultra-shallow and confined water environments are challenging to survey with conventional towed side-scan sonar (SSS) due to limited access and positioning uncertainties. This study introduces a portable, battery-powered acoustic survey system that integrates a pole-mounted dual-frequency side-scan sonar (600/1600 kHz) with RTK GNSS (Real-Time Kinematic Global Navigation Satellite System), deployable from a small inflatable boat. The system was validated in two settings: an inland lake and a marina. Field trials demonstrated reliable acquisition of high-resolution sonar imagery and effective detection of both natural and anthropogenic seabed features, including small and low-reflectivity objects. The high-frequency channel (1600 kHz) produced superior image quality and interpretability compared to the lower frequency. While there are limitations associated with fixed sonar mounting and limited altitude control, the system offers high mobility, rapid deployment, and operational safety. This approach represents a practical, cost-effective solution for high-resolution acoustic remote sensing in ultra-shallow water settings where traditional survey methods are ineffective or impractical.

1. Introduction

Side-scan sonar is commonly used to collect acoustic images of the seafloor and underwater objects, which are used in many fields of science, in various underwater scenarios, both in deep and ultra-shallow waters, offshore and inland [1]. SSS can be considered in two categories: recreational (consumer grade) and professional (survey grade) [2]. As a hydroacoustic device, SSS is utilized to detect and determine the position of underwater objects using acoustic waves. Sonar measurement involves generating an acoustic wave and receiving an echo reflected back. The signal transmitted by the transducers and the received echo are directed perpendicular to the vessel’s track.
Today, side-scan sonar is widely employed for marine and ocean exploration. This tool is indispensable for monitoring the ecological status of the marine environment. Acoustic images derived from side-scan sonar systems can be invaluable in detecting debris and other underwater obstructions on the seabed that pose a hazard to navigation [3]. Side-scan sonars are also used to find and locate marine debris from commercial or recreational fishing activities. Discarded, abandoned, or otherwise lost fishing gear is typical marine debris that significantly impacts benthic ecosystems [4]. The instrument plays an important role in fisheries research, dredging, and oceanographic surveys [5].
SSS technique is successfully applied for examining the condition of pipelines, cables and underwater marine structures [6,7]. It is crucial in operations of searching for and localizing of mines and mine-like objects (MLO) [8], as well as other objects of military origin. It is difficult to overestimate the importance of sonar in the detection of submerged human bodies [9,10,11], geological surveying [12], and searching for and identification of shipwrecks and aircraft wrecks [13,14,15]. Additionally, SSS is designed for bottom sediment classification [16,17] as well as seabed identification [18]. It is also worth mentioning that this survey technology has served marine archaeological research [19,20] for many years. Technology enables the exploration of underwater archaeological sites that were previously inaccessible, and its non-invasive nature allows the preservation of artifacts and landscapes, which is crucial for the conservation of historic locations.
Most side-scan systems are designed to operate in continental shelf areas at depths up to 250 m [21]. These are mounted on remotely operated vehicles (ROVs) or autonomous underwater vehicles (AUVs) [22], but the vast majority of SSSs are installed on a vessel or towed close to the seabed from the survey ship [23]. The side-scan sonar can be towed from the vessel’s deck from the bow, off either side or directly from the stern. Linear SSS transducers are usually mounted in a streamlined housing dragged by a towing line behind the research vessel [24,25]. The technique adopted depends largely on the environmental conditions and the aim of the survey [26,27]. In general, towfish height above the bottom is governed by the effective range as well as seafloor topography [28]. The sonar’s towing altitude is strictly defined and should be approximately between 8 and 20% of the range scale in use [29,30,31]. Towfish depth is controlled by varying the vessel speed or tow cable length adjustment. The proximity of the SSS to the bottom allows the use of higher frequencies, guaranteeing better resolution, but at shorter operational ranges.
When surveying in deep waters, the best method of using sonar is to tow it from the stern of the vessel using an electric winch and a special A-frame fitted with a pulley. Side-scan sonar operations in ultra-shallow waters (typically less than 30 m deep), ports, marinas, or inland reservoirs are demanding undertakings. Water bodies of this type pose the greatest challenge in terms of efficiency as well as high-resolution seabed mapping [32]. The survey team assigned to such tasks should select the most effective method for carrying out such a mission. Operations should be carefully planned and effectively executed. The difficulty of using scientific survey equipment in ultra-shallow waters and ports stems primarily from the accessibility of such waters, which are limited in both area and depth, yet are highly trafficked. Therefore, there is a need to optimize both the technique and methodology for searching and locating underwater objects lying on the bottom of such reservoirs.
The development of various types of survey vehicles in recent decades has resulted in a vast variation of platforms and sensors capable of performing hydrographic measurements from the air, on the water surface, and underwater. These watercraft can conduct hydrographic surveys autonomously or with human intervention [33]. The standard classification of survey watercraft includes criteria such as medium, degree of autonomy, environment, size, or specialized sensors. Numerous hydrographic offices, training centers, and institutions providing hydrographic survey services are increasingly using unmanned and autonomous watercraft capable of conducting systematic surveys of the seafloor and inland reservoirs [34]. The usage of unmanned systems is now common in areas such as hydrographic and oceanographic research [35,36], search and rescue operations [37] and renewable energy [38].
High-resolution sonar surveys on shallow shelves and inland water bodies are becoming increasingly essential for environmental management. Despite the widespread use of side-scan sonar in marine, offshore, and inland environments, there remain significant challenges in conducting high-resolution surveys in ultra-shallow waters and confined reservoirs [39]. Limited accessibility, complex seabed topography, and vessel maneuverability constraints can hinder effective data acquisition, while conventional sonar deployment methods are often impractical in such settings. The present study addresses these limitations by developing a portable, small-scale survey platform capable of performing accurate and efficient sonar mapping in challenging shallow-water environments. We hypothesize that this system can achieve reliable seabed imaging and object detection comparable to larger, conventional sonar setups while offering enhanced flexibility and ease of deployment.
The paper outline is as follows. Section 2 describes study sites and the design of the inflatable boat-based survey system with components and outlines the process of data acquisition and processing. Section 3 presents the compiled sonar mosaics from both waterbodies as well as the results of the sonar performance test survey. Section 4 addresses the potential applications of the proposed survey system, its main advantages and operational restrictions. Finally, Section 5 summarizes the key findings and suggests directions for future study.

2. Materials and Methods

2.1. Study Sites

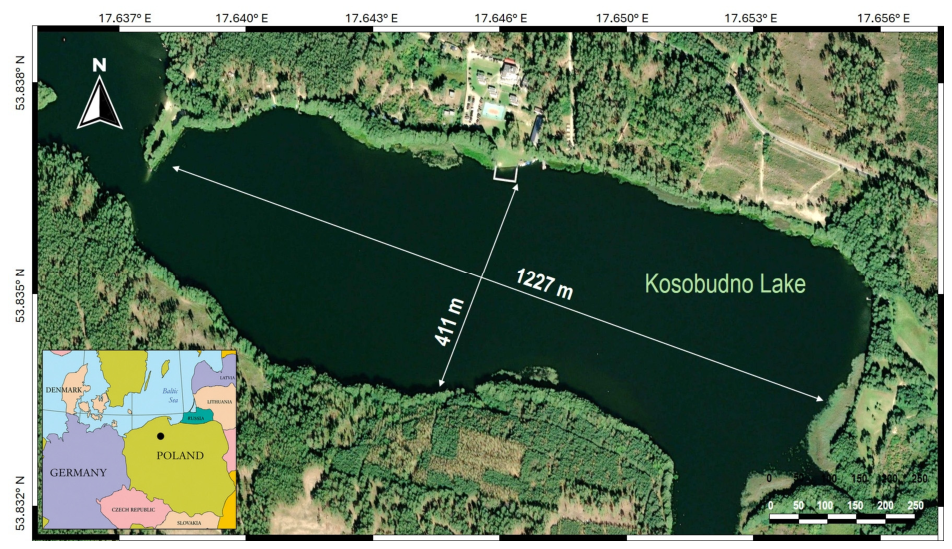
The first field tests using the side-scan sonar system were conducted in September 2025. Kosobudno Lake (Figure 1) was the test area, located in the Tuchola Forest, on the so-called Charzykowska Plain, in the village of Czernica, Pomeranian province.
Kosobudno Lake is a flow-through, ribbon lake with a surface area of approximately 58 hectares and an average depth of 5 m. The only deepest point is located in the western part of the lake, reaching a maximum depth of 8.2 m. The average length of the lake is over 1200 m and the average width is approximately 400 m. Based on the typical characteristics of postglacial lakes in the region, the bottom sediments are expected to consist predominantly of sands in shallow areas, with organic deposits and gyttja in deeper parts of the basin, and localized occurrences of fine-grained mud [40]. The lake is connected to Dybrzyk Lake by the Brda River and to Trzemeszno Lake by a narrow stream. Kosobudno features a poorly developed shoreline, and the lack of clearly defined narrowings means the reservoir forms a single body of water with a uniformly sloping bottom. An academic training center of the Naval Academy is located on the northern shore, while the southern shore is less accessible, with only forest roads leading to it.
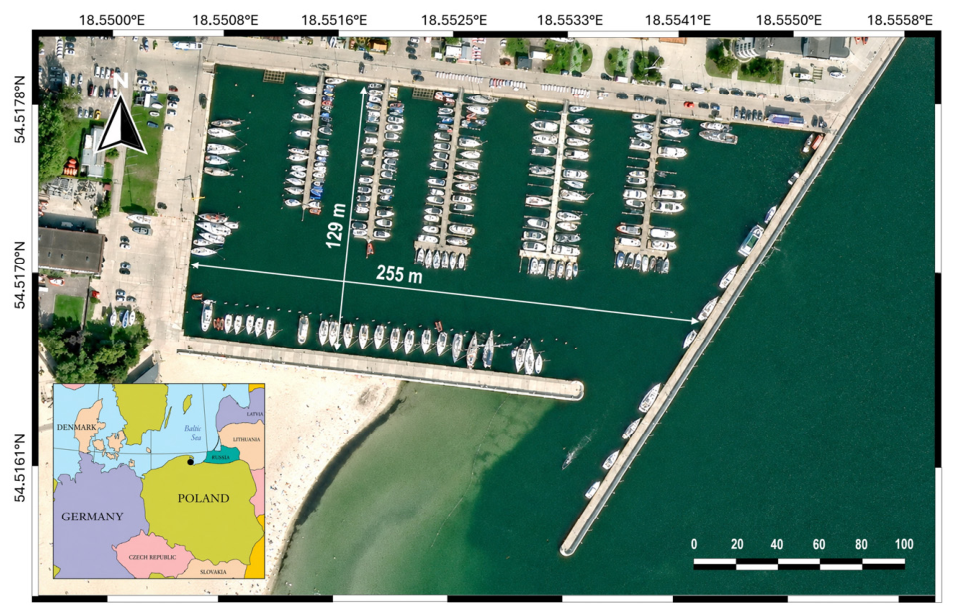
The second test site for the side-scan sonar survey system was Marina Gdynia (yacht marina) in Gdynia, Poland (Figure 2). This test site has a trapezoidal shape, with an average length of 255 m and an average width of 129 m, and is characterized by water depths ranging from approximately 3 to 6 m. The bottom sediments of Marina Gdynia are presumed to consist predominantly of fine-grained deposits characteristic of sheltered harbor environments, including silt and sandy silt with occasional layers of fine sand. The underlying geological strata are of glacial origin and comprise primarily sand and glacial tills [41].
The marina offers 260 berthing places with access to water and electricity. Currently, the marina primarily provides moorings at jetties with Y-booms. The western and southern quays are equipped with dolphins. The marina is currently accessed via a short fairway bounded on the west by three red buoys and on the east by a quay head with a permanent green light.
The constraints associated with ultra-shallow water surveys differed between the sites investigated. In Kosobudno Lake, the main limitations resulted from shallow depths (typically 3–8 m), the presence of submerged vegetation and woody debris, and the need to maintain safe sonar clearance above the bottom. In contrast, Marina Gdynia posed challenges related to restricted maneuvering space, dense mooring infrastructure, floating pontoons, quay walls, and intensive vessel traffic. These factors limited survey line geometry, reduced accessibility to some areas, and increased the risk of acoustic shadow zones and incomplete sonar coverage.

2.2. Design of the Inflatable Boat-Based Survey System

2.2.1. Selection of Survey Platform

To develop a portable system for high-resolution seafloor imaging, the decision was made to use a platform up to 4 m long, which would not only be equipped with a mapping system and power supply, but would also be capable of rapid and easy transport from point A to point B. Small survey platforms, under 10 m, make it easier to work in difficult conditions like shallow or confined waters. These watercraft are adaptable and portable and may even be transported on a trailer. For this purpose, an inflatable boat for fishing was selected. The length of the pontoon is 4 m and the width is 1.9 m (Table 1). The pontoon has an aluminum floor with stringers, making the deck hard, strong, and corrosion-resistant. Furthermore, it has a non-slip surface and a porous structure that increases hardness and reduces weight. The model is equipped with an inflatable keel that provides excellent stability and balance of the pontoon, easily regulating the direction of movement over the water. To minimize the impact of the research on the environment, the boat is powered by an electric outboard motor powered by a battery. This boat can carry up to six people, and it comes with oars for propelling the boat along in calm coastal waters. The inflatable boat is one of the most affordable options. One can pick up small recreational model for a 1000–1500 EUR. The boat is transported in a folded version, and after reaching the survey area, the air chambers are inflated using an electric pump. The inflatable boat is packed in two bags that can be easily stowed in the trunk of a car. This solution makes it an extremely mobile system for rapid response and hydrographic surveys.
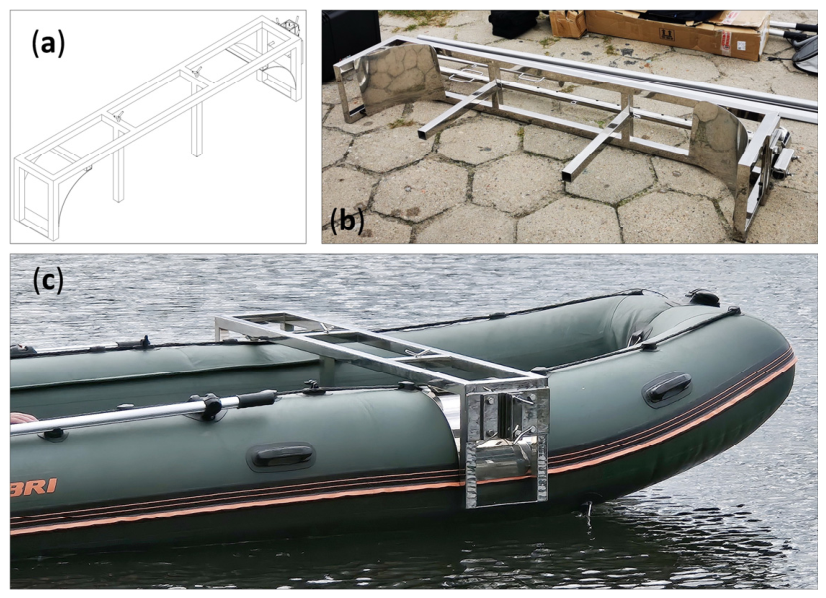
To adapt the inflatable boat for hydrographic surveying, a special stainless-steel bench was designed, mounted directly to the aluminum deck in the bow section of the platform (Figure 3). This structure served as a table for the SSS system’s laptop and a mounting point for the survey pole. The entire structure constituted a rigid and stable system ensuring safety and high-quality sonar data acquisition.

2.2.2. Components of Portable Hydroacoustic Survey System

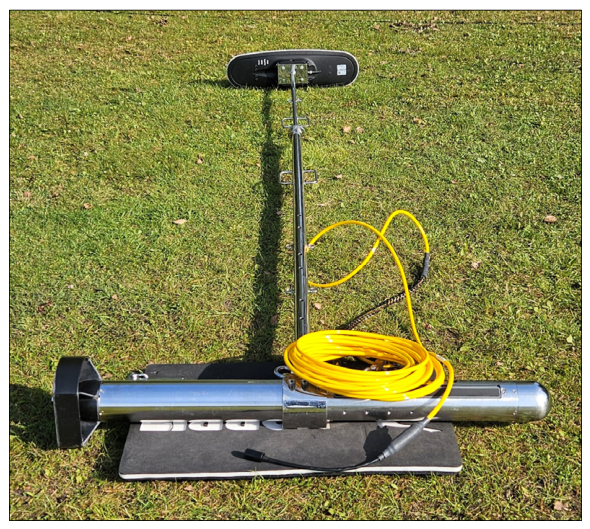
The key sensor of the survey system was the side-scan sonar, EdgeTech 4125i (EdgeTech, West Wareham, MA, USA), side-mounted using a special survey pole (Figure 4) attached to the steel deck bench on the starboard side. The pole was attached to the deck bench using a dedicated clamp-and-bolting system providing a stable mounting platform for both the side-scan sonar and GNSS antenna. Installation did not require any special tools since the connection is made with wing screws. Under normal operating conditions, the complete mounting procedure can be performed within a few minutes, while removal requires a comparable amount of time. Despite the rapid deployment and mobilization offered by the proposed configuration, immediate recovery of the sonar within a few seconds during survey operation was not possible.
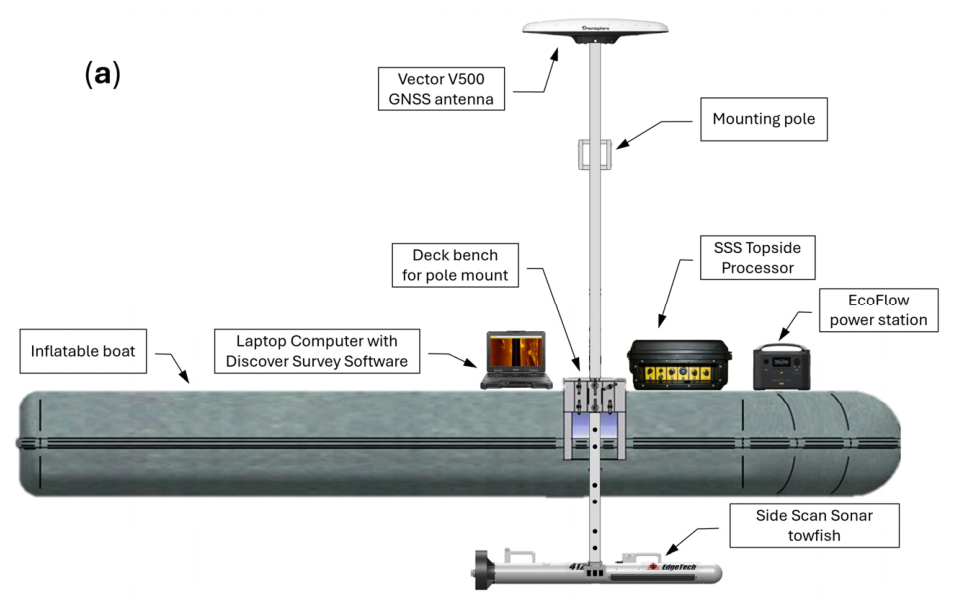
EdgeTech 4125i operates simultaneously on two acoustic signal frequencies: 600 kHz and 1600 kHz. The main components include the 4125i Towfish, a portable Topside Processor, a tow cable, and a user-provided laptop with EdgeTech’s Discover 4125i software installed [42]. The 4125i towfish is a lightweight and hydrodynamic sonar equipped with two transducers (port side and starboard side), a removable tail stabilizer, carrying handles, a tow arm, and a tow cable connector. The specifications of the EdgeTech 4125i side-scan sonar are presented in Table 2.
The Hemisphere Vector V500 receiver (Hemisphere GNSS Inc, Scottsdale, AZ, USA), equipped with two separate antennas with 50 cm baseline, was used to position the sonar measurements, providing heading accuracy of up to 0.2° RMS. The standard V500 model tracks GPS, GLONASS, Galileo, BeiDou, and QZSS satellites and provides heading, pitch, and roll readings [43]. The V500 was mounted on the top of a survey pole, parallel to the pontoon’s axis of symmetry. The GNSS receiver was interfaced with the topside laptop over an RS-232 serial port. To improve positioning quality, the V500 GNSS received RTK corrections via an NTRIP (Networked Transport of RTCM via Internet Protocol) service. ASG-EUPOS service was used to provide corrections over the Internet with access via mobile phone. The NTRIP network was developed by the German Federal Agency for Cartography and Geodesy in 2004 [44,45]. Specifications of the GNSS receiver are presented in Table 3.
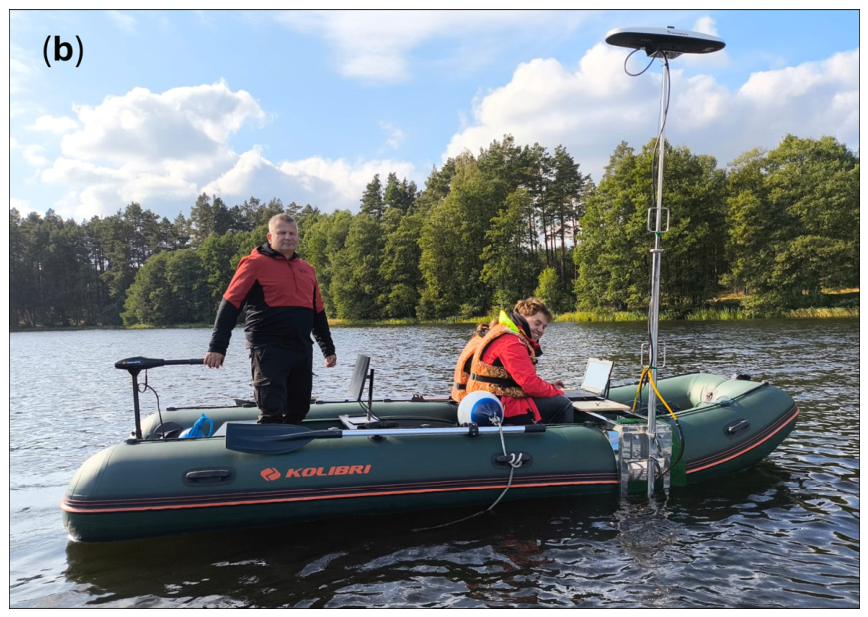
Power for the entire survey system was supplied by the EcoFlow RIVER 2 Pro portable power station, whose 768 Wh lithium-ion battery met the energy needs during the survey in the most environmentally friendly way possible. The station provides fast charging in approximately 70 min. Its portable design makes it easy to carry, and the EcoFlow application allows for remote control [46]. The complete, portable side-scan sonar system together with the inflatable boat is shown in Figure 5.

2.3. Side-Scan Sonar Data Acquisition

Field tests of the newly constructed survey system were conducted in August and September 2025. To monitor and control the side-scan sonar system, Discover 4125i software developed by EdgeTech was used. Sonar data were recorded and stored in JSF format and transmitted to a Discover-enabled laptop via a wired 10/100 BaseT Ethernet connection. The sonar data were acquired simultaneously on two frequency channels, operating at 600 kHz and 1600 kHz. The side-scan sonar was rigidly mounted and positioned 1 m below the waterline. The speed at which measurements were taken averaged 2–3 knots. Weather conditions on both Kosobudno Lake and Marina Gdynia were very favorable, with essentially no wind or waves.
Survey line planning for Kosobudno Lake and Marina Gdynia was carried out using the Discover Coverage Mapper software (EdgeTech, version 2.8.0). Survey lines were designed to be evenly spaced and arranged in parallel with predefined line spacing. In the case of Marina Gdynia, survey lines were planned parallel to the quay walls and floating pontoons. For archiving detected objects and determining their geometric characteristics, the Target Logger application—also part of the Discover software suite—was used. This application is primarily intended for cataloguing underwater objects detected by side-scan sonar [47]. All detected objects selected for further analysis were automatically saved as separate files. Before data recording began, the speed of sound in the water column was measured. For this purpose, a NORBIT SV Profiler [48] was lowered from the side of the pontoon. The sensor communicates with software loaded on a laptop via Wi-Fi. The NORBIT SV Profiler instruments are equipped with on-board GPS and GLONASS functionality.
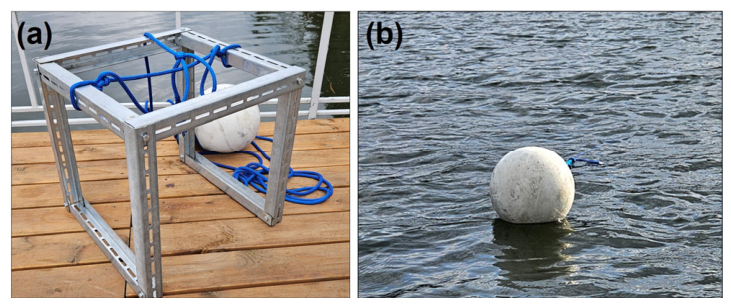
During the field test conducted on Kosobudno Lake, an artificial object of the size 0.5 m × 0.5 m × 0.5 m was placed on the lakebed to assess the detection capabilities of the proposed survey system. The object was marked with a surface-floating buoy to indicate its position (Figure 6). The aim of this part of the experiment was to evaluate the performance capabilities of the proposed survey system solution based on a side-scan sonar, taking into account different frequencies, ranges and distances from the object placed on the bottom.

2.4. Hydroacoustic Data Processing

SonarWiz 8 (version V.8.6.0, 64-bit) software, developed by Chesapeake Technology, Inc. (New York, NY, USA), was used for the visualization and processing of side-scan sonar data. The fish position was assumed to be identical to the vessel position. No positional offsets or cable layback corrections were applied, as the side-scan sonar system was rigidly mounted on a pole with a GNSS antenna installed at the top.
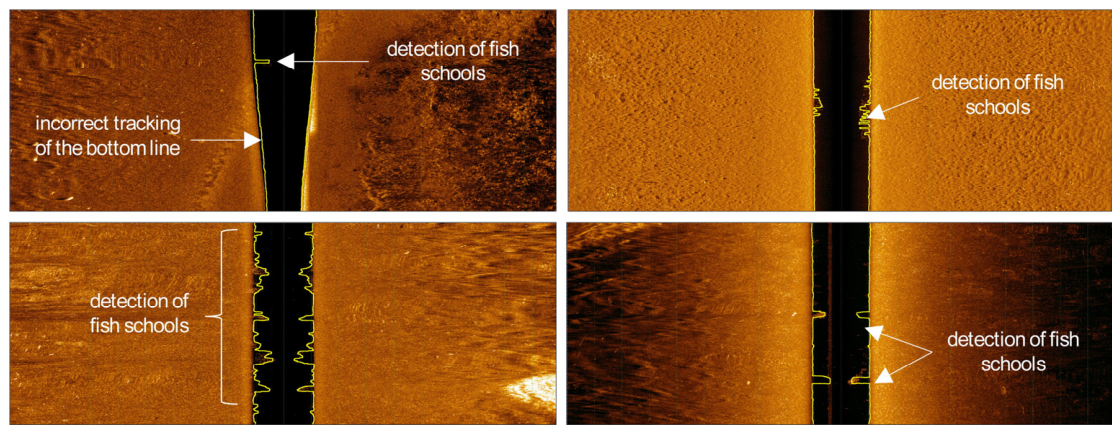
In the first processing step, the Course Smoothing and Interpolation operation was applied to individual survey lines. This procedure smoothed the raw navigation positions and interpolated the filtered navigation data onto the sonar pings, ensuring that each ping in the dataset was assigned a unique and smoothly progressing geographic position. Subsequently, all sonar data were subjected to bottom-tracking, which involved both automatic and manual detection of the seabed for each ping. In many cases, the automatic bottom-tracking algorithm did not perform satisfactorily (Figure 7). In such instances, the seabed tracking line was manually corrected. After accurate determination of the seabed line, Slant Range Correction (SRC) was applied to remove the water column and compensate for sonar altitude. Slant Range Correction is the simplest form of processing side-scan data [49,50]. The process of water column removal assumes the seabed is perfectly flat. The effect of SRC is to re-project the pixel from its apparent position to its actual position (in horizontal plane) by calculating the two-way travel time of the acoustic signal and return the towfish altitude. This correction ensured the proper spatial positioning of seabed features in the processed imagery.
Raw sonar data require gain adjustment to compensate for acoustic signal attenuation resulting from sound propagation and absorption in the water column. For this purpose, gain correction was applied in SonarWiz using Empirical Gain Normalization (EGN). EGN is a function that sums and averages sonar amplitudes across all pings within a set of sonar files. The resulting EGN table is then used to characterize sonar beam behavior through empirical analysis of millions of data samples. In addition, a Nadir Filter was applied. This filter operates exclusively along the nadir stripe and is designed to reduce the intensity contrast between nadir pixel values and those immediately off-nadir. The angular width of the filtered zone can be adjusted by the operator. The final stage of data processing involved exporting the sonar data as a sonar mosaic, resulting in composite mosaic maps of the survey area.

3. Results

3.1. Survey Results on Lake Kosobudno

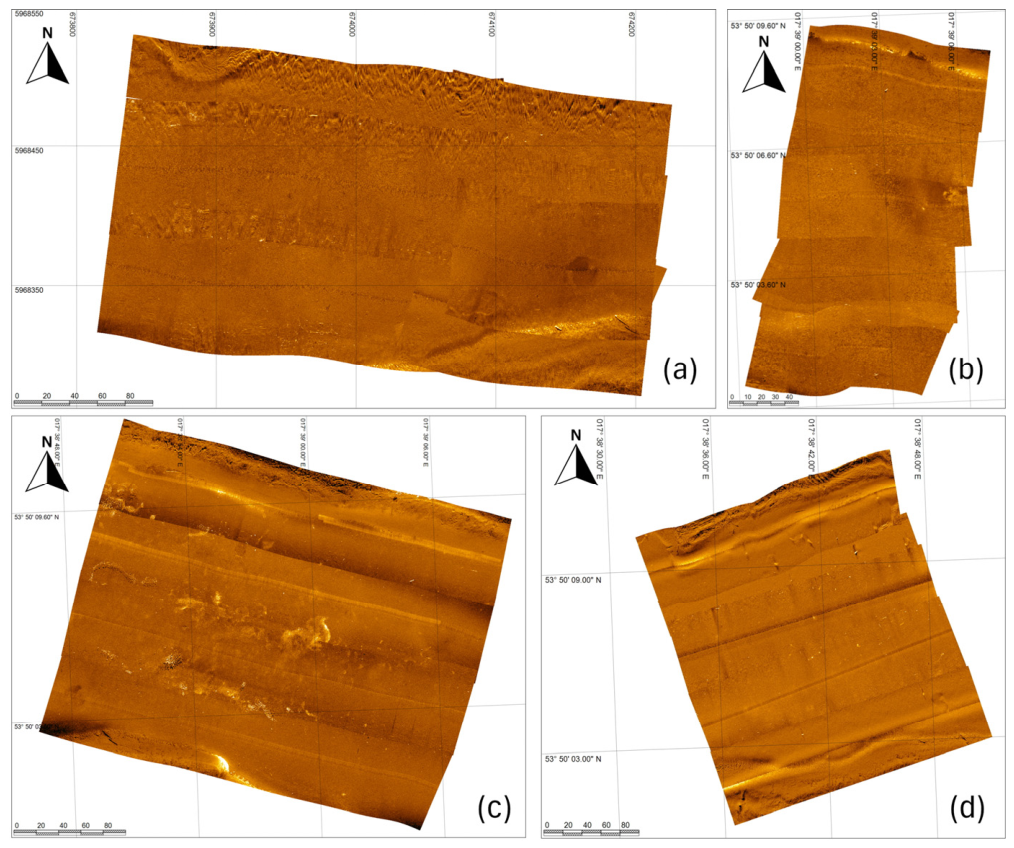
As a result of the survey work undertaken on Kosobudno Lake, sonar data were recorded and processed using SonarWiz software. Four sonar mosaics from four different sections of Kosobudno Lake were developed (Figure 8). The process of creating and exporting acoustic maps of the seabed involves combining individual side-scan traces from different passes into one complete image, considering geographical positions.
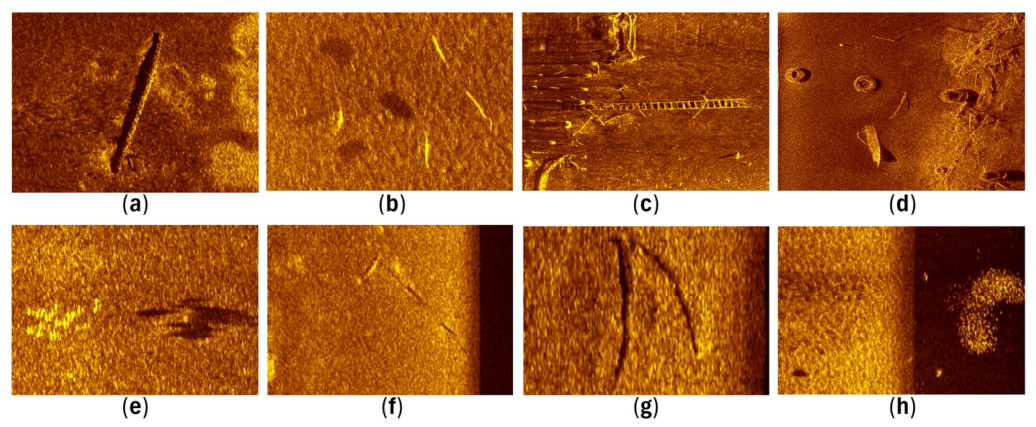
The bottom of Kosobudno Lake is relatively flat, sandy, and devoid of interesting bottom features. Despite this, several sonograms were recorded during research conducted using a battery-powered, inflatable boat, depicting both natural and anthropogenic objects. The sonar used in the tests demonstrated good detection properties. It was capable of detecting schools of fish and even individual fish measuring several centimeters in length. Some were located right at the bottom (Figure 9b,e), while others were in the water column close to the transducer (Figure 9h). The sonar was capable of detecting and imaging narrow linear objects (Figure 9a,f,g), single car tires (Figure 9d), and anthropogenic objects such as a ladder (Figure 9c).

3.2. Survey Results at Marina Gdynia

Research at Marina Gdynia required safe maneuvering of a battery-powered, inflatable boat due to the heavy traffic of small vessels, as well as moored yachts and motorboats. A marina is a unique body of water compared to the open waters of a lake. It is bounded by quays, breakwaters, and floating jetties. Therefore, it is difficult to access every corner of the marina and cover it with sonar data. Such sensitive sites, which were not covered by sonar beams, include the corners of the quays.
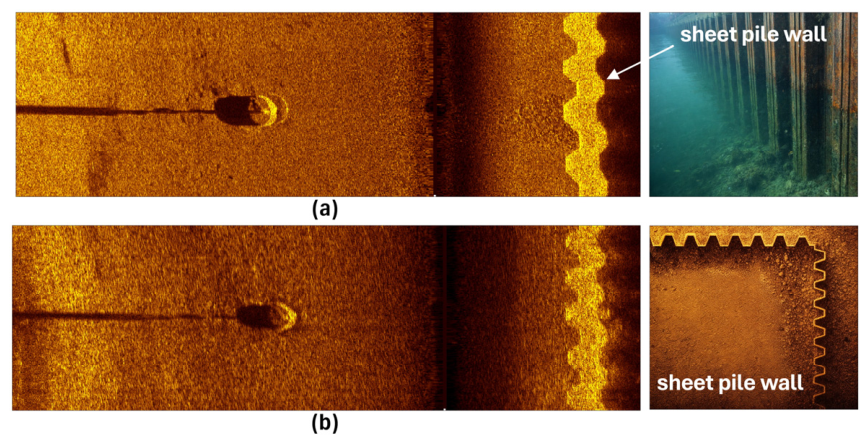
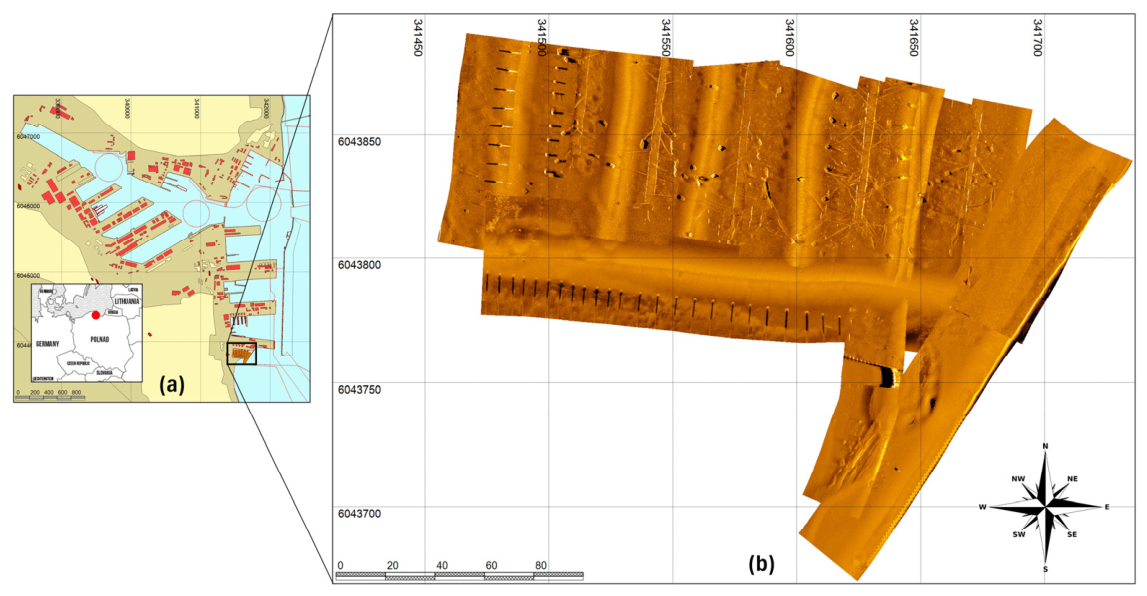
Sonar data were recorded at several passes with side-scan sonar rigidly mounted to the pontoon. A bottom mosaic was created using SonarWiz software (Figure 10). The mosaic presents the bottom surface with several concrete anchors, which, using chains, stabilize the floating jetties where yachts and motorboats are moored. Also noteworthy are the clearly visible echoes from the mooring dolphins, which cast long, sharp acoustic shadows. The dual-frequency capability of the 4125i SSS model enabled direct comparison between the two simultaneously acquired frequency channels in terms of data quality and spatial resolution.
The sonogram in Figure 11a is characterized by a more pronounced contrast between the object and the background and has a more uniform, less grainy acoustic background. The acoustic shadow cast by the anchor and chain behind the object is continuous and well defined. The contour of the sheet pile wall is clear and sharp. Fine-grained structures in the bottom are more legible. The sonogram (Figure 11b) has more speckle noise, lower contrast between the object and the background, and a blurrier image. The sheet pile wall is darker and not as sharp as in Figure 11a. All these features make the sonogram in Figure 11a of better quality and significantly easier to interpret. Their resolution and quality are largely due to the high frequency of the acoustic signal (f2 = 1600 kHz).

3.3. Results of the Sonar Performance Test

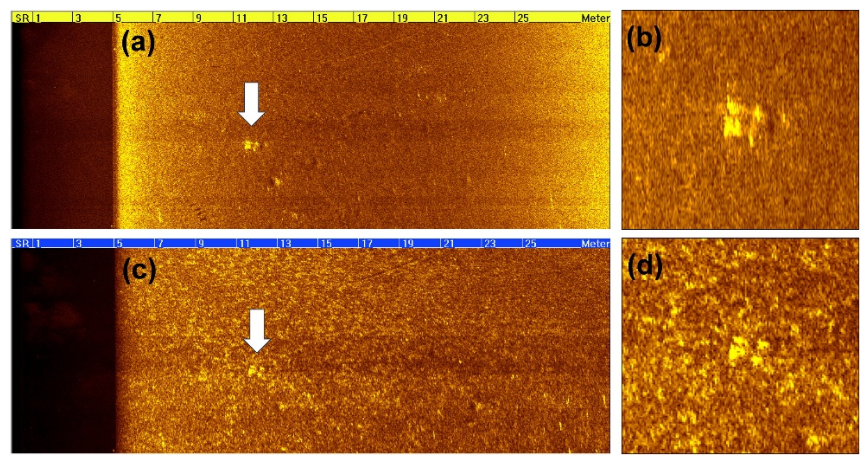
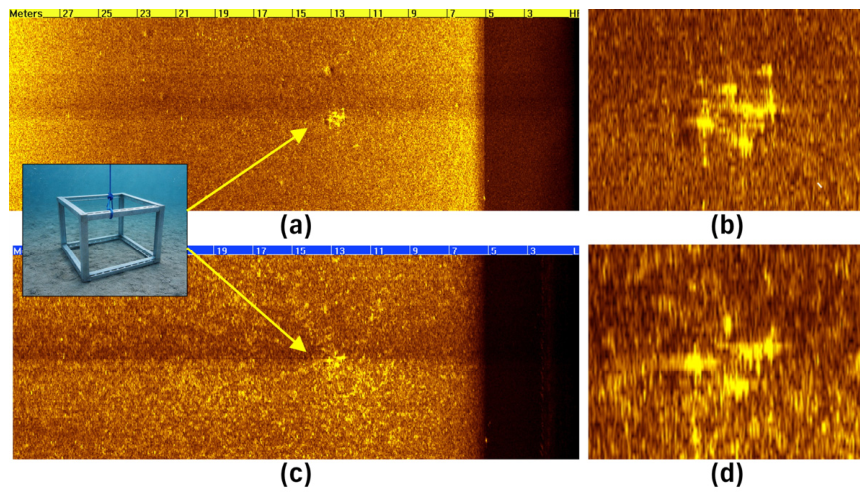
The sonar performance test was conducted on Kosobudno Lake. Several passes were made at different distances from the buoy to evaluate the sonar’s detection capabilities. Figure 12 illustrates the test object at two different frequencies. Comparing the two images in Figure 12b with Figure 12d shows the differences. The object is clearly visible in the sonar image recorded at the higher frequency of 1600 kHz. The operator can even measure the object, which was detected at a lateral distance of 11.6 m within the sonar’s operating range of R = 30 m. The sonar’s height at the time of detection was Fh = 5.1 m (Fish Height).
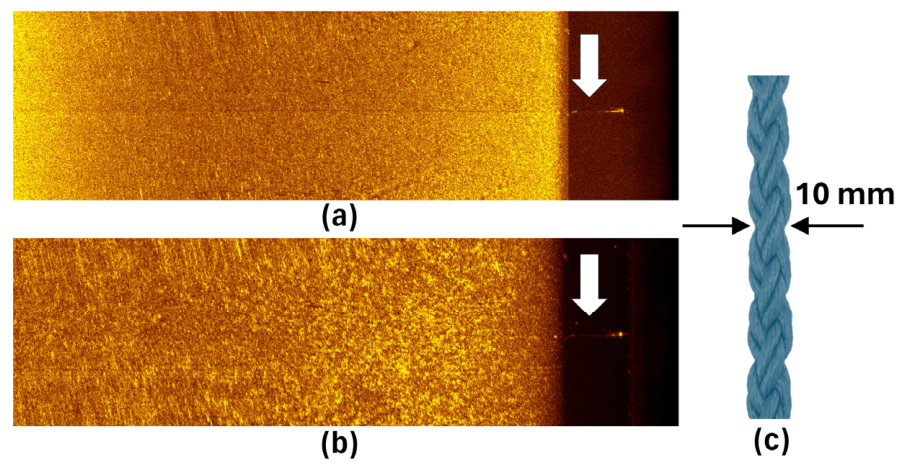
The side-scan sonar, rigidly mounted on the starboard side of the inflatable boat, was not only capable of detecting and visualizing an object on the bottom. The sonar also detected and imaged the echo coming from a very thin line (1 cm diameter) that connected the object to a buoy on the surface (Figure 13). It is also worth emphasizing that the object constructed for testing purposes had no side walls, only aluminum profiles joined at the corners. Detecting such an object is extremely difficult due to the reduced effective signal reflection surface.
During the next pass near the submerged object, at a lateral distance of R = 10.7 m, the object was detected again and recorded in the high and low frequency channels. The sonar height at the time of detection was FH = 5.2 m (Figure 14).
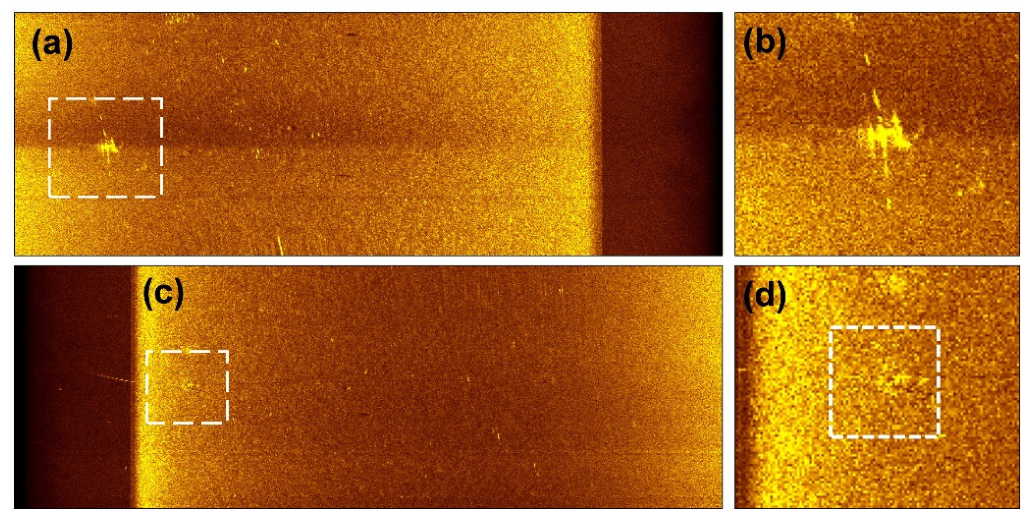
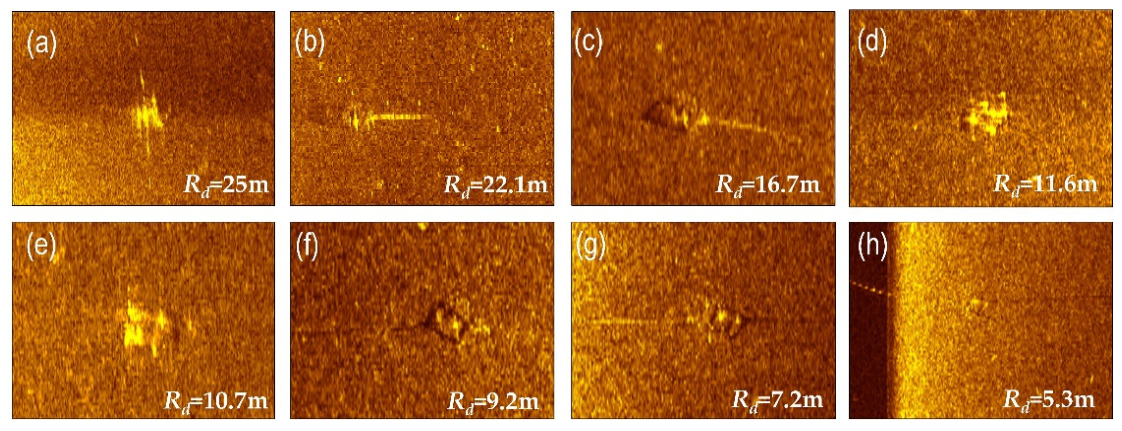
As the lateral distance from the buoy was increased, the echo from the object was still present in the sonogram, but it was less sharp, slightly distorted, and more blurred (Figure 15b). Figure 15a shows the echo recorded at a lateral distance of Rd = 25 m. When the boat passed at distances of 5–10 m, the system either no longer detected the object on the bottom or the echo was faint, indistinct, and difficult to clearly identify on the sonar image (Figure 15c,d).
By analyzing all sonar tracks near the underwater object, one can observe differences in the quality and effectiveness of sonar echo visualization. Initial conclusions can be drawn, for example, regarding the planning of survey works using side-scan sonar. If the underwater object’s position is known and the primary goal is to collect qualitative data and verify the object, the hydrographer faces the dilemma of optimally selecting the sonar operating range and distances of survey lines from the object being examined. In tests conducted on Kosobudno Lake, the clearest, and therefore qualitatively best, images of the object were obtained at distances of 0.3R–0.6R (Figure 16). The estimated values mentioned above should be verified for different sonar operating ranges and SSS heights above the bottom.

4. Discussion

The survey system, based on an inflatable boat, recorded hydroacoustic data over two water bodies: Kosobudno Lake and Marina Gdynia. The data were processed, and composite sonar images of the surveyed areas (mosaics) were ultimately generated. Experimental results demonstrate that the proposed survey system is capable of both large-scale sonar operations and the detection of point, linear and surface objects. It should be remembered, however, that survey line planning constitutes a key component that determines the efficiency and success of target search and detection [51]. Several years ago, one of the alternatives to inspecting underwater infrastructure or monitoring the bottom clearances with side-scan sonar was the use of divers. The rapid development of sonar technology allows an hydrographer to directly observe bottom objects using a small SSS mounted on highly portable craft [52,53,54]. In very shallow water bodies, SSS works more efficiently and safely than a diver. Underwater searches usually require well-trained and equipped divers, but they are deedless in extremely difficult conditions with limited underwater visibility.
Flemming believes [26] that in deep-water surveys, the side-scan sonar should be towed astern of the vessel. He also considers that in shallow waters, SSS can be towed from the port or starboard side, away from the propellers. However, towing a side-scan sonar from the vessel requires some caution, especially when turning or changing the survey line. The sonar can easily get caught under the vessel’s hull and be damaged by the propellers. Some researchers tested the effectiveness of using a side-scan sonar but mounted on the bow of a vessel [55]. The authors obtained satisfactory results, but in the tests they used a hydrographic cutter, not a battery-powered inflatable boat. Such a solution limits the mobility of the entire survey system to some extent, due to the weight of the cutter and the possibility of its easy transport and launching in difficult-to-access inland waters.
The designed survey system, based on side-scan sonar and an inflatable boat, offers several advantages. One of them is the accuracy of positioning. The GNSS antenna and the SSS transducer are mounted on a common vertical axis, reducing potential geometric offsets in the system configuration and simplifying operational procedures related to cable deployment. The survey system is exceptionally simple to mobilize and operate. There is no need for a 300–400 m cable, winch, or A-frame. This system architecture allows for relatively quick operational readiness. Another important feature is the safety of work in shallow water areas. The pole-mounted SSS system can reduce the likelihood of the sonar contacting or becoming entangled with the bottom during normal survey operations, particularly in shallow-water environments. It also facilitates maneuvering and navigating the water among numerous vessels and between quays, piers, and other port structures.
The survey results confirmed the validity and effectiveness of using a proposed boom-mounted side-scan sonar for shallow and ultra-shallow waters, enclosed and sheltered areas, harbors, and coastal areas. This configuration is crucial in ports where underwater infrastructure inspections and seabed clearance verification are performed. However, fixed setup of side-scan sonar is associated with some drawbacks. The disadvantage of rigidly mounted sonar systems is undoubtedly poorer image quality, primarily due to the sonar’s greater height above the bottom, shorter acoustic shadows, and a wider water column zone beneath the sonar (nadir zone). These factors can ultimately lead to reduced target detection and lower image resolution. The rigid mount is susceptible to longitudinal, lateral, and heave fluctuations, which are sources of various image artifacts. Fixed setups also result in a lack of operator control over the sonar’s height above the bottom and the inability to achieve optimal signal geometry (10% of set range). Unfortunately, during test surveys on the Kosobudno Lake where the depth was around 5–8 m, obtaining the optimal sonar height above the bottom was sometimes impossible. As navigational depth increases and the sonar’s distance from the bottom increases, detection resolution decreases, which restricts the capability of small-scale feature detection. Future studies should incorporate controlled targets and repeated observations to enable quantitative evaluation using metrics such as probability of detection, false alarm rate, and signal-to-noise ratio.
While an inflatable boat is a great choice for all types of hydrographic surveys on ultra-shallow reservoirs, it does have a few disadvantages that should be considered. These boats do not have a lot of deck space. Some models may have limited seating. Once you have mounted the survey equipment, laptops, power banks, and outboard motor, there is little space left. It is designed for short-term surveys. It does not have any overnight accommodation, unlike cabin yachts and cabin boats. The development of the proposed system required balancing portability, ease of deployment, positioning accuracy, and power autonomy. Particular attention was given to the integration of the side-scan sonar and RTK GNSS sensors and to ensuring reliable operation from a small inflatable survey platform under shallow-water conditions.
Inflatable boats are available in a wide range of lengths and widths. Hundreds of models are offered to meet the needs of every hydrographer and surveyor. This wide range and availability allow for the development of many different concepts for fast, portable hydrographic survey platforms. Water areas such as port basins or marinas, constructed with quays and floating piers, pose a challenge for sonar surveys. Corners where quays meet are a critical point in the survey area. Such areas should be additionally examined using other sonar techniques, such as stationary scanning sonar lowered to the bottom.

5. Conclusions

The study demonstrated that a fully battery-powered, inflatable boat-based side-scan sonar system constitutes an effective, flexible, and environmentally friendly solution for hydroacoustic surveys in ultra-shallow and confined water environments. Field experiments conducted on Kosobudno Lake and in Marina Gdynia confirmed that the proposed platform enables reliable acquisition of high-resolution sonar data, allowing for the detection and interpretation of both natural and anthropogenic seabed features, including small and low-reflectivity objects. Although the rigid mounting of the sonar limited the ability to maintain the optimal 10% altitude-to-range ratio and introduced certain constraints related to image quality and resolution, the system still achieved satisfactory performance, particularly at higher operating frequencies. The results highlight a trade-off between operational simplicity, mobility, and data quality, indicating that such systems are especially well suited for rapid-response surveys, environmental monitoring, and inspections in areas inaccessible to larger vessels or traditional towed configurations. Future research should focus on optimizing sensor mounting geometry, improving motion compensation, and validating performance across a wider range of depths and environmental conditions to further enhance the applicability and accuracy of portable hydrographic survey systems. The observed optimum target detectability within the 0.3–0.6R interval should be considered specific to the tested configuration and requires further validation under different sonar altitudes and operating ranges, including investigations involving targets with varying dimensions, geometries, and material properties. Although the present study focused on evaluating the operational capabilities of the proposed survey system, future work should also include sediment sampling and substrate classification to investigate the relationship between bottom type and acoustic image characteristics.

Author Contributions

Conceptualization, A.G. and F.G.; methodology, A.G.; validation, A.G.; formal analysis, A.G.; investigation, A.G. and F.G.; resources, F.G.; data curation, A.G.; writing—original draft preparation, A.G.; writing—review and editing, F.G.; visualization, F.G.; supervision, A.G.; project administration, A.G. and F.G.; funding acquisition, A.G. All authors have read and agreed to the published version of the manuscript.

Funding

This research received no external funding.

Data Availability Statement

The original contributions presented in this study are included in the article. Further inquiries can be directed to the corresponding author.

Conflicts of Interest

The authors declare no conflicts of interest.

Abbreviations

The following abbreviations are used in this manuscript:
SSSSide-Scan Sonar
RTK Real-Time Kinematic
GNSSGlobal Navigation Satellite System
MLOMine-Like Object
ROVRemotely Operated Vehicle
AUVAutonomous Underwater Vehicle
CHIRPCompressed High Intensity Radar Pulse
GPSGlobal Positioning System
GLONASSGlobal Orbiting Navigational Satellite System
QZSSQuasi-Zenith Satellite System
ASGAktywna Sieć Geodezyjna
EUPOSEuropean Position Determination System
NTRIPNetwork Transport of RTCM via Internet Protocol
RTCMRadio Technical Commission for Maritime Services
NMEANational Marine Electronics Association
JSFJava Sonar Format
SVSound Velocity
SRCSlant Range Correction
EGNEmpirical Gain Normalization
LFLow Frequency
HFHigh Frequency

References

  1. Burguera, A.; Oliver, G. High-Resolution Underwater Mapping Using Side-Scan Sonar. PLoS ONE 2016, 11, e0146396. [Google Scholar] [CrossRef] [PubMed]
  2. Fletcher, T.; Booth, M.T.; Pritt, J.J. A comparison of recreational and survey-grade side-scan sonar systems in mapping reservoir fish habitat. N. Am. J. Fish. Manag. 2024, 44, 1422–1438. [Google Scholar] [CrossRef]
  3. Blondel, P.; Murton, B.J. Handbook of Seafloor Sonar Imagery; John Wiley & Sons Publisher: Chichester, UK; Praxis Publishing: Chichester, UK, 1997; p. 314. ISBN 0-471-96217-1. [Google Scholar]
  4. Fulton, L.; McIntyre, J.; Duncan, K.; Smith, A.; Walker, T.R.; Brown, C.J. Evaluating the use of side scan sonar for improved detection and targeted retrieval of abandoned, lost, or otherwise discarded fishing gear. Cont. Shelf Res. 2023, 265, 105077. [Google Scholar] [CrossRef]
  5. Bryant, R. Side scan sonar for hydrography: An evaluation by the Canadian hydrographic service. Int. Hydrogr. Rev. 2015, 52, 43–56. [Google Scholar]
  6. Shi, B.; Cao, T.; Ge, Q.; Lin, Y.; Wang, Z. Sonar image intelligent processing in seabed pipeline detection: Review and application. Meas. Sci. Technol. 2024, 35, 045405. [Google Scholar] [CrossRef]
  7. Zhang, J.; Cui, X.; Li, J.; Jiang, B.; Li, L.; Dai, S. DBAC: A Novel Method for Grayscale Correction of Underwater Pipeline Images Using Side-Scan Sonar. IEEE Sens. J. 2025, 25, 19462–19476. [Google Scholar] [CrossRef]
  8. Le, H.T.; Phung, S.L.; Chapple, P.B.; Bouzerdoum, A.; Ritz, C.H.; Tran, L.C. Deep Gabor Neural Network for Automatic Detection of Mine-Like Objects in Sonar Imagery. IEEE Access 2020, 8, 94126–94139. [Google Scholar] [CrossRef]
  9. Nguyen, H.-T.; Lee, E.-H.; Lee, S. Study on the Classification Performance of Underwater Sonar Image Classification Based on Convolutional Neural Networks for Detecting a Submerged Human Body. Sensors 2020, 20, 94. [Google Scholar] [CrossRef] [PubMed]
  10. Healy, C.A.; Schultz, J.J.; Parker, K.; Lowers, B. Detecting submerged bodies: Controlled research using side-scan sonar to detect submerged proxy cadavers. J. Forensic Sci. 2015, 60, 743–752. [Google Scholar] [CrossRef] [PubMed]
  11. Schultz, J.J.; Healy, C.A.; Parker, K.; Lowers, B. Detecting submerged objects: The application of side scan sonar to forensic contexts. Forensic Sci. Int. 2013, 231, 306–316. [Google Scholar] [CrossRef] [PubMed]
  12. Bucci, G. Remote Sensing and Geo-Archaeological Data: Inland Water Studies for the Conservation of Underwater Cultural Heritage in the Ferrara District, Italy. Remote Sens. 2018, 10, 38. [Google Scholar] [CrossRef]
  13. Jiao, S.; Xu, F.; Guo, H. Side-Scan Sonar Image Detection of Shipwrecks Based on CSC-YOLO Algorithm. Comput. Mater. Contin. 2025, 82, 3019–3044. [Google Scholar] [CrossRef]
  14. Wei, C.; Bai, Y.; Liu, C.; Zhu, Y.; Wang, C.; Li, X. Unsupervised underwater shipwreck detection in side-scan sonar images based on domain-adaptive techniques. Sci. Rep. 2024, 14, 12687. [Google Scholar] [CrossRef] [PubMed]
  15. Yu, F.; Liu, X.; Liu, W.; Liu, J. Global-local coupled learning method for autonomous underwater vehicle side-scan sonar image recognition. Eng. Appl. Artif. Intell. 2025, 153, 110853. [Google Scholar] [CrossRef]
  16. Qin, X.; Luo, X.; Wu, Z.; Shang, J. Optimizing the Sediment Classification of Small Side-Scan Sonar Images Based on Deep Learning. IEEE Access 2021, 9, 29416–29428. [Google Scholar] [CrossRef]
  17. Anderson, J.T.; Van Holliday, D.; Kloser, R.; Reid, D.G.; Simard, Y. Acoustic seabed classification: Current practice and future directions. ICES J. Mar. Sci. 2008, 65, 1004–1011. [Google Scholar] [CrossRef]
  18. Lubis, M.J. Using Side Scan Sonar Instrument for Seabed Identification with Pattern Discrete Equi Spaced Unshaded Line Array (Pdesula) Model. J. Ocean. Mar. Res. 2017, 5, 163. [Google Scholar] [CrossRef]
  19. Klein, M. Side Scan Sonar. In International Handbook of Underwater Archaeology; Ruppé, C.V., Barstad, J.F., Eds.; The Springer Series in Underwater Archaeology; Springer: Boston, MA, USA, 2002. [Google Scholar] [CrossRef]
  20. Quinn, R. Acoustic Remote Sensing in Maritime Archaeology. In The Oxford Handbook of Maritime Archaeology, online ed.; Ford, B., Hamilton, D.L., Catsambis, A., Eds.; Oxford Academic: Oxford, UK, 2012. [Google Scholar] [CrossRef]
  21. Parkinson, R. High Resolution Site Surveys, 1st ed.; CRC Press: London, UK, 2000. [Google Scholar] [CrossRef]
  22. Wang, Q.; Wu, M.; Yu, F.; Feng, C.; Li, K.; Zhu, Y.; Rigall, E.; He, B. RT-Seg: A Real-Time Semantic Segmentation Network for Side-Scan Sonar Images. Sensors 2019, 19, 1985. [Google Scholar] [CrossRef] [PubMed]
  23. Ziomek, L.J. An Introduction to Sonar Systems Engineering, 2nd ed.; CRC Press: Boca Raton, FL, USA; Taylor & Francis Group: Boca Raton, FL, USA, 2022. [Google Scholar] [CrossRef]
  24. Blondel, P. Handbook of Sidescan Sonar; Praxis Publishing Ltd.: Chichester, UK, 2009; ISBN 978-3-540-49886-5. [Google Scholar]
  25. Fish, J.P.; Carr, H.A. Sound Reflection: Advanced Applications of Side Scan Sonar Data; Lower Cape Publishing: Orleans, MA, USA, 2001. [Google Scholar]
  26. Flemming, B.W. Side-Scan Sonar: A Practical Guide. Int. Hydrogr. Rev. 2015, 53, 65–92. Available online: https://journals.lib.unb.ca/index.php/ihr/article/view/23734 (accessed on 5 March 2026). [CrossRef]
  27. Klein, M.; Edgerton, H. Sonar—A modern technique for ocean exploitation. IEEE Spectr. 1968, 5, 40–46. [Google Scholar] [CrossRef]
  28. IHO C-13. Manual on Hydrography, 1st ed.; International Hydrographic Organization: Monte Carlo, Monaco, 2011. [Google Scholar]
  29. Ballard, R.D. (Ed.) Front Matter. In Archaeological Oceanography; Princeton University Press: Princeton, NJ, USA, 2008. [Google Scholar] [CrossRef]
  30. Grządziel, A. Side Scan Sonar—Method of searching for and detecting of underwater objects. Marit. Rev. 2006, 1, 48–63. (In Polish) [Google Scholar]
  31. NOAA, Office of Coast Survey. Hydrographic Survey Specifications and Deliverables; National Oceanic and Atmospheric Administration, Office of Coast Survey: Silver Spring, MD, USA, 2021; 154p. [Google Scholar] [CrossRef]
  32. Murawski, S.A.; Gilbert, S.; Hommeyer, M.; Liu, Y.; Lembke, C.; Grasty, S.; English, D.; Hu, C.; Dixon, T.; Sadeghi, C.T. Bathymetric Mapping in the Coastal Zone: Approaches, Challenges, and Opportunities. Mar. Technol. Soc. J. 2025, 59, 62–77. [Google Scholar] [CrossRef]
  33. Hydro International; Lekkerkerk, H.-J. Zooming in on the Range of Vehicles for Hydrographic Surveying. A Classification of Survey Platforms. Available online: https://www.hydro-international.com/content/article/a-classification-of-survey-platforms (accessed on 4 April 2026).
  34. Schmidt, V. Hydrographic survey with autonomous surface vessels: A best practices guide. In International Hydrographic Review; International Hydrographic Organization: City of Monaco, Monaco, 2020; Volume P-1(24), pp. 189–201, Publication P-1. [Google Scholar]
  35. Leder, N.; Leder, T.A. Unmanned vehicle systems in hydrographic survey—New opportunities and challenges. In Proceedings of the Conference: Unmanned Vehicle Systems in Hydrographic Survey—New Opportunities and Challenges, Portoroz, Slovenia, 14 June 2018. [Google Scholar]
  36. Specht, M. Methodology for Performing Bathymetric and Photogrammetric Measurements Using UAV and USV Vehicles in the Coastal Zone. Remote Sens. 2024, 16, 3328. [Google Scholar] [CrossRef]
  37. Khaled, D.; Aly, H.; Khaled, M.; Mahmoud, N. Development of a Sustainable Unmanned Surface Vehicle (USV) for Search and Rescue Operations. Int. Undergrad. Res. Conf. 2021, 5, 462–468. [Google Scholar]
  38. Marin, R.; Ciortan, S.; Rusu, E. A Novel Method Based on Artificial Neural Networks for Selecting the Most Appropriate Locations of the Offshore Wind Farms. Energy Rep. 2022, 8, 408–413. [Google Scholar] [CrossRef]
  39. Halmai, Á.; Gradwohl–Valkay, A.; Czigány, S.; Ficsor, J.; Liptay, Z.Á.; Kiss, K.; Lóczy, D.; Pirkhoffer, E. Applicability of a Recreational-Grade Interferometric Sonar for the Bathymetric Survey and Monitoring of the Drava River. ISPRS Int. J. Geo-Inf. 2020, 9, 149. [Google Scholar] [CrossRef]
  40. Barańczuk, J.; Borowiak, D. Atlas of the Zaborski Landscape Park Lakes. In Limnological Research; Department of Limnology, Gdansk University: Gdansk, Poland, 2010; Volume 6, ISBN 978-83-910381-9-2. [Google Scholar]
  41. Dworniczak, J.; Wróblewski, R.; Rudowski, S.; Sitkiewicz, P.; Bieszk, M. Bottom structure of selected basins in the Port of Gdynia. Bull. Marit. Inst. Gdańsk 2017, 32, 1–7. [Google Scholar] [CrossRef]
  42. EdgeTech. 4125i/4125 Side Scan Sonar System. User Hardware Manual. 0004823_REV_O. August 2025. West Wareham, Massachusetts, USA. Available online: https://www.edgetech.com/wp-content/uploads/2023/04/0004823_Rev_O.pdf (accessed on 7 April 2026).
  43. Hemisphere GNSS, Inc. Vector™ V500 GNSS Smart Antenna. Scottsdale, Arizona, USA. Available online: https://www.hemispheregnss.com/wp-content/uploads/875-0458-10_V500_DataSheet.pdf (accessed on 3 April 2026).
  44. Elsobeiey, M.E. Performance of Network Real-Time Kinematic in Hydrographic Surveying. J. Mar. Sci. Eng. 2025, 13, 61. [Google Scholar] [CrossRef]
  45. Koivula, H.; Kuokkanen, J.; Marila, S.; Lahtinen, S.; Mattila, T. Assessment of sparse GNSS network for network RTK. J. Geod. Sci. 2018, 8, 136–144. [Google Scholar] [CrossRef]
  46. EcoFlow RIVER 2 Pro Portable Power Station Quick Start Guide. Available online: https://cdn-files.innpro.pl/ecoflow/4895251601559/4895251601559_en.pdf (accessed on 9 April 2026).
  47. EdgeTech: Target Logger Software Module Addendum, 2018. Available online: https://www.edgetech.com/wp-content/uploads/2019/07/0018974_Rev_B.pdf (accessed on 11 March 2026).
  48. NORBIT Subsea. NORBIT SV Profiler: User Manual. SVP Logger Instrument; Technical Note TN-210096; NORBIT Subsea: Trondheim, Norway, 2021. [Google Scholar]
  49. Fish, J.P.; Carr, H.A. Sound Underwater Images—A Guide to the Generation and Interpretation of Side Scan Sonar Data, American Underwater Search and Survey; Lower Cape Publishing: Orleans, MA, USA, 1990; 188p. [Google Scholar]
  50. Huvenne, V.A.I.; Blondel, P.; Henriet, J.-P. Textural analyses of sidescan sonar imagery from two mound provinces in the Porcupine seabight. Mar. Geol. 2002, 189, 323–341. [Google Scholar] [CrossRef]
  51. Chen, E.; Guo, J. Real time map generation using sidescan sonar scanlines for unmanned underwater vehicles. Ocean Eng. 2014, 91, 252–262. [Google Scholar] [CrossRef]
  52. Wang, J.; Cao, J.; Lu, B.; He, B. Underwater Target Detection Project Equipment Application and Development Trend. China Water Transp. 2016, 11, 43–44. [Google Scholar]
  53. Greene, A.; Rahman, A.F.; Kline, R.; Rahman, M.S. Side scan sonar: A cost-efficient alternative method for measuring seagrass cover in shallow environments. Estuar. Coast. Shelf Sci. 2018, 207, 250–258. [Google Scholar] [CrossRef]
  54. Hurtós, N.; Palomeras, N.; Carrera, A.; Carreras, M. Autonomous detection, following and mapping of an underwater chain using sonar. Ocean Eng. 2017, 130, 336–350. [Google Scholar] [CrossRef]
  55. Wąż, M.; Felski, A.; Grządziel, A. Experience with the use of a rigidly-mounted side-scan sonar in a harbour basin bottom investigation. Ocean Eng. 2015, 109, 439–443. [Google Scholar] [CrossRef]
Figure 1. Kosobudno Lake study area, Tuchola Forest, Czernica, Poland.
Remotesensing 18 02113 g001
Figure 2. Marina Gdynia study area, Gdynia, Poland.
Remotesensing 18 02113 g002
Figure 3. Deck bench as a component of a portable survey system: (a) construction design; (b) bench ready for assembly; (c) bench mounted to the deck of the pontoon.
Remotesensing 18 02113 g003
Figure 4. Side-scan sonar and GNSS antenna attached to the survey pole.
Remotesensing 18 02113 g004
Figure 5. Design of a fully battery-powered, inflatable boat-based survey system: (a) system design and components; (b) survey boat during real measurements on the lake.
Remotesensing 18 02113 g005aRemotesensing 18 02113 g005b
Figure 6. Components used for testing purposes: (a) Appearance of the test artificial object (0.5 m × 0.5 m × 0.5 m); (b) Buoy marking the location of the object on the lake bottom.
Remotesensing 18 02113 g006
Figure 7. Examples of incorrect bottom tracking caused by schools of fish in the water column.
Remotesensing 18 02113 g007
Figure 8. Side-scan sonar mosaics as the final results of the field test survey using a fully battery-powered, inflatable boat-based survey system on Kosobudno Lake: (a) Survey test area with dimensions 390–200 m; (b) Survey test area with dimensions 130–250 m; (c) Survey test area with dimensions 330–280 m; (d) Survey test area with dimensions 320–270 m.
Remotesensing 18 02113 g008
Figure 9. Underwater objects detected with side-scan sonar during the field test survey on Kosobudno Lake: (a) Linear object, 5.63 m long and 0.16 m high, probably a fragment of a tree stand; (b) School of four fish, several dozen centimeters above the bottom; (c) Ladder, length 6 m; (d) Group of point objects, car tires; (e) A school of fish detected at a lateral distance of 25 m, visible sharp acoustic shadows; (f) A barely visible underwater linear object, approximately 8.78 m long; (g) Linear objects, length about 2 m; (h) A school of small fish detected in the water column a short distance from the transducer.
Remotesensing 18 02113 g009
Figure 10. Side-scan sonar mosaic of the seafloor of the Marina Gdynia, Poland: (a) Gdynia seaport plan; (b) Sonar mosaic.
Remotesensing 18 02113 g010
Figure 11. Sonograms with echoes from the concrete anchor of the buoy and echoes from the Larssen sheet piling: (a) Side-scan sonar imagery acquired with high frequency 1600 kHz; (b) Side-scan sonar imagery acquired with low frequency 600 kHz.
Remotesensing 18 02113 g011
Figure 12. Detection of an artificial test object at the bottom of Kosobudno Lake at a lateral distance 11.6 m: (a) Part of sonogram recorded on the high-frequency channel HF = 1600 kHz; (b) echo of the object in magnification; (c) Part of sonogram recorded on the low-frequency channel LF = 600 kHz; (d) echo of the object in magnification.
Remotesensing 18 02113 g012
Figure 13. Detection of a thin line connecting the buoy to an artificial object on the bottom: (a) sonar imagery of high-frequency channel 1600 kHz; (b) sonar imagery of low-frequency channel 600 kHz; (c) sailing rope of 1 cm diameter.
Remotesensing 18 02113 g013
Figure 14. Detection of an artificial test object at the bottom of Kosobudno Lake at a lateral distance 10.7 m: (a) Part of sonogram recorded on the high-frequency channel HF = 1600 kHz; (b) echo of the object in magnification; (c) Part of sonogram recorded on the low-frequency channel LF = 600 kHz; (d) echo of the object in magnification.
Remotesensing 18 02113 g014
Figure 15. Detection of an artificial test object at different ranges: (a) Detection of an artificial test object at the distance of Rd = 25 m; (b) echo of the object in magnification; (c) Detection of an artificial test object at the distance of Rd = 5.3 m; (d) echo of the object in magnification.
Remotesensing 18 02113 g015
Figure 16. Sonar images of the artificial object placed on the bottom, recorded at various lateral distances from the side-scan sonar: (a) echo of underwater object at Rd = 25 m; (b) echo of underwater object at Rd = 22.1 m; (c) echo of underwater object at Rd = 16.7 m; (d) echo of underwater object at Rd = 11.2 m; (e) echo of underwater object at Rd = 10.7 m; (f) echo of underwater object at Rd = 9.2 m; (g) echo of underwater object at Rd = 7.2 m; (h) echo of underwater object at Rd = 5.3 m.
Remotesensing 18 02113 g016
Table 1. Specifications of inflatable boat selected for SSS survey.
SpecificationsValue
Remotesensing 18 02113 i001
Overall length 400 cm
Overall width190 cm
Number of air chambers 4 + 1
Air chamber diameter49 cm
Weight88.6 kg
Load capacity 700–750 kg
Number of passengers5–6
Hull type: inflatable
Floorrigid aluminum
Tube material: 5-layer PVC, 1100 g/m2
Table 2. Specifications of sonar system EdgeTech 4125i.
SpecificationsValue
Remotesensing 18 02113 i002
Frequencies 600/1600 kHz
Pulse-type CHIRP
Operating range120 m (600 kHz); 35 m (1600 kHz)
Horizontal beam width 0.33° (600 kHz); 0.20° (1600 kHz)
Vertical beam width 50°
Transducer tilt angle Factory set at 33°, adjustable to 25°
Navigation interfaces RS-232, NMEA0183
Depth rating200 m
Size 114.8 cm long; 9.6 cm diameter
Weight in air 20.4 kg
Table 3. GNSS Receiver Specifications.
SpecificationsValue
Remotesensing 18 02113 i003
Receiver TypeVector GNSS RTK Receiver
Signals ReceivedGPS, GLONASS, BeiDou, Galileo, QZSS
Channels1059
Update Rate10 Hz standard, 20 Hz optional
Timing (1 PPS) Accuracy20 ns
Rate of Turn100°/s maximum
RTK Accuracy Position15 mm + 2 ppm
Heading Accuracy (RMS)0.27°
Pitch/Roll (RMS)
Heave (RMS)5 cm (RTK)
Baud Rates4800–115,200
Radio InterfacesBluetooth 2.0 (Class 2), Wi-Fi 2.4 GHz
ProtocolHemisphere GNSS proprietary ROX format, RTCM v2.3, RTCM v3.2, CMR, CMR+
Data I/O ProtocolNMEA 0183, Hemisphere GNSS binary
Input Voltage9–32 VDC
Weight3.7 kg
Disclaimer/Publisher’s Note: The statements, opinions and data contained in all publications are solely those of the individual author(s) and contributor(s) and not of MDPI and/or the editor(s). MDPI and/or the editor(s) disclaim responsibility for any injury to people or property resulting from any ideas, methods, instructions or products referred to in the content.