


Highlights
What are the main findings?
- ULS-derived forest structural metrics showed weak relationships with understory taxonomic and functional alpha diversity.
- Canopy openness and vertical heterogeneity emerged as significant predictors of understory beta diversity and community turnover
What are the implications of the main findings?
- ULS metrics are effective tools for assessing spatial variation in understory plant community composition.
- Forest stand structure can help reveal patterns of understory community turnover across successional stages
Abstract
Forest structural heterogeneity is widely recognized as a key driver of biodiversity, yet its effects on different components of understory diversity across spatial scales remain insufficiently understood, particularly when assessed using high-resolution remote sensing techniques. In this study, we examined the relationship between forest structure and understory plant diversity along secondary forest succession using high-density uncrewed laser scanning (ULS) data. We derived a suite of LiDAR-based structural metrics describing canopy height, vertical heterogeneity and canopy openness, and evaluated their association with both taxonomic and functional diversity at alpha- and beta-scales, through linear mixed models and distance-based redundancy analysis. Structural metrics showed a limited explanatory power for local (alpha) diversity, with generally weak relationships across taxonomic and functional indices. In contrast, forest structure consistently explained variation in beta diversity, with canopy openness and vertical heterogeneity emerging as the strongest predictors of community dissimilarity. These findings suggest that forest structure plays a greater role in shaping differences in species composition among stands than in determining within-stand diversity. Overall, our findings highlight the potential of ULS-derived structural metrics to capture spatial patterns of understory diversity, while underscoring the importance of accounting for multiple environmental drivers and scale-dependent processes.
1. Introduction
Forests are among the most biodiverse ecosystems on Earth, hosting an estimated 80% of the global terrestrial biodiversity [1]. Beyond their intrinsic conservation value, they regulate key ecological processes, including carbon (C) storage, nutrient cycling, hydrological regulation and climate buffering [2]. Consequently, monitoring and conserving forest biodiversity is essential not only for species preservation but also for maintaining ecosystem functioning and resilience in the face of ongoing global change [3,4,5].
In temperate forests, more than 80% of vascular plant diversity is typically concentrated in the understory, defined as the vegetation layer comprising all vascular plants below one meter in height [6]. Despite accounting for less than 1% of total forest biomass, understory vegetation plays a disproportionately important role at the ecosystem level. It contributes to carbon dynamics and energy flow and influences the cycling rates of essential nutrients [6,7,8]. Moreover, the understory constitutes a critical component of forest ecosystems by supporting higher trophic levels through the provision of food resources [9].
Given the role of the understory as an indicator of forest viability, health, and conservation status [10], understanding its dynamics and underlying drivers is essential for informing sustainable forest management and ensuring long-term ecosystem functioning. The composition and diversity of the understory are influenced by multiple factors, including edaphic and climatic conditions, topography and forest structural properties [6,11,12,13,14]. At the local scale, forest structure represents a key determinant of understory species distribution as it shapes microclimatic conditions such as air and soil temperature, humidity and wind regimes [15,16]. Consistent with the niche theory, biodiversity is expected to increase in more heterogeneous environments, where a wider range of habitat conditions allows species with different ecological requirements to coexist and more effectively exploit available niche space [17,18,19]. In turn, forest structure is itself shaped by a combination of factors, including management practices [20,21], disturbance regime [22,23], stand age and successional dynamics [24,25,26].
Most studies investigating understory biodiversity have traditionally focused on taxonomic diversity [27]. However, species richness captures only one facet of biodiversity. Over the past two decades, increasing attention has shifted toward the functional dimension of diversity [28], which provides deeper insights into ecosystem functioning and resilience, the provision of ecosystem services, and species’ responses to environmental gradients [29,30]. Functional diversity (FD) describes the range, distribution, and relative abundance of functional traits within a community. It is commonly quantified through three complementary components: (i) functional richness (FRic), representing the volume of trait space occupied by species; (ii) functional evenness (FEve), reflecting how evenly species abundances are distributed within that space; and (iii) functional divergence (FDiv), indicating the extent to which species abundances are concentrated toward the extremes of trait values [31]. Recent studies have shown that forest structural attributes influence not only taxonomic diversity but also the functional composition of plant communities [32]. At the understory level, functional diversity has been shown to respond to structural attributes, such as overstory canopy height and vertical complexity [33]. However, biodiversity responses to forest structure may differ across spatial scales. Beyond local (alpha) diversity, understanding how plant communities vary across space is essential for capturing broader biodiversity patterns. Variation in forest structure among stands may promote species and trait turnover, thereby contributing to patterns of beta diversity, providing key insights into the processes underlying community assembly along environmental gradients. Therefore, integrating beta with alpha diversity enables a more comprehensive assessment of how forest structure influences biodiversity across spatial scales [34,35].
Over recent decades, forest area in Europe has steadily expanded, largely driven by natural succession following widespread agricultural land abandonment [36]. This process of natural reforestation already affects tens of thousands of square kilometres across the continent [37] and is expected to continue in the coming decades as rural depopulation and agricultural decline persist [38,39]. As forests regenerate through succession, landscapes increasingly develop into mosaics of stands at different developmental stages. These successional gradients create a broad spectrum of forest structural conditions within relatively small spatial extents, offering a valuable framework for investigating how variation in forest structure shapes biodiversity patterns.
Quantifying forest structural variability has traditionally relied on field-based inventories, which are often time-consuming and typically capture only a limited subset of structural attributes [40]. In recent years, remote sensing technologies have increasingly complemented or replaced these approaches. Among them, Light Detection and Ranging (LiDAR) has emerged as one of the most effective tools for characterizing forest structure, as it provides detailed three-dimensional information on vegetation architecture [41,42]. LiDAR-derived structural metrics have been successfully used to explain patterns of taxonomic and functional beta diversity in forest ecosystems [35] and, when integrated with other remote sensing data, can improve predictions of plant biodiversity [43]. LiDAR sensors can be deployed on multiple platforms depending on the spatial and temporal scale of interest. Among these, aerial laser scanning (ALS) remains the most widely used approach, with nearly 95% of studies investigating species–habitat relationships relying on ALS-derived metrics [44]. While ALS enables rapid coverage of large areas, it is often associated with high operational costs, limited flexibility in data acquisition, and comparatively lower point densities compared to systems operating closer or within the canopy [45,46]. Uncrewed aerial laser scanning (ULS) represents a cost-effective alternative that provides very-high-spatial-resolution data [40,47]. Despite its potential, its application in biodiversity research remains limited. A recent review by Feigl et al. [40] identified only seven studies using ULS to characterize forest structure in biodiversity assessments; among these, just three focused on plant communities, and none explicitly addressed understory vegetation. Moreover, none of the reviewed studies evaluated understory biodiversity from a functional perspective.
Bearing in mind these considerations, this paper aims to improve our understanding of the relationships between understory alpha and beta diversity and forest structure. To this end, we used high-density ULS point clouds to derive detailed metrics of vertical and horizontal forest structure and tested whether these attributes are associated with variation in understory taxonomic and functional diversity at both local (alpha) and between-community (beta) scales.
Based on the heterogeneity–diversity hypothesis and previous empirical evidence, we hypothesize that greater forest structural complexity is associated with higher understory plant diversity through increased niche availability and environmental heterogeneity. Specifically, we expect forest structure to be associated with both taxonomic [13,48,49,50,51] and functional alpha diversity [12,28,33,51,52]. We further hypothesize that variation in forest structure among stands is linked to both taxonomic and functional beta diversity, as environmental and structural heterogeneity are known to drive compositional and functional dissimilarity across forest stands [33,34,35]. To test these hypotheses, we selected sites along a secondary succession gradient in order to maximize stand structural diversity, as forest structure is known to vary along succession [26].
2. Materials and Methods
2.1. Study Area
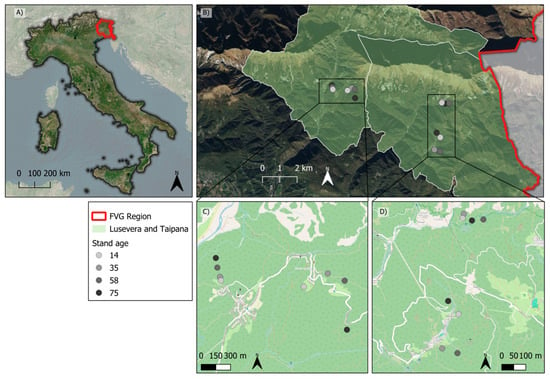
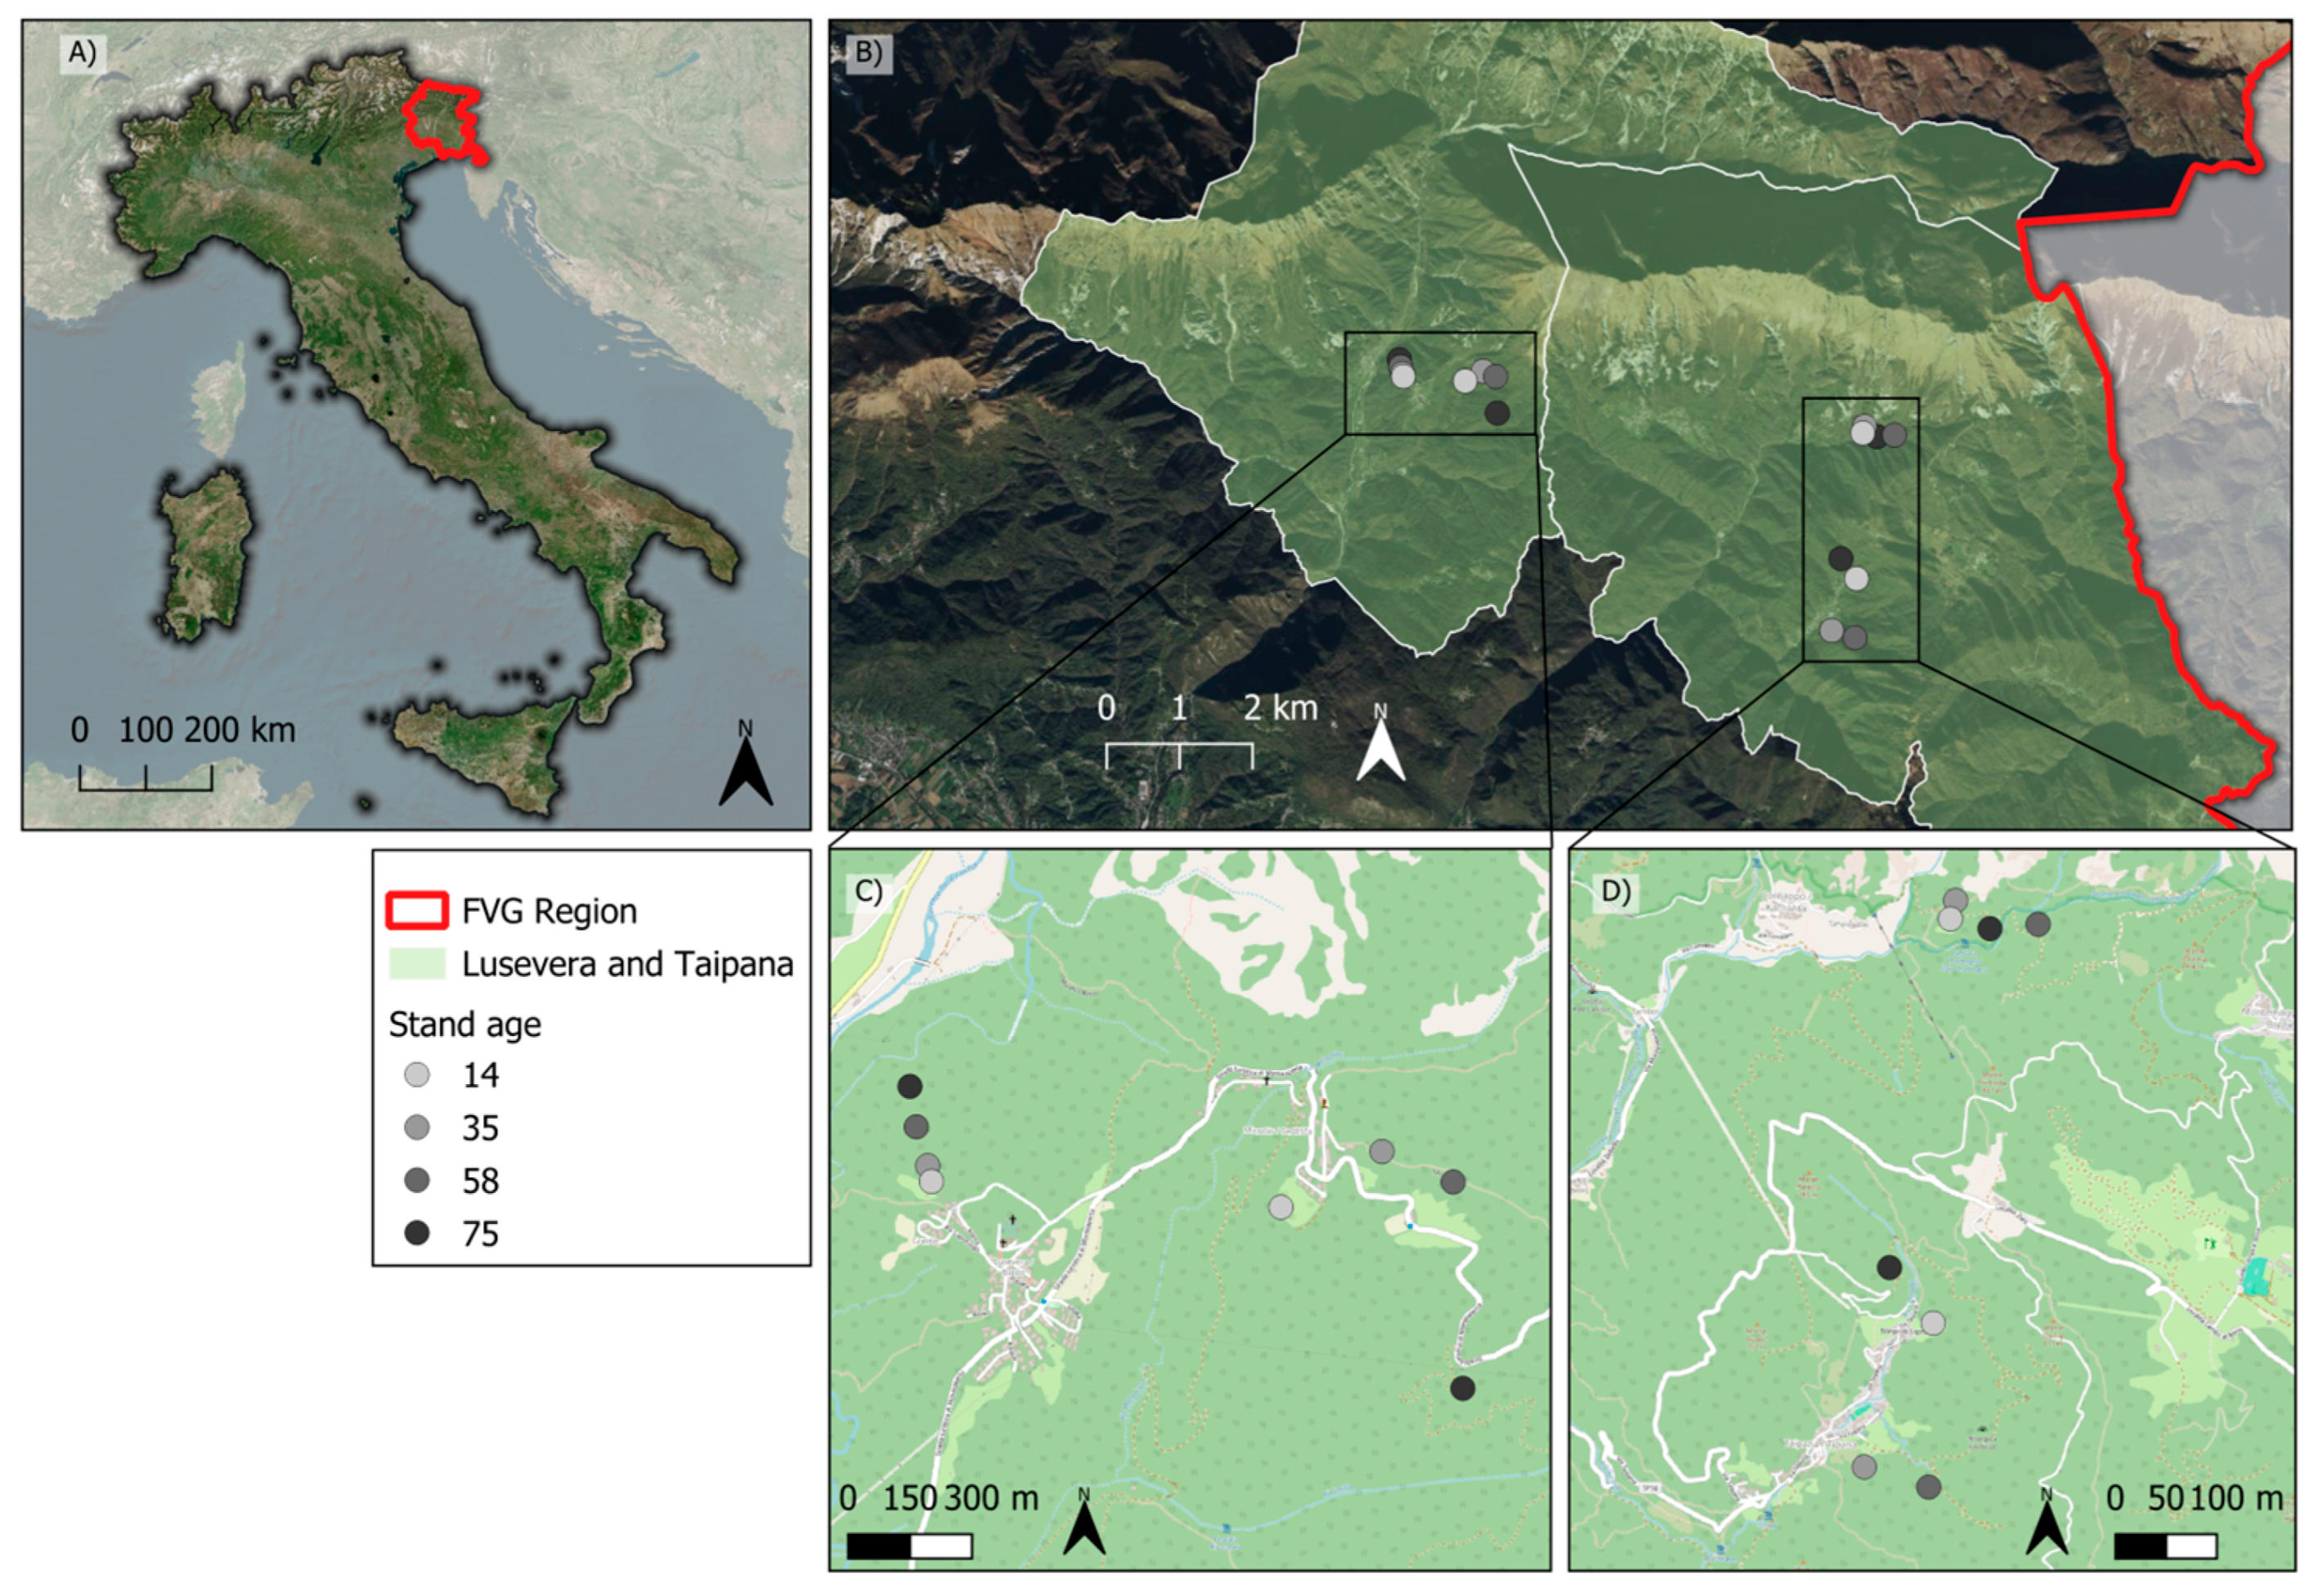
The study was conducted in the municipalities of Taipana and Lusevera, located in the Friuli Venezia Giulia Region in north-eastern Italy (46°26′N, 13°31′E) (Figure 1). The study sites range between 400 and 600 m a.s.l., with a mean elevation of approximately 580 m. The climate is temperate and humid, with a mean annual temperature of about 11 °C and mean annual precipitation of approximately 2660 mm [53]. Soils in the area are predominantly classified as Cambisols according to USDA Soil Taxonomy and have developed from calcareous parent materials [54]. The vegetation consists of mixed deciduous forests dominated by Fraxinus excelsior L., Acer pseudoplatanus L., and Ostrya carpinifolia Scop., which are particularly abundant in later successional stages. Patches of Corylus avellana L. and Castanea sativa Mill. are also common, especially in stands representing earlier stages of succession [55].
Figure 1.
Location of the study area. (A) Boundaries of Friuli Venezia Giulia (FVG) region in Italy; (B) municipalities of Lusevera and Taipana, where the four chronosequences are located; (C) detail of the Lusevera chronosequences; and (D) detail of the Taipana chronosequences.
Since the mid-twentieth century, the region has undergone progressive rural depopulation and the abandonment of traditional agricultural activities, including croplands and pastures, which has triggered widespread natural reforestation processes [56,57]. As a result, the current landscape is characterized by a mosaic of forest stands at different stages of secondary succession occurring in close spatial proximity. This configuration provides an ideal setting for investigating the relationships between forest structural attributes and understory plant diversity, as different successional stages correspond to distinct forest structural conditions [26].
2.2. Sampling Design and Data Collection
Within the study area, forest chronosequences were reconstructed using a time series of historical georeferenced orthophotos, following the approach proposed by Panico et al. [55,58].
Based on the timing of the land-use transitions from managed meadows to forest, identified from orthophoto interpretation, four successional stages were distinguished (approximately 14, 35, 58 and 75 years since abandonment). Four replicated chronosequences were then established within the study area, each comprising one sampling plot per successional stage, for a total of 16 plots. Although this design allowed us to sample a broad range of structural conditions along the successional gradient, the number of effectively independent sampling units remained limited (four chronosequences and 16 plots). Consequently, subsequent analyses were intended to identify associations between forest structure and understory diversity patterns rather than support broad generalizations beyond the study system.
Vegetation surveys were conducted within a circular plot with a radius of 13 m (531 m2). Within each plot, three 5 × 5 m subplots were randomly located to characterize within-plot variability in understory vegetation. Subplots were positioned entirely within the plot boundaries, did not overlap, and were separated by a minimum distance of 5 m. In each subplot, the percentage cover of each species was visually estimated, considering only the understory layer, defined as all vascular plants occurring below 1 m in height. The surveys included tree seedlings, shrubs, and herbaceous species present within this height threshold. Fieldwork was carried out during April and May 2024, coinciding with the peak growing season of understory vegetation. For subsequent analyses, tree seedlings and climbing species were excluded from the dataset, as functional trait values available in the literature generally refer to fully developed individuals and may therefore not accurately reflect the functional characteristics of juvenile plants [12,51]. ULS data were obtained using a Zenmuse L1 (DJI, Shenzhen, China) LiDAR sensor mounted on a DJI Matrice 300 RTK UAV (DJI, Shenzhen, China). Flights were performed using autonomous mode along pre-planned flight paths at an average altitude of 60 m above ground level and a flight speed of about 4 m s−1. Adjacent flight lines were planned with a 70% lateral overlap to ensure full coverage and data redundancy. The resulting point clouds achieved densities exceeding 1500 points m−2. Scans were acquired in December 2024, under leaf-off conditions. Although canopy conditions during leaf-off do not fully correspond to those experienced by understory vegetation during the growing season, our objective was to characterize relatively stable forest structural attributes rather than seasonal variation in canopy openness or light availability. For this reason, leaf-off acquisition was preferred, as it enhances canopy penetration and improves the characterization of forest stand structure, allowing a more complete representation of both canopy and subcanopy layers. This approach is widely recommended in the literature when the objective is to characterize three-dimensional forest structure using LiDAR data [59,60,61].
2.3. Plant Diversity Indices
For each subplot, three alpha diversity indices, namely species richness (Rich), Shannon diversity (H) and Pielou’s evenness (J), were calculated for understory plant species using the ‘diversity’ function in the vegan v2.6-8 R package [62].
We then selected six functional traits from the “Global Spectrum of Plant Form and Function Dataset” [63]. Together, these traits—plant height, stem specific density, leaf area, leaf mass per area, leaf nitrogen content per dry mass, and diaspore (seed or spore) mass—capture the main axes of variation in plant form and function [64]. Trait data were retrieved for species whose cumulative abundance, using the percentage coverage, reached at least 80% [65,66]. Species nomenclature was standardized using the Taxonomic Name Resolution Service (TNRS; [67]) with the World Flora Online backbone [68]. Outputs were manually verified, and accepted synonyms were used when the standardized names were not present in the trait databases. Missing trait values were subsequently imputed using phylogenetic information. A phylogenetic tree including all species was generated with the phylo.maker function from the V.PhyloMaker v0.1 R package [69], and used as a basis for imputation via the impute function from the funspace v0.2.2 R package [70]. To reduce dimensionality, a Principal Component Analysis (PCA) was performed using the princomp function in the base stats R package. The first two principal components, explaining 54% of the total functional variation, were retained. Based on these axes, species-level and community-level functional spaces were computed using the Trait Probability Density (TPD) framework implemented in the TPD v1.1 R package [71]. From these functional spaces, three functional diversity indices—functional richness (FRic), functional divergence (FDiv), and functional evenness (FEve)—were calculated for each subplot using the REND function. Functional dissimilarity between communities was also computed using the dissim function. The TPD approach was chosen because it has been identified as particularly robust for estimating functional diversity indices in datasets with partially imputed traits [72]. Taxonomic beta diversity among subplots was quantified using Bray–Curtis dissimilarity on Hellinger-transformed species abundance data, computed with the vegdist function in the vegan R package.
2.4. LiDAR Data Processing and Structural Metrics
LiDAR point clouds were processed to derive structural metrics describing different components of forest structure, namely forest canopy height, vertical heterogeneity, and canopy openness, which are widely used in studies investigating relationship between forest structure and biodiversity [40,73].
As a first step, raw point clouds were homogenized using a voxel-based thinning procedure with a voxel size of 0.2 m in all three dimensions. This procedure reduces local variations in point density and improves computational efficiency in subsequent analysis [74]. Within each voxel, a single representative point, selected as the point closest to the voxel centroid, was retained, resulting in a homogenized point cloud with approximately uniform sampling density. The point cloud was then height-normalised, with point heights expressed as elevation above ground. Negative values resulting from interpolation artefacts were set to zero. All structural metrics were computed on a 1 m × 1 m grid using the height-normalized, non-ground point cloud. To characterize different aspects of forest structure, five structural metrics were derived: Top Canopy Height, Coefficient of Variation of Canopy Height (CanopyHeightCoV), Gap Fraction, Vertical Complexity Index (VCI) and Understory Complexity Index (UCI). A detailed description of each metric is provided in Table 1. The subplot boundaries were used for the extraction of the mean values of the five LiDAR-derived structural metrics, ensuring that vegetation and structural measurements were collected at matching spatial scales.
Table 1.
Description of the LiDAR-derived forest structural metrics.
2.5. Statistical Analysis
Differences in forest structural attributes among successional stages were assessed at the plot level (13 m radius) using linear mixed-effects models (LMMs). For each structural metric (TopCanopyHeight, CanopyHeightCoV, GapFraction, VCI, and UCI), successional stage was included as a fixed factor, while chronosequence was treated as a random intercept to account for the hierarchical sampling design. Model assumptions were evaluated using the DHARMa package v0.4.7 [79]. Pairwise differences among successional stages were tested using estimated marginal means with Tukey-adjusted comparisons with the emmeans package v2.0.3 [80]. Polynomial contrasts were used to test for linear and non-linear trends of structural metrics along the successional gradient, using linear mixed-effects models with chronosequence as a random effect.
Relationships between forest structure and understory diversity were first explored using Spearman correlation analyses between structural metrics and both taxonomic and functional alpha diversity indices (Figure S1). Collinearity among predictor variables (TopCanopyHeight, CanopyHeightCoV, GapFraction, VCI, and UCI) was assessed using Spearman rank correlations and hierarchical cluster analysis; no strong collinearity was detected (|ρ| < 0.75).
Linear mixed effect models (LMMs) were then used to examine the effects of the structural attributes on taxonomic (Rich, H, J) and functional (FRic, FEve, FDiv) diversity indices at the subplot level. Because subplots were nested within plots, representing samples within the same ecological unit rather than independent sampling units, plot identity was included as a random effect in all linear mixed models to account for the hierarchical sampling design and potential spatial non-independence among observations. Model diagnostics performed using the DHARMa package indicated no significant deviations from model assumptions.
To further assess the contribution of structural attributes in explaining variation in understory diversity, variance partitioning was conducted. Semi-partial coefficients of determination (part R2) were computed to quantify the independent contribution of each structural metric using the partR2 R package v0.9.2 [81].
Finally, the role of forest structure in shaping patterns of beta diversity was evaluated using distance-based redundancy analysis (dbRDA) implemented through the capscale function in the “vegan” R package [62]. This approach extends linear modelling to multivariate response data by relating a dissimilarity matrix to a set of explanatory variables [82]. Both taxonomic and functional beta diversity matrices were used as response variables, while LiDAR-derived structural metrics were included as explanatory variables. Given the hierarchical sampling design (subplots nested within plots), analyses were first conducted at the subplot level, both with and without conditioning on plot identity. Conditioning on plot identity substantially reduced explained variance, indicating that most variation in beta diversity occurred among plots rather than within plots (Table S1). Accordingly, complementary analyses were performed at the plot level by aggregating subplot data and recalculating diversity metrics for each 13 m plot, allowing relationships between forest structure and beta diversity to be evaluated at the spatial scale at which structural variation was most pronounced. Given the limited number of independent sampling units, analyses conducted at plot and subplot level are considered exploratory and aimed at identifying associations rather than supporting broad inference.
Statistical significance of the overall model and individual predictors was assessed using permutation tests with 999 permutations. All statistical analyses were performed in R [83].
3. Results
3.1. Structural Differences Across Successional Stages
Forest structural attributes varied along the successional stage gradient, although responses differed among metrics (Figure S2; Table S4). Top canopy height showed a strong and significant increase with increasing successional stage, supported by both the mixed-effects model and a significant linear trend. Canopy height variability and vertical complexity (VCI) also increased along the gradient, with significant effects of successional stage and positive linear trends (Table S4). Gap fraction exhibited a decreasing pattern with increasing successional stage, with a significant negative linear trend, although differences among classes were not statistically significant in pairwise comparisons. In contrast, understory complexity (UCI) did not show significant differences among successional stages and no clear trend along the gradient.
3.2. Relationships Between Alpha Diversity Indices and Forest Structure
Linear mixed-effects models were used to assess the relationships between forest structural metrics and understory taxonomic and functional diversity indices. The marginal R2 values of the models ranged from 0.03 to 0.22 across diversity indices (Table S2), indicating generally low to moderate explanatory power of forest structural attributes. Table 2 reports the estimated coefficients for models in which at least one structural predictor showed a significant effect (statistics for all 6 models can be found in Table S5). Functional richness (FRic) was significantly negatively related to canopy height (TopCanopyHeight; β = −0.60 ± 0.29 SE, p = 0.042), whereas no other structural metrics showed significant effects on functional diversity components. Species richness was negatively associated with understory structural complexity (UCI; β = −12.87 ± 5.85 SE, p = 0.034), with weaker, non-significant trends observed for TopCanopyHeight and GapFraction. Similarly, Shannon diversity (H) showed a marginally significant negative relationship with UCI (β = −1.44 ± 0.71 SE, p = 0.049).
Table 2.
Results of the significant LMMs relating alpha diversity indices (FRic, Rich, H) and the forest structural attributes. Marginal R2 represents the proportion of variance explained by the fixed effects. Estimate and Std. Error denote the estimated regression coefficient and its standard error, respectively. df indicates the degrees of freedom, t value is the test statistic for the fixed effect, and Pr(>|t|) represents the associated p-value (bold values indicate statistical significance; * indicates p < 0.05).
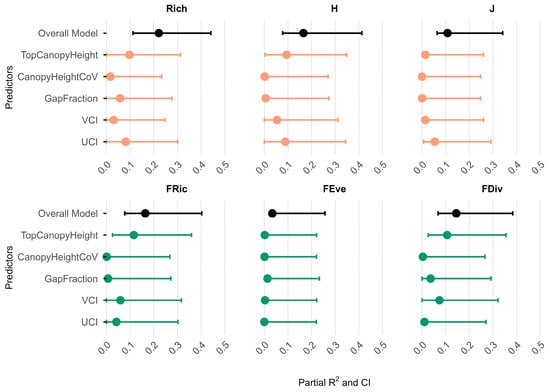
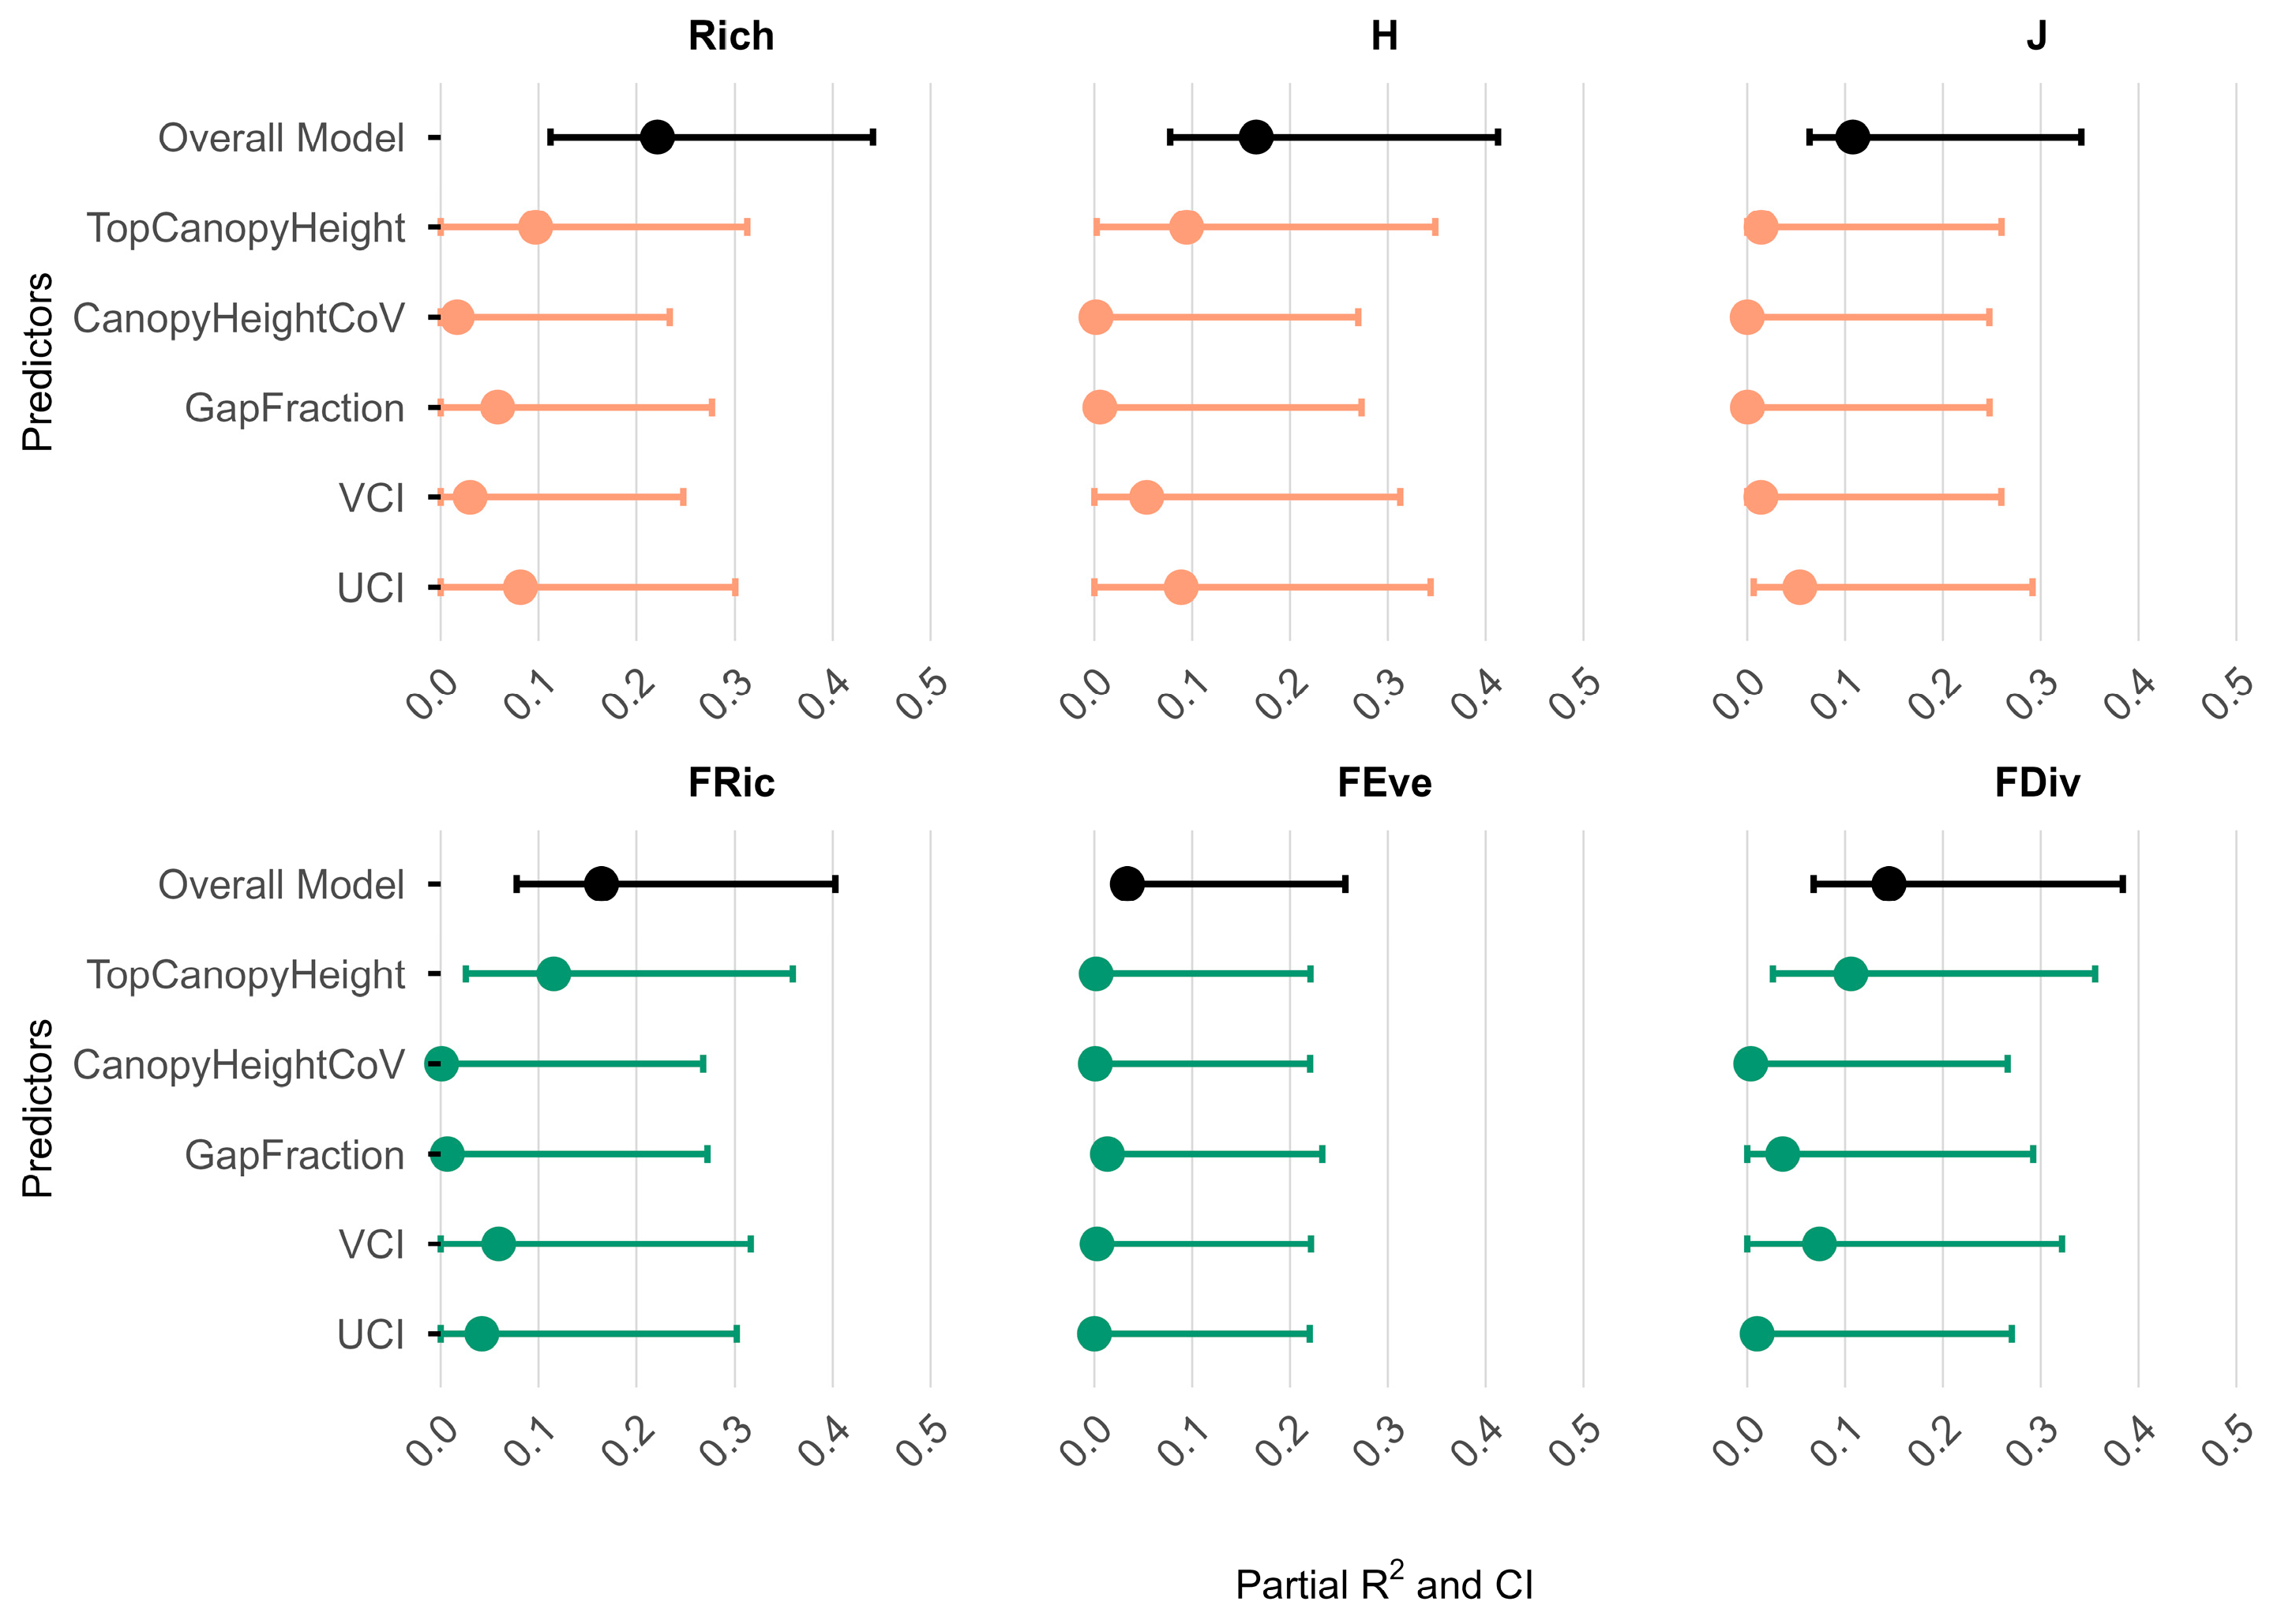
As reported in Table S3, TopCanopyHeight showed the strongest and most consistent contribution, explaining a substantial portion of variance in both taxonomic and functional diversity (Figure 2). Its effects were particularly evident for Rich (part R2 = 0.097), H (part R2 = 0.094), FRic (part R2 = 0.116), and FDiv (part R2 = 0.106), whereas its contribution to evenness metrics (J and FEve) was negligible. GapFraction exhibited a more variable and generally weaker contribution, showing moderate association with Rich (part R2 = 0.058) and FDiv (part R2 = 0.036), but limited effects on the remaining indices. Similarly, UCI played a relevant role mainly for taxonomic diversity, with notable contributions to Rich (part R2 = 0.082), H (part R2 = 0.089), and J (part R2 = 0.054), while its influence on functional diversity metrics was comparatively limited. In contrast, VCI contributed primarily to FRic (part R2 = 0.059) and FDiv (part R2 = 0.074), with weak effects on taxonomic indices. CanopyHeightCoV showed only minor contributions, mainly for Rich. Overall, bootstrap confidence intervals for part R2 estimates were wide and frequently overlapped zero, indicating considerable uncertainty in the relative importance of individual predictors.
Figure 2.
Contribution of structural metrics to herbaceous diversity indices. Proportions of variance in taxonomic (orange; Rich, H, J) and functional (green; FRic, FEve, FDiv) diversity indices explained by structural attributes.
3.3. Beta Diversity and Structural Attributes
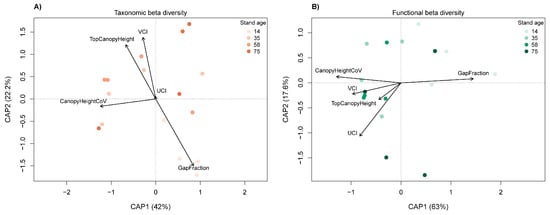
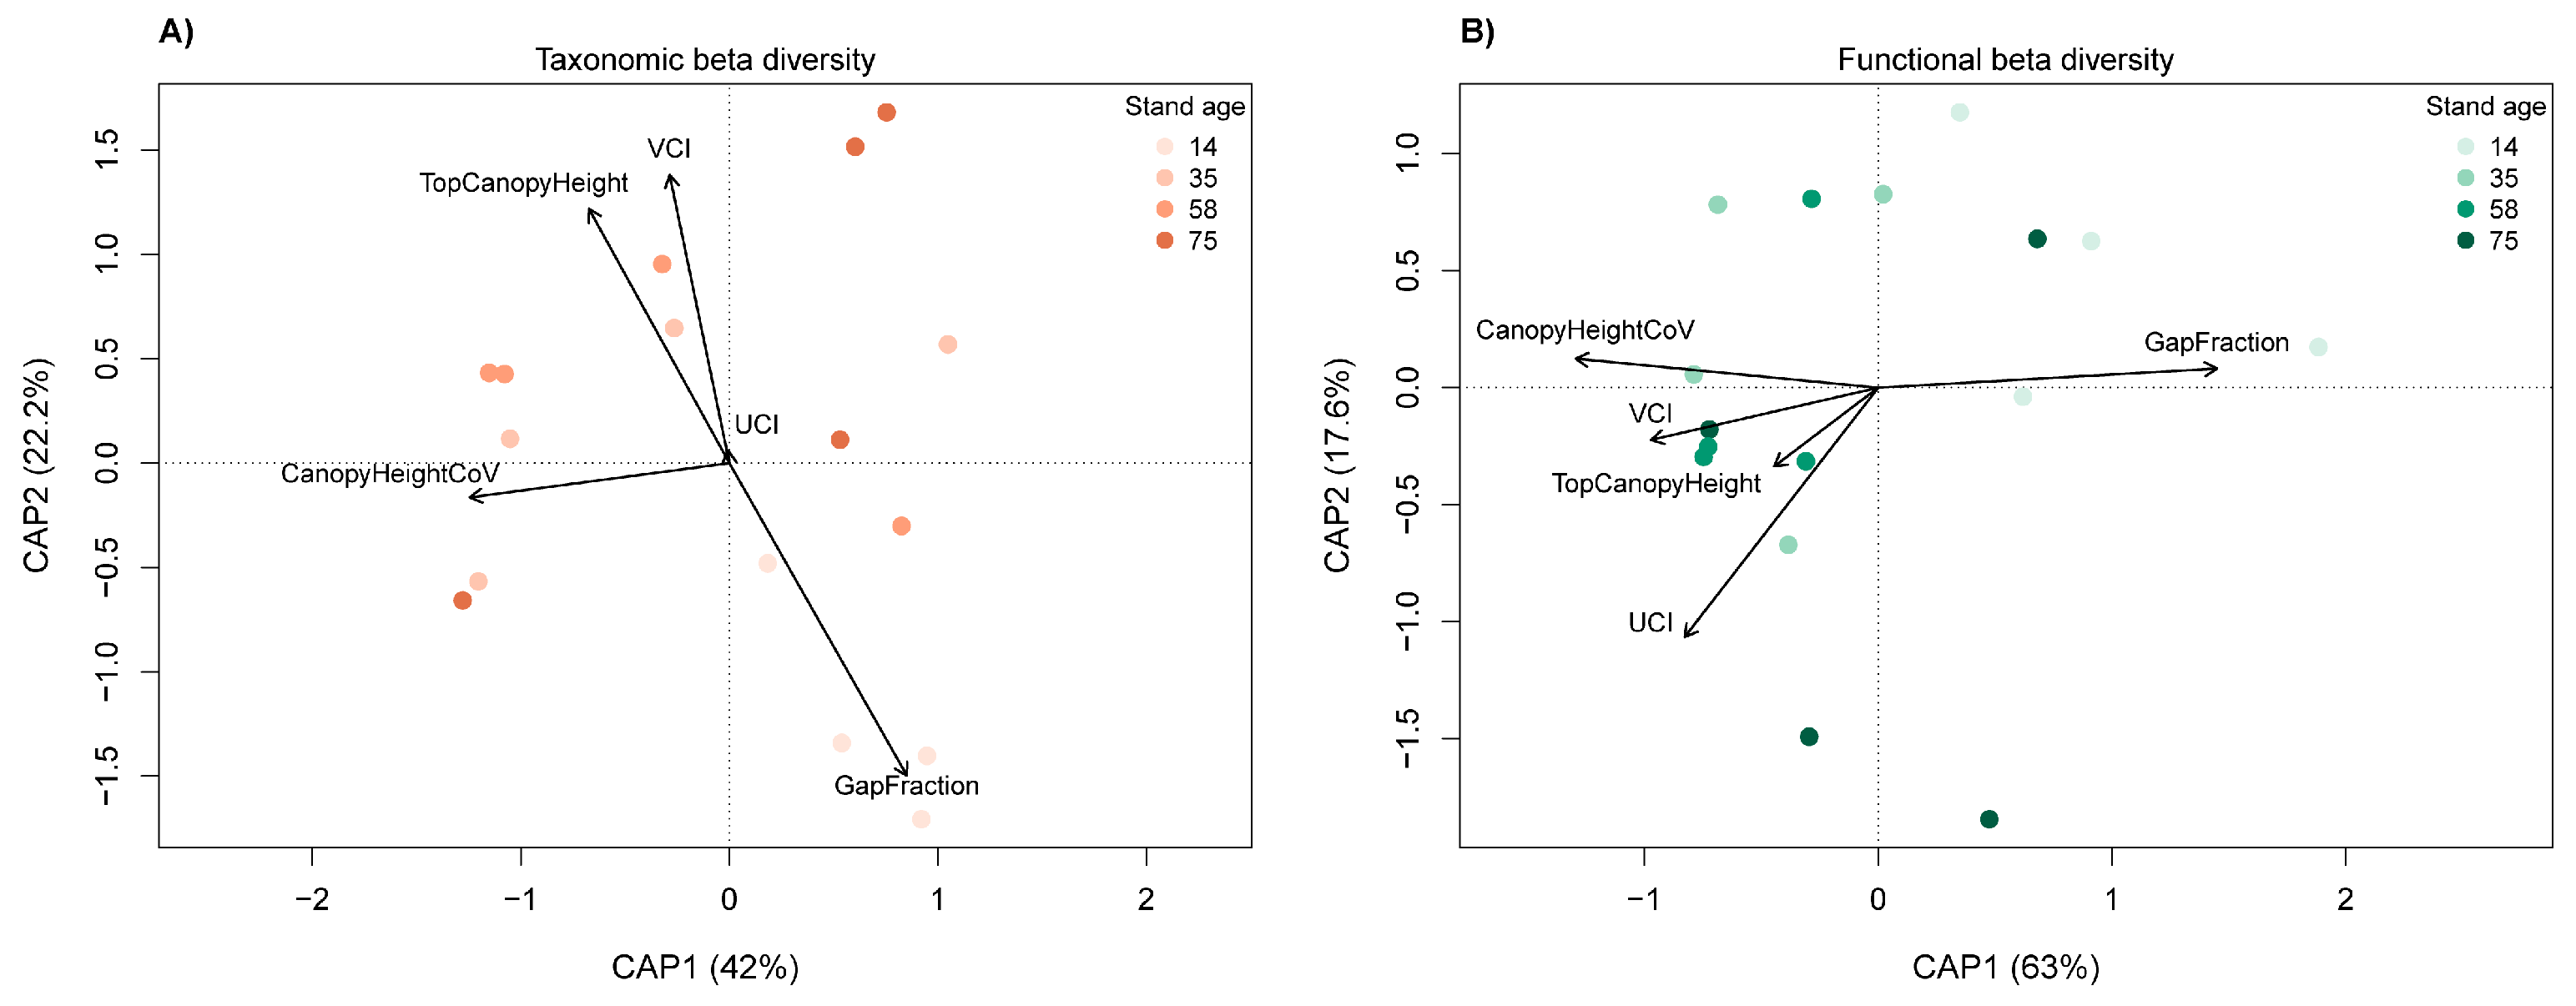
At the plot level, forest structural metrics significantly explained variation in both functional and taxonomic beta diversity (Figure 3). For functional beta diversity, the dbRDA model accounted for 47.8% of the total variation and was statistically significant (F = 1.83, p = 0.034). Similarly, taxonomic beta diversity was significantly related to forest structure, with the model explaining 45.2% of the variation (F = 1.65, p = 0.019). For functional beta diversity, GapFraction was the main predictor, showing a significant marginal effect, whereas the remaining structural variables were not significant (Table 3). In contrast, taxonomic beta diversity was associated with a combination of structural attributes, with CanopyHeightCoV and GapFraction showing significant marginal effects, and VCI contributing more weakly (Table 3).
Figure 3.
Distance-based redundancy analysis (dbRDA) ordinations of taxonomic beta diversity (orange; (A)) and functional beta diversity (green; (B)) of understory plant communities constrained by forest structural metrics. Points represent 13-m-radius plots and are coloured according to successional stage. Plots located closer together in the ordination space have more similar community composition than plots located farther apart. Arrows represent forest structural variables; arrow direction indicates the direction of increasing values of the corresponding variable, whereas arrow length is proportional to the strength of its association with the ordination axes. Analyses were conditioned on chronosequence. The percentages reported in parentheses on the CAP1 and CAP2 axes indicate the proportion of constrained variance explained by each canonical axis.
Table 3.
Marginal effects of forest structural metrics on taxonomic and functional beta diversity from dbRDA. Sum Sq represents the variation in community dissimilarity explained by each structural metric. F value is the pseudo-F statistic obtained from permutation tests, and p-values indicate the significance of the relationship based on 999 permutations. For both dbRDA models, model df = 5 and residual df = 10. Bold values indicate statistical significance; * indicates p < 0.05.
4. Discussion
Our results show that forest structural attributes derived from ULS LiDAR exhibit contrasting relationships with understory plant diversity across spatial scales. Structural metrics explained only a limited proportion of variation in taxonomic and functional alpha diversity, with generally weak relationships, whereas they accounted for a substantially higher proportion of variation in both taxonomic and functional beta diversity. In particular, canopy height and understory structural complexity were negatively associated with local diversity indices, while metrics related to canopy openness and structural heterogeneity emerged as key predictors of community dissimilarities among plots. These patterns suggest that, in the studied secondary temperate forests, forest structure plays a more prominent role in shaping spatial changes in community composition than in regulating local (alpha) diversity. Overall, our findings highlight a clear scale-dependent relationship between forest structure and understory plant diversity, whereby structural heterogeneity primarily contributes to between-community differentiation rather than within-community diversity.
4.1. Alpha Diversity
Forest structure showed only a limited capacity to explain local (alpha) understory diversity in our study, with generally low marginal R2 values and only a few significant effects. Furthermore, bootstrap confidence intervals around the partial R2 estimates were generally broad and frequently overlapped zero, indicating substantial uncertainty in the contribution of individual structural predictors. Despite this uncertainty, the partial R2 analysis identified TopCanopyHeight as one of the most influential structural predictors across several diversity metrics, affecting both taxonomic and functional components. Consistently, the LMM results showed that functional richness was negatively associated with increasing canopy height. In our system, taller canopies correspond to more advanced successional stages (Figure S2). Such stages have been reported to be associated with lower understory taxonomic diversity compared to early successional stages in the same region and elsewhere in Italy [84], a pattern consistent with the structural gradient captured by canopy height in this study. More advanced stages of forest succession are also associated with reduced light penetration at the forest floor, as suggested by the decreasing trend of gap fraction observed along the successional gradient (Table S4). Such conditions may constrain the coexistence of species with contrasting ecological strategies, potentially leading to lower functional richness [84,85,86,87]. These patterns align with previous findings by Chelli et al. [52], who reported that in Italian temperate forests canopy closure reduced the diversity of individual functional traits, namely plant height, specific leaf area and seed mass, suggesting that shaded conditions may constrain the range of available trait combinations. Overall, our results suggest that canopy height may be indicative of the ecological gradient associated with secondary succession underlying variation in alpha diversity.
LMM analysis highlighted that species richness and Shannon diversity were negatively associated with increasing understory structural complexity. Higher UCI values likely reflect denser and more vertically developed understory layers, potentially dominated by shrubs within the 0–3 m height range. Such conditions may reduce light availability at ground level and intensify competition for resources, thereby limiting the establishment and coexistence of additional herbaceous species. This is in line with previous studies conducted in abandoned coppice forests, where higher tree density was associated with lower understory species richness, likely due to stronger light limitation under closed canopy [51]. While the underlying mechanisms were not directly assessed in this study, the negative relationship observed with UCI is consistent with this general interpretation.
The overall weak explanatory power of structural variables suggests that local understory diversity is not primarily driven by forest structure alone. In line with this, Chelli et al. [12] showed that climate, soil and forest structure jointly shape understory functional diversity across Italian forests, with herbaceous species responding more strongly to climate and soil than to structural attributes. The limited performance of our models may therefore reflect the influence of unmeasured environmental drivers, such as soil properties and topography. This highlights an important limitation of relying exclusively on LiDAR-derived structural metrics to explain alpha diversity patterns in temperate forest ecosystems. Furthermore, this weak relationship may partly reflect scale mismatches and boundary effects, as structural metrics derived over limited spatial extents may fail to capture the heterogeneity experienced by plant communities.
4.2. Beta Diversity
In contrast to alpha diversity, forest structural attributes explained a substantial proportion of variation in both taxonomic and functional beta diversity, indicating a stronger influence of forest structure on spatial patterns of community dissimilarity than on local diversity. This strong relationship partly contrasts with previous studies, where forest structure has been shown to play a weak to moderate role and is often confounded with other environmental drivers. For instance, Yao et al. [35], analysing woody communities in subtropical forests of southwest China, found that forest structure explained only a limited proportion of beta diversity, particularly for the functional composition, with topography and spatial structure playing a more prominent role. Similarly, Zellweger at al. [34] highlighted that forest structure interacts with microclimatic and topographic gradients in shaping vascular plant community dissimilarity, rather than acting as an independent dominant driver alone.
The stronger effects observed in our study likely reflect the characteristics of the investigated ecosystems, where forest stands represent distinct successional stages and therefore exhibit pronounced structural contrasts. Such differences are expected to generate heterogeneous light environments and microhabitat conditions among plots, thereby promoting both taxonomic and functional turnover in understory communities.
Among structural metrics, GapFraction showed the strongest associations with functional beta diversity. Canopy gaps could create heterogeneous microhabitats that facilitate the coexistence of species with contrasting ecological strategies and functional traits. Consequently, spatial variation in gap distribution may lead to marked differences in functional composition across forest stands. Taxonomic beta diversity, in turn, was associated with a combination of structural attributes, with canopy height variability and canopy openness contributing significantly to species dissimilarity. This supports our hypothesis that both vertical and horizontal components of forest structure jointly drive spatial heterogeneity in understory communities. These findings have important implications for forest management and biodiversity conservation. In landscapes undergoing forest encroachment and succession, maintaining a mosaic of patches differing in canopy height, gap dynamics and structural complexity can sustain a wide range of habitat conditions, thereby promoting both taxonomic and functional beta diversity at the landscape scale. This suggests that management strategies should aim not only to enhance local diversity, but also to maintain structural variability across forest stands.
However, these results should be interpreted with some caution. In our study system, where successional stages are well-defined, forest structure may act as a proxy for multiple co-varying environmental gradients. Moreover, the relatively limited number of sampled plots may constrain the generality of our findings. Future studies based on larger datasets would help to test the robustness of these patterns across broader environmental contexts. Integrating LiDAR-derived metrics with direct measurements of microclimate, topography, and soil conditions could further improve understanding of the mechanisms driving beta diversity, allowing the independent effects of forest structure to be more clearly disentangled from other environmental drivers.
5. Conclusions
Our study provides new insights into the role of forest structure, derived from high-density ULS point clouds, as an indicator of forest biodiversity. Overall, the results partially support our hypotheses. While we expected structural diversity to affect both taxonomic and functional alpha and beta diversity, LiDAR-derived metrics showed limited explanatory power for local (alpha) diversity but accounted for a substantial proportion of variation in beta diversity. These findings suggest a scale-dependent association of forest structure on understory plant diversity in secondary temperate forests with a stronger role for spatial patterns of community dissimilarity. In particular, canopy openness and vertical heterogeneity appear to be primarily associated with differences among communities rather than with increases in local diversity. In systems characterized by pronounced successional gradients, structural attributes may effectively capture multiple underlying environmental drivers. From a landscape management perspective, maintaining structural heterogeneity across forest stands, including a mosaic of patches at different successional stages, may help support plant diversity at the landscape scale. At the same time, the weak relationships observed for alpha diversity underline the need to integrate structural information with additional environmental variables, such as soil properties and microclimate, to better understand local diversity patterns. Overall, our findings demonstrate the value of high-resolution ULS LiDAR data for capturing ecologically meaningful variation in forest structure and emphasize its potential for improving biodiversity assessments in structurally complex forest ecosystems.
Supplementary Materials
The following supporting information can be downloaded at: https://www.mdpi.com/article/10.3390/rs18132099/s1. Figure S1: Spearman correlation matrix between structural attributes and understory diversity indices; Table S1: Summary of subplot-level distance-based redundancy analyses (dbRDA) for functional and taxonomic β-diversity; Table S2: Marginal R2 values of the linear mixed-effects models explaining taxonomic and functional diversity indices; Table S3: Semi-partial R2 values for each structural predictor across taxonomic and functional diversity indices; Figure S2: Estimated marginal means of LiDAR-derived forest structural metrics across successional stages; Table S4: Results of linear mixed-effects models testing polynomial trends of forest structural metrics along the successional stage gradient. Table S5: Results of the LMMs relating alpha diversity indices (FRic, FEve, FDiv Rich, H, J) and the forest structural attributes.
Author Contributions
Conceptualization, L.O. and A.T.; methodology, L.O., A.T., K.K., F.K. and M.K.; software, M.Ž.; formal analysis, L.O.; investigation, P.C., G.T. and L.O.; data curation, L.O., K.K., F.K., M.K. and M.Ž.; writing—original draft preparation, L.O. and A.T.; writing—review and editing, L.O., A.T., V.C., P.C., K.K., F.K., M.K., M.Ž., G.T. and G.A.; visualization, L.O.; supervision, A.T.; project administration, G.A.; funding acquisition, G.A. All authors have read and agreed to the published version of the manuscript.
Funding
This study was supported by the WILDCARD project funded by the European Climate, Infrastructure and Environment Executive Agency (CINEA) of the European Union under grant number 101081177. Views and opinions expressed are however those of the authors only and do not necessarily reflect those of the funders. Neither the European Union nor the granting authorities can be held responsible for them.
Data Availability Statement
The original data presented in the study are openly available in Zenodo at https://doi.org/10.5281/zenodo.19914025.
Acknowledgments
Special thanks go to Luca Cadez for his support during ULS flights.
Conflicts of Interest
The authors declare no conflicts of interest. The funders had no role in the design of the study; in the collection, analyses, or interpretation of data; in the writing of the manuscript; or in the decision to publish the results.
Abbreviations
The following abbreviations are used in this manuscript:
| ALS | Aerial Laser Scanning |
| dbRDA | distance-based Redundancy Analysis |
| FD | Functional Diversity |
| FDiv | Functional Divergence |
| FEve | Functional Evenness |
| FRic | Functional Richness |
| H | Shannon diversity |
| J | Pielou’s evenness |
| LiDAR | Light Detection and Ranging |
| LMMs | Linear Mixed Models |
| PCA | Principal Component Analysis |
| Rich | Species richness |
| TPD | Trait Probability Density |
| UAV | Uncrewed Aerial Vehicle |
| UCI | Understory Complexity Index |
| ULS | Uncrewed Laser Scanning |
| VCI | Vertical Complexity Index |
References
- Aerts, R.; Honnay, O. Forest Restoration, Biodiversity and Ecosystem Functioning. BMC Ecol. 2011, 11, 29. [Google Scholar] [CrossRef] [Scilit] [PubMed]
- Thompson, I.D.; Okabe, K.; Tylianakis, J.M.; Kumar, P.; Brockerhoff, E.G.; Schellhorn, N.A.; Parrotta, J.A.; Nasi, R. Forest Biodiversity and the Delivery of Ecosystem Goods and Services: Translating Science into Policy. BioScience 2011, 61, 972–981. [Google Scholar] [CrossRef] [Scilit]
- Duffy, J.E. Why Biodiversity Is Important to the Functioning of Real-World Ecosystems. Front. Ecol. Environ. 2009, 7, 437–444. [Google Scholar] [CrossRef] [Scilit]
- Mori, A.S.; Lertzman, K.P.; Gustafsson, L. Biodiversity and Ecosystem Services in Forest Ecosystems: A Research Agenda for Applied Forest Ecology. J. Appl. Ecol. 2017, 54, 12–27. [Google Scholar] [CrossRef] [Scilit]
- Balvanera, P.; Pfisterer, A.B.; Buchmann, N.; He, J.-S.; Nakashizuka, T.; Raffaelli, D.; Schmid, B. Quantifying the Evidence for Biodiversity Effects on Ecosystem Functioning and Services. Ecol. Lett. 2006, 9, 1146–1156. [Google Scholar] [CrossRef] [Scilit] [PubMed]
- Gilliam, F.S. The Ecological Significance of the Herbaceous Layer in Temperate Forest Ecosystems. BioScience 2007, 57, 845–858. [Google Scholar] [CrossRef] [Scilit]
- Welch, N.T.; Belmont, J.M.; Randolph, J.C. Summer Ground Layer Biomass and Nutrient Contribution to Above-Ground Litter in an Indiana Temperate Deciduous Forest. Am. Midl. Nat. 2007, 157, 11–26. [Google Scholar] [CrossRef] [Scilit]
- Landuyt, D.; De Lombaerde, E.; Perring, M.P.; Hertzog, L.R.; Ampoorter, E.; Maes, S.L.; De Frenne, P.; Ma, S.; Proesmans, W.; Blondeel, H.; et al. The Functional Role of Temperate Forest Understorey Vegetation in a Changing World. Glob. Change Biol. 2019, 25, 3625–3641. [Google Scholar] [CrossRef] [Scilit] [PubMed]
- Gonzalez, M.; Augusto, L.; Gallet-Budynek, A.; Xue, J.; Yauschew-Raguenes, N.; Guyon, D.; Trichet, P.; Delerue, F.; Niollet, S.; Andreasson, F.; et al. Contribution of Understory Species to Total Ecosystem Aboveground and Belowground Biomass in Temperate Pinus pinaster Ait. forests. For. Ecol. Manag. 2013, 289, 38–47. [Google Scholar] [CrossRef] [Scilit]
- Haritika; Negi, A.K. The Underestimated Role of Understory Vegetation Dynamics for Forest Ecosystem Resilience: A Review. Plant Ecol. 2025, 226, 763–787. [Google Scholar] [CrossRef] [Scilit]
- Förster, A.; Becker, T.; Gerlach, A.; Meesenburg, H.; Leuschner, C. Long-Term Change in Understorey Plant Communities of Conventionally Managed Temperate Deciduous Forests: Effects of Nitrogen Deposition and Forest Management. J. Veg. Sci. 2017, 28, 747–761. [Google Scholar] [CrossRef] [Scilit]
- Chelli, S.; Bricca, A.; Tsakalos, J.L.; Andreetta, A.; Bonari, G.; Campetella, G.; Carnicelli, S.; Cervellini, M.; Puletti, N.; Wellstein, C.; et al. Multiple Drivers of Functional Diversity in Temperate Forest Understories: Climate, Soil, and Forest Structure Effects. Sci. Total Environ. 2024, 916, 170258. [Google Scholar] [CrossRef] [Scilit] [PubMed]
- Deng, T.; Du, Q.; Zhu, Y.; Queenborough, S.A. Environmental Drivers of Herbaceous Plant Diversity in the Understory Community of a Warm-Temperate Forest. Plant Divers. 2025, 47, 282–290. [Google Scholar] [CrossRef] [Scilit] [PubMed]
- Zhang, Y.; Liu, T.; Guo, J.; Tan, Z.; Dong, W.; Wang, H. Changes in the Understory Diversity of Secondary Pinus Tabulaeformis Forests Are the Result of Stand Density and Soil Properties. Glob. Ecol. Conserv. 2021, 28, e01628. [Google Scholar] [CrossRef] [Scilit]
- De Frenne, P.; Zellweger, F.; Rodríguez-Sánchez, F.; Scheffers, B.R.; Hylander, K.; Luoto, M.; Vellend, M.; Verheyen, K.; Lenoir, J. Global Buffering of Temperatures under Forest Canopies. Nat. Ecol. Evol. 2019, 3, 744–749. [Google Scholar] [CrossRef] [Scilit]
- De Frenne, P.; Lenoir, J.; Luoto, M.; Scheffers, B.R.; Zellweger, F.; Aalto, J.; Ashcroft, M.B.; Christiansen, D.M.; Decocq, G.; De Pauw, K.; et al. Forest Microclimates and Climate Change: Importance, Drivers and Future Research Agenda. Glob. Change Biol. 2021, 27, 2279–2297. [Google Scholar] [CrossRef] [Scilit] [PubMed]
- Chase, J.M.; Leibold, M.A. Ecological Niches: Linking Classical and Contemporary Approaches; University of Chicago Press: Chicago, IL, USA, 2009; ISBN 978-0-226-10181-1. [Google Scholar]
- Stein, A.; Gerstner, K.; Kreft, H. Environmental Heterogeneity as a Universal Driver of Species Richness across Taxa, Biomes and Spatial Scales. Ecol. Lett. 2014, 17, 866–880. [Google Scholar] [CrossRef] [Scilit] [PubMed]
- Trotta, G.; Boscutti, F.; Jamoneau, A.; Decocq, G.; Chiarucci, A. There Is Room for Everyone: Invasion Credit Cannot Be Inferred from the Species–Area Relationship in Fragmented Forests. Appl. Veg. Sci. 2023, 26, e12745. [Google Scholar] [CrossRef] [Scilit]
- Dieler, J.; Uhl, E.; Biber, P.; Müller, J.; Rötzer, T.; Pretzsch, H. Effect of Forest Stand Management on Species Composition, Structural Diversity, and Productivity in the Temperate Zone of Europe. Eur. J. For. Res. 2017, 136, 739–766. [Google Scholar] [CrossRef] [Scilit]
- Baran, J.; Pielech, R.; Kauzal, P.; Kukla, W.; Bodziarczyk, J. Influence of Forest Management on Stand Structure in Ravine Forests. For. Ecol. Manag. 2020, 463, 118018. [Google Scholar] [CrossRef] [Scilit]
- Janda, P.; Trotsiuk, V.; Mikoláš, M.; Bače, R.; Nagel, T.A.; Seidl, R.; Seedre, M.; Morrissey, R.C.; Kucbel, S.; Jaloviar, P.; et al. The Historical Disturbance Regime of Mountain Norway Spruce Forests in the Western Carpathians and Its Influence on Current Forest Structure and Composition. For. Ecol. Manag. 2017, 388, 67–78. [Google Scholar] [CrossRef] [Scilit] [PubMed]
- Caviedes, J.; Ibarra, J.T. Influence of Anthropogenic Disturbances on Stand Structural Complexity in Andean Temperate Forests: Implications for Managing Key Habitat for Biodiversity. PLoS ONE 2017, 12, e0169450. [Google Scholar] [CrossRef] [Scilit] [PubMed]
- D’Amato, A.W.; Orwig, D.A.; Foster, D.R. The Influence of Successional Processes and Disturbance on the Structure of Tsuga Canadensis Forests. Ecol. Appl. 2008, 18, 1182–1199. [Google Scholar] [CrossRef] [Scilit] [PubMed]
- Ponce, D.B.; Donoso, P.J.; Salas-Eljatib, C. Differentiating Structural and Compositional Attributes across Successional Stages in Chilean Temperate Rainforests. Forests 2017, 8, 329. [Google Scholar] [CrossRef] [Scilit]
- Matsuo, T.; Hiura, T.; Onoda, Y. Vertical and Horizontal Light Heterogeneity along Gradients of Secondary Succession in Cool- and Warm-Temperate Forests. J. Veg. Sci. 2022, 33, e13135. [Google Scholar] [CrossRef] [Scilit] [PubMed]
- Kumar, P.; Chen, H.Y.H.; Thomas, S.C.; Shahi, C. Linking Resource Availability and Heterogeneity to Understorey Species Diversity through Succession in Boreal Forest of Canada. J. Ecol. 2018, 106, 1266–1276. [Google Scholar] [CrossRef] [Scilit]
- De Pauw, K.; Meeussen, C.; Govaert, S.; Sanczuk, P.; Vanneste, T.; Bernhardt-Römermann, M.; Bollmann, K.; Brunet, J.; Calders, K.; Cousins, S.A.O.; et al. Taxonomic, Phylogenetic and Functional Diversity of Understorey Plants Respond Differently to Environmental Conditions in European Forest Edges. J. Ecol. 2021, 109, 2629–2648. [Google Scholar] [CrossRef] [Scilit]
- Petchey, O.L.; Gaston, K.J. Functional Diversity: Back to Basics and Looking Forward. Ecol. Lett. 2006, 9, 741–758. [Google Scholar] [CrossRef] [Scilit] [PubMed]
- Garnier, E.; Navas, M.-L.; Grigulis, K. Plant Functional Diversity: Organism Traits, Community Structure, and Ecosystem Properties; Oxford University Press: Oxford, UK, 2016; ISBN 978-0-19-875736-8. [Google Scholar]
- Mason, N.W.H.; Mouillot, D.; Lee, W.G.; Wilson, J.B. Functional Richness, Functional Evenness and Functional Divergence: The Primary Components of Functional Diversity. Oikos 2005, 111, 112–118. [Google Scholar] [CrossRef] [Scilit]
- Thom, D.; Taylor, A.R.; Seidl, R.; Thuiller, W.; Wang, J.; Robideau, M.; Keeton, W.S. Forest Structure, Not Climate, Is the Primary Driver of Functional Diversity in Northeastern North America. Sci. Total Environ. 2021, 762, 143070. [Google Scholar] [CrossRef] [Scilit] [PubMed]
- De Benedictis, L.L.M.; Chelli, S.; Zhu, Z.; Cervellini, M.; Canullo, R.; Chianucci, F.; Puletti, N.; Tsakalos, J.L.; Bartha, S.; Campetella, G. Forest Structure and Understory Functional Diversity at Multiple Scales: The Importance of Median Tree Height. Ecol. Indic. 2026, 183, 114687. [Google Scholar] [CrossRef] [Scilit]
- Zellweger, F.; Roth, T.; Bugmann, H.; Bollmann, K. Beta Diversity of Plants, Birds and Butterflies Is Closely Associated with Climate and Habitat Structure. Glob. Ecol. Biogeogr. 2017, 26, 898–906. [Google Scholar] [CrossRef] [Scilit]
- Yao, Z.; Yang, X.; Wang, B.; Shao, X.; Wen, H.; Deng, Y.; Zhang, Z.; Cao, M.; Lin, L. Multidimensional Beta-Diversity across Local and Regional Scales in a Chinese Subtropical Forest: The Role of Forest Structure. Ecol. Evol. 2023, 13, e10607. [Google Scholar] [CrossRef] [Scilit] [PubMed]
- Palmero-Iniesta, M.; Pino, J.; Pesquer, L.; Espelta, J.M. Recent Forest Area Increase in Europe: Expanding and Regenerating Forests Differ in Their Regional Patterns, Drivers and Productivity Trends. Eur. J. For. Res. 2021, 140, 793–805. [Google Scholar] [CrossRef] [Scilit]
- Frei, T.; Espelta, J.M.; Górriz-Mifsud, E.; Hampe, A.; Lefèvre, F.; Martín-Forés, I.; Winkel, G. Can Natural Forest Expansion Contribute to Europe’s Restoration Policy Agenda? An Interdisciplinary Assessment. Ambio 2024, 53, 34–45. [Google Scholar] [CrossRef] [Scilit] [PubMed]
- Verburg, P.H.; Overmars, K.P. Combining Top-down and Bottom-up Dynamics in Land Use Modeling: Exploring the Future of Abandoned Farmlands in Europe with the Dyna-CLUE Model. Landsc. Ecol. 2009, 24, 1167–1181. [Google Scholar] [CrossRef] [Scilit]
- Perpiña Castillo, C.; Kavalov, B.; Diogo, V.; Jacobs, C.; Batista E Silva, F.; Lavalle, C. Agricultural Land Abandonment in the EU Within 2015–2030; European Commission: Ispra, Italy, 2018; JRC113718, 20 November 2018; Available online: https://publications.jrc.ec.europa.eu/repository/handle/JRC113718 (accessed on 21 June 2026).
- Feigl, J.; Frey, J.; Seifert, T.; Koch, B. Close-Range Remote Sensing of Forest Structure for Biodiversity Assessments: A Systematic Literature Review. Curr. For. Rep. 2025, 11, 18. [Google Scholar] [CrossRef] [Scilit]
- Lim, K.; Treitz, P.; Wulder, M.; St-Onge, B.; Flood, M. LiDAR Remote Sensing of Forest Structure. Prog. Phys. Geogr. Earth Environ. 2003, 27, 88–106. [Google Scholar] [CrossRef] [Scilit]
- Akay, A.E.; Oğuz, H.; Karas, I.R.; Aruga, K. Using LiDAR Technology in Forestry Activities. Environ. Monit. Assess. 2009, 151, 117–125. [Google Scholar] [CrossRef] [Scilit] [PubMed]
- Kamoske, A.G.; Dahlin, K.M.; Read, Q.D.; Record, S.; Stark, S.C.; Serbin, S.P.; Zarnetske, P.L. Towards Mapping Biodiversity from above: Can Fusing Lidar and Hyperspectral Remote Sensing Predict Taxonomic, Functional, and Phylogenetic Tree Diversity in Temperate Forests? Glob. Ecol. Biogeogr. 2022, 31, 1440–1460. [Google Scholar] [CrossRef] [Scilit]
- Acebes, P.; Lillo, P.; Jaime-González, C. Disentangling LiDAR Contribution in Modelling Species–Habitat Structure Relationships in Terrestrial Ecosystems Worldwide. A Systematic Review and Future Directions. Remote Sens. 2021, 13, 3447. [Google Scholar] [CrossRef] [Scilit]
- Bruggisser, M.; Hollaus, M.; Kükenbrink, D.; Pfeifer, N. Comparison of forest structure metrics derived from uav lidar and als data. ISPRS Ann. Photogramm. Remote Sens. Spat. Inf. Sci. 2019, IV-2-W5, 325–332. [Google Scholar] [CrossRef] [Scilit]
- Vandendaele, B.; Fournier, R.A.; Vepakomma, U.; Pelletier, G.; Lejeune, P.; Martin-Ducup, O. Estimation of Northern Hardwood Forest Inventory Attributes Using UAV Laser Scanning (ULS): Transferability of Laser Scanning Methods and Comparison of Automated Approaches at the Tree- and Stand-Level. Remote Sens. 2021, 13, 2796. [Google Scholar] [CrossRef] [Scilit]
- Neuville, R.; Bates, J.S.; Jonard, F. Estimating Forest Structure from UAV-Mounted LiDAR Point Cloud Using Machine Learning. Remote Sens. 2021, 13, 352. [Google Scholar] [CrossRef] [Scilit]
- Lopatin, J.; Dolos, K.; Hernández, H.J.; Galleguillos, M.; Fassnacht, F.E. Comparing Generalized Linear Models and Random Forest to Model Vascular Plant Species Richness Using LiDAR Data in a Natural Forest in Central Chile. Remote Sens. Environ. 2016, 173, 200–210. [Google Scholar] [CrossRef] [Scilit]
- Walter, J.A.; Stovall, A.E.L.; Atkins, J.W. Vegetation Structural Complexity and Biodiversity in the Great Smoky Mountains. Ecosphere 2021, 12, e03390. [Google Scholar] [CrossRef] [Scilit]
- Helbach, J.; Frey, J.; Messier, C.; Mörsdorf, M.; Scherer-Lorenzen, M. Light Heterogeneity Affects Understory Plant Species Richness in Temperate Forests Supporting the Heterogeneity–Diversity Hypothesis. Ecol. Evol. 2022, 12, e8534. [Google Scholar] [CrossRef] [Scilit] [PubMed]
- Bricca, A.; Bonari, G.; Padullés Cubino, J.; Cutini, M. Effect of Forest Structure and Management on the Functional Diversity and Composition of Understorey Plant Communities. Appl. Veg. Sci. 2023, 26, e12710. [Google Scholar] [CrossRef] [Scilit]
- Chelli, S.; Bricca, A.; Cutini, M.; Campetella, G.; Cervellini, M.; Tsakalos, J.L.; Canullo, R. Large Standard Trees and Deadwood Promote Functional Divergence in the Understory of Beech Coppice Forests. For. Ecol. Manag. 2021, 494, 119324. [Google Scholar] [CrossRef] [Scilit]
- ARPA FVG-s.o.c. OSMER e GRN Osservatorio Meteorologico Regionale e Gestione Rischi Naturali c/o Protezione civile FVG, Il Clima Del Friuli-Venezia Giulia. 2023. Available online: https://www.arpa.fvg.it/temi/temi/meteo-e-clima/pubblicazioni/il-clima-del-friuli-venezia-giulia-2023/ (accessed on 25 April 2026).
- Alberti, G.; Peressotti, A.; Piussi, P.; Zerbi, G. Forest Ecosystem Carbon Accumulation during a Secondary Succession in the Eastern Prealps of Italy. For. Int. J. For. Res. 2008, 81, 1–11. [Google Scholar] [CrossRef] [Scilit]
- Panico, S.C.; Alberti, G.; Foscari, A.; Sciabbarrasi, G.L.; Tomao, A.; Incerti, G. Bacterial and Fungal Communities Respond Differently to Changing Soil Properties Along Afforestation Dynamic. Microb. Ecol. 2025, 88, 2. [Google Scholar] [CrossRef] [Scilit] [PubMed]
- Agnoletti, M.; Piras, F.; Venturi, M.; Santoro, A. Cultural Values and Forest Dynamics: The Italian Forests in the Last 150 Years. For. Ecol. Manag. 2022, 503, 119655. [Google Scholar] [CrossRef] [Scilit]
- Cimini, D.; Tomao, A.; Mattioli, W.; Barbati, A.; Corona, P. Assessing Impact of Forest Cover Change Dynamics on High Nature Value Farmland in Mediterranean Mountain Landscape. Ann. Silvic. Res. 2013, 37, 29–37. [Google Scholar] [CrossRef] [Scilit]
- Panico, S.C.; Sciabbarrasi, G.L.; Foscari, A.; Tomao, A.; Orzan, L.; Alberti, G.; Incerti, G. The Interplay Between Forest Succession and Soil Properties Shapes Microbial Community Dynamics After Land Abandonment. Eur. J. Soil Sci. 2026, 77, e70365. [Google Scholar] [CrossRef] [Scilit]
- Hill, R.A.; Broughton, R.K. Mapping the Understorey of Deciduous Woodland from Leaf-on and Leaf-off Airborne LiDAR Data: A Case Study in Lowland Britain. ISPRS J. Photogramm. Remote Sens. 2009, 64, 223–233. [Google Scholar] [CrossRef] [Scilit]
- Davison, S.; Donoghue, D.N.M.; Galiatsatos, N. The Effect of Leaf-on and Leaf-off Forest Canopy Conditions on LiDAR Derived Estimations of Forest Structural Diversity. Int. J. Appl. Earth Obs. Geoinf. 2020, 92, 102160. [Google Scholar] [CrossRef] [Scilit]
- Puletti, N.; Innocenti, S.; Guasti, M. A Co-Registration Approach between Terrestrial and UAV Laser Scanning Point Clouds Based on Ground and Trees Features. Ann. Silvic. Res. 2024, 49, 66–70. [Google Scholar] [CrossRef] [Scilit]
- Oksanen, J.; Simpson, G.L.; Blanchet, F.G.; Kindt, R.; Legendre, P.; Minchin, P.R.; O’Hara, R.B.; Solymos, P.; Stevens, M.H.H.; Szoecs, E.; et al. Vegan: Community Ecology Package; Version 2.6-8; R Foundation for Statistical Computing: Berkeley, CA, USA, 2001. [Google Scholar]
- Díaz, S.; Kattge, J.; Cornelissen, J.H.C.; Wright, I.J.; Lavorel, S.; Dray, S.; Reu, B.; Kleyer, M.; Wirth, C.; Prentice, I.C.; et al. The Global Spectrum of Plant Form and Function: Enhanced Species-Level Trait Dataset. Sci. Data 2022, 9, 755. [Google Scholar] [CrossRef] [Scilit] [PubMed]
- Díaz, S.; Kattge, J.; Cornelissen, J.H.C.; Wright, I.J.; Lavorel, S.; Dray, S.; Reu, B.; Kleyer, M.; Wirth, C.; Colin Prentice, I.; et al. The Global Spectrum of Plant Form and Function. Nature 2016, 529, 167–171. [Google Scholar] [CrossRef] [Scilit] [PubMed]
- Pakeman, R.J.; Quested, H.M. Sampling Plant Functional Traits: What Proportion of the Species Need to Be Measured? Appl. Veg. Sci. 2007, 10, 91–96. [Google Scholar] [CrossRef]
- Májeková, M.; Paal, T.; Plowman, N.S.; Bryndová, M.; Kasari, L.; Norberg, A.; Weiss, M.; Bishop, T.R.; Luke, S.H.; Sam, K.; et al. Evaluating Functional Diversity: Missing Trait Data and the Importance of Species Abundance Structure and Data Transformation. PLoS ONE 2016, 11, e0149270. [Google Scholar] [CrossRef] [Scilit] [PubMed]
- Boyle, B.; Hopkins, N.; Lu, Z.; Raygoza Garay, J.A.; Mozzherin, D.; Rees, T.; Matasci, N.; Narro, M.L.; Piel, W.H.; Mckay, S.J.; et al. The Taxonomic Name Resolution Service: An Online Tool for Automated Standardization of Plant Names. BMC Bioinform. 2013, 14, 16. [Google Scholar] [CrossRef] [Scilit] [PubMed]
- The World Flora Online Consortium; Elliott, A.; Hyam, R.; Watson, M.; Wrankmore, E.; Hartley, H.; Krieger, J.; Gandhi, K.; Abad-Brotons, J.; Acuña, R.; et al. World Flora Online Plant List December 2025; Zenodo: Geneva, Switzerland, 2025. [Google Scholar] [CrossRef]
- Jin, Y.; Qian, H.V. PhyloMaker: An R Package That Can Generate Very Large Phylogenies for Vascular Plants. Ecography 2019, 42, 1353–1359. [Google Scholar] [CrossRef] [Scilit]
- Carmona, C.P.; Pavanetto, N.; Puglielli, G. Funspace: An R Package to Build, Analyse and Plot Functional Trait Spaces. Divers. Distrib. 2024, 30, e13820. [Google Scholar] [CrossRef] [Scilit]
- Carmona, C.P.; de Bello, F.; Mason, N.W.H.; Lepš, J. Trait Probability Density (TPD): Measuring Functional Diversity across Scales Based on TPD with R. Ecology 2019, 100, e02876. [Google Scholar] [CrossRef] [Scilit] [PubMed]
- Stewart, K.; Carmona, C.P.; Clements, C.; Venditti, C.; Tobias, J.A.; González-Suárez, M. Functional Diversity Metrics Can Perform Well with Highly Incomplete Data Sets. Methods Ecol. Evol. 2023, 14, 2856–2872. [Google Scholar] [CrossRef] [Scilit]
- Toivonen, J.; Kangas, A.; Maltamo, M.; Kukkonen, M.; Packalen, P. Assessing Biodiversity Using Forest Structure Indicators Based on Airborne Laser Scanning Data. For. Ecol. Manag. 2023, 546, 121376. [Google Scholar] [CrossRef] [Scilit]
- Neudam, L.; Annighöfer, P.; Seidel, D. Exploring the Potential of Mobile Laser Scanning to Quantify Forest Structural Complexity. Front. Remote Sens. 2022, 3, 861337. [Google Scholar] [CrossRef] [Scilit]
- Favrichon, S.; Lee, J.; Yang, Y.; Dalagnol, R.; Wagner, F.; Sagang, L.B.; Saatchi, S. Monitoring Changes of Forest Height in California. Front. Remote Sens. 2025, 5, 1459524. [Google Scholar] [CrossRef] [Scilit]
- Zhang, B.; Fischer, F.J.; Prober, S.M.; Yeoh, P.B.; Gosper, C.R.; Zdunic, K.; Jucker, T. Robust Retrieval of Forest Canopy Structural Attributes Using Multi-Platform Airborne LiDAR. Remote Sens. Ecol. Conserv. 2024, 10, 725–742. [Google Scholar] [CrossRef] [Scilit]
- van Ewijk, K.Y.; Treitz, P.M.; Scott, N.A. Characterizing Forest Succession in Central Ontario Using Lidar-Derived Indices. Photogramm. Eng. Remote Sens. 2011, 77, 261–269. [Google Scholar] [CrossRef] [Scilit]
- Ross, C.W.; Loudermilk, E.L.; O’Brien, J.J.; Flanagan, S.A.; McDaniel, J.; Aubrey, D.P.; Lowe, T.; Hiers, J.K.; Skowronski, N.S. Lidar-Derived Estimates of Forest Structure in Response to Fire Frequency. Fire Ecol. 2024, 20, 44. [Google Scholar] [CrossRef] [Scilit]
- Hartig, F. DHARMa: Residual Diagnostics for Hierarchical (Multi-Level/Mixed) Regression Models; Version 0.4.7; CRAN: Berkeley, CA, USA, 2024. [Google Scholar]
- Lenth, R.V.; Piaskowski, J. Emmeans: Estimated Marginal Means, Aka Least-Squares Means; Version 2.0.3; CRAN: Berkeley, CA, USA, 2017. [Google Scholar]
- Stoffel, M.A.; Nakagawa, S.; Schielzeth, H. partR2: Partitioning R2 in Generalized Linear Mixed Models. PeerJ 2021, 9, e11414. [Google Scholar] [CrossRef] [Scilit] [PubMed]
- Legendre, P.; Anderson, M.J. Distance-Based Redundancy Analysis: Testing Multispecies Responses in Multifactorial Ecological Experiments. Ecol. Monogr. 1999, 69, 491–511. [Google Scholar] [CrossRef]
- R Core Team. R: A Language and Environment for Statistical Computing; R Foundation for Statistical Computing: Vienna, Austria, 2024; Available online: https://www.R-project.org/ (accessed on 21 June 2026).
- Orzan, L.; Tomao, A.; Antoniella, G.; Bonari, G.; Casolo, V.; Chiti, T.; Cingano, P.; Foscari, A.; Incerti, G.; Panico, S.C.; et al. As Forests Reclaim the Land: Latitudinal Variations in Carbon-Biodiversity Trade-Offs under Natural Forest Expansion in Italy. For. Ecol. Manag. 2026, 605, 123527. [Google Scholar] [CrossRef] [Scilit]
- Grime, J.P. Competitive Exclusion in Herbaceous Vegetation. Nature 1973, 242, 344–347. [Google Scholar] [CrossRef] [Scilit]
- Ellenberg, H. Vegetation Ecology of Central Europe; Cambridge University Press: Cambridge, UK, 1988; ISBN 978-0-521-23642-3. [Google Scholar]
- Sabatini, F.; Jiménez-Alfaro, B.; Burrascano, S.; Blasi, C. Drivers of Herb-Layer Species Diversity in Two Unmanaged Temperate Forests in Northern Spain. Community Ecol. 2014, 15, 147–157. [Google Scholar] [CrossRef] [Scilit]

Disclaimer/Publisher’s Note: The statements, opinions and data contained in all publications are solely those of the individual author(s) and contributor(s) and not of MDPI and/or the editor(s). MDPI and/or the editor(s) disclaim responsibility for any injury to people or property resulting from any ideas, methods, instructions or products referred to in the content. |
© 2026 by the authors. Licensee MDPI, Basel, Switzerland. This article is an open access article distributed under the terms and conditions of the Creative Commons Attribution (CC BY) license.