


Highlights
What are the main findings?
- A robust fixed-cost framework was developed using rotated-frame fixed-order quadrature to approximate the intersection area of arbitrarily rotated ellipses.
- In the BAMFORESTS tree-crown delineation case study, ellipse-proxy overlap preserved peak F1, modestly shifted NMS behavior toward lower thresholds, and achieved runtime comparable to AABB- and OBB-based overlap.
What are the implications of the main findings?
- The proposed framework provides a more accurate and faster alternative to polygonal ellipse clipping within the tested resolution range.
- The proposed framework enables efficient use of elliptical object support during duplicate suppression, candidate filtering, and other repeated overlap-based post-processing steps.
Abstract
The intersection area between two arbitrarily rotated ellipses is a recurring geometric primitive in imaging, computer vision, and robotics. In the general case, its evaluation is often associated with intersection-point recovery, topology-dependent case handling, adaptive refinement, or dense boundary approximation. This study presents a fixed-cost computational framework for ellipse–ellipse intersection based on a rotated-frame slice formulation. A coordinate-frame rotation expresses one ellipse in axis-aligned form while representing the second as a general conic. This yields a hybrid formulation that reduces the intersection area to a one-dimensional overlap integral of vertical slice height over the admissible horizontal interval. The integral is evaluated using fixed-order quadrature, with optional sine mapping to improve conditioning near grazing configurations. Numerical evaluation on 100,000 synthetic ellipse pairs shows that the proposed formulation reaches a low-error regime earlier than polygonal approximation while remaining substantially faster across the tested range. The formulation is further examined through a tree-crown delineation case study on the BAMFORESTS dataset, a benchmark forest dataset of very-high-resolution UAV imagery. In this case study, ellipse proxies derived from axis-aligned and oriented bounding box detections are used for overlap computation during non-maximum suppression (NMS). Using ellipse-proxy overlap during NMS preserves nearly the same peak F1 score of 0.785 while modestly shifting NMS behavior toward lower thresholds and producing slightly broader near-peak intervals.
1. Introduction
Elliptical representations arise in imaging and computer vision problems in which object support, spatial extent, shape, or uncertainty regions must be described in a compact parametric form. In microscopy, medical image analysis, and related delineation tasks, overlapping structures are often approximated by ellipses for segmentation, counting, and footprint estimation, while in industrial vision and ellipse-aware object detection, ellipses are used to model smooth anisotropic objects under clutter, occlusion, or low signal-to-noise conditions [1,2,3,4,5]. Beyond imaging, elliptical overlap also appears in geographic and engineering applications [6,7]. In such settings, the intersection area between two ellipses becomes a recurring geometric primitive for footprint comparison, instance association, delineation-oriented consolidation, and geometry-aware post-processing. Although the problem appears elementary at first glance, determining the intersection area of two ellipses in closed form remains difficult in the general case. The boundary of the common region is defined by the interaction of two quadratic curves, and solving for the intersection points leads to a quartic equation whose real roots, when they exist, may produce several distinct geometric regimes with up to four intersection points [8,9].
The ellipse–ellipse intersection problem has been addressed through several methodological classes, each reflecting a different compromise between geometric exactness, numerical robustness, and computational cost. Exact and semi-analytical formulations recover the intersection points explicitly and reconstruct the intersection area from conic arcs and auxiliary polygonal components, often through Gauss–Green-based area constructions that preserve the continuous boundary geometry [10,11]. Their rigor, however, depends on stable root recovery and correct topology classification, both of which may become numerically sensitive near tangency and other nearly degenerate configurations under finite-precision arithmetic. Polygonal and polyarc approximations replace each ellipse by a sampled boundary representation, determine the overlap by clipping procedures such as those of Sutherland–Hodgman [12], Weiler–Atherton [13], Vatti [14], or Greiner–Hormann [15], and evaluate the resulting area using the shoelace formula [16]. Although straightforward to implement, these approximations converge only gradually with boundary refinement, with smooth-boundary accuracy typically improving on the order of with the number of segments [17]. Numerical integration approaches instead reduce the problem to a one-dimensional overlap integral over the shared horizontal domain and evaluate the associated overlap-height function using adaptive Simpson or related Newton–Cotes-type procedures [18,19,20,21]. These methods avoid explicit boundary tessellation and may provide high accuracy for well-behaved configurations, but their numerical behavior can still deteriorate for highly eccentric ellipses, grazing contact, or arrangements that induce steep endpoint variation in the integrand [22,23]. Algebraic–geometric formulations operate directly on the implicit conic equations, eliminate one variable to obtain a quartic polynomial, and reconstruct the intersection area from algebraic segments or level-set expressions [24,25,26,27]. While mathematically rigorous, they inherit the numerical fragility of higher-degree polynomial root solving near degeneracy. Other approximations trade geometric fidelity for implementation simplicity or hardware efficiency. Monte Carlo estimators [28,29,30,31] are conceptually simple and readily parallelized, but their slow convergence and high variance limit their suitability for precision-oriented applications. Raster-based methods approximate each ellipse on a binary grid and estimate overlap from intersecting pixels or sub-pixel corrections, but their accuracy remains strongly resolution-dependent and degrades rapidly on coarse lattices [32,33,34]. Morphological and convolution-based representations likewise operate on discretized indicator functions, for example, through elliptical structuring elements, and may benefit from Fast Fourier Transform (FFT)-based acceleration; however, when applied to ellipse overlap, they remain fundamentally discrete and therefore sacrifice direct analytical correspondence with the underlying conic geometry [34,35,36]. Transformation-based methods map one or both ellipses into more convenient canonical domains, such as a unit circle or other normalized form, to simplify subsequent analysis or improve conditioning, although such reductions are typically most effective only under specific symmetry assumptions or restricted parameter regimes [22,37].
Despite the breadth of the existing literature, most formulations for the overlap of arbitrarily rotated ellipses achieve generality through explicit intersection recovery, topology-dependent case distinction, adaptive refinement, polygonal clipping, or repeated algebraic elimination. However, the main requirement is different in many computer-vision applications: the overlap must be evaluated through a numerically stable procedure whose computational cost remains bounded and predictable from one ellipse pair to the next, even if this entails a slight loss of precision. This distinction becomes particularly important when overlap evaluation is embedded within repetitive, iterative, or threshold-based workflows, such as robotics, feature extraction, and object detection. In such workflows, configuration-dependent runtime caused by adaptive integration, case branching, or repeated root solving may become operationally undesirable. Accordingly, this study introduces a computational framework for approximating the intersection area between two ellipses using a rotated-frame fixed-order quadrature formulation, as detailed in Section 2. The formulation rotates the coordinate frame to obtain direct slice bounds for one ellipse, represents the second ellipse as a conic, and evaluates the resulting overlap-height integral using a predetermined number of quadrature nodes. The numerical behavior of the proposed framework is examined in Section 3 using a synthetic benchmark of 100,000 ellipse pairs against a polygonal approximation. Its practical use in repeated imaging post-processing is then evaluated in Section 4 through a tree-crown delineation case study on the BAMFORESTS dataset, a benchmark forest dataset of very-high-resolution UAV imagery [38]. In this case study, ellipse proxies derived from axis-aligned bounding box (AABB) and oriented bounding box (OBB) detector outputs are used for overlap computation during non-maximum suppression (NMS). Section 5 discusses the numerical behavior, runtime characteristics, post-processing implications, limitations, and possible extensions of the proposed computational framework. Finally, Section 6 concludes the study.
2. Computational Framework: Rotated-Frame Fixed-Order Quadrature
The proposed computational framework, illustrated in Figure 1, estimates the intersection area of two arbitrarily rotated ellipses by reducing the problem to a one-dimensional overlap integral. This integral is then approximated using a fixed-order quadrature rule. The formulation begins with the geometric definition of a reference ellipse and a candidate ellipse in the global Cartesian frame, from which the two-dimensional intersection-area computation is first reduced to an overlap-height representation over a finite horizontal interval, as described in Section 2.1. The coordinate system is then rotated so that the reference ellipse becomes axis-aligned in the transformed frame, while the candidate ellipse remains rotated, as detailed in Section 2.2. This rotated representation allows the vertical slice bounds of both ellipses to be obtained analytically and yields a hybrid formulation in which the intersection area is expressed as a one-dimensional overlap integral over the admissible horizontal interval, as developed in Section 2.3. The resulting integral is then approximated using a direct fixed-order rule in Section 2.4. The boundary behavior of the corresponding overlap-height function and its implications for numerical conditioning near grazing configurations are then examined in Section 2.5. To improve numerical conditioning near such configurations, Section 2.6 introduces a sine-mapped variable substitution to redistribute the quadrature nodes toward the interval boundaries, where the integrand varies most rapidly. Moreover, pseudocode of the proposed framework is provided in Appendix A, including the optional sine-mapping configuration.
Figure 1.
Workflow of the proposed rotated-frame fixed-order quadrature framework. The ellipse pair is reduced to a vertical overlap-height formulation and expressed in a reference-aligned frame, where the reference ellipse is axis-aligned and the candidate ellipse is represented as a conic. The resulting integral is evaluated using fixed-order quadrature, with optional sine mapping.
2.1. Reduction of the Intersection Problem to a One-Dimensional Height Function
Let the reference ellipse and the candidate ellipse be defined by their centers (, ), semi-axes (, ), and orientations , where , as illustrated in Figure 2a. In the global Cartesian frame, each ellipse satisfies the rotated implicit equation
Figure 2.
Example problem in the global frame. (a) Illustration of two arbitrarily rotated ellipses. (b) Illustration of the intersection area of two arbitrarily rotated ellipses, showing the one-dimensional integral representation over the horizontal domain [L, R].
The intersection area is expressed as the integral of the vertical overlap height over the horizontal interval in which the two ellipses may overlap. Let and denote, respectively, the upper and lower vertical slice boundaries of ellipse at abscissa , whenever such a slice exists. The instantaneous overlap height is then defined as
Accordingly, the intersection area is written as
where [, ] denotes the horizontal interval of potential overlap. For an arbitrarily rotated ellipse, the half-width of its horizontal projection is
and the corresponding projection interval is [, ]. Therefore, the horizontal interval of potential overlap between and is
The reduction of the two-dimensional intersection-area computation to a one-dimensional overlap integral over the horizontal interval [, ] is illustrated in Figure 2b.
If , the ellipses are horizontally disjoint, and the intersection area is zero. Equation (3) therefore reduces the two-dimensional intersection-area computation to the evaluation of a one-dimensional overlap-height function over [, ]. However, in the global frame, the explicit vertical slice bounds of both ellipses remain coupled to their orientations. To simplify their evaluation, the domain is rotated so that the reference ellipse becomes axis-aligned.
2.2. Rotation of the Integration Domain
To decouple the vertical slice bounds of the reference ellipse from its orientation, the integration domain is rotated by so that the reference ellipse is aligned with the coordinate axes. Denoting the rotated-frame coordinates as (, ), the transformed coordinates are obtained from
Under this transformation, the centers of the two ellipses become
and the candidate ellipse assumes the relative orientation
The reference ellipse is therefore transformed into , while the candidate ellipse becomes , as illustrated in Figure 3a.
Figure 3.
Example problem in the rotated frame. (a) Ellipse pair after coordinate-frame rotation by , where the reference ellipse is axis-aligned and the candidate ellipse retains the relative orientation . (b) Corresponding one-dimensional representation of the intersection area over the rotated-frame horizontal domain [, ].
Since rigid rotation preserves area, the intersection area may be written equivalently as
where [, ] denotes the horizontal interval of potential overlap in the rotated frame and denotes the overlap-height function defined there, as shown in Figure 3b. In this frame, the reference ellipse becomes axis-aligned, while the candidate ellipse remains rotated. This yields a hybrid representation in which the two ellipses are described in compatible analytical forms.
2.3. Hybrid Representation in the Rotated Frame
Because is axis-aligned in the rotated frame, it satisfies the standard implicit equation
Therefore, its horizontal projection is given by [, ], and for any within this interval, its upper and lower boundaries are
The candidate ellipse , on the other hand, is represented as a general quadratic conic in the rotated frame,
where the quadratic coefficients are obtained from the candidate ellipse geometry in the rotated frame. Let
Then the conic coefficients are written as
The horizontal half-width of in the rotated frame is
and its horizontal projection is [, ]. The horizontal interval of potential overlap in the rotated frame is therefore given by
If , the ellipses are horizontally disjoint in the rotated frame, and the intersection area is zero.
For any , fixing in Equation (13) yields a quadratic equation in ,
whose discriminant is
If , the candidate ellipse contributes no real vertical slice at that abscissa. If , the slice degenerates to a single point and contributes zero overlap height. Otherwise, its slice bounds are
The overlap-height function in the rotated frame is then defined as
Using the slice bounds in Equations (11), (12), (22) and (23), the overlap-height function in the rotated frame is fully specified by Equation (24). Consequently, the rotated-frame overlap integral introduced in Equation (9) becomes explicitly defined. At this stage, the two-dimensional intersection-area computation has been reduced to the integration of a slice-based overlap-height function over a finite interval, where the reference ellipse contributes axis-aligned square-root boundaries and the candidate ellipse contributes conic slice boundaries obtained from a quadratic equation.
2.4. Fixed-Order Quadrature Approximation of the Overlap Integral
Equation (9) reduces the intersection-area computation to the numerical evaluation of a one-dimensional overlap integral over the finite interval [, ], where a fixed-order quadrature rule may be applied directly to approximate this area. In the present problem, however, the overlap-height function may change sharply near the interval endpoints, particularly in grazing or near-tangential configurations. These steep local gradients arise because the reference ellipse boundaries contain square-root terms and the candidate ellipse boundaries are governed by the discriminant of the conic slice equation. As a result, fixed quadrature nodes defined directly on [, ] may under-sample the endpoint regions in which the strongest variation occurs.
Representative fixed-order quadrature rules of the canonical interval [, ] include the Gauss–Legendre (GL) quadrature rule, the Clenshaw–Curtis (CC) quadrature rule, the composite Simpson (CS) rule, and the composite midpoint (CM) rule. Their node placement and weighting differ, and these differences influence how effectively the affinely mapped approximation samples the endpoint regions of the physical interval [, ]. Moreover, the same transformed integral may also be evaluated by higher-precision adaptive procedures, such as adaptive Simpson integration, but such methods fall outside the scope of the present fixed-order study. Figure 4a shows an example of uniformly distributed nodes within the interval [, ].
Figure 4.
Example problem with direct fixed-order quadrature. (a) Illustration of the intersection area of two arbitrarily rotated ellipses after coordinate-frame rotation by , showing the quadrature nodes over the horizontal domain [, ]. (b) Illustration of the corresponding fixed-order approximation of the overlap-height function over the horizontal domain [, ].
Let denote the nodes and weights of a chosen -point fixed-order quadrature rule on the canonical interval . Using the standard affine transformation
with Jacobian
Equation (9) becomes
Applying the chosen fixed-order quadrature rule to Equation (27) gives the direct approximation
For a given quadrature order , Equation (28) approximates the intersection area using a fixed number of function evaluations, where each evaluation is represented by a vertical slice within the intersection region, as shown in Figure 4b. However, because the node distribution is determined directly by the chosen quadrature rule on the affinely mapped interval, the endpoint regions may still receive insufficient sampling in configurations where the overlap-height function varies most rapidly.
2.5. Smoothness and Boundary Behavior of the Overlap-Height Function
After coordinate-frame rotation by , the reference ellipse is axis-aligned in (, ) and admits analytic slice bounds for , as given by Equations (11) and (12). In the same rotated frame, the candidate ellipse is represented by the conic , as given in Equation (13). For fixed , the slice bounds of follow from a quadratic equation in with discriminant , as defined in Equation (21), and are given, when , by Equations (22) and (23). Therefore, the overlap-height function , defined as the common vertical height between [, ] and [, ], is piecewise analytic on any open sub-interval where (i) , (ii) , and (iii) the active upper and lower envelopes remain unchanged. Consequently, is on each such sub-interval, whereas non-analytic behavior is confined to isolated envelope-switching abscissas and to slice-activation endpoints where either the reference-ellipse square root vanishes or the conic discriminant satisfies . These endpoint singularities govern the local variation of the integrand near the interval boundaries, although their direct sampling depends on the chosen quadrature rule.
In near-tangent configurations, steep gradients arise from both boundary mechanisms. For , the derivative magnitude diverges as , such that
causing large local variation in near the effective overlap endpoints. In addition, for , differentiating Equations (22) and (23) yields
where
Hence, and typically grow like as . This introduces discriminant-driven endpoint steepness even when is locally well-conditioned and represents a primary source of numerical sensitivity in the rotated conic-slice formulation.
2.6. Sine-Mapped Rotated-Frame Fixed-Order Quadrature
To improve numerical conditioning near grazing configurations, an optional sine-based variable substitution is introduced to redistribute the quadrature nodes toward the boundaries of the overlap interval. The transformation is defined as
which maps the canonical interval [, ] to the physical interval [, ]. The associated Jacobian is
Substituting Equations (34) and (35) into Equation (9) yields the transformed integral
This transformation preserves the fixed-order character of the numerical approximation while modifying the node distribution so that more evaluation points are placed near the interval endpoints. The transformation can therefore improve numerical conditioning in cases where the overlap-height function exhibits strong boundary variation. The effect of the sine mapping on uniformly distributed nodes is illustrated in Figure 5a.
Figure 5.
Example problem with sine-mapped fixed-order quadrature. (a) Illustration of the intersection area of two arbitrarily rotated ellipses after coordinate-frame rotation by , showing the sine-mapped quadrature nodes over the horizontal domain [, ]. (b) Illustration of the corresponding sine-mapped approximation of the overlap-height function over the horizontal domain [, ].
Let denote the nodes and weights of a chosen -point fixed-order quadrature rule on [, ]. Applying that rule to Equation (36) gives the sine-mapped fixed-order approximation
The sine term maps each canonical node from [, ] to the physical interval [, ], while the cosine term arises from the Jacobian of the transformation and compensates for the local stretching and compression introduced by the mapping. For a given quadrature order , Equation (37) therefore evaluates the intersection area using a fixed number of function evaluations, while concentrating sampling effort near the interval boundaries where the overlap-height function varies more rapidly. The resulting sine-mapped approximation of the overlap-height function is illustrated in Figure 5b.
3. Numerical Evaluation of the Proposed Overlap Formulation
The numerical evaluation is conducted on a synthetic benchmark of 100,000 rotated ellipse pairs generated using the implementation developed by Hughes and Chraibi [11,39]. A dense polygonal approximation with 20,480 boundary vertices per ellipse is used as the numerical reference. Figure 6 and Figure 7 summarize the results over resolutions from 8 to 1024, corresponding to quadrature nodes and polygonal vertices, where the polygonal approximation is compared against the fixed-order quadrature variants in the affine domain and under sine mapping, respectively. In each figure, panel (a) reports the mean absolute relative error, panel (b) reports the standard deviation of the absolute relative error, panel (c) reports the p95 of the absolute relative error, and panel (d) reports the total runtime across the full benchmark. All experiments were executed on an Intel Core i7-14650HX CPU (Intel Corporation, Santa Clara, CA, USA) with 16 GB RAM, and no GPU acceleration was used during this evaluation. Polygonal approximations were computed using uniform angular sampling, and intersection areas were obtained using a vectorized polygon-clipping implementation provided by Python 3’s Shapely 2.1.2 package. The proposed formulation variants were evaluated in Python 3 using the Numba 0.61.2 package to precompile the corresponding kernels and reduce Python-level overhead.
Figure 6.
Synthetic benchmark results in the affine domain for the polygonal approximation and fixed-order quadrature variants over resolutions 8–1024 across 100,000 randomly generated ellipse pairs, showing (a) mean absolute relative error, (b) standard deviation of the absolute relative error, (c) p95 of the absolute relative error, and (d) total runtime.
Figure 7.
Synthetic benchmark results in the sine-mapped domain for the polygonal approximation and fixed-order quadrature variants over resolutions 8–1024 across 100,000 randomly generated ellipse pairs, showing (a) mean absolute relative error, (b) standard deviation of the absolute relative error, (c) p95 of the absolute relative error, and (d) total runtime.
Figure 6a shows that all evaluated methods exhibit a monotonic reduction in error as the numerical resolution increases in the direct affine domain, i.e., for the proposed formulation without sine mapping. The polygonal approximation exhibits the expected steady decay in error, decreasing from 18.419% at 8 vertices to 0.00197% at 1024 vertices. The affine quadrature variants follow the same monotonic trend, but with substantially lower error over the same resolution range. At the lowest tested order, 8, affine GL and affine CC already reduce the mean absolute relative error to 0.336% and 0.481%, respectively, while affine CS and affine CM remain less accurate at 1.836% and 1.377%. As the order increases, the separation between the quadrature rules becomes clearer. From order 32 onward, affine GL and affine CC remain the strongest affine variants, and their curves nearly overlap, while affine CS and affine CM converge more slowly. At 1024 nodes, affine GL and affine CC reach 2.18 × 10⁻⁵% and 2.26 × 10⁻⁵% mean absolute relative error, respectively, whereas affine CS and affine CM remain at 1.13 × 10⁻³% and 8.51 × 10⁻⁴%.
Figure 6b,c show the same global contraction in dispersion and upper-tail error. The polygonal approximation reduces the standard deviation from 15.93% at 8 vertices to 0.0333% at 1024 vertices, and the p95 from 49.37% to 0.00340%. The affine quadrature variants again contract more rapidly. At low orders, affine CS and affine CM show the smallest dispersion, with standard deviations of 2.79% and 2.27% at 8 nodes, respectively, whereas affine GL and affine CC provide the tighter upper tail, with p95 values of 0.583% and 0.819%, respectively. As the order increases, GL and CC remain the strongest affine variants in the tail statistics. At 1024 nodes, affine GL and affine CC reduce the standard deviation to 4.76 × 10⁻⁴% and 6.32 × 10⁻⁴% and the p95 to 4.11 × 10⁻⁵% and 4.16 × 10⁻⁵%, whereas affine CS and affine CM remain at 9.11 × 10⁻⁴% and 5.75 × 10⁻⁴% in standard deviation and 1.63 × 10⁻³% and 1.20 × 10⁻³% in p95. Thus, in the affine setting, the decrease in mean error is accompanied by a comparable contraction in dispersion and upper-tail error.
The runtime behavior in Figure 6d follows a different pattern. The polygonal approximation starts from a relatively high baseline cost and increases gradually, from 6.62 s at 8 vertices to 22.21 s at 1024 vertices. In contrast, all affine quadrature variants begin with substantially lower runtimes, ranging between 0.0182 s and 0.0191 s at order 8, and then increase almost proportionally with order. Across the full tested range, the quadrature methods are simultaneously more accurate and faster than the polygonal approximation. For example, at 128, affine GL achieves 0.00141% mean absolute relative error in 0.123 s, whereas the polygonal baseline at the same nominal resolution remains at 0.117% and requires 8.88 s. Even at the highest tested order, the affine quadrature variants remain substantially less expensive than the polygonal approximation. By 1024 nodes, affine GL and affine CC require 0.559 s and 0.567 s, respectively, while the polygonal approximation requires 22.21 s. Thus, in the affine domain, the quadrature variants dominate the polygonal approximation throughout the tested range, providing both lower error and lower runtime.
Figure 7a shows the corresponding results after applying sine mapping to the quadrature rules. The overall convergence pattern remains monotonic for all methods, but the relative ordering among the quadrature variants changes. At low orders, sine mapping clearly benefits the more uniformly distributed rules. The strongest example is the composite midpoint rule, whose mean absolute relative error decreases from 1.377% in the affine domain to 0.326% under sine mapping at 8 nodes, and from 0.474% to 0.0837% at 16 nodes. A similar effect is observed for composite Simpson, whose mean absolute relative error decreases from 1.836% to 0.485% at 8 nodes and from 0.637% to 0.133% at 16 nodes. As a result, the best low-order sine-mapped variants are no longer GL and CC, but CM and CS. At 8 nodes, sine-mapped CM gives the lowest mean error among all sine-mapped rules at 0.326%, followed by sine-mapped CS at 0.485%. This behavior persists into the moderate-order range. At 32 nodes, sine-mapped CM reaches 0.0207%, which is essentially identical to affine GL at the same nominal order, and at 64 nodes it reaches 0.00483%, again matching the strongest affine results. By 128 nodes, all sine-mapped variants have entered a low-error regime, with CM at 0.00144%, CS at 0.00204%, GL at 0.00278%, and CC at 0.00285%.
Figure 7b,c show that the same shift is clearest in the upper-tail statistics, while the standard deviation follows the same global decline with a less uniform low-order ranking. At 8 nodes, sine-mapped CM gives the lowest p95 among all sine-mapped rules at 0.654%, followed by sine-mapped CS at 1.04%, whereas sine GL and sine CC remain at 1.11% and 1.63%. This ordering persists into the moderate-order range. At 64 nodes, sine-mapped CM reaches a p95 of 9.61 × 10⁻³%, compared with 1.55 × 10⁻²% for CS, 1.75 × 10⁻²% for GL, and 1.85 × 10⁻²% for CC. The standard deviation also contracts monotonically, but the ranking is more mixed at low and moderate orders. By 1024, sine-mapped CS and sine-mapped CM provide the smallest dispersion, at 4.89 × 10⁻⁴% and 5.17 × 10⁻⁴%, while sine GL and sine CC remain at 1.03 × 10⁻³% and 8.73 × 10⁻⁴%. Thus, under sine mapping, the strongest gains appear most clearly in the upper tail, where CM and CS dominate at low and moderate orders, while the standard-deviation curves converge more gradually toward the same ranking.
The runtime curves in Figure 7d remain close to those in the affine case. At 8 nodes, the sine-mapped quadrature variants require between 0.0184 s and 0.0194 s and remain far below the polygonal baseline of 6.62 s. Their cost then increases steadily with resolution, reaching approximately 0.576 s for sine GL, 0.594 s for sine CC, 0.588 s for sine CS, and 0.567 s for sine CM at 1024 nodes. Therefore, the principal effect of sine mapping in the tested range is observed in the error curves rather than in runtime. In particular, sine mapping leaves the runtime order essentially unchanged while shifting the accuracy ranking among the quadrature rules, with the largest gains occurring for CS and CM at low and intermediate orders.
Taken together, Figure 6 and Figure 7 show that the fixed-order quadrature variants reach low-error regimes earlier than the polygonal approximation while maintaining substantially lower runtime across the tested range. The main difference between the affine and sine-mapped formulations lies in the ranking of the quadrature rules: GL and CC are strongest in the affine domain, whereas CS and especially CM become more competitive under sine mapping at low and moderate orders. Across both formulations, the reduction in mean error is accompanied by corresponding reductions in dispersion and upper-tail error.
Stress Analysis Under High-Eccentricity and Low-Overlap Configurations
To further evaluate the numerical behavior of the fixed-order formulation under difficult geometric configurations, two stress subsets were extracted from the 100,000-pair ellipse benchmark. The first subset targets high-eccentricity configurations. For each ellipse pair, the maximum aspect ratio was computed across the two ellipses, and cases satisfying with positive reference intersection area were retained. This threshold corresponds to a minimum classical ellipse eccentricity of approximately 0.943 and therefore represents clearly elongated ellipse geometries [40]. The resulting high-eccentricity subset contains 1032 ellipse pairs. The second subset targets low-overlap, grazing-like configurations. For each pair, the reference IoU was computed using the high-resolution polygonal reference intersection area, and cases satisfying were retained. This subset contains 4120 ellipse pairs and represents cases where the common intersection region is small but nonzero. The polygonal approximation and the fixed-order quadrature variants were evaluated over the same resolution range used in the main benchmark, from 8 to 1024 vertices or quadrature nodes. Figure 8 reports the high-eccentricity results, while Figure 9 reports the low-overlap results.
Figure 8.
Stress analysis under high-eccentricity configurations , showing (a) mean absolute relative error under affine mapping, (b) p95 absolute relative error under affine mapping, (c) mean absolute relative error under sine mapping, and (d) p95 absolute relative error under sine mapping.
Figure 9.
Stress analysis under low-overlap, grazing-like configurations , showing (a) mean absolute relative error under affine mapping, (b) p95 absolute relative error under affine mapping, (c) mean absolute relative error under sine mapping, and (d) p95 absolute relative error under sine mapping.
Figure 8a shows that the mean absolute relative error decreases with increasing order for the high-eccentricity subset. The polygonal approximation follows the same decay pattern observed in the full benchmark, decreasing from 20.74% at 8 vertices to 0.00312% at 1024 vertices. The affine quadrature variants remain substantially more accurate over the tested range. The affine GL configuration decreases from 0.500% at to 0.026% at , 0.007% at , and at . Figure 8b shows the same contraction in upper-tail error. For affine GL, the p95 absolute relative error decreases from 1.756% at to 0.127% at , 0.026% at , and 0.002% at . These results indicate that high eccentricity alone does not lead to an uncontrolled increase in approximation error.
Figure 8c,d show the corresponding behavior under sine mapping for the high-eccentricity subset. The sine-mapped quadrature variants also decrease consistently with increasing order, although the low-order ranking differs from the affine case. At low orders, sine-mapped GL and CC exhibit larger mean and p95 errors than their affine counterparts, while CS and CM remain more competitive. As the order increases, the differences between the mappings become small, and the sine-mapped variants also reach low-error regimes. Therefore, the high-eccentricity subset follows the same general pattern observed in the full benchmark: increasing the quadrature order reduces both average and upper-tail error.
Figure 9a shows that the low-overlap subset is more demanding at low numerical orders. This is expected because the intersection region is narrow in these configurations. The polygonal approximation decreases from 59.33% at 8 vertices to 0.0210% at 1024 vertices. The affine quadrature variants again converge more rapidly. For affine GL, the mean absolute relative error decreases from 4.121% at to 0.290% at , 0.064% at , and 0.005% at . Figure 9b shows a similar reduction in the upper tail, with the affine GL p95 error decreasing from 12.915% at to 0.847% at , 0.218% at , and 0.015% at . Thus, low-overlap configurations mainly affect the low-order approximation regime, while moderate and high orders remain stable.
Figure 9c,d show the sine-mapped results for the low-overlap subset. The same decreasing trend is observed as the order increases, but the low-order errors are generally higher than in the affine case for several quadrature rules. This behavior indicates that the sine mapping does not uniformly improve the most grazing-like configurations at very low order. However, the errors contract rapidly as the order increases, and the sine-mapped variants also enter a low-error regime at moderate and high orders. Overall, the stress analysis shows that both high-eccentricity and low-overlap cases follow the same main numerical trend as the full benchmark. The largest deviations occur in low-overlap cases at low order, but the error decreases systematically as the quadrature order increases. Since the proposed formulation evaluates a fixed number of quadrature nodes, the relevant issue is approximation error under difficult geometries rather than non-convergence in an iterative sense.
4. Case Study of Object Delineation: Post-Processing of Tree-Crown Delineation Using Non-Maximum Suppression
Object delineation in imaging concerns the recovery of object support, not only object presence. In instance-level vision tasks, this requires distinguishing individual objects while preserving their spatial extent and boundaries. The quality of the final delineation therefore depends on three coupled choices: the detector output geometry, the model used to compare competing candidates, and the suppression rule used to consolidate duplicate predictions. Their interaction becomes critical in crowded scenes, where adjacent objects may partially overlap or exhibit weak local boundary contrast, and where small changes in support can alter which candidates are retained as distinct instances [41,42,43,44]. In aerial forest imagery, tree-crown delineation is used to move from canopy-level observation to individual-tree interpretation, enabling crown counting, crown-size estimation, spacing analysis, and the derivation of structural attributes relevant to forest inventory and ecological assessment [45]. The problem is geometric as well as classificatory. Each crown must be represented by a support model that remains compact enough for efficient prediction and comparison, while still preserving the dominant visible crown body and separating neighboring trees. This is not straightforward in practice, since tree crowns rarely appear as isolated, sharply bounded objects. Their visible extent varies with species, age, competition, stand structure, illumination, viewing geometry, and image resolution, and in dense canopies neighboring crowns may overlap, merge visually, or remain only weakly separated [46,47].
The geometric primitive used for crown support directly affects post-processing. AABBs are simple, compact, and compatible with standard object detectors, but their support is governed by rectangular enclosure and therefore includes corner and background regions that do not belong to the main crown body. OBBs reduce part of this excess support by incorporating orientation, yet they remain rectilinear. Polygonal and instance-mask representations capture shape more faithfully, but at higher annotation and computational cost [48,49]. In tree-crown imagery, many objects occupy an intermediate regime: the visible support is compact, smooth, and anisotropic, but not well characterized by corners. For such objects, an elliptical representation may provide a compact geometry that preserves center, dominant extent, anisotropy, and orientation without introducing corner-driven support. For many crowns, especially in nadir or near-nadir imagery, this may provide a closer approximation of the dominant crown body than either an AABB or an OBB [50,51]. Figure 10 shows an example of crown representation using OBBs and oriented ellipses, illustrating how the elliptical representation reduces corner-driven support that may otherwise contribute to overlap clutter between neighboring predictions.
Figure 10.
Example comparison of oriented bounding box (OBB) and elliptical representations for tree-crown objects. Blue outlines indicate OBB support, while red outlines indicate the corresponding elliptical representation. Source: BAMFORESTS dataset [38].
Candidate suppression is a central post-processing step in object-detection pipelines, where multiple predictions may be generated around the same object and lower-scoring candidates must be filtered before final detections are reported. This step is commonly performed using non-maximum suppression (NMS), in which lower-scoring candidates are removed or attenuated based on their overlap with higher-scoring candidates. The most common variants include hard (greedy) suppression, which discards candidates above a chosen overlap threshold, and softer score-decay formulations, which reduce candidate confidence as overlap increases [41,42,43].
In sparse scenes, the suppression geometry may have limited practical effect, since predictions are already well separated. In dense canopies, however, neighboring crowns can lie close together and overlap partially, so the geometric model used for overlap comparison may influence which predictions are treated as redundant and which are preserved as distinct trees [52,53,54,55]. When support is represented by a coarse rectangular enclosure, suppression decisions may be influenced partly by background agreement rather than agreement over the dominant crown body. A smoother and more compact geometry can therefore lead to different suppression behavior in crowded scenes.
Although ellipse-based crown representations and ellipse-fitting strategies have been considered previously [56,57], the recent tree-crown delineation literature remains dominated by box-based and segmentation-based representations [38,58,59]. This limited use is consistent with current workflow practice, in which standard benchmarks, annotation formats, and post-processing routines are primarily defined for boxes, masks, or oriented boxes rather than ellipses [42,43,60].
The case study does not evaluate ellipses as a learned prediction geometry. The predictions, confidence scores, and native support representations are produced by the AABB or OBB detector, and the ellipse proxy is introduced only after inference as the geometry used to compute pairwise overlap during NMS. The analysis therefore focuses on a narrower question: whether the proposed fixed-cost ellipse-overlap formulation allows a compact ellipse proxy to be used efficiently in tree-crown post-processing, and whether replacing native rectangular overlap with ellipse-proxy overlap changes suppression behavior, threshold response, or the resulting precision–recall balance.
4.1. Experimental Setup and Detector Training
The case study is conducted on the Bamberg benchmark forest dataset of individual tree crowns in very-high-resolution UAV images (BAMFORESTS) [38]. The official BAMFORESTS split consists of 57.14% training data, 15.24% validation data, 14.29% Test-Set-1 data, and 13.33% Test-Set-2 data. Model fitting is performed on the complete training split, model selection on the complete validation split, and all reported results are evaluated on the union of the two test subsets. BAMFORESTS contains 27,160 unique individually delineated tree crowns over 105 ha across four areas of interest around Bamberg, covering coniferous, mixed, deciduous, and city-park environments. The dataset provides instance-level crown AABBs and polygons, fixed data splits, and COCO-format releases at both 1024 × 1024 and 2048 × 2048; however, only the 1024 × 1024 release is used in this study. Its imagery combines high spatial detail with frequent local crown interaction, irregular crown extent, and substantial variation in canopy structure.
Two compact detector variants are trained, corresponding to the two native output geometries examined: YOLO26n for AABB detection (YOLO-AABB) and YOLO26n-obb for OBB detection (YOLO-OBB). Both models are trained under the same BAMFORESTS pipeline, with output geometry and the corresponding annotation format being the intended differences between them. In both cases, pretrained nano-scale checkpoints are used for initialization, training is run for 150 epochs, the input size is fixed to , the random seed is set to 18, and patience is set equal to the maximum epoch count. The remaining training configuration is kept unchanged across the two variants, including automatic batch sizing, device allocation on a single GPU, and zero worker processes. All experiments were executed on the same machine specified in Section 3, except that CUDA was enabled during training and inference.
YOLO26n and YOLO26n-obb were used because YOLO26 provides an NMS-free default inference path, which allowed the external NMS variants evaluated in this study to be applied without interference from an internal detector-side NMS step [61]. The nano-scale models were selected to keep the AABB and OBB experiments lightweight and comparable under the same BAMFORESTS training configuration and the hardware used to conduct the study.
Because BAMFORESTS does not provide native OBB annotations, the OBB labels used for YOLO-OBB training were derived from the instance-level crown polygons using the cv2.minAreaRect() function from the Python 3’s OpenCV (cv2) 4.11.0 package, which computes the minimum-area rotated rectangle enclosing a 2D point set; when the corner coordinates were required explicitly, they were obtained using cv2.boxPoints().
As shown in Figure 11a, the reported F1 scores of the two models remain close across the examined confidence range. The best observed native result is obtained by YOLO-OBB, which reaches at confidence 0.32, whereas YOLO-AABB reaches at confidence 0.30. In both cases, the strongest native performance is concentrated in the low-to-moderate confidence range. The same pattern is reflected in the precision-recall behavior shown in Figure 11b. YOLO-OBB remains slightly stronger across most of the frontier, but the separation between the two detector families is limited. This is also consistent with the native detection metrics, where YOLO-OBB achieves compared with for YOLO-AABB.
Figure 11.
Native detector screening on BAMFORESTS at : (a) F1-score as a function of confidence under each detector’s native overlap formulation; (b) precision-recall curves for YOLO-AABB and YOLO-OBB. YOLO-OBB achieves the highest native peak performance, while YOLO-AABB remains close across the examined operating range.
4.2. Response of Hard NMS to Native and Ellipse-Proxy Overlap
The retained predictions are post-processed under two overlap geometries: their native detector geometry, either AABB or OBB, and an ellipse proxy derived directly from that geometry. For YOLO-AABB, each predicted box is converted to an axis-aligned ellipse using the same box center, with semi-axis lengths equal to half the predicted box width and height. For YOLO-OBB, each predicted oriented box is converted to an oriented ellipse using the same center and orientation, with semi-axis lengths equal to half the oriented box side lengths. No boundary fitting or image-based ellipse estimation is performed; the ellipse is a deterministic post-processing proxy derived from the detector output. The detector predictions, confidence scores, and evaluation geometry remain unchanged. Only the geometry used for pairwise overlap computation during greedy NMS is replaced.
Figure 12 and Table 1 summarize the F1-score response to the NMS threshold for the AABB detector family, whereas Figure 13 and Table 2 present the corresponding results for the OBB detector family. In both cases, native and ellipse-proxy suppression follow the same global pattern. At small thresholds, suppression is strong and F1 remains limited. As the threshold increases, F1 rises rapidly and then transitions into a broad high-value region. This transition is more pronounced at low confidence, whereas at higher confidence the curves flatten and the influence of the NMS threshold becomes weaker.
Figure 12.
F1-score response of greedy NMS for YOLO-AABB using native AABB overlap and ellipse-proxy overlap derived from the AABB geometry. Each panel shows the complete sweep over the NMS threshold at a fixed confidence value.
Table 1.
Per-confidence summary for YOLO-AABB under hard NMS using native AABB overlap and ellipse-proxy overlap derived from the AABB geometry, showing the best achieved score and the associated NMS threshold.
Figure 13.
F1-score response of greedy NMS for YOLO-OBB using native OBB overlap and ellipse-proxy overlap derived from the OBB geometry. Each panel shows the complete sweep over the NMS threshold at a fixed confidence value.
Table 2.
Per-confidence summary for YOLO-OBB under greedy NMS using native OBB overlap and ellipse-proxy overlap derived from the OBB geometry, showing the best achieved score and its associated NMS threshold.
For YOLO-AABB, the highest F1 values remain essentially unchanged under the two overlap formulations, while the threshold at which they are attained generally shifts downward under the ellipse proxy, as shown in Figure 12 and Table 1. This behavior is most visible at low and moderate confidence values, where ellipse-proxy overlap reaches comparable best F1 scores at lower NMS thresholds than native AABB overlap. The effect is therefore not a strong displacement of the peak response, but a modest threshold-response shift: the high-F1 regime is reached earlier and remains near its maximum over a slightly broader interval.
The same pattern appears under YOLO-OBB, although the threshold shift is slightly clearer at low and moderate confidence values, as reported in Figure 13 and Table 2. Across these settings, ellipse-proxy overlap generally reduces the NMS threshold associated with the best or near-best F1 score, while the maximum F1 itself remains effectively unchanged. As in the AABB case, the principal difference lies in the location and breadth of the favorable threshold region rather than in a major change in the maximum F1.
From approximately 0.35 confidence onward, the distinction between native and ellipse-proxy suppression becomes small in both detector families. The curves flatten substantially, and the best F1 values either coincide or differ only marginally. In this range, the delineation outcome is influenced more strongly by confidence filtering than by the precise geometry used for pairwise suppression. Across the examined range, ellipse-proxy NMS preserves the same overall response pattern as native NMS while shifting the onset of the favorable suppression regime toward lower thresholds. In most confidence panels, this shift is accompanied by a slight broadening of the near-peak operating interval.
4.3. Runtime Cost of Ellipse-Overlap Evaluation During NMS
The practical cost of replacing native overlap with ellipse-proxy overlap is summarized in Table 3 and Table 4. The comparison is conducted against the corresponding native detector overlap and against a polygonal ellipse approximation. The proposed formulation is evaluated using affine-mapped GL quadrature with 32 nodes. This configuration was selected from the numerical benchmark because affine GL provided a favorable accuracy–runtime balance: the error had already entered a low-error regime, while the runtime remained close to the minimum-cost settings. Higher quadrature orders further reduced the error, but with a proportional increase in runtime that was unnecessary for the NMS case study. Sine mapping was not used in the case-study runtime evaluation because the affine GL variant already provided the strongest practical configuration among the tested low-order quadrature variants. The polygonal baseline is evaluated using polygonal clipping with 256 vertices because this setting produced a mean absolute relative error comparable to the selected 32-node affine GL.
Table 3.
Per-confidence runtime summaries for YOLO-AABB based on GL quadrature with 32 nodes and polygonal clipping with 256 vertices.
Table 4.
Per-confidence runtime summaries for YOLO-OBB based on GL quadrature with 32 nodes and polygonal clipping with 256 vertices.
All methods were evaluated using early-exit checks before full overlap evaluation. Native AABB overlap was computed using the closed-form intersection and union of two axis-aligned rectangles. Native OBB overlap was computed using a rectangle-specific oriented-box intersection routine: candidate boxes were represented by their center, side lengths, and orientation; pairs were converted to four-corner quadrilaterals; the intersection polygon was obtained by convex clipping; and the intersection area was computed using the shoelace formula [16]. The proposed ellipse-overlap routine used the fixed-order quadrature formulation described in Section 2. AABB overlap, OBB overlap, and the proposed quadrature-based ellipse overlap were implemented using Python 3’s Numba 0.61.2 package to precompile the corresponding kernels and reduce Python-level overhead. The polygonal ellipse approximation was evaluated using Python 3’s Shapely 2.1.2 package. The reported timings isolate overlap evaluation and exclude detector inference, geometry extraction, pair-list construction, and NMS selection.
Relative to native AABB overlap, the proposed ellipse formulation introduces only a modest runtime increase. As shown in Table 3, the GL quadrature runtime decreases from 0.094 s at confidence 0.05 to 0.006 s at confidence 0.50, while the runtime ratio to native AABB remains tightly concentrated between 1.75 and 1.79. Thus, under the AABB detector family, ellipse-proxy overlap remains within a narrow band of approximately 1.8 times the native post-processing cost over the full confidence range. By contrast, the polygonal alternative is several orders of magnitude more expensive in the same setting. Its runtime decreases from 20.374 s at confidence 0.05 to 1.311 s at confidence 0.50, but its ratio to native AABB remains between 351.88 and 379.00. The polygonal approximation is therefore consistently slower than the proposed formulation by a large margin.
A similar conclusion holds when the ellipse proxy is compared against native OBB overlap. As shown in Table 4, the GL quadrature runtime decreases from 0.091 s at confidence 0.05 to 0.011 s at confidence 0.50, while the runtime ratio to native OBB remains between 0.73 and 0.75. In the present implementation setting, the proposed ellipse formulation is slightly faster than the native OBB baseline over the examined range. The advantage is modest in absolute terms but consistent across all listed confidence values. This behavior reflects the fact that native OBB overlap itself requires nontrivial geometric handling, so the fixed-order ellipse formulation does not incur the same relative penalty observed against the simpler AABB baseline. The polygonal approximation again remains far more expensive, with runtimes between 18.892 s and 2.164 s and ratios to native OBB between 150.40 and 156.22. Even under OBB, polygonal ellipse clipping remains more than two orders of magnitude slower than the proposed formulation.
Taken together, these results show that the computational burden of ellipse-aware post-processing depends strongly on the method used to evaluate ellipse overlap. With the proposed fixed-order quadrature formulation, the cost remains close to native post-processing: modestly above native AABB and slightly below native OBB in the present implementation setting. By contrast, polygonal clipping remains substantially more expensive than the native baselines. These results support the proposed quadrature-based overlap formulation as a practical alternative for delineation-oriented post-processing, since it preserves the intended geometric comparison while avoiding the high cost associated with polygonal approximation. Additionally, these runtime ratios should be interpreted as implementation-specific, since native AABB overlap, native OBB overlap, and ellipse-overlap evaluation depend on the chosen geometric kernels and pre-rejection strategy.
4.4. Annotation-Level Area Fidelity of Box and Ellipse Representations
To quantify the area difference introduced by replacing polygonal crown annotations with box- and ellipse-based proxy representations, an annotation-level area comparison was performed using the original BAMFORESTS polygon annotations as the reference. The analysis was conducted on all annotated crowns in the two test sets and was independent of detector predictions. For each crown, the polygon area was compared with the corresponding AABB area, OBB area, AABB-derived ellipse area, and OBB-derived ellipse area.
Four area-based metrics were used. The global area ratio compares the total area of a given representation across all crowns with the total polygon area; therefore, values above 1 indicate aggregate area overestimation. The median area ratio reports the median crown-level ratio between the representation area and the polygon area. The mean absolute relative area error measures the average crown-level absolute percentage difference between the representation area and the polygon area. The p95 absolute relative area error reports the 95th percentile of this absolute crown-level error and indicates the upper-tail behavior of the area difference. These metrics quantify area fidelity only and should not be interpreted as boundary-overlap or full shape-similarity measures.
The results are summarized in Table 5. Both rectangular representations overestimated the polygon area substantially, with total area increases of 46.6% for AABBs and 40.5% for OBBs. The ellipse-based representations reduced this area difference. The AABB-derived ellipse had a total area 15.2% larger than the polygon total, while the OBB-derived ellipse had the closest agreement, with a total area 10.3% larger than the polygon annotations. At the instance level, the mean absolute relative area error decreased from 55.9% for AABBs and 45.9% for OBBs to 23.5% for AABB-derived ellipses and 15.9% for OBB-derived ellipses. These results show that the elliptical proxy representation does not reproduce the irregular polygonal crown boundary, but it reduces the area bias associated with rectangular representations in the BAMFORESTS annotations.
Table 5.
Annotation-level area comparison of AABB-, OBB-, and ellipse-based representations relative to the BAMFORESTS polygon annotations.
5. Discussion
This section discusses the findings in Section 3 and Section 4 with respect to numerical behavior, fixed-cost approximation, rotated-frame geometry, and post-processing performance in tree-crown delineation. Section 5.1 discusses the benchmark behavior and the accuracy–runtime trade-off of the proposed formulation. Section 5.2 interprets the role of the rotated-frame hybrid representation, while Section 5.3 examines the numerical accuracy of fixed-order quadrature. Section 5.4 and Section 5.5 address the effect of ellipse-proxy overlap on NMS behavior and its geometric implications for tree-crown delineation. Section 5.6 relates the proposed formulation to existing overlap and post-processing methods. Section 5.7 relates the study to recent work that utilized BAMFORESTS. Section 5.8 outlines the main limitations and considerations of the present study. Finally, Section 5.9 discusses directions for future research.
5.1. Numerical Behavior of the Proposed Rotated Ellipse-Overlap Formulation
The benchmark results indicate that the proposed rotated-frame formulation provides a stable fixed-order approximation with a predictable accuracy–runtime trade-off, as error decreases with quadrature order while runtime increases in a controlled manner. This behavior is consistent with the structure of the method, since each ellipse pair is evaluated with a prescribed number of quadrature nodes, giving complexity with respect to the selected order . The formulation therefore reaches a low-error regime earlier than the dense polygonal approximation without introducing configuration-dependent evaluation cost.
The main effect of sine mapping is to distribute the available evaluations more effectively, particularly in cases where the overlap-height function varies rapidly near the effective endpoints. Because the quadrature-node evaluations are independent once the rotated-frame coefficients have been precomputed, the formulation is also amenable to parallel execution under suitable implementation settings. Accordingly, although the arithmetic work remains , the node-level independence provides a practical basis for batched or parallel evaluation.
Sine mapping was not used as an automatically triggered adaptive step in this study. It was evaluated as an optional fixed-cost node-redistribution strategy. Its use is most relevant when the selected quadrature rule does not already place sufficient nodes near the integration interval endpoints, because near-grazing configurations often produce rapid changes in the overlap-height function close to the interval boundaries. Conversely, when the quadrature rule already has strong endpoint coverage, sine mapping is not expected to provide a clear advantage.
This behavior is consistent with the numerical results. Sine mapping improved the performance of CM and CS at low and moderate quadrature orders, where the original node distributions are comparatively less concentrated near the interval boundaries. In contrast, it did not improve GL and CC, and in some cases slightly worsened their accuracy. This is expected because GL and CC already provide endpoint-sensitive node distributions, and applying sine mapping on top of these rules can over-concentrate nodes near the boundaries and reduce sampling in the interior of the interval, which may explain the reduced or negative benefit observed for GL and CC.
5.2. Role of the Rotated-Frame Hybrid Representation
The importance of the rotated-frame hybrid representation lies in separating geometric preservation from numerical simplification. After coordinate-frame rotation by , the reference ellipse is expressed in axis-aligned form, while the candidate ellipse remains a general rotated conic. This preserves the intersection area but changes the computational form of the problem, allowing the area to be evaluated through direct slice-based quadrature rather than explicit conic–conic intersection recovery and topology-dependent case handling. The benefit of the resulting hybrid representation is therefore analytical and computational: it keeps the geometry unchanged while simplifying the integration bounds, reducing algebraic complexity, and supporting a uniform fixed-cost numerical procedure.
5.3. Numerical Accuracy of Fixed-Order Quadrature
The accuracy of the proposed formulation depends on how effectively the fixed-order quadrature rule samples the rotated-frame overlap-height function over the horizontal interval of potential overlap [, ]. On any open sub-interval where (i) the square-root terms of the reference ellipse remain real, (ii) the conic discriminant satisfies , and (iii) the active upper and lower envelopes do not switch, the slice bounds are analytic functions of , and is therefore analytic on that sub-interval. In such regions, fixed-order quadrature rules may exhibit rapid convergence with respect to the node count , although the rate depends on the chosen quadrature family and on the effective smoothness of the transformed integrand. In the rotated conic-slice setting, the effective smoothness deteriorates near interval endpoints where either the reference-ellipse square root approaches zero or the candidate slice becomes marginal, that is, . In these regions, derivatives of the slice bounds become large, which reduces the effectiveness of direct fixed-order sampling and increases the sensitivity of the numerical approximation to node placement. This behavior is especially relevant in grazing or near-tangential configurations, where much of the variation in the overlap-height function is concentrated close to the effective boundaries of the integration interval.
The sine-mapping step targets these regimes directly by redistributing nodes toward the effective endpoint regions, where the overlap-height function varies most rapidly. The resulting formulation therefore preserves the fixed-order character of the approximation and can improve numerical behavior in configurations where the direct affinely mapped rule may under-resolve boundary variation.
5.4. Effect of Ellipse-Proxy Overlap on NMS Behavior
The case study shows that ellipse-proxy overlap mainly changes the threshold response of greedy NMS rather than the detector’s peak precision–recall capacity. In both AABB- and OBB-based outputs, the same global suppression pattern remains: low thresholds suppress many candidates, intermediate thresholds produce the strongest F1 values, and higher thresholds eventually flatten the response. The ellipse proxy modestly shifts the onset of the favorable operating region toward lower NMS thresholds and, in most tested confidence values, slightly broadens the near-peak interval. This indicates that the ellipse proxy changes how duplicate candidates are filtered, while leaving the underlying detector outputs and confidence scores unchanged. At higher confidence values, fewer candidates remain available for suppression, so the effect of the overlap geometry becomes smaller.
5.5. Geometric Implications for Tree-Crown Delineation Post-Processing
For tree crowns, the main advantage of the elliptical representation is that it provides a compact and orientation-aware support model without introducing rectangular corners. Crown footprints in aerial imagery are often smooth, locally compact, and anisotropic, but not naturally rectilinear. In such cases, rectangular overlap may reflect enclosure geometry more than the visible crown body. An elliptical representation can reduce this mismatch by preserving center, dominant extent, and orientation while avoiding corner-driven support. This matters during suppression, where pairwise overlap is used as evidence of duplication. A smoother support model may better reflect the shared visible crown region between adjacent candidates, especially when crowns overlap partially or are elongated by viewing conditions. This does not mean that the ellipse is the true crown geometry. Rather, it acts as a more shape-consistent representation than a rectangle while remaining far simpler than polygonal or mask-based representations. Its value in this study is therefore practical: it offers a more suitable geometric basis for repeated overlap decisions without requiring dense shape reconstruction.
5.6. Relation to Existing Overlap and Post-Processing Formulations
The proposed framework is not intended to replace exact or general ellipse-intersection methods. Methods based on explicit intersection recovery, adaptive refinement, or topology-aware geometric reconstruction remain appropriate when the main objective is maximal geometric fidelity for individual pairs. This differs from the objective considered here. The present formulation is instead positioned as a practical overlap primitive for repeated decision-making. Its main advantage is that it handles arbitrary relative orientation while maintaining bounded evaluation cost and limited implementation dependence. This makes it suitable for workflows in which overlap is queried repeatedly within suppression, filtering, or consolidation stages.
The same distinction applies in relation to common post-processing formulations. Rectangular overlap is often preferred because it is simple and fast, while polygonal or mask-based overlap is more shape-faithful but more expensive. The proposed framework occupies an intermediate position: it preserves a compact parametric geometry with smoother support than boxes, while remaining computationally lighter than dense boundary or mask-based comparison.
5.7. Relation to Studies That Utilized BAMFORESTS
Several recent UAV-forestry studies have used BAMFORESTS as a benchmark or external test set for model-level tasks, including tree-crown delineation and inventory estimation, contour-based instance segmentation, foundation-model adaptation, semi-supervised domain adaptation, and standing-dead-tree detection generalizability [62,63,64,65]. These studies primarily evaluate how tree or crown candidates are detected, segmented, classified, or transferred across domains. The present study differs in scope: it does not modify the detector architecture or propose a new segmentation model, but uses BAMFORESTS detector outputs to examine how the pairwise overlap representation used during NMS affects post-processing behavior. Therefore, the comparison is not intended as a direct detector-level benchmark; instead, it positions the proposed ellipse-based overlap formulation as a post-processing component that can complement existing BAMFORESTS-based detection and segmentation workflows.
5.8. Limitations and Considerations
The numerical benchmark evaluates the approximation against a dense polygonal reference rather than an exact closed-form solution for the general rotated case. This reference is suitable for practical comparison because of its high boundary resolution, but the reported errors are relative to a numerical baseline and should not be interpreted as exact errors with respect to the true intersection area. In addition, the benchmark is based on synthetically generated ellipse pairs, which allows controlled evaluation over a large number of configurations but does not exhaust all possible geometric degeneracies, particularly extreme near-tangency, high eccentricity, or very small overlap regimes. These cases are partly addressed through the analysis of endpoint behavior and sine-mapped quadrature, but they remain important configurations for further numerical stress testing.
The imaging case study is also intentionally post-processing-oriented. The ellipse proxy is not trained as a native prediction geometry; instead, it is constructed from AABB or OBB detector outputs after inference and used only for overlap computation during NMS. Consequently, the results should not be interpreted as evidence that ellipse-native detectors would necessarily improve tree-crown prediction. They show instead that, when predictions and confidence scores are already produced by native box-based detectors, ellipse-proxy overlap can be introduced as an alternative comparison geometry at practical computational cost. The observed changes in threshold response and precision–recall balance therefore arise from the suppression stage rather than from a change in detector training or prediction geometry.
The F1-score curves in the BAMFORESTS case study are point estimates obtained from one trained model per detector configuration using the fixed dataset split and a fixed random seed. Repeated training runs would be required to quantify the contribution of detector-training stochasticity to the observed threshold shifts. Therefore, the case-study results should be interpreted as post-processing behavior under the trained detector instances rather than as a statistical estimate of detector-family performance.
The BAMFORESTS evaluation provides a real-world imaging example under dense crown interaction, but it remains a single-dataset case study. Crown morphology, canopy closure, acquisition geometry, spatial resolution, and annotation practice may influence whether ellipse-proxy overlap produces the same behavior in other forest environments. Broader validation across additional datasets and imaging conditions would therefore be needed before drawing general conclusions about tree-crown delineation workflows. Similarly, the present experiments focus on hard greedy NMS. Other suppression strategies, including score-decay, adaptive thresholding, and geometry-aware matching rules, may interact differently with ellipse-based overlap and should be examined separately.
5.9. Directions for Future Research
The proposed rotated-frame formulation is not restricted to fixed-order quadrature. Once the ellipse–ellipse intersection-area computation is reduced to the one-dimensional overlap integral in Equation (9), the same overlap-height function can also be integrated using adaptive or higher-accuracy numerical schemes. In this sense, the main contribution of the formulation lies in the geometric reduction itself, while the area evaluation rule may be replaced according to the required accuracy. This creates a natural direction for future research, in which the present formulation may be extended toward higher-accuracy evaluation while preserving the same rotated-frame geometry and slice-based overlap function. One example is adaptive Simpson integration, in which only the numerical area approximation changes, while the underlying overlap-height formulation remains unchanged. Such extensions may be useful when local error control is prioritized over bounded evaluation cost.
From the imaging perspective, future studies could evaluate ellipse-aware overlap beyond ellipse-proxy NMS. One direction is to train or adapt detectors that predict ellipse parameters directly, allowing the overlap formulation to operate on native ellipse outputs rather than on ellipse proxies derived from boxes. Another direction is to examine the same overlap primitive in related post-processing tasks, such as duplicate filtering, instance association, temporal matching, or multi-stage candidate refinement. These extensions would help clarify whether the main benefit of the proposed formulation lies primarily in NMS threshold behavior, broader geometry-aware post-processing, or applications where repeated ellipse-overlap queries are required at a larger scale.
Explainable AI is also a relevant direction because the case study uses YOLO-based detector outputs before NMS. Although this study focuses on overlap computation rather than detector interpretation, explainability tools could help distinguish detector-side uncertainty from post-processing effects, especially in dense crown regions where duplicated candidates, missed detections, and boundary ambiguity occur. Future work could therefore combine ellipse-aware NMS with explainable detector diagnostics to better identify when geometry-aware overlap provides the greatest benefit.
6. Conclusions
This study presented a computational framework for approximating the intersection area of two arbitrarily rotated ellipses using a rotated-frame fixed-order quadrature formulation. The main contribution of the study is the formulation of ellipse–ellipse intersection as a bounded-cost one-dimensional overlap problem, rather than as a topology-dependent geometric reconstruction problem. By applying a coordinate-frame rotation, the reference ellipse is expressed in axis-aligned form while the candidate ellipse is represented as a general conic. This hybrid representation preserves the original ellipse geometry while reducing the two-dimensional intersection-area computation to a one-dimensional integral of the vertical overlap-height function over the admissible horizontal interval. The area is then approximated using fixed-order quadrature, with optional sine mapping used when additional node concentration near the interval boundaries is needed.
The numerical benchmark on 100,000 rotated ellipse pairs showed two main findings. First, the proposed quadrature-based framework reached low-error regimes earlier than polygonal approximation, indicating that accurate overlap estimates can be obtained without reconstructing dense polygonal boundaries. Second, the formulation required substantially lower runtime, supporting its use in repeated overlap evaluation settings where bounded and predictable computational cost is important. Among the tested quadrature variants, Gauss–Legendre (GL) and Clenshaw–Curtis (CC) performed strongest in the affine domain, whereas sine mapping improved composite midpoint (CM) and composite Simpson (CS) quadrature at low and moderate orders. These results show that the accuracy–runtime behavior can be controlled through quadrature choice, quadrature order, and node mapping.
The BAMFORESTS [38] case study showed that the proposed overlap formulation can be used in object-detection post-processing without changing the native detector outputs. Across AABB and OBB detectors, using ellipse-proxy overlap during NMS preserved peak F1 while modestly shifting favorable operating regions toward lower NMS thresholds and slightly broadening the near-peak interval. This indicates that the main application-level effect is not a large increase in maximum F1, but a change in the threshold behavior and stability of suppression. Runtime results further showed that the fixed-order formulation remained close to native post-processing cost and substantially less expensive than polygonal ellipse clipping. Nonetheless, these findings should be interpreted in relation to the numerical-reference baseline, the single-dataset case study, and the statistical uncertainty of the case study results.
Overall, the proposed framework provides a practical bounded-cost overlap approximation for the ellipse–ellipse intersection problem. It is not intended to replace exact topology formulations when maximal pairwise geometric fidelity is required. Rather, it provides an alternative where cheap overlap evaluation, predictable runtime, and sufficient numerical accuracy are the primary requirements.
Author Contributions
Conceptualization, M.S. and E.E.; methodology, M.S. and E.E.; software, M.S.; validation, M.S., E.E., E.F. and F.P.; formal analysis, M.S. and E.E.; investigation, M.S. and E.E.; resources, F.P.; data curation, M.S. and E.E.; writing—original draft preparation, M.S. and E.E.; writing—review and editing, M.S., E.E., E.F. and F.P.; visualization, M.S. and E.E.; supervision, E.F. and F.P.; project administration, M.S. All authors have read and agreed to the published version of the manuscript.
Funding
This research received no external funding.
Data Availability Statement
The synthetic benchmark data used for the numerical evaluation, including the 100,000 randomly generated ellipse pairs, as well as the trained YOLO26n and YOLO26n-obb model weights used in the BAMFORESTS case study, are available in the following public GitHub repository: https://github.com/mshatnawi/fixed-cost-ellipse-ellipse-intersection-data (accessed on 13 May 2026). The repository also provides source code for the proposed fixed-cost ellipse–ellipse intersection framework, including the Python and Numba implementations. The BAMFORESTS dataset used for the tree-crown delineation case study is publicly available from the dataset authors through the official BAMFORESTS data release and the corresponding publication [38].
Acknowledgments
During the preparation of this manuscript, the authors used generative AI tools (ChatGPT 5.4) to improve the formal writing of the article and assist with code development for implementing and evaluating the proposed computational framework. The authors have reviewed the generated output and take full responsibility for the content of this publication.
Conflicts of Interest
The authors declare no conflicts of interest.
Abbreviations
The following abbreviations are used in this manuscript:
| AABB | Axis-Aligned Bounding Box |
| BAMFORESTS | Bamberg Benchmark Forest Dataset |
| CC | Clenshaw–Curtis |
| CM | Composite Midpoint |
| COCO | Common Objects in Context |
| CPU | Central Processing Unit |
| CS | Composite Simpson |
| FFT | Fast Fourier Transform |
| GB | Gigabyte |
| GL | Gauss–Legendre |
| GPU | Graphics Processing Unit |
| NMS | Non-Maximum Suppression |
| OBB | Oriented Bounding Box |
| RAM | Random Access Memory |
| YOLO | You Only Look Once |
Appendix A
Algorithm A1 describes the pseudocode of the proposed rotated-frame fixed-order quadrature framework for estimating the intersection area between a reference ellipse and a candidate ellipse. The procedure follows directly from Section 2.1, Section 2.2, Section 2.3, Section 2.4, Section 2.5 and Section 2.6 and summarizes the computational sequence used to rotate the coordinate frame, construct the candidate ellipse as a conic in the rotated frame, define the horizontal interval of potential overlap, map the quadrature nodes, and evaluate the overlap-height contribution at each node.
| Algorithm A1: Fixed-order quadrature for approximating ellipse–ellipse intersection area. |
| Input: Output: Approximate intersection area using rotated-frame fixed-cost quadrature Procedure:
|
References
- Plissiti, M.E.; Nikou, C. Overlapping cell nuclei segmentation using a spatially adaptive active physical model. IEEE Trans. Image Process. 2012, 21, 4568–4580. [Google Scholar] [CrossRef] [Scilit] [PubMed]
- Panagiotakis, C.; Argyros, A.A. Region-based fitting of overlapping ellipses and its application to cells segmentation. Image Vis. Comput. 2020, 93, 103810. [Google Scholar] [CrossRef] [Scilit]
- Zhao, Z.; Zhao, Z.; Zhang, P. A new method for identifying industrial clustering using the standard deviational ellipse. Sci. Rep. 2023, 13, 578. [Google Scholar] [CrossRef] [Scilit] [PubMed]
- Liu, K.; Lu, Y.; Bai, R.; Xu, K.; Peng, T.; Tai, Y.; Zhang, Z. Ellipse detection with applications of convolutional neural network in industrial images. Electronics 2023, 12, 3431. [Google Scholar] [CrossRef] [Scilit]
- Funada, R.; Nishimoto, K.; Ibuki, T.; Sampei, M. Collision avoidance for ellipsoidal rigid bodies with control barrier functions designed from rotating supporting hyperplanes. IEEE Trans. Control Syst. Technol. 2025, 33, 148–164. [Google Scholar] [CrossRef] [Scilit]
- Yuill, R.S. The Standard deviational ellipse; An updated tool for spatial description. Geogr. Ann. Ser. B Hum. Geogr. 1971, 53, 28–39. [Google Scholar] [CrossRef]
- Mala, S.; Jat, M.K. Geographic information system based spatio-temporal dengue fever cluster analysis and mapping. Egypt. J. Remote Sens. Space Sci. 2019, 22, 297–304. [Google Scholar] [CrossRef] [Scilit]
- Etayo, F.; González-Vega, L.; del Río, N. A new approach to characterizing the relative position of two ellipses depending on one parameter. Comput. Aided Geom. Des. 2006, 23, 324–350. [Google Scholar] [CrossRef] [Scilit]
- Vallo, D.; Fulier, J.; Rumanova, L. Numerical calculation of area of elliptical segments. Mathematics 2020, 8, 1411. [Google Scholar] [CrossRef] [Scilit]
- Yi, Y.-B.; Sastry, A.M. Analytical approximation of the two-dimensional percolation threshold for fields of overlapping ellipses. Phys. Rev. E 2002, 66, 066130. [Google Scholar] [CrossRef] [Scilit] [PubMed]
- Hughes, G.B.; Chraibi, M. Calculating ellipse overlap areas. Comput. Vis. Sci. 2014, 15, 291–301. [Google Scholar] [CrossRef] [Scilit]
- Sutherland, I.E.; Hodgman, G.W. Reentrant polygon clipping. Commun. ACM 1974, 17, 32–42. [Google Scholar] [CrossRef] [Scilit]
- Weiler, K.; Atherton, P. Hidden surface removal using polygon area sorting. In Proceedings of the 4th Annual Conference on Computer Graphics and Interactive Techniques, New York, NY, USA, 20–22 July 1977; pp. 214–222. [Google Scholar] [CrossRef] [Scilit]
- Vatti, B.R. A generic solution to polygon clipping. Commun. ACM 1992, 35, 56–63. [Google Scholar] [CrossRef] [Scilit]
- Greiner, G.; Hormann, K. Efficient clipping of arbitrary polygons. ACM Trans. Graph. 1998, 17, 71–83. [Google Scholar] [CrossRef] [Scilit]
- Lee, Y.; Lim, W. Shoelace formula: Connecting the area of a polygon and the vector cross product. Math. Teach. 2017, 110, 631–636. [Google Scholar] [CrossRef] [Scilit]
- Fu, P.; Walton, O.R.; Harvey, J.T. Polyarc discrete element for efficiently simulating arbitrarily shaped 2D particles. Int. J. Numer. Methods Eng. 2012, 89, 599–617. [Google Scholar] [CrossRef] [Scilit]
- McKeeman, W.M. Algorithm 145: Adaptive numerical integration by Simpson’s rule. Commun. ACM 1962, 5, 604. [Google Scholar] [CrossRef] [Scilit]
- Lyness, J.N. Notes on the adaptive Simpson quadrature routine. J. ACM 1969, 16, 483–495. [Google Scholar] [CrossRef] [Scilit]
- Press, W.H.; Teukolsky, S.A.; Vetterling, W.T.; Flannery, B.P. Integration Functions. In Numerical Recipes: The Art of Scientific Computing, 3rd ed.; Cambridge University Press: Cambridge, UK, 2007; pp. 155–196. [Google Scholar]
- Plaskota, L. Automatic integration using asymptotically optimal adaptive Simpson quadrature. Numer. Math. 2015, 131, 173–198. [Google Scholar] [CrossRef] [Scilit] [PubMed]
- Johansson, F. Numerical Evaluation of Elliptic Functions, Elliptic Integrals and Modular Forms. In Elliptic Integrals, Elliptic Functions and Modular Forms in Quantum Field Theory; Springer: Cham, Switzerland, 2019; pp. 269–293. [Google Scholar] [CrossRef] [Scilit]
- Shatnawi, M.; Földesi, P. An analytically derived Gauss–Legendre quadrature for axis-aligned ellipse–ellipse intersection. Mathematics 2025, 13, 3814. [Google Scholar] [CrossRef] [Scilit]
- Vieillard-Baron, J. Phase transitions of the classical hard-ellipse system. J. Chem. Phys. 1972, 56, 4729–4744. [Google Scholar] [CrossRef] [Scilit]
- Gnidovec, A.; Božič, A.; Jelerčič, U.; Čopar, S. Measure of overlap between two arbitrary ellipses on a sphere. Proc. Math. Phys. Eng. Sci. 2022, 478, 20210807. [Google Scholar] [CrossRef] [Scilit] [PubMed]
- Bongardt, B.; Thomas, F. On Ellipse Intersections by Means of Distance Geometry. In Proceedings of the IFToMM World Congress on Mechanism and Machine Science, Tokyo, Japan, 5–10 November 2023; pp. 533–543. [Google Scholar] [CrossRef] [Scilit]
- Kim, M.; Kim, Y.; Cho, G. Advanced Ellipse Overlap Computation Based on Segment Decomposition. Alex. Eng. J. 2025, 119, 425–436. [Google Scholar] [CrossRef] [Scilit]
- Metropolis, N.; Ulam, S. The Monte Carlo method. J. Am. Stat. Assoc. 1949, 44, 335–341. [Google Scholar] [CrossRef] [PubMed]
- Cuesta, J.A.; Frenkel, D. Monte Carlo simulation of two-dimensional hard ellipses. Phys. Rev. A 1990, 42, 2126. [Google Scholar] [CrossRef] [Scilit] [PubMed]
- Press, W.H.; Teukolsky, S.A.; Vetterling, W.T.; Flannery, B.P. Random Numbers. In Numerical Recipes: The Art of Scientific Computing, 3rd ed.; Cambridge University Press: Cambridge, UK, 2007; pp. 340–418. [Google Scholar]
- Hung, Y.-C. A review of Monte Carlo and quasi-Monte Carlo sampling techniques. WIREs Comput. Stat. 2023, 16, e1637. [Google Scholar] [CrossRef] [Scilit]
- Rosenfeld, A.; Pfaltz, J.L. Sequential operations in digital picture processing. J. ACM 1966, 13, 471–494. [Google Scholar] [CrossRef] [Scilit]
- Klette, R.; Rosenfeld, A. Grids and Digitization. In Digital Geometry: Geometric Methods for Digital Picture Analysis; Morgan Kaufmann: San Francisco, CA, USA, 2004; pp. 35–75. [Google Scholar] [CrossRef] [Scilit]
- Gonzalez, R.C.; Woods, R.E. Filtering in the Frequency Domain. In Digital Image Processing, 4th ed.; Pearson Education Limited: New York, NY, USA, 2018; pp. 204–315. [Google Scholar]
- Soille, P. Segmentation. In Morphological Image Analysis: Principles and Applications, 2nd ed.; Springer: Berlin/Heidelberg, Germany, 2003; pp. 267–292. [Google Scholar] [CrossRef] [Scilit]
- Landström, A.; Thurley, M.J. Adaptive morphology using tensor-based elliptical structuring elements. Pattern Recognit. Lett. 2013, 34, 1416–1422. [Google Scholar] [CrossRef] [Scilit]
- Horn, R.A.; Johnson, C.R. Hermitian Matrices, Symmetric Matrices, and Congruences. In Matrix Analysis, 2nd ed.; Cambridge University Press: Cambridge, UK, 2012; pp. 225–311. [Google Scholar]
- Troles, J.; Schmid, U.; Fan, W.; Tian, J. BAMFORESTS: Bamberg benchmark forest dataset of individual tree crowns in very-high-resolution UAV images. Remote Sens. 2024, 16, 1935. [Google Scholar] [CrossRef] [Scilit]
- Hughes, G.B.; Chraibi, M. EEOver. 2014. Available online: https://github.com/chraibi/EEOver (accessed on 8 February 2026).
- Thomas, G.B.; Finney, R.L. Calculus and Analytic Geometry, 5th ed.; Addison-Wesley: Reading, MA, USA, 1979. [Google Scholar]
- Choi, S.B.; Lee, S.-S.; Park, J.; Jang, S.-J. Standard greedy non maximum suppression optimization for efficient and high speed inference. In Proceedings of the 2021 IEEE International Conference on Consumer Electronics-Asia (ICCE-Asia), Gangwon, Republic of Korea, 27–29 October 2021; pp. 1–4. [Google Scholar] [CrossRef] [Scilit]
- Bodla, N.; Singh, B.; Chellappa, R.; Davis, L.S. Soft-NMS—Improving object detection with one line of code. In Proceedings of the 2017 IEEE International Conference on Computer Vision (ICCV), Venice, Italy, 22–29 October 2017; pp. 5562–5570. [Google Scholar] [CrossRef] [Scilit]
- Liu, S.; Huang, D.; Wang, Y. Adaptive NMS: Refining pedestrian detection in a crowd. In Proceedings of the 2019 IEEE/CVF Conference on Computer Vision and Pattern Recognition (CVPR), Long Beach, CA, USA, 15–21 June 2019; pp. 6452–6461. [Google Scholar] [CrossRef] [Scilit]
- Hafiz, A.M.; Bhat, G.M. A survey on instance segmentation: State of the art. Int. J. Multimed. Inf. Retr. 2020, 9, 171–189. [Google Scholar] [CrossRef] [Scilit]
- Zhao, H.; Morgenroth, J.; Pearse, G.; Schindler, J. A Systematic review of individual tree crown detection and delineation with convolutional neural networks (CNN). Curr. For. Rep. 2023, 9, 149–170. [Google Scholar] [CrossRef] [Scilit]
- Miraki, M.; Sohrabi, H.; Fatehi, P.; Kneubuehler, M. Individual tree crown delineation from high-resolution UAV images in broadleaf forest. Ecol. Inform. 2021, 61, 101207. [Google Scholar] [CrossRef] [Scilit]
- Xu, X.; Zhou, Z.; Tang, Y.; Qu, Y. Individual tree crown detection from high spatial resolution imagery using a revised local maximum filtering. Remote Sens. Environ. 2021, 258, 112397. [Google Scholar] [CrossRef] [Scilit]
- Han, B.; Oh, T.-H. Learning few-shot segmentation from bounding box annotations. In Proceedings of the 2023 IEEE/CVF Winter Conference on Applications of Computer Vision (WACV), Waikoloa, HI, USA, 3–7 January 2023; pp. 3739–3748. [Google Scholar] [CrossRef] [Scilit]
- Ke, L.; Danelljan, M.; Ding, H.; Tai, Y.-W.; Tang, C.-K.; Yu, F. Mask-free video instance segmentation. In Proceedings of the 2023 IEEE/CVF Conference on Computer Vision and Pattern Recognition (CVPR), Vancouver, BC, Canada, 18–22 June 2023; pp. 22857–22866. [Google Scholar] [CrossRef] [Scilit]
- Schmitt, M.; Shahzad, M.; Zhu, X.X. Reconstruction of individual trees from multi-aspect TomoSAR data. Remote Sens. Environ. 2015, 165, 175–185. [Google Scholar] [CrossRef] [Scilit]
- Xu, J.; Su, M.; Sun, Y.; Pan, W.; Cui, H.; Jin, S.; Zhang, L.; Wang, P. Tree crown segmentation and diameter at breast height prediction based on BlendMask in unmanned aerial vehicle imagery. Remote Sens. 2024, 16, 368. [Google Scholar] [CrossRef] [Scilit]
- Duncanson, L.I.; Cook, B.D.; Hurtt, G.C.; Dubayah, R.O. An efficient, multi-layered crown delineation algorithm for mapping individual tree structure across multiple ecosystems. Remote Sens. Environ. 2014, 154, 378–386. [Google Scholar] [CrossRef] [Scilit]
- Freudenberg, M.; Magdon, P.; Nölke, N. Individual tree crown delineation in high-resolution remote sensing images based on U-Net. Neural Comput. Appl. 2022, 34, 22197–22207. [Google Scholar] [CrossRef] [Scilit]
- Dietenberger, S.; Mueller, M.M.; Bachmann, F.; Nestler, M.; Ziemer, J.; Metz, F.; Heidenreich, M.G.; Koebsch, F.; Hese, S.; Dubois, C.; et al. Tree Stem Detection and Crown Delineation in a Structurally Diverse Deciduous Forest Combining Leaf-On and Leaf-Off UAV-SfM Data. Remote Sens. 2023, 15, 4366. [Google Scholar] [CrossRef] [Scilit]
- Tong, F.; Zhang, Y. Individual tree crown delineation in high resolution aerial RGB imagery using StarDist-based model. Remote Sens. Environ. 2025, 319, 114618. [Google Scholar] [CrossRef] [Scilit]
- Ardila, J.P.; Bijker, W.; Tolpekin, V.A.; Stein, A. Quantification of crown changes and change uncertainty of trees in an urban environment. ISPRS J. Photogramm. Remote Sens. 2012, 74, 41–55. [Google Scholar] [CrossRef] [Scilit]
- Özcan, A.H.; Hisar, D.; Sayar, Y.; Ünsalan, C. Tree crown detection and delineation in satellite images using probabilistic voting. Remote Sens. Lett. 2017, 8, 761–770. [Google Scholar] [CrossRef] [Scilit]
- Dersch, S.; Schöttl, A.; Krzystek, P.; Heurich, M. Towards complete tree crown delineation by instance segmentation with Mask R–CNN and DETR using UAV-based multispectral imagery and lidar data. ISPRS J. Photogramm. Remote Sens. 2023, 8, 100037. [Google Scholar] [CrossRef] [Scilit]
- Aldaeri, A.S.T.M.; Kit, C.Y.; Ting, L.S.; Abdul Rahman, M.R.B. Deep learning for tree crown detection and delineation using UAV and high-resolution imagery for biometric parameter extraction: A systematic review. Forests 2026, 17, 179. [Google Scholar] [CrossRef] [Scilit]
- Chen, X.; Fang, H.; Lin, T.Y.; Vedantam, R.; Gupta, S.; Dollár, P.; Zitnick, C.L. Microsoft COCO captions: Data collection and evaluation server. arXiv 2015, arXiv:1504.00325. [Google Scholar] [CrossRef] [Scilit]
- Ultralytics. Ultralytics YOLO26; Ultralytics: New York, NY, USA, 2025; Available online: https://docs.ultralytics.com/models/yolo26 (accessed on 10 June 2026).
- Wang, G.; Mo, C.; Li, Y.; Huang, J.; Song, W. Dual-stream feature integration network for unmanned aerial vehicles remote sensing detection of dense standing dead trees. Comput. Electron. Agric. 2025, 236, 110468. [Google Scholar] [CrossRef] [Scilit]
- Wu, S.; Zhuang, B.; Wang, Z.; Zhang, Q. Dual-level domain alignment and boundary-aware optimization for semisupervised tree crown instance segmentation in UAV imagery. IEEE J. Sel. Top. Appl. Earth Obs. Remote Sens. 2026, 19, 9516–9531. [Google Scholar] [CrossRef] [Scilit]
- Huang, C.; Ding, Y.; Xiao, K.; Liu, R.; Sun, Y. Ladder-Side-Tuning of visual foundation model for city-scale individual tree detection from high-resolution remote sensing images. Remote Sens. 2026, 18, 819. [Google Scholar] [CrossRef] [Scilit]
- Do, M.V.H.; Phung, D.T.; Pham, H.D.L.; Pham, Q.-D.; Hoang, V.-N.; Hoang, V.-S.; Vlaminck, M.; Luong, H.; Tran, T.-H.; Vu, H.; et al. A UAV RGB dataset and method for instance tree crown segmentation for biodiversity monitoring. Sci. Rep. 2026, 16, 5788. [Google Scholar] [CrossRef] [Scilit] [PubMed]
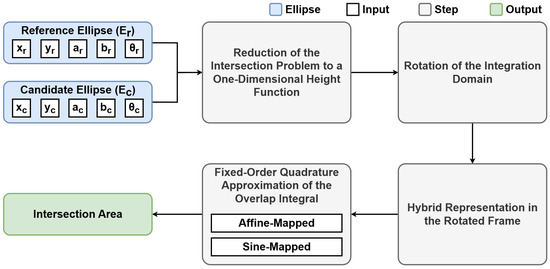
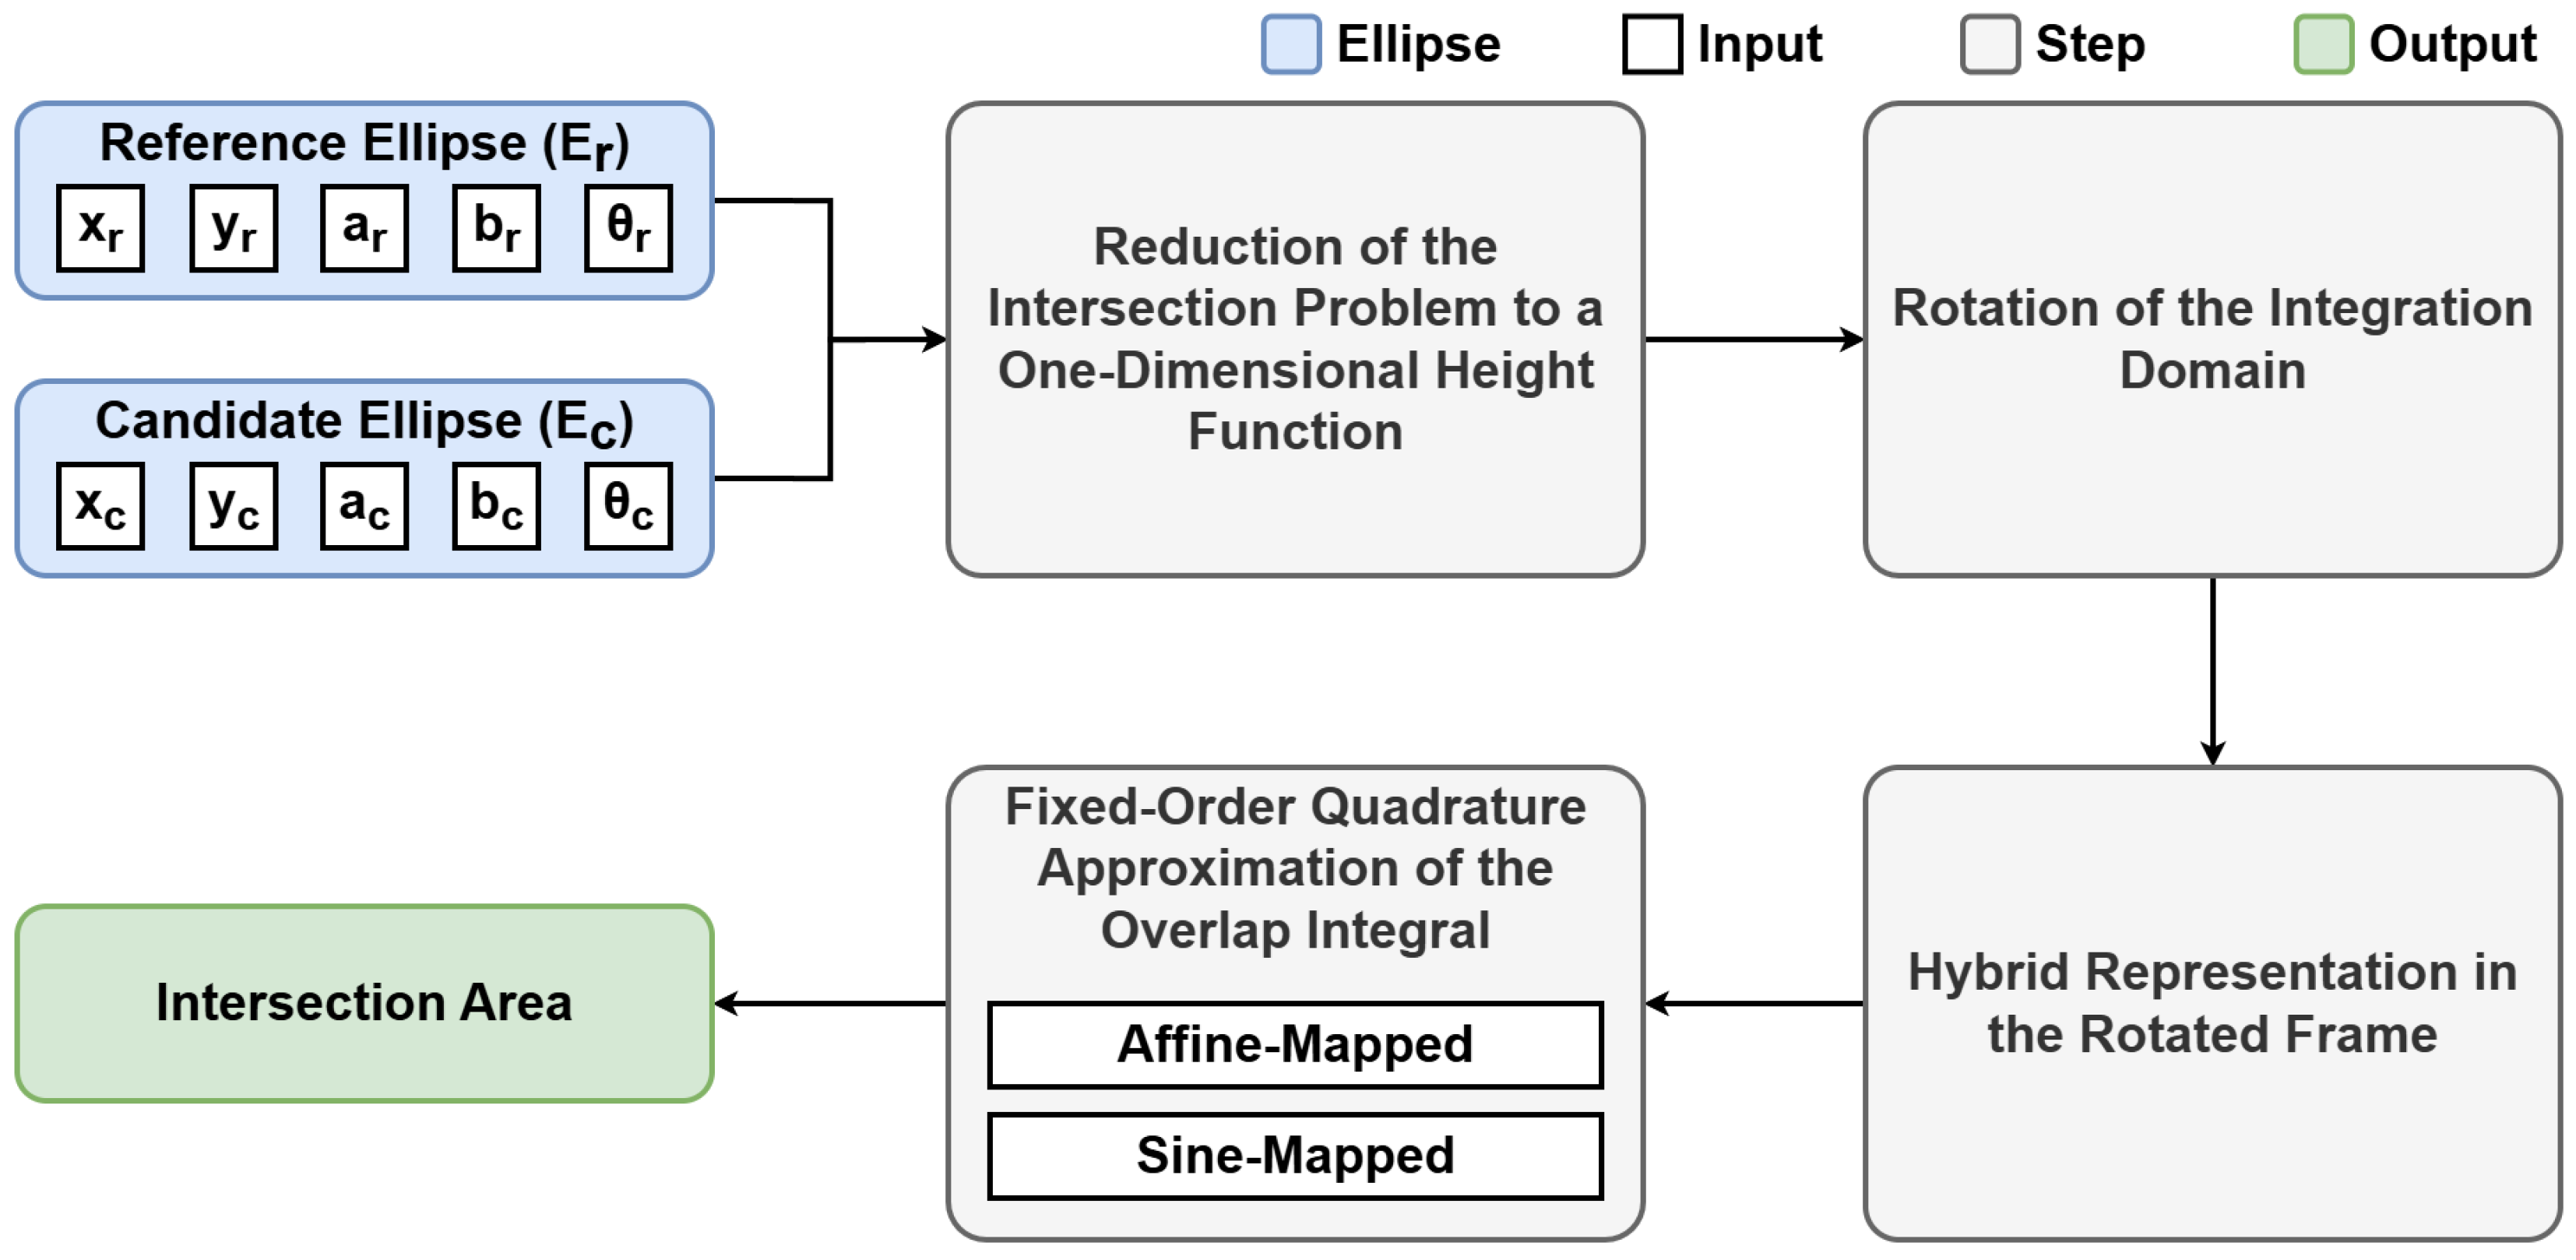
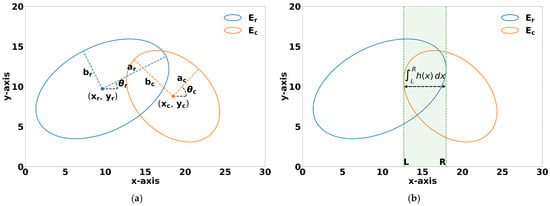
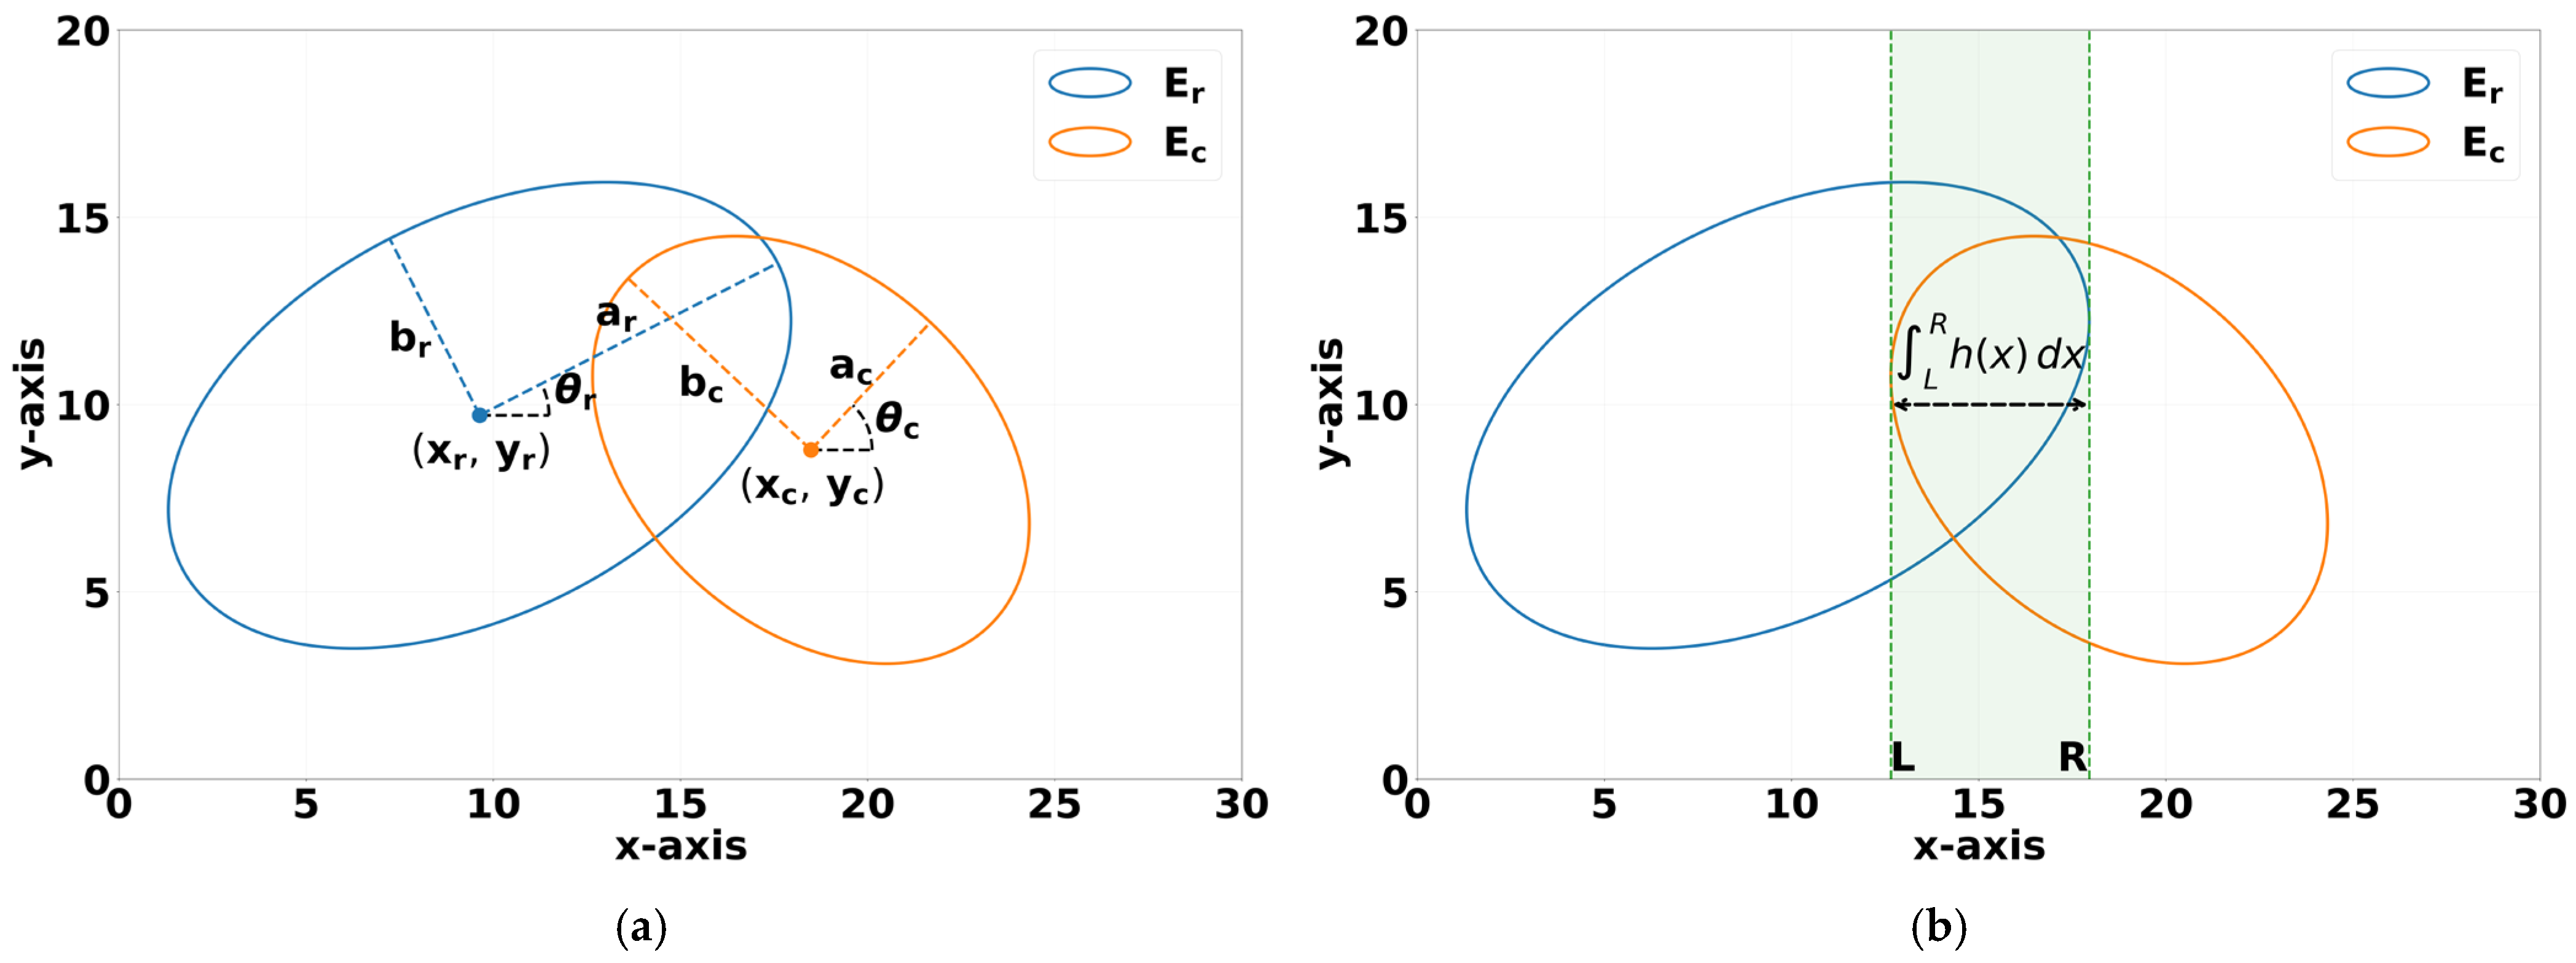
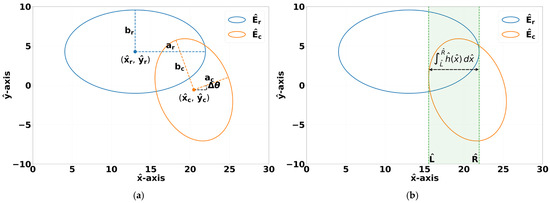
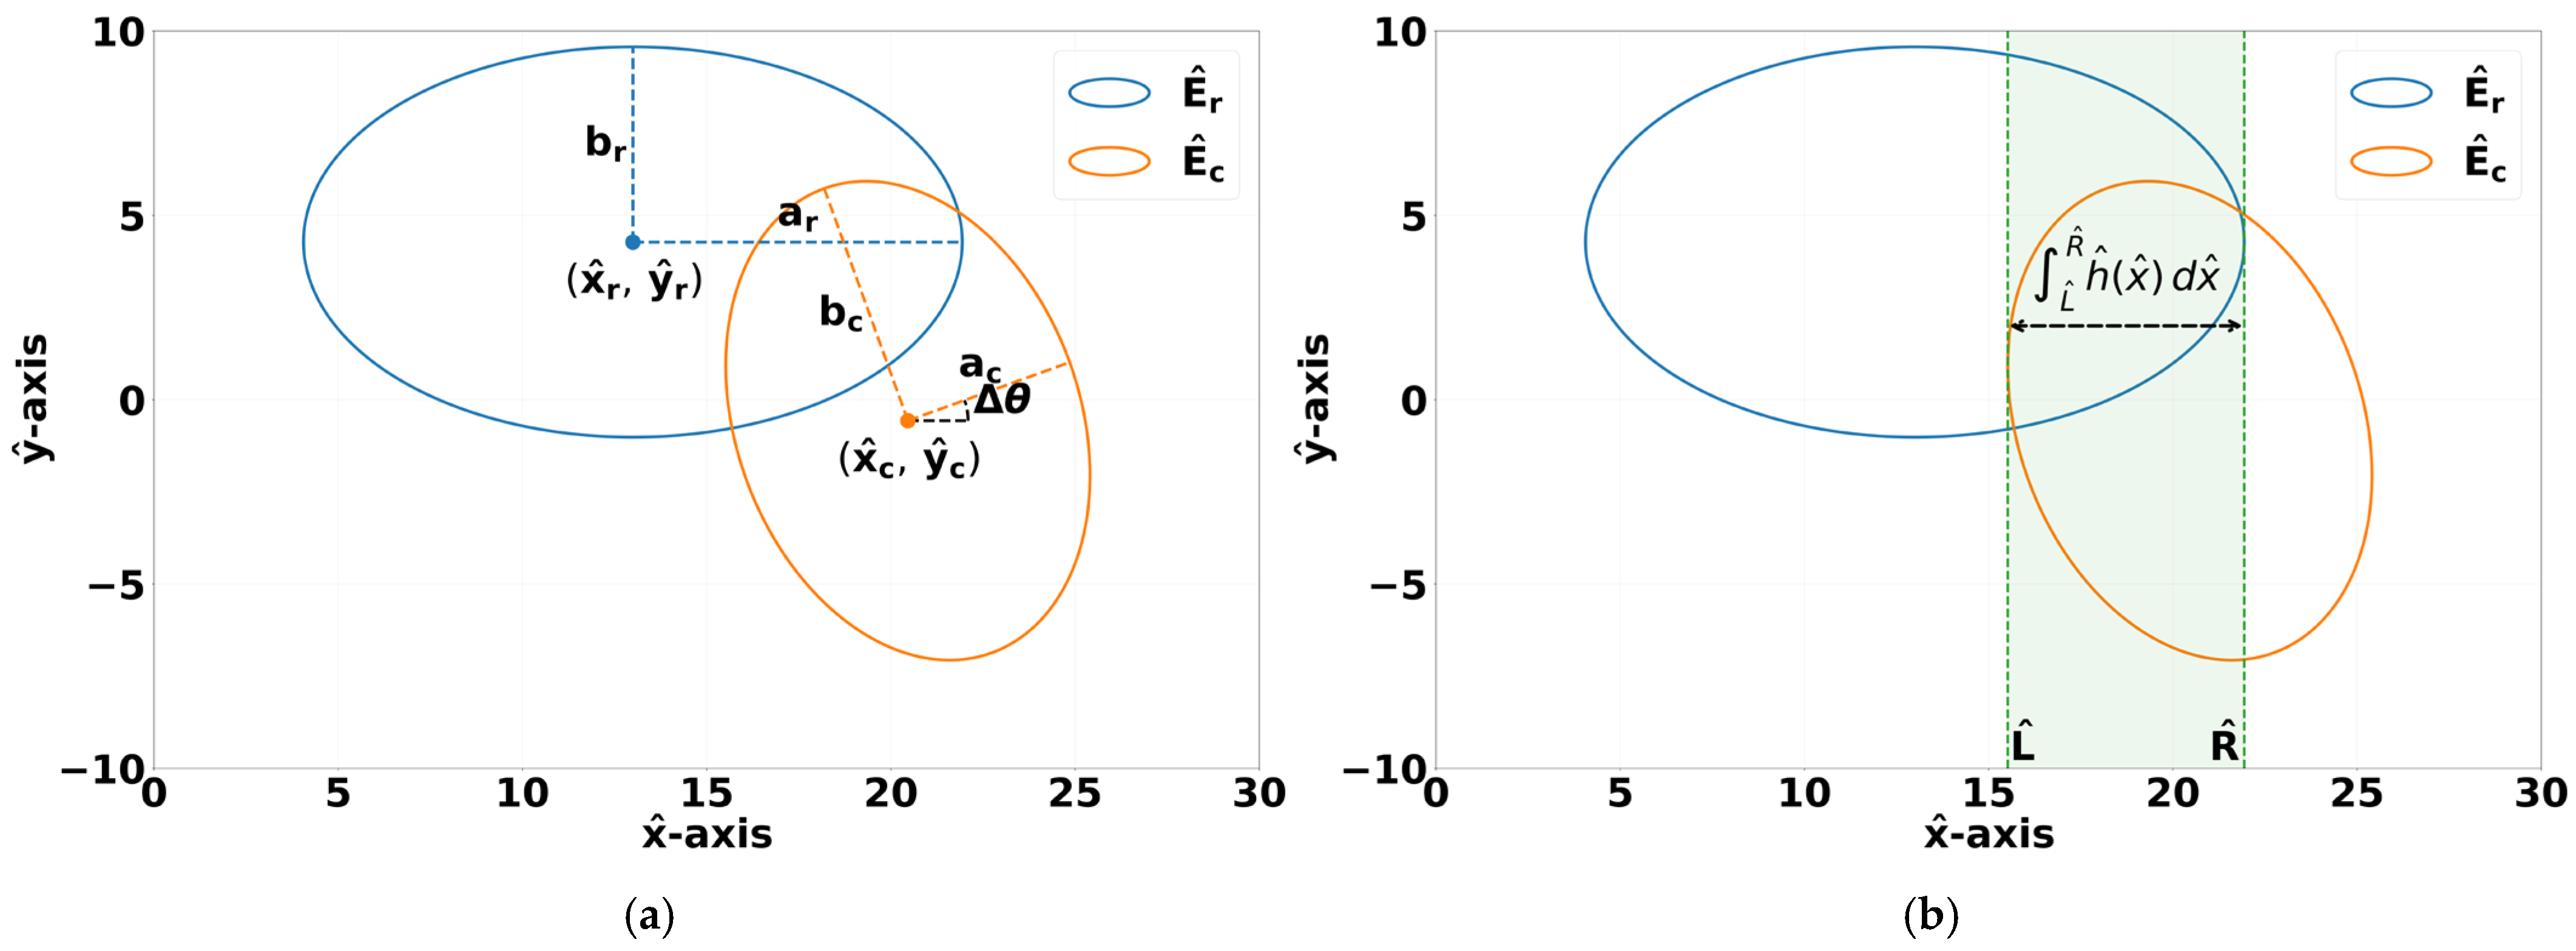
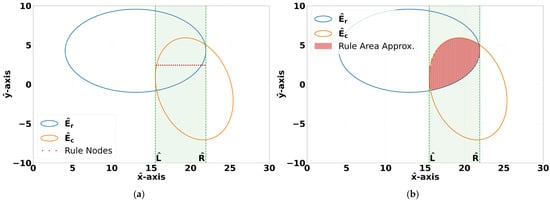
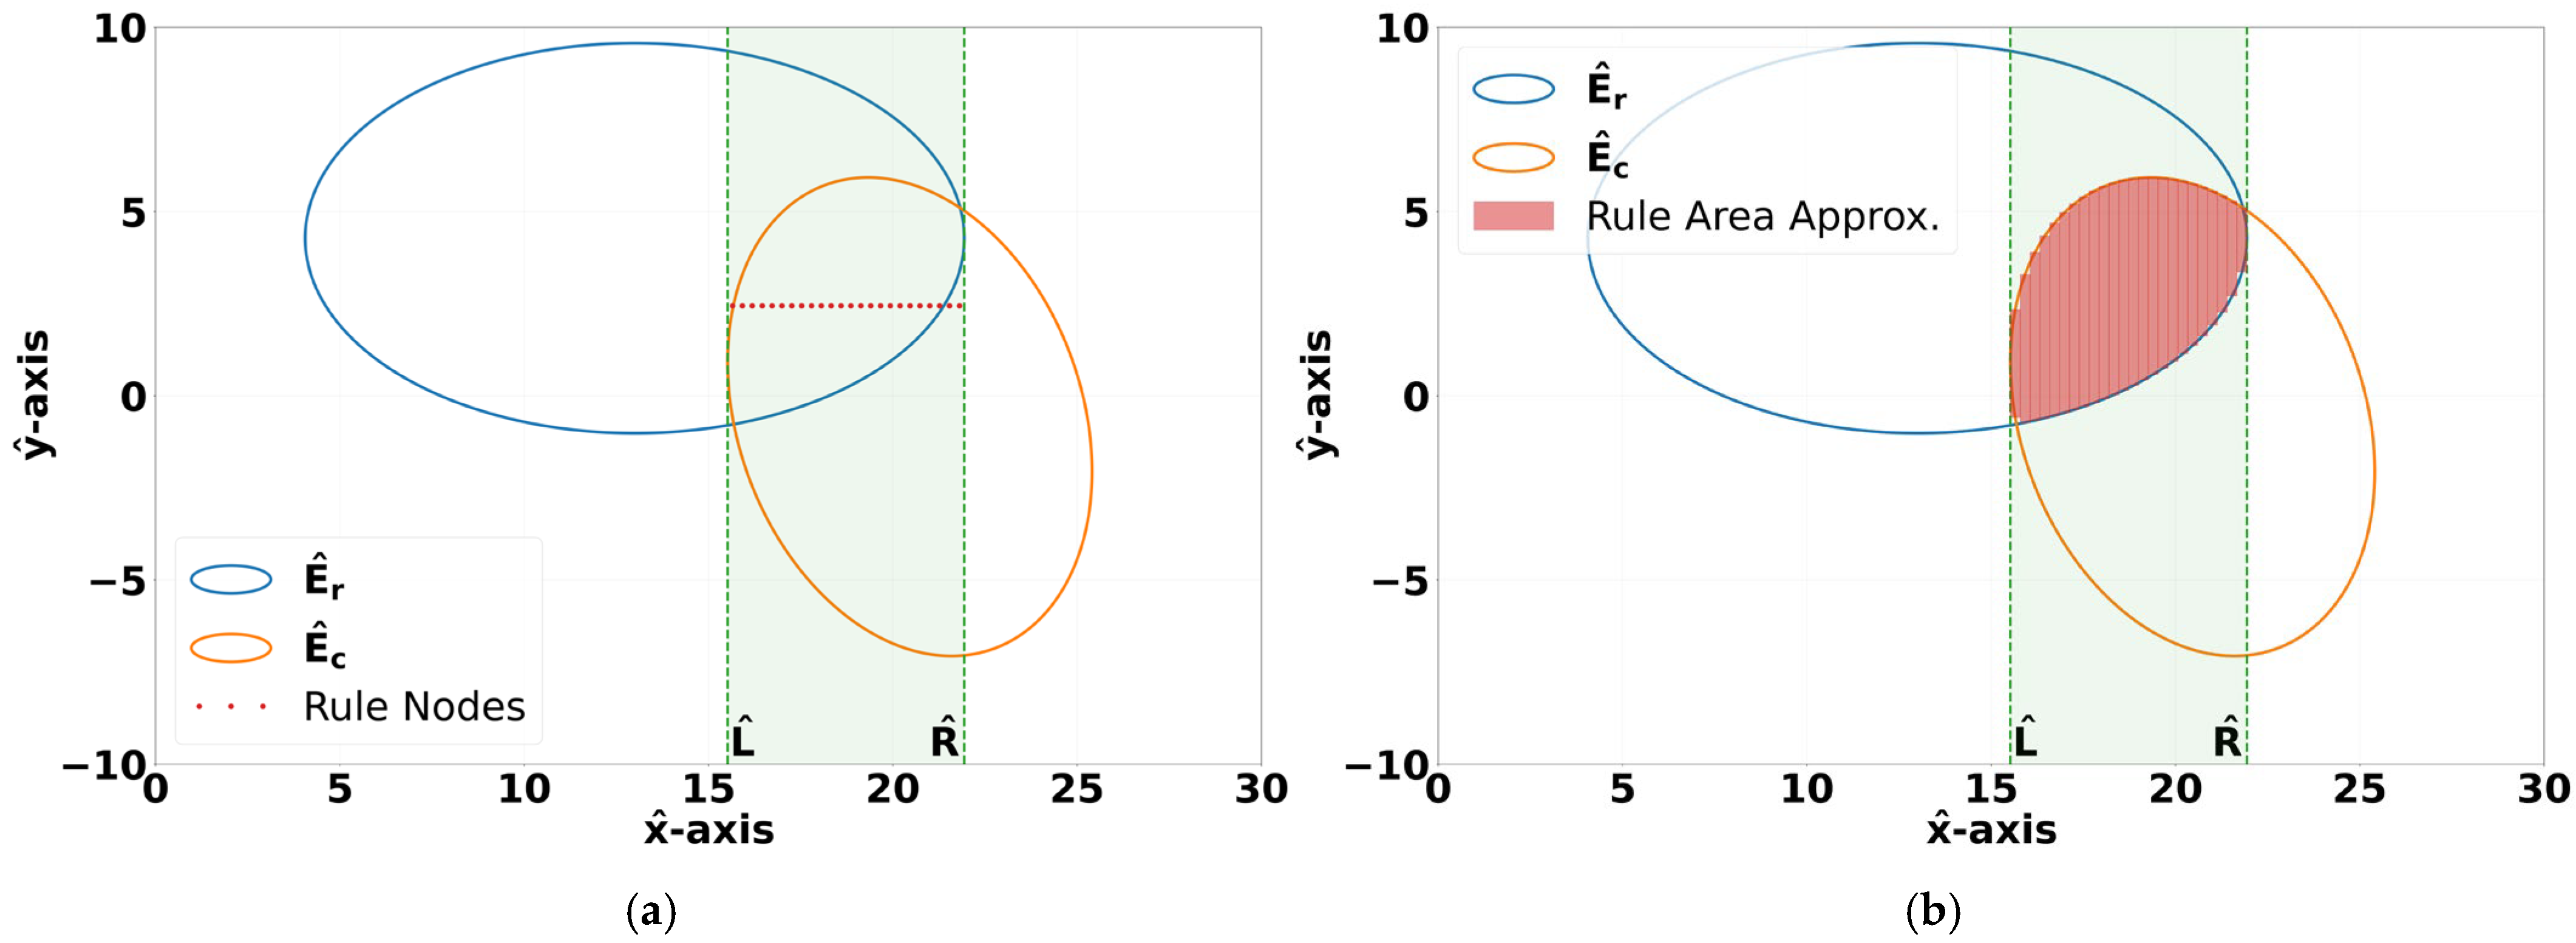
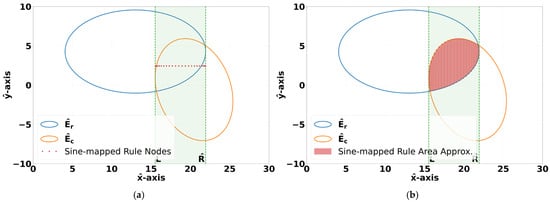
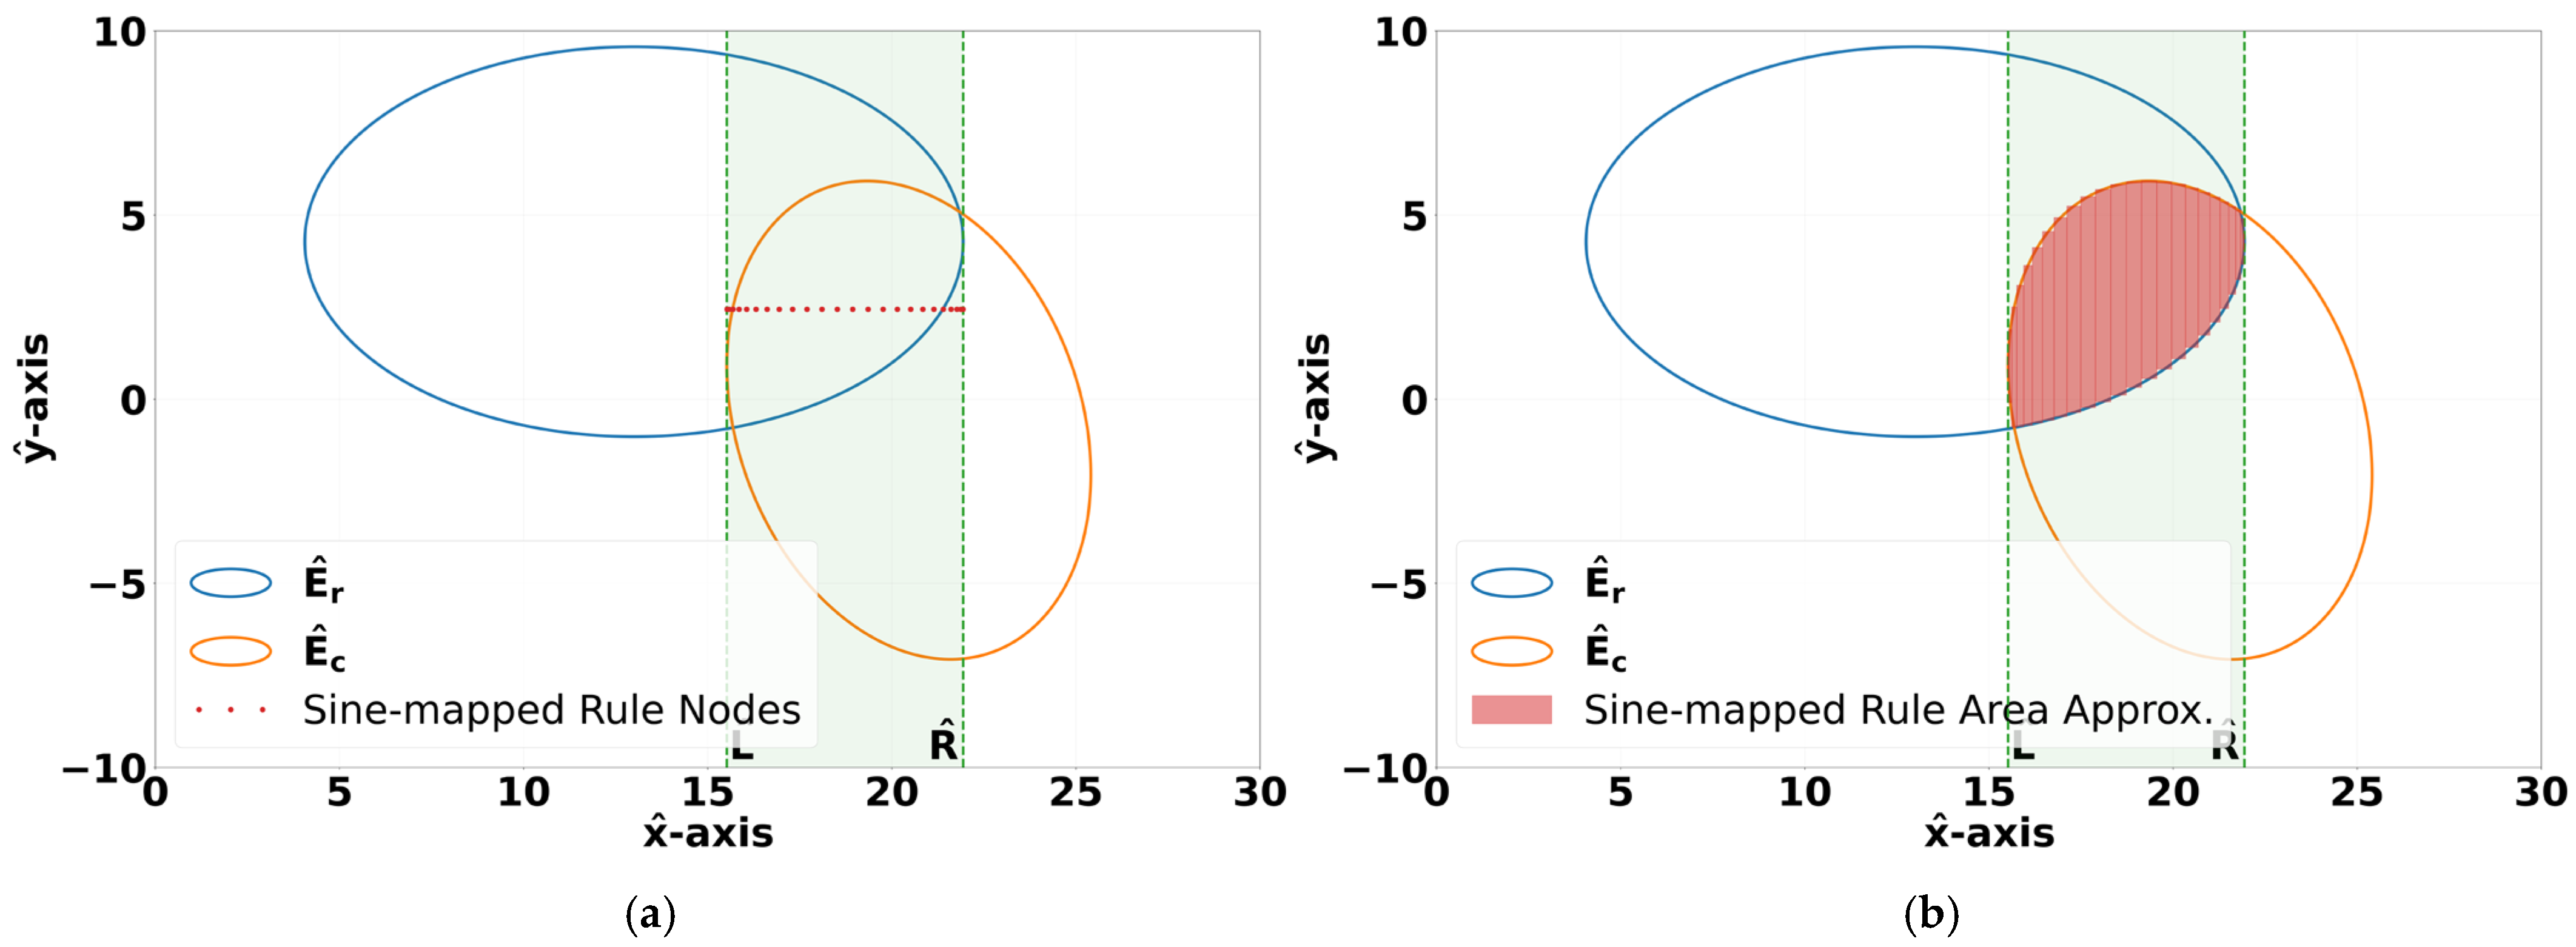
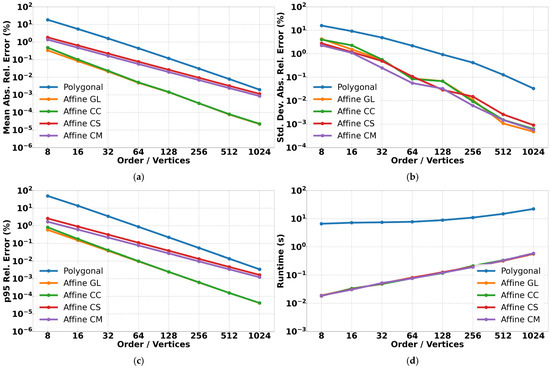
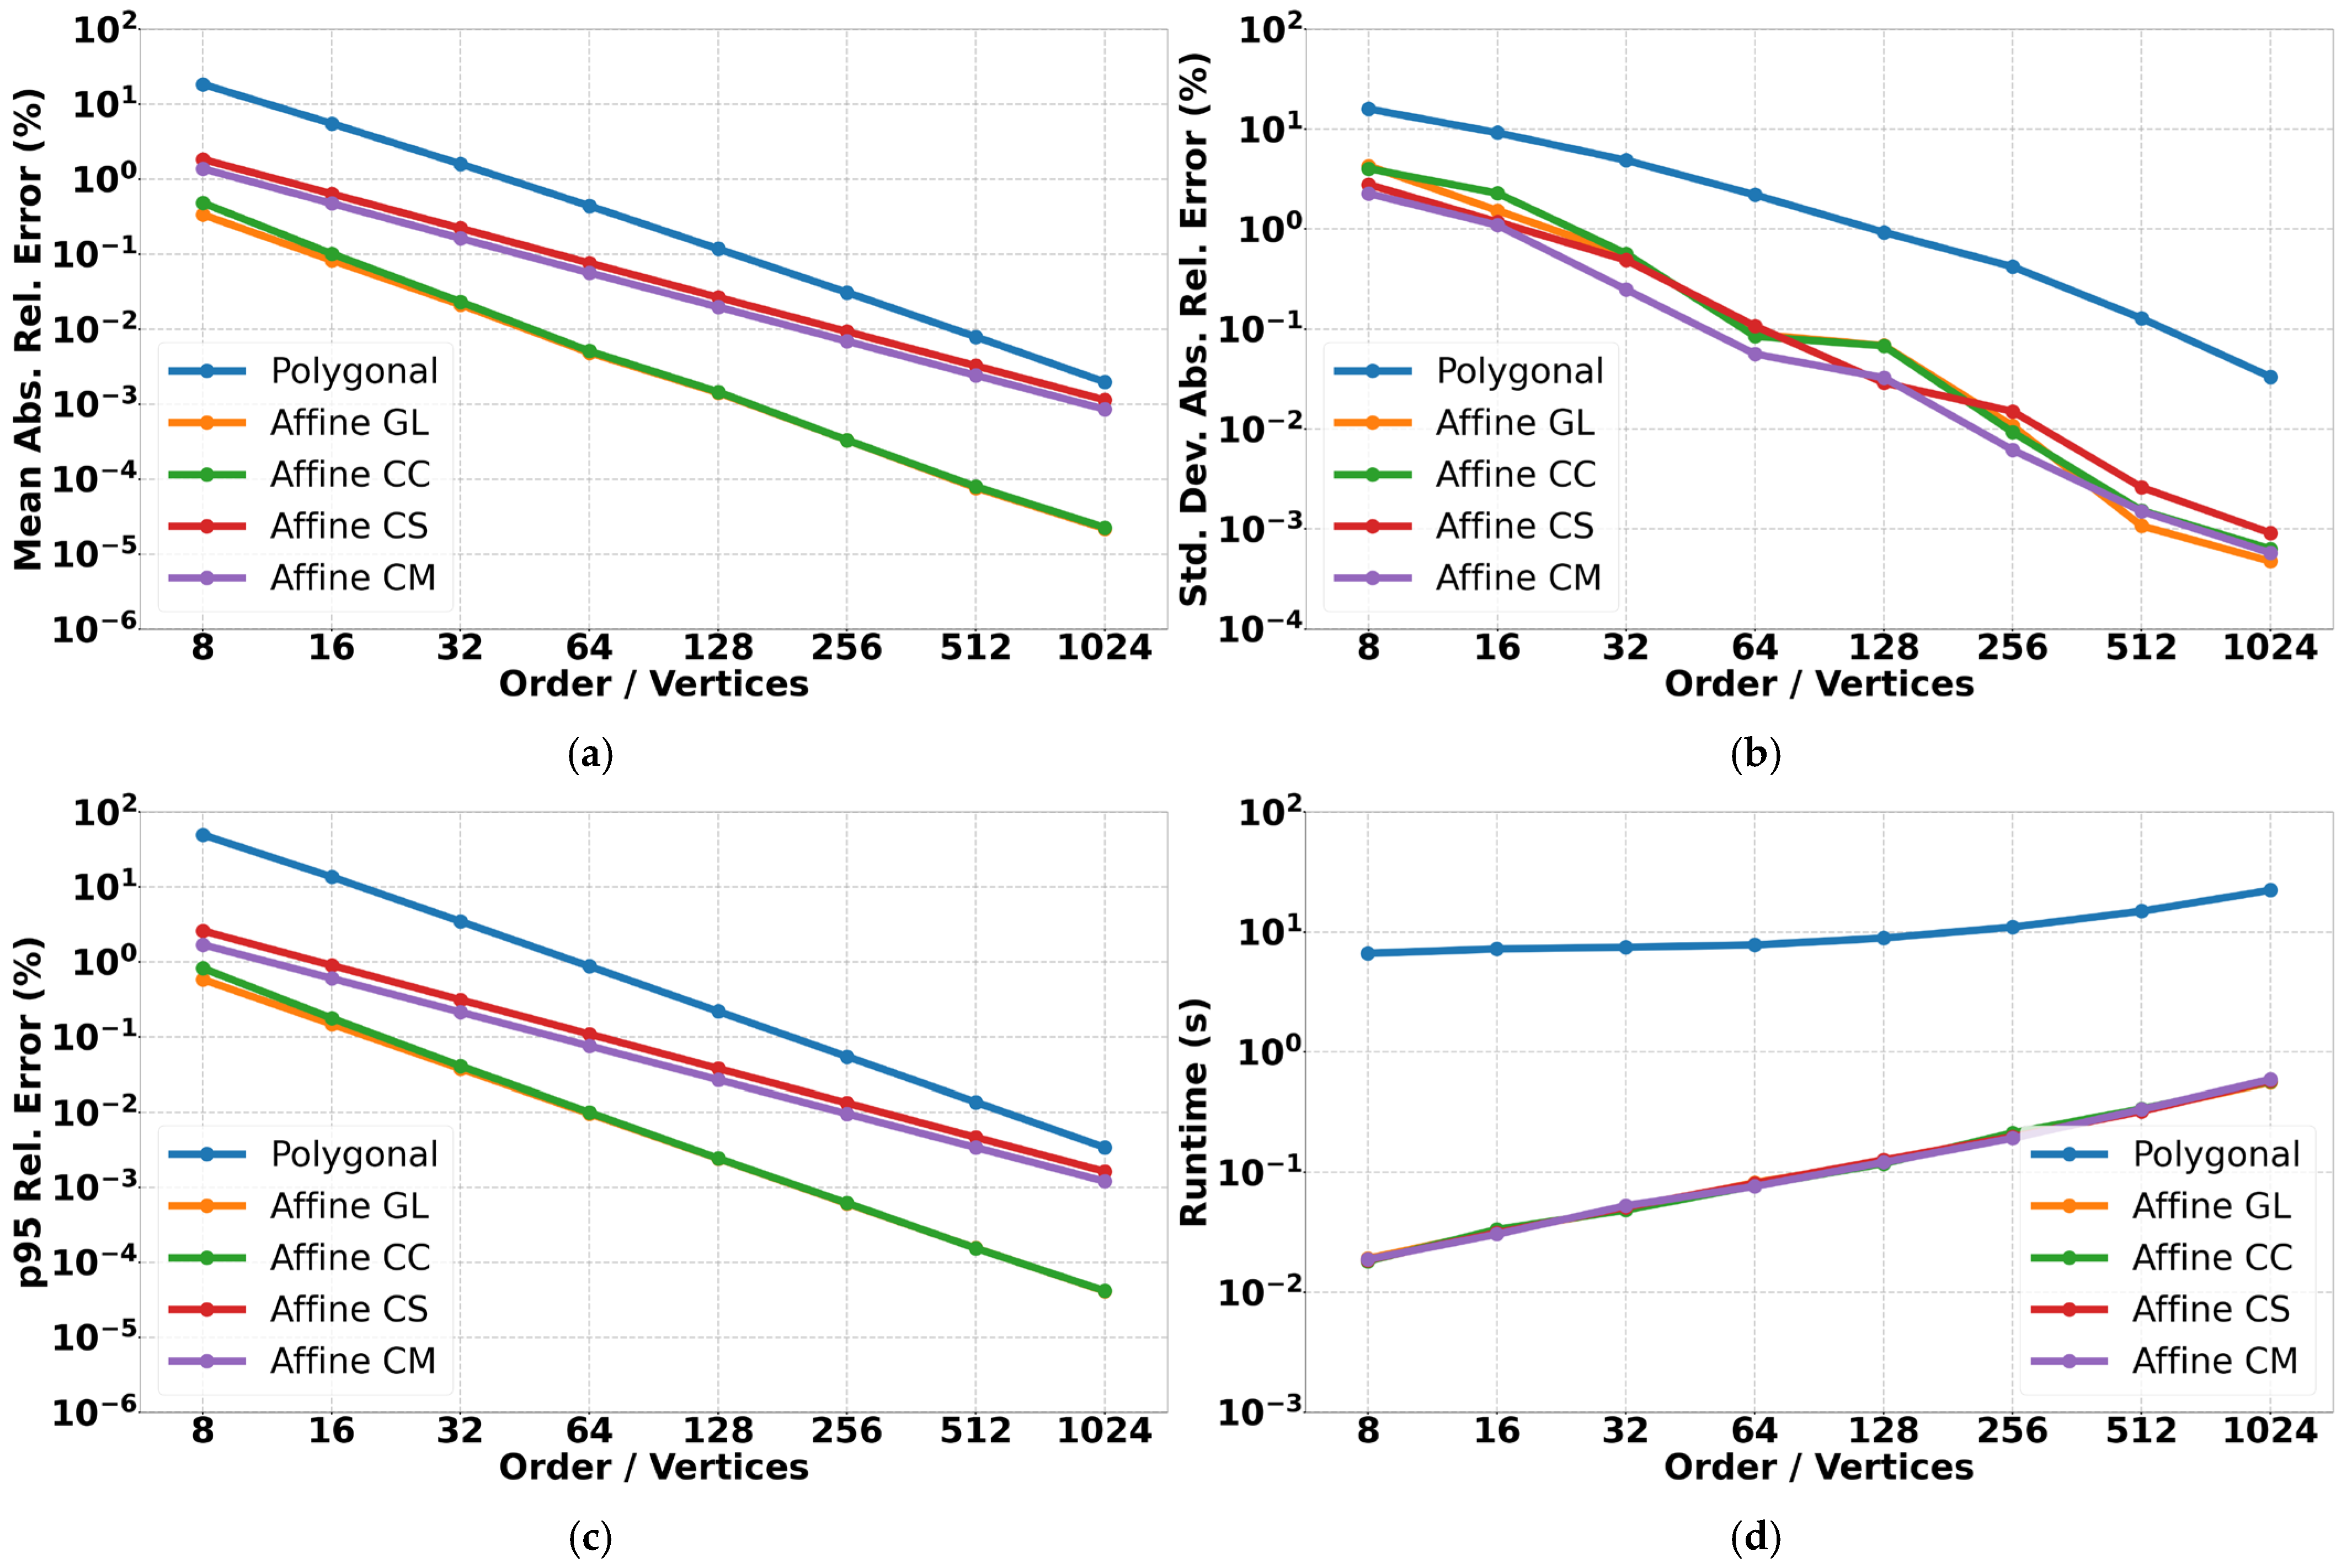
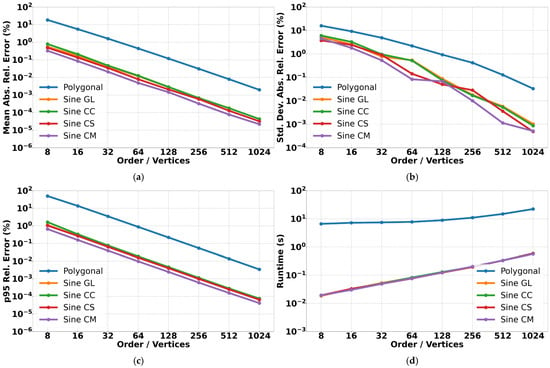
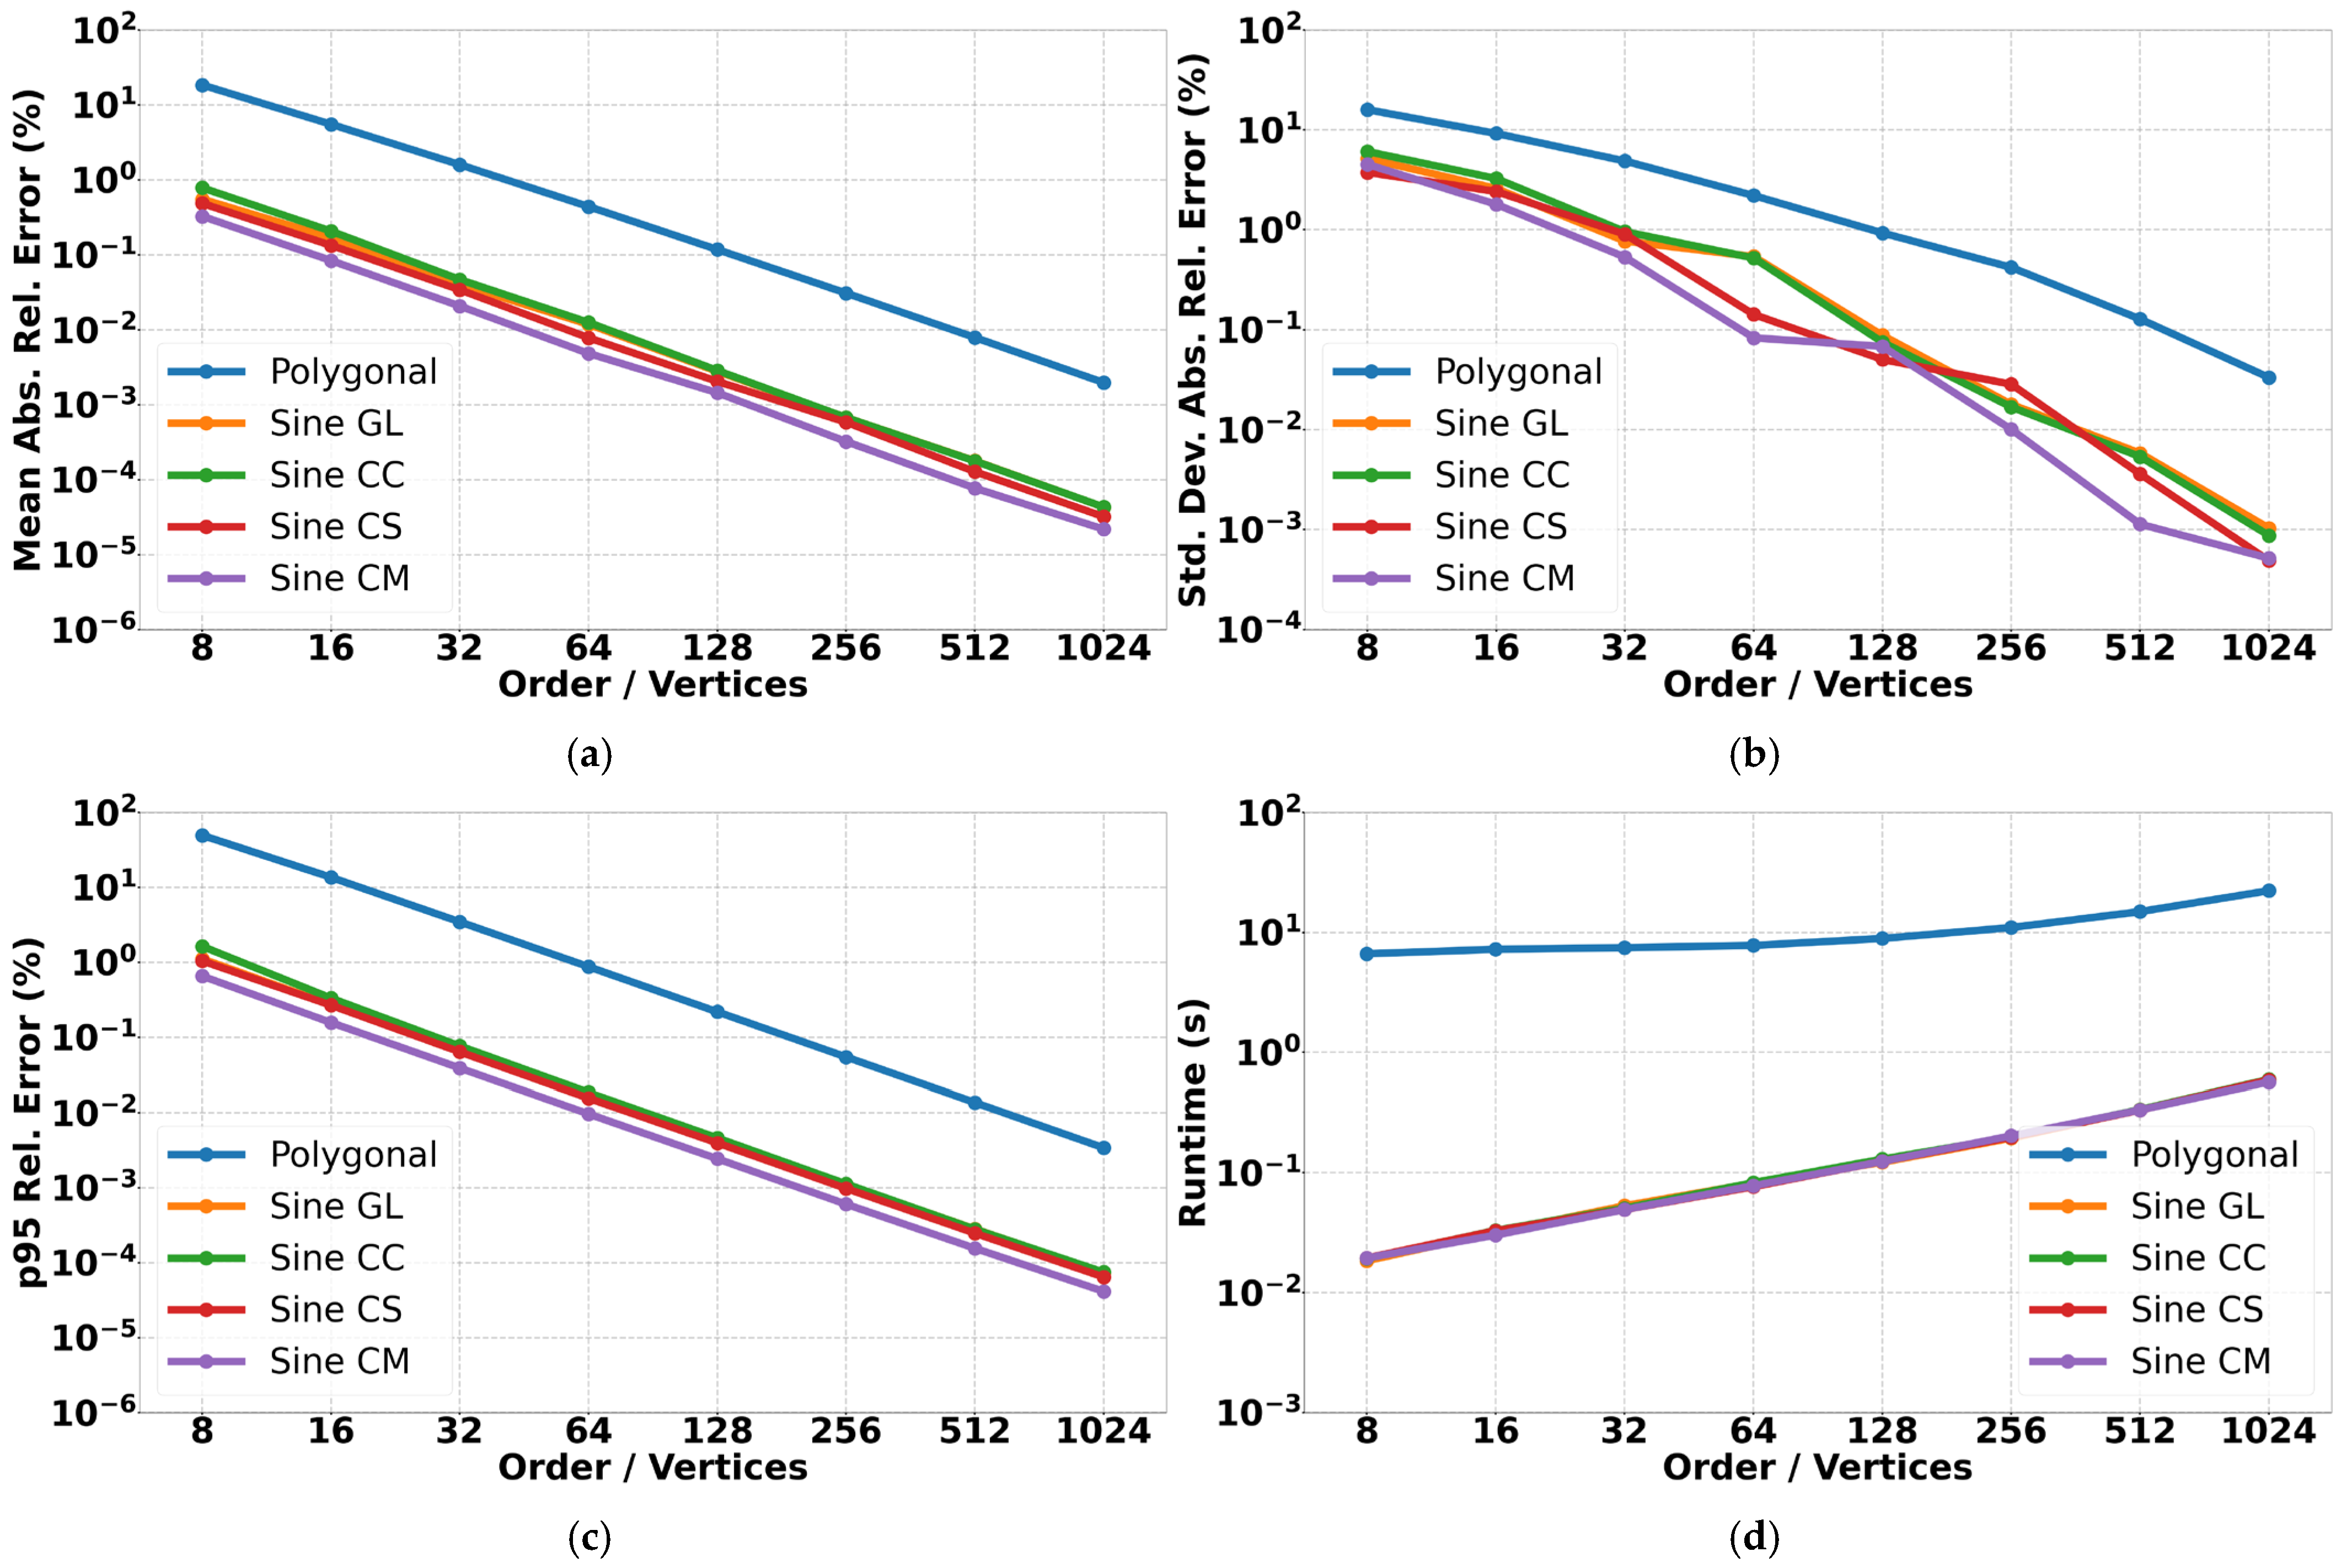
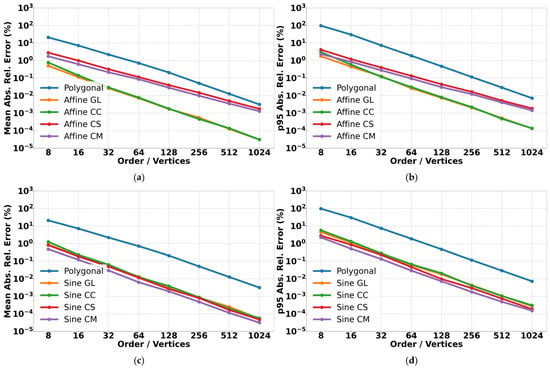
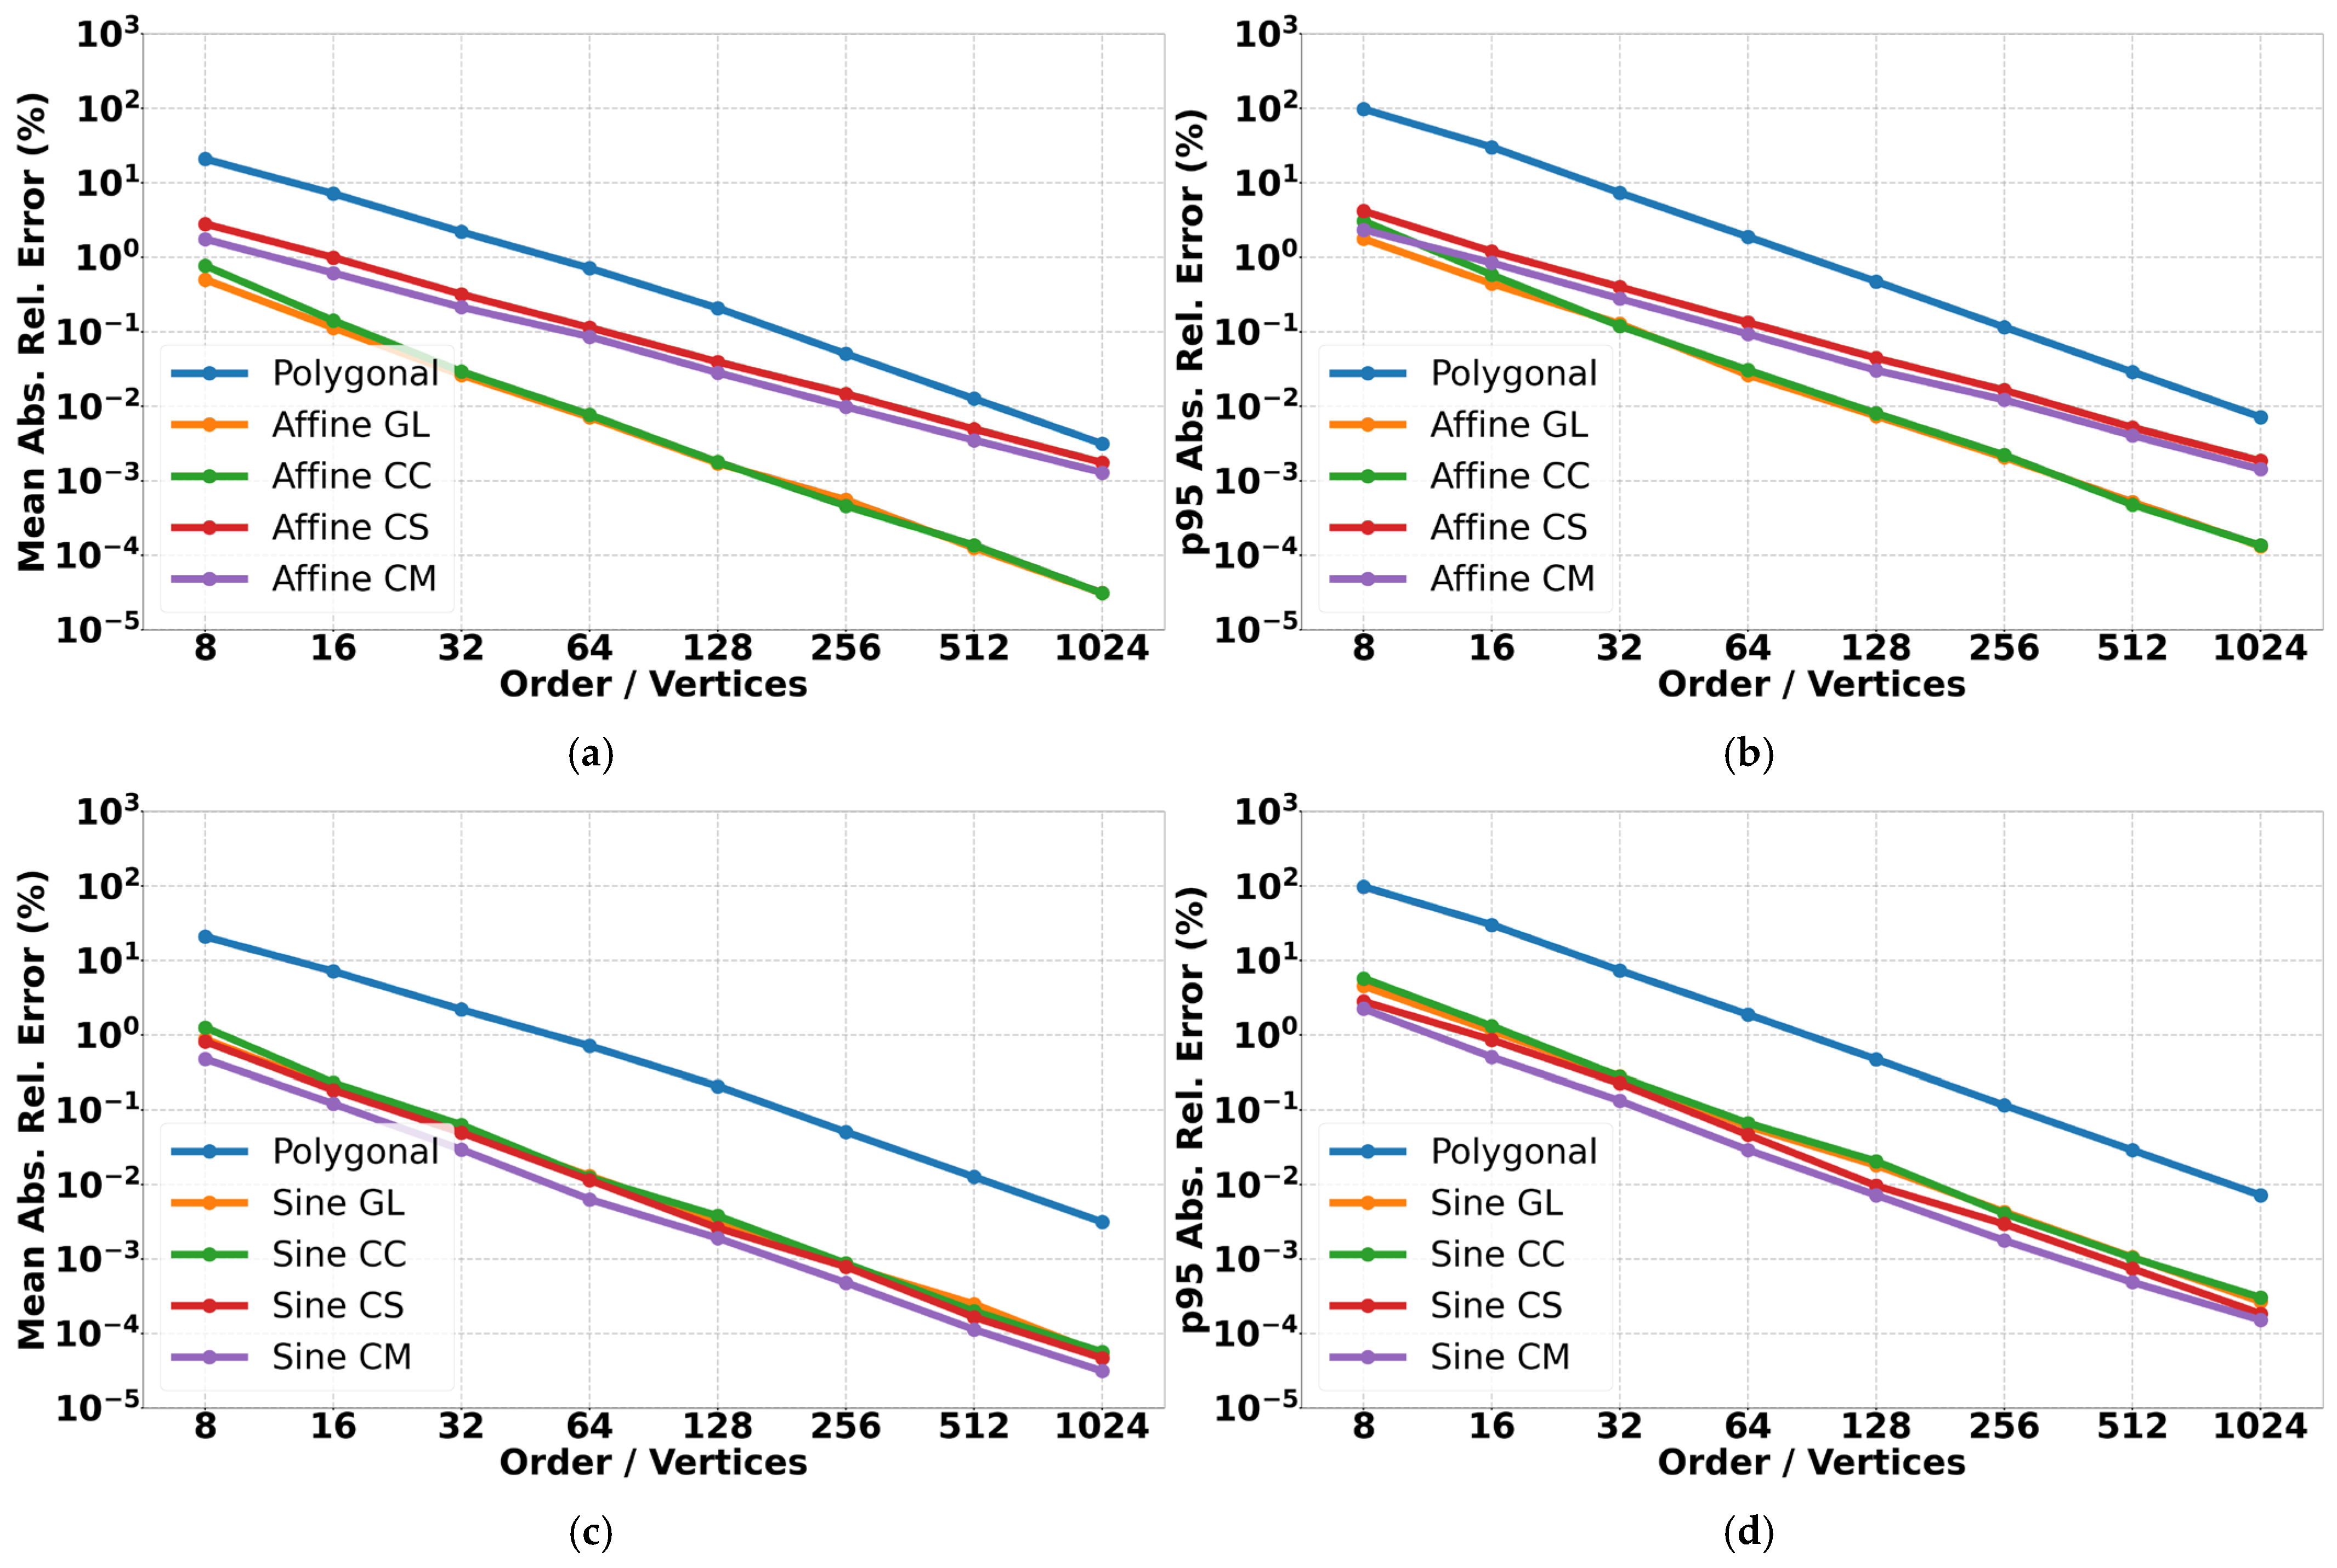
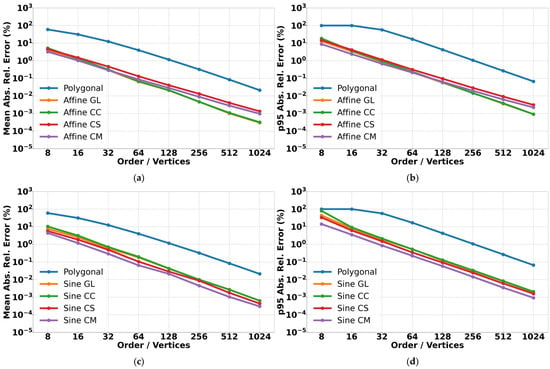
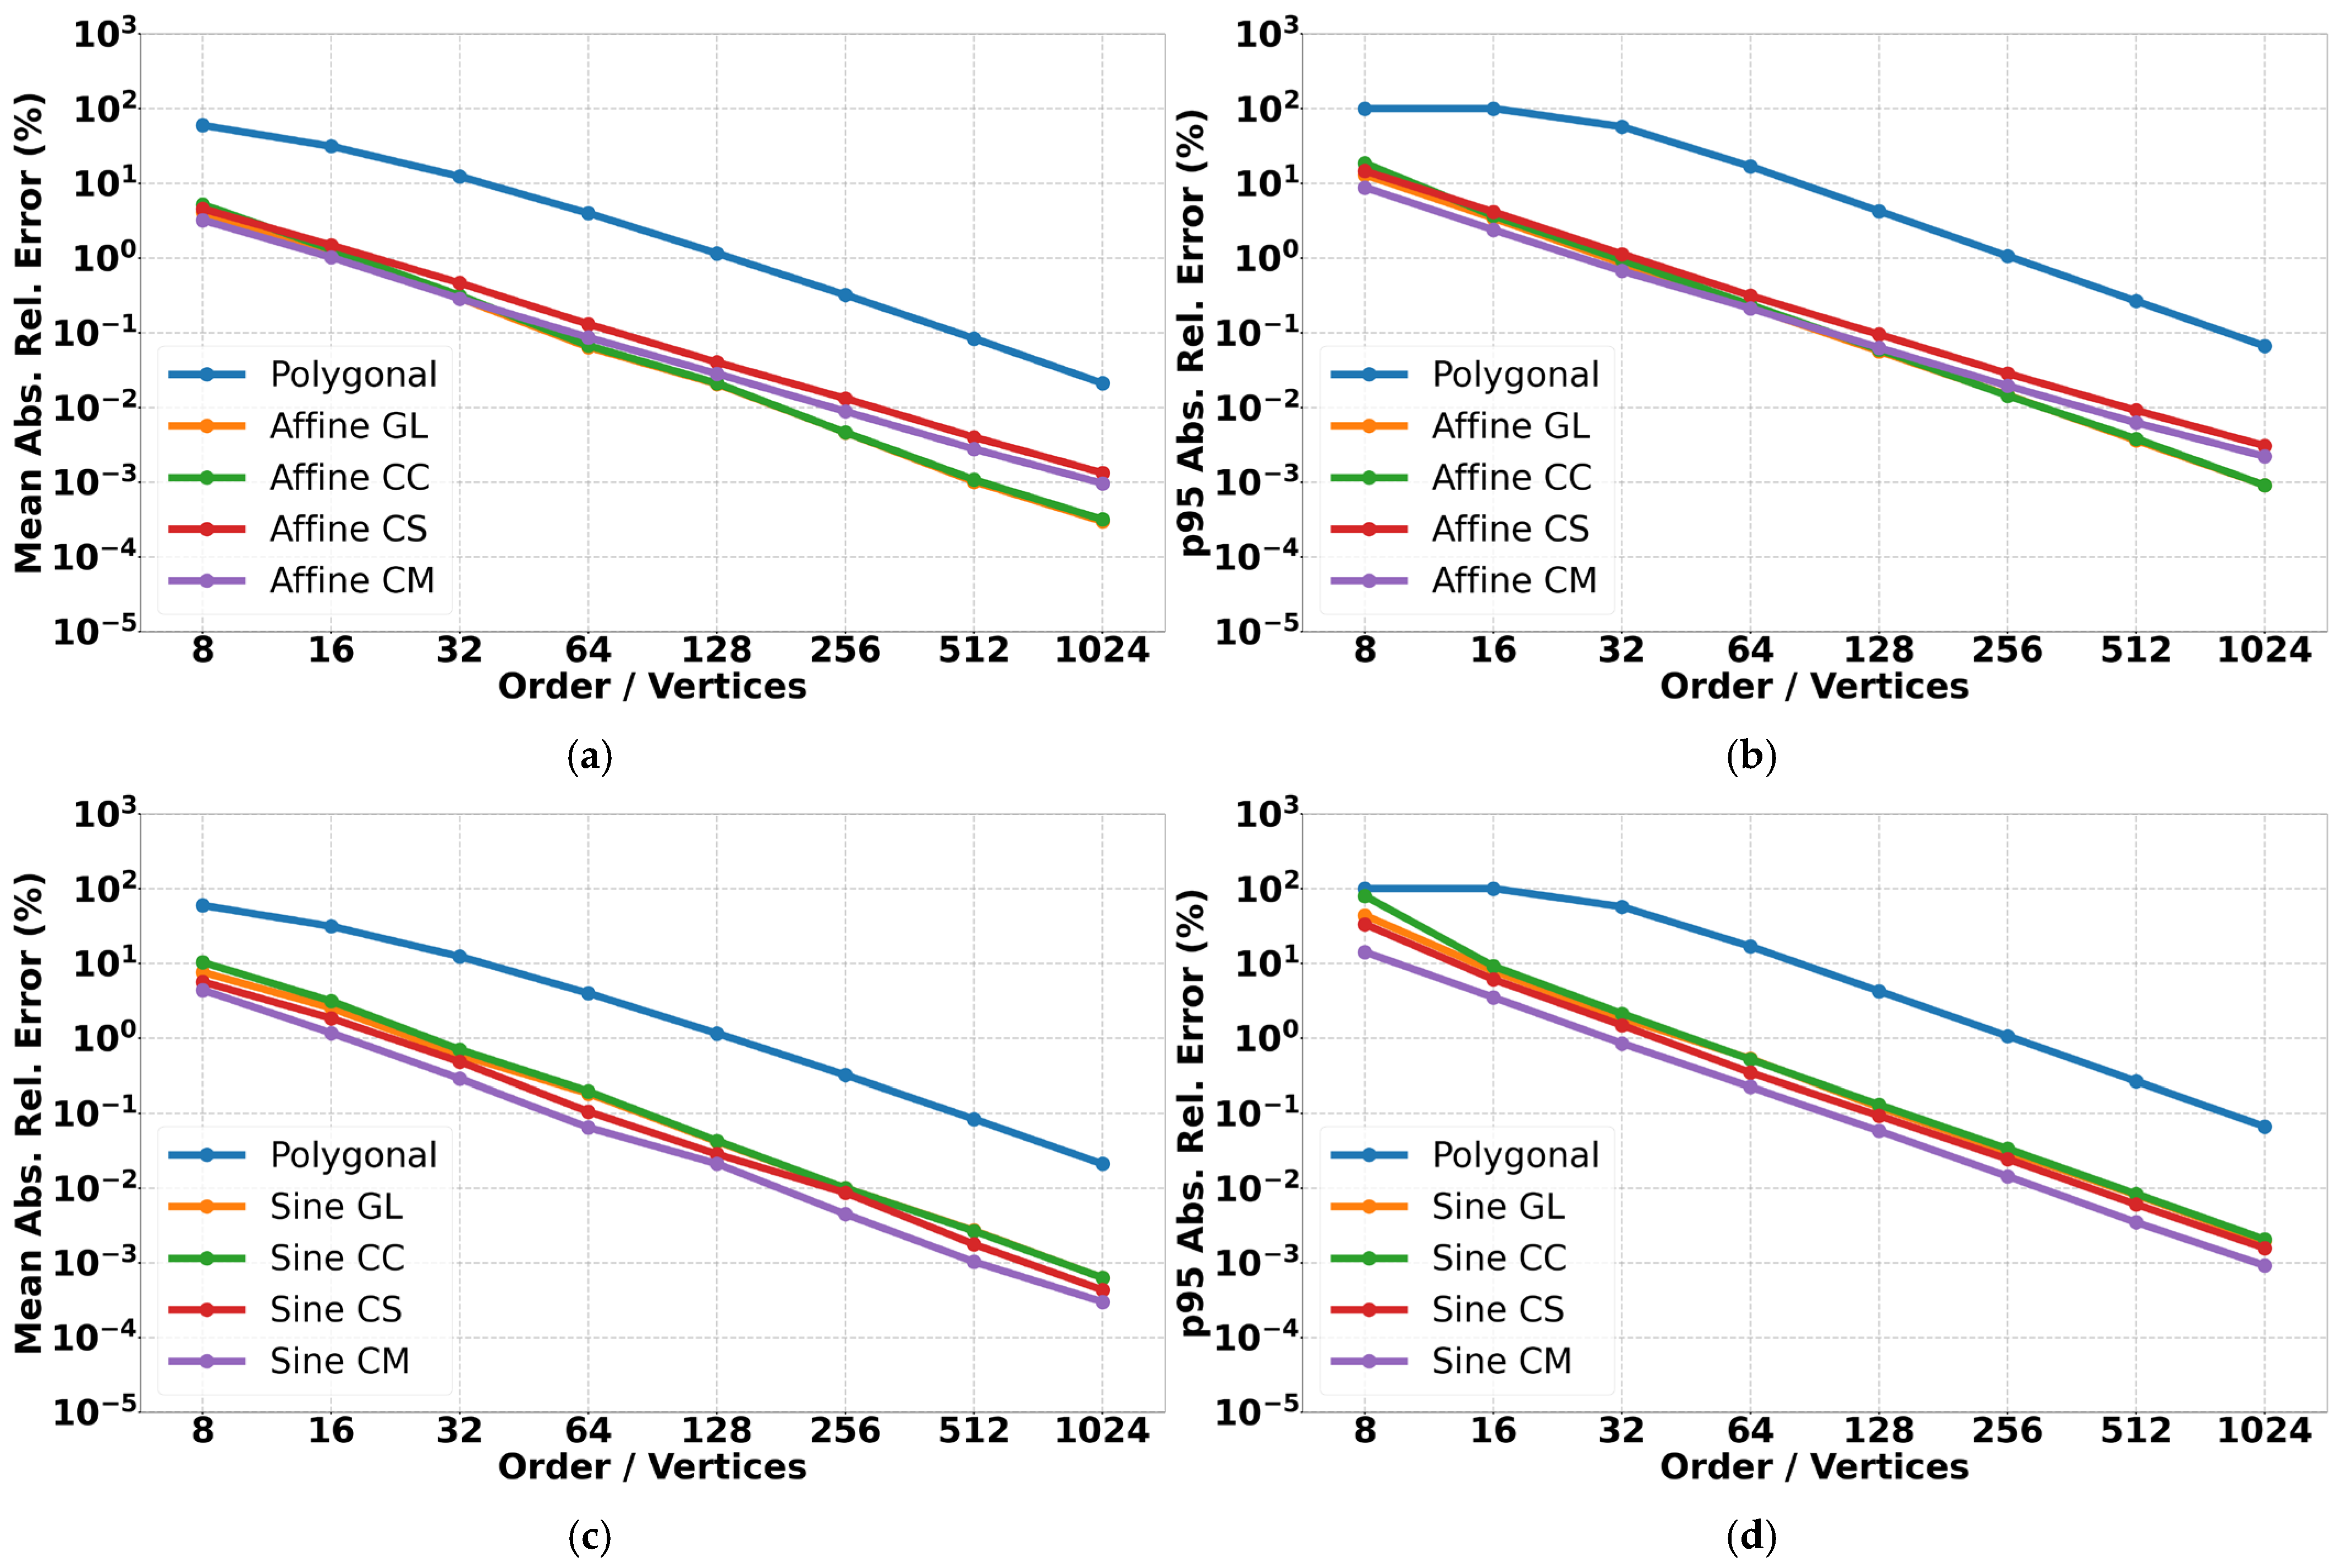
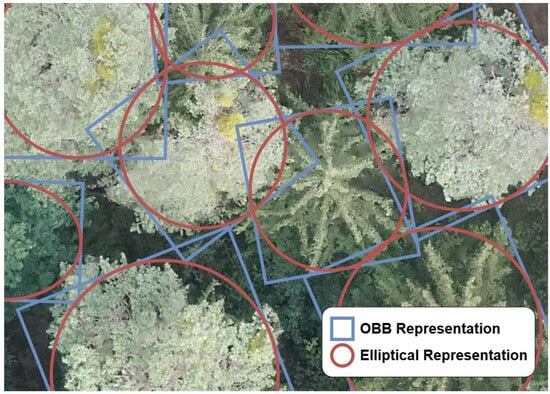
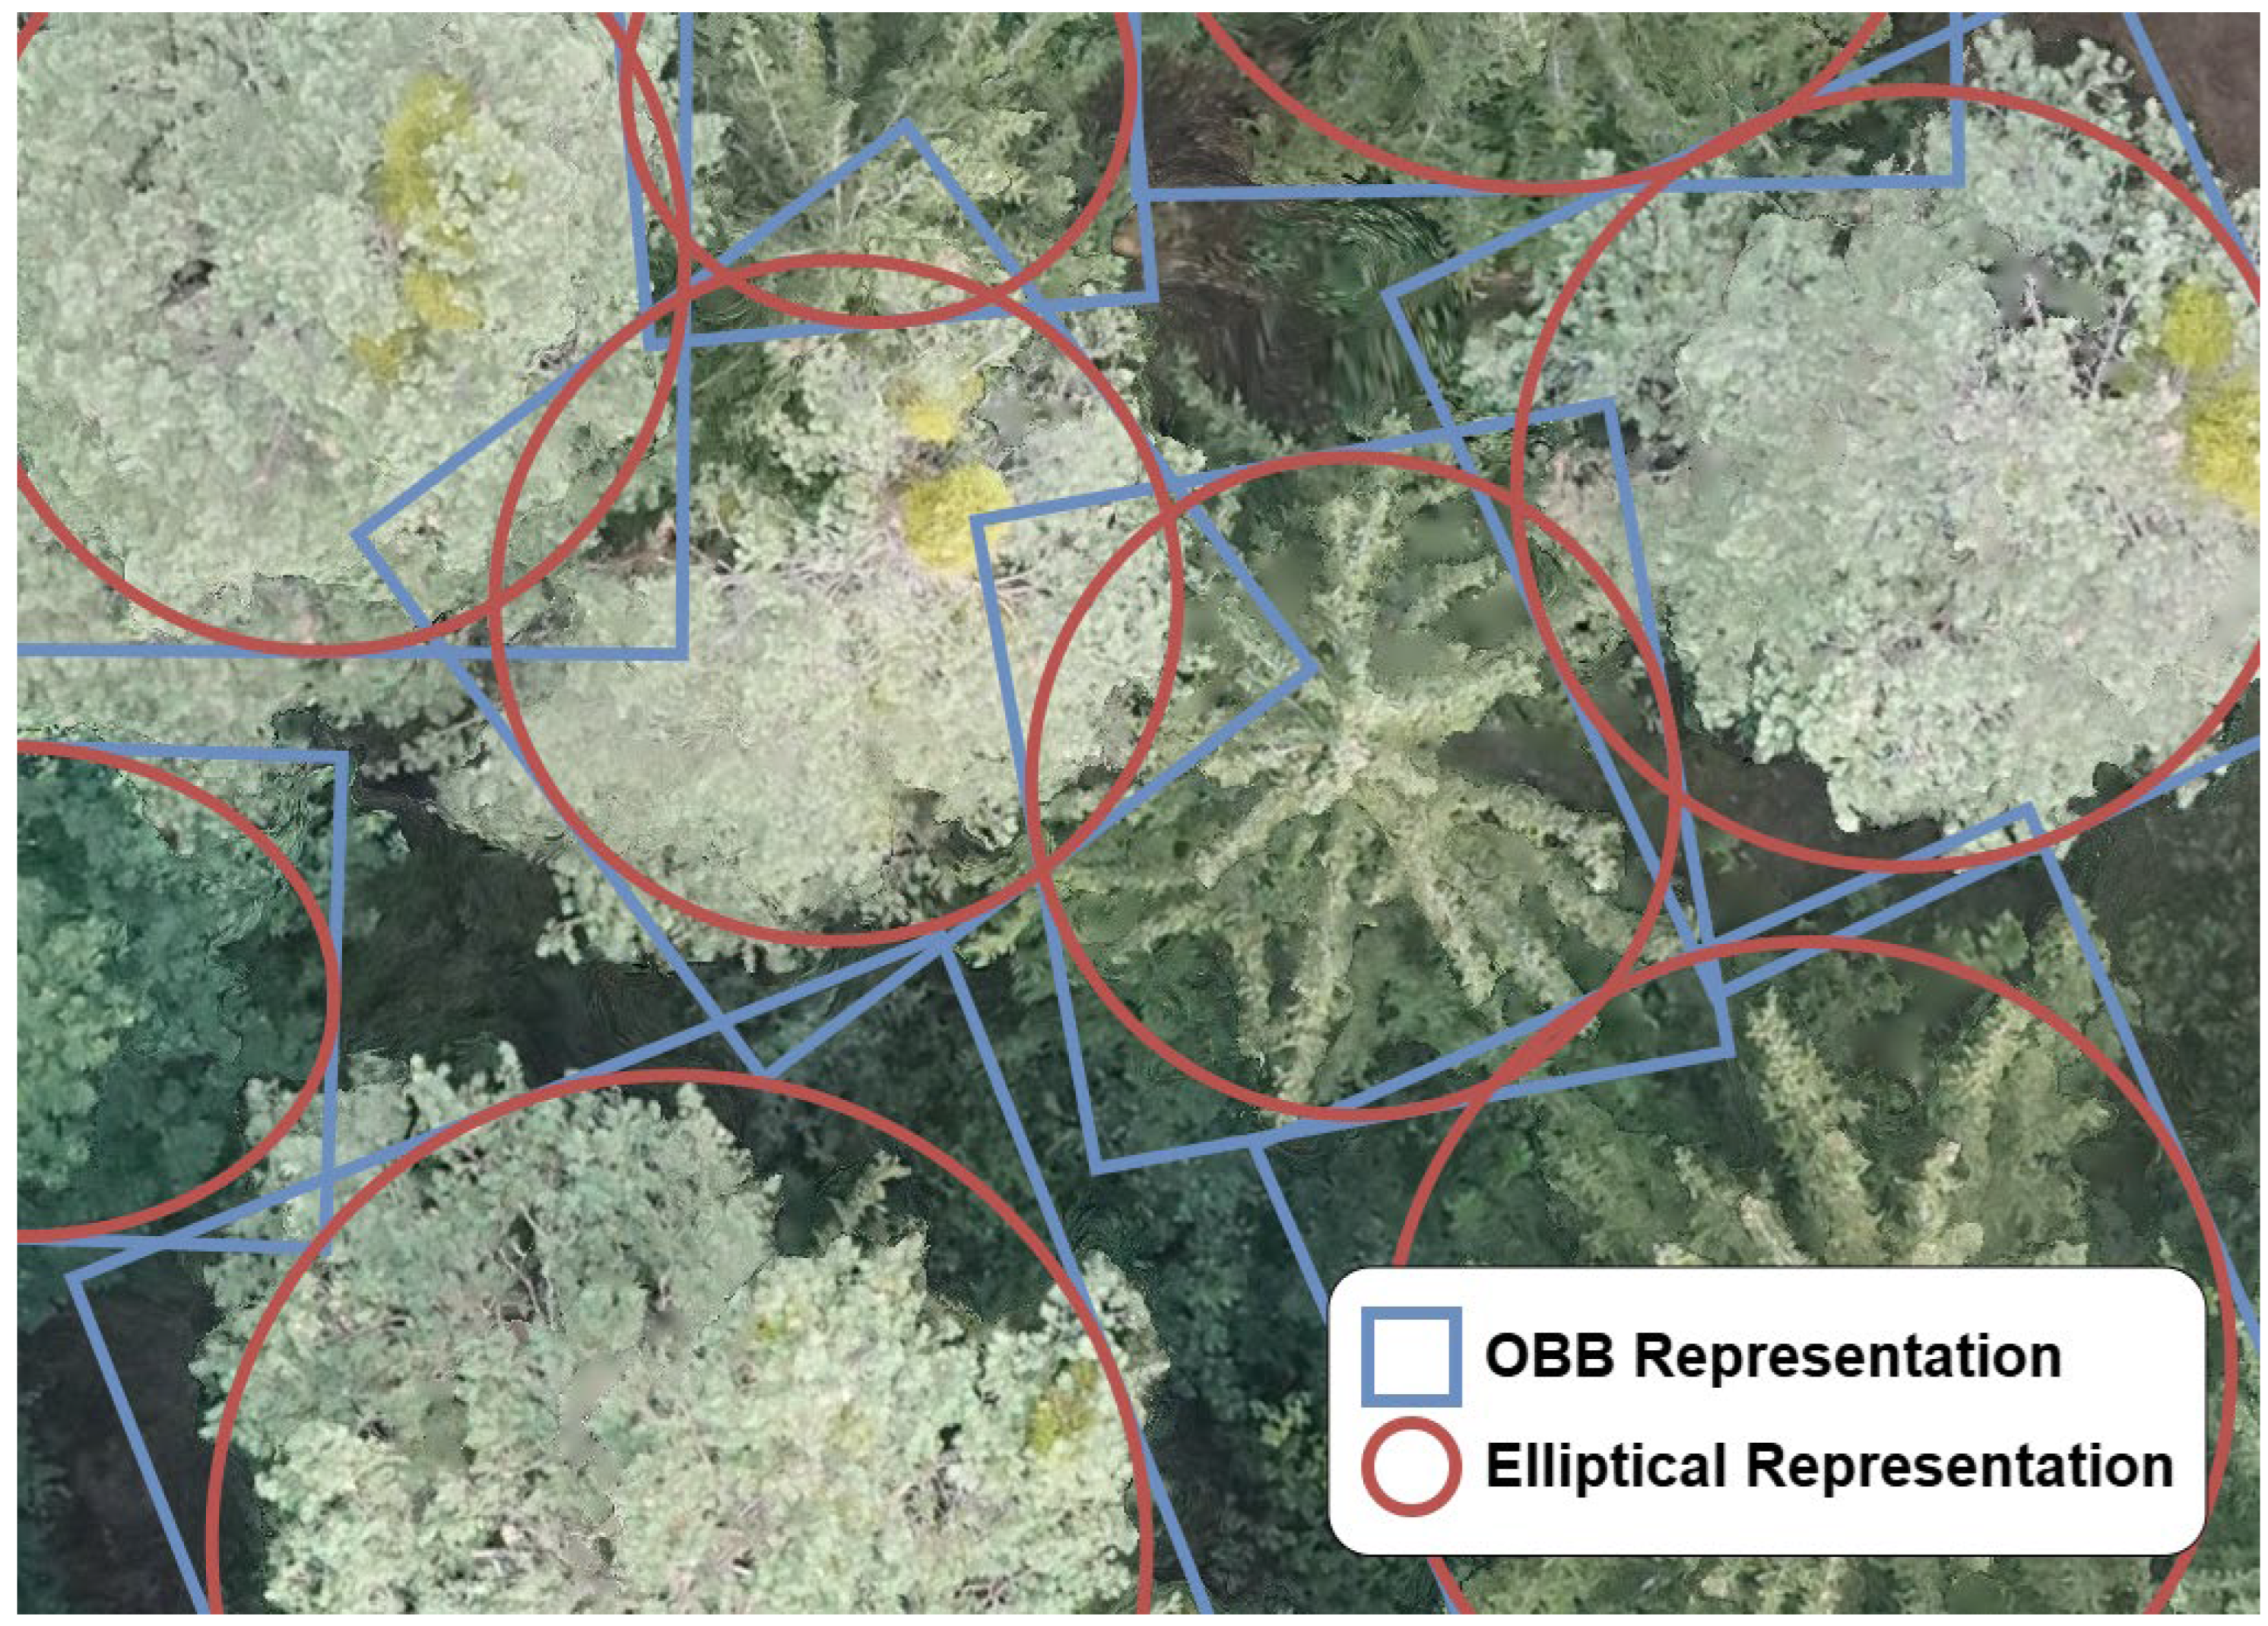
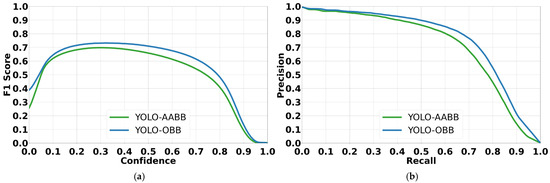
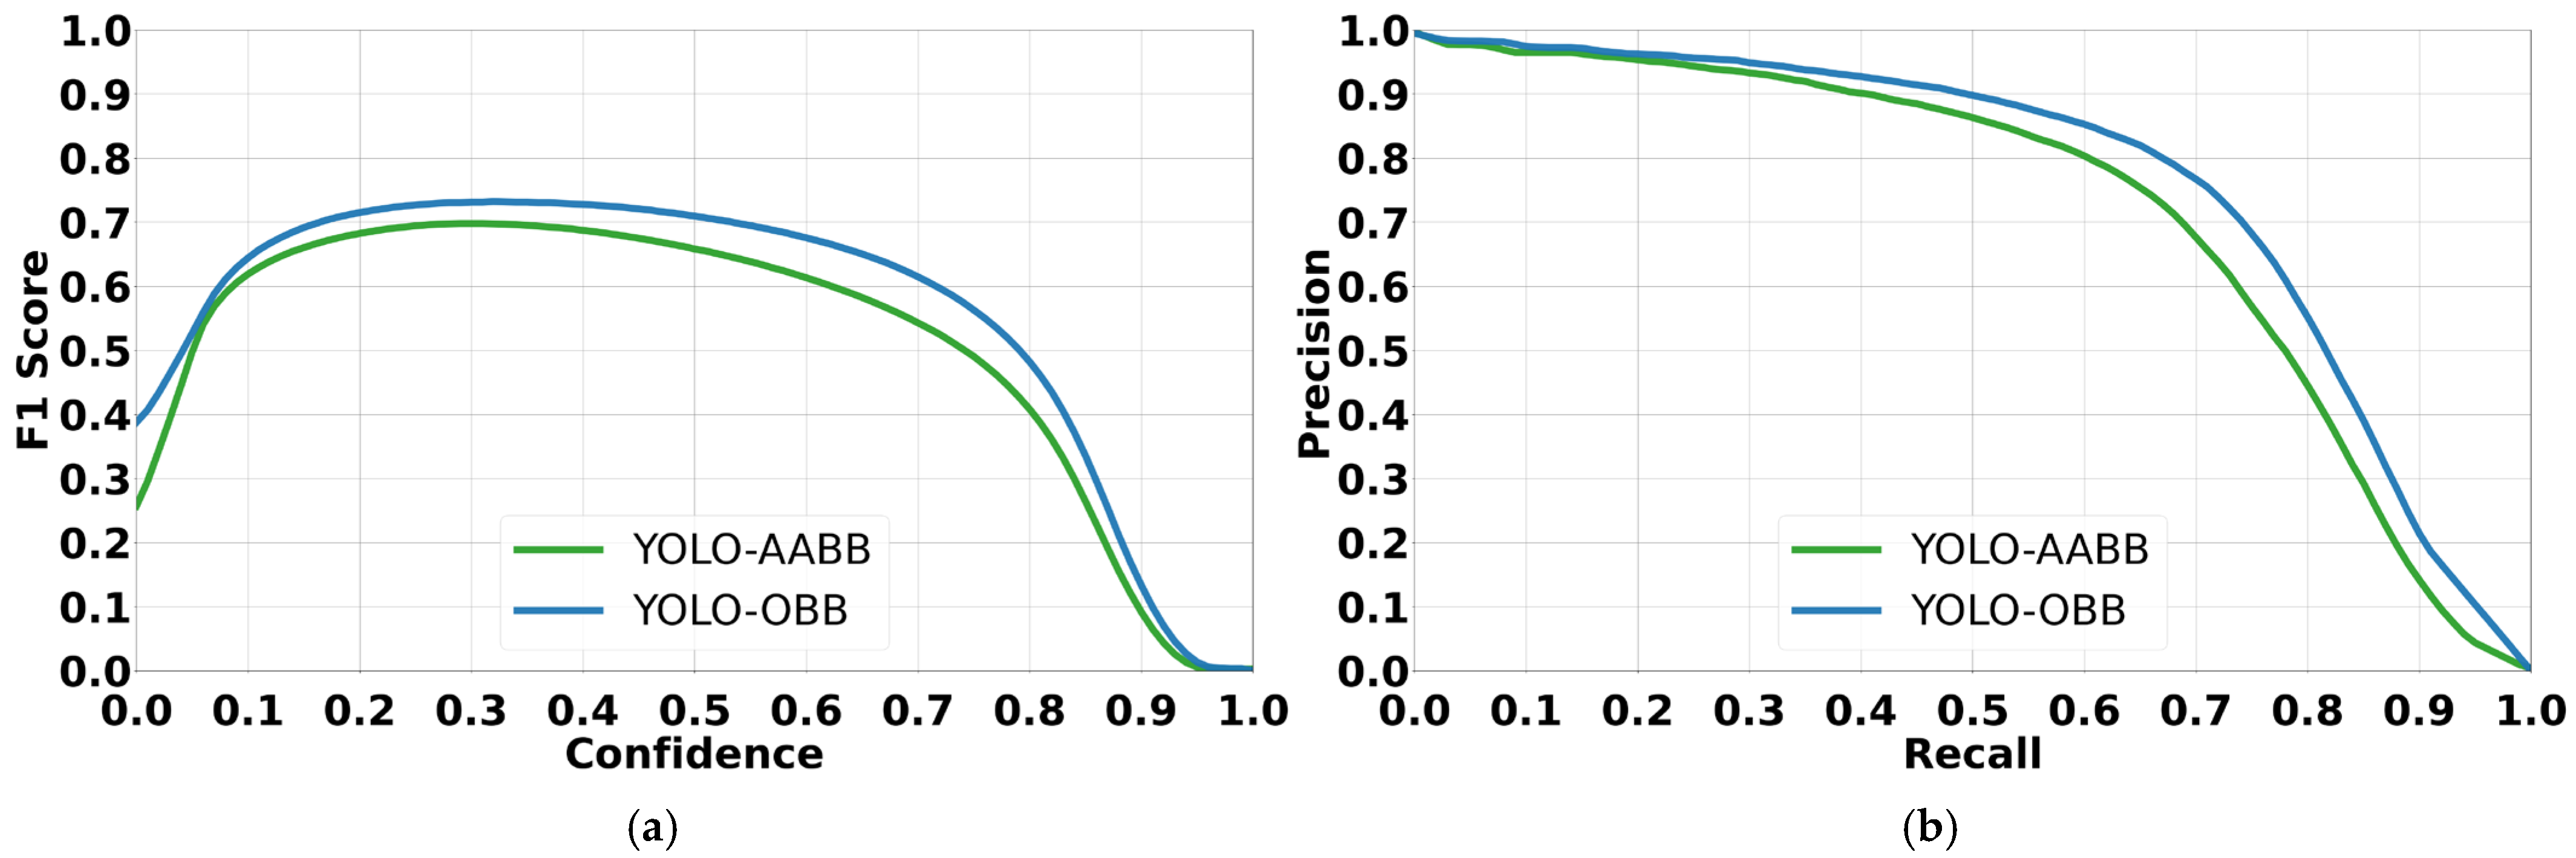
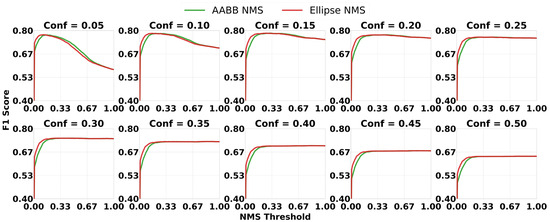
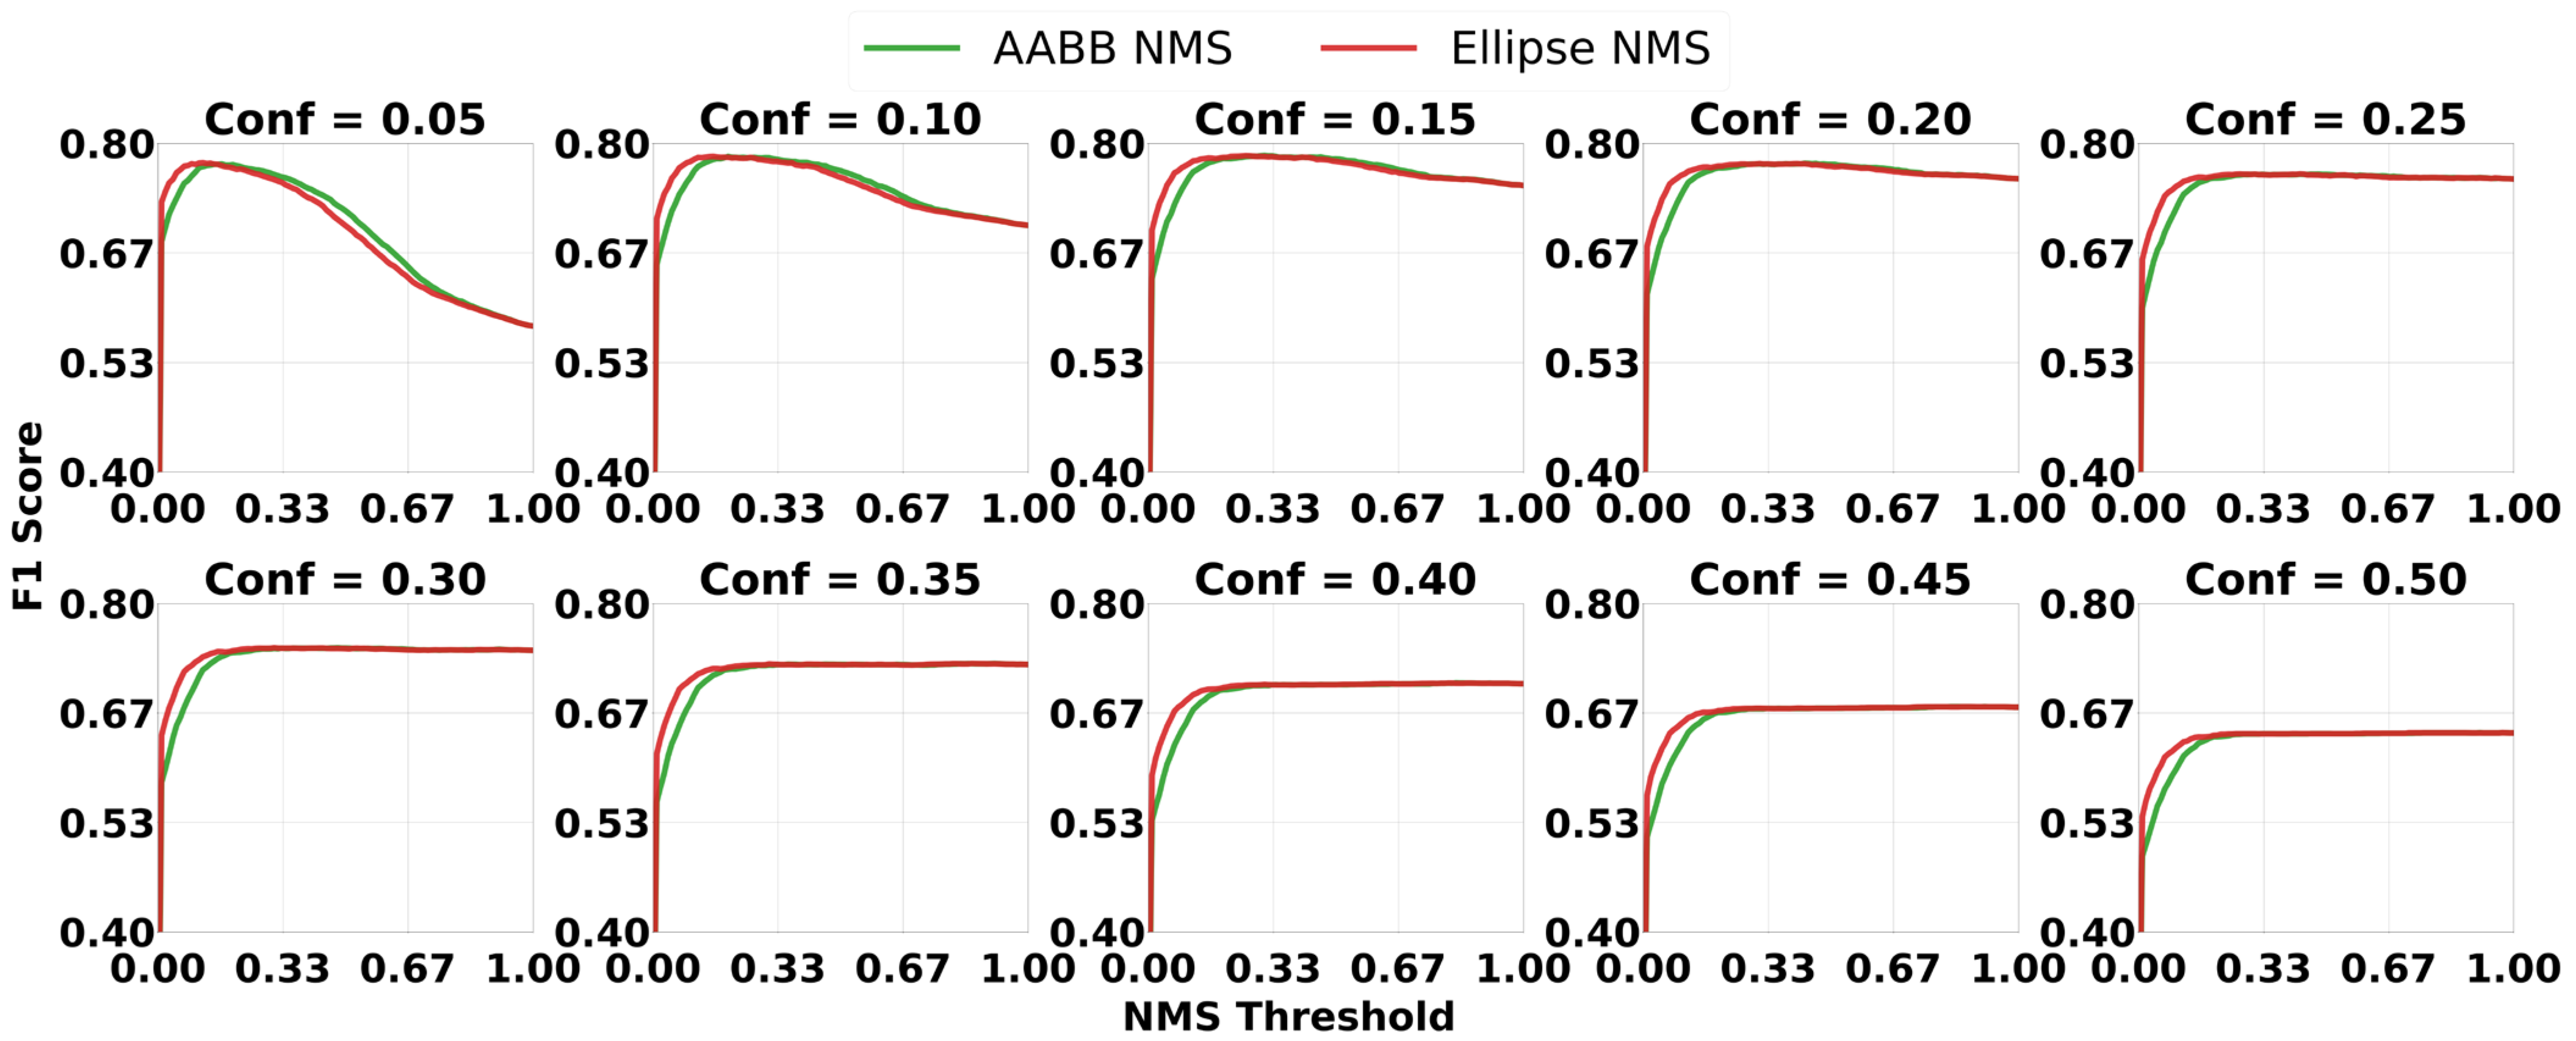
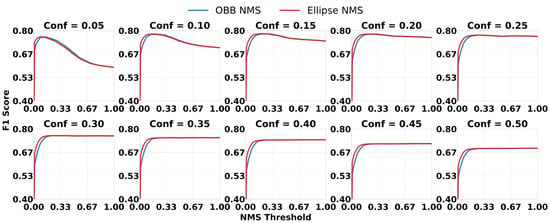
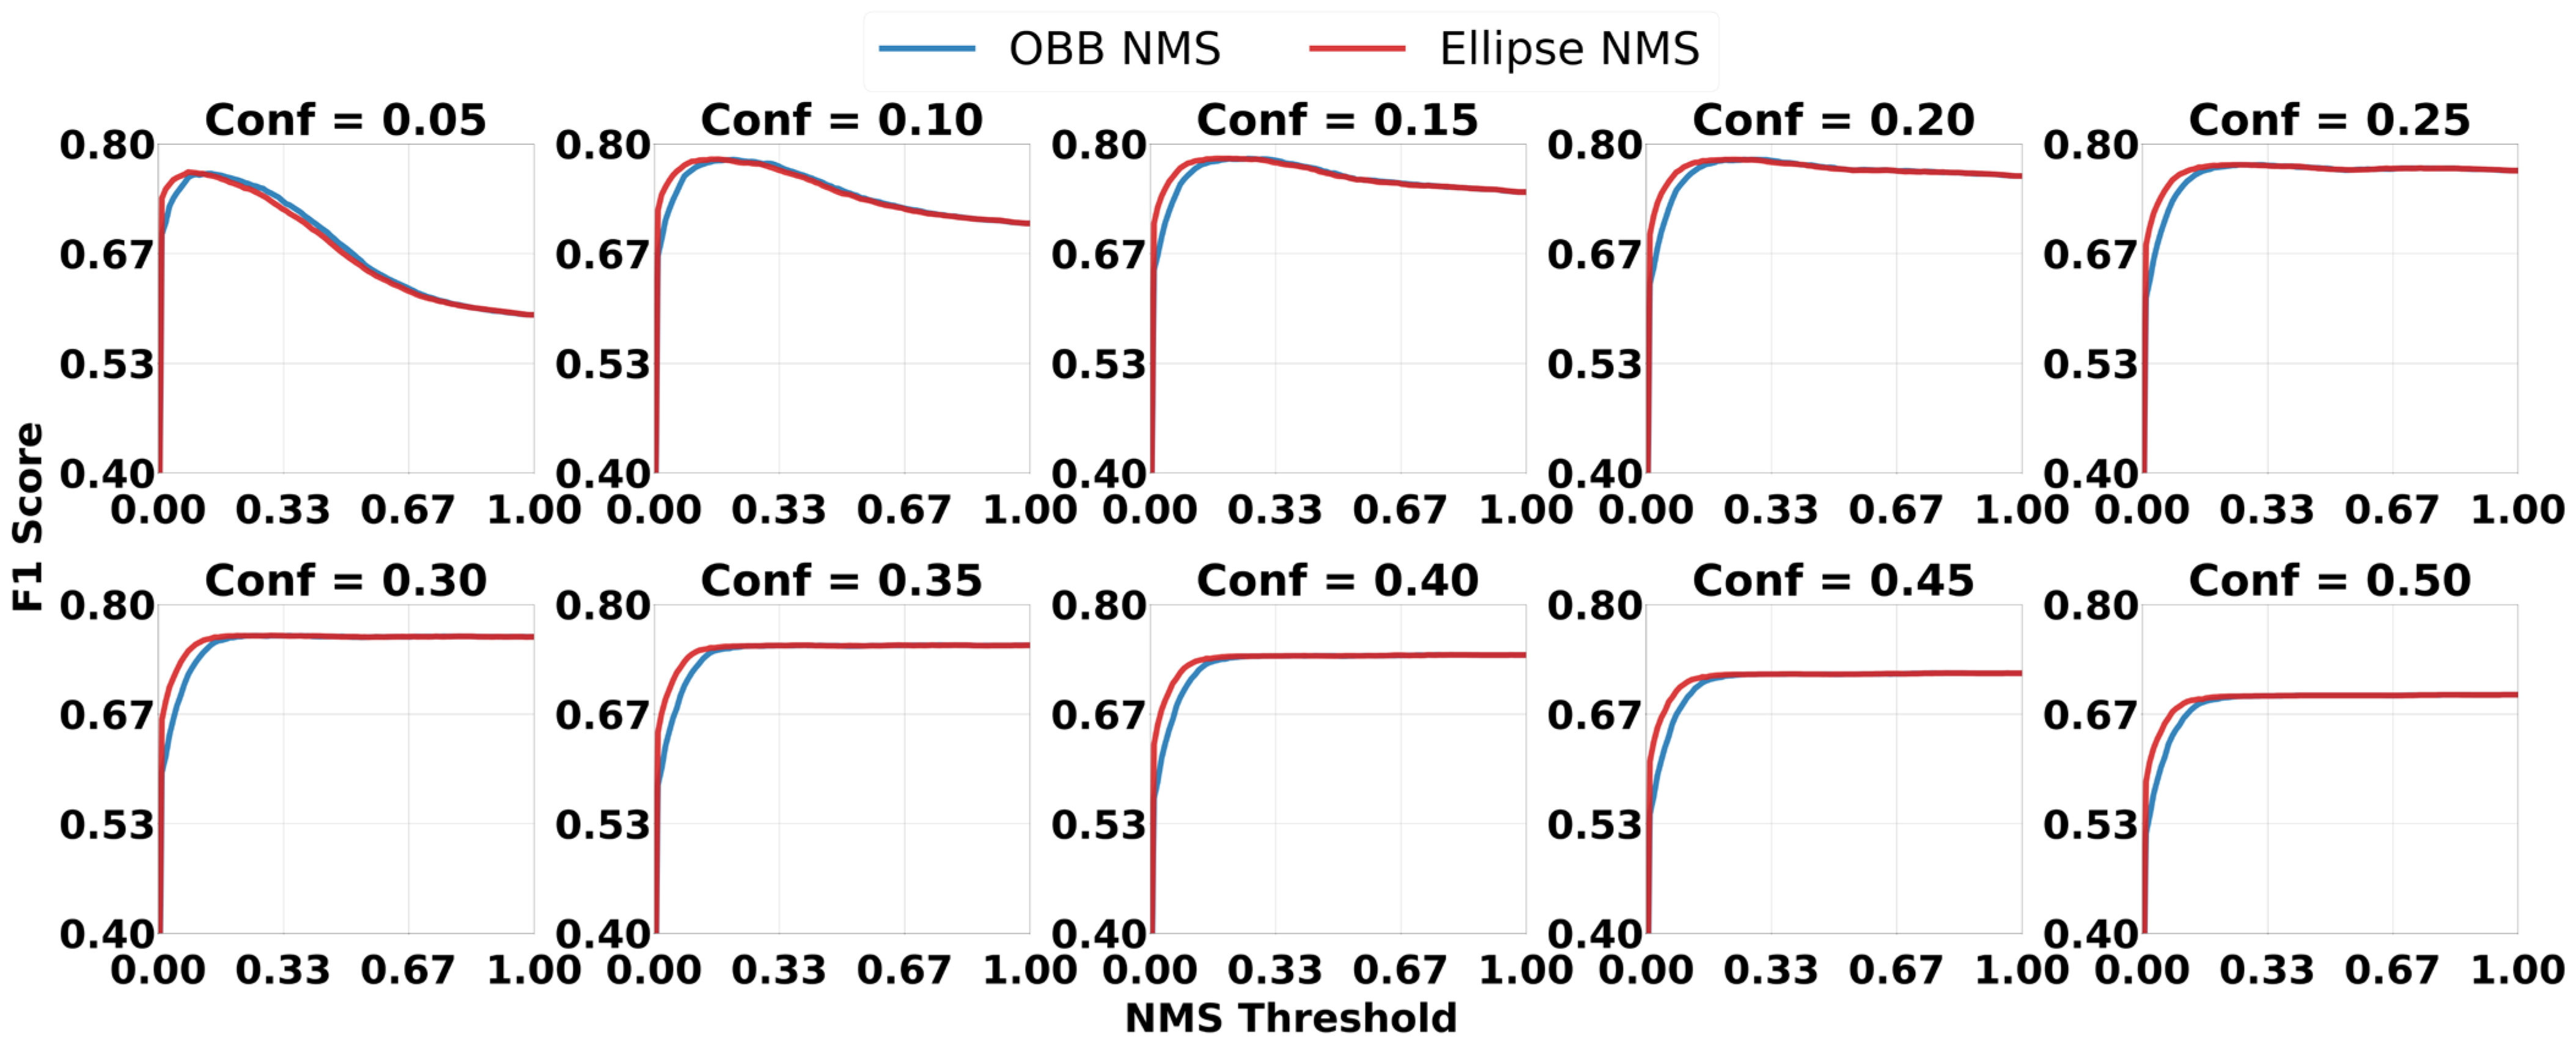

Disclaimer/Publisher’s Note: The statements, opinions and data contained in all publications are solely those of the individual author(s) and contributor(s) and not of MDPI and/or the editor(s). MDPI and/or the editor(s) disclaim responsibility for any injury to people or property resulting from any ideas, methods, instructions or products referred to in the content. |
© 2026 by the authors. Licensee MDPI, Basel, Switzerland. This article is an open access article distributed under the terms and conditions of the Creative Commons Attribution (CC BY) license.