Article

Radar Target Detection on Matrix Manifolds with Optimal Geometric Measure Selection

College of Electronic Science and Technology, National University of Defense Technology, Changsha 410073, China
*
Author to whom correspondence should be addressed.
Remote Sens. 2026, 18(13), 2098; https://doi.org/10.3390/rs18132098
Submission received: 18 May 2026 / Revised: 13 June 2026 / Accepted: 23 June 2026 / Published: 28 June 2026

Highlights

What are the main findings?
  • Proposed a normalized geometric measure ratio-based matrix information geometry (NGMR-MIG) framework that adaptively selects the optimal geometric measure from a candidate pool for radar target detection in heterogeneous clutter.
  • Developed an NGMR test statistic that normalizes the target-to-clutter deviation by the intrinsic dispersion of reference cells, and demonstrated a 3–5 dB detection improvement over classical MIG detectors on both simulated and measured radar data.
What are the implications of the main findings?
  • Provides an adaptive detection tool for heterogeneous radar environments, effectively suppressing false alarms caused by clutter fluctuation without requiring prior statistical assumptions.
  • Establishes a measure selection and dispersion-normalized detection paradigm that combines information geometry with radar signal processing, supporting the design of robust manifold-based detectors for dynamically varying remote sensing scenarios.

Abstract

Matrix information geometry (MIG) detectors have demonstrated advantages for radar target detection in heterogeneous clutter. However, existing MIG methods often select a geometric measure empirically and perform detection without adjusting for the natural fluctuation of the clutter, which poses a limitation under dynamically varying strong clutter. To address these limitations, this paper proposes a normalized geometric measure ratio-based matrix information geometry (NGMR-MIG) framework with optimal geometric measure selection from commonly used candidates for radar target detection. Representative divergence-type and distance-type measures are first organized into a candidate pool and then evaluated by the normalized geometric measure ratio (NGMR) to determine the optimal one. The NGMR is defined as the ratio of the deviation between the cell under test (CUT) and the clutter centroid to the average intrinsic dispersion of the reference cells. A larger NGMR therefore means the CUT stands out from the clutter background, implying the presence of a target. Experiments on simulated and measured radar datasets show that NGMR-MIG improves detection performance by 3–5 dB over classical MIG detectors in heterogeneous environments.

1. Introduction

The core task of radar target detection is to distinguish target echoes from clutter backgrounds. With the widespread adoption of high-range-resolution and high-Doppler-resolution radar systems [1], the statistical characteristics of clutter within observation scenes often exhibit significant heterogeneity and non-stationarity [2]. Furthermore, this enhancement in range resolution drives clutter amplitude statistics away from the Gaussian model, making them exhibit heavy-tailed characteristics [3,4]. Particularly in maritime surveillance, urban mapping and complex terrain remote sensing applications [5,6,7], reference cells within the same detection window may contain sea spikes, clutter edges or discrete scatterers [8,9,10,11], causing the classical independent and identically distributed (i.i.d.) assumption often breaks down [12]. This makes precise statistical modeling of clutter characteristics difficult in complex scenes. Therefore, designing a detector with robust adaptability to heterogeneous clutter has become a critical problem in modern radar signal processing.
To address these challenges, classical radar detectors mainly include CFAR detectors and model-based adaptive detectors. CA-CFAR and its variants [13,14,15,16] set detection thresholds by estimating local clutter power, but their performance degrades near clutter edges or with multiple targets [17]. Model-based detectors such as the adaptive matched filter (AMF) [18] and adaptive normalized matched filter (ANMF) [19] exploit clutter covariance and the target steering vector. However, their detection performance strongly depends on the assumed data model and the accuracy of covariance estimation, both of which are often violated in heterogeneous environments.
Matrix information geometry (MIG) methods have recently been introduced to address this problem from a nonlinear signal processing perspective [20,21]. In MIG, the covariance matrix of each range cell is mapped to a point on a Riemannian manifold and geometric measures are used to quantify the dissimilarity between matrices. Within this framework, the choice of geometric measure plays a decisive role, as different measures capture matrix discrepancies from distinct viewpoints. Commonly used measures include the Log-Euclidean (LE) distance, the Riemannian (Rm) distance, the Kullback–Leibler (KL), symmetrized KL (sKL) and total KL (tKL) divergences [22,23,24]. In a classical MIG detector, the geometric centroid is first computed from the reference cells according to the chosen geometric measure [25,26,27,28]. Then the geometric distance between the CUT and this centroid is evaluated to decide the presence of a target [29,30]. Existing studies have demonstrated that MIG detectors do not require explicit assumptions about clutter distributions [31] and exhibit unique advantages in heterogeneous, non-Gaussian clutter environments [32,33,34,35]. However, for wide-area radar observation, the  background often switches among sea, coast, island, urban and land scenarios, which induces diverse clutter characteristics. Coupled with clutter edges and sea spikes, the geometric distance among clutter cells becomes large. In such dynamically varying strong environments, two inherent limitations of classical MIG detectors should be taken into consideration.
  • Empirical selection of the geometric measure and lack of adaptivity:In existing MIG detectors, the geometric measure is usually chosen empirically and remains fixed across varying scenes, lacking a mechanism that adapts to local clutter characteristics. Consequently, it is difficult to guarantee that a single prescribed measure remains optimal for all environments. This calls for a measure-adaptive MIG framework capable of evaluating the instantaneous clutter background and automatically selecting an appropriate geometric measure.
  • The neglect of local clutter fluctuations results in false alarms in dynamically varying strong clutter scenarios: Existing MIG detectors work well when the reference cells are tightly clustered, but a large geometric distance may originate from either a target echo or the natural fluctuation of the dynamically varying strong clutter. Hence, the influence of clutter variability should be normalized, motivating the integration of an intrinsic dispersion into the test statistic.
To address these issues, this article proposes a normalized geometric measure ratio matrix information geometry (NGMR-MIG) framework for joint geometric measure selection and radar target detection. Representative geometric measures are first organized into a candidate pool. For each candidate measure, the normalized geometric measure ratio (NGMR) is calculated as the ratio of the CUT-to-centroid deviation to the average intrinsic dispersion of the reference cells on the manifold. This construction favors measures that amplify the geometric distance of a target from the clutter centroid, yet be insensitive to clutter scatter. After ranking the candidate measures, the selected ratio is used as a test statistic for the target decision.
The main contributions can be summarized as follows:
  • NGMR-based geometric measure selection criterion: A quantitative criterion is proposed to evaluate candidate geometric measures for MIG detection. By jointly considering the CUT-to-centroid deviation and the intrinsic dispersion of the reference cells, the criterion selects the measure that maximizes the discriminability between target signals and clutter in the current environment. This mechanism avoids the reliance on empirical measure selection and adapts to dynamically varying clutter scenarios.
  • Dispersion-normalized test statistic: The proposed test statistic directly incorporates the intrinsic dispersion of the reference cells into the MIG decision rule. This normalization suppresses false alarms caused by heterogeneous clutter while maintaining high sensitivity in homogeneous backgrounds. Geometrically, the NGMR statistic defines an adaptive open ball centered at the clutter centroid whose effective radius expands or contracts with the local clutter scatter.
  • Comprehensive experiments on simulated and measured radar data show that the proposed NGMR-MIG method outperforms classical MIG detectors by at least 3 dB at a fixed false alarm rate, with false alarm maintained across heterogeneous clutter scenarios.
The remainder is organized as follows: Section 2 introduces the signal model and the preliminaries on MIG; Section 3 elaborates on the proposed NGMR-MIG framework for optimal measure selection and detection; Section 4 validates the effectiveness of the algorithm through simulated and measured radar data; Section 5 provides conclusions and future perspectives.

2. Problem Formulation and Preliminaries on MIG

To clearly elucidate the theoretical foundation of the proposed method, the radar target detection system model is first introduced, followed by a review of the principles of classical MIG detectors and commonly used geometric measures.

2.1. Signal Model and Hypothesis Test

Pulse-Doppler radar sensors perceive the surrounding environment through continuous pulse trains. Echo data collected in each coherent processing interval is regarded as a processing unit. At the processing instant, a sliding window of length K + 1 is taken along the range dimension centered on the CUT, where the center column within the window corresponds to the CUT, and the remaining columns constitute reference cells. Each range cell contains N pulse samples, forming an N-dimensional column vector. Therefore, the data within the entire sliding window constitutes a N × ( K + 1 ) complex matrix
z ( t ) = z CUT , z 1 , z 2 , , z K
where z CUT C N is the CUT data, and  z k = z 1 k , z 2 k , , z N k T C N is the data of the k-th reference cell.
For sample data z C N from a single range cell, where N is the pulse data length, the radar target detection problem can be formulated as a binary hypothesis testing model
H 0 : z = c H 1 : z = α s ( f d ) + c
where c C N represents the clutter vector, typically assumed to be a zero-mean complex circular symmetric random vector; α C denotes the complex amplitude of the target signal; and s ( f d ) C N is the target steering vector
s ( f d ) = [ 1 , e j 2 π f d , e j 4 π f d , , e j 2 π ( N 1 ) f d ] T
where f d [ 0 , 1 ) represents the normalized Doppler frequency.

2.2. Classical MIG Detectors

MIG detectors transform the target detection problem into a geometric problem on manifolds. Rather than imposing a priori parametric models on the clutter statistics, this approach exploits the geometric structure of covariance matrices on differentiable manifolds to separate targets from background. Define Φ as the function that maps one-dimensional data to the differentiable Riemannian manifold
Φ : C N M , z R M
where C N denotes the N-dimensional complex vector space, and  M denotes a differentiable Riemannian manifold. Under the stationary Gaussian assumption, the covariance matrix is a Hermitian positive definite (HPD) matrix
R = E z z H = r 0 r 1 * r N 1 * r 1 r 0 r N 2 * r N 1 r N 2 r 0
where r k is the correlation coefficient and ( · ) * denotes complex conjugation. By the ergodicity of a stationary Gaussian process, the correlation coefficients can be estimated through their time averages.
r k = 1 N m = 0 N 1 | k | z ( m ) z ¯ ( m + k ) , | k | N 1 .
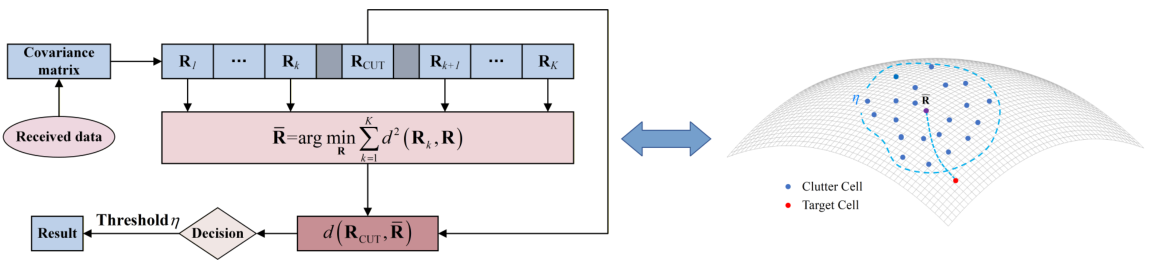
On the manifold, the target detection problem is transformed into determining whether the CUT matrix R CUT lies within the distribution region of clutter. The distribution region of clutter matrices on the manifold can be modeled as an open ball centered at the geometric centroid of the reference cells, with a radius η determined by the prescribed false alarm rate. Using the geometric distance between the CUT and the geometric centroid as the test statistic, the classical MIG decision rule can be expressed as
H 0 : d ( R CUT , R ¯ ) η H 1 : d ( R CUT , R ¯ ) > η
where d ( · ,   · ) denotes the geometric distance under a specific measure and R ¯ is the geometric centroid of reference cells. The principle of the classical MIG detector is illustrated in Figure 1.
For two points R 1 and R 2 on the matrix manifold, commonly used representative measures can be divided into distance-type measures and divergence-type measures. In this paper, the distance-type measures include the Log-Euclidean (LE) distance and the Riemannian distance, whereas the divergence-type measures include the KL divergence, the sKL divergence, and the tKL divergence.
For the distance-type measures, the LE and Riemannian distances are, respectively, given by
d LE ( R 1 , R 2 ) = log ( R 1 ) log ( R 2 ) F
d Rm ( R 1 , R 2 ) = log R 1 1 / 2 R 2 R 1 1 / 2 F
where   ·     F denotes the Frobenius norm and log ( · ) denotes the matrix logarithm.
For the divergence-type measures, the KL divergence is expressed as
d KL ( R 1 , R 2 ) = tr ( R 1 R 2 1 ) log | R 1 R 2 1 | N
where tr ( · ) denotes the matrix trace, |   ·   | denotes the matrix determinant, and N is the matrix dimension.
The sKL divergence is obtained by symmetrizing the two directed KL divergences:
d sKL ( R 1 , R 2 ) = 1 2 d KL ( R 1 , R 2 ) + d KL ( R 2 , R 1 ) = 1 2 tr R 1 1 R 2 + R 2 1 R 1 2 I
The tKL divergence has also been validated as a geometric measure with favorable detection performance and robustness in classical MIG detectors [36]. Its matrix form is expressed as
d tKL ( R 1 , R 2 ) = log | R 1 1 R 2 | + tr R 2 1 R 1 N 2 c + log | R 2 | 2 4 N ( 1 + log 2 π ) 2 log | R 2 |
where
c = 3 N 4 + N 2 log ( 2 π ) 2 + N log ( 2 π ) 2 4

3. NGMR-MIG Framework for Optimal Measure Selection and Detection

3.1. Construction of the NGMR Test Statistic

Within the MIG framework, the radar echo from each range cell is characterized as an N-dimensional HPD matrix. For the echo signal received at time t, the mapping function processes the data as
Φ z ( t ) : z CUT R CUT M z k R k M , k = 1 , 2 , , K
where S = { R 1 , R 2 , , R K } denotes the reference cell set.
Let D = { d 1 , d 2 , , d M } denote a candidate pool of representative geometric measures on the HPD matrix manifold. The pool consists of distance-type measures including Riemannian distance and LE distance, as well as divergence-type measures such as KL, sKL and tKL divergences, which characterize matrix dissimilarity from different Riemannian geometry perspectives. Since no single measure performs optimally across all clutter scenarios, the proposed NGMR-MIG framework is designed to be extensible. Any additional measures can be incorporated whenever their centroid computation and dispersion characterization are well defined.
Definition 1 
(Geometric centroid). For the ℓ-th candidate measure d ( · ,   · ) , the geometric centroid of the reference cell set S is defined as the matrix R ¯ M that minimizes the accumulated squared distance
R ¯ = arg min R M k = 1 K d 2 ( R k , R ) , = 1 , 2 , , M
The geometric centroid provides a central representative point of the local clutter matrices under the selected measure.
For distance-type measures, their geometric centroids are given as follows
R ¯ LE = exp 1 K k = 1 K log R k
R ¯ Rm : R ¯ i + 1 = R ¯ i 1 2 exp ε k = 1 K log R ¯ i 1 2 R k R ¯ i 1 2 R ¯ i 1 2
where R ¯ i denotes the geometric centroid at the i-th iteration, and  ε is the step size.
For divergence-type measures, their geometric centroids are given as follows
R ¯ KL = 1 K k = 1 K R k 1 1
R ¯ sKL = k = 1 K R k 1 k = 1 K R k 1 1 / 2
R ¯ tKL = k = 1 K w k R k 1 1 , w k = μ k j = 1 K μ j
where the weights are determined by
μ k = 1 2 c + ( log | R k | ) 2 4 N ( 1 + log 2 π ) 2 log | R k |
Definition 2 
(Intrinsic dispersion). For the ℓ-th candidate measure, the intrinsic dispersion of the reference cell set S is defined as
σ ref , = 1 K k = 1 K d ( R k , R ¯ ) , = 1 , 2 , , M
This quantity measures the average geometric scatter of the reference cell covariance matrices. In homogeneous clutter regions, the reference cell matrices cluster tightly on the manifold, causing σ ref , to approach a small value. Conversely, in heterogeneous regions, the reference cell matrices disperse on the manifold, leading to a significant increase in σ ref , . Therefore, σ ref , quantifies the scatter scale of the local clutter under the -th measure.
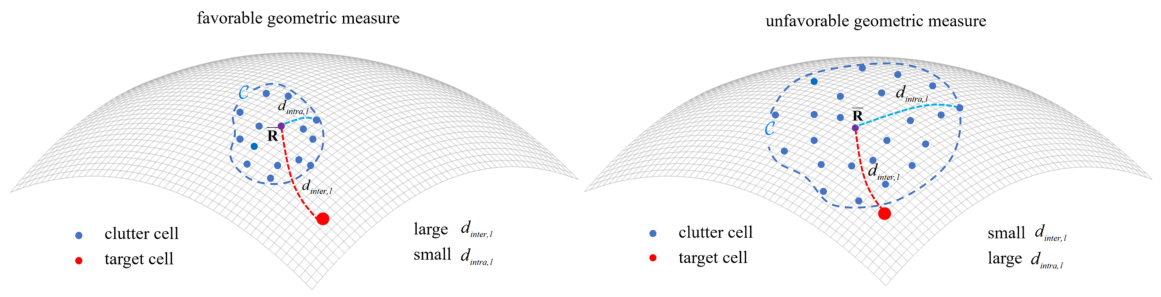
From a classification perspective on the manifold, the reference cells collectively form a clutter class, centered at R ¯ with intrinsic scatter σ ref , , while the CUT is an unlabeled sample to be judged. The displacement of the CUT from the centroid can thus be interpreted as an inter-class deviation, and the average dispersion of the reference cells as the intra-class scatter. Accordingly, for the -th candidate measure, these two quantities are, respectively, defined as
d inter , = d ( R CUT , R ¯ ) , d intra , = σ ref , = 1 K k = 1 K d ( R k , R ¯ ) .
Then the NGMR test statistic is formulated as the ratio of these two quantities
T NGMR , ( R CUT ; S ) = d inter , d intra , = d ( R CUT , R ¯ ) σ ref ,
For target-bearing CUTs, the inter-class departure increases while the intra-class scatter stays stable, yielding a high ratio; for clutter-only CUTs, the inter- and intra-class dissimilarities remain comparable, maintaining a low ratio. Thus, T NGMR , naturally adapts to the local clutter fluctuation and provides a scale-invariant measure of how prominently the CUT stands out from the clutter background on the manifold. Compared with the unnormalized geometric distance used in classical MIG detectors, the NGMR statistic provides a relative measure of anomaly that adapts naturally to local clutter variability.

3.2. Optimal Geometric Measure Selection Criterion and Detection Procedure

Classical MIG methods mainly treat covariance matrices as isolated points on the manifold and evaluate the CUT through its geometric distance to the reference centroid. In practice, however, the reference cells form a local clutter population on the manifold. The CUT is characterized here by its degree of departure from the reference population and this departure is exploited for adaptive measure selection and detection. Under the null hypothesis, the CUT is a member of this clutter population; under the alternative, it lies outside. The detection problem can therefore be written as a classification on the manifold
H 0 : R CUT C H 1 : R CUT C
where C denotes the clutter region spanned by the reference samples on the manifold. Under  H 0 , the CUT and the reference cells belong to the same geometric cluster; under H 1 , the CUT deviates from this cluster due to the presence of a target signal.
For each candidate measure, the target-clutter discriminability in the current environment is quantified by the normalized geometric measure ratio
Γ ( R CUT ; S ) = d ( R CUT , R ¯ ) σ ref , = d ( R CUT , R ¯ ) 1 K k = 1 K d ( R k , R ¯ ) , = 1 , 2 , , M
The numerator in (26) measures the deviation of the CUT from the overall clutter background on the manifold. If the CUT contains a target, this value is expected to be large under an effective geometric measure. The denominator, denoted as σ ref , , measures the average scatter of the reference cells around their geometric centroid and reflects the internal fluctuation of the clutter samples. Hence, an appropriate measure should enlarge the CUT-background separation while suppressing the clutter scatter, resulting in a large NGMR value.
The measure-selection rule is therefore written as
= arg max 1 M Γ ( R CUT ; S )
For a candidate measure d , the numerator d inter , = d ( R CUT , R ¯ ) quantifies the deviation of the CUT from the clutter centroid. When the CUT contains a target, an effective geometric measure should amplify this deviation, making the target clearly separable from the background. The denominator σ ref , measures the average intrinsic dispersion of the reference cells. A suitable measure should also suppress this clutter scatter. Consequently, a larger Γ value indicates that under the -th measure, the target signal stands out more prominently relative to the natural fluctuation of the clutter. Selecting the measure that maximizes Γ thus yields the best discriminability between the target and the local clutter background. The optimal geometric measure selection criterion is illustrated schematically in Figure 2.
After the measure is selected, the NGMR test statistic is defined as
T NGMR = Γ ( R CUT ; S )
The corresponding decision rule is
T NGMR H 1 H 0 η NGMR
where η NGMR is determined according to the prescribed false alarm probability. A large number M MC of pure clutter segments are extracted from the available clutter data, and the NGMR statistic is computed under H 0 . The obtained statistics are sorted in ascending order, and  η NGMR is set to the ( 1 P fa ) -th quantile of this empirical distribution. This Monte Carlo based approach guarantees that the false alarm probability of the NGMR-MIG detector is maintained at the desired level.
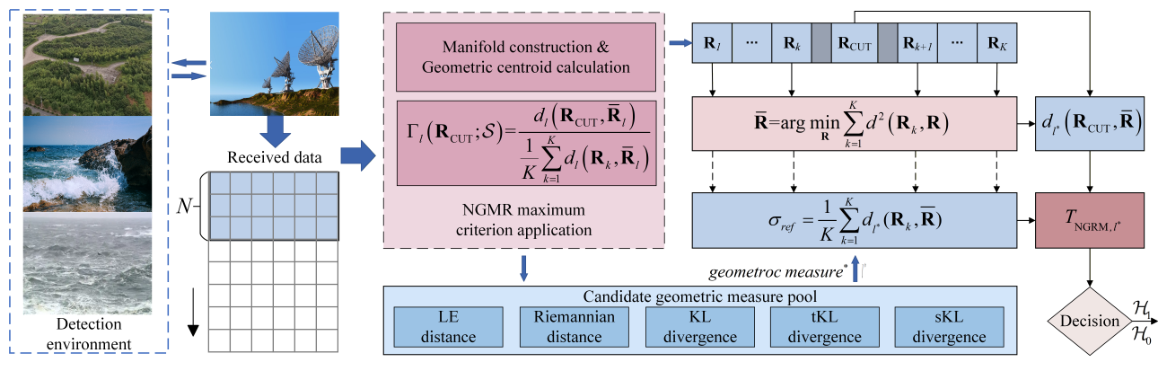
The practical procedure of the NGMR-MIG detection is illustrated in Figure 3. First, a candidate pool D is constructed from representative geometric measures. Second, for each candidate measure, the geometric centroid and intrinsic dispersion are computed from the current echo window. Third, the NGMR values are evaluated across the pool, and the measure that yields the maximum ratio is selected as the most discriminative one for the current clutter environment. Finally, the NGMR value of the selected measure is compared with a threshold to produce the target decision.
For clarity, the proposed geometric measure selection criterion and the detection procedure are summarized in Algorithm 1.
Algorithm 1 NGMR-MIG Detection Procedure
Require: Radar data z ( t ) , candidate measure pool D = { d 1 , , d M } , threshold η NGMR
Ensure: Final detection result
   1: Map range cells onto the HPD manifold to obtain R CUT and reference set S =
       {R1, …, RK}
   2: for each candidate measure d D do
   3:        Compute the measure-dependent geometric centroid R ¯ via (15)
   4:        Compute the intrinsic dispersion σ ref , via (22)
   5:        Compute d inter , = d ( R CUT , R ¯ ) and d intra , = σ ref ,
   6:        Compute T NGMR , = d inter , / d intra ,
   7: end for
   8: Select the optimal measure = arg max T NGMR , and set T = T NGMR ,
   9: if  T > η NGMR   then
 10:        Declare target presence H 1
 11: else
 12:        Declare target absence H 0
 13: end if
The computational costs of the representative MIG detectors and the proposed NGMR-MIG method are summarized in Table 1. For KL-, sKL-, tKL-, and LE-based MIG detectors, the dominant cost lies in repeated matrix inversion, determinant, square-root, or logarithm operations, leading to an overall complexity of O ( K N 3 ) . For the Rm-based detector, the centroid is obtained iteratively, so the complexity becomes O ( I K N 3 ) , where I is the number of iterations. The proposed NGMR-MIG method further evaluates the candidate pool and computes the reference-cell dispersion for each candidate measure. If the number of candidate measures is denoted by M, its overall complexity can be written as O ( ( M + I ) K N 3 ) . Since M is a small fixed constant in practice, the dominant order with respect to K and N remains linear in K and cubic in N.

3.3. Geometric Interpretation of the NGMR Statistic

For the selected measure, the NGMR decision rule can be rewritten by substituting the definition of the statistic
d ( R CUT , R ¯ ) H 1 H 0 η NGMR · σ ref ,
This inequality admits a direct geometric interpretation: the detector declares a target present if the CUT lies outside an adaptive open ball, centered at the geometric centroid R ¯ , whose radius is scaled by the local clutter fluctuation
τ eff = η NGMR · σ ref ,
In classical MIG detectors, the decision boundary is determined solely by a fixed threshold η . By contrast, the NGMR-MIG framework adopts an adaptive threshold scale τ eff . This scale is modulated by the intrinsic dispersion σ ref , , which reflects the local scatter degree of reference samples on the manifold. Consequently, the decision region adapts to local clutter characteristics. In homogeneous areas where reference cells are tightly clustered, σ ref , is small and the boundary contracts. In heterogeneous areas with widely dispersed reference cells, σ ref , increases and the boundary expands accordingly. This mechanism ensures that the CUT deviation is evaluated against an appropriate local fluctuation scale, thereby suppressing false alarms that would otherwise arise from clutter heterogeneity.
This interpretation holds for any geometric measure compatible with the manifold structure. The NGMR-MIG method thus defines an adaptive neighborhood whose size reflects the local geometric variability of the clutter. This design provides a principled way to achieve robust detection under heterogeneous environments.
Remark 1. 
The NGMR statistic shares an intuitive analogy with the classical t-test: the geometric distance d ( R CUT , R ¯ ) plays the role of a deviation term, whereas σ ref , provides a scatter scale. This analogy is meant to illustrate the rationale of dispersion normalization. Unlike the t-test, the NGMR statistic is defined on an HPD manifold. Consequently, the proposed detector does not rely on the theoretical distribution of the t-test.

4. Experimental Results and Analysis

In the following, multiple sets of experiments are conducted to verify the effectiveness of the proposed NGMR-MIG method. The first part uses simulated data to visualize how covariance matrices are distributed on the manifold under different clutter backgrounds. Subsequently, both simulated data, measured sea clutter data, and measured ground clutter data are employed to verify the detector performance and robustness. All simulations were conducted using MATLAB R2020b (The MathWorks, Inc., Natick, MA, USA).

4.1. Manifold Distribution Visualization

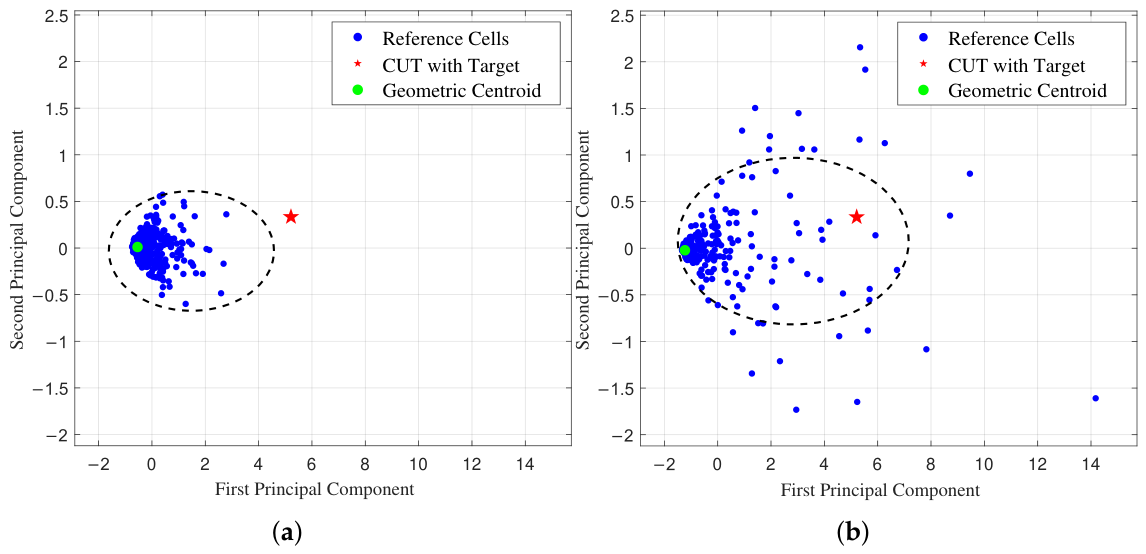
In practical radar systems, clutter heterogeneity is mainly reflected in two forms: statistical distribution heterogeneity and power heterogeneity [37,38,39]. In this section, the distribution of radar echoes on the matrix manifold is visually analyzed using simulated data to verify the necessity of the proposed method. The simulation parameters are set as follows: the number of radar echo pulses N = 7 , the number of reference cells K = 300 ; the target signal is modeled as a point target with a normalized Doppler frequency f d = 0.1 , and the SCR is set to 20 dB.
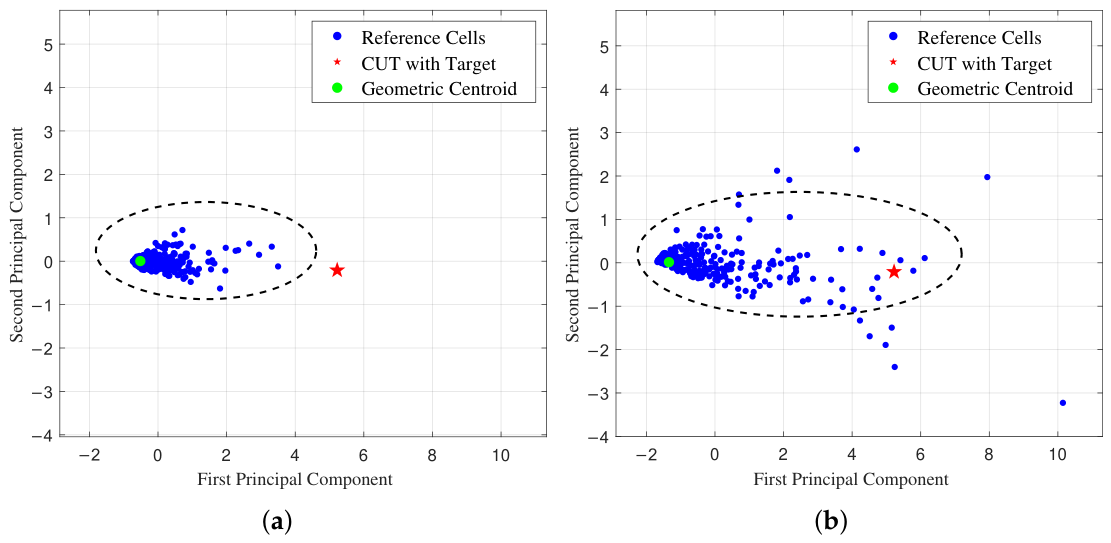
Two types of clutter heterogeneity are considered, namely statistical distribution heterogeneity and local power heterogeneity. For the distribution case, the homogeneous scenario uses 300 Rayleigh-distributed reference cells at 20 dB. The heterogeneous scenario consists of 100 Rayleigh, 100 log-normal, and 100 Weibull clutter cells. All cells are adjusted to an average power of 20 dB, so as to eliminate the influence of power discrepancy. For the power case, the homogeneous scenario uses Rayleigh cells with power set to 20 dB. The heterogeneous scenario assigns Rayleigh cells to three power levels: 20 dB, 23 dB, and 17 dB, with 100 cells each. In all cases, the CUT contains Rayleigh clutter plus an injected target with identical SCR. To visualize the high-dimensional matrix manifold, principal component analysis (PCA) projects the covariance matrices onto the plane of maximum variance. The corresponding results are presented in Figure 4 and Figure 5, respectively.
In the homogeneous scenario, the reference cells cluster tightly on the manifold. The geometric distance between the target and the clutter centroid is much larger than the internal clutter spread, so a simple threshold works well. However, in the heterogeneous case, the increased scatter of the reference samples expands the clutter region. In this case, a large CUT-to-centroid distance can still fall inside the broader clutter region and become hard to separate from the surrounding clutter. This behavior highlights the limitation of fixed-threshold MIG detectors in heterogeneous environments. It also motivates a dispersion-normalized detection framework that evaluates the CUT deviation relative to local clutter scatter rather than relying only on a geometric distance.

4.2. Detection Performance Analysis

To evaluate the detection performance of the proposed approach, four categories of baseline detectors are included for comparison: (1) the classical MIG detector based on Riemannian distance and Log-Euclidean distance [24]; (2) the classical MIG detectors employing KL, sKL and tKL divergence; (3) the conventional adaptive detectors ANMF and AMF; (4) the traditional FFT-CFAR processor [40]. In the following discussion, the proposed detector is denoted as “NGMR-MIG”, and compared methods adopt the same names as in their original works. For the Riemannian distance-based MIG detector, the geometric centroid is computed iteratively. In our implementation, the centroid is initialized as the arithmetic mean of the reference matrices. The step size is set to ε = 0.1 , and the maximum number of iterations is 1000. The iteration terminates when the Frobenius norm of the change between successive centroids is less than 10 6 or when the maximum iteration count is reached. In all experiments, convergence is achieved well before the maximum limit. The number of pulses is set to N = 7 throughout all experiments, which represents a typical value in practical radar systems with limited CPI duration. This choice validates the applicability of NGMR-MIG under realistic small-pulse-number conditions that pose challenges for classical detectors. In practice, the pulse number for such detectors typically ranges from 5 to 15.
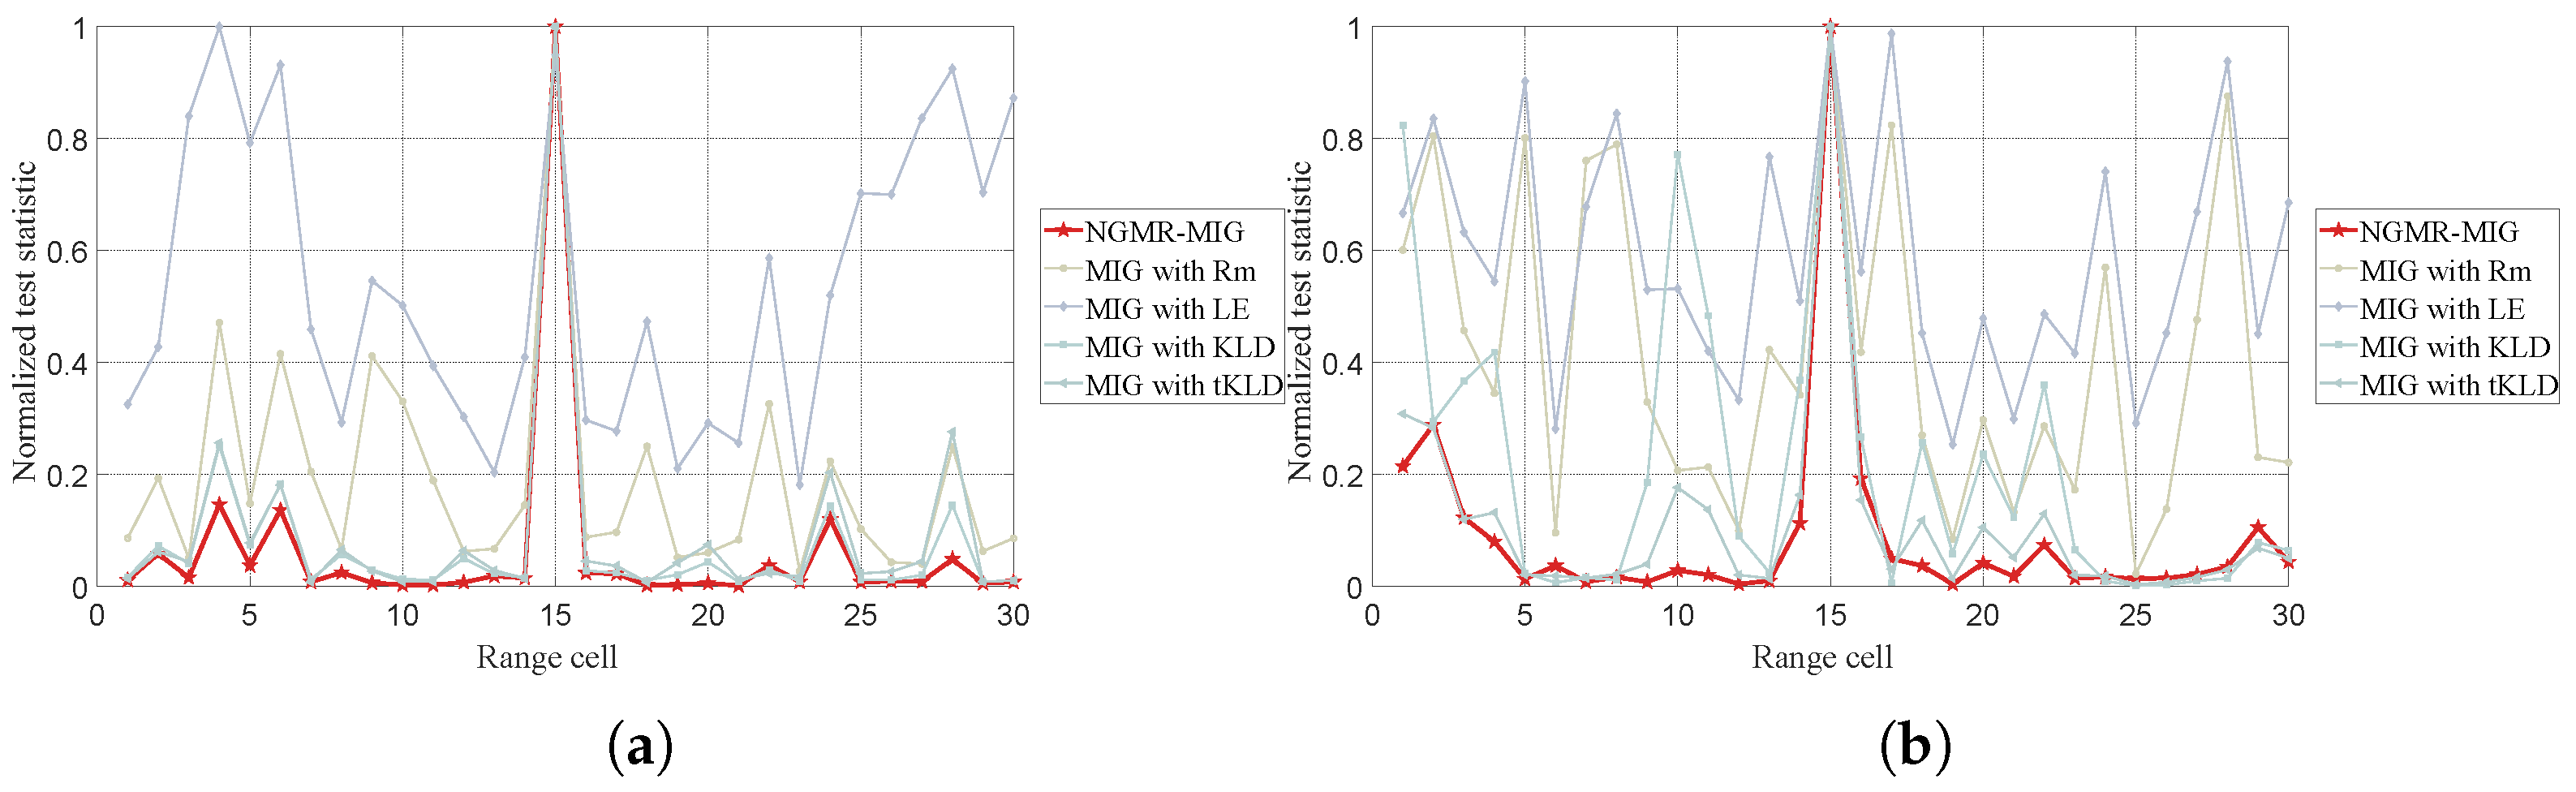
To illustrate the necessity of both measure selection and intrinsic dispersion normalization, simulated sea clutter data are generated according to the K-distribution with N = 7 pulses and K = 30 range cells. Two sets of clutter parameters are adopted in the experiments, with  ( v , μ ) = ( 1 , 0.5 ) and ( v , μ ) = ( 3 , 1 ) [41]. A simulated target with SCR = 7 dB is injected into the 15th range cell. The normalized test statistic in the proposed method corresponds to the NGMR, while those of the other classical MIG detectors are defined as geometric distances under different geometric measures.
Figure 6 shows that different geometric measures exhibit distinct detection performances under the two clutter scenarios. Specifically, KL divergence performs best among classical MIG detectors in Figure 6a, while tKL achieves the optimal performance in Figure 6b. This outcome demonstrates the necessity of dynamically selecting the optimal geometric measure for time-varying backgrounds. NGMR-MIG locates the target at the correct range cell in both clutter scenarios and maintains lower clutter responses compared with classical MIG methods. The lower clutter responses indicate that NGMR-MIG is less likely to produce false alarms in the presence of heterogeneous clutter. These results demonstrate that the proposed NGMR-MIG achieves reliable target detection and better clutter suppression capability.
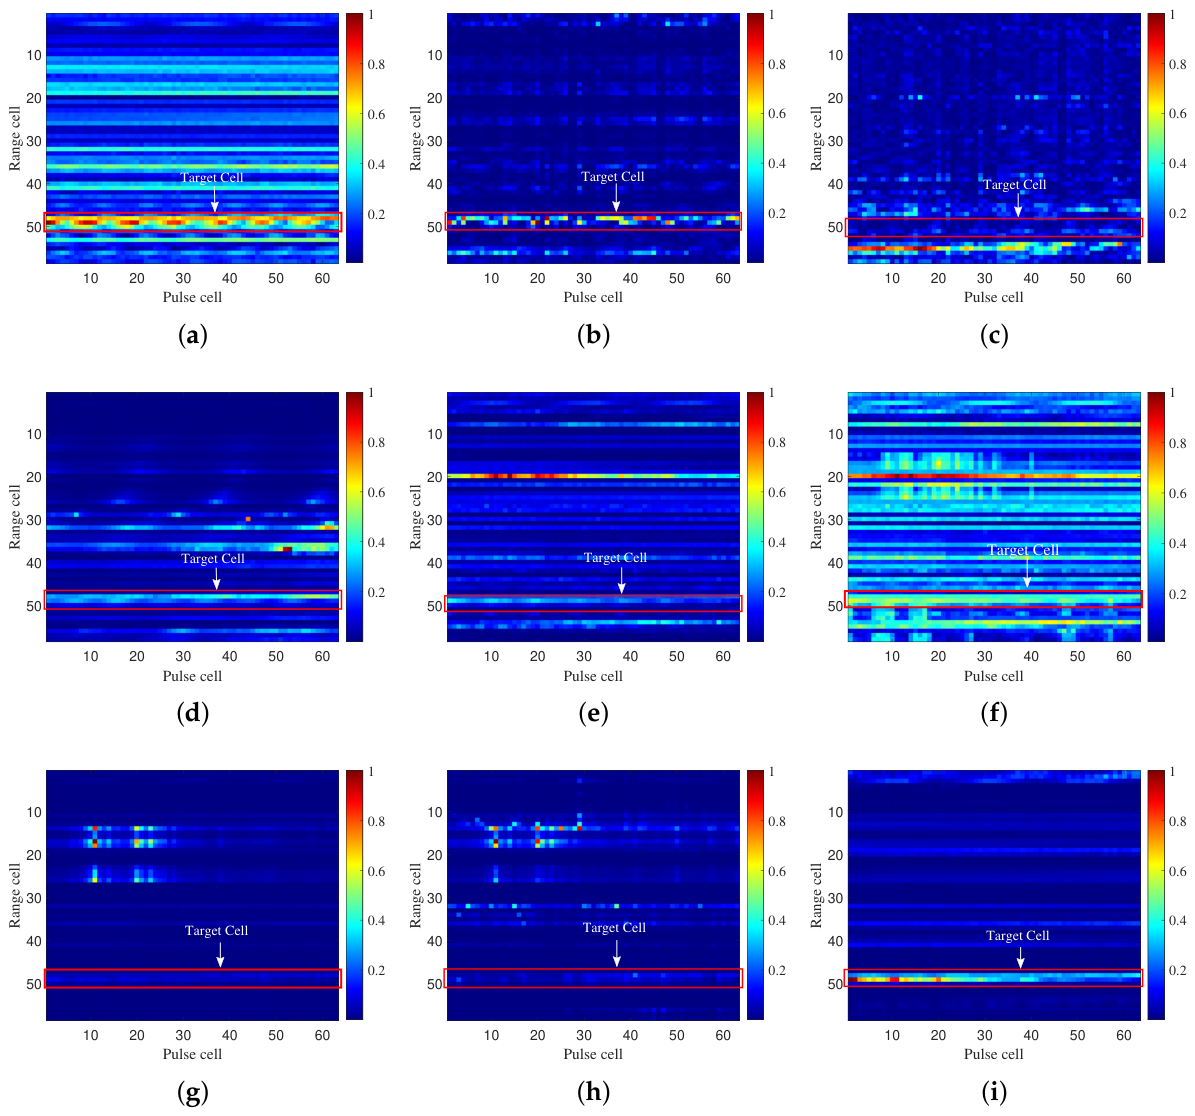
The LSS-Ku-1.0 ground clutter dataset [42] is used to assess performance in a real environment. The dataset contains 60 range cells and 70 pulses, with a UAV target located at the 49th range cell. Figure 7 displays the original data alongside the two-dimensional test statistics produced by each method.
Figure 7a indicates that there exists strong ground clutter in the original data, especially near the 19th, 40th, and 53rd range cells where target-like peaks appear. For existing competing methods, the processed results often fail to fully suppress clutter, or suppress the target signal undesirably. This weakens the ability to distinguish targets from background clutter. In contrast, Figure 7i shows the result of the NGMR-MIG method. The ground clutter is well suppressed while the target response is prominently enhanced. In particular, NGMR-MIG maintains a low statistic level in clutter range cells, which lowers the false alarm probability relative to the comparison methods. Quantitative analysis reveals that the proposed method enlarges the discriminability between the target signal and clutter by 7.61 dB, verifying its superior clutter suppression and target detection performance.
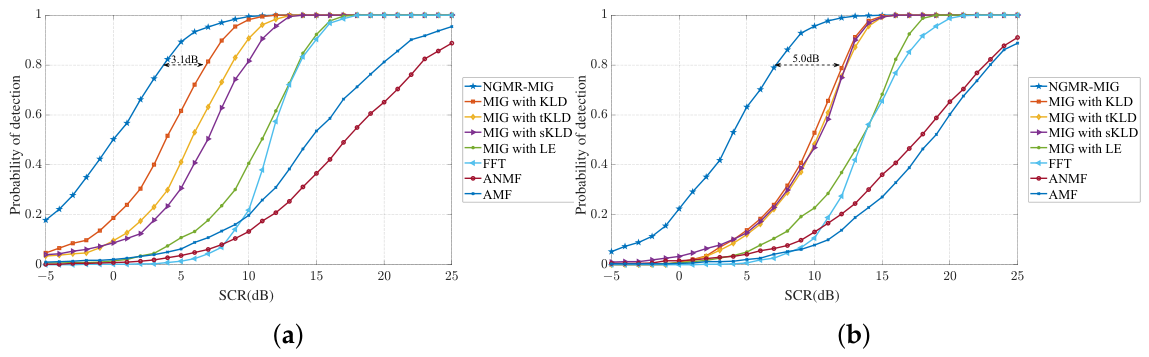
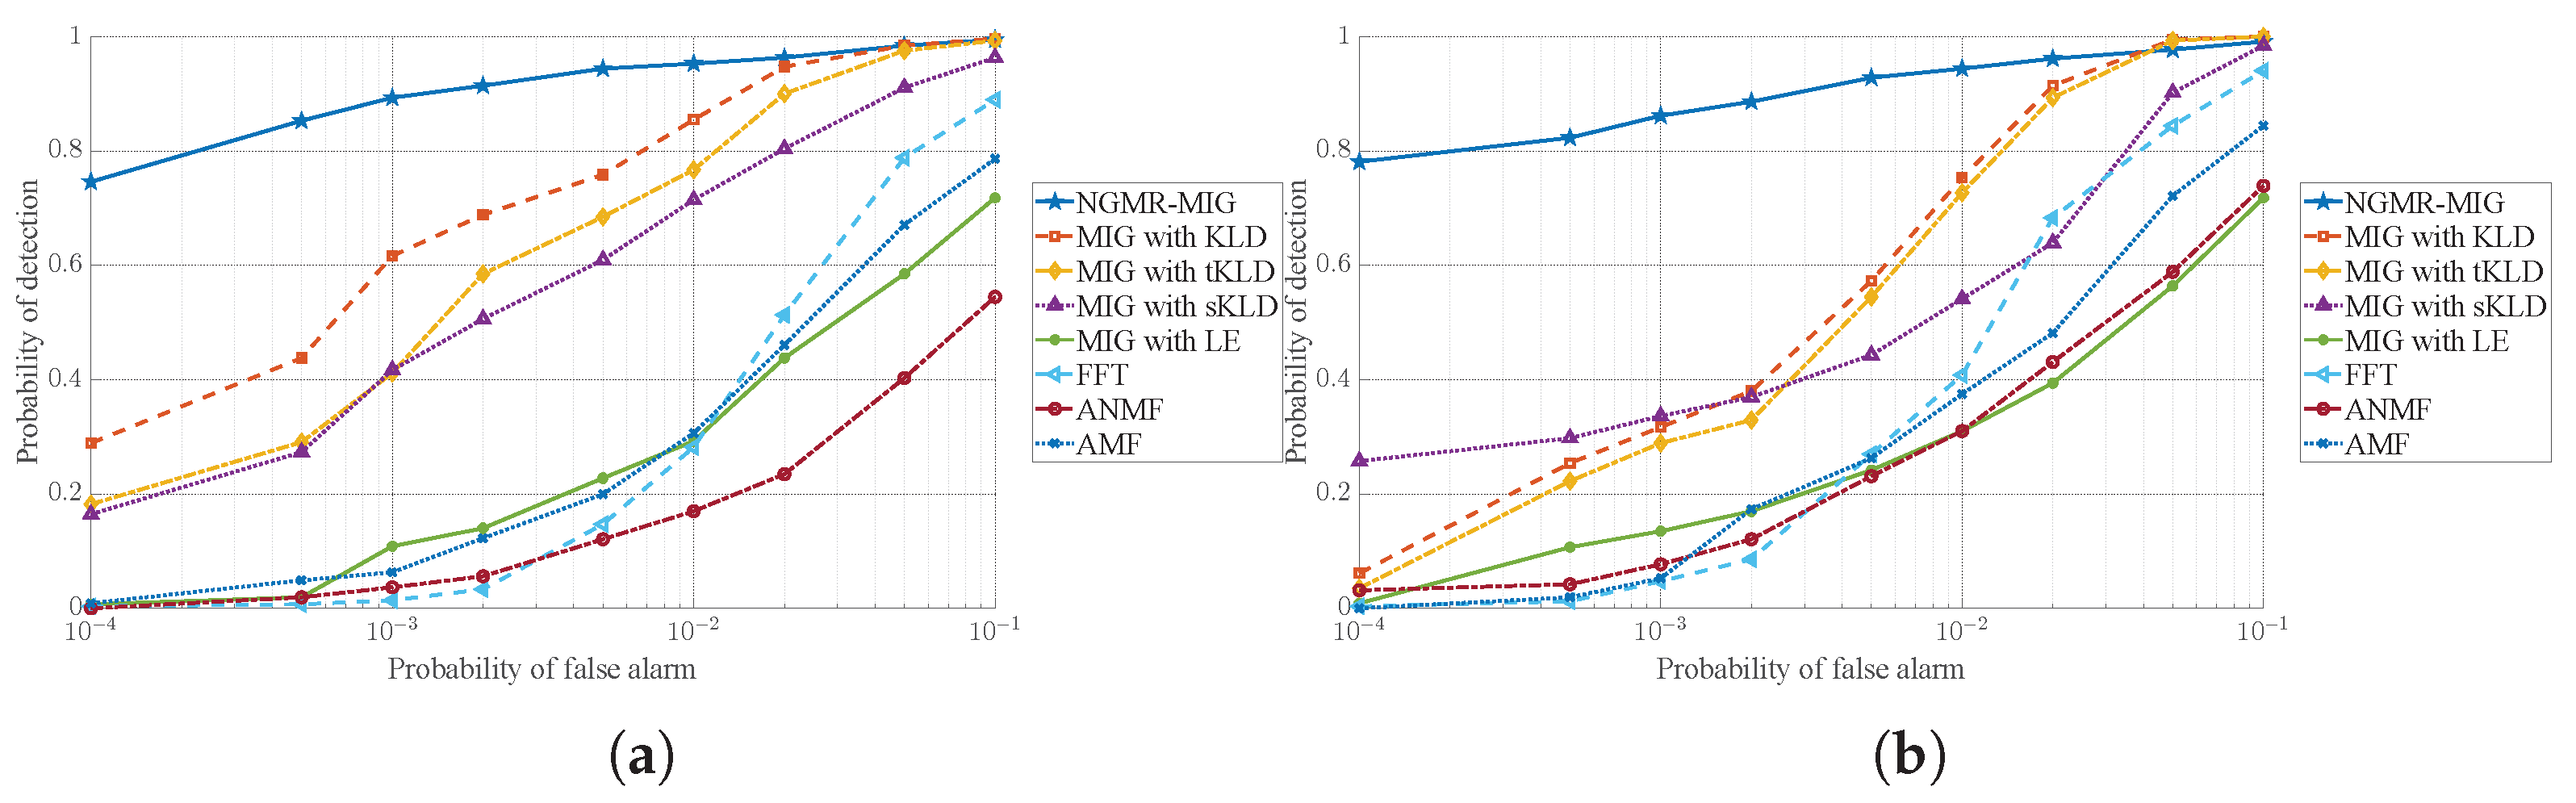
To further verify the target detection capability and environmental adaptability of NGMR-MIG, sea clutter data (20221112160048_stare_HH.mat) and (20221112150043_s tare_HH.mat) collected by the SDRDSP dataset [43] are used for algorithm verification. Since the selected original clutter data does not contain actual targets, a simulated target with a normalized Doppler frequency of 0.1 is added to the 10th range cell. The number of reference cells is set to 8 and the number of pulses in a single coherent processing interval is 7. The first 56,000 samples of this dataset are used to calculate the detection threshold. The remaining 4000 samples are then used to calculate the detection probability, with the false alarm probability set to 10 3 .
Figure 8 display the detection probability curves for the two datasets, respectively. The results indicate that NGMR-MIG achieves the optimal detection performance in both scenarios. Specifically, when the detection probability reaches 0.8, NGMR-MIG achieves an improvement of about 5 dB in Figure 8a and 3.1 dB in Figure 8b compared with the best competing detector.
To further analyze the false alarm suppression capability of the proposed detector, receiver operating characteristic (ROC) curve experiments are conducted on the same two datasets. For each detector, the pure clutter samples are used to obtain the test statistic under H 0 , while the target-injected samples are used to obtain the statistic under H 1 . To maintain consistency with Figure 8, we use 56,000 pure-clutter pulses to compute the test statistics under H 0 , which restricts the achievable false alarm range. Figure 9 shows the ROC curves across different false alarm probabilities. The NGMR-MIG curve remains above those of the competing detectors in both datasets, especially in the low- P f a region. This result confirms that the proposed dispersion-normalized statistic suppresses clutter-induced excursions under H 0 while preserving a strong target response under H 1 , leading to higher detection probability at the same false alarm probability.

4.3. Robustness Analysis to Clutter Heterogeneity Level

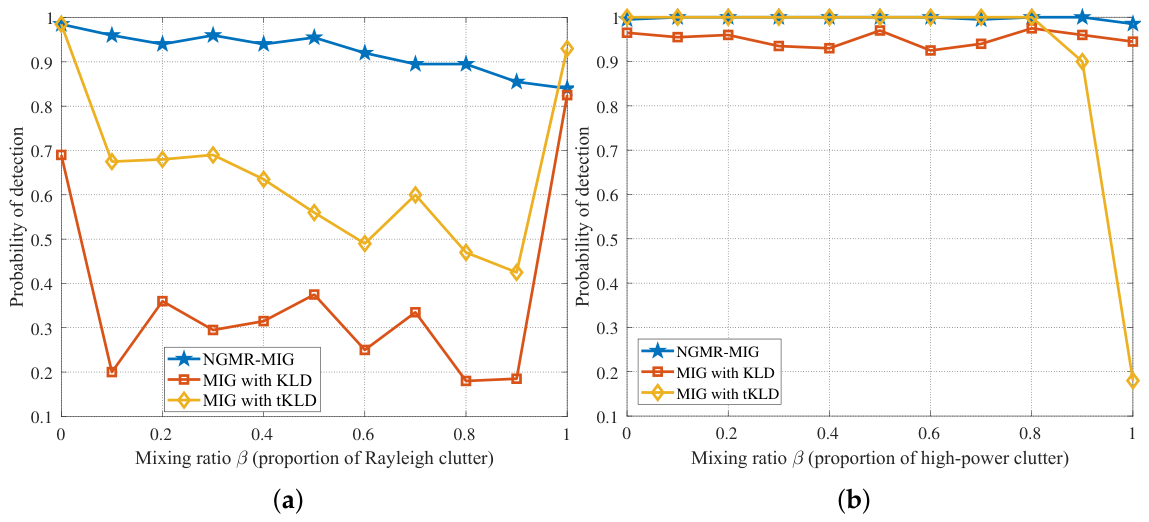
To quantify the robustness against different levels of clutter heterogeneity, two simulations are conducted with a reference window of K = 8 range cells and N = 7 pulses. The CUT contains a simulated target with f d = 0.1 and SCR = 10 dB. For each heterogeneity level, the false alarm probability is fixed at P f a = 10 4 . The detection thresholds are estimated using 10 6 clutter-only trials, and P d is evaluated using 2000 target-present trials.
In the distribution heterogeneity scenario, the reference window comprises K-distributed and Rayleigh-distributed clutter, each normalized to 0 dB average power. Here, β denotes the fraction of Rayleigh cells, while the CUT is embedded in the K-distributed background. In the power heterogeneity scenario, the reference cells are drawn from a K-distribution with v = 3 and b = 1 and assigned two different power levels, 0 dB and 3 dB. The mixing ratio β [ 0 , 1 ] controls the fraction of high-power cells, while the cell under test is set in a low-power clutter background.
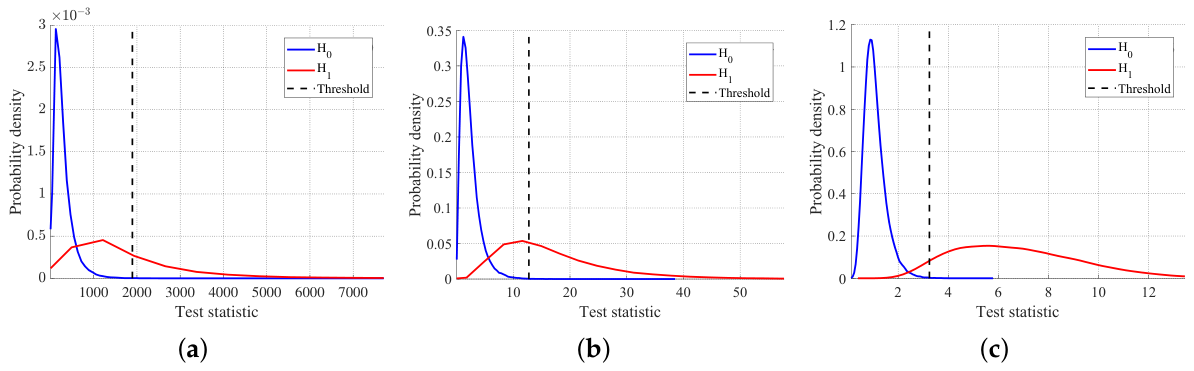
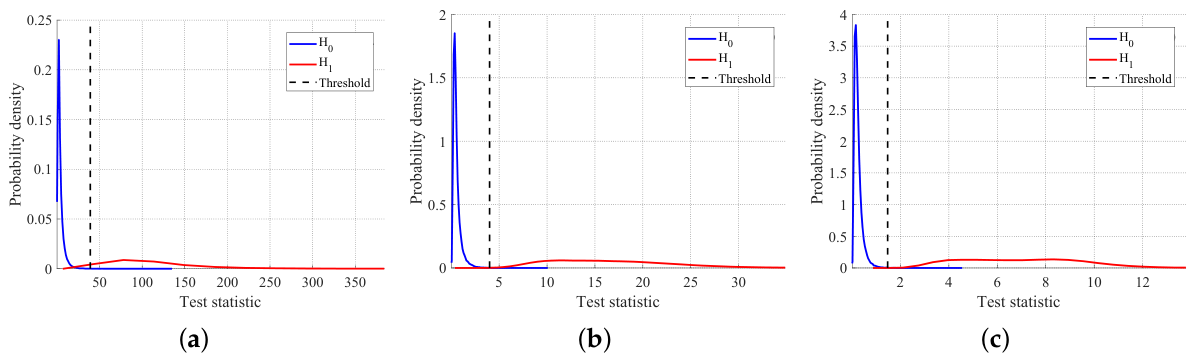
Figure 10 shows P d versus β for both scenarios. Under distribution heterogeneity, the KL-based MIG detector suffers a pronounced performance drop when the mixture of the two clutter distributions becomes strong, whereas NGMR-MIG maintains a substantially flatter response. Under power heterogeneity, the tKL-based MIG detector exhibits a clear degradation in detection probability in the presence of high-power clutter mixing, while NGMR-MIG again shows less sensitivity to the mixture of clutter power. The experiments above indicate that the dispersion normalization improves the robustness of the proposed detector under both distributional and power heterogeneity. It should be noted that, in Figure 10a, the detection probability of NGMR-MIG is slightly lower than that of the tKL-based MIG detector at β = 1 . In NGMR-MIG, the selected measure is optimal according to the proposed criterion, and the final statistic is constructed with dispersion normalization rather than by directly using the raw geometric divergence. Therefore, NGMR-MIG should not be regarded as the optimal envelope of all fixed-measure detectors. When β = 1 , the distribution heterogeneity is weakened. In this boundary case, the raw tKL divergence happens to match the environment well, whereas the benefit of dispersion normalization becomes less pronounced under finite reference samples. Nevertheless, over the whole range of β , NGMR-MIG exhibits a flatter detection performance, as shown in Figure 11 and Figure 12.
To further reveal the connection between the statistical design and robustness, this section analyzes the test statistic distributions at the representative heterogeneous scenario of β = 0.5 . This parameter corresponds to a balanced mixture of two clutter components, where the environmental heterogeneity is manifested. Consistent with the simulation configurations in Figure 10, statistical samples of all detectors are collected under the clutter-only hypothesis H 0 and the target-present hypothesis H 1 . The empirical distributions of the test statistics are plotted to characterize the degree of separation between clutter and target statistics.
For the KL- and tKL-based MIG detectors, the clutter-only statistic distributions show long tails under heterogeneous backgrounds. This indicates that clutter fluctuations can generate large values. According to the threshold-setting procedure under a prescribed false alarm probability, such long-tailed distributions lead to relatively high thresholds. Consequently, part of the target-present samples may fall below the threshold and be misclassified as clutter. In addition, the H 0 and H 1 distributions of the KL- and tKL-based MIG detectors show stronger overlap, indicating weaker separability between clutter and target statistics.
In contrast, NGMR-MIG suppresses the long tail of the clutter-only statistic distribution by normalizing the CUT-to-centroid deviation with the intrinsic dispersion. As a result, clutter-induced abnormal statistic values are reduced, the clutter and target distributions become more separable, and more target-present samples can be detected under the same false alarm probability. Consequently, these statistic-level observations directly support the stable detection performance of the proposed detector.

5. Conclusions

This paper proposes a normalized geometric measure ratio matrix information geometry (NGMR-MIG) framework for optimal geometric measure selection and radar target detection in heterogeneous clutter environments. The framework addresses two key limitations of classical MIG detectors: the empirical selection of the geometric measure and the lack of normalization against natural clutter fluctuation, which often leads to false alarms in dynamically varying strong clutter. The test statistic is constructed as the ratio of inter-class deviation to intra-class dispersion, combining adaptive measure selection and dispersion-based normalization into one step. Geometrically, this defines an adaptive open ball around the clutter centroid, whose radius scales with the local scatter of the reference samples. Experimental results on simulated and measured radar datasets demonstrate that NGMR-MIG achieves performance improvements of 3–5 dB over classical MIG detectors while maintaining robust false alarm control. Current limitations include the single-target assumption and the computational demands of high-dimensional real-time processing. Future work will explore more refined adaptive detection strategies on the manifold and integrate data-driven measure selection for end-to-end detection.

Author Contributions

Writing—original draft preparation, X.P.; writing—review and editing, X.P., H.W.; visualization, Z.Y.; supervision, Y.C.; conceptualization and methodology, X.P.; investigation, H.L.; resources and software, X.H. All authors have read and agreed to the published version of the manuscript.

Funding

This research was funded by the National Natural Science Foundation of China under Grant 62322122, 62371458, 62301598 and 62501616.

Data Availability Statement

The original contributions presented in this study are included in the article. Further inquiries can be directed to the corresponding author.

Conflicts of Interest

The authors declare no conflicts of interest.

References

  1. Xu, S.; Bai, X.; Guo, Z.; Shui, P. Status and prospects of feature-based detection methods for floating targets on the sea surface. J. Radars 2020, 9, 684–714. [Google Scholar]
  2. He, Y.; Huang, Y.; Guan, J.; Liu, N. Research progress in radar maritime target detection technology. J. Signal Process. 2025, 41, 969–992. [Google Scholar]
  3. Jakeman, E.; Pusey, P. A model for non-Rayleigh sea echo. IEEE Trans. Antennas Propag. 1976, 24, 806–814. [Google Scholar] [CrossRef]
  4. Conte, E.; Longo, M. Characterisation of radar clutter as a spherically invariant random process. IEE Proc. Commun. Radar Signal Process. 1987, 134, 191–196. [Google Scholar] [CrossRef]
  5. Greco, M.; Gini, F. Statistical analysis of high-resolution SAR ground clutter data. IEEE Trans. Geosci. Remote Sens. 2007, 45, 566–575. [Google Scholar] [CrossRef]
  6. Chen, S.; Luo, F.; Luo, X. Multiview feature-based sea surface small target detection in short observation time. IEEE Geosci. Remote Sens. Lett. 2021, 18, 1189–1193. [Google Scholar] [CrossRef]
  7. Zou, R.; Cheng, Y.; Wu, H.; Yang, Z.; Hua, X. A steering-vector-based matrix information geometry method for space–time adaptive detection in heterogeneous environments. Remote Sens. 2024, 16, 2208. [Google Scholar]
  8. Sangston, K.; Gini, F.; Greco, M. Coherent radar target detection in heavy-tailed compound-Gaussian clutter. IEEE Trans. Aerosp. Electron. Syst. 2012, 48, 64–77. [Google Scholar] [CrossRef]
  9. Ward, K.; Tough, R.; Watts, S. Sea Clutter: Scattering, the K Distribution and Radar Performance, 2nd ed.; The Institution of Engineering and Technology: London, UK, 2013. [Google Scholar]
  10. Raynal, A.; Doerry, A. Doppler Characteristics of Sea Clutter; Technical Report SAND2010-3828; Sandia National Laboratories: Albuquerque, NM, USA, 2010.
  11. Toporkov, J.; Sletten, M. Statistical properties of low-grazing range-resolved sea surface backscatter generated through two-dimensional direct numerical simulations. IEEE Trans. Geosci. Remote Sens. 2007, 45, 1181–1197. [Google Scholar] [CrossRef]
  12. Guo, Z.; Shui, P. Anomaly based sea-surface small target detection using k-nearest neighbor classification. IEEE Trans. Aerosp. Electron. Syst. 2020, 56, 4947–4964. [Google Scholar] [CrossRef]
  13. Watts, S. Cell-averaging CFAR gain in spatially correlated K-distributed clutter. IEE Proc.-Radar Sonar Navig. 1996, 143, 321–327. [Google Scholar] [CrossRef]
  14. Rohling, H. Radar CFAR thresholding in clutter and multiple target situations. IEEE Trans. Aerosp. Electron. Syst. 1983, AES-19, 608–621. [Google Scholar] [CrossRef]
  15. Hansen, V.; Sawyers, J. Detectability loss due to “greatest of” selection in a cell-averaging CFAR. IEEE Trans. Aerosp. Electron. Syst. 1980, AES-16, 115–118. [Google Scholar] [CrossRef]
  16. Trunk, G. Range resolution of targets using automatic detectors. IEEE Trans. Aerosp. Electron. Syst. 1978, AES-14, 750–755. [Google Scholar] [CrossRef]
  17. Gini, F.; Farina, A.; Greco, M. Selected list of references on radar signal processing. IEEE Trans. Aerosp. Electron. Syst. 2001, 37, 329–359. [Google Scholar] [CrossRef]
  18. Robey, F.; Fuhrmann, D.; Kelly, E.; Nitzberg, R. A CFAR adaptive matched filter detector. IEEE Trans. Aerosp. Electron. Syst. 1992, 28, 208–216. [Google Scholar] [CrossRef]
  19. Conte, E.; Lops, M.; Ricci, G. Asymptotically optimum radar detection in compound-Gaussian clutter. IEEE Trans. Aerosp. Electron. Syst. 1995, 31, 617–625. [Google Scholar] [CrossRef]
  20. Barbaresco, F. Interactions between symmetric cone and information geometries: Bruhat-tits and siegel spaces models for high resolution autoregressive doppler imagery. In International Conference on Emerging Trends in Engineering and Technology; IEEE: Piscataway, NJ, USA, 2008; pp. 124–163. [Google Scholar]
  21. Arnaudon, M.; Barbaresco, F.; Yang, L. Riemannian medians and means with applications to radar signal processing. IEEE J. Sel. Top. Signal Process. 2013, 7, 595–604. [Google Scholar] [CrossRef]
  22. Moakher, M. Divergence measures and means of symmetric positive-definite matrices. In New Developments in the Visualization and Processing of Tensor Fields; Springer: Berlin/Heidelberg, Germany, 2012. [Google Scholar]
  23. Hua, X.; Cheng, Y.; Wang, H. Matrix CFAR detectors based on symmetrized Kullback–Leibler and total Kullback–Leibler divergences. Digit. Signal Process. 2017, 69, 106–116. [Google Scholar]
  24. Yang, Z.; Cheng, Y.; Wu, H.; Yang, Y.; Li, X.; Wang, H. Adaptive log-Euclidean metric on HPD manifold for target detection in dynamically changing clutter environments. IEEE Trans. Aerosp. Electron. Syst. 2024, 60, 9261–9274. [Google Scholar] [CrossRef]
  25. Hua, X.; Cheng, Y.; Wang, H. Geometric target detection based on total Bregman divergence. Digit. Signal Process. 2018, 75, 232–241. [Google Scholar] [CrossRef]
  26. Hua, X.; Fan, H.; Cheng, Y. Information geometry for radar target detection with total Jensen–Bregman divergence. Entropy 2018, 20, 256. [Google Scholar] [CrossRef] [PubMed]
  27. Chebbi, Z.; Moakher, M. Means of hermitian positive-definite matrices based on the log-determinant α-divergence function. Linear Algebra Appl. 2012, 436, 1872–1889. [Google Scholar] [CrossRef]
  28. Hua, X.; Ono, Y.; Peng, L.; Cheng, Y.; Wang, H. Target detection within nonhomogeneous clutter via total Bregman divergence-based matrix information geometry detectors. IEEE Trans. Signal Process. 2021, 69, 4326–4340. [Google Scholar] [CrossRef]
  29. Hua, X.; Cheng, Y.; Wang, H. Geometric means and medians with applications to target detection. IET Signal Process. 2017, 11, 711–720. [Google Scholar] [CrossRef]
  30. Zhao, W.; Liu, W.; Jin, M. Spectral norm based mean matrix estimation and its application to radar target CFAR detection. IEEE Trans. Signal Process. 2019, 67, 5746–5760. [Google Scholar] [CrossRef]
  31. Yan, Y.; Hu, C.; Jiang, Q.; Yang, H.; Li, W.; Wang, R. A matrix information geometry detector based on Riemannian Gaussian distribution for radar detection in clutter backgrounds. IEEE Trans. Aerosp. Electron. Syst. 2025, 61, 14160–14176. [Google Scholar] [CrossRef]
  32. Yang, Z.; Cheng, Y.; Wu, H.; Hua, X.; Li, X.; Wang, H. Subband matrix information geometry detector in heterogeneous clutter. In 2022 IEEE 22nd International Conference on Communication Technology (ICCT); IEEE: Piscataway, NJ, USA, 2022; pp. 313–317. [Google Scholar]
  33. Yang, Z.; Cheng, Y.; Wu, H. Enhanced matrix information geometry detection for weak targets in heterogeneous clutter environment. Sci. China Inf. Sci. 2025, 68, 219301. [Google Scholar] [CrossRef]
  34. Wu, H.; Cheng, Y.; Chen, X.; Li, X.; Wang, H. Adaptive matrix information geometry detector with local metric tensor. IEEE Trans. Signal Process. 2022, 70, 3758–3773. [Google Scholar] [CrossRef]
  35. Yang, Z.; Cheng, Y.; Wu, H.; Yang, Y.; Li, X.; Wang, H. Manifold transformation-based information geometry radar target detection method. J. Electron. Inf. Technol. 2024, 46, 4317–4327. [Google Scholar]
  36. Pan, X.; Wu, H.; Cheng, Y. Geometric measures for information geometry detectors in sea clutter environments. In 2025 IEEE International Workshop on Electromagnetics: Applications and Student Innovation Competition (iWEM); IEEE: Piscataway, NJ, USA, 2025; pp. 153–156. [Google Scholar]
  37. Tian, F.; Wei, T.; Fu, W.; Wang, S. Research on target detection algorithm for complex traffic scenes based on ADVI-CFAR. Electronics 2025, 14, 1474. [Google Scholar] [CrossRef]
  38. Xiao, D.; Liu, W.; Chen, H.; Li, H.; Li, B. An adaptive radar target detection method based on alternate estimation in power heterogeneous clutter. Remote Sens. 2024, 16, 2508. [Google Scholar] [CrossRef]
  39. Cao, V. Modelling of inhomogeneity in radar clutter using Weibull mixture densities. IET Radar Sonar Navig. 2014, 8, 180–194. [Google Scholar] [CrossRef]
  40. Wang, S.; Inkol, R.; Rajan, S.; Patenaude, F. Performance analysis of the FFT filter bank-based summation CFAR detector. In 2008 IEEE Instrumentation and Measurement Technology Conference; IEEE: Piscataway, NJ, USA, 2008; pp. 452–456. [Google Scholar]
  41. Zhu, J.; Tang, J. K-distribution clutter simulation methods based on improved ZMNL and SIRP. J. Radars 2014, 3, 533–540. [Google Scholar] [CrossRef]
  42. Cheng, Y.; Zou, R.; Chen, J. Radar detection dataset of low-slow-small UAV under ground clutter (LSS-Ku-1.0). J. Signal Process. 2025, 41, 807–820. [Google Scholar]
  43. Liu, N.; Dong, Y.; Wang, G. Sea-detecting X-band radar and data acquisition program. J. Radars 2019, 8, 656–667. [Google Scholar]
Figure 1. Principle block diagram of the classical MIG detection. The received echoes are first transformed into covariance matrices residing on the matrix manifold. Detection is then performed by evaluating the geometric distance between the CUT matrix and the centroid of the reference matrices. The dashed lines between the dots represent this geometric distance, which serves as the test statistic in the classical MIG detector.
Remotesensing 18 02098 g001
Figure 2. Schematic diagram of the optimal geometric measure selection criterion. The red dashed line represents the geometric distance between the CUT and the clutter centroid under the target-present hypothesis, while the blue dashed lines represent the geometric distances between the clutter matrices and the clutter centroid.
Remotesensing 18 02098 g002
Figure 3. Block diagram of the NGMR-MIG detection procedure. The arrows indicate the processing flow. The asterisk (∗) denotes the optimal geometric measure selected by the proposed criterion.
Remotesensing 18 02098 g003
Figure 4. PCA visualization of covariance matrices under statistical distribution heterogeneity. The dashed circle schematically depicts the natural scatter boundary centered at the geometric centroid, with radius equal to the average intrinsic dispersion σ ref of the reference cells. (a) Homogeneous clutter. (b) Heterogeneous clutter.
Remotesensing 18 02098 g004
Figure 5. PCA visualization of covariance matrices under power heterogeneity. The dashed circle schematically depicts the natural scatter boundary centered at the geometric centroid, with radius equal to the average intrinsic dispersion σ ref of the reference cells. (a) Homogeneous clutter. (b) Heterogeneous clutter.
Remotesensing 18 02098 g005
Figure 6. Normalized test statistics of NGMR-MIG and competing methods under two K-distributed clutter settings. (a) v = 1 , μ = 0.5 . (b) v = 3 , μ = 1 .
Remotesensing 18 02098 g006
Figure 7. Comparison of normalized test statistics between NGMR-MIG and competing methods in LSS-Ku-1.0. (a) raw data. (b) AMF. (c) ANMF. (d) FFT. (e) Rm. (f) LE. (g) KL. (h) tKL. (i) NGMR-MIG.
Remotesensing 18 02098 g007
Figure 8. Probability of detection versus the signal to clutter ratio for the SDRDSP dataset. (a) 20221112160048_stare_HH.mat. (b) 20221112150043_stare_HH.mat.
Remotesensing 18 02098 g008
Figure 9. The ROC curves for the SDRDSP dataset. (a) 20221112160048_stare_HH.mat. (b) 20221112150043_stare_HH.mat.
Remotesensing 18 02098 g009
Figure 10. Robustness of NGMR-MIG against different levels of clutter heterogeneity. (a) distribution heterogeneity. (b) power heterogeneity.
Remotesensing 18 02098 g010
Figure 11. Test statistic distributions at β = 0.5 under distribution heterogeneity. (a) MIG with KLD. (b) MIG with tKLD. (c) NGMR-MIG.
Remotesensing 18 02098 g011
Figure 12. Test statistic distributions at β = 0.5 under power heterogeneity. (a) MIG with KLD. (b) MIG with tKLD. (c) NGMR-MIG.
Remotesensing 18 02098 g012
Table 1. Computational complexity comparison of representative MIG detectors.
DetectorMain StepsComplexity
KLKL measure + centroid O ( K N 3 )
sKLsKL measure + centroid O ( K N 3 )
tKLtKL measure + centroid O ( K N 3 )
LELE measure + centroid O ( K N 3 )
RmRm measure + iterative centroid O ( I K N 3 )
NGMR-MIGcandidate measure + centroid + σ ref O ( ( M + I ) K N 3 )
K: number of reference cells; N: matrix dimension; I: iterations for the Rm centroid; M: number of candidate measures.
Disclaimer/Publisher’s Note: The statements, opinions and data contained in all publications are solely those of the individual author(s) and contributor(s) and not of MDPI and/or the editor(s). MDPI and/or the editor(s) disclaim responsibility for any injury to people or property resulting from any ideas, methods, instructions or products referred to in the content.