


Highlights
What are the main findings?
- A spectral response function (SRF) was introduced to quantify the response of Rrs to relative changes in CDOM, chlorophyll-a, and mineral particles.
- The applied spectral response function reveals that mineral particles have a secondary but condition-dependent influence on Rrs, primarily through scattering processes.
What are the implications of the main findings?
- The results highlight limitations of single-band and band-ratio algorithms in optically complex Baltic waters, where multiple constituents simultaneously affect the signal.
- The proposed spectral response framework provides a quantitative basis for improving bio-optical models and remote sensing algorithms for Case 2 waters.
Abstract
Remote sensing reflectance (Rrs) in optically complex waters is controlled by the combined effects of phytoplankton, colored dissolved organic matter (CDOM), and suspended mineral particles. In the Baltic Sea, strong CDOM absorption and variable particle loads complicate the interpretation of ocean color signals and the retrieval of biogeochemical properties. In this study, we investigate the individual and combined influence of these optically significant constituents on Rrs using a set of HydroLight radiative transfer simulations representing typical Baltic Sea conditions. A wide range of chlorophyll-a (0.25–10 mg·m−3), CDOM absorption (0.5–15 m−1), and particulate inorganic matter (0.04–4 g·m−3) was considered. To quantify the influence of each component, a spectral response function was applied, defined as the change in Rrs relative to a normalized perturbation of each input parameter. This approach preserves information about the magnitude of the reflectance signal and allows direct comparison of the impact of different constituents across the visible spectrum. The spectral response analysis reveals that the relative influence of each constituent varies with wavelength and environmental conditions, highlighting the limitations of single-band or ratio-based algorithms in optically complex waters. These findings provide a quantitative framework for interpreting spectral variability of Rrs in the Baltic Sea and other optically complex water basins, support the development of more robust bio-optical algorithms for Case 2 waters. Similar spectral response analysis can be conducted in other water basins in order to quantify combined constituent-specific effects on Rrs.
1. Introduction
The Baltic Sea is one of the world’s largest semi-enclosed brackish water bodies and provides numerous ecosystem services that support the economies of the surrounding countries. Its coastal and marine ecosystems sustain fisheries, maritime transport, tourism, recreation, and other economic activities while contributing to nutrient cycling, carbon sequestration, and biodiversity conservation [1,2]. At the same time, the Baltic Sea is subject to substantial anthropogenic pressure, including eutrophication, pollution, and climate-driven environmental changes, making continuous environmental monitoring a key requirement for sustainable management of the region [3].
Monitoring the distribution and variability of seawater constituents, such as phytoplankton pigments, colored dissolved organic matter (CDOM), and suspended particulate matter, is essential for assessing ecosystem status and understanding biogeochemical processes in the Baltic Sea [4]. These constituents directly influence water quality, primary productivity, and light penetration and serve as indicators of eutrophication and other environmental changes [5,6]. However, the Baltic Sea is optically complex due to strong spatial gradients in salinity, high terrestrial inputs of organic matter, and independently varying concentrations of phytoplankton, CDOM, and suspended particles, which complicate both in situ and satellite-based observations [7].
Satellite ocean-color remote sensing offers an effective means of monitoring seawater constituents across large spatial scales and with high temporal frequency. Recent advances in sensors such as Sentinel-3 OLCI have improved the capability to retrieve chlorophyll-a (Chl-a), CDOM, and suspended matter concentrations in Baltic waters, enabling long-term assessments of ecosystem dynamics and supporting environmental management initiatives [8,9]. Consequently, the development and validation of robust remote sensing approaches for the Baltic Sea remain important research priorities for both scientific understanding and operational monitoring of this environmentally and socio-economically significant marine ecosystem.
The absorption coefficient, together with the volume scattering function, defines the inherent optical properties (IOPs) of a water body. IOPs can be measured in situ or in the laboratory, providing local and temporal information on seawater composition and quality. Total absorption and scattering coefficients in seawater are the sums of the corresponding coefficients for each optically significant component [10]:
where aw(λ) is the absorption of pure water, achl(λ) is the absorption of Chl-a (the organic fraction of total suspended particulate matter), aCDOM(λ) is the absorption of CDOM, and aPIM(λ) is the absorption of particulate inorganic matter (PIM). Correspondingly, bw(λ), bchl(λ), and bPIM(λ) are the scattering coefficients of pure water, Chl-a, and mineral particles.
a(λ) = aw(λ) + achl(λ) + aCDOM(λ) + aPIM(λ),
b(λ) = bw(λ) + bchl(λ) + bPIM(λ),
In contrast, apparent optical properties (AOPs) are derived from measurements of downwelling and upwelling light intensity obtained using remote techniques—from space, offshore platforms, optical buoys, or sensors deployed directly in the water [11].
In ocean optics, remote sensing reflectance (Rrs) is a key quantity used to interpret the color of the ocean and to retrieve the concentrations of individual seawater components from satellite or airborne sensors. It provides a normalized measure of water-leaving radiance and is defined as [10]
where is the water-leaving radiance (W·m−2·sr−1) and is the downwelling irradiance (W·m−2). In open-ocean waters, the spectrum of Rrs is primarily shaped by Chl-a concentration and co-varying CDOM [12]. In coastal waters, estuaries, and inland seas, the relationship between Rrs and the concentrations of individual components becomes more complex, driven by local interrelationships. Nevertheless, Rrs plays a critical role in coastal water observation for environmental, ecological, and human-activity-related purposes. The spectral variability of Rrs carries information about seawater component concentrations, but the effects of multiple components often overlap. Understanding the potential influence of each component on water-leaving light is therefore essential for correctly interpreting Rrs data. Therefore, there is a need to establish multi-band and multi-band ratio relationships between Rrs and component concentrations. This is particularly important in coastal and optically complex waters, where global algorithms and models have limited applicability, and the use of inappropriate models can lead to misinterpretation of results. Most previous studies have focused on empirical relationships between selected Rrs band ratios and individual water constituents, such as chlorophyll-a, colored dissolved organic matter (CDOM), or suspended mineral particles [4,13,14,15]. While these approaches have proven useful for the development of constituent-specific retrieval algorithms, there remains a lack of methods capable of quantifying the relative spectral response of Rrs to simultaneous changes in multiple optically significant constituents. This limitation is particularly important in optically complex waters, where phytoplankton, CDOM, and mineral particles coexist and interact to shape the observed reflectance spectrum [10,16].
To address this gap, we analyzed a set of unbiased Rrs spectra generated through radiative transfer modeling using representative ranges of IOPs measured in the Baltic Sea. The aim of this study is to identify and discuss the spectral features of Rrs associated with variations in CDOM, phytoplankton, and mineral particle concentrations, with particular emphasis on the optically complex environment of the Baltic Sea. Although the influence of optically significant constituents on remote sensing reflectance has been extensively investigated, relatively few studies have quantitatively characterized these relationships specifically for Baltic Sea waters, which are distinguished by high CDOM concentrations, strong seasonal variability, and large spatial gradients in constituent composition [7,13,14,17]. One important knowledge gap is the absence of a comprehensive framework for identifying spectral regions that remain sensitive to a given constituent under varying concentrations of other coexisting constituents.
To overcome this limitation, we propose the use of the spectral response function (SRF) as a measure of the sensitivity of Rrs to relative changes in CDOM, Chl-a, and mineral particles. Previous studies have investigated sensor-specific spectral response functions (also referred to as relative spectral response functions) and their influence on ocean-color products, sensor intercomparisons, and Rrs retrievals [18,19,20,21]. However, these investigations have primarily focused on sensor characteristics and global ocean-color applications rather than on the spectral response of Rrs to variations in water constituents, particularly in the Baltic Sea. Analogous to the use of sensor response functions for cross-sensor harmonization, the SRF proposed here can be applied to radiative transfer modeling datasets to identify wavelength regions that are most sensitive to phytoplankton, CDOM, and mineral particles while explicitly accounting for their simultaneous occurrence in varying proportions. Such information may support the development, optimization, and interpretation of bio-optical algorithms by linking spectral sensitivity directly to constituent concentrations.
The objectives of this study are:
- To assess the individual and combined influence of phytoplankton, CDOM, and mineral particles on remote sensing reflectance within concentration ranges representative of optically complex Baltic Sea waters, using radiative transfer modeling.
- To provide a quantitative and convenient measure of the spectral sensitivity of Rrs to optically significant constituents under Baltic Sea conditions and in similar coastal and inland waters.
2. Materials and Methods
2.1. Study Site
The Baltic Sea is a very atypical water basin, with limited water exchange with the North Sea and a high riverine freshwater input, resulting in very low surface salinity of about 7 PSU. It is a semi-enclosed sea with one of the highest transport intensities in the world, making it particularly susceptible to long-term pollution and the cumulative effects of excessive nutrient inputs [22]. The Baltic Sea is relatively shallow, with an average depth of about 55 m, and 86% of its area is shallower than 100 m [23]. The euphotic zone in the Baltic Sea ranges from 1 to 5 m in estuaries and small gulfs to about 13 m in the Baltic Proper, reaching up to 22 m in the largest Bothnian Bay and Bothnian Sea [24].
From an optical perspective, the Baltic Sea is a complex water basin classified as Case 2 waters [25]. Its inherent optical properties are primarily shaped by three types of components: phytoplankton, colored dissolved organic matter (CDOM), and suspended mineral particles. Phytoplankton, typically characterized by the concentration of its main pigment, chlorophyll-a (Chl-a), exhibits strong seasonal variability, with maxima during spring and summer blooms. Chl-a concentrations typically range from 0.1 mg·m−3 in the winter season in deeper areas to 15 mg·m−3 in gulfs and estuaries (see Table 1) [26]. Average Chl-a concentrations tend to increase over the years due to persistent eutrophication [27], and spring and summer blooms are becoming more frequent and prolonged [28].
Table 1.
Typical ranges * of optical parameters in different regions of the Baltic Sea [24,26,29].
Baltic Sea waters are characterized by a relatively high content of CDOM, which dominates the process of light absorption. The absorption coefficient spectrum of CDOM decreases exponentially across the ultraviolet-visible range. It is characterized by the absorption at a reference wavelength, aCDOM(λ0), where λ0 is usually 440 nm, and by the slope of the exponential curve, γ. Values of aCDOM(λ0) typically range from 0.25 m−1 in open Baltic waters to 5 m−1 in coastal waters and up to 15 m−1 in turbid estuaries. The slope γ has been reported to vary between 0.007 and 0.036 with a median of 0.018–0.020 [29,30].
At the same time, large riverine inflows make coastal Baltic waters rich in suspended particulate matter (SPM) of inorganic origin. The inorganic part of the total SPM is often referred to as PIM—particulate inorganic matter. Mineral particles primarily affect light scattering, contributing to the total scattering coefficient and altering the directional distribution of scattering, as described by the volume scattering function. Particle scattering and backscattering coefficients are spectrally described by power-law functions. Typical concentrations of mineral particles in the Baltic Sea range from 0.04 mg·m−3 in open waters to several g·m−3 in coastal areas [26,29].
2.2. Radiative Transfer Simulations
In the present study, we selected a typical range of inherent optical properties for the Baltic Sea and then used the HydroLight numerical model (Numerical Optics Ltd., Devon, UK) to compute remote sensing reflectance. The HydroLight software 6.0 version solves the radiative transfer equation (RTE) using a direct solution based on the invariant embedding method developed by Mobley [10]. The RTE is a differential–integral equation that describes changes in the directional distribution of radiance with depth in water. In the case of horizontally homogeneous water, the time-independent RTE is given as follows [10]:
where L(z, θ, ϕ, λ) is the directional and spectral radiance at depth z; a(z, λ) and b(z, λ) are the total absorption and scattering coefficients at depth z; is the phase function of the volume scattering function, and the scattering angle in is defined as the angle between the incident light direction (θ, ϕ) and the scattered direction (θ′, ϕ′). The source function S(z, θ, ϕ, λ) is usually considered to represent inelastically scattered light at other wavelengths (by chlorophyll-bearing particles and CDOM) or an internal light source such as bioluminescence.
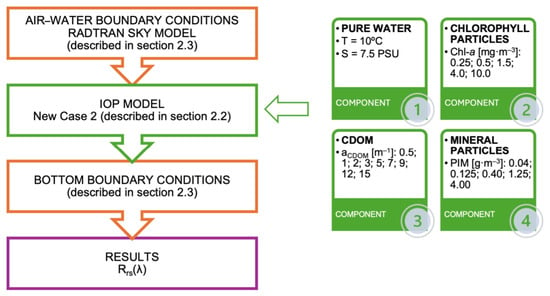
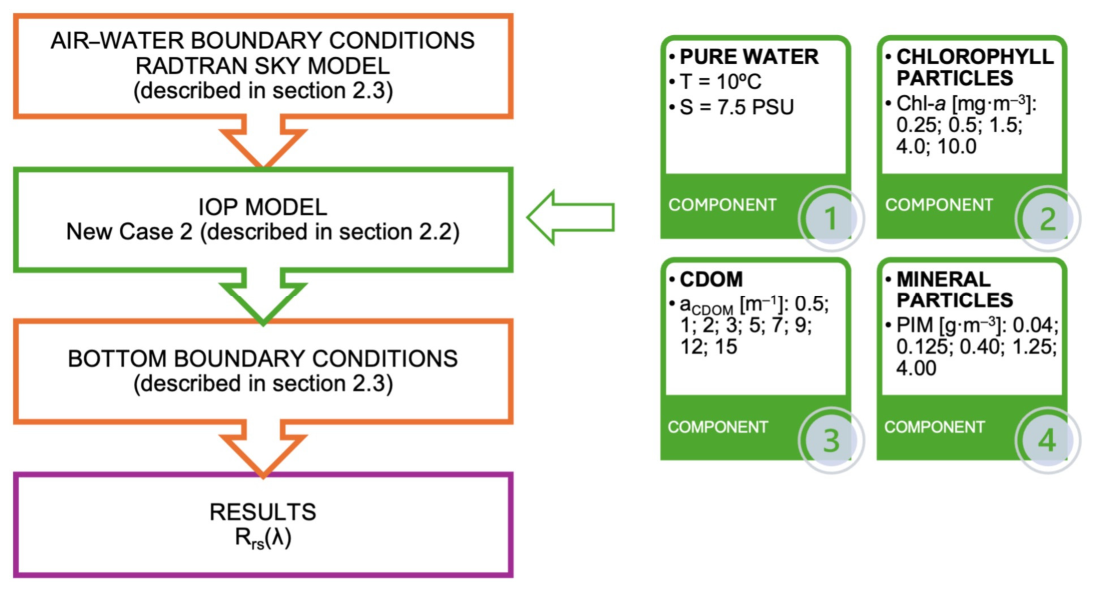
Figure 1 shows a schematic block diagram of the HydroLight radiative transfer model applied in this study. All simulations were conducted using the same air–water and seabed boundary conditions in order to compare specific features of Rrs shaped solely by seawater components.
Figure 1.
Block diagram of the applied radiative transfer model from HydroLight software. Elements framed in orange are constant in all simulations; elements framed in green are variable.
2.3. Bio-Optical Model of the Baltic Sea
In this study, we customized the New Case 2 IOPs model suitable for optically complex waters. The model consists of four components: pure water, chlorophyll-bearing particles, CDOM, and mineral particles.
Pure water. Optical properties of pure seawater were computed as functions of the water temperature (T) and salinity (s) after Röttgers et al. [31] and Zhang et al. [32], using T = 10 °C (most typical of the spring–summer season, when measurements are conducted) and s = 7.5 PSU (average for the Baltic Proper) [33].
Chlorophyll-dependent components. Chlorophyll-a concentration was assumed to be constant with depth and varied from 0.25 mg·m−3 to 10 mg·m−3, based on typical values measured in the Baltic Sea and included in datasets from Woźniak et al. [29] and Kratzer and Moore [26]. All IOPs were determined as functions of Chl-a concentration, using combined data from Morrison and Nelson [34] and Bricaud et al. [35] for absorption coefficients, and from Morel et al. [36] for scattering coefficients and phase functions:
where A(λ) and E(λ) are experimentally derived coefficients over a large dataset from Bricaud et al. [33]; while b0(Cchl-a), n, and υ are experimentally derived parameters by Morel et al. [36] applied in the HydroLight model. Technically, the model separates small- and large-particle phase functions, and the fraction of their contribution is determined by chlorophyll concentration. Medium UV absorption was assumed.
CDOM. The absorption of CDOM decreases exponentially with wavelength according to Mobley and Sundman [37]:
where is the CDOM absorption at the reference wavelength λ0 = 440 nm, expressed in m−1, and γ is the slope of the exponential decay. The range of aCDOM(440) values varied from 0.5 m−1 (typical for open Baltic Sea waters) to 15 m−1 (characteristic of turbid estuarine waters). For all simulations, we assumed the same representative Baltic Sea value of the slope, γ = 0.018, following Kratzer and Moore [26].
Regarding mineral particles, the concentration of mineral particles was assumed to be constant with depth and ranged from 0.04 g·m−3 (minimum values for open Baltic waters) to 4 g·m−3, representing typical maximum concentrations of particulate inorganic matter observed in bays during the spring season [26]. The absorption coefficient of PIM was described by an exponential decay function [37]:
where C is the PIM concentration in g·m−3; is the mass-specific absorption coefficient at the reference wavelength λ0 = 400 nm, expressed in m2·g−1; and S is the slope of the exponential decay. The value of was set to 0.09189 m2·g−1 following Woźniak et al. [38], and the slope S = 0.011 after Bowers et al. [39] and Babin et al. [40].
The scattering coefficient of PIM was described by a power-law function of the wavelength [37]:
where is the mass-specific scattering coefficient of PIM at the reference wavelength λ0 = 550 nm, expressed in m2·g−1, and m is the spectral exponent. Typical values of m in the Baltic Sea range between −1 and 1. In this study, the values m2·g−1 and m = 1 were selected as most representative, following Woźniak et al. [38].
The scattering phase function for PIM was described using a Fournier–Forand function, parameterized by the ratio of the backscattering coefficient bb,PIM to the total scattering coefficient bPIM [40]. For pure inorganic particles, the ratio bb,PIM/bPIM has been shown to be nearly wavelength-independent in the visible range (0.022–0.024) based on long-term Baltic Sea observations [38]; therefore, a constant value of 0.023 was assumed.
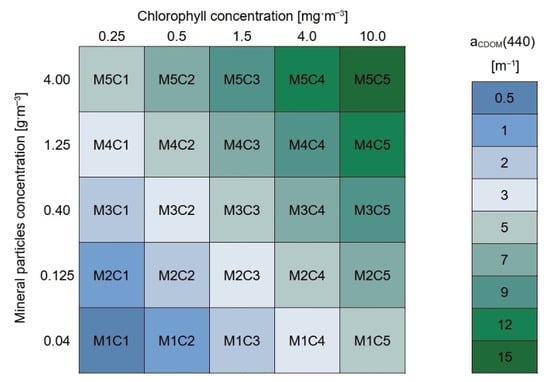
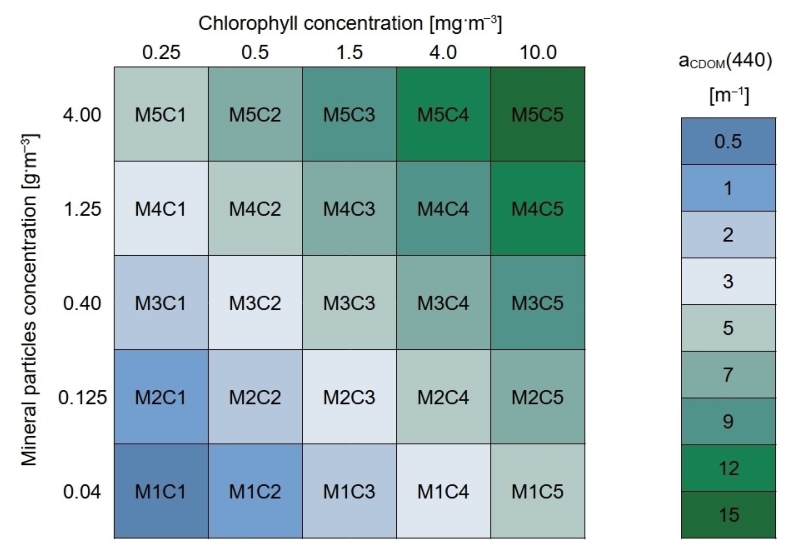
Figure 2 presents the scheme of the modeling series conducted for 25 combinations of five mineral particle concentrations (M1–M5) and five Chl-a concentrations (C1–C5). Corresponding values of aCDOM(440) were selected to represent realistic Baltic Sea conditions: lower CDOM absorption values, associated with low CDOM concentrations, are typical of open Baltic waters characterized by low Chl-a and low PIM concentrations, whereas higher concentrations of Chl-a and PIM correspond to higher CDOM levels. This controlled selection of parameters allowed us to analyze specific spectral features of remote sensing reflectance attributable to individual seawater components.
Figure 2.
Scheme of the HydroLight modeling series conducted for 25 combinations of five mineral particle concentrations, marked as M1–M5 in the rows, and five Chl-a concentrations, marked as C1–C5 in the columns. Corresponding values of aCDOM(440) are displayed using color shades and explained by the color bar.
2.4. Boundary Conditions
Simulations were performed using a set of representative boundary conditions for the Baltic Sea. All boundary conditions were kept constant in order to isolate the effects of individual seawater components on remote sensing reflectance.
The air–water interface was modeled using an azimuthally isotropic Cox–Munk wave slope distribution, parameterized by a wind speed of 5 m·s−1. The wavelength-dependent refractive index of seawater was computed for a temperature of T = 10 °C and salinity s = 7.5 PSU, following the empirical formulation of Quan and Fry [41]. The direct and diffuse components of downwelling irradiance were calculated using the RADTRAN-X sky model included in HydroLight. The sky model parameters were set to a solar zenith angle of 30° and 30% cloud cover in open waters above Gdansk Bay (55.0N; 19.0E). Default values were applied for most RADTRAN-X parameters, with the exception of sea-level pressure (101,325 kPa) and airmass type (type five was assumed in this study).
All simulations included the effects of inelastic scattering, namely Chl-a fluorescence, CDOM fluorescence, and Raman scattering by water. The depth of the water column was assumed to be infinite, which is a common approximation for optically complex and turbid waters such as the Baltic Sea. Due to relatively high concentrations of CDOM, phytoplankton, and mineral particles, light penetration in the Baltic Sea is strongly limited and typically does not reach the seabed. The depth of the euphotic zone in the Baltic Sea generally ranges from 1 to 5 m in estuaries and coastal gulfs to approximately 10–15 m in the Baltic Proper, reaching up to about 20–25 m in the Bothnian Sea and Bothnian Bay [22,24,25]. In contrast, the average bottom depth of the Baltic Sea is substantially greater. As a result, the euphotic zone occupies only the upper 10–30% of the water column in most regions (and up to ~50% in the Bothnian Bay), leaving the seabed permanently aphotic.
2.5. Spectral Response Function of Rrs
Simulations of Rrs enable a quantitative assessment of the impact of individual seawater constituents on the reflected signal. To compare the influence of Chl-a, colored dissolved organic matter (CDOM), and particulate inorganic matter (PIM), a spectral response function (SRF) was defined and evaluated across the visible spectrum.
The SRF is expressed as
where Rrs(λ) is the remote sensing reflectance at wavelength λ, and X is the input parameter (Chl-a concentration, aCDOM or PIM concentration), the fraction ΔX/X is the relative change in the input parameter, while ΔRrs(λ) represents the corresponding absolute change in reflectance.
In practice, the relative perturbation of the input parameter was defined using a symmetric (centered) formulation:
where xi and xj denote two arbitrary values of the parameter within the considered range. The SRF was evaluated for all pairwise combinations of parameter values, allowing the response of Rrs(λ) to be assessed across the full range of variability rather than only for local perturbations. Accordingly, the SRF was computed as
This formulation corresponds to a centered finite-difference approximation and provides a numerically stable estimate of the response across the full range of parameter variability. The SRF represents the absolute change in Rrs in response to a relative perturbation of the input parameter and therefore retains the same units as Rrs (sr−1).
Unlike dimensionless sensitivity metrics, the SRF preserves information about the magnitude of the reflectance signal, which is essential for remote sensing applications. In the limit of small perturbations, this formulation converges to , providing a physically consistent measure of the response of Rrs to changes in optically significant constituents.
3. Results
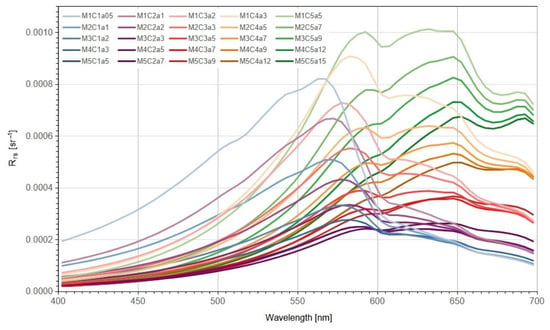
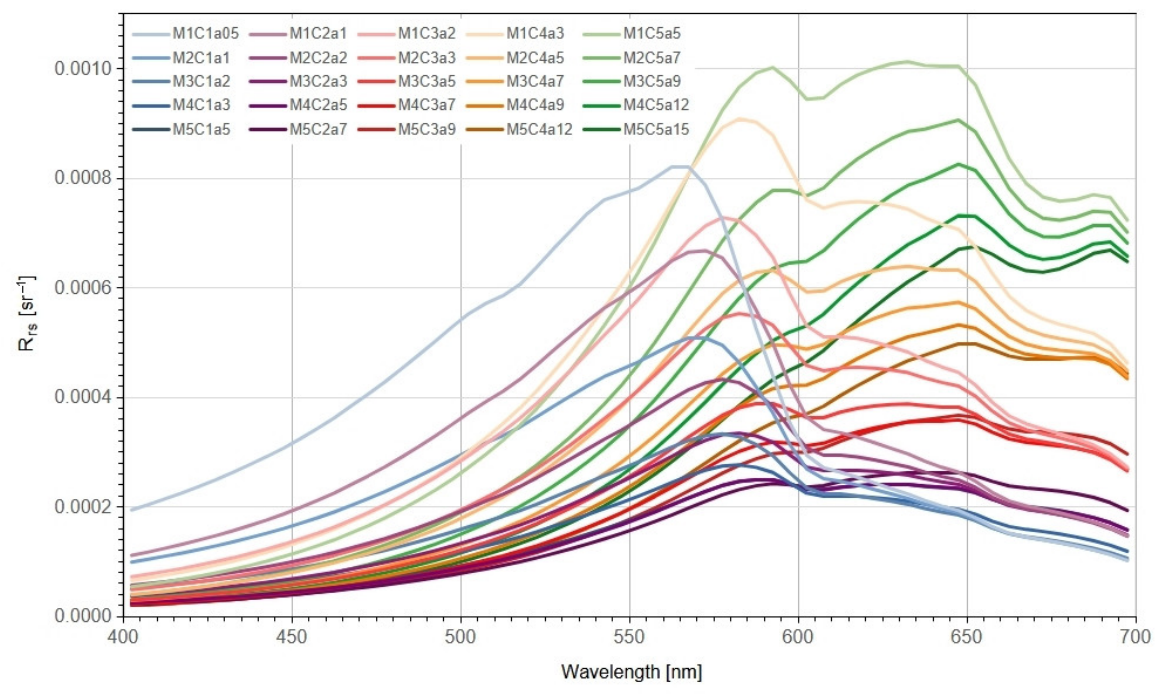
The modeling results of global variation in all three parameters are presented in Figure 3. It shows 25 remote sensing reflectance spectra generated using the HydroLight modeling software for 25 different parameter sets. The modeled scenarios varied in the concentration of PIM (five levels, shown in the rows of Figure 2), phytoplankton (represented by five levels of Chl-a concentration, shown in the columns of Figure 2), and CDOM, represented by nine different values of absorption at 440 nm, aCDOM (440) (see color scale in Figure 2).
Figure 3.
Summary of 25 remote sensing reflectance (Rrs) spectra obtained for different parameter sets of PIM concentration, Chl-a concentration, and CDOM absorption. The variation in these parameters is summarized in Figure 1.
Despite the inclusion of 25 spectra in a single figure (Figure 3), the use of distinct line colors and brightness levels allows several clear patterns to be identified. In the central part of the spectrum, the maximum Rrs values correspond to scenarios characterized by the lowest concentrations of mineral suspended particles, which are also associated with low CDOM levels. At shorter wavelengths (400–565 nm), the highest Rrs is observed for the M1C1a05 scenario, representing the lowest concentrations of CDOM, PIM, and Chl-a. At wavelengths above 570 nm, Rrs is dominated by the M1C5a5 scenario, which is characterized by minimal PIM concentration but the highest Chl-a concentration.
Spectra associated with high concentrations of mineral particles and Chl-a generally exhibit the lowest Rrs values in the short- and mid-wavelength ranges. In the red spectral region, above 620 nm, a clear stratification and ordering of the spectra emerge, primarily driven by differences in Chl-a concentration.
The highest Rrs values in the red spectral bands are associated with waters characterized by the highest Chl-a concentration (symbol C5), whereas the lowest Rrs values correspond to waters with the lowest Chl-a concentration (symbol C1). At wavelengths above 655 nm, the spectra become completely separated and grouped according to chlorophyll concentration. With increasing wavelength, the influence of the other parameters—namely, the PIM concentration and CDOM—progressively decreases, and their effect on the shape of the Rrs spectra becomes negligible.
The compilation of 25 spectra shown in Figure 3 motivated a more detailed analysis of the influence of individual (one-at-a-time) seawater components on the shape of Rrs spectra. Three additional local modeling series were conducted in order to isolate and highlight specific spectral features of Rrs associated with individual seawater components, as summarized in Table 2:
- Effect of PIM. The influence of particulate inorganic matter was analyzed under two representative conditions: a typical Baltic Proper scenario (fixed Chl-a = 0.25 mg·m−3 and aCDOM = 1 m−1) and a typical gulf scenario (fixed Chl-a = 4 mg·m−3 and aCDOM = 7 m−1).
- Effect of Chl-a. The influence of Chl-a was examined for a typical Baltic Proper scenario (fixed PIM = 0.04 g·m−3 and aCDOM = 1 m−1) and for a typical gulf scenario (fixed PIM = 4 g·m−3 and aCDOM = 7 m−1).
- Effect of CDOM. The influence of CDOM was also analyzed under four scenarios: (i) low PIM = 0.04 g·m−3 and low Chl-a = 0.25 mg·m−3, representing typical Baltic Proper values; (ii) high PIM = 4 g·m−3 and low Chl-a = 0.25 mg·m−3, representing gulf waters without an active phytoplankton bloom; (iii) low PIM = 0.04 g·m−3 and high Chl-a = 4 mg·m−3, representing open Baltic waters during a phytoplankton bloom; and (iv) high PIM = 4 g·m−3 and high Chl-a = 4 mg·m−3, representing typical gulf values during a bloom.
Table 2.
Parameters of the additional modeling series representing the most typical Baltic Sea scenarios, conducted to analyze the influence of individual seawater components on the shape of Rrs spectra.
Figure 4.
Effect of suspended mineral particles concentration on Rrs for (a) low Chl-a and low CDOM concentrations representing a typical Baltic Proper scenario, and (b) for high Chl-a and CDOM concentrations, representing a typical gulf scenario.
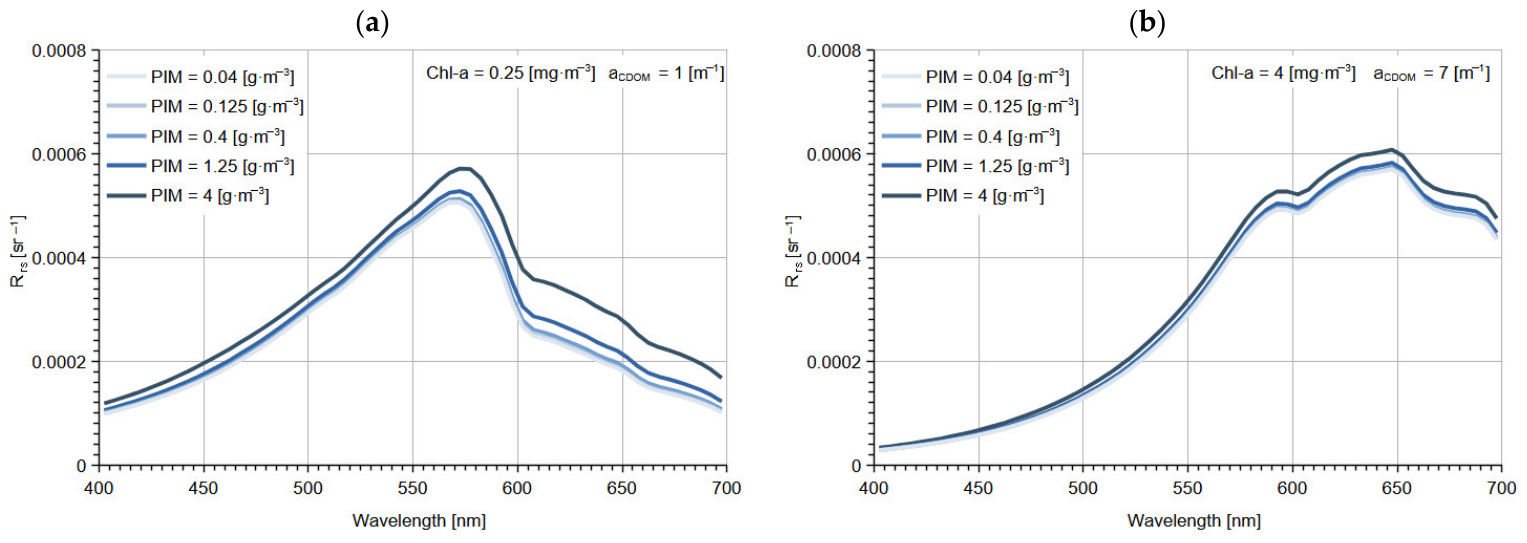
Figure 5.
Effect of Chl-a concentration on Rrs for (a) low PIM and CDOM concentrations, representing typical Baltic Proper conditions, and for (b) high PIM and CDOM concentrations, representing typical Gulf water conditions.
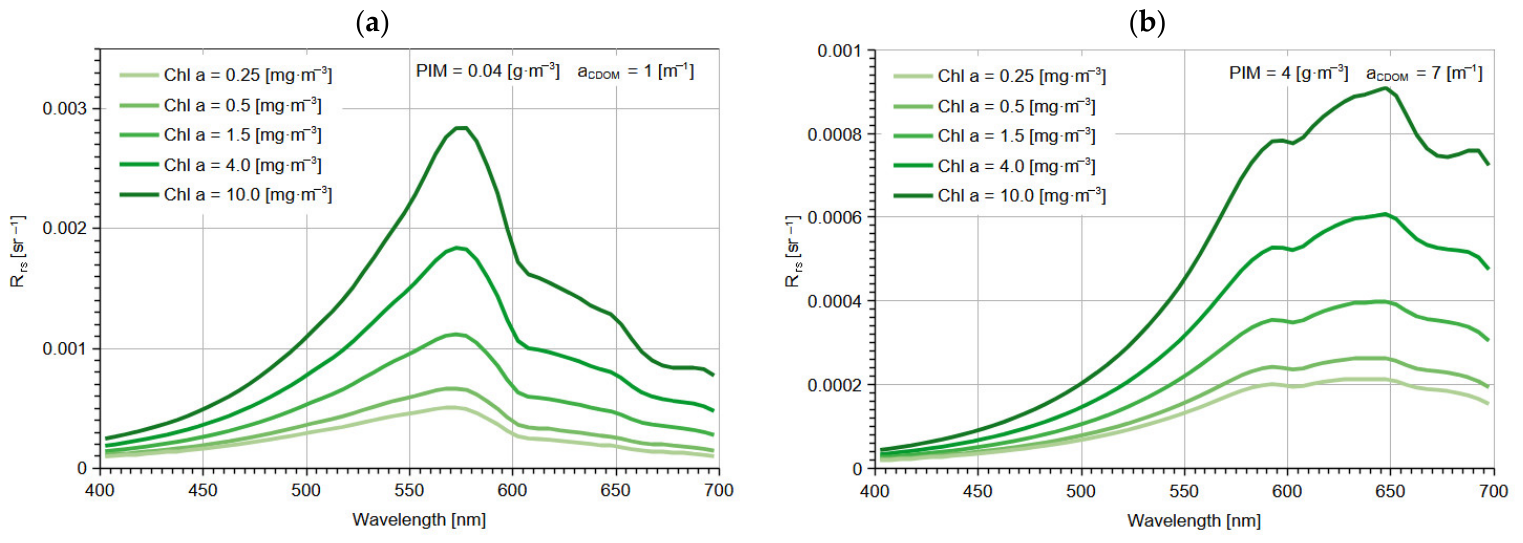
Figure 6.
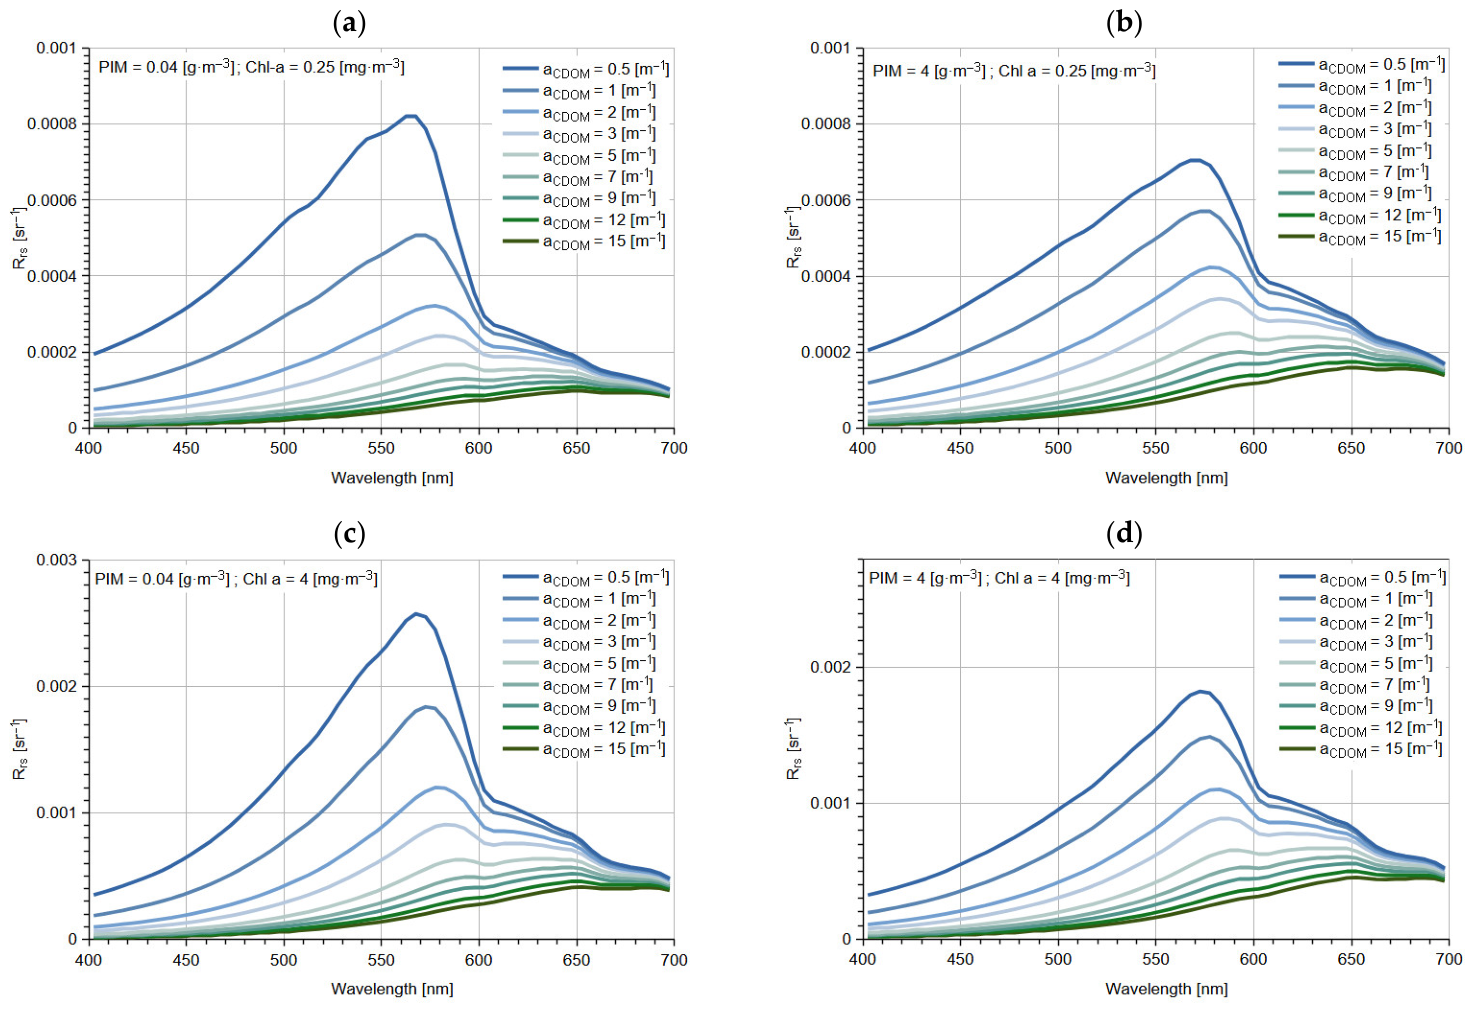
Influence of CDOM concentration, indicated by increasing aCDOM, on Rrs for four representative scenarios: (a) low PIM and low Chl-a, typical open Baltic waters; (b) high PIM and low Chl-a, gulf waters without an active phytoplankton bloom; (c) low PIM and high Chl-a, open Baltic waters during a phytoplankton bloom; and (d) high PIM and high Chl-a, gulf waters with an active phytoplankton bloom.
The analyses presented in the following sections focus on the effect of variations in the concentration of only one of the three optically significant seawater components at a time.
3.1. Influence of Mineral Particles on Rrs Spectra
Results presented in Figure 4 illustrate the influence of mineral particles on Rrs. Simulations were performed for five PIM concentrations—0.04, 0.125, 0.4, 1.25, and 4 g·m−3—while all other parameters were held constant. The highest PIM concentration is two orders of magnitude greater than the lowest.
Figure 4a shows Rrs spectra for low Chl-a concentration and low CDOM absorption (aCDOM(440) = 1 m−1), while Figure 4b presents results for elevated Chl-a concentration (4 mg·m−3) and higher CDOM absorption (aCDOM(440) = 7 m−1). Under low Chl-a and CDOM conditions, representing a typical Baltic Proper scenario, the Rrs spectra exhibit a characteristic shape, with low values at short and long wavelengths and a pronounced maximum in the green spectral region around 570–575 nm. Across all PIM concentrations, peak Rrs values are only about five times higher than the minimum values at the spectral edges. The highest reflectance corresponds to the largest PIM concentration, and the lowest to the smallest. The relative difference in Rrs between these two cases varies spectrally, reaching approximately 20% in the blue region, about 9% in the 525–550 nm range, and up to 66% in the red region.
In contrast, Figure 4b, representing a typical gulf scenario in the Baltic Sea, demonstrates Rrs variability under elevated phytoplankton and CDOM concentrations, where spectral differences are much more pronounced. Maximum Rrs values, observed near 645–650 nm, exceed the minimum values by nearly a factor of 20. Despite a 100-fold difference in PIM concentration, its influence on the spectral shape is minor. Although the highest Rrs values still correspond to the largest PIM concentration, the overall spectral form remains nearly unchanged. A comparison between PIM concentrations of 0.04 and 4 g·m−3 shows that Rrs increases by only ~17% at short wavelengths (400–450 nm), ~7% in the 580–660 nm range, and ~9% at longer wavelengths (680–700 nm).
Comparing Rrs spectra for waters with low Chl-a and CDOM (Figure 4a) and those with high concentrations of both components (Figure 4b) reveals a characteristic spectral shift. Elevated Chl-a and CDOM result in increased Rrs in the red spectral region (>600 nm), similar values in the central part of the spectrum, and reduced Rrs at shorter wavelengths. While variations in PIM concentration have a relatively moderate effect on Rrs magnitude and shape, phytoplankton—represented by Chl-a—is expected to introduce substantially greater spectral variability. This influence is examined in the following subsection under fixed CDOM and PIM conditions.
3.2. Influence of Chlorophyll on Rrs Spectra
Figure 5 presents simulations conducted for five Chl-a concentrations representing, for example, the development of a phytoplankton bloom. The concentrations selected for modeling (corresponding to the columns in Figure 2) were 0.25, 0.5, 1.5, 4, and 10 mg·m−3, spanning a 40-fold range between the lowest and highest values.
The simulations were first performed for low and fixed concentrations of particulate inorganic matter (PIM = 0.04 g·m−3) and CDOM (aCDOM(440) = 1 m−1) (Figure 5a). The modeling was then repeated for high and fixed values of both parameters, namely PIM = 4 g·m−3 and aCDOM(440) = 7 m−1 (Figure 5b). In both scenarios, the highest Rrs values correspond to the highest Chl-a concentration.
For low PIM and low CDOM conditions, representing typical bloom development conditions in the Baltic Proper, the spectral shape of Rrs remains similar across all chlorophyll concentrations, with maxima consistently occurring in the 570–580 nm range. Under high PIM and high CDOM conditions, representing typical bloom development conditions in gulfs, the position of the Rrs maximum shifts toward longer wavelengths, occurring near 640–650 nm.
A comparison between spectra obtained for the lowest and highest Chl-a concentrations indicates that a 40-fold increase in Chl-a results in a 1.5-fold increase in Rrs at the shortest wavelengths (~400 nm), a 4.5-fold increase in the vicinity of the spectral maximum (570–580 nm), and approximately a 6.5-fold increase at the longest wavelengths near 700 nm.
3.3. Influence of CDOM on Rrs Spectra
In the last step, the influence of CDOM was analyzed under four representative scenarios:
- Low PIM and low Chl-a concentrations (Figure 6a), representing typical open Baltic waters without an active phytoplankton bloom;
- High PIM and low Chl-a concentrations (Figure 6b), representing gulf waters in the Baltic Sea without an active phytoplankton bloom;
- Low PIM and high Chl-a concentrations (Figure 6c), representing open Baltic waters during a phytoplankton bloom;
- High PIM and high Chl-a concentrations (Figure 6d) representing gulf waters with an active phytoplankton bloom.
In all scenarios, the highest Rrs values occurred at the lowest CDOM content, corresponding to an absorption coefficient aCDOM(440) = 0.5 m−1, whereas the lowest Rrs values were observed at the highest CDOM absorption (aCDOM(440) = 15 m−1). A comparison across the four scenarios indicates that the largest absolute Rrs values are associated with low PIM concentrations combined with high Chl-a levels, as illustrated in Figure 6c. For low CDOM concentrations, the Rrs spectrum exhibits a single dominant maximum at approximately 570–580 nm. As CDOM concentration increases, this maximum progressively decreases in magnitude and shifts toward longer wavelengths. Simultaneously, additional maxima emerge in the red spectral region (650–680 nm) and become dominant across the spectrum at the highest CDOM levels.
The presence of mineral particles can either increase or decrease Rrs values, depending on the Chl-a and CDOM concentrations. Under conditions of low Chl-a and low CDOM, high PIM concentrations reduce the absolute Rrs values; however, this effect reverses at aCDOM ≥ 1 m−1, where higher PIM concentrations lead to increased Rrs compared to low-PIM conditions. In contrast, under high Chl-a conditions, the Rrs-damping effect of PIM persists up to aCDOM ≤ 3 m−1, indicating that the backscattering contribution of mineral particles becomes apparent only at higher CDOM levels. In the following subsection, we discuss the obtained modeling results in the context of recent Baltic Sea research.
4. Discussion
4.1. Variability of Blue-to-Green Rrs Ratios in Relation to Chl-a, CDOM, and PIM Concentrations in the Baltic Sea: Overview Based on Global Variability 25 Simulated Spectra
Many bio-optical models are based on correlations between blue-to-green remote sensing reflectance ratios and Chl-a concentration. The most commonly applied ratios are Rrs(443)/Rrs(560) and Rrs(490)/Rrs(560) [16,42,43]. In this study, we analyzed the same band ratios calculated from HydroLight modeling results (with input parameters shown in Figure 2 and summarized results presented in Figure 3) to demonstrate the potential range of influence of three optically significant components in the Baltic Sea: chlorophyll-bearing particles (phytoplankton), colored dissolved organic matter (CDOM), and mineral particles. In Case 1 waters, these ratios are primarily used to retrieve Chl-a concentration [44], whereas in optically complex Case 2 waters, they act as indicators of the combined concentrations of light-absorbing and light-scattering constituents [45,46]. In general, lower ratio values correspond to higher concentrations of optically significant seawater components.
The Rrs(443)/Rrs(560) ratio is sensitive to both Chl-a and CDOM concentrations; however, in CDOM-rich waters, the influence of CDOM absorption, together with enhanced mineral backscattering, can dominate the signal. Consequently, in Baltic Sea bio-optical algorithms, this ratio is most often used to characterize CDOM concentration [9] or to separate CDOM and phytoplankton contributions [47]. By contrast, the Rrs(490)/Rrs(560) ratio is less sensitive to CDOM absorption while remaining highly responsive to Chl-a concentration, which makes it more suitable for application in turbid waters [26,48].
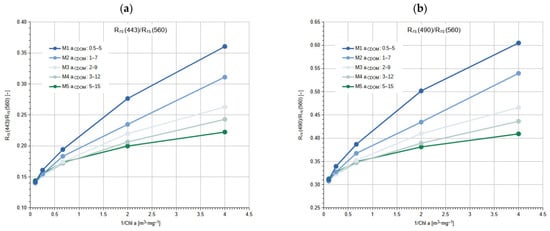
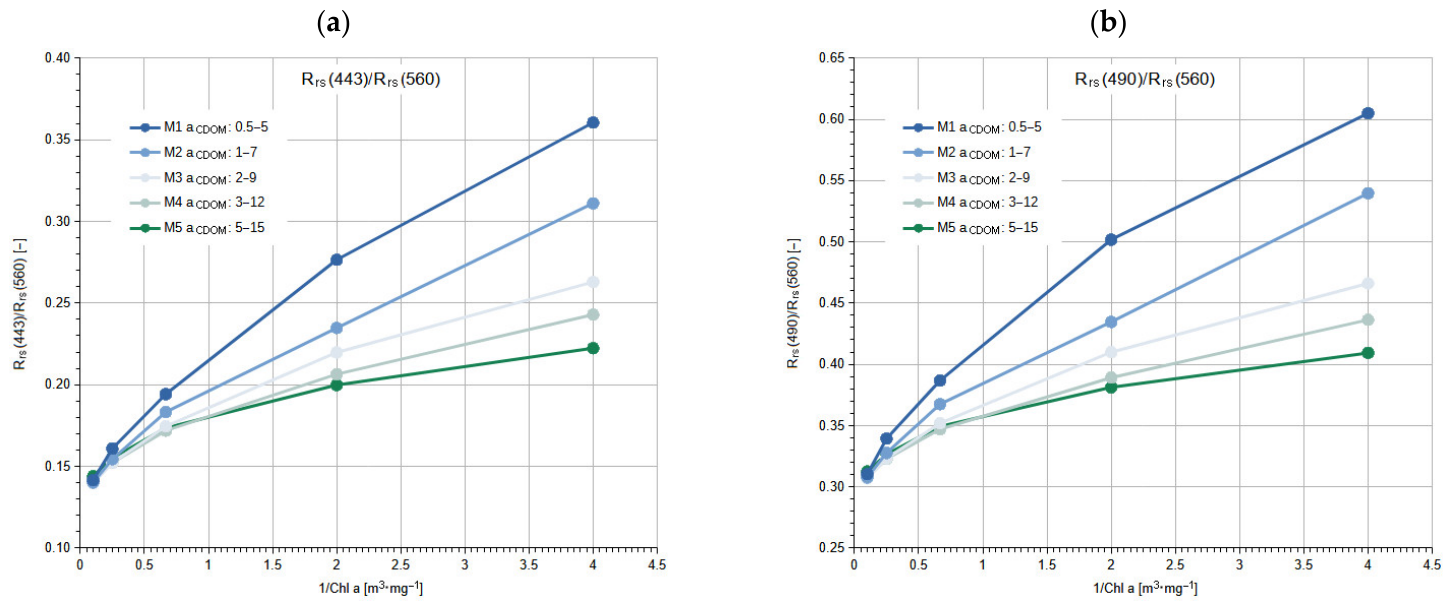
Because the relationship between blue-to-green Rrs ratios and Chl-a concentration exhibits a hyperbolic-like shape, the correlations are presented in Figure 7 as functions of the inverse chlorophyll concentration. The ratio Rrs(443)/Rrs(560) illustrated in Figure 7a starts from a common value of approximately 0.14 at the highest Chl-a concentration of 10 mg·m−3 under conditions of relatively high CDOM and variable PIM concentrations, which is consistent with typical eutrophic optical conditions (e.g., [49,50,51]). Regardless of the variability in PIM and aCDOM, the Rrs(443)/Rrs(560) ratio in this case remains within a narrow range of 0.140–0.143. With decreasing Chl-a concentration, the blue-to-green Rrs ratio increases, reaching a maximum value of 0.360 for waters characterized by the lowest concentrations of Chl-a, CDOM, and PIM. High Chl-a combined with high CDOM concentrations dominates the value of this ratio, while the influence of mineral particles is negligible, which is typical for optically complex waters [52].
Figure 7.
Blue-to-green Rrs ratios plotted against the inverse of Chl-a concentration: (a) Rrs(443)/Rrs(560) and (b) Rrs(490)/Rrs(560).
The Rrs(490)/Rrs(560) ratio exhibits a similar relationship (Figure 7b). At the highest Chl-a concentration, the ratio is approximately 0.310, varying only slightly between 0.307 and 0.312. As Chl-a concentration decreases, the ratio increases, reaching a maximum value of 0.605 for waters with the lowest CDOM and PIM concentrations; again, PIM has a negligible effect on this ratio. The values of Rrs(490)/Rrs(560) are approximately 50% higher than those of Rrs(443)/Rrs(560), which makes the former more suitable for ocean color retrievals, as previously concluded by Darecki and Stramski [53] and Kowalczuk et al. [30]. Moreover, Woźniak and Meller [54] also emphasize the need for “locally calibrated” bio-optical algorithms in the Baltic Sea, based on a set of HydroLight simulations. They demonstrate the applicability of the ratio of Rrs(490)/Rrs(625) to retrieve the total SPM concentration.
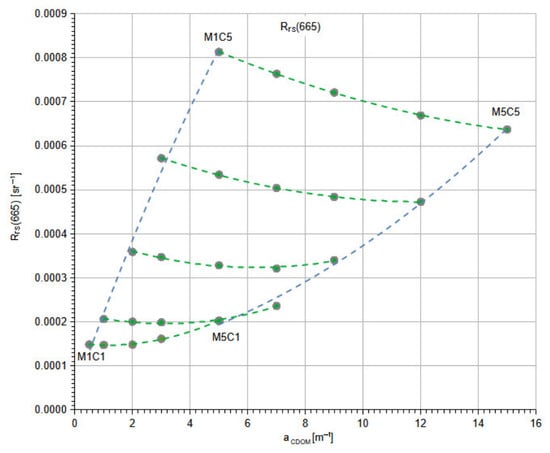
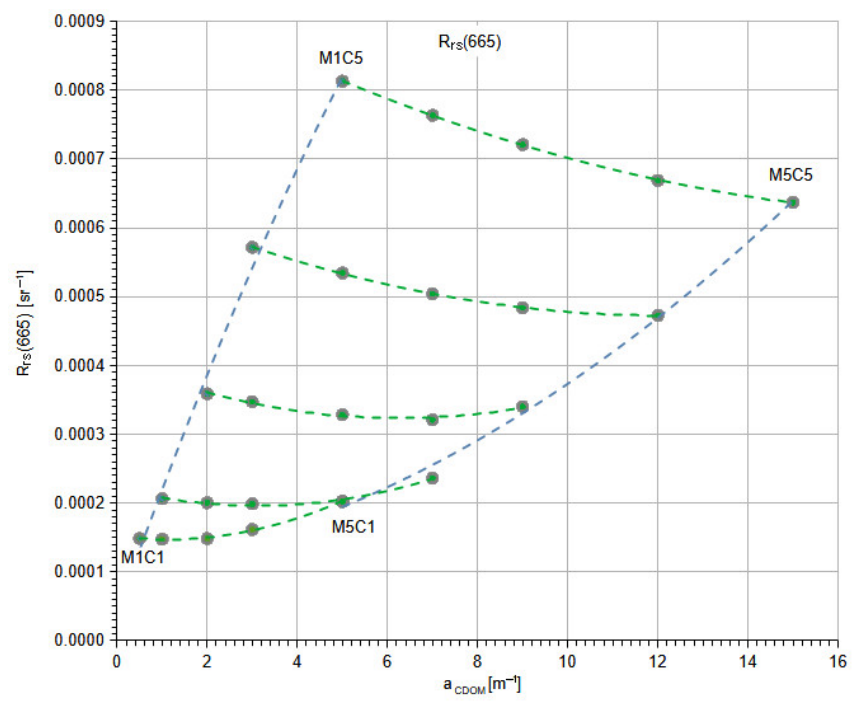
Due to the overlapping effects of phytoplankton and CDOM absorption in the blue spectral bands, a single Rrs ratio is rarely used alone in bio-optical algorithms for turbid waters. Instead, it is commonly combined with absolute Rrs values in the red or near-infrared (NIR) spectral regions, their ratios, or normalized differences [54,55,56]. Accordingly, Figure 8 illustrates the range of Rrs(665) values obtained for all 25 combinations of Chl-a, CDOM, and PIM concentrations representative of typical Baltic Sea scenarios. The highest Rrs(665) values are associated with high Chl-a and low PIM concentrations. The contribution of CDOM to Rrs(665) is explicitly visualized along the x-axis. Identical Chl-a concentrations are connected by green dashed lines, while extreme values of the same mineral particle concentrations are connected by blue dashed lines. An increase in CDOM concentration leads to an increase in Rrs(665) only at low Chl-a levels (C1–C2, corresponding to 0.25–0.5 mg·m−3). A similar pattern is observed for mineral particles, which increase absolute Rrs(665) values only at comparably low Chl-a concentrations. At higher Chl-a concentrations, Rrs(665) decreases with increasing CDOM and PIM. Overall, Chl-a exerts a much stronger effect on Rrs(665) than either CDOM or mineral particles. Rrs(665) increases significantly with Chl-a concentration, from approximately 0.00015–0.00020 sr−1 at 0.25 mg·m−3 to 0.00064–0.00081 sr−1 at 10 mg·m−3, representing more than a five-fold increase in reflectance associated with a forty-fold increase in Chl-a concentration.
Figure 8.
Remote sensing reflectance at 665 nm plotted against the CDOM absorption coefficient at 440 nm for 25 combinations of Chl-a, CDOM, and PIM concentrations representing typical Baltic Sea conditions. Green dashed lines connect points with fixed Chl-a concentrations (C1, …, C5) and varying PIM concentrations (M1–M5), while blue dashed lines connect the two extreme scenarios of fixed PIM concentrations (M1 and M5) and varying Chl-a concentrations (C1–C5).
Moreover, Rrs in the red and NIR spectral bands are closely related to turbidity. Dogliotti et al. [57] applied Rrs(645) and Rrs(859) in a semi-empirical, single-band algorithm and demonstrated that this approach is largely insensitive to variations in particle type, size, and composition. The use of the red band around 665 nm is particularly recommended for waters with low to moderate turbidity (approximately 1–10 NTU). Typical turbidity values in the Baltic Sea range from approximately 0.2–1 NTU in offshore waters to 1–5 NTU in most coastal areas and 5–20 NTU in estuaries [55,58,59]. Despite generally lower turbidity compared to sediment-dominated estuaries, Baltic Sea waters are optically complex due to strong CDOM absorption. Consequently, turbidity retrievals in this region rely primarily on red and NIR reflectance, including bands centered near 665 nm [57,60,61]. In this context, our results demonstrate that Rrs(665), and by extension turbidity, in the Baltic Sea is strongly influenced by scattering from both chlorophyll-bearing particles and mineral particles. At Chl-a concentrations below 1.5 mg·m−3, Rrs(665) increases exponentially with increasing PIM concentration by approximately 10–33%, whereas above this chlorophyll threshold, Rrs(665) decreases with increasing PIM by approximately 21–26%.
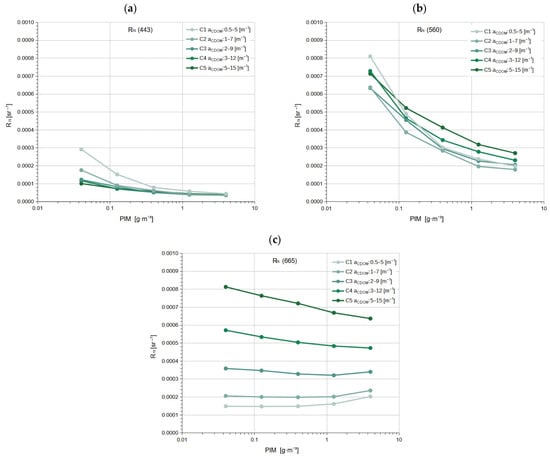
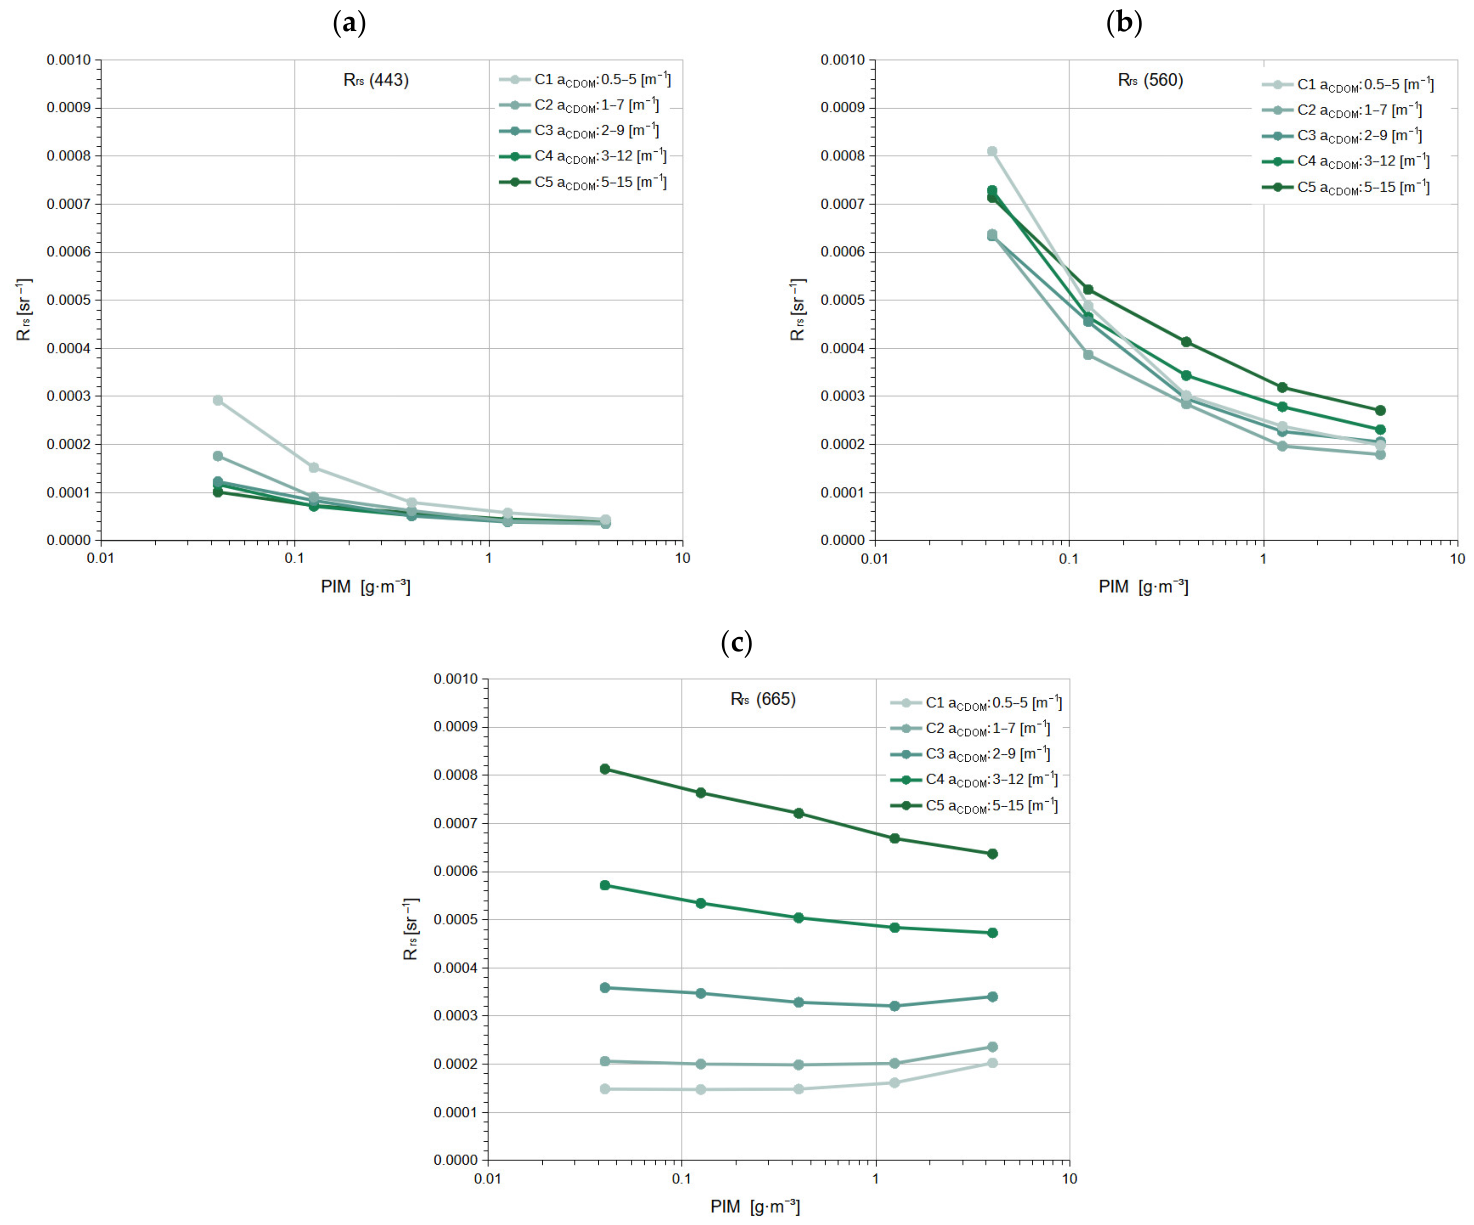
To isolate the contribution of mineral particles to individual Rrs spectral bands, Figure 9 presents the results for three wavelengths: (a) 443 nm, (b) 560 nm, and (c) 665 nm. The Rrs values are derived from the set of 25 HydroLight simulations shown in Figure 3 and are plotted as a function of PIM concentration. In all graphs, the results are displayed as five series distinguished by brightness, with the lightest color representing the lowest Chl-a concentration of 0.25 mg m−3 (the first column in Figure 2) and the darkest color corresponding to the highest Chl-a concentration of 10 mg m−3 (the last column in Figure 2). All three plots share the same vertical-axis scale to facilitate direct comparison.
Figure 9.
Remote sensing reflectance for spectral bands: (a) 443 nm, (b) 560 nm, and (c) 665 nm, plotted with PIM concentration.
Figure 9a demonstrates that at 443 nm, all Rrs values decrease with increasing PIM concentration. The highest Rrs(443) values occur in waters characterized by the lowest PIM and the lowest Chl-a concentration, represented by the lightest-colored series. As PIM concentration increases, the influence of Chl-a concentration diminishes, and Rrs(443) values converge toward similar levels across all series.
In Figure 9b, showing Rrs(560), all reflectance values are higher than those observed at 443 nm. Rrs(560) decreases markedly with increasing PIM concentration, by up to a factor of four for the C1 series representing the lowest Chl-a concentration. At the same time, a consistent ordering of Rrs(560) values by Chl-a concentration cannot be identified across the full PIM range. At low PIM concentrations, the highest Rrs(560) values are associated with the C1 series, whereas at high PIM concentrations, the highest Rrs(560) values occur for the C5 series, corresponding to the highest Chl-a concentration.
Figure 9c, which presents Rrs(665), reveals a distinctly different ordering of the series compared to the blue and green bands. For the highest Chl-a concentration (darkest lines and symbols), Rrs(665) reaches the largest values and decreases monotonically with increasing PIM concentration. In contrast, for the lowest Chl-a concentration, Rrs(665) values are substantially lower, by a factor of approximately three to five, and remain nearly constant over the PIM range from 0.04 to 0.4 g·m−3. At higher PIM concentrations, Rrs(665) increases for these low-Chl-a conditions. Similarly, Nechad et al. [62] concluded that the concentration of total suspended matter can be retrieved from Rrs at 665–750 nm with similar accuracy up to 30%, depending on the satellite sensor; this accuracy can be improved by using multi-band algorithms.
4.2. Scaled Spectral Sensitivity of Rrs to Optically Significant Constituents Under Baltic Sea Conditions
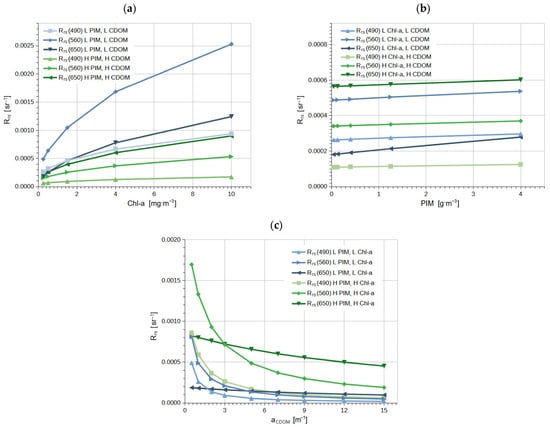
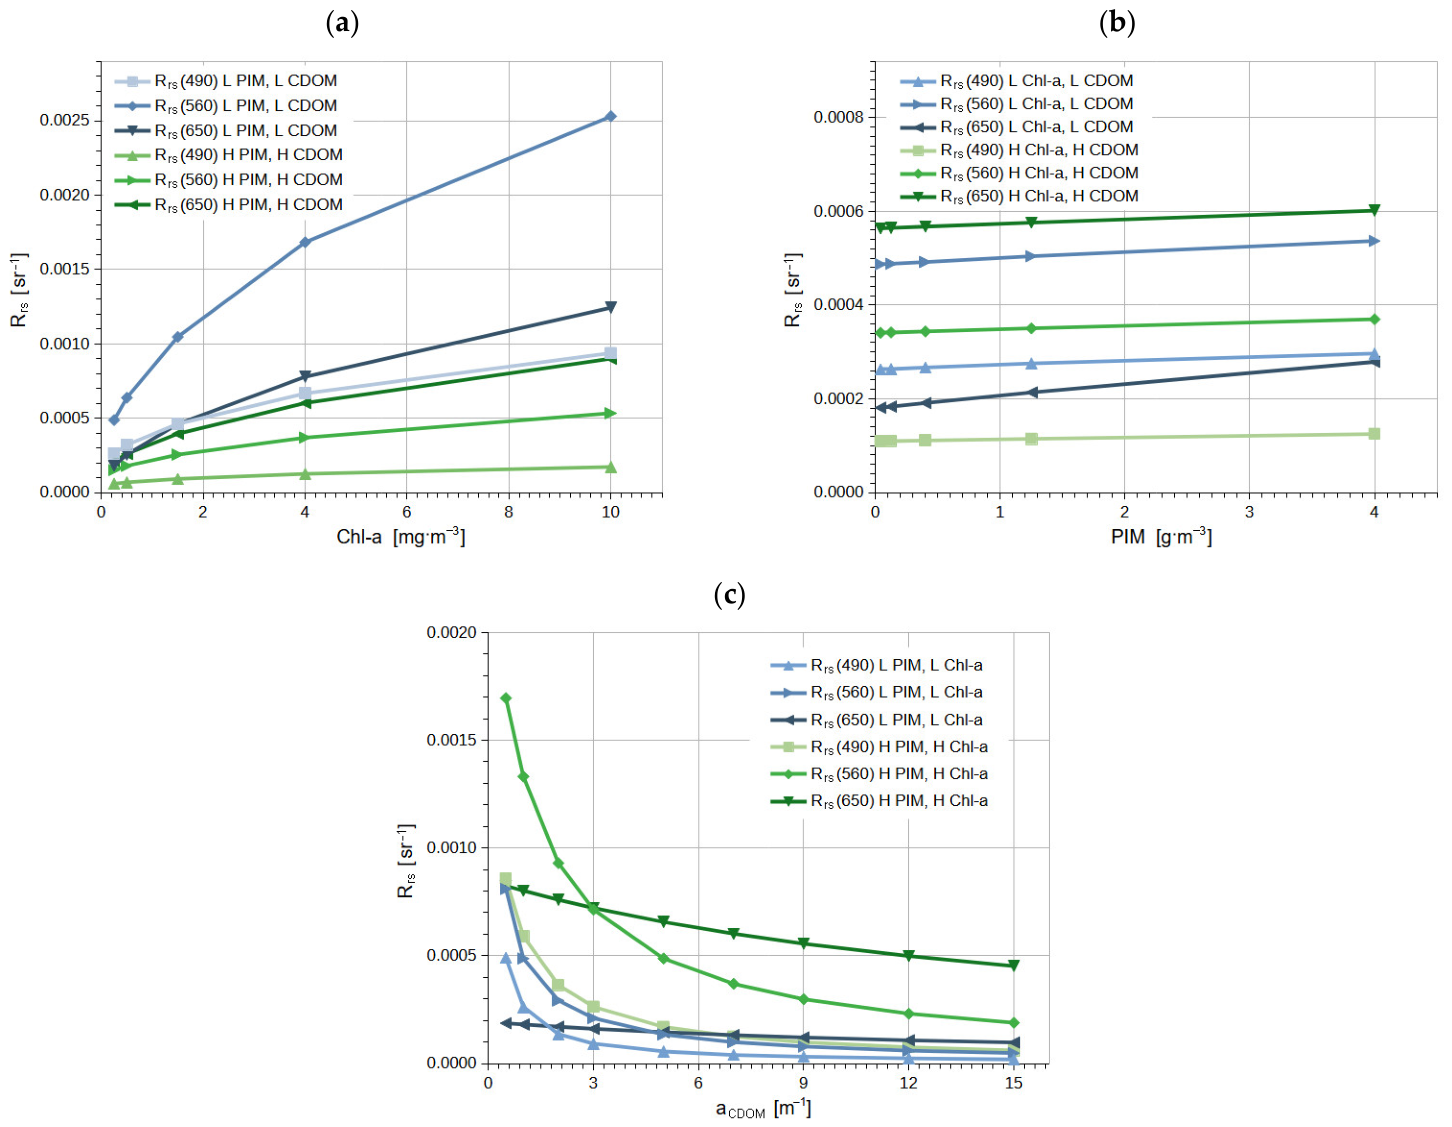
Finally, based on the extended local modeling series presented in Table 2, our results are synthesized in Figure 10. This figure summarizes the ranges of absolute Rrs values obtained for different combinations of three optically significant components in Baltic Sea waters. The ranges correspond to representative, typical (rather than extreme) low (L) and high (H) levels of the following constituents: chlorophyll-a (Chl-a; L = 0.25 mg·m−3, H = 4 mg·m−3), colored dissolved organic matter (CDOM; L corresponding to aCDOM = 1 m−1 and H to aCDOM = 7 m−1), and particulate inorganic matter (PIM; L = 0.04 mg·m−3, H = 4 mg·m−3).
Figure 10.
Summarized typical ranges of absolute Rrs values in three spectral bands (490 nm, 560 nm, and 650 nm) obtained for different combinations of Chl-a, PIM, and CDOM concentrations. Graphs show Rrs variability with increasing (a) Chl-a, (b) PIM, and (c) CDOM under low remaining parameters (blue lines) or high remaining parameters (green lines), with the following low (L) and high (H) levels: Chl-a: L = 0.25 mg·m−3, H = 4 mg·m−3; CDOM: L corresponding to aCDOM = 1 m−1 and H to aCDOM = 7 m−1, and PIM: L = 0.04 mg·m−3, H = 4 mg·m−3.
We compared Rrs at three spectral bands that are most characteristic of remote sensing of optically complex waters: 490 nm (blue band), 560 nm (green band), and 650 nm (red band). With increasing Chl-a concentration (Figure 10a), Rrs also increases, but at different rates. The most rapid increase occurs in the green band under low CDOM and PIM levels, whereas the slowest increase is observed in the blue band under high CDOM and PIM conditions. Notably, the lowest Rrs(490) values obtained under low remaining parameters are comparable to the highest Rrs(650) values obtained under high levels of those parameters. Figure 10b illustrates the range of the PIM effect on Rrs in different spectral bands under low and high levels of the remaining parameters. The most pronounced increase in Rrs is observed in the red band under low Chl-a and low CDOM conditions. In contrast, Rrs(490) remains nearly constant under high Chl-a and high CDOM conditions. These results are consistent with Kratzer and Moore [26], who compared the typical Baltic optical properties to other seas and oceans, suggesting that the red/green Rrs ratio could be a better alternative to improve the quantitative retrieval of Chl-a from CDOM-dominated waters.
Whereas increasing concentrations of Chl-a and PIM lead to higher Rrs values across the visible spectrum, the effect of CDOM, illustrated in Figure 10c, is opposite: increasing CDOM concentrations reduce remote sensing reflectance. Rrs in the blue and green bands decrease at similar, approximately exponential rates with increasing CDOM under both low and high levels of the remaining parameters. The absolute values of Rrs(490) under high PIM and high Chl-a conditions are comparable to those of Rrs(560) under low PIM and low Chl-a conditions. In the red band, the effect of CDOM becomes nearly linear.
To complement the analysis presented above, the results were further interpreted in terms of the spectral response SRF(λ), defined in Section 2.3 (Equation (8)). This formulation enables direct comparison of the influence of CDOM, phytoplankton, and mineral particles across the visible spectrum for all scenarios shown in Figure 4, Figure 5 and Figure 6.
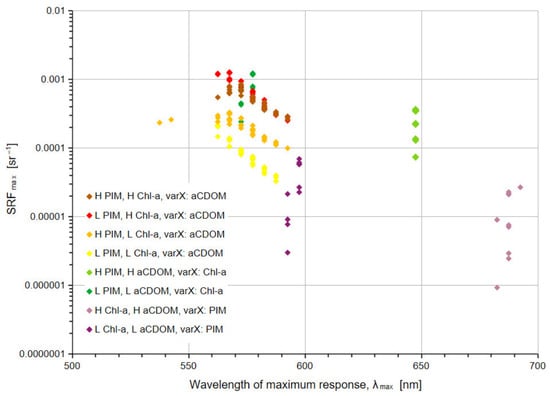
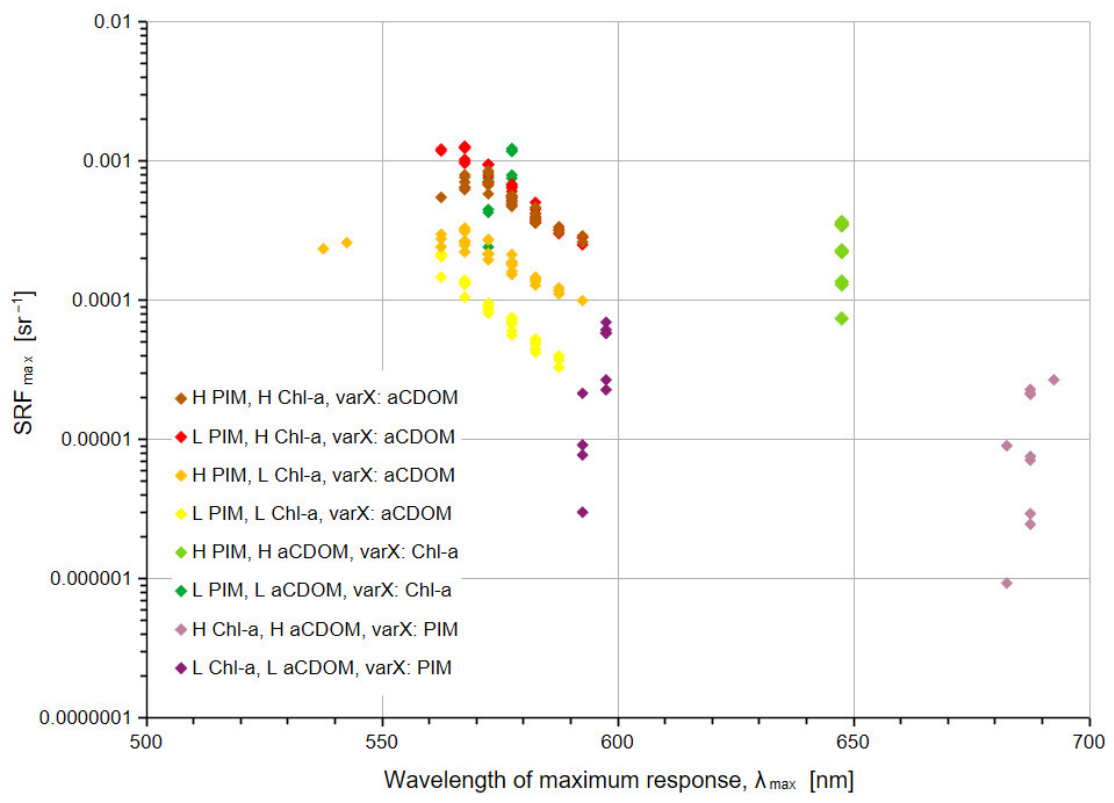
Analysis of the spectral distribution of SRF(λ), together with its maxima and corresponding wavelengths λmax, allows identification of spectral regions where Rrs is most responsive to each constituent under representative Baltic Sea conditions. Distinct patterns emerge for each component, reflecting the different roles of absorption and scattering processes (Figure 11). The figure presents only the maximum values of and their associated wavelengths, although full spectra were evaluated for all considered variations in the input parameter X.
Figure 11.
Maximum of the spectral response function, for variables X (CDOM absorption, Chl-a concentration, and particulate inorganic matter—PIM), plotted against the wavelengths (λmax) at which these maxima occur. Each point represents the maximum SRF value identified from the full spectral response.
The horizontal axis of the figure represents the central wavelengths of the spectral bands. It can be observed that the highest values of , occur when CDOM absorption is the varying parameter, particularly under conditions of low PIM concentration (0.04 g m−3) and high Chl-a concentration (4 mg m−3). Under these conditions, , reaches its maximum in the central part of the spectrum, corresponding to the spectral bands at approximately 560–570 nm, and is associated with variations at the lowest CDOM absorption level (aCDOM = 0.5 m−1).
Similarly high spectral responses are observed for variability in Chl-a concentration under conditions of low aCDOM and low PIM concentrations (green points in Figure 11). In this case, the maximum occurs at slightly longer wavelengths, around the 575–580 nm spectral band. The highest values are observed for the largest Chl-a concentrations (4–10 mg m−3).
The majority of values occur within the spectral range of approximately 560–600 nm. Variations in CDOM absorption lead to maxima distributed over a relatively broad spectral range. In contrast, variability in Chl-a and PIM exhibits a more constrained behavior: depending on the values of the remaining parameters, the maxima occupy one, two, or three adjacent spectral bands.
For example, variability in Chl-a under conditions of high CDOM absorption and high PIM concentration results in maximum spectral responses confined to a single spectral band at 645–650 nm. The lowest values of are observed for variability in PIM concentration. Under conditions of low Chl-a and low CDOM absorption, ranges from 3 × 10⁻⁶ to 7 × 10⁻⁵, with maxima spanning two spectral bands between 590 and 600 nm. Even lower values of are obtained for PIM variability under conditions of high CDOM absorption and high Chl-a concentration. In this case, ranges from 9 × 10⁻⁷ to 3 × 10⁻⁵, and the maxima extend across three spectral bands between 680 and 695 nm.
The spectral patterns obtained in this study are generally consistent with previous observations showing that CDOM is the dominant absorber in Baltic Sea waters and strongly affects the blue part of the Rrs spectrum, whereas chlorophyll-a exerts the strongest control over reflectance in the red and red-edge regions (e.g., Darecki and Stramski [53], Kowalczuk et al. [30], Kratzer and Moore [26]). However, most previous studies were focused on empirical relationships between selected band ratios and individual water constituents, while the present work quantifies the relative spectral response of Rrs to simultaneous changes in CDOM, phytoplankton, and mineral particles across a broad range of realistic Baltic Sea conditions.
A key difference from earlier studies is that the proposed spectral response function (SRF) allows the magnitude of constituent-specific effects to be compared directly on a common scale. The results demonstrate that CDOM dominates spectral variability below approximately 550 nm, whereas chlorophyll-a becomes the principal driver of variability in the red spectral region. In contrast, mineral particles have a secondary but non-negligible influence that depends strongly on the optical background conditions. This finding extends previous Baltic Sea studies, which often treated suspended particles mainly as a source of additional scattering, by showing that their contribution becomes significant only under specific combinations of CDOM and phytoplankton concentrations.
The comparison with previous research, therefore, provides a new understanding of the spectral partitioning of constituent effects in optically complex Case 2 waters. Rather than identifying only spectral bands correlated with a given parameter, the SRF framework reveals where and under which environmental conditions each constituent dominates the reflectance signal. This information may support the development of more robust regional bio-optical algorithms and improve constituent retrieval in waters where strong CDOM absorption and variable particle loads limit the performance of conventional band-ratio approaches.
5. Conclusions
The spectral shape and magnitude of Rrs in the Baltic Sea are controlled by the combined and interdependent effects of the three optically dominant constituents: CDOM, phytoplankton, and mineral particles. Among these components, Chl-a plays the dominant role in scaling the overall magnitude of the Rrs spectrum. In contrast, CDOM is primarily responsible for reducing Rrs, particularly in the blue and green spectral regions, and for shifting the reflectance maximum toward longer wavelengths. Mineral particles generally increase absolute Rrs values through enhanced backscattering; however, their contribution remains secondary and becomes significant mainly under low-absorption conditions.
The present study quantifies the expected range and direction of Rrs variability across a broad spectrum of constituent concentrations representative of typical Baltic Sea conditions. The results demonstrate that the influence of individual components cannot be considered independently, as their optical effects are strongly modulated by the concentrations of the remaining constituents. A forty-fold increase in Chl-a corresponds to more than a five-fold increase in Rrs, whereas a thirty-fold increase in CDOM absorption induces a seven- to sixteen-fold reduction in reflectance, depending on background conditions. In contrast, even a hundred-fold increase in PIM produces only a limited response, with Rrs increasing by up to 1.5 times in the red band. The backscattering contribution of particulate inorganic matter becomes apparent only when CDOM absorption is sufficiently low, whereas high CDOM concentrations suppress the influence of scattering particles and dominate the spectral response.
The analysis of the spectral response function can improve the understanding of how optically significant constituents shape the Rrs spectrum in the conditions of low and high concentrations of other components in coastal waters. The identified wavelengths of maximum spectral response may provide guidance for the selection of spectral bands used in future satellite retrieval algorithms for chlorophyll-a, CDOM, and suspended particles in Baltic Sea waters, and they may support the development of regionally optimized bio-optical models for optically complex environments. In particular, the results highlight the importance of accounting for strong CDOM absorption and constituent interactions when retrieving Chl-a and suspended particle properties in the Baltic Sea and similar optically complex environments. We recommend conducting Rrs spectral response analyses over large locally measured and modeled data sets in order to advance the algorithm-based retrieval of individual seawater component concentrations.
Author Contributions
Conceptualization, H.T.; methodology, H.T.; validation, H.T., K.H. and W.F.; formal analysis, H.T. and K.H.; investigation, H.T. and K.H.; resources, W.F.; data curation, H.T.; writing—original draft preparation, H.T.; writing—review and editing, K.H.; visualization, H.T. and W.F. All authors have read and agreed to the published version of the manuscript.
Funding
This research was funded by the Doctoral Studies Fund of the Gdynia Maritime University, the National Science Centre, Poland (grant number 2023/49/B/ST10/02193), as well as internal funds from the Gdynia Maritime University individual project number WM/2026/PI/09.
Data Availability Statement
Model input and output data can be obtained from the authors upon request.
Conflicts of Interest
The authors declare no conflicts of interest. The funders had no role in the design of the study; in the collection, analyses, or interpretation of data; in the writing of the manuscript; or in the decision to publish the results.
Abbreviations
The following abbreviations are used in this manuscript:
| IOPs | Inherent Optical Properties |
| AOPs | Apparent Optical Properties |
| Chl-a | Chlorophyll-a |
| CDOM | Colored Dissolved Organic Matter |
| PIM | Particulate Inorganic Matter |
| RTE | Radiative Transfer Equation |
| SPM | Suspended Particulate Matter |
| SRF | Spectral Response Function |
References
- Heckwolf, M.J.; Peterson, A.; Jänes, H.; Horne, P.; Künne, J.; Liversage, K.; Sajeva, M.; Reusch, T.B.H.; Kotta, J. From ecosystems to socio-economic benefits: A systematic review of coastal ecosystem services in the Baltic Sea. Sci. Total Environ. 2021, 755, 142565. [Google Scholar] [CrossRef] [Scilit] [PubMed]
- Jernberg, S.; Kuosa, H.; Boström, C.; Burdon, D.; Haavisto, F.; Heiskanen, A.-S.; Kiviluoto, S.; Kuningas, S.; Kunnasranta, M.; Uusitalo, L.; et al. Linking natural capital stocks with ecosystem services in the Northern Baltic Sea. Ecosyst. Serv. 2024, 65, 101585. [Google Scholar] [CrossRef] [Scilit]
- HELCOM. HELCOM Annual Report 2025. Baltic Sea Environment Proceedings 2026; No. 209; HELCOM: Helsinki, Finland, 2026. [Google Scholar]
- Stramska, M.; Jakacki, J. Variability of chlorophyll a concentration in surface waters of the open Baltic Sea. Oceanologia 2024, 66, 365–380. [Google Scholar] [CrossRef] [Scilit]
- Ahtiainen, H.; Artell, J.; Czajkowski, M.; Hasler, B.; Hasselström, L.; Huhtala, A.; Meyerhoff, J.; Smart, J.C.R.; Söderqvist, T.; Alemu, M.H.; et al. Benefits of meeting nutrient reduction targets for the Baltic Sea—A contingent valuation study in the nine coastal states. J. Environ. Econ. Policy 2014, 3, 278–305. [Google Scholar] [CrossRef] [Scilit]
- Andersen, J.H.; Axe, P.; Backer, H.; Carstensen, J.; Claussen, U.; Fleming-Lehtinen, V.; Järvinen, M.; Kaartokallio, H.; Knuuttila, S.; Korpinen, S.; et al. Getting the measure of eutrophication in the Baltic Sea: Towards improved assessment principles and methods. Biogeochemistry 2011, 106, 137–156. [Google Scholar] [CrossRef] [Scilit]
- Hieronymi, M.; Behr, D.; Bi, S.; Röttgers, R. Optical complexity of North Sea, Baltic Sea, and adjacent coastal and inland waters derived from Sentinel-3 OLCI satellite data. Earth Syst. Sci. Data 2026, 18, 1307–1329. [Google Scholar] [CrossRef] [Scilit]
- O’Kane, S.; McCarthy, T.; Fealy, R.; Kratzer, S.A. Validation of OLCI Sentinel-3 Water Products in the Baltic Sea and an Evaluation of the Effect of System Vicarious Calibration (SVC) on the Level-2 Water Products. Remote Sens. 2024, 16, 3932. [Google Scholar] [CrossRef] [Scilit]
- González Vilas, L.; Brando, V.E.; Di Cicco, A.; Colella, S.; D’Alimonte, D.; Kajiyama, T.; Attila, J.; Schroeder, T. Assessment of ocean color atmospheric correction methods and development of a regional ocean color operational dataset for the Baltic Sea based on Sentinel-3 OLCI. Front. Mar. Sci. 2024, 10, 1256990. [Google Scholar] [CrossRef] [Scilit]
- Mobley, C.D. (Ed.) The Oceanic Optics Book; International Ocean Colour Coordinating Group (IOCCG): Dartmouth, NS, Canada, 2022; 924p. [Google Scholar] [CrossRef]
- Dutkiewicz, S. (Ed.) Synergy Between Ocean Colour and Biogeochemical/Ecosystem Models; Report Series 19; International Ocean Colour Coordinating Group (IOCCG): Dartmouth, NS, Canada, 2020. [Google Scholar]
- Groom, S.; Sathyendranath, S.; Ban, Y.; Bernard, S.; Brewin, R.; Brotas, V.; Brockmann, C.; Chauhan, P.; Choi, J.K.; Chuprin, A.; et al. Satellite Ocean Colour: Current Status and Future Perspective. Front. Mar. Sci. 2019, 29, 485. [Google Scholar] [CrossRef] [Scilit] [PubMed]
- Lednicka, B.; Kubacka, M.; Freda, W.; Haule, K.; Ficek, D.; Sokólski, M. Multi-Parameter Algorithms of Remote Sensing Reflectance, Absorption and Backscattering for Coastal Waters of the Southern Baltic Sea Applied to Pomeranian Lakes. Water 2023, 15, 2843. [Google Scholar] [CrossRef] [Scilit]
- Soomets, T.; Toming, K.; Paavel, B.; Kutser, T. Evaluation of remote sensing and modeled chlorophyll-a products of the Baltic Sea. J. Appl. Remote Sens. 2022, 16, 046516. [Google Scholar] [CrossRef] [Scilit]
- Ostrowska, M.; Ficek, D.; Stoltmann, D.; Stoń-Egiert, J.; Zdun, A.; Kowalewski, M.; Zapadka, T.; Majchrowski, R.; Pawlik, M.; Dera, J. Ten years of remote sensing and analyses of the Baltic Sea primary production (2010–2019). Remote Sens. Appl. Soc. Environ. 2022, 26, 100715. [Google Scholar] [CrossRef] [Scilit]
- Lee, Z.-P. (Ed.) Remote Sensing of Inherent Optical Properties: Fundamentals, Tests of Algorithms, and Applications; Report Number 5; International Ocean Colour Coordinating Group (IOCCG): Dartmouth, NS, Canada, 2006; 126p. [Google Scholar]
- Ligi, M.; Kutser, T.; Kallio, K.; Attila, J.; Koponen, S.; Paavel, B.; Soomets, T.; Reinart, A. Testing the performance of empirical remote sensing algorithms in the Baltic Sea waters with modelled and in situ reflectance data. Oceanologia 2017, 59, 57–68. [Google Scholar] [CrossRef] [Scilit]
- Gordon, H.R. Remote sensing of ocean color: A methodology for dealing with broad spectral bands and significant out-of-band response. Appl. Opt. 1995, 34, 8363–8374. [Google Scholar] [CrossRef] [Scilit] [PubMed]
- Melin, F.; Sclep, G. Band shifting for ocean color multi-spectral reflectance data. Opt. Express 2015, 23, 2262–2279. [Google Scholar] [CrossRef] [Scilit] [PubMed]
- Salem, S.; Higa, H.; Ishizaka, J.; Pahlevan, N.; Oki, K. Spectral band-shifting of multispectral remote-sensing reflectance products: Insights for matchup and cross-mission consistency assessments. Remote Sens. Environ. 2023, 299, 113846. [Google Scholar] [CrossRef] [Scilit]
- Pahlevan, N.; Smith, B.; Binding, C.; O’Donnell, D.M. Spectral band adjustments for remote sensing reflectance spectra in coastal/inland waters. Opt. Express 2017, 25, 28650–28667. [Google Scholar] [CrossRef] [Scilit]
- HELCOM. Effectiveness of Measures to Reduce Nutrient Inputs—Importance of Point Sources; Baltic Sea Environment Proceedings 203; HELCOM: Helsinki, Finland, 2025; Available online: https://helcom.fi/wp-content/uploads/2025/05/Effectiveness_of_measures_to_reduce_nutrient_inputs-1.pdf (accessed on 20 January 2026).
- Jakobsson, M.; Stranne, C.; O’Regan, M.; Greenwood, S.L.; Gustafsson, B.; Humborg, C.; Weidner, E. Bathymetric properties of the Baltic Sea. Ocean Sci. 2019, 15, 905–924. [Google Scholar] [CrossRef] [Scilit]
- System Satbałtyk. Available online: https://www.satbaltyk.pl/ (accessed on 20 January 2026).
- Kaczmarek, S.; Woźniak, B. The application of the optical classification of waters in the Baltic Sea [Case 2 Waters]. Oceanologia 1995, 37, 285–297. [Google Scholar]
- Kratzer, S.; Moore, G. Inherent Optical Properties of the Baltic Sea in Comparison to Other Seas and Oceans. Remote Sens. 2018, 10, 418. [Google Scholar] [CrossRef] [Scilit]
- Andersen, J.H.; Carstensen, J.; Conley, D.J.; Dromph, K.; Fleming-Lehtinen, V.; Gustafsson, B.G.; Josefson, A.B.; Norkko, A.; Villnäs, A.; Murray, C. Long-term temporal and spatial trends in eutrophication status of the Baltic Sea. Biol. Rev. 2017, 92, 135–149. [Google Scholar] [CrossRef] [Scilit] [PubMed]
- HELCOM. Chlorophyll-a, HELCOM Core Indicator Report. 2023. Available online: https://indicators.helcom.fi/indicator/chlorophyll/ (accessed on 20 January 2026).
- Woźniak, S.B.; Meler, J.; Lednicka, B.; Zdun, A.; Stoń-Egiert, J. Inherent optical properties of suspended particulate matter in the southern Baltic Sea. Oceanologia 2011, 53, 691–729. [Google Scholar] [CrossRef] [Scilit]
- Kowalczuk, P.; Olszewski, J.; Darecki, M.; Kaczmarek, S. Empirical relationships between Coloured Dissolved Organic Matter (CDOM) absorption and apparent optical properties in Baltic Sea waters. Int. J. Remote Sens. 2005, 26, 345–370. [Google Scholar] [CrossRef] [Scilit]
- Röttgers, R.; McKee, D.; Utschig, C. Temperature and salinity correction coefficients for light absorption by water in the visible to infrared spectral region. Opt. Express 2014, 22, 25093–25108. [Google Scholar] [CrossRef] [Scilit] [PubMed]
- Zhang, X.; Hu, L.; He, M.-X. Scattering by pure seawater: Effect of salinity. Opt. Express 2009, 17, 5698–5710. [Google Scholar] [CrossRef] [Scilit] [PubMed]
- Lehmann, A.; Myrberg, K.; Post, P.; Chubarenko, I.; Dailidiene, I.; Hinrichsen, H.-H.; Hüssy, K.; Liblik, T.; Meier, H.E.M.; Lips, U.; et al. Salinity dynamics of the Baltic Sea. Earth Syst. Dynam. 2022, 13, 373–392. [Google Scholar] [CrossRef] [Scilit]
- Morrison, J.R.; Nelson, N.B. Seasonal cycle of phytoplankton UV absorption at the Bermuda Atlantic Time-series Study (BATS) site. Limnol. Oceanogr. 2004, 49, 215–224. [Google Scholar] [CrossRef] [Scilit]
- Bricaud, A.; Morel, A.; Babin, M.; Allali, K.; Claustre, H. Variations of light absorption by suspended particles with chlorophyll a concentration in oceanic (case 1) waters: Analysis and implications for bio-optical models. J. Geophys. Res. Ocean. 1998, 103, 31033–31044. [Google Scholar] [CrossRef] [Scilit]
- Morel, A.; David, A.; Gentili, B. Bidirectional reflectance of oceanic waters: Accounting for Raman emission and varying particle scattering phase function. Appl. Opt. 2022, 41, 6289–6306. [Google Scholar] [CrossRef] [Scilit] [PubMed]
- Mobley, C.D.; Sundman, L.K. HydroLight-EcoLight; Version 6.0; Technical Documentation; Numerical Optics Ltd.: Witheridge, UK, 2024. [Google Scholar]
- Woźniak, S.; Meler, J.; Stoń-Egiert, J. Inherent optical properties of suspended particulate matter in the southern Baltic Sea in relation to the concentration, composition and characteristics of the particle size distribution; new forms of multicomponent parameterizations of optical properties. J. Mar. Syst. 2022, 229, 103720. [Google Scholar] [CrossRef] [Scilit]
- Bowers, D.G.; Harker, G.E.L.; Stephan, B. Absorption spectra of inorganic particles in the Irish Sea and their relevance to remote sensing of chlorophyll. Int. J. Remote Sens. 1996, 17, 2449–2460. [Google Scholar] [CrossRef] [Scilit]
- Babin, M.; Morel, A.; Fournier-Sicre, V.; Fell, F.; Stramski, D. Light scattering properties of marine particles in coastal and open oceanwaters as related to the particle mass concentration. Limnol. Oceanogr. 2003, 48, 843–859. [Google Scholar] [CrossRef] [Scilit]
- Quan, X.; Fry, E.S. Empirical equation for the index of refraction of seawater. Appl. Opt. 1995, 34, 3477–3480. [Google Scholar] [CrossRef] [Scilit] [PubMed]
- Konik, M.; Kowalczuk, P.; Zabłocka, M.; Makarewicz, A.; Meler, J.; Zdun, A.; Darecki, M. Empirical Relationships between Remote-Sensing Reflectance and Selected Inherent Optical Properties in Nordic Sea Surface Waters for the MODIS and OLCI Ocean Colour Sensors. Remote Sens. 2020, 12, 2774. [Google Scholar] [CrossRef] [Scilit]
- O’Reilly, J.E.; Werdell, J.P. Chlorophyll algorithms for ocean color sensors-OC4, OC5 & OC6. Remote Sens. Environ. 2019, 229, 32–47. [Google Scholar] [PubMed]
- Bailey, S.W.; Werdell, P.J. A multi-sensor approach for the global measurement of ocean chlorophyll: The “Matchup” data set. Remote Sens. Environ. 2006, 102, 12–23. [Google Scholar] [CrossRef] [Scilit]
- Werdell, P.J.; McKinna, L.I.W.; Boss, E.; Tzortziou, M.; Zhang, X. An overview of approaches and challenges for retrieving marine inherent optical properties from ocean color remote sensing. Prog. Oceanogr. 2018, 160, 186–212. [Google Scholar] [CrossRef] [Scilit] [PubMed]
- Haule, K.; Freda, W.; Darecki, M.; Toczek, H. Possibilities of optical remote sensing of dispersed oil in coastal waters. Estuar. Coast. Shelf Sci. 2016, 195, 76–87. [Google Scholar] [CrossRef] [Scilit]
- Tilstone, G.H.; Pardo, S.; Simis, S.G.H.; Qin, P.; Selmes, N.; Dessailly, D.; Kwiatkowska, E. Consistency between Satellite Ocean Colour Products under High Coloured Dissolved Organic Matter Absorption in the Baltic Sea. Remote Sens. 2022, 14, 89. [Google Scholar] [CrossRef] [Scilit]
- Ficek, D.; Zapadka, T.; Dera, J. Remote sensing reflectance of Pomeranian lakes and the Baltic. Oceanologia 2011, 53, 959–970. [Google Scholar] [CrossRef] [Scilit]
- Doxaran, D.; Cherukuru, N.; Lavender, S.J. Apparent and inherent optical properties of turbid estuarine waters: Measurements, empirical quantification relationships, and modeling. Appl. Opt. 2006, 45, 2310–2324. [Google Scholar] [CrossRef] [Scilit] [PubMed]
- Le, C.; Hu, C. A hybrid approach to estimate chromophoric dissolved organic matter in turbid estuaries from satellite measurements: A case study for Tampa Bay. Opt. Express 2013, 21, 18849–18871. [Google Scholar] [CrossRef] [Scilit] [PubMed]
- Wei, J.; Yu, X.; Lee, Z.; Wang, M.; Jiang, L. Improving low-quality satellite remote sensing reflectance at blue bands over coastal and inland waters. Remote Sens. Environ. 2020, 250, 112029. [Google Scholar] [CrossRef] [Scilit]
- Kowalczuk, P.; Darecki, M.; Zabłocka, M.; Górecka, I. Validation of empirical and semi-analytical remote sensing algorithms for estimating absorption by Coloured Dissolved Organic Matter in the Baltic Sea from SeaWiFS and MODIS imagery. Oceanologia 2010, 52, 171–196. [Google Scholar] [CrossRef] [Scilit]
- Darecki, M.; Stramski, D. An evaluation of MODIS and SeaWiFS bio-optical algorithms in the Baltic Sea. Remote Sens. 2004, 89, 326–350. [Google Scholar] [CrossRef] [Scilit]
- Woźniak, S.B.; Meler, J. Modelling Water Colour Characteristics in an Optically Complex Nearshore Environment in the Baltic Sea; Quantitative Interpretation of the Forel-Ule Scale and Algorithms for the Remote Estimation of Seawater Composition. Remote Sens. 2020, 12, 2852. [Google Scholar] [CrossRef] [Scilit]
- Lednicka, B.; Kubacka, M. Semi-Empirical Model of Remote-Sensing Reflectance for Chosen Areas of the Southern Baltic. Sensors 2022, 22, 1105. [Google Scholar] [CrossRef] [Scilit] [PubMed]
- Uudeberg, K.; Aavaste, A.; Kõks, K.-L.; Ansper, A.; Uusõue, M.; Kangro, K.; Ansko, I.; Ligi, M.; Toming, K.; Reinart, A. Optical Water Type Guided Approach to Estimate Optical Water Quality Parameters. Remote Sens. 2020, 12, 931. [Google Scholar] [CrossRef] [Scilit]
- Dogliotti, A.I.; Ruddick, K.; Nechad, B.; Doxaran, D.; Knaeps, E. A Single Algorithm to Retrieve Turbidity from Remotely-Sensed Data in All Coastal and Estuarine Waters. Remote Sens. Environ. 2015, 156, 157–168. [Google Scholar] [CrossRef] [Scilit]
- Haule, K.; Kubacka, M.; Toczek, H.; Lednicka, B.; Pranszke, B.; Freda, W. Correlation between Turbidity and Inherent Optical Properties as an Initial Recognition for Backscattering Coefficient Estimation. Water 2024, 16, 594. [Google Scholar] [CrossRef] [Scilit]
- Kari, E.; Kratzer, S.; Beltrán-Abaunza, J.M.; Harvey, E.T.; Vaičiūtė, D. Retrieval of suspended particulate matter from turbidity—Model development, validation, and application to MERIS data over the Baltic Sea. Int. J. Remote Sens. 2017, 38, 1983–2003. [Google Scholar] [CrossRef] [Scilit]
- Chowdhury, M.; Vilas, C.; van Bergeijk, S.; Navarro, G.; Laiz, I.; Caballero, I. Monitoring turbidity in a highly variable estuary using Sentinel-2A/B for ecosystem management applications. Front. Mar. Sci. 2023, 10, 1186441. [Google Scholar] [CrossRef] [Scilit]
- Wu, Z.; Pang, J.; Li, J.; Wang, Y.; Ruan, J.; Zhang, X.; Yang, L.; Pang, Y.; Gao, Y. A review of remote sensing-based water quality monitoring in turbid coastal waters. Intell. Mar. Technol. Syst. 2025, 3, 24. [Google Scholar] [CrossRef] [Scilit]
- Nechad, B.; Ruddick, K.G.; Park, Y. Calibration and validation of a generic multisensor algorithm for mapping of total suspended matter in turbid waters. Remote Sens. Environ. 2010, 114, 854–866. [Google Scholar] [CrossRef] [Scilit]

Disclaimer/Publisher’s Note: The statements, opinions and data contained in all publications are solely those of the individual author(s) and contributor(s) and not of MDPI and/or the editor(s). MDPI and/or the editor(s) disclaim responsibility for any injury to people or property resulting from any ideas, methods, instructions or products referred to in the content. |
© 2026 by the authors. Licensee MDPI, Basel, Switzerland. This article is an open access article distributed under the terms and conditions of the Creative Commons Attribution (CC BY) license.