Global Accuracy Comparison from Multi-Source NO2 Products Based on Pandora Observations

 ,
,  ,
,
Highlights
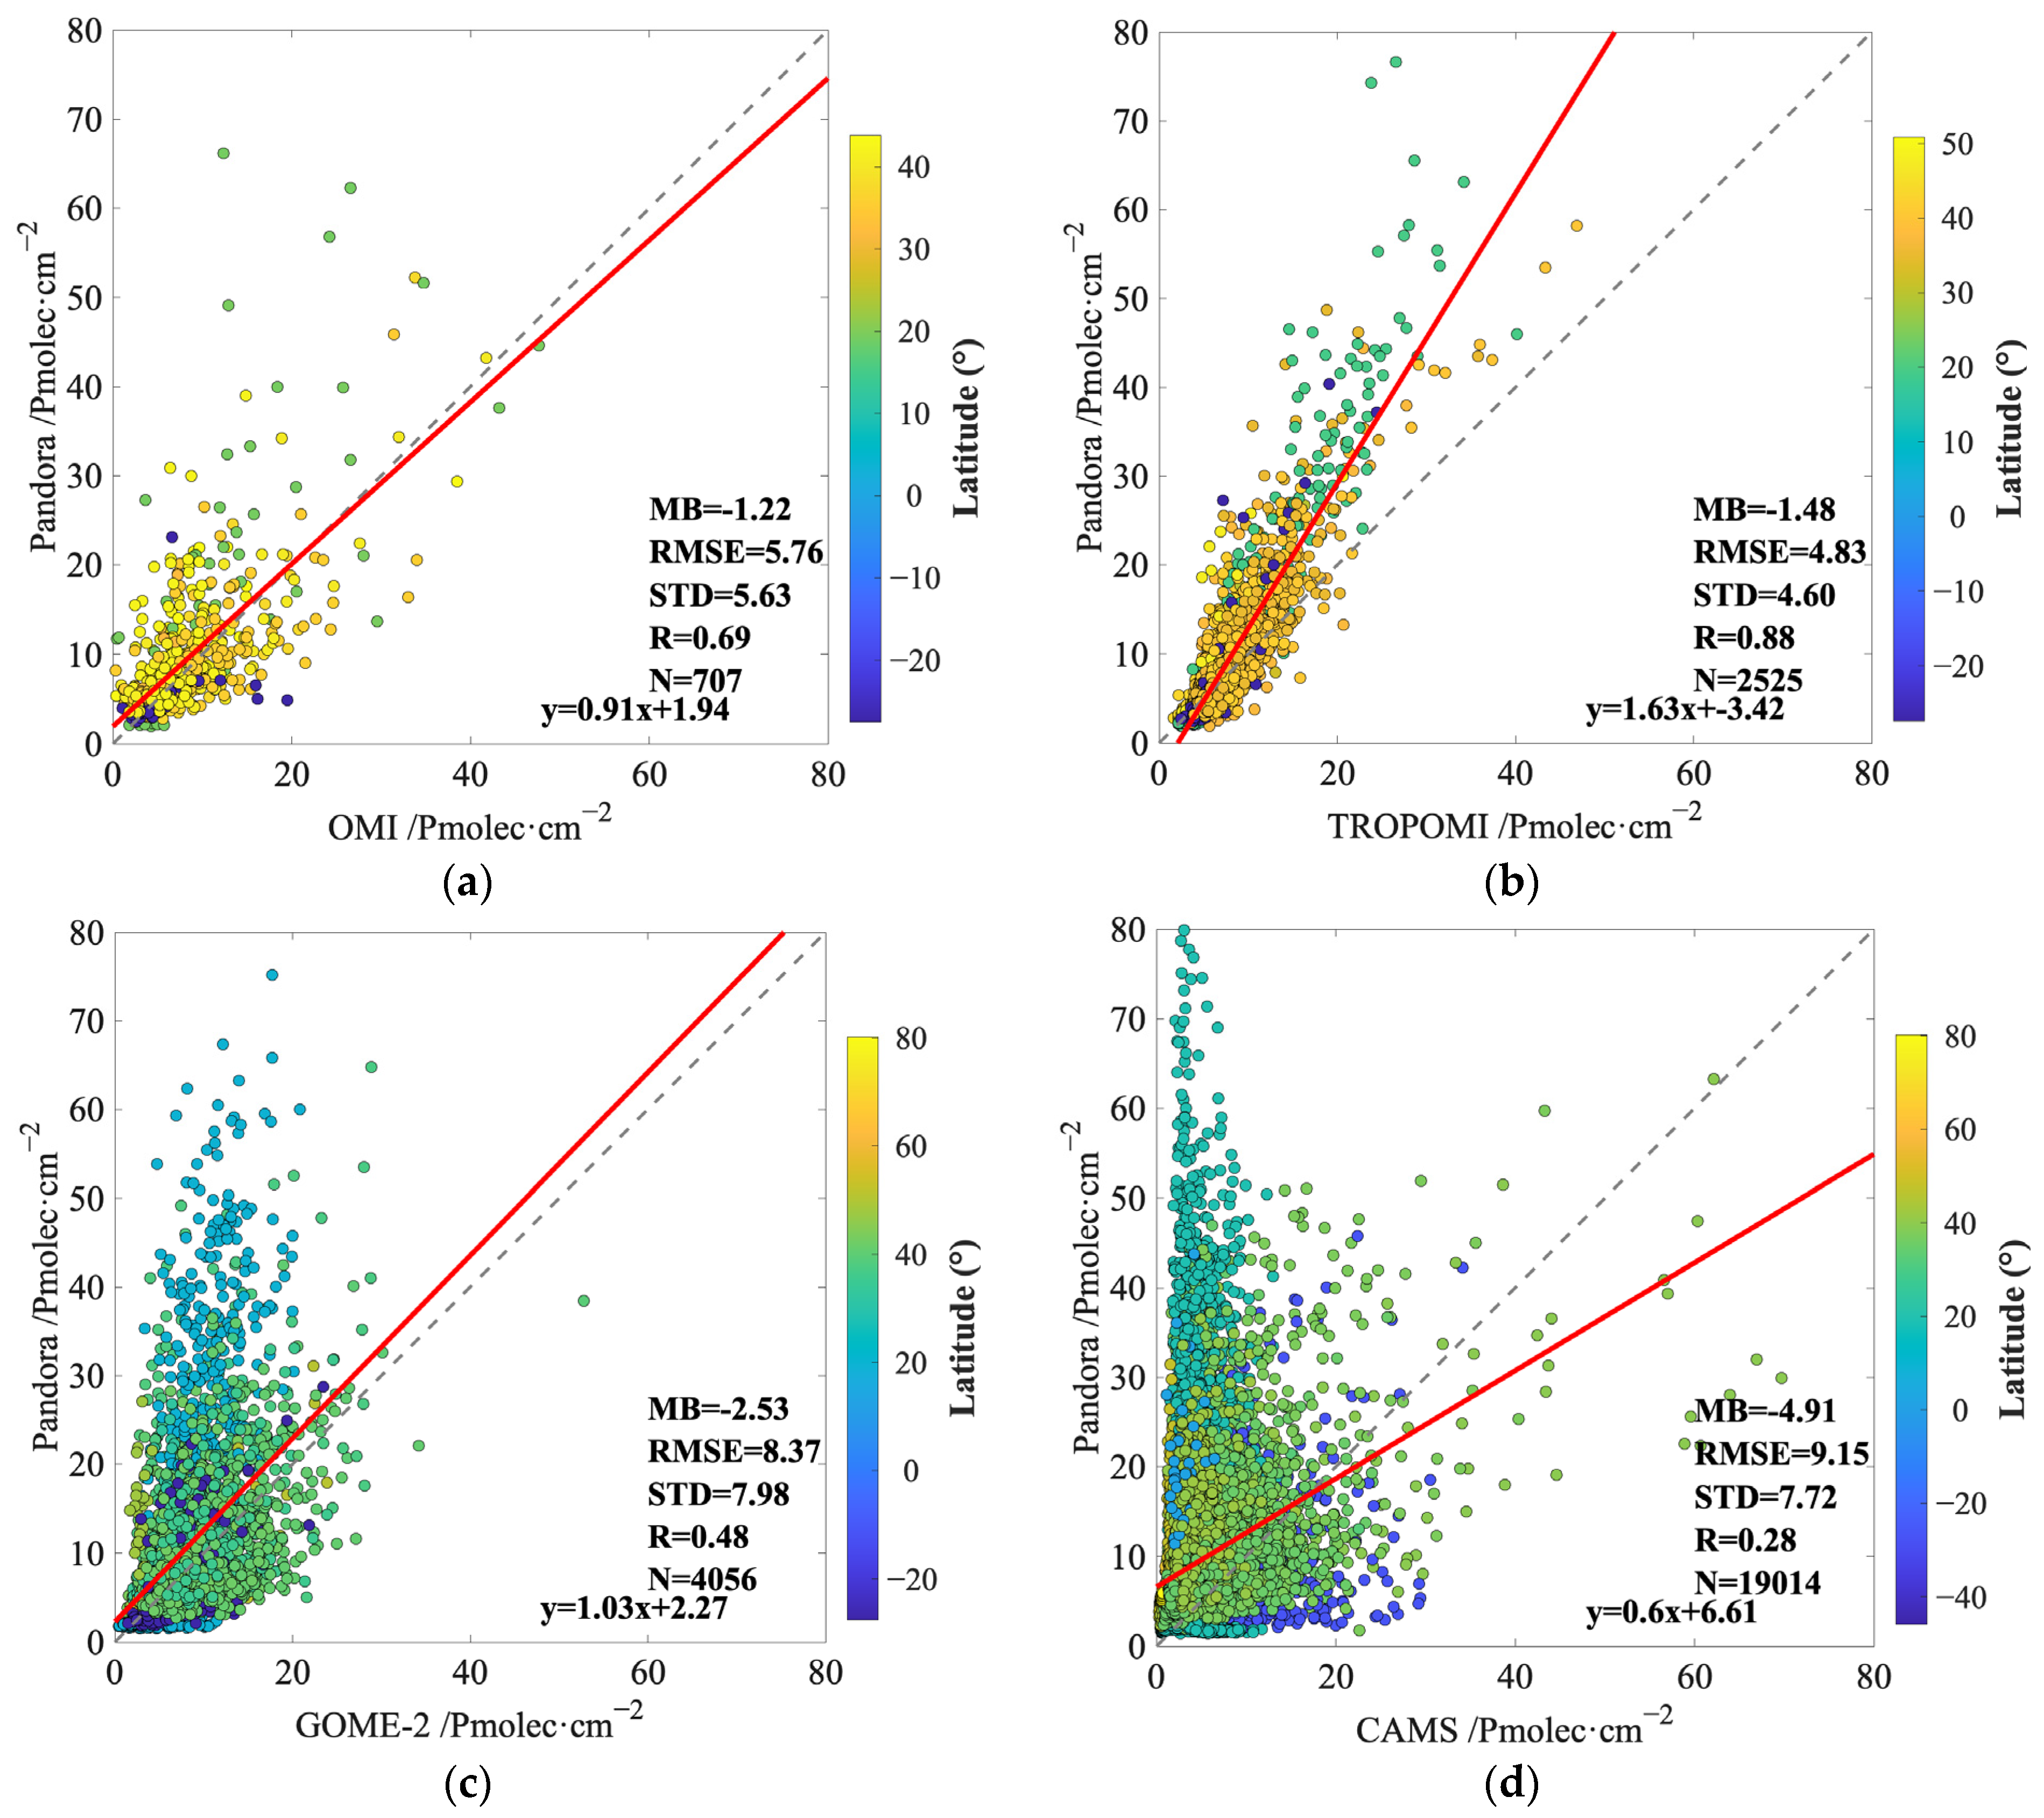
- TROPOMI exhibits the highest accuracy among the four global TOTNO2 products (R = 0.88, RMSE = 4.83 Pmolec·cm−2), while CAMS reanalysis shows the largest bias and error (MB = −4.91 Pmolec·cm−2, RMSE = 9.15 Pmolec·cm−2).
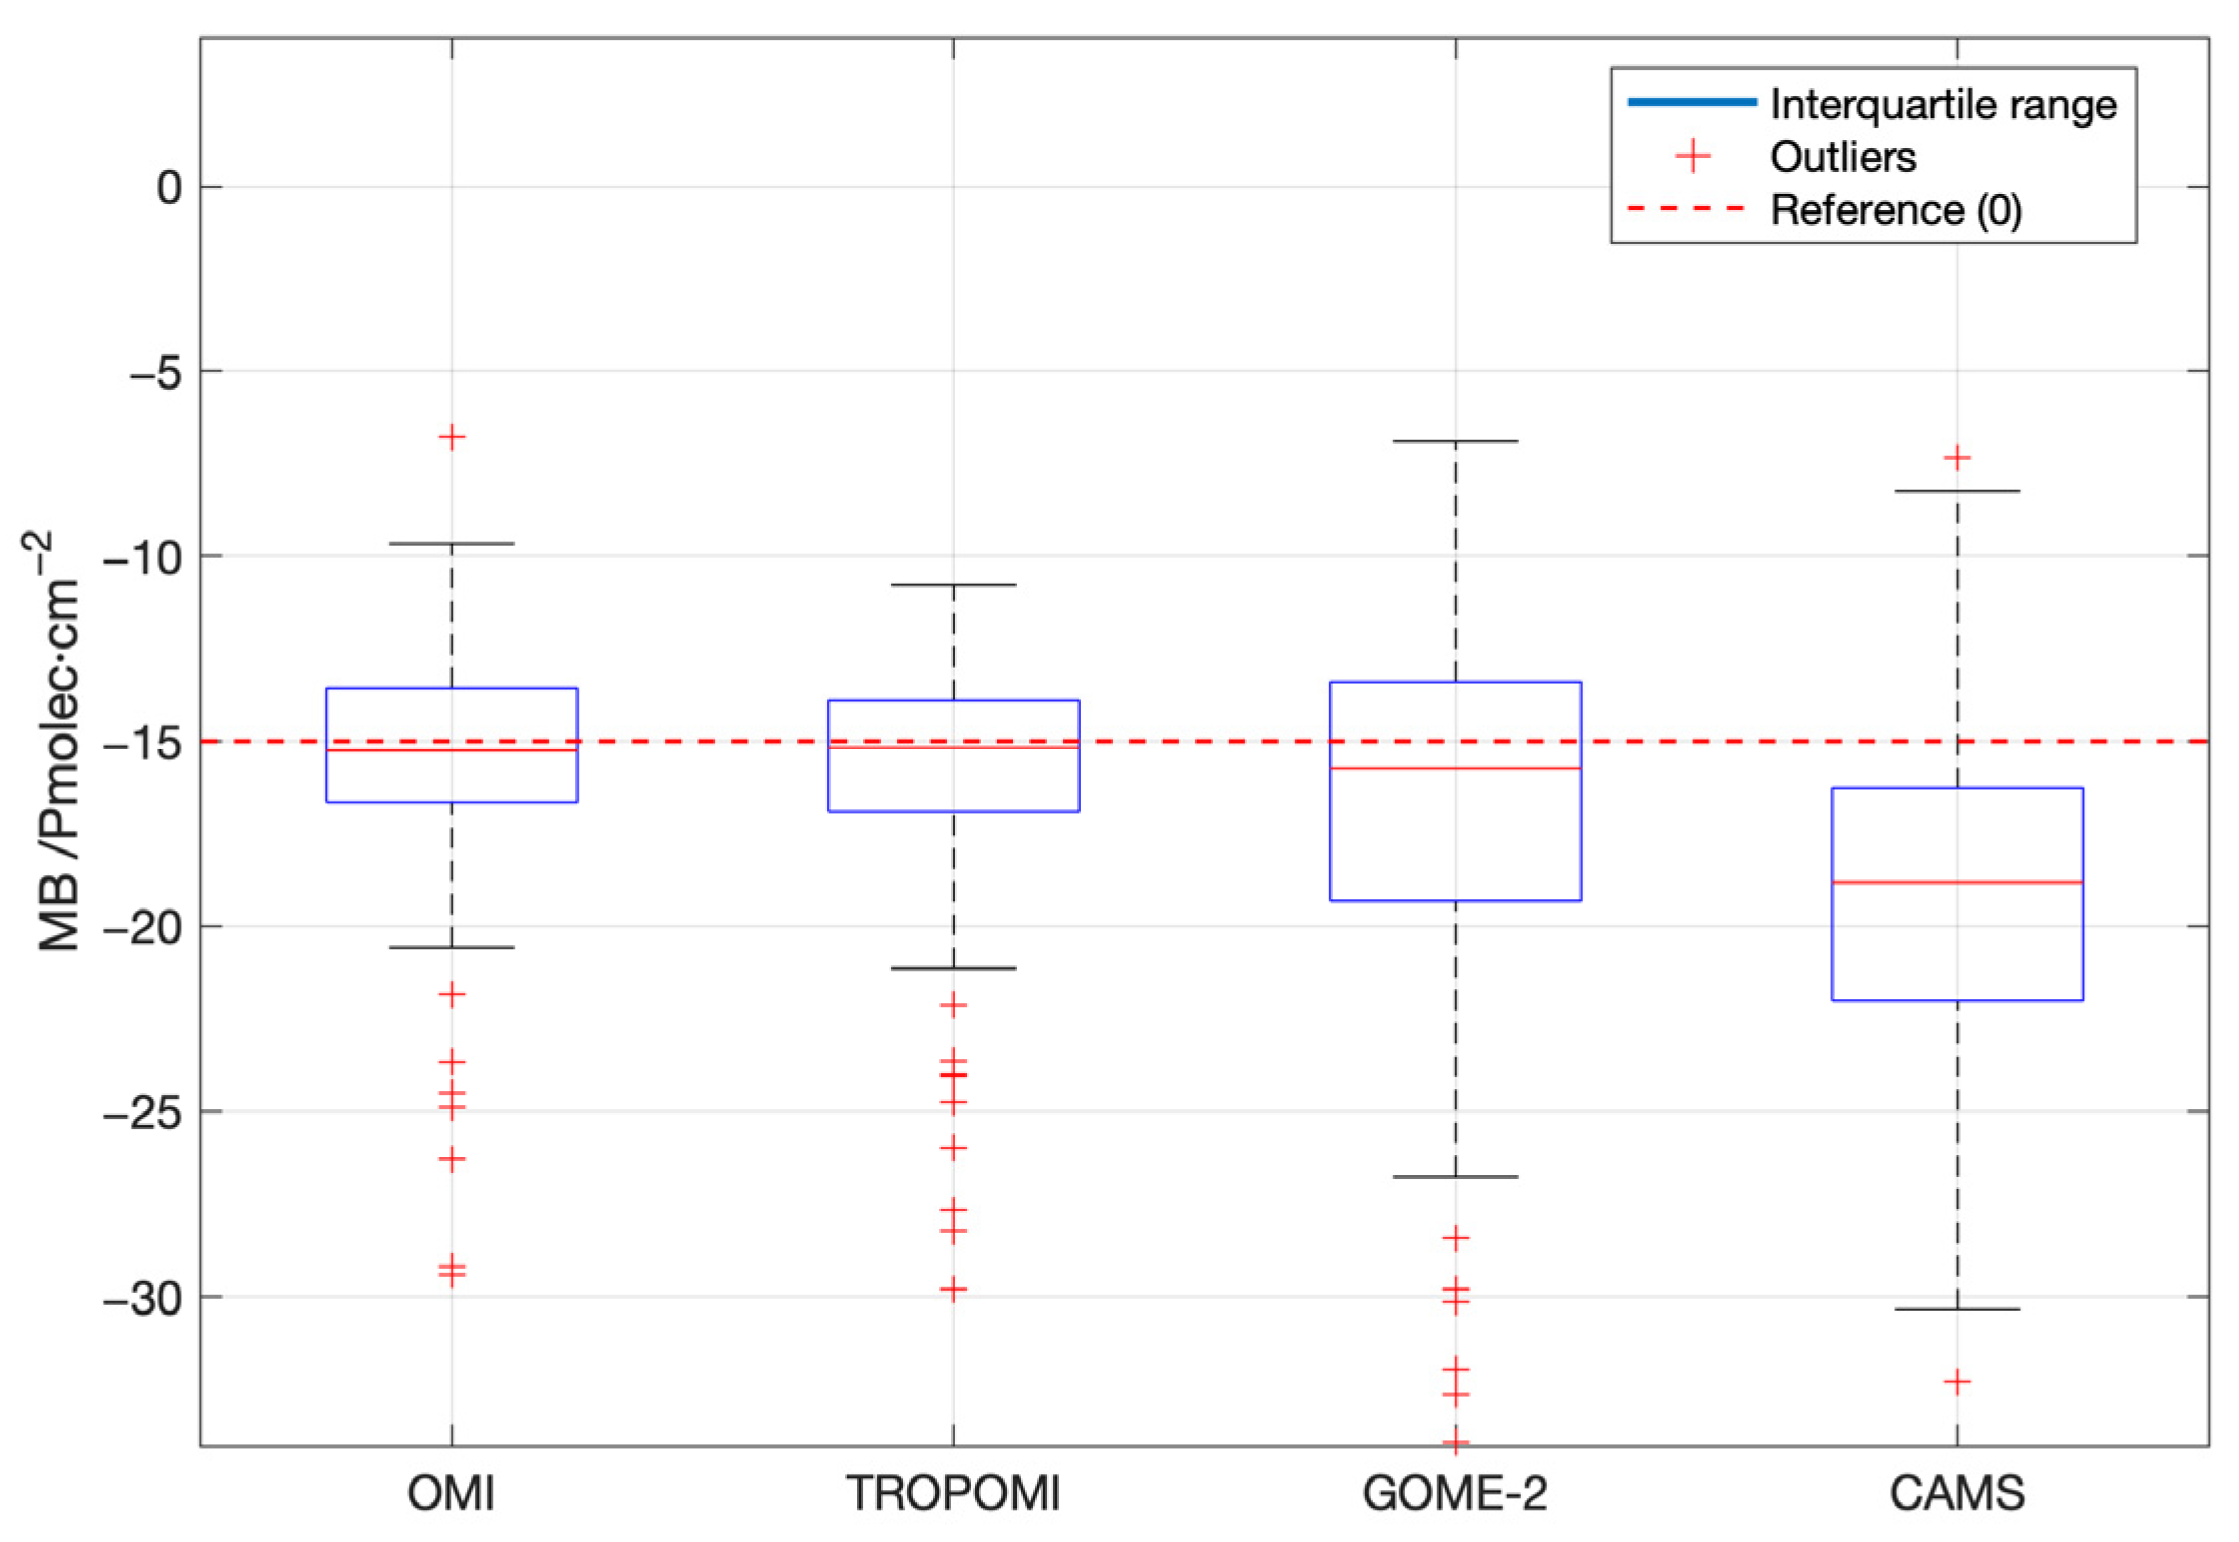
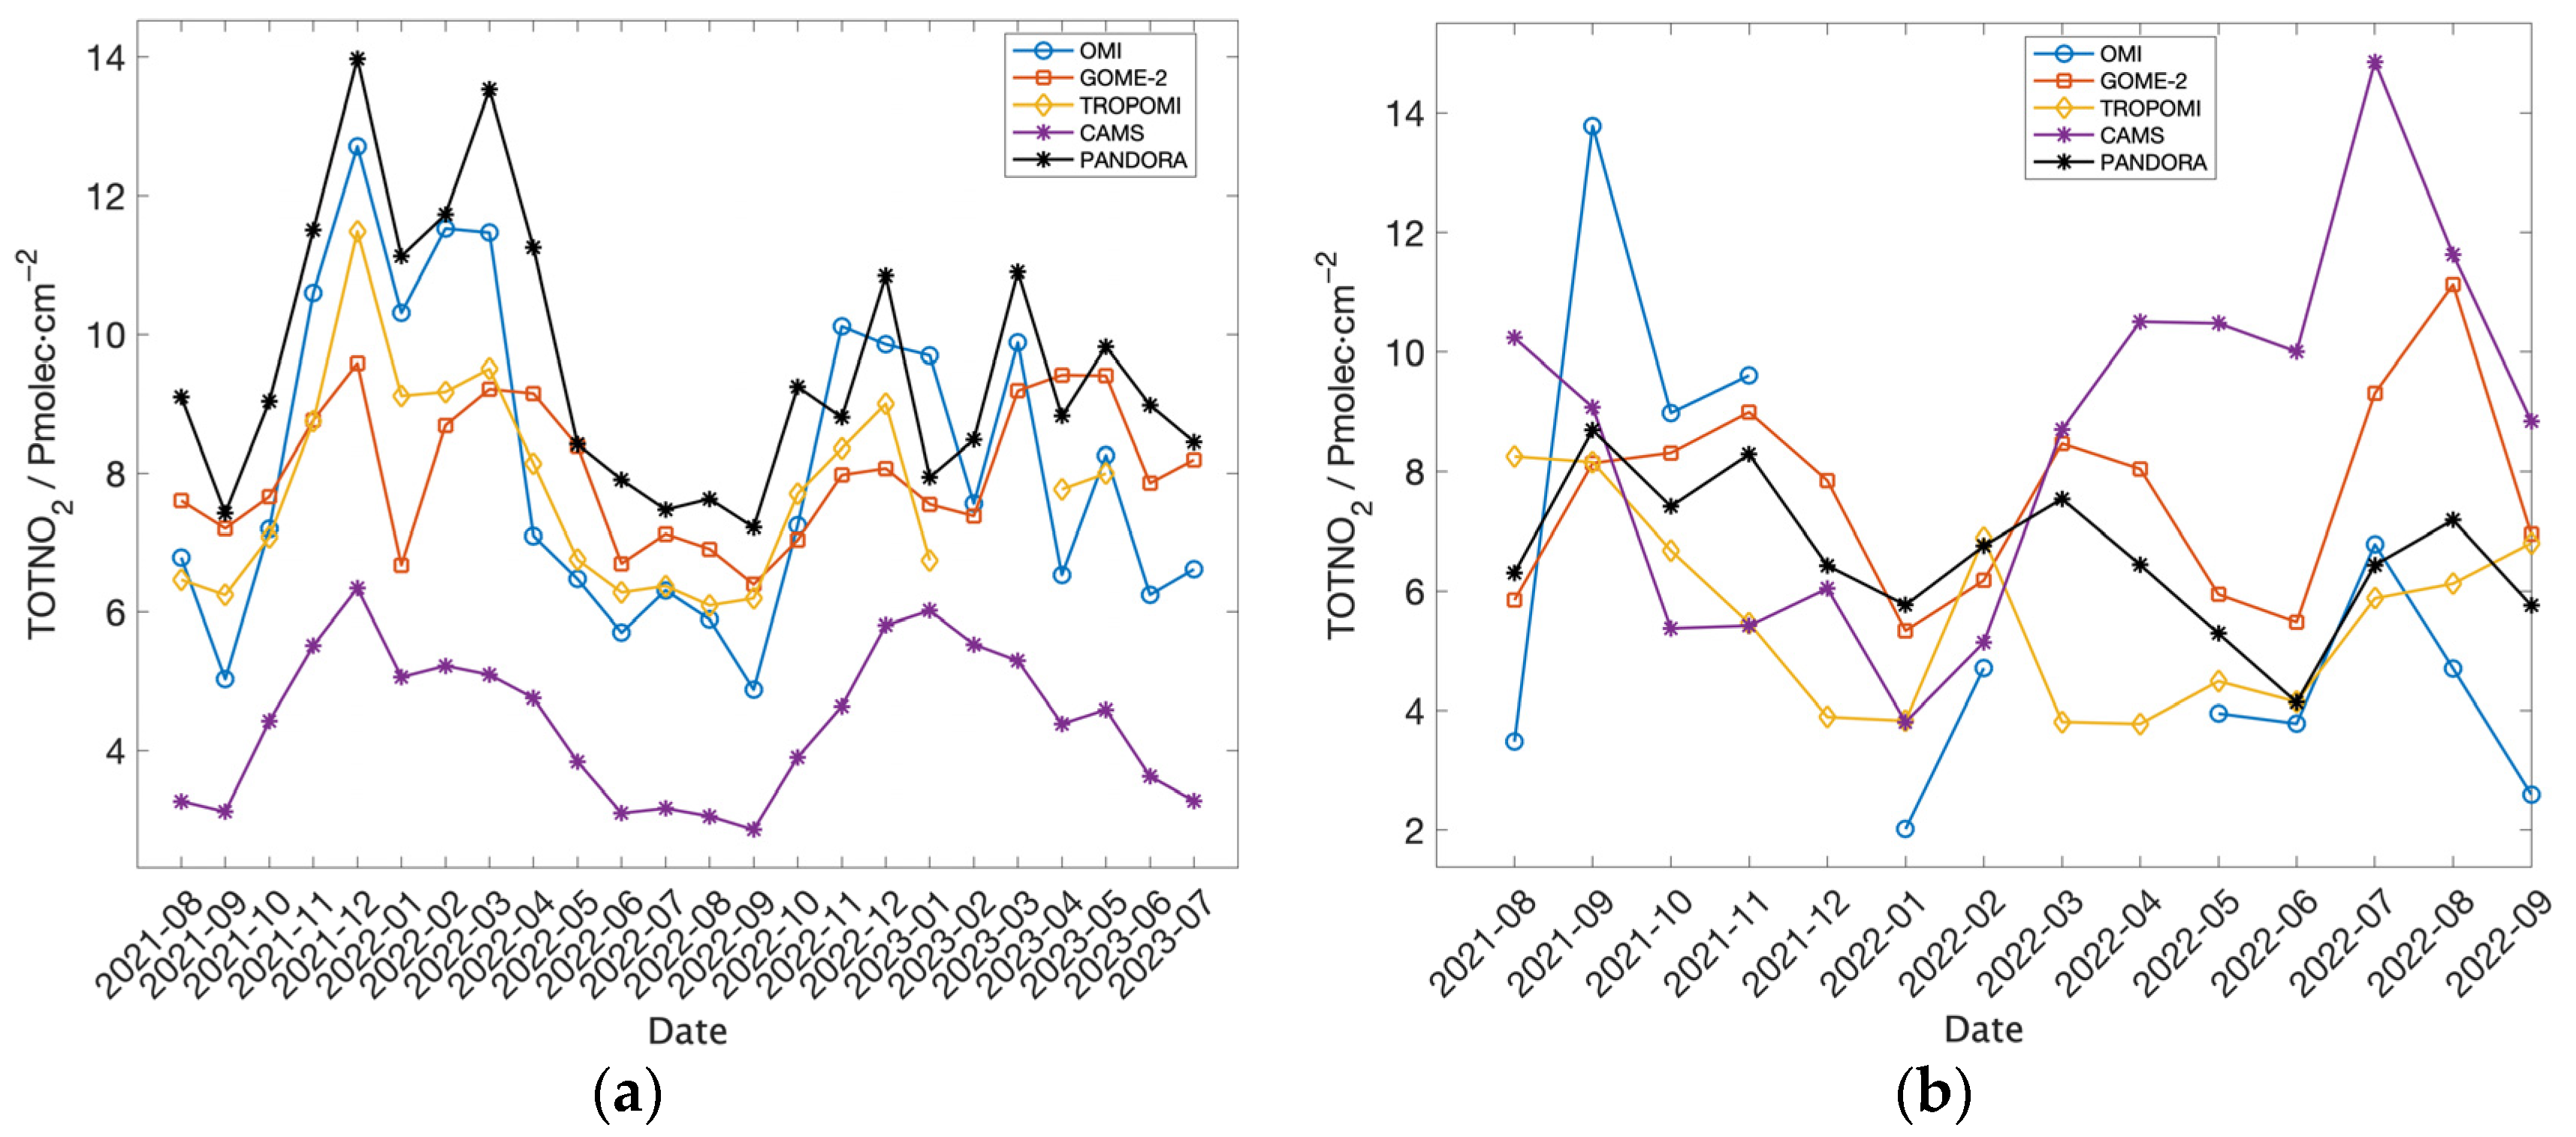
- All four TOTNO2 products (OMI, TROPOMI, GOME-2, CAMS) systematically underestimate Pandora ground-based observations and follow a clear “winter-high, summer-low” seasonal cycle.
- Linear bias correction reduces systematic errors by more than 79% and lowers RMSE by 4–28%, significantly improving the consistency between satellite/CAMS data and ground-based measurements.
- The superior accuracy and stability of TROPOMI make it a suitable reference for calibrating coarser-resolution products like CAMS, facilitating multi-source NO2 data fusion and air quality applications.
Abstract
1. Introduction
2. Data and Methods
2.1. Data
2.1.1. Pandora Data
2.1.2. OMI NO2 Product
2.1.3. TROPOMI NO2 Product
2.1.4. GOME-2 NO2 Product
2.1.5. CAMS NO2 Product
2.2. Research Methods
2.2.1. Data Matching Method
2.2.2. Screening Method
2.2.3. Statistical Indicators
2.2.4. Bias Correction Method
3. Results
3.1. Comparison of the Temporal Characteristics of NO2 Products Three Kinds of Satellite and CAMS Reanalysis with Those of the Pandora Station
3.2. Accuracy Assessment of Multi-Source NO2 Products Based on Pandora Ground-Based Observations
3.2.1. Overall Accuracy Assessment of NO2 Products
3.2.2. The Accuracy of the Four NO2 Products Changes over Time
3.2.3. Station-Level Accuracy Evaluation from NO2 Products
3.3. Analysis of Bias Correction for TOTNO2 Products from OMI, TROPOMI, GOME-2 and CAMS
4. Discussion
4.1. Discussion on the Change in Accuracy Before and After the Downgrade of OMI
4.2. Discussion on Temporal Characteristics and Systematic Underestimation
4.3. Discussion on Seasonal Accuracy Variation
4.4. Discussion on Bias Correction
5. Conclusions
- (1)
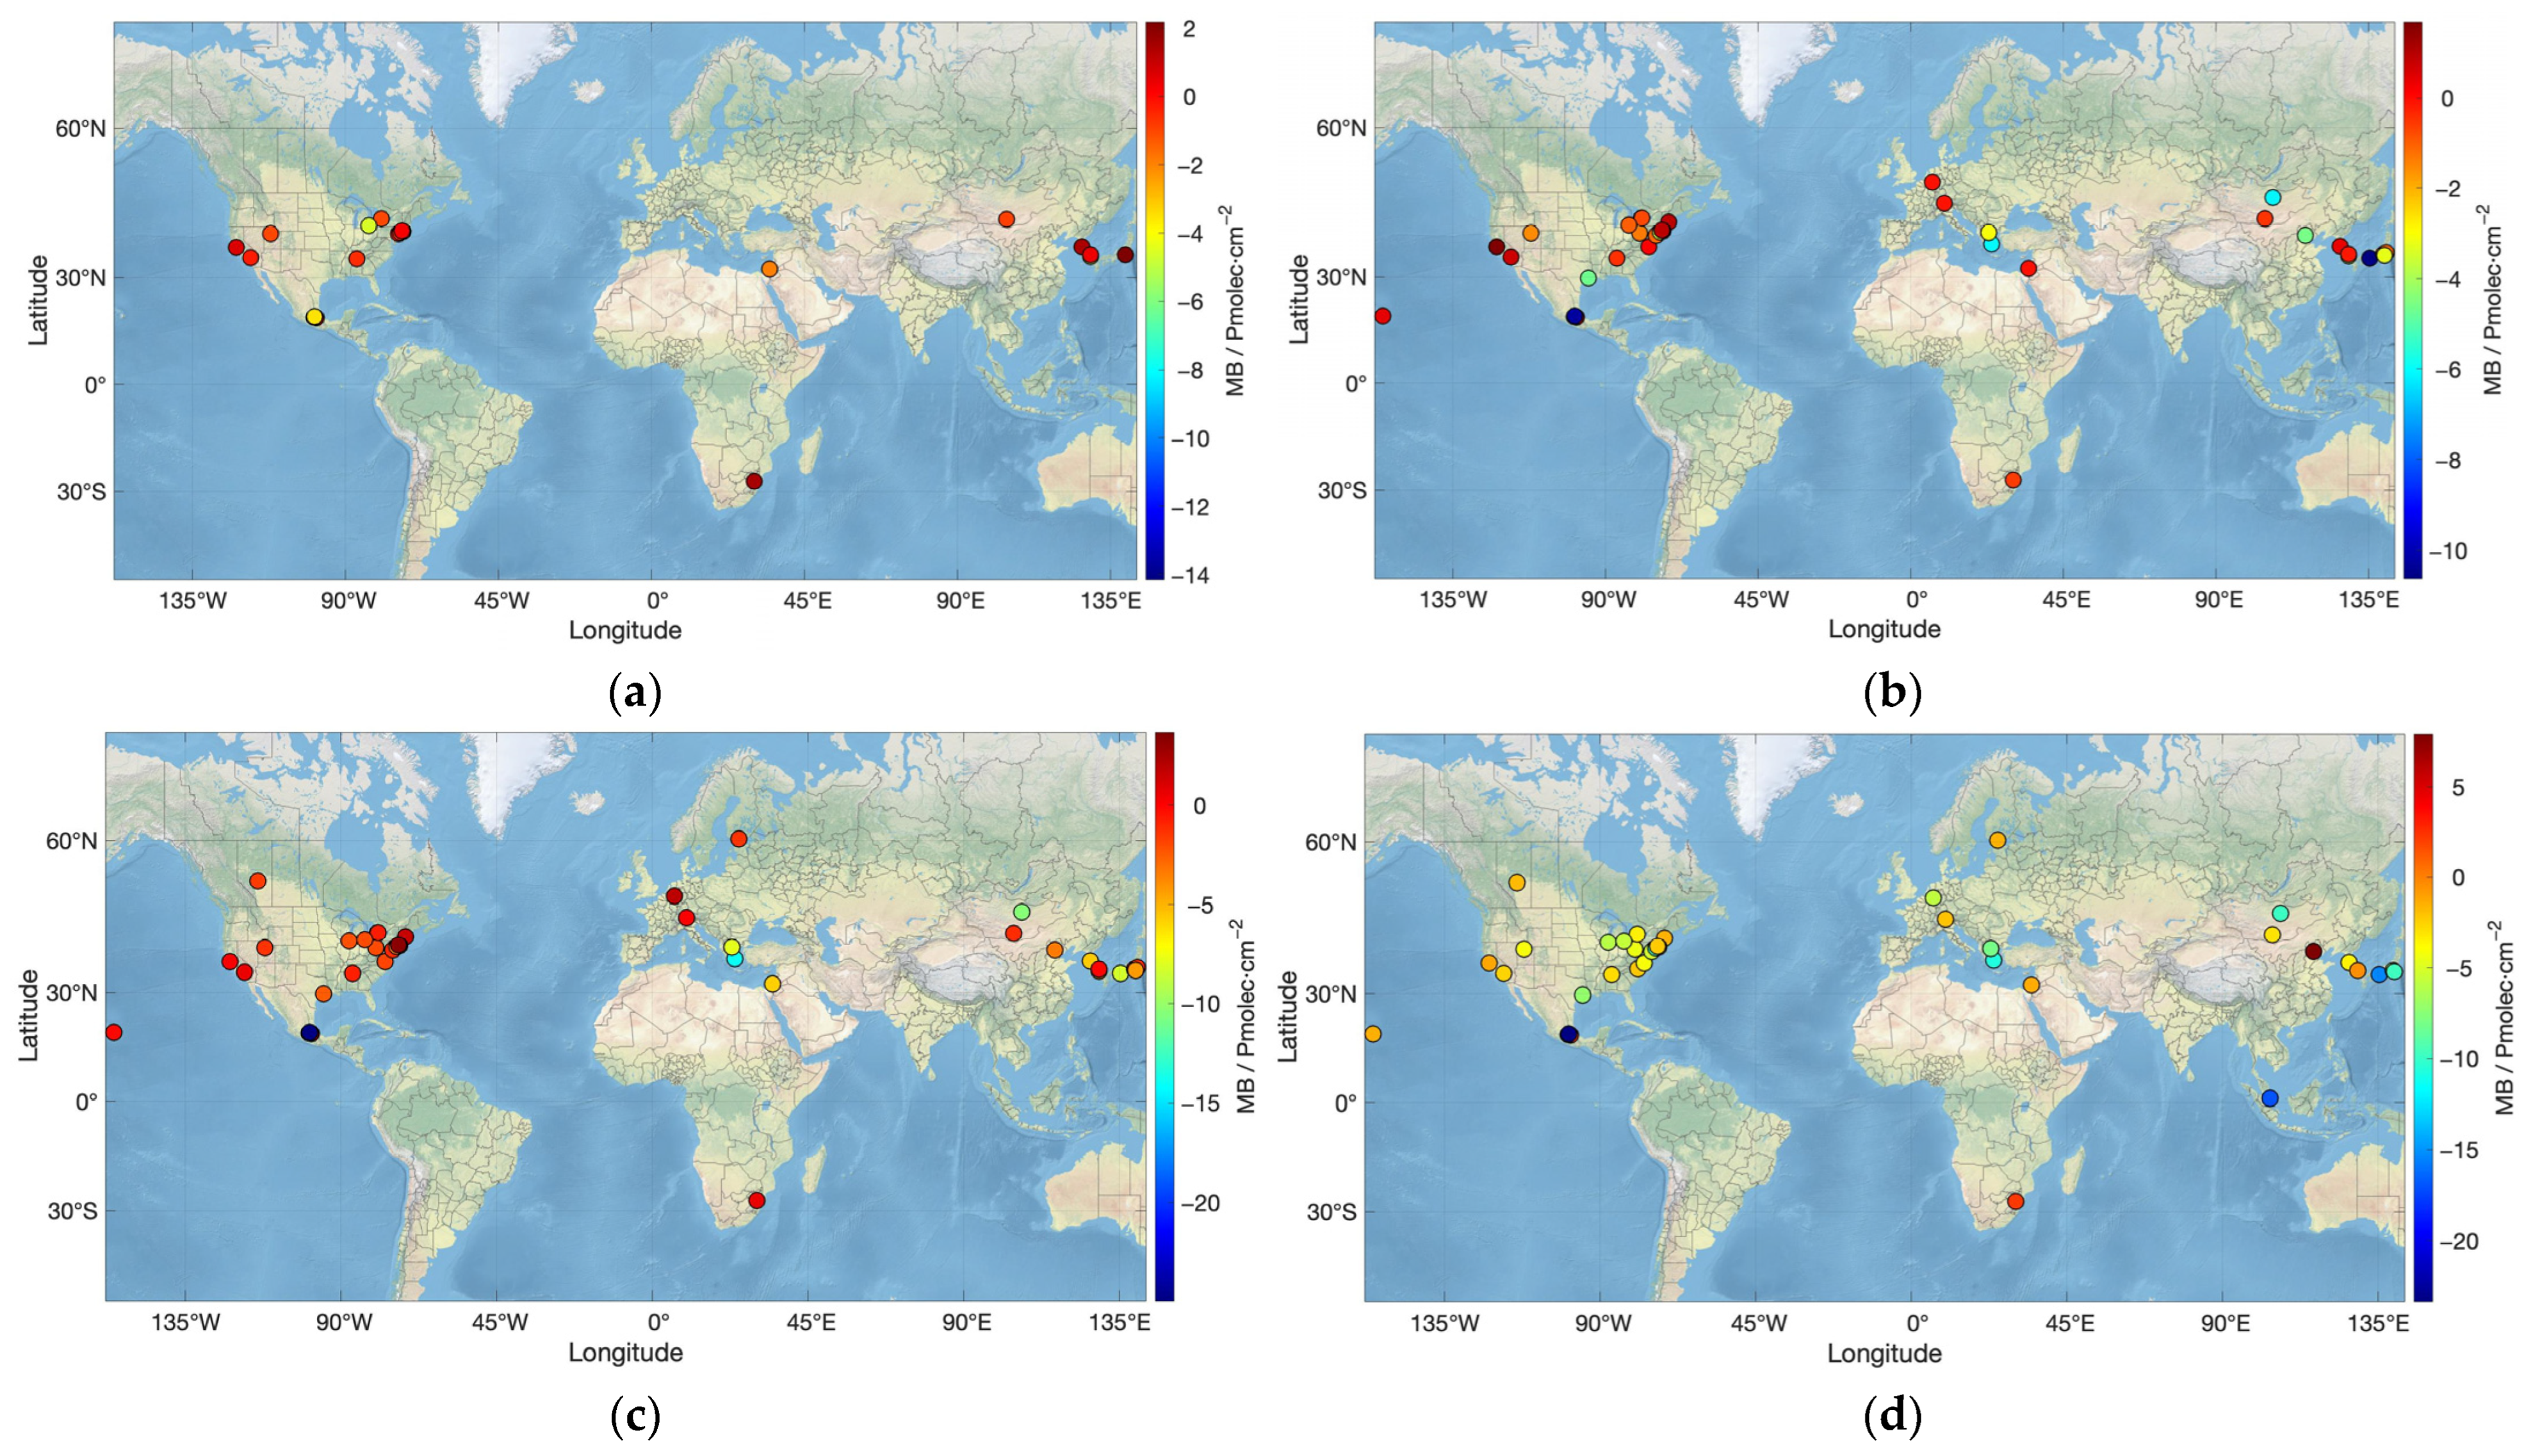
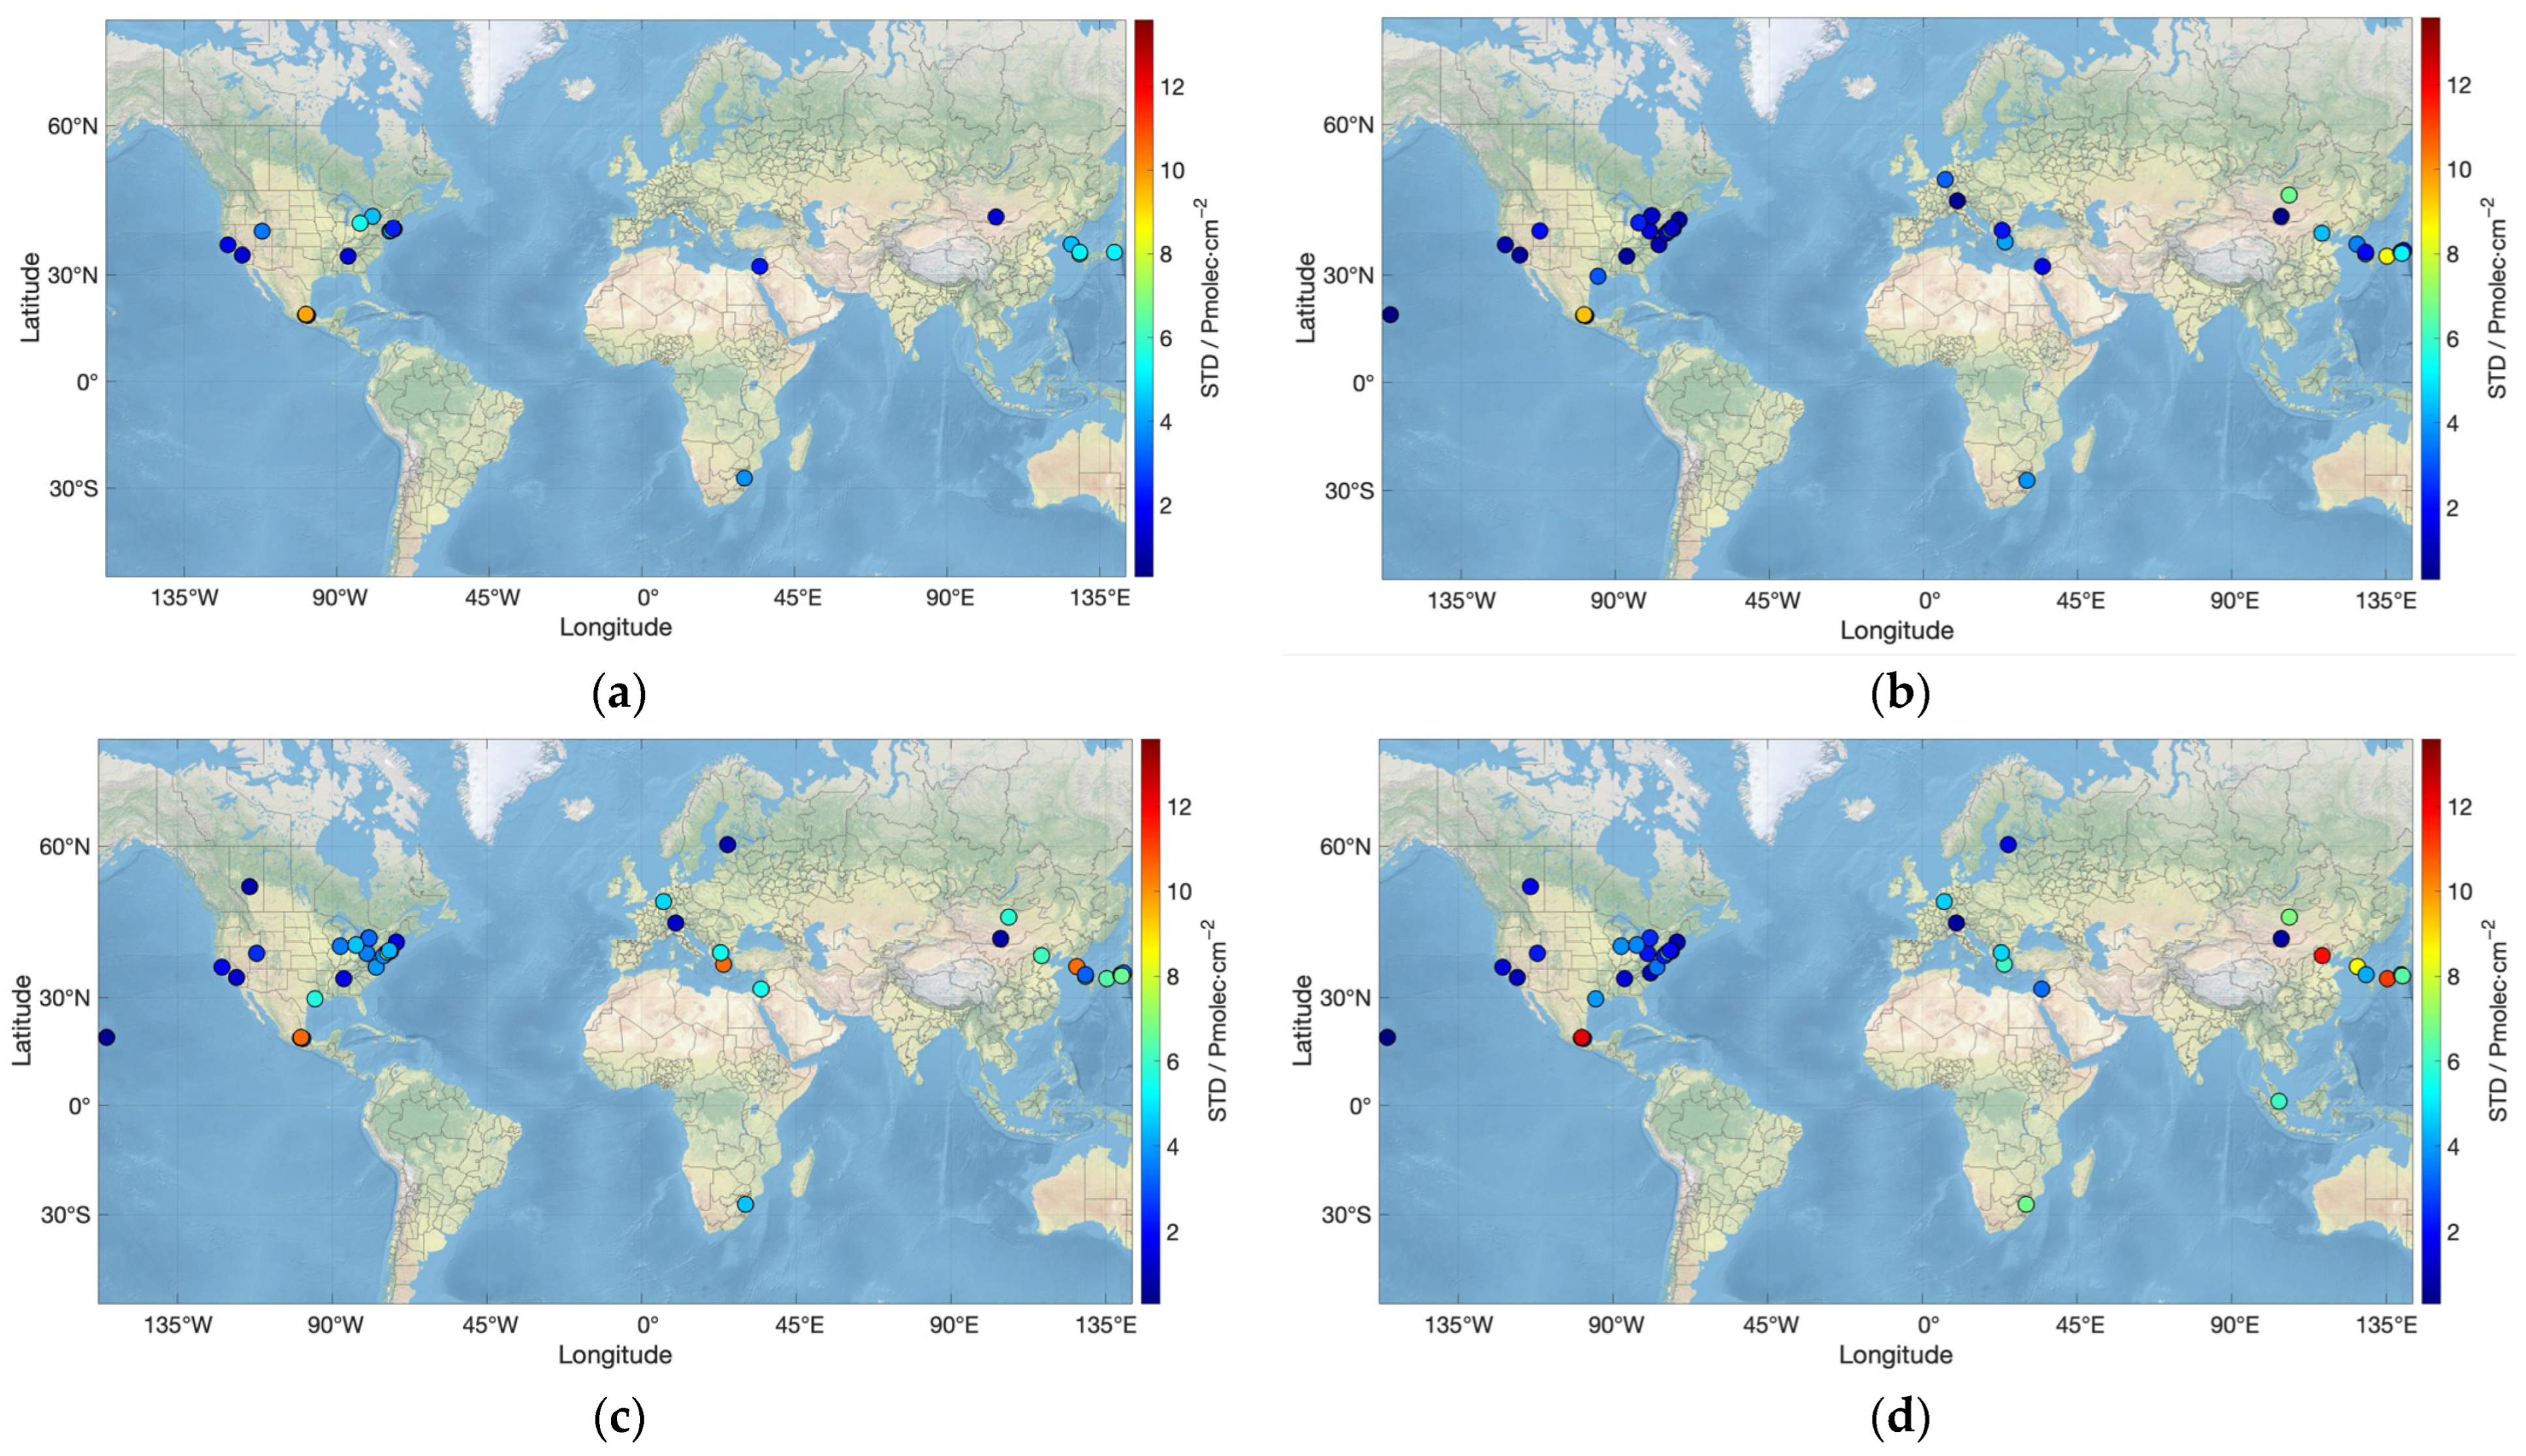
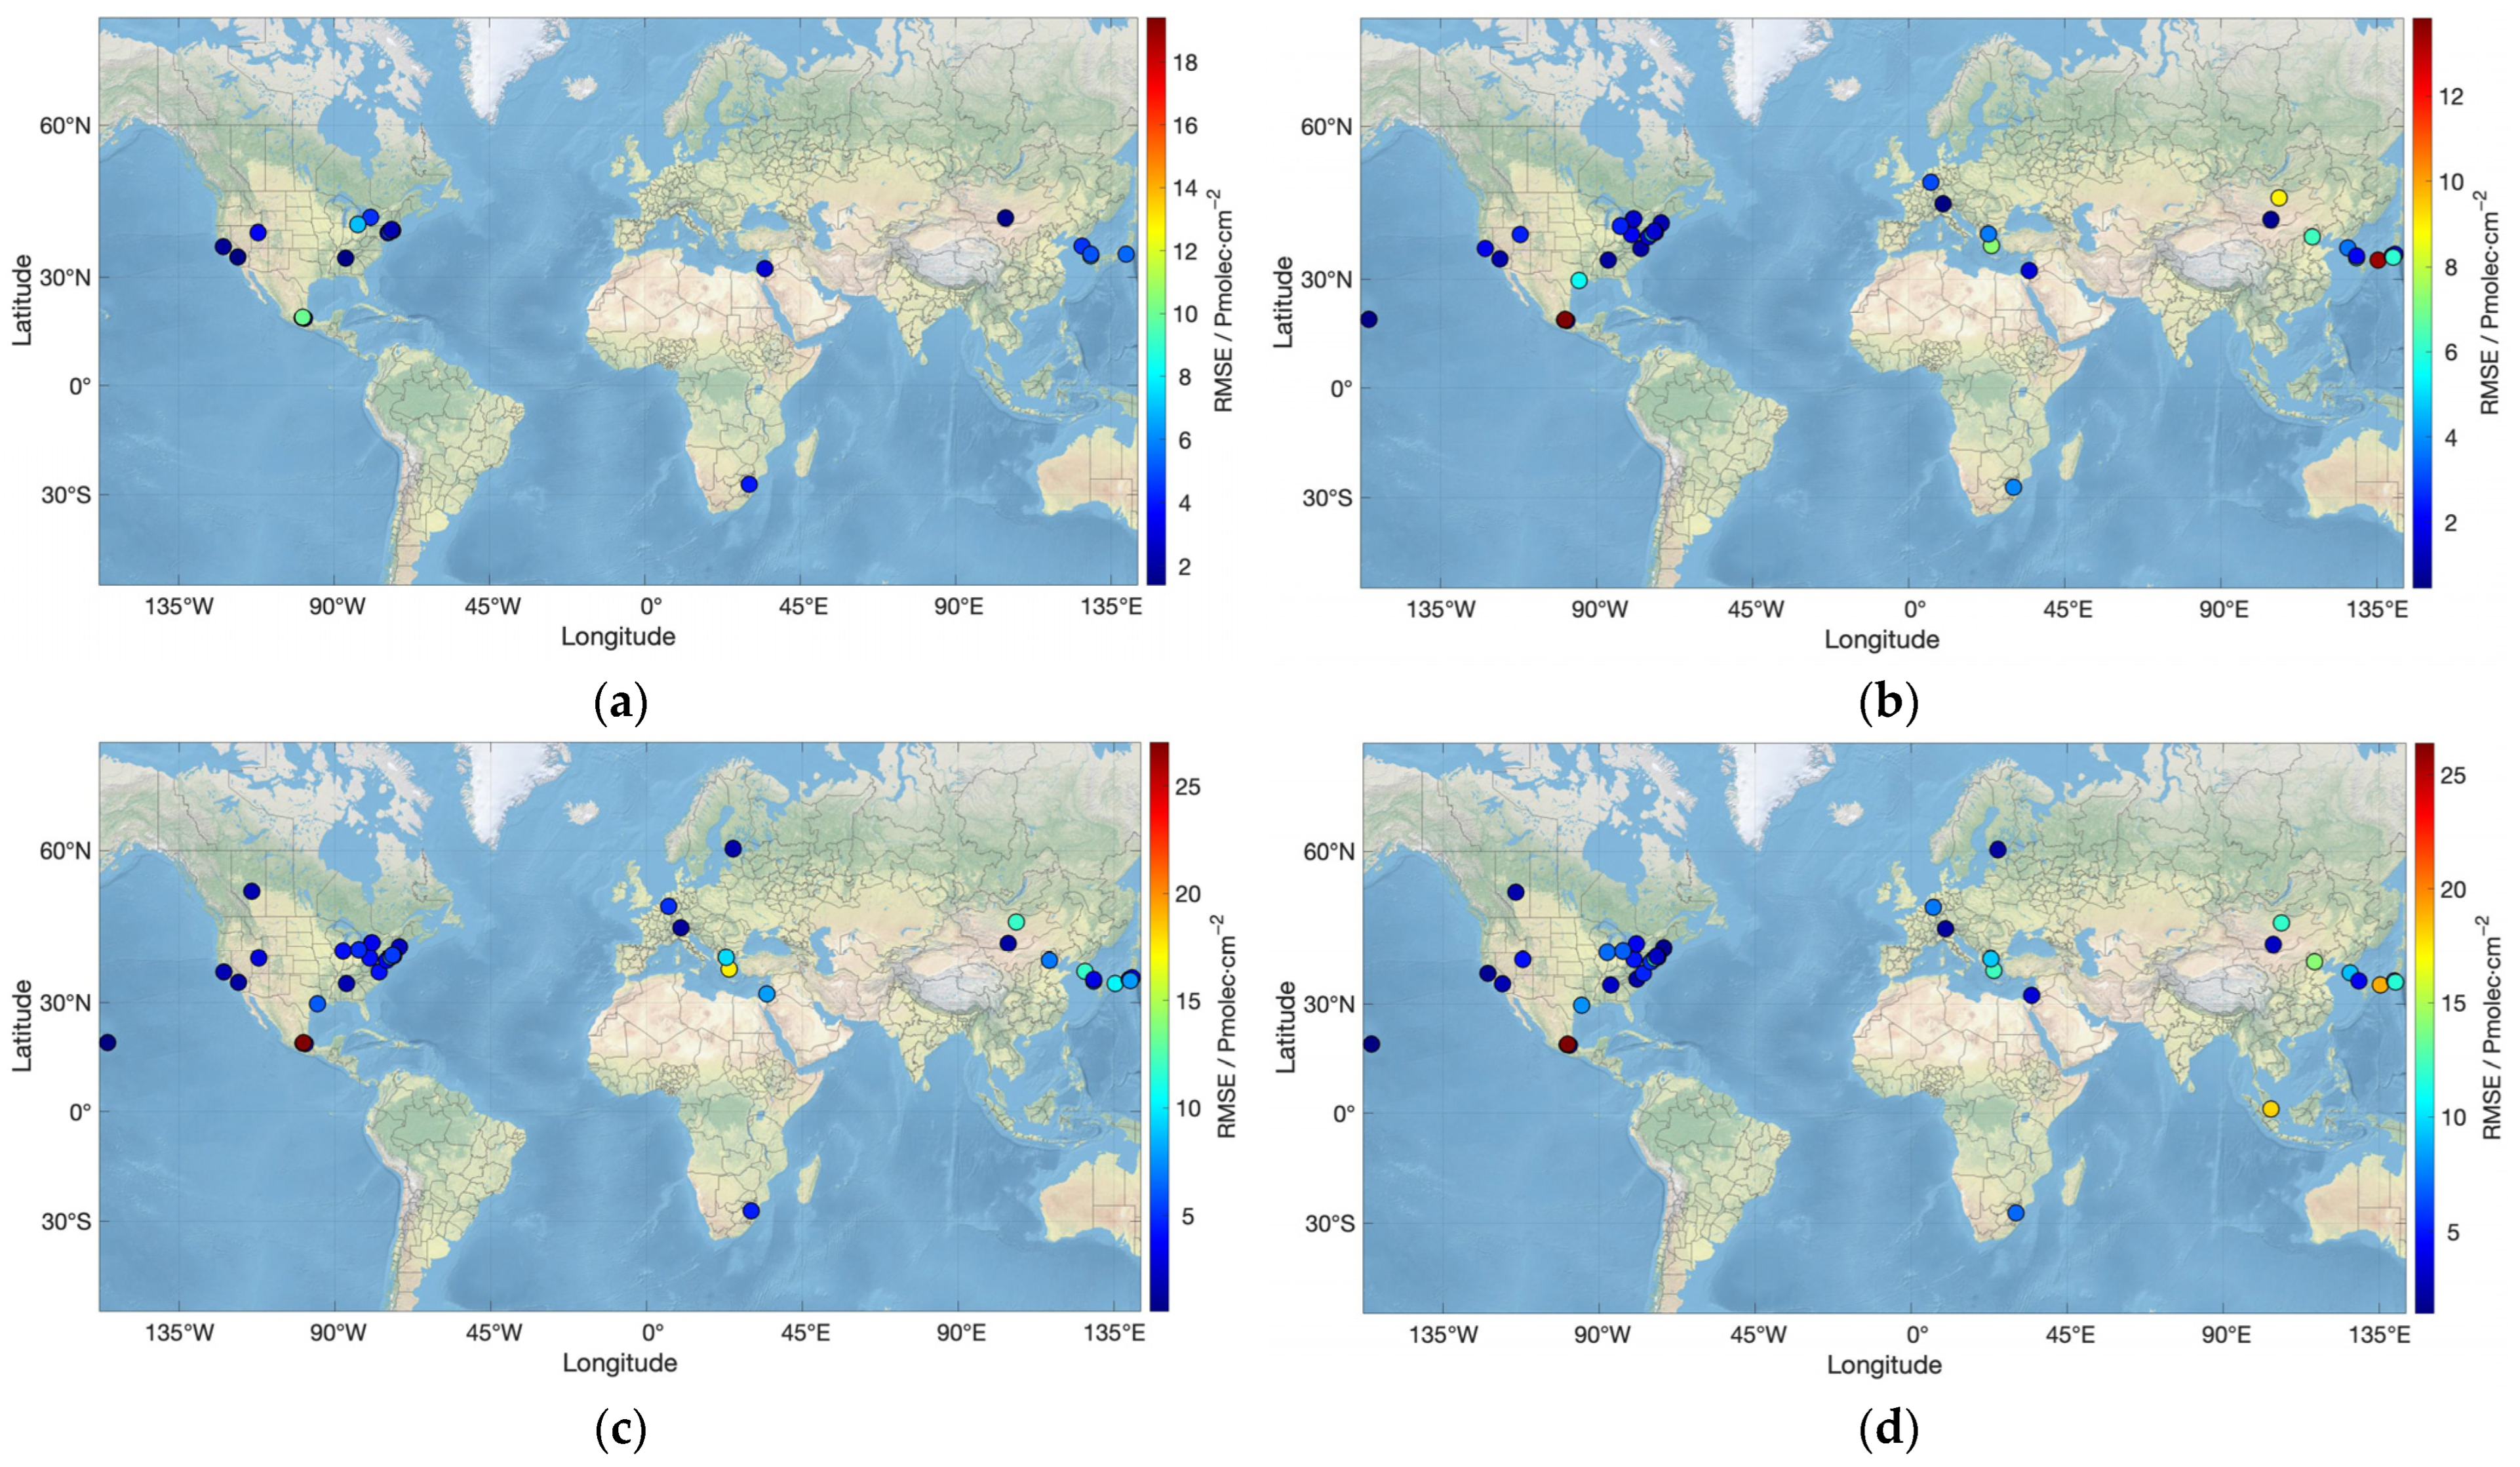
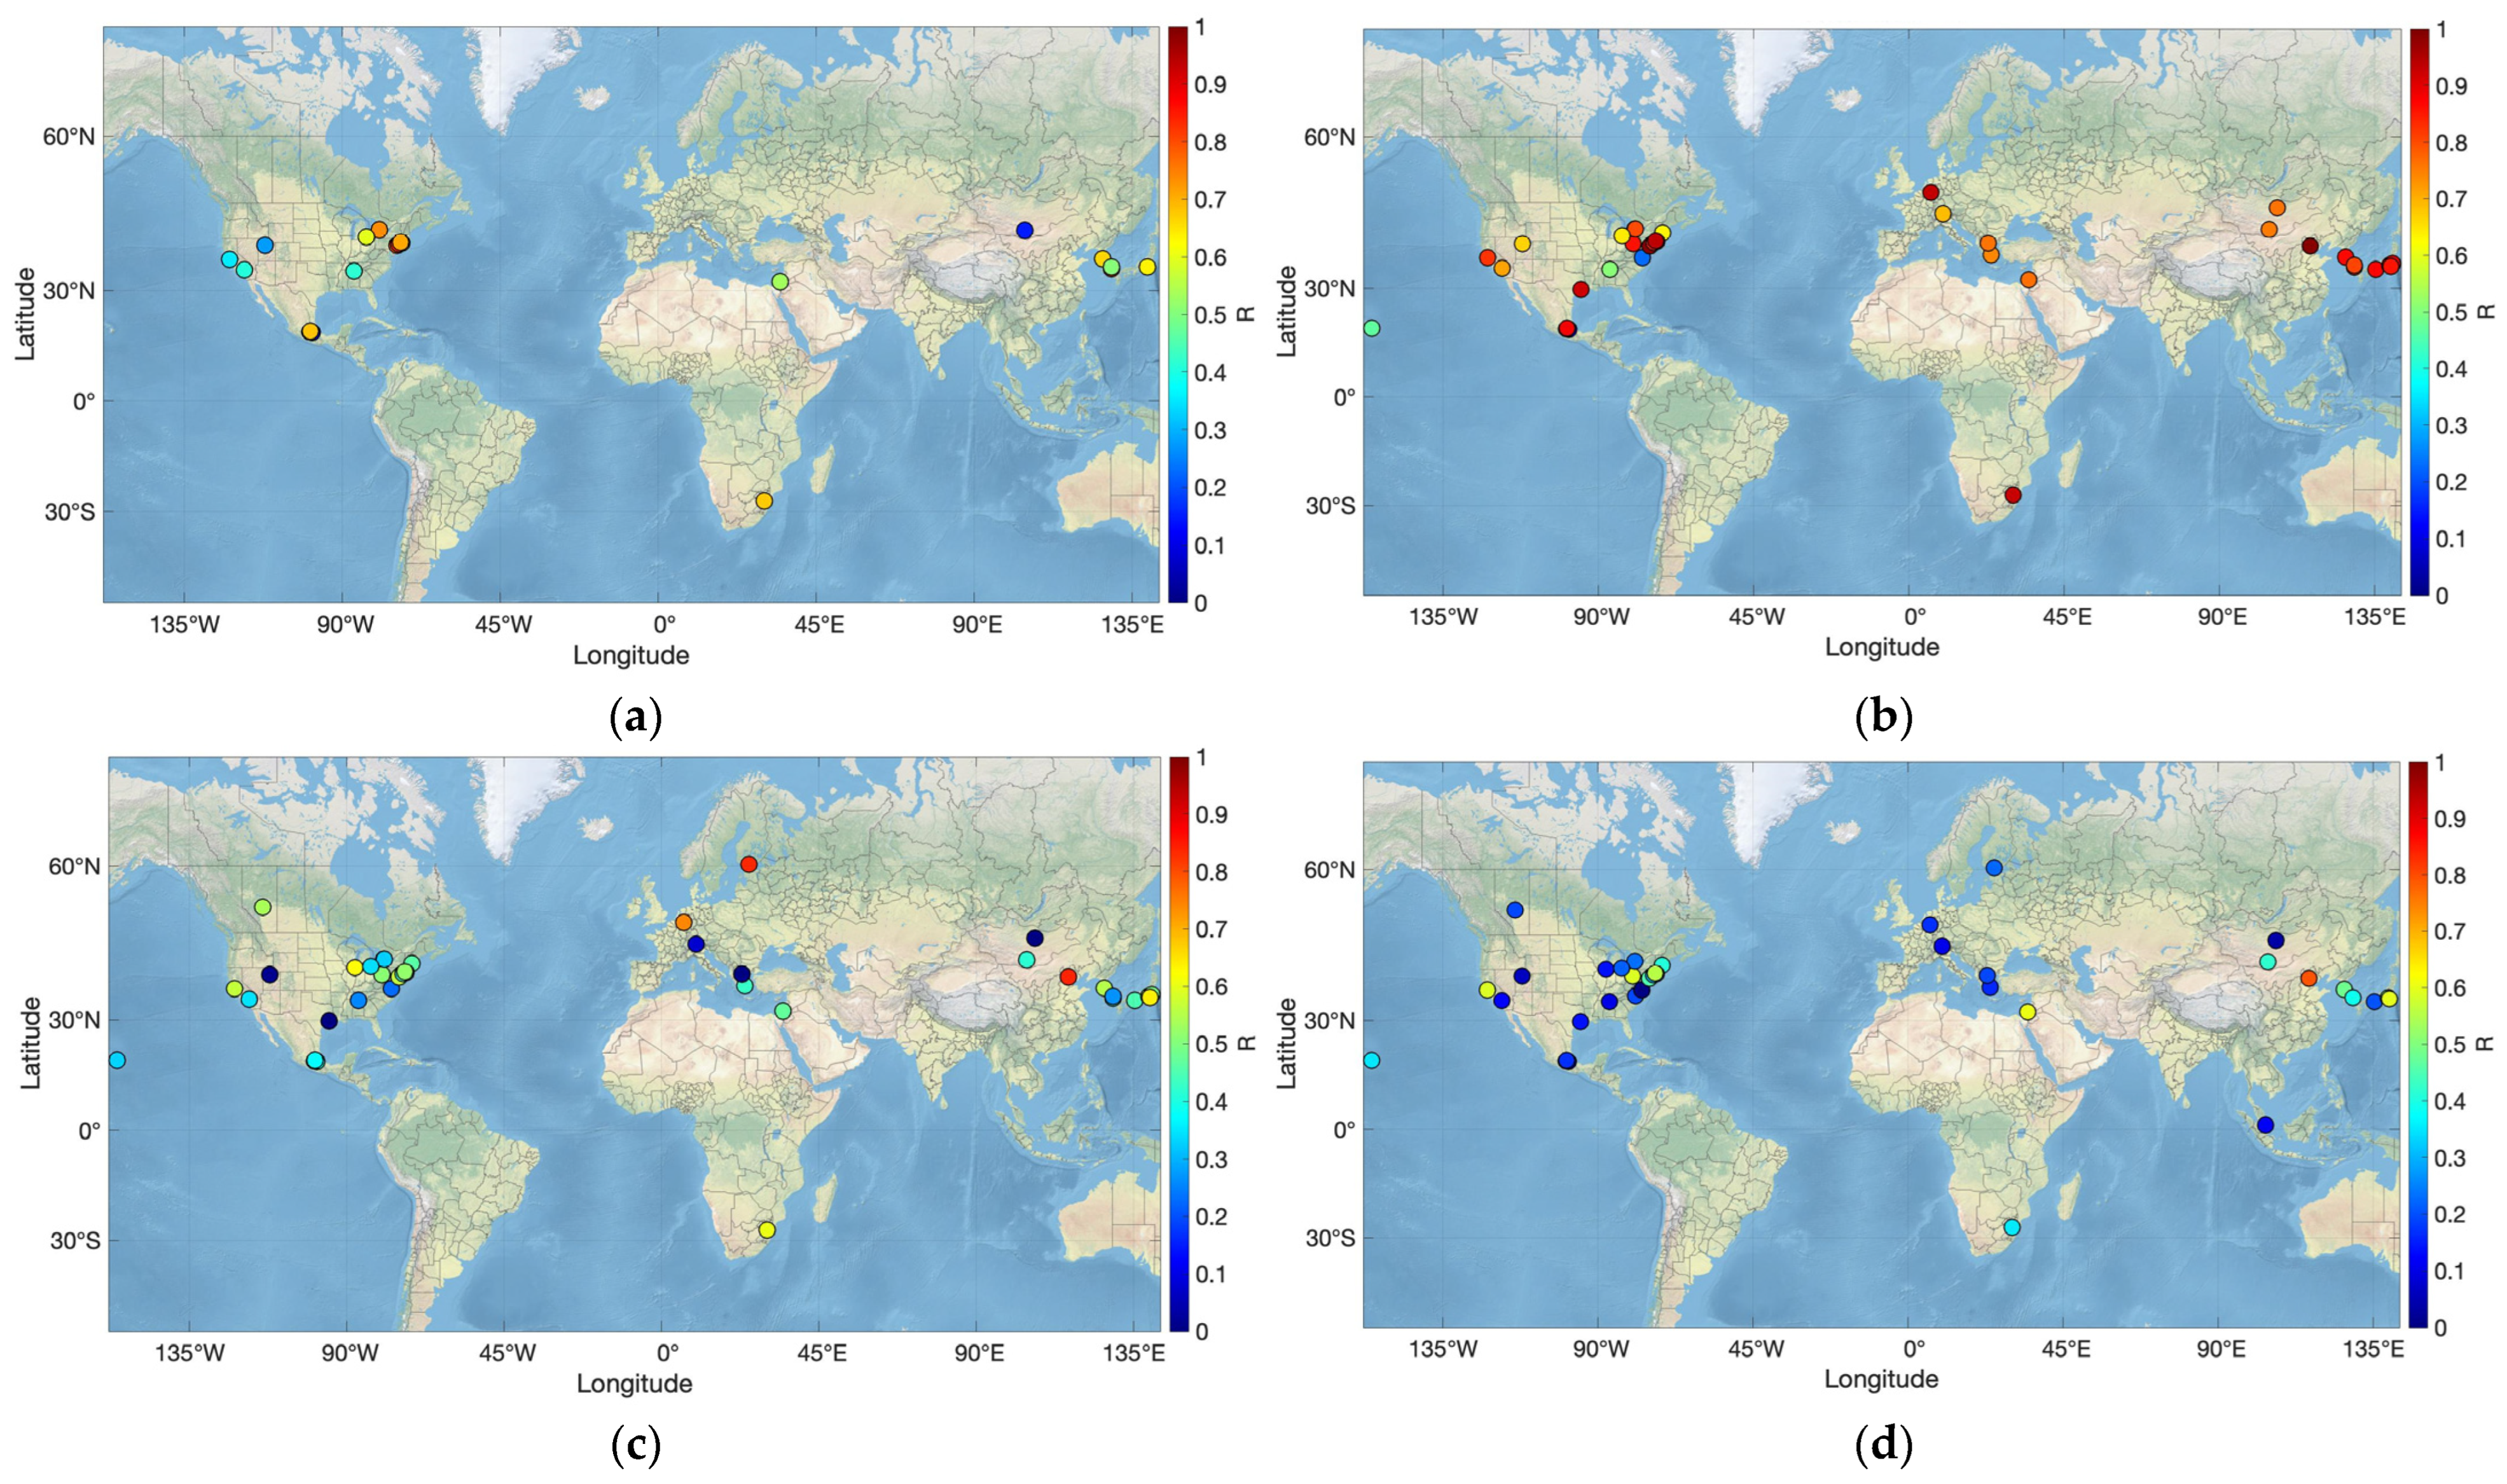
- The four TOTNO2 data sources relative to the Pandora observations generally show systematic underestimation, with negative mean bias values. Among them, TROPOMI TOTNO2 products perform best, with the highest correlation coefficient (average R = 0.88) and the smallest RMSE value (RMSE = 4.83 Pmolec·cm−2), reflecting its advantage in capturing the distribution of urban NO2 with high spatial resolution. The accuracies of the OMI and GOME-2 TOTNO2 products are comparable and intermediate. The TOTNO2 data from CAMS reanalysis shows the largest bias and RMSE (MB = −4.91 Pmolec·cm−2, RMSE = 9.15 Pmolec·cm−2), and the results are unstable in different regions, indicating a significant discrepancy between the model simulation and the ground-based observation values.
- (2)
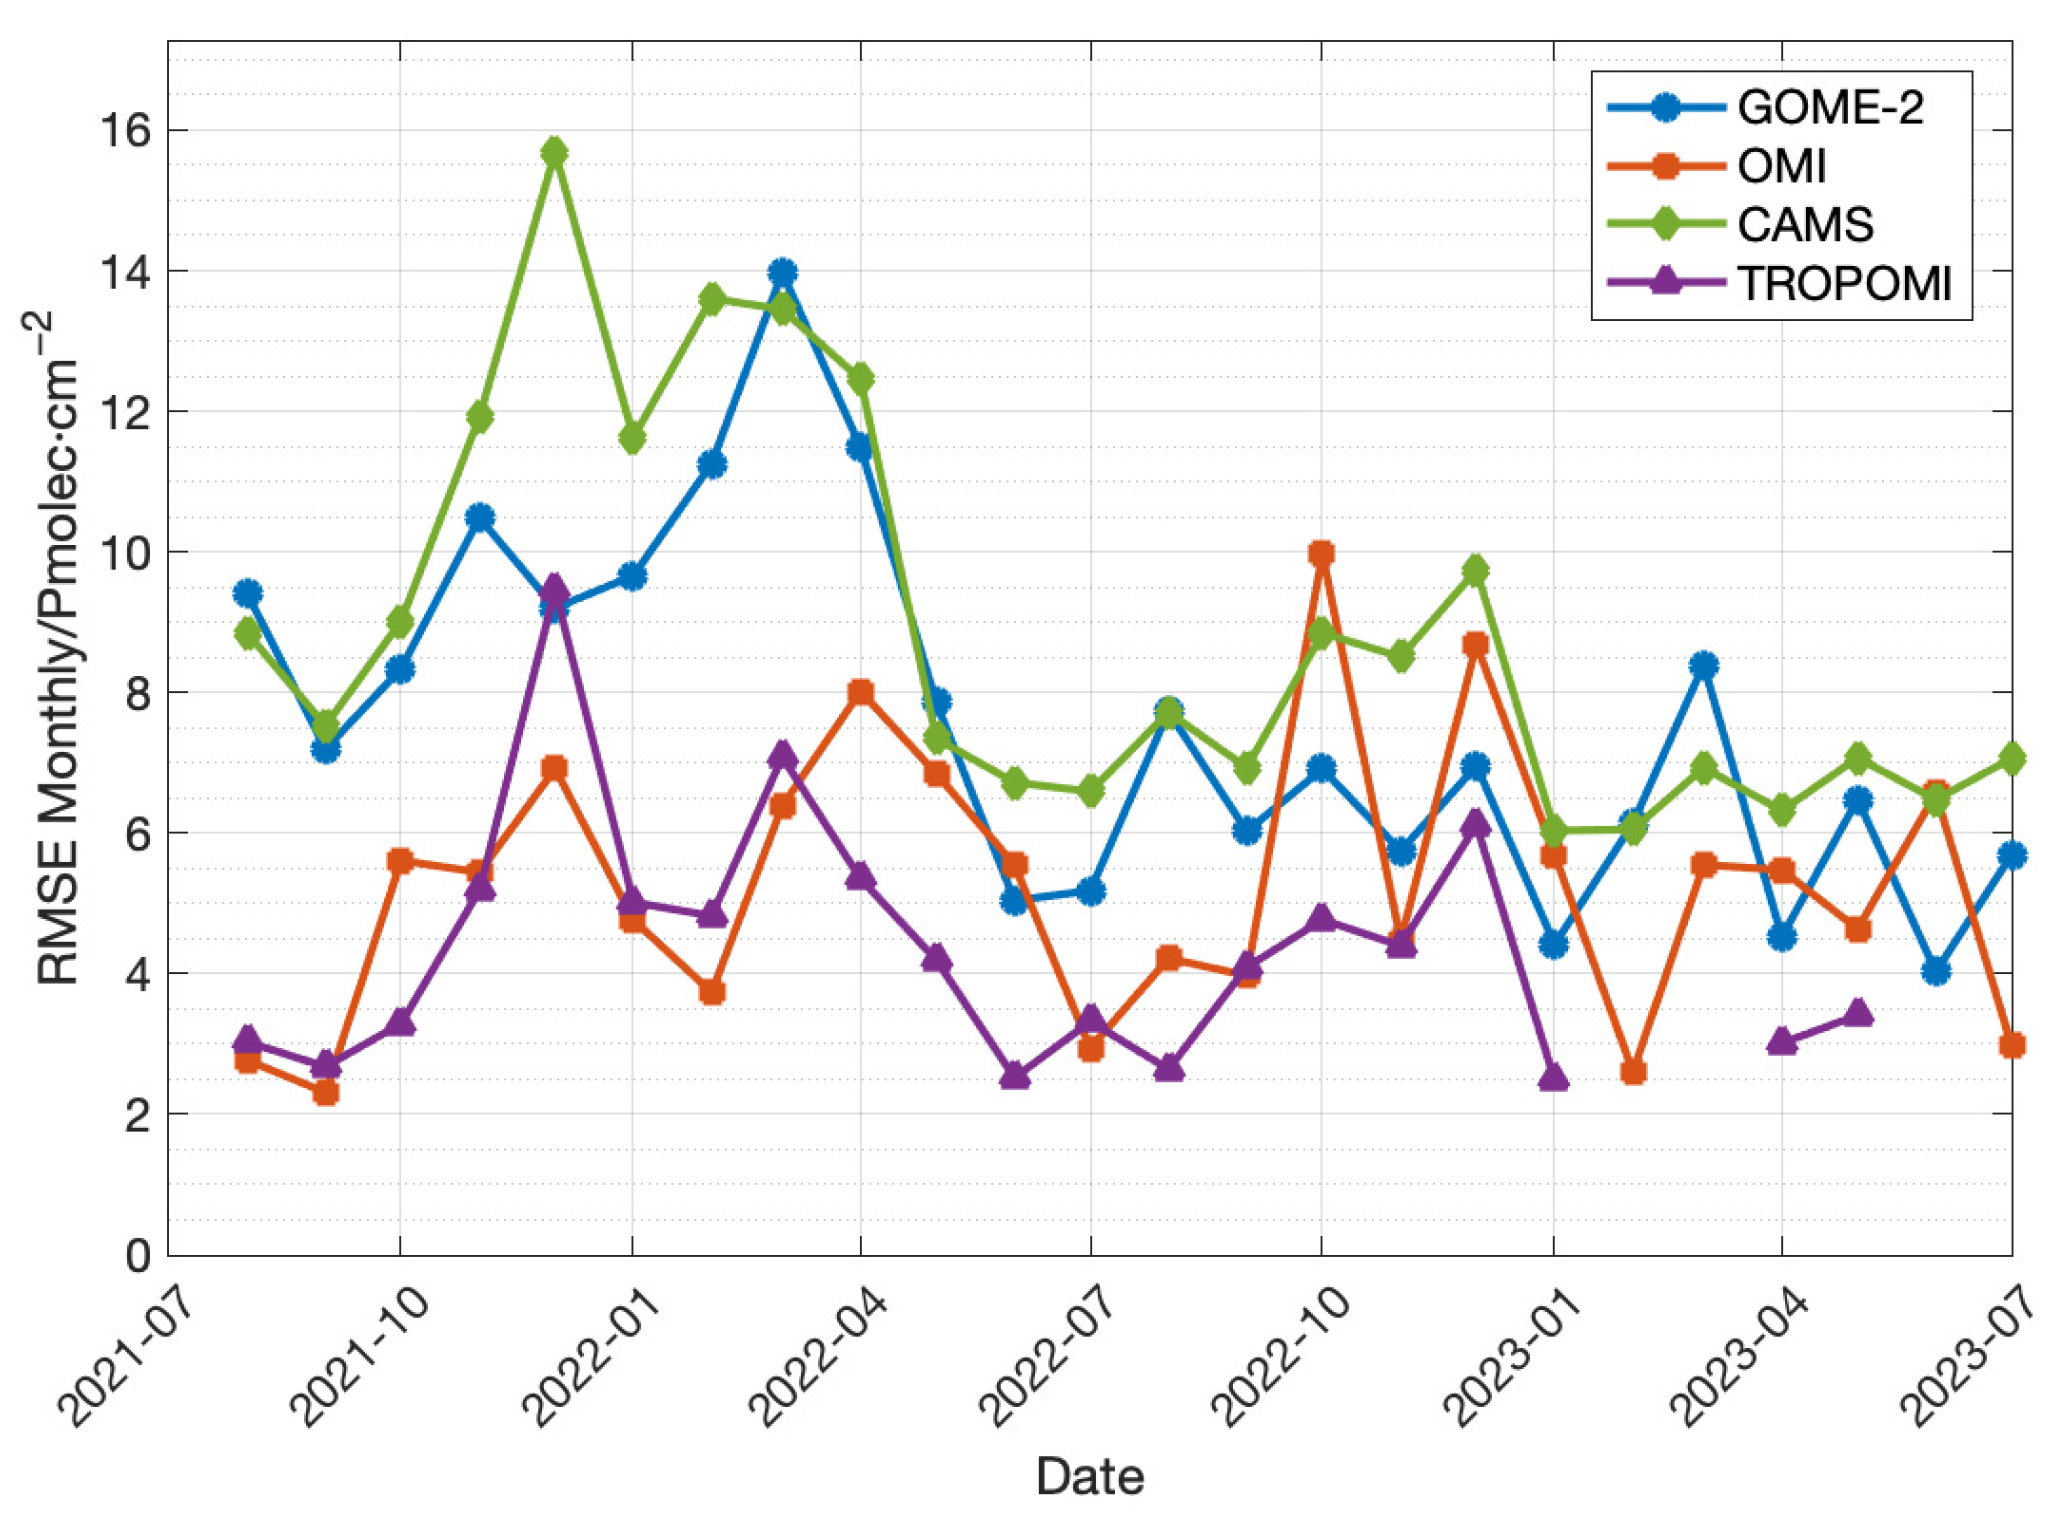
- In terms of the temporal variation characteristics, an obvious seasonality, characterized by higher TOTNO2 values in winter and lower TOTNO2 values in summer, is evident in all four TOTNO2 products, and this variation agrees well with the Pandora observation. The increase in TOTNO2 concentration in winter is primarily attributed to increased anthropogenic emissions (particularly from heating combustion), reduced photochemical loss rates, and a marked decrease in atmospheric dispersion capacity caused by adverse meteorological conditions such as temperature inversions. In summer, due to enhanced photolysis and the elevation of the boundary layer, the concentration drops to the lowest level. From the perspective of seasonal variation in TOTNO2 product accuracy, each data source has the smallest bias and the highest correlation in summer, while the RMSE and STD generally increase in autumn and winter, which may be related to the decrease in the solar elevation angle in winter and the aggravation of aerosol influence.
- (3)
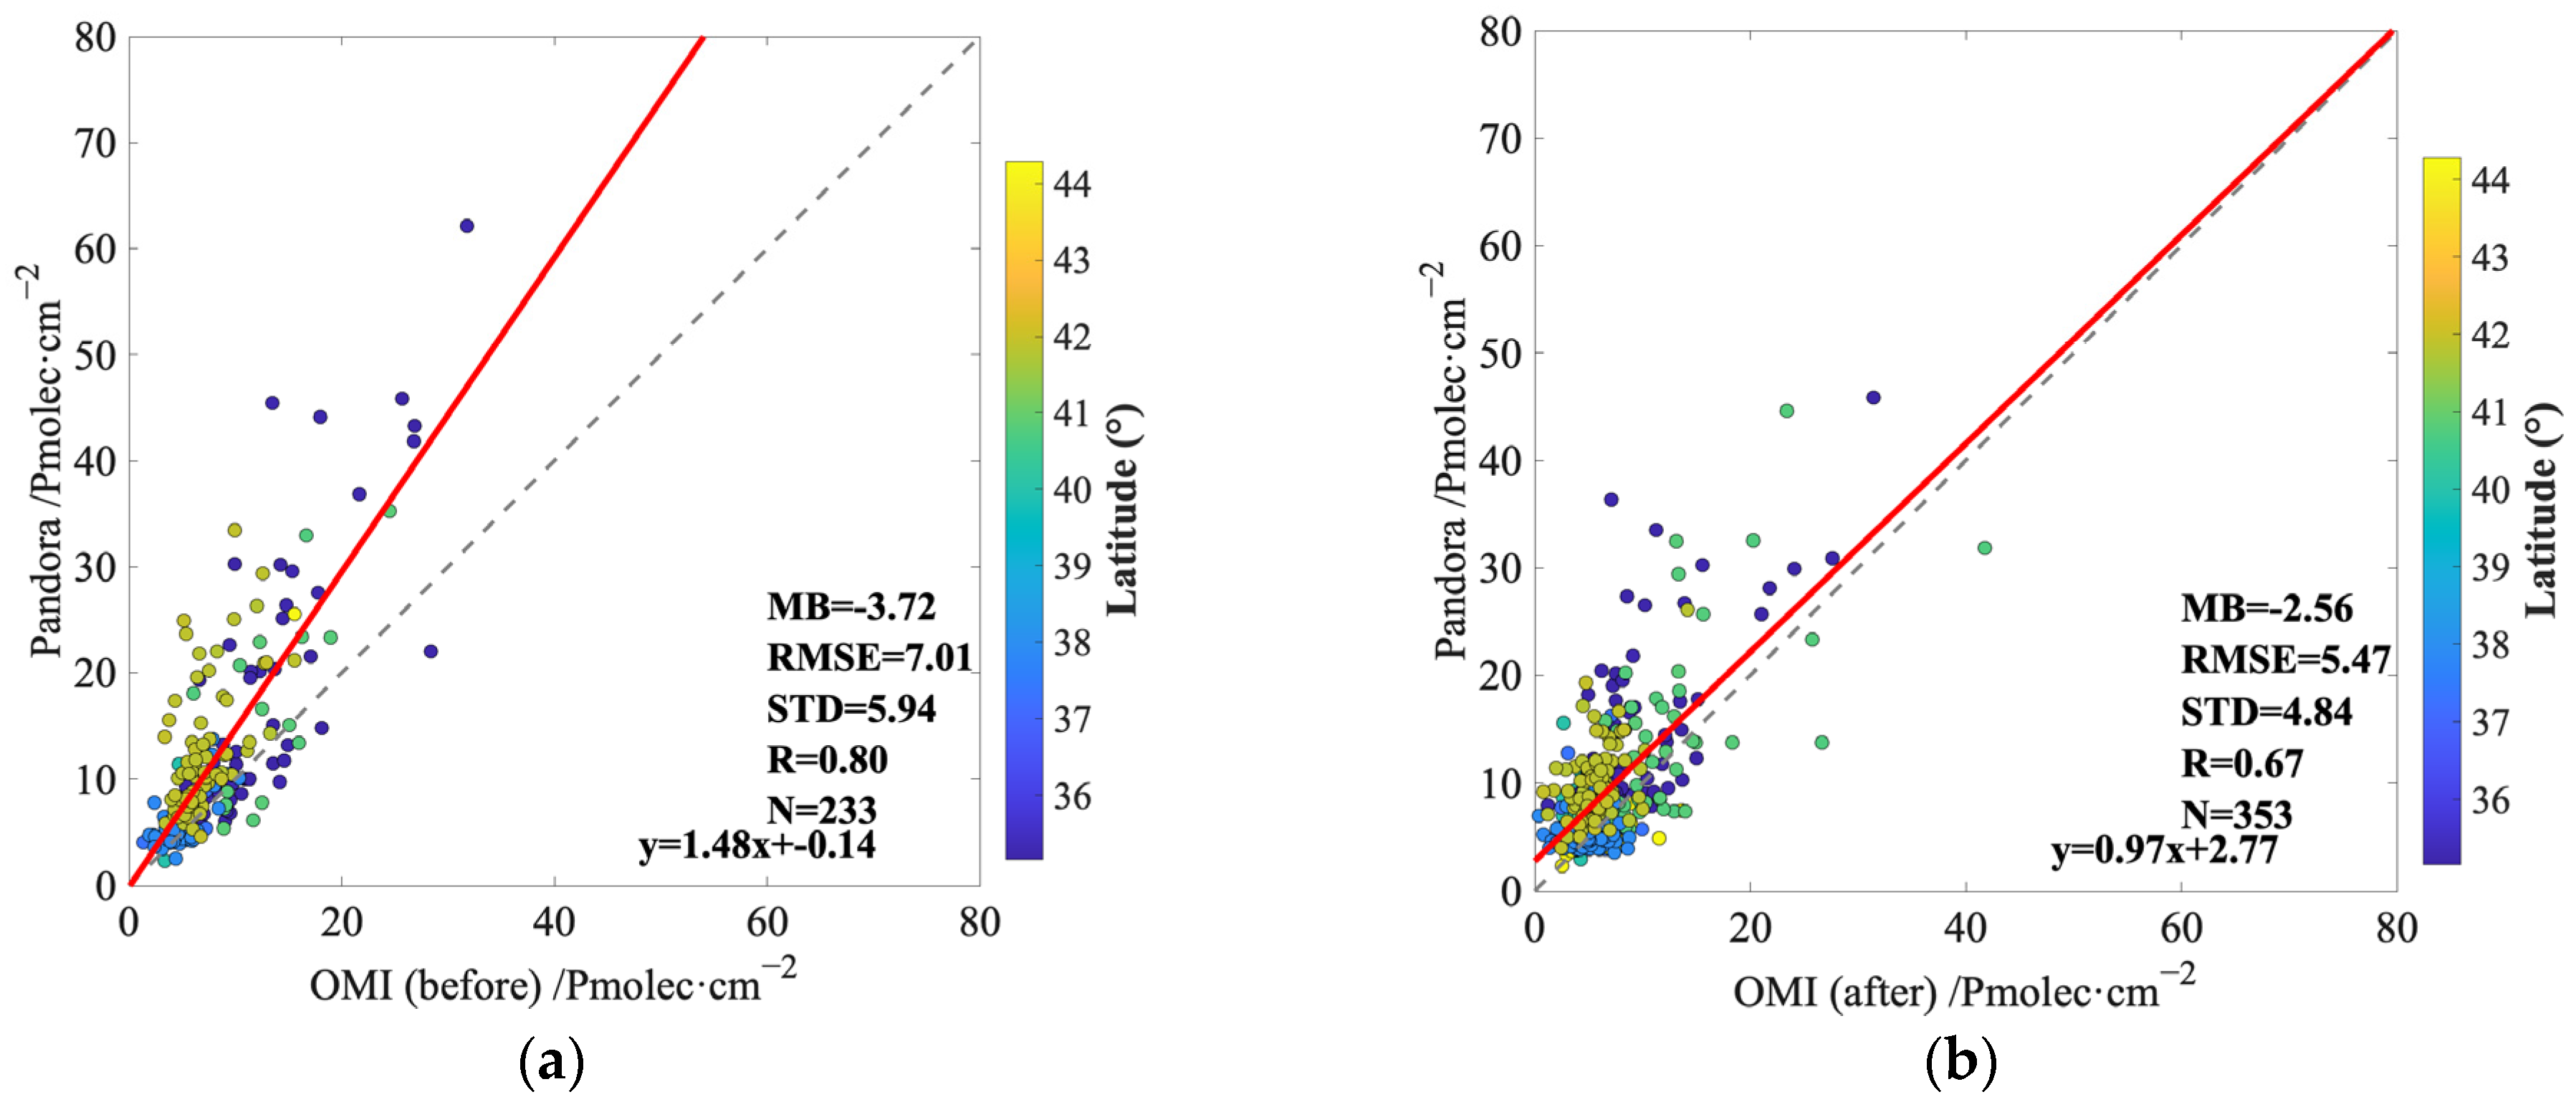
- In terms of bias correction, the correction method based on linear fitting effectively reduces the systematic bias of the four types of TOTNO2 data. After correction, the mean bias values of OMI, TROPOMI, GOME-2 and CAMS decreased by 79%, 90%, 93% and 97%, respectively, and the root mean square error values decreased by 4%, 28%, 5% and 17%, respectively. The results indicate that the systematic bias values of the four kinds of TOTNO2 products have been significantly reduced and the accuracies have significantly improved. However, the random error (STD) and correlation of the four kinds of TOTNO2 products do not change significantly. The four kinds of TOTNO2 products after correction are overall closer to the ground-based observations, providing a reliable foundation for the fusion and application of multi-source NO2 data.
Author Contributions
Funding
Data Availability Statement
Acknowledgments
Conflicts of Interest
Abbreviations
| NO2 | nitrogen dioxide |
| ERS-2 | European Remote-Sensing Satellite-2 |
| ESA | European Space Agency |
| GOME | Global Ozone Monitoring Experiment |
| ENVISAT | Environmental Satellite |
| SCIAMACHY | Scanning Imaging Absorption SpectroMeter for Atmospheric CHartographY |
| NASA | National Aeronautics and Space Administration |
| OMI | Ozone Monitoring Instrument |
| GOME-2 | Global Ozone Monitoring Experiment-2 |
| MetOp-A/B | Meteorological Operational Satellite-A/B |
| TROPOMI | Tropospheric Monitoring Instrument |
| S-5P | Sentinel-5 Precursor |
| CAMS | Copernicus Atmosphere Monitoring Service |
| SAOZ | Systeme d’Analyse par Observations Zenithales |
| TOTNO2 | total column density of NO2 |
| PGN | Pandonia Global Network |
| SZA | Solar Zenith Angle |
| O3 | ozone |
| SO2 | sulfur dioxide |
| HCHO | formaldehyde |
| CH4 | methane |
| CO | carbon monoxide |
| IASI | Infrared Atmospheric Sounding Interferometer |
| EUMETSAT | Exploitation of Meteorological Satellites |
| CAMSRA | Copernicus Atmosphere Monitoring Service Reanalysis |
| ECMWF | European Centre for Medium-Range Weather Forecasts |
| EAC4 | ECMWF’s Fourth-generation Atmospheric Composition Reanalysis |
| MB | Mean Bias |
| RMSE | Root Mean Square Error |
| STD | Standard Deviation |
| R | Correlation Coefficient |
References
- Boersma, K.F.; Eskes, H.J.; Brinksma, E.J. Error analysis for tropospheric NO2 retrieval from space. J. Geophys. Res. Atmos. 2004, 109, D04311. [Google Scholar] [CrossRef] [Scilit]
- Cheng, S.; Ma, J.; Cheng, W.; Yan, P.; Zhou, H.; Zhou, L.; Yang, P. Tropospheric NO2 vertical column densities retrieved from ground-based MAX-DOAS measurements at Shangdianzi regional atmospheric background station in China. J. Environ. Sci. 2019, 80, 186–196. [Google Scholar]
- Zhang, Y.; Wei, Y.; de Leeuw, G.; Liu, O.; Chen, Y.; Lv, Y.; Zhang, Y.; Li, Z. Relation between total vertical column density and near-surface NO2 based on in situ and Pandora ground-based remote sensing observations. Atmos. Chem. Phys. 2025, 25, 10643–10660. [Google Scholar]
- Hesterberg, T.W.; Bunn, W.B.; McClellan, R.O.; Hamade, A.K.; Long, C.M.; Valberg, P.A. Critical review of the human data on short-term nitrogen dioxide (NO2) exposures: Evidence for NO2 no-effect levels. Crit. Rev. Toxicol. 2009, 39, 743–781. [Google Scholar] [PubMed]
- Van Der A, R.; Eskes, H.; Boersma, K.; Van Noije, T.; Van Roozendael, M.; De Smedt, I.; Peters, D.; Meijer, E. Trends, seasonal variability and dominant NOx source derived from a ten year record of NO2 measured from space. J. Geophys. Res. Atmos. 2008, 113, D04302. [Google Scholar] [CrossRef] [Scilit]
- Alberts, W.M. Indoor air pollution: NO, NO2, CO, and CO2. J. Allergy Clin. Immunol. 1994, 94, 289–295. [Google Scholar] [CrossRef] [Scilit] [PubMed]
- Lamsal, L.N.; Krotkov, N.A.; Celarier, E.A.; Swartz, W.H.; Pickering, K.E.; Bucsela, E.J.; Gleason, J.F.; Martin, R.V.; Philip, S.; Irie, H.; et al. Evaluation of OMI operational standard NO2 column retrievals using in situ and surface-based NO2 observations. Atmos. Chem. Phys. 2014, 14, 11587–11609. [Google Scholar] [CrossRef] [Scilit]
- Douros, J.; Eskes, H.; van Geffen, J.; Boersma, K.F.; Compernolle, S.; Pinardi, G.; Blechschmidt, A.-M.; Peuch, V.-H.; Colette, A.; Veefkind, P. Comparing Sentinel-5P TROPOMI NO2 column observations with the CAMS regional air quality ensemble. Geosci. Model Dev. 2022, 2022, 509–534. [Google Scholar] [CrossRef] [Scilit]
- Di Bernardino, A.; Mevi, G.; Iannarelli, A.M.; Falasca, S.; Cede, A.; Tiefengraber, M.; Casadio, S. Temporal variation of NO2 and O3 in Rome (Italy) from Pandora and in situ measurements. Atmosphere 2023, 14, 594. [Google Scholar] [CrossRef] [Scilit]
- Burrows, J.P.; Weber, M.; Buchwitz, M.; Rozanov, V.; Ladstätter-Weißenmayer, A.; Richter, A.; DeBeek, R.; Hoogen, R.; Bramstedt, K.; Eichmann, K.-U.; et al. The global ozone monitoring experiment (GOME): Mission concept and first scientific results. J. Atmos. Sci. 1999, 56, 151–175. [Google Scholar] [CrossRef] [Scilit]
- Bracher, A.; Bovensmann, H.; Bramstedt, K.; Burrows, J.; Von Clarmann, T.; Eichmann, K.-U.; Fischer, H.; Funke, B.; Gil-López, S.; Glatthor, N.; et al. Cross comparisons of O3 and NO2 measured by the atmospheric ENVISAT instruments GOMOS, MIPAS, and SCIAMACHY. Adv. Space Res. 2005, 36, 855–867. [Google Scholar] [CrossRef] [Scilit]
- Garane, K.; Koukouli, M.-E.; Verhoelst, T.; Lerot, C.; Heue, K.-P.; Fioletov, V.; Balis, D.; Bais, A.; Bazureau, A.; Dehn, A.; et al. TROPOMI/S5P total ozone column data: Global ground-based validation and consistency with other satellite missions. Atmos. Meas. Tech. 2019, 12, 5263–5287. [Google Scholar]
- Argyrouli, A.; Lutz, R.; Romahn, F.; Molina García, V.; Loyola, D.; Seo, S.; Valks, P.; De Smedt, I.; Boersma, F.; Tilstra, L.G.; et al. Comparison of Cloud Parameters from GOME-2 and Assessment of Cloud Impact on Tropospheric NO2 and HCHO Retrievals. Environ. Sci. Proc. 2023, 26, 203. [Google Scholar] [CrossRef] [Scilit]
- Cersosimo, A.; Serio, C.; Masiello, G. TROPOMI NO2 tropospheric column data: Regridding to 1 km grid-resolution and assessment of their consistency with in situ surface observations. Remote Sens. 2020, 12, 2212. [Google Scholar] [CrossRef] [Scilit]
- Inness, A.; Flemming, J.; Heue, K.-P.; Lerot, C.; Loyola, D.; Ribas, R.; Valks, P.; Van Roozendael, M.; Xu, J.; Zimmer, W. Monitoring and assimilation tests with TROPOMI data in the CAMS system: Near-real-time total column ozone. Atmos. Chem. Phys. 2019, 19, 3939–3962. [Google Scholar]
- Zhang, Y.; Shi, M.; Chen, J.; Fu, S.; Wang, H. Spatiotemporal variations of NO2 and its driving factors in the coastal ports of China. Sci. Total Environ. 2023, 871, 162041. [Google Scholar] [CrossRef] [Scilit] [PubMed]
- Ma, C.; Ju, T.; Wang, Q.; Li, F.; Zhang, Y.; Zhang, G. Spatiotemporal variations of tropospheric NO2 in Lanzhou for the period 2009–2018 based on satellite remote sensing. Atmos. Pollut. Res. 2021, 12, 206–216. [Google Scholar] [CrossRef] [Scilit]
- Wang, C.; Wang, T.; Wang, P. The spatial–temporal variation of tropospheric NO2 over China during 2005 to 2018. Atmosphere 2019, 10, 444. [Google Scholar] [CrossRef] [Scilit]
- Zhao, Z.; Lu, Y.; Zhan, Y.; Cheng, Y.; Yang, F.; Brook, J.R.; He, K. Long-term spatiotemporal variations in surface NO2 for Beijing reconstructed from surface data and satellite retrievals. Sci. Total Environ. 2023, 904, 166693. [Google Scholar] [CrossRef] [Scilit] [PubMed]
- Judd, L.M.; Al-Saadi, J.A.; Szykman, J.J.; Valin, L.C.; Janz, S.J.; Kowalewski, M.G.; Eskes, H.J.; Veefkind, J.P.; Cede, A.; Mueller, M.; et al. Evaluating Sentinel-5P TROPOMI tropospheric NO2 column densities with airborne and Pandora spectrometers near New York City and Long Island Sound. Atmos. Meas. Tech. 2020, 13, 6113–6140. [Google Scholar] [CrossRef] [Scilit] [PubMed]
- Herman, J.; Abuhassan, N.; Kim, J.; Kim, J.; Dubey, M.; Raponi, M.; Tzortziou, M. Underestimation of column NO2 amounts from the OMI satellite compared to diurnally varying ground-based retrievals from multiple PANDORA spectrometer instruments. Atmos. Meas. Tech. 2019, 12, 5593–5612. [Google Scholar] [CrossRef] [Scilit]
- Celarier, E.A.; Brinksma, E.J.; Gleason, J.F.; Veefkind, J.P.; Cede, A.; Herman, J.R.; Ionov, D.; Goutail, F.; Pommereau, J.-P.; Lambert, J.-C.; et al. Validation of Ozone Monitoring Instrument nitrogen dioxide columns. J. Geophys. Res. Atmos. 2008, 113, D15S15. [Google Scholar] [CrossRef] [Scilit]
- Peters, E.; Wittrock, F.; Großmann, K.; Frieß, U.; Richter, A.; Burrows, J. Formaldehyde and nitrogen dioxide over the remote western Pacific Ocean: SCIAMACHY and GOME-2 validation using ship-based MAX-DOAS observations. Atmos. Chem. Phys. 2012, 12, 11179–11197. [Google Scholar]
- Wang, Y.; Beirle, S.; Lampel, J.; Koukouli, M.; De Smedt, I.; Theys, N.; Li, A.; Wu, D.; Xie, P.; Liu, C.; et al. Validation of OMI, GOME-2A and GOME-2B tropospheric NO2, SO2 and HCHO products using MAX-DOAS observations from 2011 to 2014 in Wuxi, China: Investigation of the effects of priori profiles and aerosols on the satellite products. Atmos. Chem. Phys. 2017, 17, 5007–5033. [Google Scholar]
- Pinardi, G.; Lambert, J.; Granville, J.; Roozendael, M.; Delcloo, A.; Backer, H.; Valks, P.; Hao, N. Overview of the validation of GOME-2 total and tropospheric NO2 columns. In Proceedings of the EUMETSAT Meteorological Satellite Conference, Córdoba, Spain, 20–24 September 2010. [Google Scholar]
- Gruzdev, A.N.; Elokhov, A.S. Validation of Ozone Monitoring Instrument NO2 measurements using ground based NO2 measurements at Zvenigorod, Russia. Int. J. Remote Sens. 2010, 31, 497–511. [Google Scholar] [CrossRef] [Scilit]
- Ghahremanloo, M.; Nowlan, C.; Abad, G.G.; Garraffo, C.; Liu, X.; Wang, H.; Henderson, B.; Baumann, E.; Valin, L.; Geddes, J.A.; et al. Comprehensive Analysis of Bias in TEMPO NO2 Column Densities Through Pandora Observations. J. Geophys. Res. Atmos. 2025, 130, e2025JD044150. [Google Scholar] [CrossRef] [Scilit] [PubMed]
- Liu, O.; Li, Z.; Lin, Y.; Fan, C.; Zhang, Y.; Li, K.; Zhang, P.; Wei, Y.; Chen, T.; Dong, J.; et al. Evaluation of the first year of Pandora NO2 measurements over Beijing and application to satellite validation. Atmos. Meas. Tech. 2024, 17, 377–395. [Google Scholar] [CrossRef] [Scilit]
- Herman, J.; Cede, A.; Spinei, E.; Mount, G.; Tzortziou, M.; Abuhassan, N. NO2 column amounts from ground-based Pandora and MFDOAS spectrometers using the direct-sun DOAS technique: Intercomparisons and application to OMI validation. J. Geophys. Res. Atmos. 2009, 114, D13307. [Google Scholar]
- Reed, A.J.; Thompson, A.M.; Kollonige, D.E.; Martins, D.K.; Tzortziou, M.A.; Herman, J.R.; Berkoff, T.A.; Abuhassan, N.K.; Cede, A. Effects of local meteorology and aerosols on ozone and nitrogen dioxide retrievals from OMI and pandora spectrometers in Maryland, USA during DISCOVER-AQ 2011. J. Atmos. Chem. 2015, 72, 455–482. [Google Scholar] [PubMed]
- Duncan, B.N.; Yoshida, Y.; de Foy, B.; Lamsal, L.N.; Streets, D.G.; Lu, Z.; Pickering, K.E.; Krotkov, N.A. The observed response of Ozone Monitoring Instrument (OMI) NO2 columns to NOx emission controls on power plants in the United States: 2005–2011. Atmos. Environ. 2013, 81, 102–111. [Google Scholar] [CrossRef] [Scilit]
- Vinken, G.C.M.; Boersma, K.F.; Maasakkers, J.D.; Adon, M.; Martin, R.V. Worldwide biogenic soil NOx emissions inferred from OMI NO2 observations. Atmos. Chem. Phys. 2014, 14, 10363–10381. [Google Scholar] [CrossRef] [Scilit]
- Lamsal, L.N.; Krotkov, N.A.; Vasilkov, A.; Marchenko, S.; Qin, W.; Yang, E.-S.; Fasnacht, Z.; Joiner, J.; Choi, S.; Haffner, D. OMI/aura nitrogen dioxide standard product with improved surface and cloud treatments. Atmos. Meas. Tech. Discuss. 2020, 2020, 1–56. [Google Scholar] [CrossRef] [Scilit]
- Goldberg, D.L.; Anenberg, S.C.; Kerr, G.H.; Mohegh, A.; Lu, Z.; Streets, D.G. TROPOMI NO2 in the United States: A Detailed Look at the Annual Averages, Weekly Cycles, Effects of Temperature, and Correlation With Surface NO2 Concentrations. Earths Future 2021, 9, e2020EF001665. [Google Scholar] [CrossRef] [Scilit] [PubMed]
- Veefkind, J.P.; Aben, I.; McMullan, K.; Förster, H.; De Vries, J.; Otter, G.; Claas, J.; Eskes, H.J.; De Haan, J.F.; Kleipool, Q.; et al. TROPOMI on the ESA Sentinel-5 Precursor: A GMES mission for global observations of the atmospheric composition for climate, air quality and ozone layer applications. Remote Sens. Environ. 2012, 120, 70–83. [Google Scholar] [CrossRef] [Scilit]
- Inness, A.; Ades, M.; Agustí-Panareda, A.; Barré, J.; Benedictow, A.; Blechschmidt, A.-M.; Dominguez, J.J.; Engelen, R.; Eskes, H.; Flemming, J.; et al. The CAMS reanalysis of atmospheric composition. Atmos. Chem. Phys. 2019, 19, 3515–3556. [Google Scholar] [CrossRef] [Scilit]
- Clerbaux, C.; Boynard, A.; Clarisse, L.; George, M.; Hadji-Lazaro, J.; Herbin, H.; Hurtmans, D.; Pommier, M.; Razavi, A.; Turquety, S.; et al. Monitoring of atmospheric composition using the thermal infrared IASI/MetOp sounder. Atmos. Chem. Phys. 2009, 9, 6041–6054. [Google Scholar]
- Peuch, V.-H.; Engelen, R.; Rixen, M.; Dee, D.; Flemming, J.; Suttie, M.; Ades, M.; Agustí-Panareda, A.; Ananasso, C.; Andersson, E.; et al. The copernicus atmosphere monitoring service: From research to operations. Bull. Am. Meteorol. Soc. 2022, 103, E2650–E2668. [Google Scholar] [CrossRef] [Scilit]
- Flemming, J.; Benedetti, A.; Inness, A.; Engelen, R.J.; Jones, L.; Huijnen, V.; Remy, S.; Parrington, M.; Suttie, M.; Bozzo, A.; et al. The CAMS interim reanalysis of carbon monoxide, ozone and aerosol for 2003–2015. Atmos. Chem. Phys. 2017, 17, 1945–1983. [Google Scholar] [CrossRef] [Scilit]
- Kleipool, Q.; Rozemeijer, N.; van Hoek, M.; Leloux, J.; Loots, E.; Ludewig, A.; van der Plas, E.; Adrichem, D.; Harel, R.; Spronk, S.; et al. Ozone Monitoring Instrument (OMI) collection 4: Establishing a 17-year-long series of detrended level-1b data. Atmos. Meas. Tech. 2022, 15, 3527–3553. [Google Scholar]





| Type | Instrument | Data Version | Spatial Resolution/km | Time Resolution | Time Range |
|---|---|---|---|---|---|
| Ground-based | Pandora | - | - | 2 min | 2010–present |
| Satellite observation | OMI | MINDS v1.1 | 13 × 24 | 98.8 min | 1 October 2004–1 January 2025 |
| TROPOMI | HiR v2 | 3.5 × 5.5 | 1 d | 13 October 2017–present | |
| GOME-2 | TM4-NO2A v 2.3 | 80 × 40 | 1 d | 17 September 2012–10 January 2024 | |
| CAMS reanalysis | - | EAC4 v2 | 80 × 80 | 3 h | 1 December 2003–31 December 2024 |
| Month | GOME-2 | OMI | CAMS | TROPOMI |
|---|---|---|---|---|
| 2021-08 | 219 | 23 | 1190 | 155 |
| 2021-09 | 258 | 16 | 1141 | 179 |
| 2021-10 | 246 | 19 | 909 | 138 |
| 2021-11 | 304 | 25 | 817 | 169 |
| 2021-12 | 204 | 16 | 553 | 153 |
| 2022-01 | 111 | 26 | 580 | 133 |
| 2022-02 | 207 | 28 | 709 | 112 |
| 2022-03 | 195 | 29 | 812 | 115 |
| 2022-04 | 203 | 19 | 833 | 96 |
| 2022-05 | 164 | 37 | 1040 | 93 |
| 2022-06 | 139 | 43 | 1077 | 80 |
| 2022-07 | 168 | 29 | 1110 | 90 |
| 2022-08 | 174 | 25 | 1087 | 133 |
| 2022-09 | 207 | 23 | 1002 | 165 |
| 2022-10 | 231 | 36 | 895 | 180 |
| 2022-11 | 192 | 20 | 710 | 157 |
| 2022-12 | 106 | 50 | 517 | 121 |
| 2023-01 | 80 | 9 | 293 | 48 |
| 2023-02 | 40 | 13 | 338 | 0 |
| 2023-03 | 94 | 24 | 373 | 0 |
| 2023-04 | 81 | 32 | 443 | 67 |
| 2023-05 | 129 | 63 | 662 | 68 |
| 2023-06 | 90 | 29 | 597 | 0 |
| 2023-07 | 89 | 42 | 657 | 0 |
| Type | Bias Correction | MD /Pmolec·cm−2 | RMSE /Pmolec·cm−2 | STD /Pmolec·cm−2 | R |
|---|---|---|---|---|---|
| OMI | Before correction | −1.06 | 5.05 | 4.77 | 0.74 |
| After correction | 0.22 | 4.87 | 4.70 | 0.74 | |
| TROPOMI | Before correction | −1.57 | 4.70 | 4.43 | 0.91 |
| After correction | −0.16 | 3.38 | 3.38 | 0.91 | |
| GOME-2 | Before correction | −2.40 | 7.87 | 7.50 | 0.51 |
| After correction | 0.16 | 7.50 | 7.50 | 0.51 | |
| CAMS | Before correction | −4.77 | 8.88 | 7.49 | 0.31 |
| After correction | 0.14 | 7.36 | 7.35 | 0.31 |
Disclaimer/Publisher’s Note: The statements, opinions and data contained in all publications are solely those of the individual author(s) and contributor(s) and not of MDPI and/or the editor(s). MDPI and/or the editor(s) disclaim responsibility for any injury to people or property resulting from any ideas, methods, instructions or products referred to in the content. |
© 2026 by the authors. Licensee MDPI, Basel, Switzerland. This article is an open access article distributed under the terms and conditions of the Creative Commons Attribution (CC BY) license.
Share and Cite
Wang, S.; Guo, Y.; Zhang, J.; Zhao, A.; Xu, Y.; Wang, D. Global Accuracy Comparison from Multi-Source NO2 Products Based on Pandora Observations. Remote Sens. 2026, 18, 2072. https://doi.org/10.3390/rs18132072
Wang S, Guo Y, Zhang J, Zhao A, Xu Y, Wang D. Global Accuracy Comparison from Multi-Source NO2 Products Based on Pandora Observations. Remote Sensing. 2026; 18(13):2072. https://doi.org/10.3390/rs18132072
Chicago/Turabian StyleWang, Shuaimin, Yu Guo, Jiajia Zhang, Anzhou Zhao, Yujing Xu, and Dongli Wang. 2026. "Global Accuracy Comparison from Multi-Source NO2 Products Based on Pandora Observations" Remote Sensing 18, no. 13: 2072. https://doi.org/10.3390/rs18132072
APA StyleWang, S., Guo, Y., Zhang, J., Zhao, A., Xu, Y., & Wang, D. (2026). Global Accuracy Comparison from Multi-Source NO2 Products Based on Pandora Observations. Remote Sensing, 18(13), 2072. https://doi.org/10.3390/rs18132072