


Highlights
- ICESat-2 ATL08 canopy height metrics demonstrated strong agreement with corresponding airborne LiDAR height measurements with improved performance at 20 m sub-segment scale compared to 100 m segment scale.
- Hurricane-driven structural changes were detected from multi-temporal ICESat-2 observations, with the greatest canopy height reduction in tall canopy (20–30 m) and evidence of regeneration for shorter canopy classes (0–10 m).
- Repeat ICESat-2 ground tracks enable the monitoring of structural changes associated with disturbances such as hurricanes.
Abstract
Forests worldwide are impacted by tropical cyclones which alter their structure and ecological functions. In this study, we investigated repeat track data from ICESat-2’s (Ice, Cloud and land Elevation Satellite-2’s) land and vegetation height product (ATL08) to quantify structural changes in forests, with a focus on coastal forests in Alabama and Florida affected by Hurricane Sally (2020). We evaluated pre-hurricane ATL08 along-track canopy estimates at the ATL08 100 m segment scale and 20 m sub-segment scale and quantified structural canopy changes using exact pre- and post-repeated tracks. Results demonstrated strong agreement between ATL08’s 98th percentile canopy height (RH98) and reference airborne LiDAR-derived RH98 at both spatial scales, with improved performance at the 20 m sub-segment scale (mean bias: −1.16 m; MAE: 2.28 m; RMSE: 3.44 m; r: 0.80). Samples over evergreen forests provided reduced bias (−2 m to −0.55 m), reduced RMSE (4.02 m to 2.96 m), and improved correlation (0.77 to 0.83) than woody wetlands for canopy height acquisition. Post-hurricane analyses revealed height reductions in tall canopy (20–30 m) of 1.51 m, while smaller trees (0–10 m) increased by 0.77 m, reflecting growth. Overall, findings highlight ICESat-2’s ability to monitor canopy height changes and offer prospects for integrating ICESat-2 data for damage assessments.
1. Introduction
Natural disturbances such as fires, storms, and hurricanes can have a significant and far-reaching impact on forest ecosystems, altering age, composition, and structure [1,2,3]. Hurricanes adversely affect forest health, reduce tree diversity, and disrupt successional trajectories [4], leading to long-term carbon loss and ecosystem degradation [5]. Cyclonic wind-induced damage is particularly common in coastal regions of the United States (US), especially in the southern states due to their proximity to hurricane-prone waters and prevailing climatic conditions [6]. In the southeastern US, hurricanes frequently damage economically valuable forests. For instance, Hurricane Ivan (2004) caused approximately $610 million in timber damage in Alabama, Hurricane Irma (2017) caused an estimated $1.3 billion in timber damage in Alabama, and Hurricane Michael (2018) led to approximately $ 1.3 billion in timber damage in Florida and approximately $763 million in Georgia [6,7,8].
High-frequency and high-intensity hurricanes can cause multiple types of structural forest damage. Forest structure is defined as the three-dimensional organization of canopy vertical structure (canopy height), as well as horizontal distribution of tree crown (canopy cover) [9]. Immediate canopy damage occurs in the form of branch breakage, twisted trunks, uproots, defoliation, and wounds [10], while prolonged damage may manifest as waterlogging, increased pathogenic activity, and fires, leading to root mortality, regeneration loss, and overall tree mortality [5]. Understanding these structural changes is crucial for projecting future recovery trajectories, estimating ecosystem values, and implementing sustainable forest management strategies [11,12,13]. Canopy height and canopy cover are key indicators of forest health and productivity. Forest canopy height in particular is a strong proxy for characterizing forest structure as it reflects the vertical distribution of biomass which is critical to determine forest maturity, productivity and ecosystem stability [14].
Conventional hurricane damage assessments rely on labor-intensive field surveys [15] to quantify mortality and structural damage, using measurements such as diameter at breast height (dbh) and canopy height, cover and crown density [2]. Advances in remote sensing (RS) technologies have revolutionized forest monitoring by providing broader spatial coverage and finer resolution of such variables [16]. Optical RS technologies, like multispectral imagery, have limited capability to characterize vertical forest structure, including canopy height [17,18]. Light detection and ranging (LiDAR) technologies have been increasingly applied, given capabilities to provide more precise measurements of structural forest attributes. LiDAR signals can pass through canopy cover gaps and provide three-dimensional (3D) measurements of forest structure, including canopy height, ground elevation, and canopy cover, with high precision [19,20,21].
LiDAR data are collected from terrestrial, airborne, and spaceborne platforms, each with distinct advantages and limitations. Terrestrial laser scanning (TLS) offers detailed and fine-scale accuracy (Coefficient of determination (R2) = 0.48–0.99) for measuring tree-level attributes like dbh, tree height, and stem density [20], although it is limited to small geographic areas [19]. Airborne laser scanning (ALS) also provides accurate estimates of forest canopy height (e.g., R2 = 0.80 and p < 0.000) when compared with field-measured canopy height [22]. However, for regional-scale mapping, airborne LiDAR systems present challenges, including large data volumes, high operation costs, and limited temporal and spatial coverage [21,23]. To overcome these limitations, spaceborne LiDAR technologies, capturing near-global and multi-temporal information, present opportunities for large-area damage assessments, such as those caused by hurricanes [24].
National Aeronautics and Space Administration’s (NASA) launch of the Ice, Cloud, and land Elevation Satellite (ICESat) represented the first polar-orbiting laser altimetry mission for collecting measurements over the Earth’s surface. ICESat data have been widely used for a broad range of applications, such as monitoring ice sheet elevation, estimating sea ice thickness, and characterizing vegetation structure across diverse ecosystems [25]. Notably, Dolan, et al. [26] used ICESat data to quantify structural changes from Hurricane Katrina and reported mean canopy height (MCH) changes correlated with wind intensity. However, this study was constrained by the lack of coincident pre- and post-damage LiDAR footprints, which limited its ability to comprehensively quantify structural changes.
NASA launched the second generation of the spaceborne LiDAR missions in 2018, including ICESat-2 and the Global Ecosystem Dynamics Investigation (GEDI). These missions have demonstrated significant advancements in canopy height estimation across diverse landscapes and forest types [27,28]. While the GEDI provides detailed waveform-based measurements of vegetation structure, it only operates between 51.6 degrees north and 51.6 degrees south latitudes and does not provide systematic, repeat track coverage with its non-sun-synchronous orbit of the International Space Station (ISS) [29]. ICESat-2, equipped with the Advanced Laser Altimeter System (ATLAS), features a smaller footprint (14 m in diameter versus 70 m from ICESat) [30], near-global coverage (88 degrees north to 88 degrees south latitude), and denser sampling (high-frequency measurement along track every 0.7 m, versus 170 m intervals with ICESat) [31]. Although height observations made from ICESat-2 are discrete, capabilities like narrow swath and higher sampling resolution allow ICESat-2 to capture precise measurements, making it suitable for capturing fine-scale variability and changes in forest structure [28,32,33]. In particular, the availability of repeat track observations from ICESat-2 supports direct pre- and post-disturbance hurricane assessments.
Three of four of ICESat-2’s science objectives focus on the cryosphere to understand polar ice sheet changes and sea ice thickness. As a fourth objective, ICESat-2 provides global vegetation data for understanding forests and other ecosystems globally [33]. The ATLAS onboard ICESat-2 uses a diffractive component to split a single outgoing laser into six beams: three beam pairs spaced approximately 3.3 km apart with a 90 m distance within pairs [33]. The ATLAS operates at a 532 nm (green) wavelength, at a laser repetition rate of 10 kHz (i.e., 10,000 pulses every second) [30,33]. ICESat-2 acquires data from ground tracks (GTs) associated with three strong and weak beam pairs (4:1 energy ratio) in the along-track direction [33]. Strong beams are high-energy beams that are useful for detecting surfaces with relatively low reflectance such as vegetation-covered terrain [34], and weak beams are low-energy beams useful for detecting surfaces with high reflectance such as ice sheets. ICESat-2 is specifically designed to repeat track observations for polar regions with a seasonal repeat cycle of 91 days, enabling consistent ice elevation measurements [33]. At mid-latitudes (30° to 60°) over land, ICESat-2 exhibits substantially reduced exact ground-track repeat relative to polar regions (which have a 91-day repeat cycle). This is a consequence of the instrument’s ~1.5° off-nadir pointing strategy, which sacrifices repeatability in non-polar regions in favor of increasing the spatial density of along-track measurements [30,33]. Within the Hurricane Sally damage extent, the first repeat coverage occurred from June to September 2021 for locations originally sampled between March and June 2019. The second repeat coverage took place from June to September 2022, corresponding to tracks first sampled between April and September 2020. These exact ground-track repeats provide a unique opportunity to exploit spatially coincident observations for multi-temporal detection of canopy change.
ICESat-2’s Global Geolocated Photon data product (ATL03) provides geolocation (x, y) and ellipsoidal height (z) of every photon detected by the ATLAS instrument [28]. ATL03 is the foundation for other surface-specific higher-level geophysical products, including the mission’s vegetation product: Land/Vegetation Height (ATL08). ATL08 provides users with terrain and canopy parameters at a fixed 100 m step size in the along-track direction, referred to as a segment [34]. ICESat-2’s ATL08 data have shown promising performance for vegetation mapping. Initial evaluations of ATL08 over boreal forests in Finland by Neuenschwander, et al. [35] reported a Root Mean Square Error (RMSE) of 3.2 m for canopy height when compared with ALS data. Similarly, Li, et al. [36] reported a strong correlation between ATL08 canopy height and ALS-derived height (Pearson’s correlation coefficient (r) = 0.82, mean bias = −1.46 m). Biome scale accuracy (mean bias = −1.17 m) also confirms the reliability of ATL08 for regional-scale canopy height estimation [27]. While ATL08 height validation has been conducted in prior studies [35,37], this study emphasizes ATL08’s utility to characterize hurricane-driven structural forest changes at multiple spatial scales. Furthermore, to meet this goal, this study leverages spatially repeated ATL08 track information, which is not yet fully understood for coastal forest monitoring.
With the introduction of version 5, ATL08 provides additional canopy parameters at an upscaled sub-segment size of 20 m, in addition to the standard 100 m parameters [38,39]. Prior vegetation studies suggest varying levels of accuracy of multi-scale ATL08 for acquiring height-related parameters when compared with the ALS reference datasets. For instance, Feng, et al. [40] compared the corresponding accuracies of ATL08-derived canopy height with ALS data (RMSE = 4.17 m at 100 m segment scale, RMSE = 4.75 m at 30 m scale) in North American boreal forests. On the contrary, Chen, et al. [41] reported ATL08 canopy height comparison with improved accuracy at the 30 m scale (R2 increasing from 0.49 to 0.59 and RMSE decreasing from 7.48 m to 5.51 m) compared to the 100 m segment scale using only the nighttime data. Studies have concluded that the accuracy of canopy height measurements from ICESat-2’s ATL08 is often constrained by factors such as the time of data acquisition (day vs. night), beam intensity (strong vs. weak), and topography (terrain slope, land cover type, etc.) and forest heterogeneity [42,43]. While research has provided evidence that sub-segment scale captures finer canopy height variations, this study aimed to explore the utility of each ATL08 resolution, particularly in hurricane-damaged, heterogeneous coastal forests, which are not well-examined with ICESat-2 data.
Hurricane Sally, a Category 2 storm, struck in mid-September 2020, coinciding with ICESat-2’s repeat track cycle over the affected regions [44]. This timing provides an opportunity to analyze pre- and post-disturbance changes in forest canopy structure using pre- and post-disturbance observations along the same ground tracks. The storm was recorded with maximum sustained wind speeds of 110 mph on the Saffir–Simpson Scale [45]. Sally made landfall along the coast of Alabama in the southeastern United States, causing widespread wind, storm surges, and freshwater flooding across coastal Alabama and traveling across the western Florida Panhandle with sustained damage [44]. In terms of forest damage, the Alabama Forestry Commission (AFC) reported a loss of 2440 acres of forested area with 79,175 tons of timber destroyed, valued at 1.5 million USD just within Baldwin County, in southern Alabama [46]. The National Oceanic and Atmospheric Administration (NOAA) reported Sally’s devastating damage within the coastal counties of Alabama and western Florida including Mobile, Baldwin, Escambia, and Santa Rosa counties as a Category 2 wind-damaged zone. The AFC and Florida Forest Service (FSS) reports focus on the forest damage in terms of monetary value, and research studies focus primarily on cyclone-induced coastal morphology changes [46]. However, studies focusing on Sally’s overall damage in terms of forest structural changes are lacking, highlighting the need for a detailed assessment of post-hurricane forest canopy dynamics.
To better understand the utility of ICESat-2 for measuring hurricane-induced changes in forests, this study was designed with the following specific objectives: (1) to evaluate ATL08’s canopy parameters (canopy height and canopy cover) at segment (100 m) and sub-segment (20 m) scales across different forest types, using coincident reference canopy estimates from airborne LiDAR data, and (2) to examine structural canopy changes using ICESat-2 data from exact repeat tracks, pre- and post-hurricane. This study serves to provide a comprehensive approach to inform the utility of ICESat-2’s ATL08 for change detection and damage assessment.
2. Materials and Methods
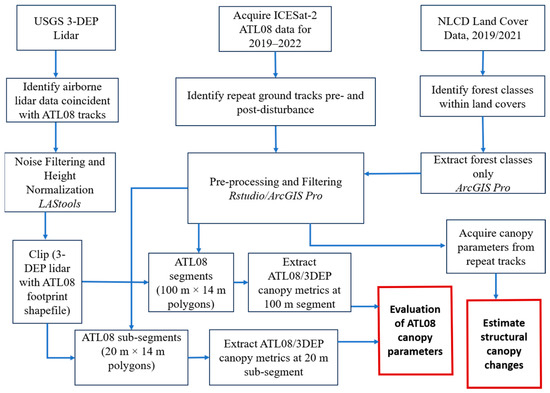
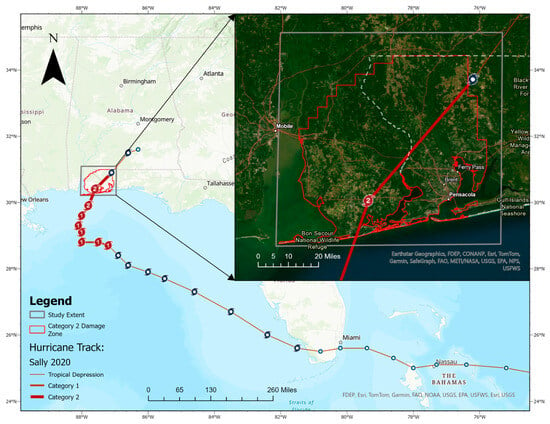
For this study, the ATL08 version 6 data product was acquired from the National Snow and Ice Data Center Distributed Active Archive Center (NSIDC DAAC) and spatially coincident pre- and post-hurricane data were examined (Figure 1). The National Land Use Land Cover (NLCD) product [47] was used to extract ATL08 samples within forest classes (deciduous forest (41), evergreen forest (42), mixed forest (43) and woody wetland (90)). Reference airborne LiDAR data were downloaded from the United States Geological Survey (USGS) 3D Elevation Program and processed to derive canopy metrics at both the segment and sub-segment scale of ATL08 data. The agreement between the ATL08 and coincident airborne LiDAR-derived canopy metrics (canopy height and canopy cover) was assessed, and along-track structural changes were computed using pre- and post-disturbance ATL08 samples. A general workflow of the methodology is presented in Figure 1.
Figure 1.
Flowchart showing an overview of the methodology.
2.1. Study Area
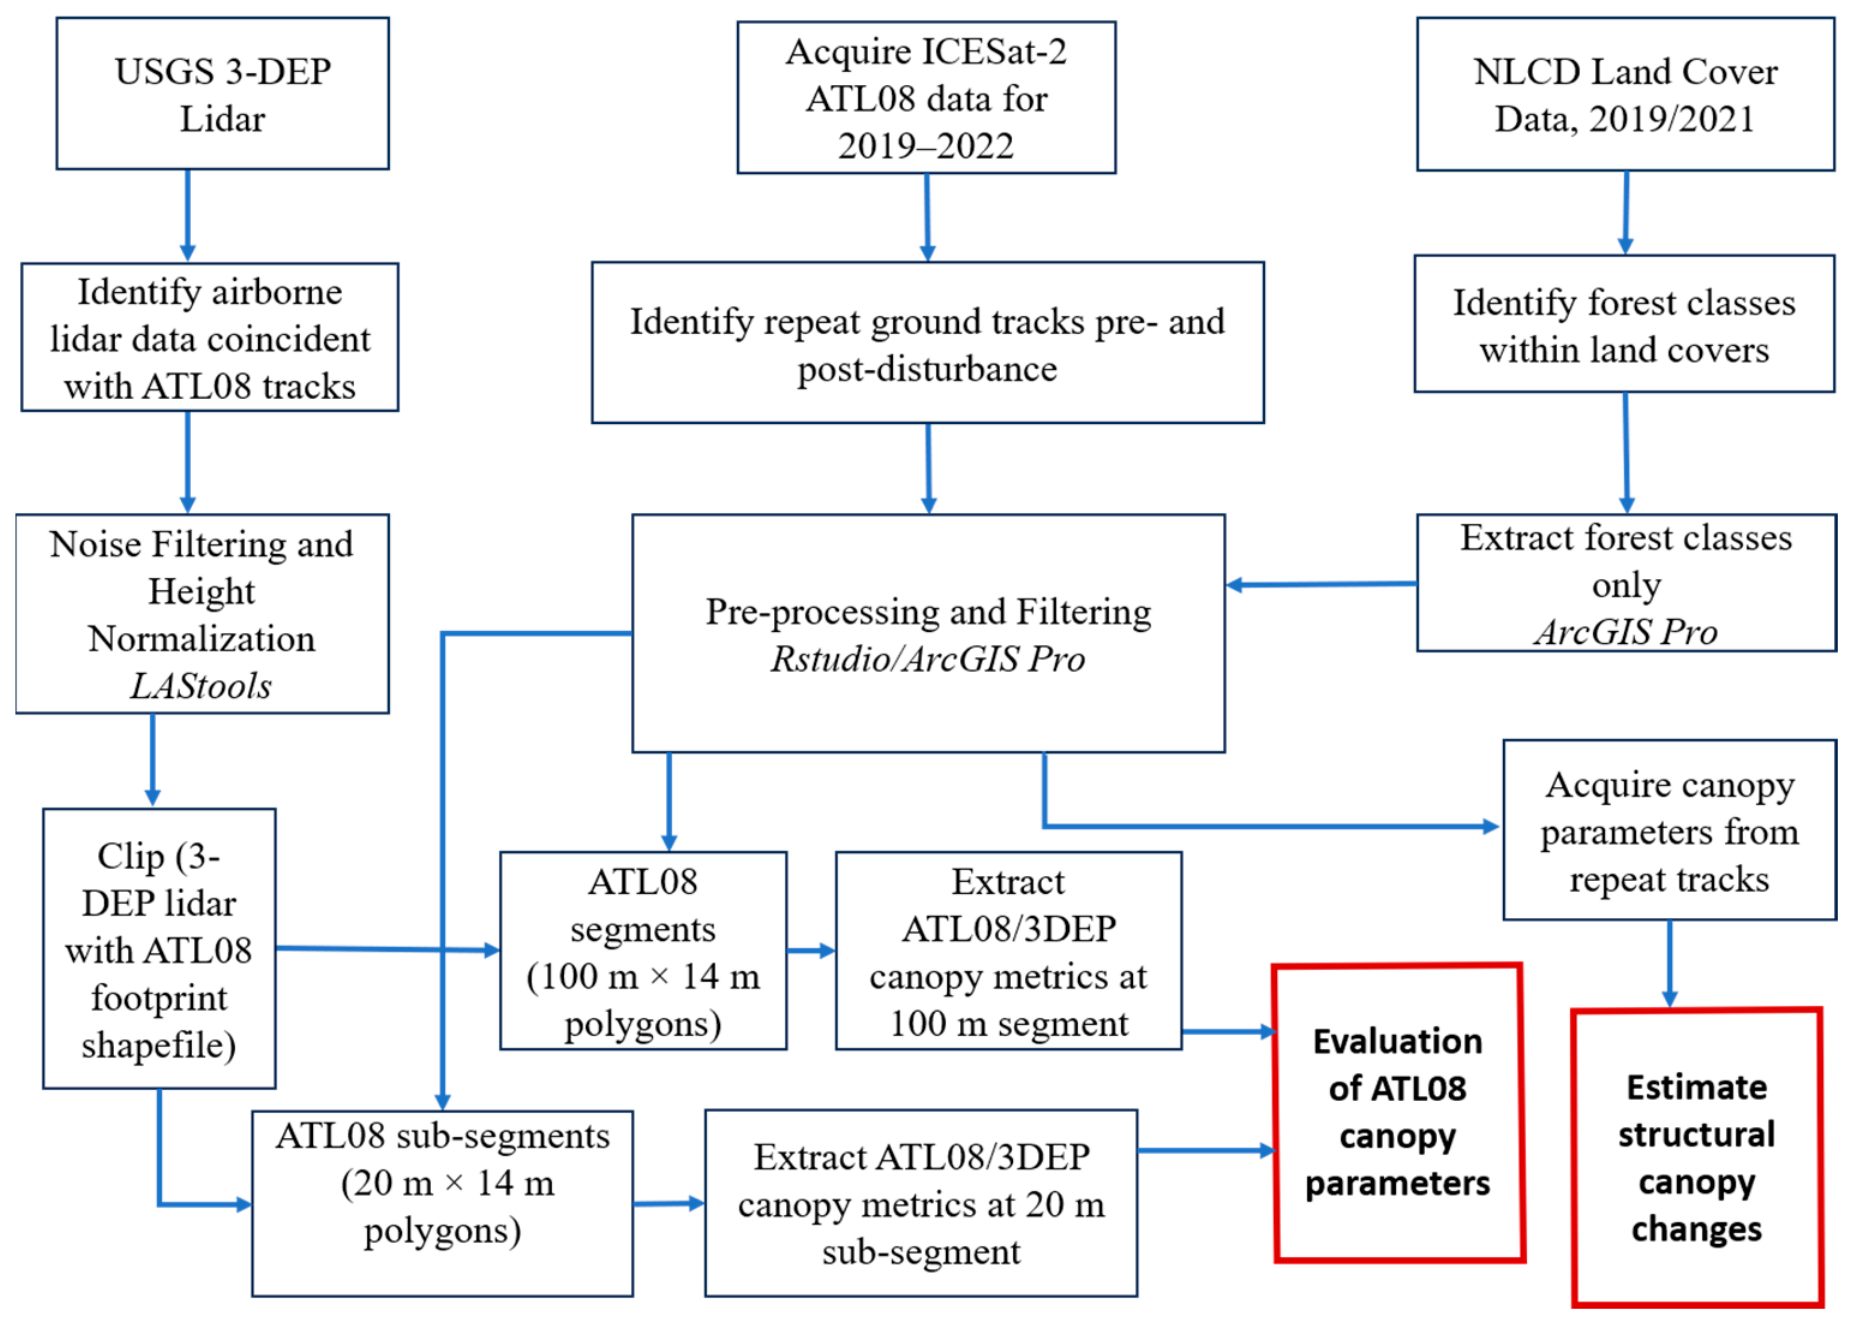
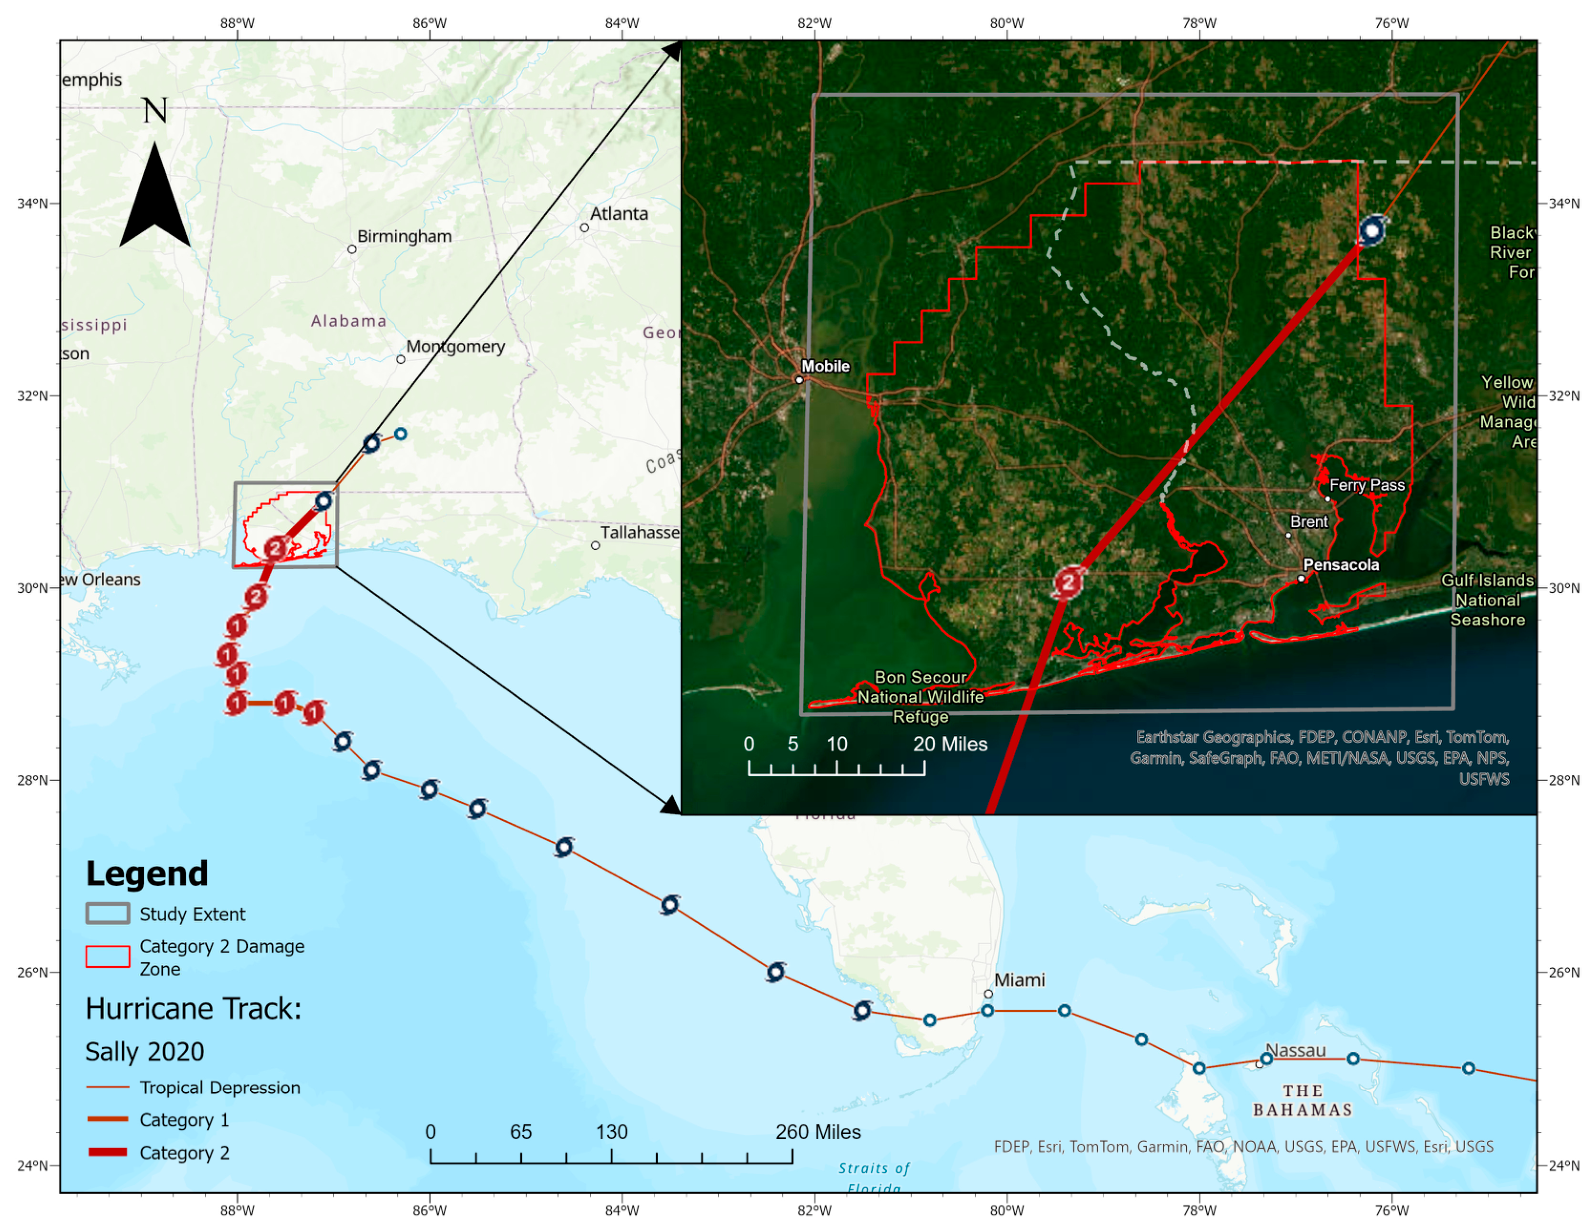
The study area encompassed coastal regions of Alabama and Florida within the National Oceanic and Atmospheric Administration (NOAA)-defined maximum wind speed radii (96–110 mph) of Hurricane Sally (Figure 2; [44]). The impacted region includes the Mobile and Baldwin counties in Alabama, and Escambia and Santa Rosa counties in Florida, which experienced significant vegetation damage [44]. This region was selected due to the availability of repeat ICESat-2 tracks to facilitate multi-temporal analyses of structural changes caused by Hurricane Sally. The region is characterized by a diverse range of land cover types and unique ecological features because of its proximity to the Gulf of Mexico and the Atlantic Ocean. The area is dominated by forests (35.3%), wetlands (25.3%), agriculture (12.7%), developed spaces (6.2%), shrublands (4.9%), and herbaceous (4%) [47]. The flat terrain, with elevations ranging up to 150 m above sea level, supports coastal plain forests dominated by pine forests in uplands and hardwood forests in bottomlands [48,49]. Key vegetation includes pine forests comprising longleaf pine (Pinus palustris), slash pine (Pinus elliottii), shortleaf pine (Pinus echinata), and loblolly pine (Pinus taeda); mixed hardwoods comprising oak–pine forests, including species like southern red oak (Quercus falcata) and water oak (Quercus nigra); and cypress and woody wetland forest comprising swamp forests and other wetland vegetation dominated by black gum (Nyssa sylvatica) and water tupelo (Nyssa aquatica) [48,49].
Figure 2.
Study area map showing Hurricane Sally’s track passing through coastal Alabama and Florida within the study extent, with points indicating Sally’s direction and intensity. (This map was created in ArcGIS Pro 3.1.3 [50] using a topographic map and world imagery as a basemap).
2.2. Data
2.2.1. ICESat-2 ATL08 Product
The ATL08 land and vegetation height product (version 6) for the study area was downloaded from NASA’s National Snow and Ice Data Center Distributed Active Archive Center (NSIDC DAAC). ATL08 data were selected from positively oriented (+X) cycle 7 (April 2020) and cycle 16 (June–July 2022) tracks, ensuring consistency in seasonality and satellite orientation (Table 1). Canopy parameters extracted at the 100 m segment scale and 20 m sub-segments are listed in Table 2 and Table 3 respectively. After spatial matching and filtering, the clean dataset comprised 5748 segments (14 m × 100 m) and 28,740 sub-segments (14 m × 20 m) across the study area.
Table 1.
Spatially repeated ICESat-2 tracks in the study area.
Table 2.
ATL08 parameters at the 100 m segment scale.
Table 3.
ATL08 parameters at the 20 m sub-segment scale.
2.2.2. USGS 3DEP Airborne LiDAR Data
The U.S. Geological Survey (USGS) launched its 3D Elevation Program (3DEP) in 2012, to provide standardized LiDAR coverage for the conterminous US. For this study, airborne LiDAR point clouds with a point density of 2.04 pts/m2 and vertical accuracy of 10 cm were acquired within the overall extent of Hurricane Sally damage (2018–2022) from USGS TNM Download (v2.0) (TNM Download iv2, https://apps.nationalmap.gov/downloader/ (accessed on 15 March 2024) [51]. Given its point density and vertical accuracy, airborne LiDAR has been widely used in validating regional-scale modeling efforts using spaceborne LiDAR [35,37]. Each USGS airborne LiDAR dataset represents a spatially contiguous coverage of approximately 1 km × 1 km and only those point clouds that were spatially and temporally coincident with pre- and post-hurricane ATL08 samples were acquired. While airborne LiDAR data samples were available for the pre-hurricane ATL08 samples, little to no post-hurricane airborne LiDAR data were available. Using datasets acquired between July 2019 and July 2020, the agreement between pre-hurricane forest canopy attributes from airborne LiDAR and ATL08 data was assessed at 100 m and 20 m scales.
2.3. Airborne LiDAR Processing
The available airborne LiDAR point clouds were normalized and filtered to retain canopy heights between 1.37 and 45 m using LAStools [52]. The lower threshold, corresponding to breast height, was used to exclude near-ground vegetation, shrubs, and non-canopy returns, whereas the 45 m upper threshold was used to remove canopy height outliers for the evergreen forest and woody wetland classes in the study area. Corresponding canopy metrics for the ATL08 segments and sub-segments were computed using the lidR package in Rstudio [53]. Metrics derived from the airborne LiDAR data included maximum canopy height (p100_height), the 98th percentile canopy height (p98_height), and the 99th percentile canopy height (p99_height), along with canopy cover; these were computed at both 100 m and 20 m resolutions to correspond with ATL08 data. Using airborne LiDAR data to directly estimate percentage of returns above a specific height is a well-established method for characterizing canopy cover, as noted by Coops, et al. [19] and Narine, et al. [54]. Airborne LiDAR-derived canopy cover was calculated as a percentage of canopy returns above 2 m, relative to all returns (Equation (1)) [54].
where canopy returns represent LiDAR points captured from vegetation greater than 2 m and total returns represents all LiDAR returns within a 100 m segment (14 m × 100 m).
2.4. ATL08 Filtering and Extraction of Metrics
ICESat-2 vegetation studies highlight the use of nighttime-collected data due to its superior signal-to-noise ratio [37,55]. However, both nighttime and daytime data were used to ensure sufficient repeated coverage tracks for multi-temporal analysis. Only strong beam data were used, as strong beams demonstrate better performance in canopy height estimation, compared to measurements from weak beams [35,36,41,56,57]. For instance, strong beams were validated for canopy height estimation in Finland’s boreal forests, achieving a mean bias reduced to cm level accuracy (bias = −0.56 m), compared to weak beams (bias = −1.66 m) [35].
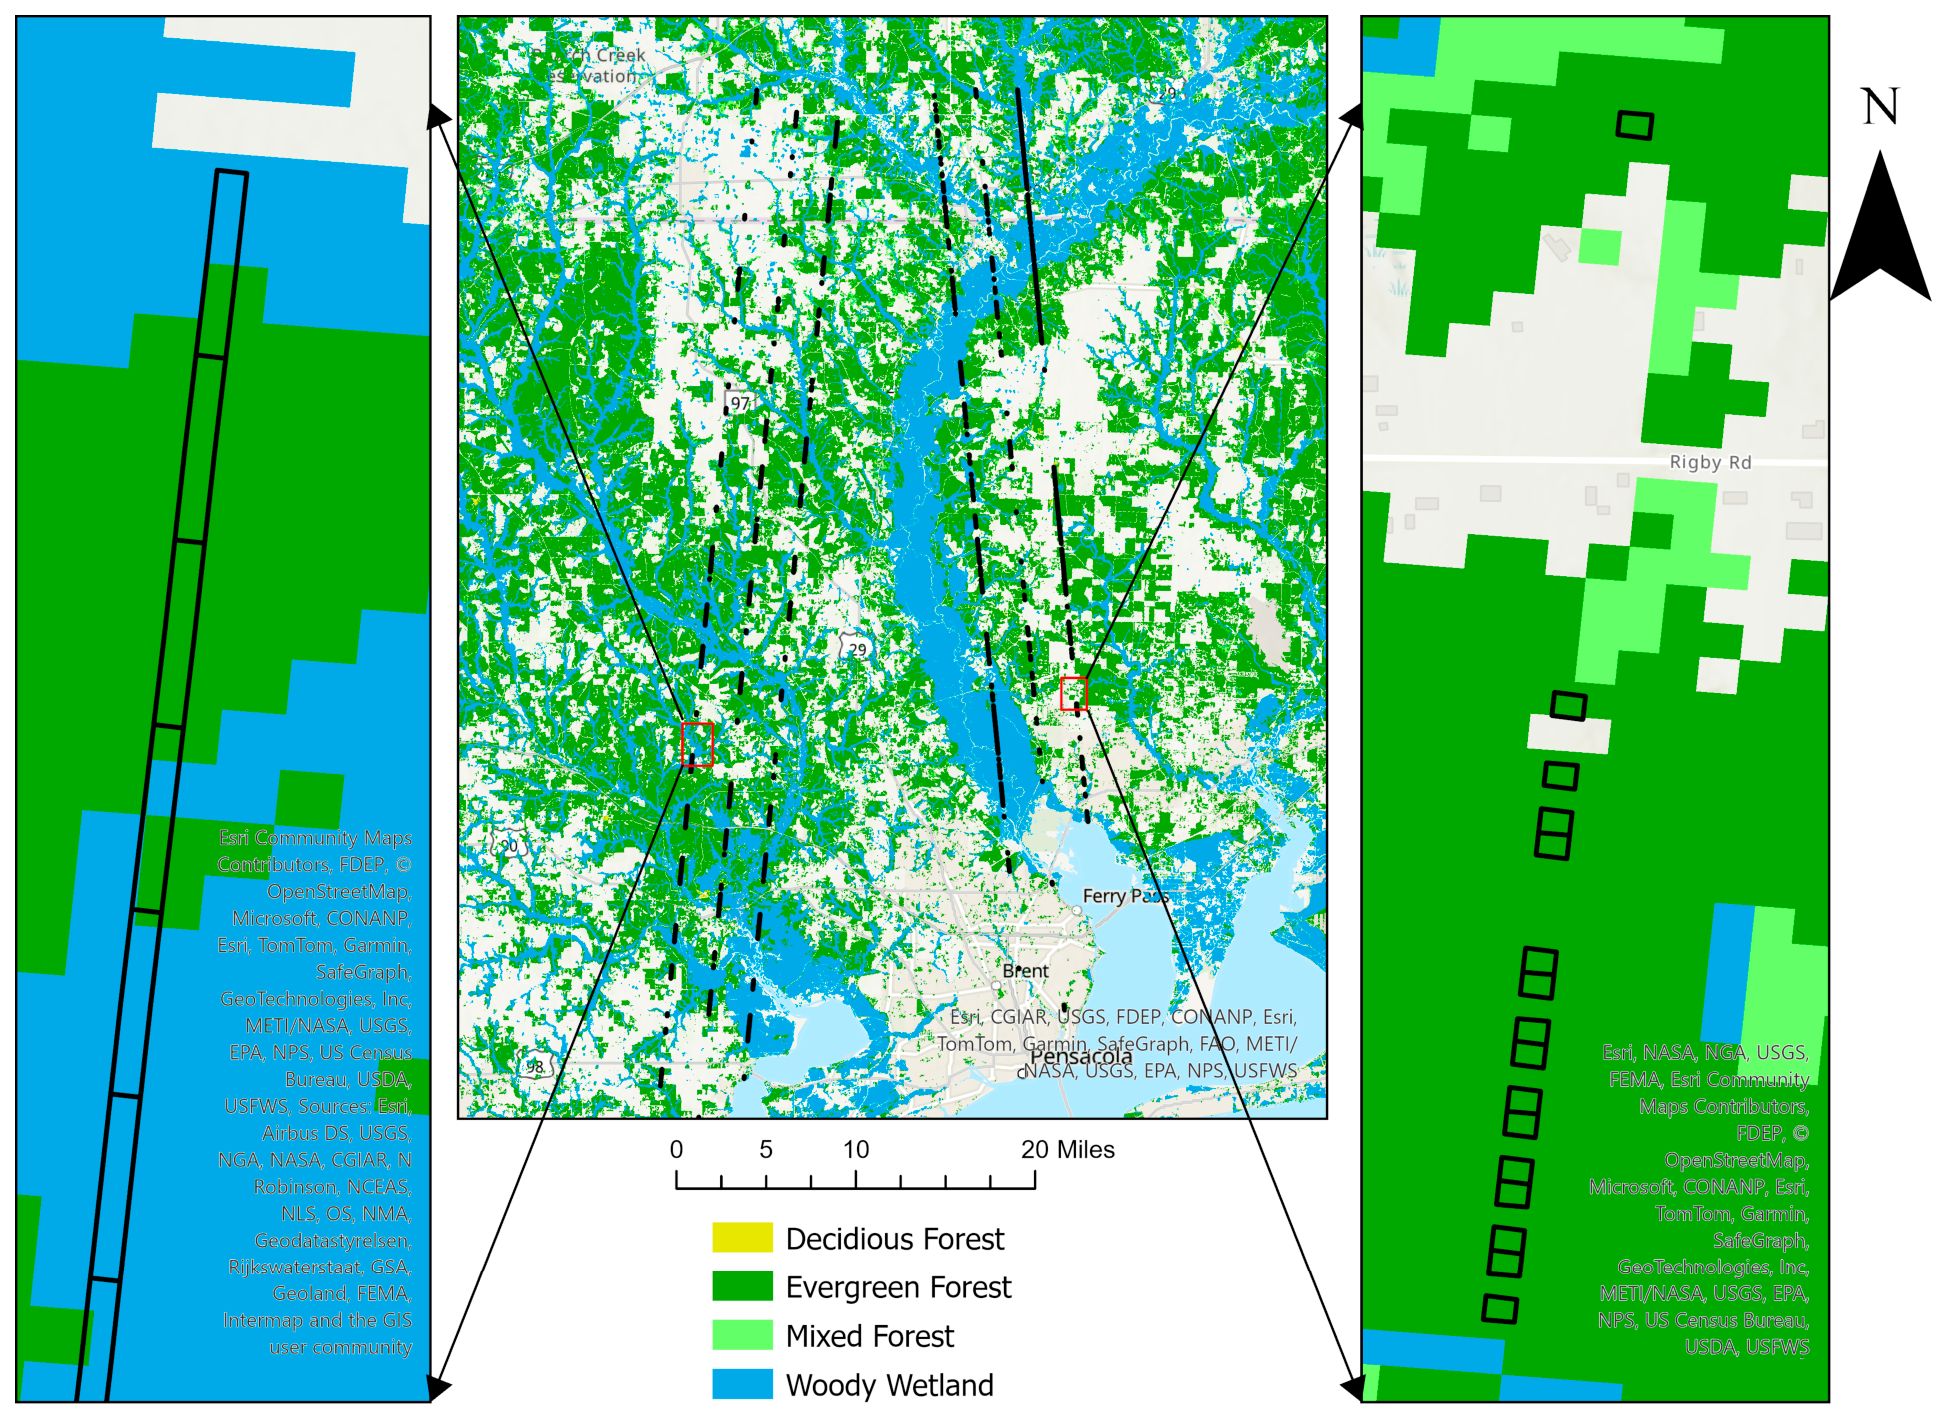
ATL08 segment- and sub-segment-scale data were processed independently. ATL08 geolocation information (x, y) was used to create pre- and post-rectangular buffers based on the Algorithm Theoretical Basis Document (ATBD) for ATL08 [30]. Data with erroneous height measurement values (<1.37 m and >45 m) were excluded following the approach by Malambo and Popescu Malambo and Popescu [37]. This threshold ensures that only valid canopy height data are retained for analysis as it excludes the ground and noise from the dataset. Data were further filtered based on National Land Cover Database (NLCD) land cover categories, to focus exclusively on forested areas, including deciduous forest (41), evergreen forest (42), mixed forest (43), and woody wetlands (90). This filtering ensured that the analysis was specific to forested areas only. A comparison of segment and sub-segment scale polygons after filtering is presented in Figure 3.
Figure 3.
Map showing ICESat-2’s ATL08 filtered ground tracks with NLCD forest classes (middle), segment-scale (14 m × 100 m) polygons (left), and sub-segment-scale (14 m × 20 m) polygons (right) within the damage extent of Hurricane Sally.
In addition to canopy height metrics, canopy cover was computed using photon count metrics available at the 100 m scale [58]. ATL08-derived canopy cover was calculated as the percentage of canopy (canopy and top-of-canopy photon counts) of the total photons (canopy, top-of-canopy photons, and terrain photons) per segment (Equation (2)) [58]. This canopy cover formulation was designed for estimation at the 100 m scale, limiting its calculation to the segment scale only. ATL08 canopy cover was compared with reference airborne LiDAR-derived canopy cover at the same spatial extent (100 m) to inform accuracy.
where n_ca_photons, n_toc_photons, and n_te_photons represent the number of canopy, top-of-canopy and terrain photons respectively.
2.5. Evaluation of ATL08 Canopy Parameters
The agreement between ATL08 canopy parameters and reference airborne LiDAR parameters were examined using several canopy metrics. The assessment was primarily conducted with the pre-hurricane dataset due to limited to no airborne LiDAR data available for post-hurricane, spatially coincident ATL08 data. Both segment (100 m)- and sub-segment (20 m)-scale ATL08 canopy parameters were compared with the corresponding airborne LiDAR-derived canopy parameters. Canopy height was compared at both the segment and sub-segment scales, whereas canopy cover accuracy was assessed only at the segment scale. Accuracy assessment metrics used to assess agreement included: (1) Mean bias (Bias), (2) Relative Bias, (3) MAE, (4) Relative MAE, (5) RMSE, (6) Relative RMSE, and (7) Pearson’s correlation coefficient (r) at both the segment (100 m) and sub-segment (20 m) scale. Bias represents how much the height values differ between the ATL08 and airborne LiDAR estimates with a negative value determining underestimation and positive value determining overestimation. RMSE emphasizes larger discrepancies, whereas MAE provides a balanced view of average errors between the predicted height from ATL08 and the observed height from airborne LiDAR. Pearson’s correlation coefficient assesses the linear relationship between ATL08 and airborne LiDAR canopy parameters. The equations (Equations (3)–(9)) are listed below:
where ATL08canopy is an ATL08 canopy parameter for each segment and sub-segment, ALScanopy represents airborne LiDAR-derived canopy estimates for corresponding segments and sub-segments, and n is the total number of segments or sub-segments respectively.
2.6. Structural Change Assessment
Canopy height changes were evaluated by comparing pre- and post-disturbance ATL08 canopy height (98th percentile canopy height) data. This scale was chosen to maximize the number of samples and minimize bias within the damage extent. The spatially and temporally matching pre- and post-ATL08 polygons were identified and only those within the forested land cover classes were selected for change assessment. The track-level mean canopy height difference (ΔHcanopy) within the damage extent was computed as the difference between pre- and post-hurricane 98th percentile canopy height (Equation (10)).
where ΔHcanopy represents mean canopy height differences, and h_canopy_pre and h_canopy_post are the 98th percentile canopy height before and after disturbance respectively.
3. Results
3.1. Pre-Hurricane Assessment: ATL08 Segment
3.1.1. ATL08 Canopy Height
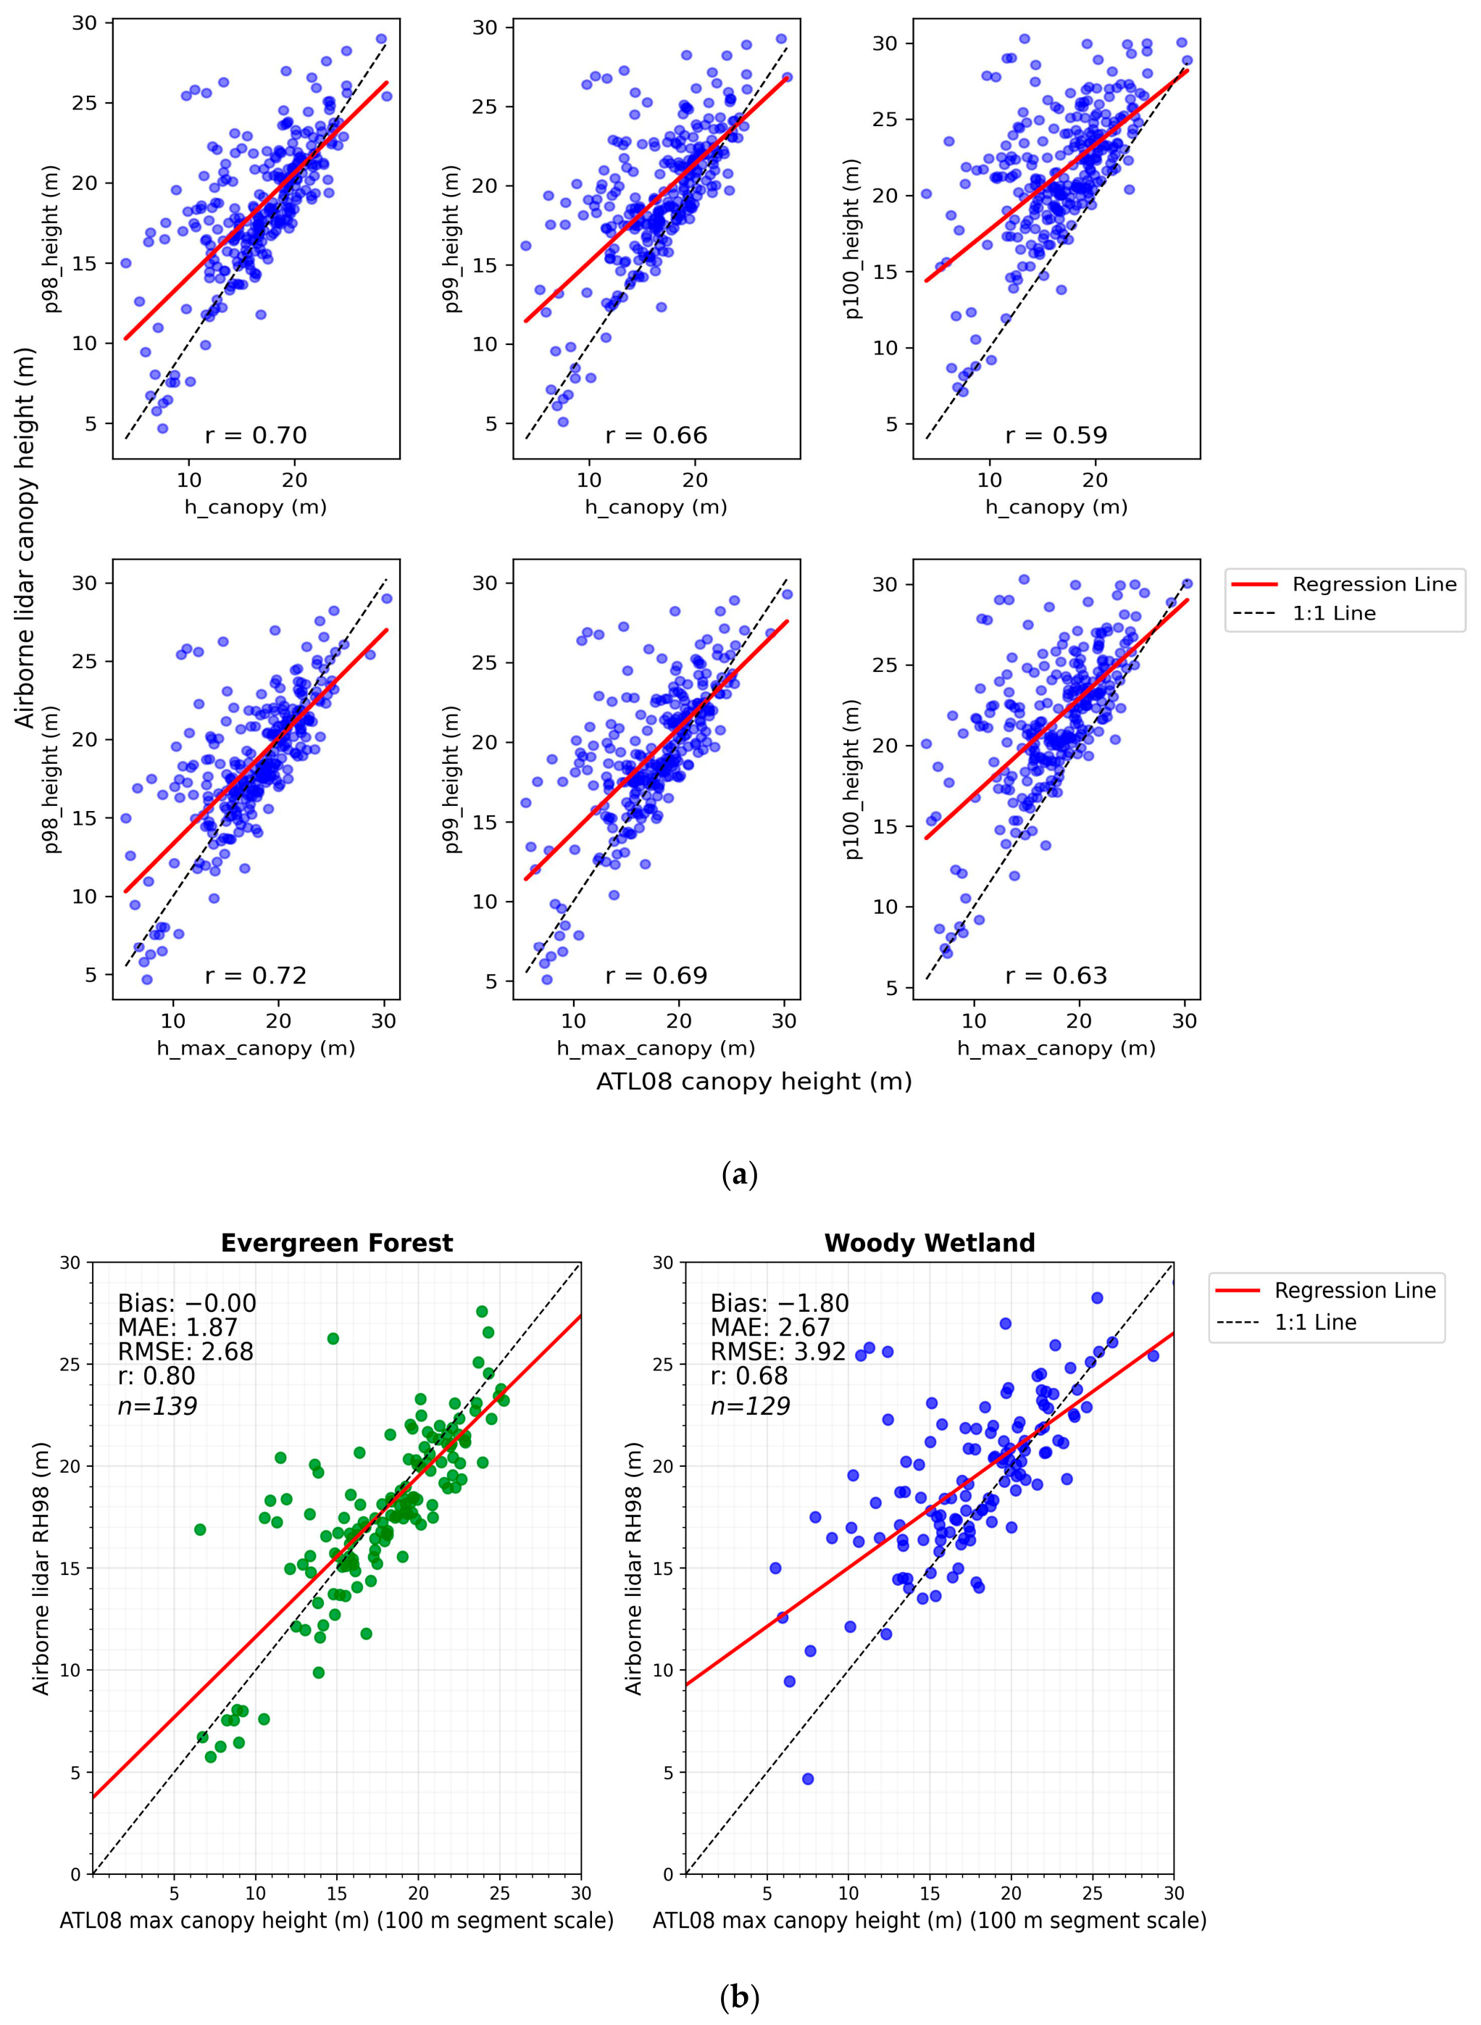
Strong agreement (Figure 4a and Table 4) was observed between ATL08 maximum canopy height (h_canopy_max) and airborne LiDAR-derived 98th percentile canopy height (RH98) with a bias of −0.85 m, MAE of 2.24 m, and a Pearson correlation coefficient of 0.72. The ATL08 RH98 and airborne LiDAR RH98 also showed reasonable agreement with a bias of −1.77 m, MAE of 2.55 m, and a Pearson correlation coefficient of 0.70. The agreement was weakest when ATL08 RH98 was compared to airborne LiDAR-derived maximum canopy height.
Figure 4.
(a) Multi-scatter plot of ATL08-derived canopy height parameters vs. airborne LiDAR-derived height parameters at segment scale (100 m). (b) Multi-scatter plot showing ATL08-derived maximum canopy height vs. airborne LiDAR-derived 98th percentile height at segment scale (100 m) for evergreen forest (left) and woody wetland (right) land cover classes.
Table 4.
Table showing agreement between ATL08-derived canopy parameters and airborne LiDAR-derived canopy parameters at segment scale (100 m).
Evergreen forest and woody wetland land cover classes were the primary forest classes found within study extent data: 52% of segments and 48% of segments, respectively. In contrast, deciduous and mixed forests, with almost no representation (1 out of 269 samples), were excluded from further analysis. The strong agreement (ATL08 maximum canopy height vs. airborne LiDAR RH98) reported in Section 3.1.1 was used to evaluate ATL08 accuracy across forest classes. ATL08 accuracy was higher for the evergreen forest class than for the woody wetland class, with a mean bias approaching zero (compared to −1.8 m), a mean absolute error (MAE) of 1.87 m (compared to 2.67 m), and a Pearson correlation coefficient of 0.80 (compared to 0.68) (Figure 4b).
3.1.2. ATL08 Canopy Cover
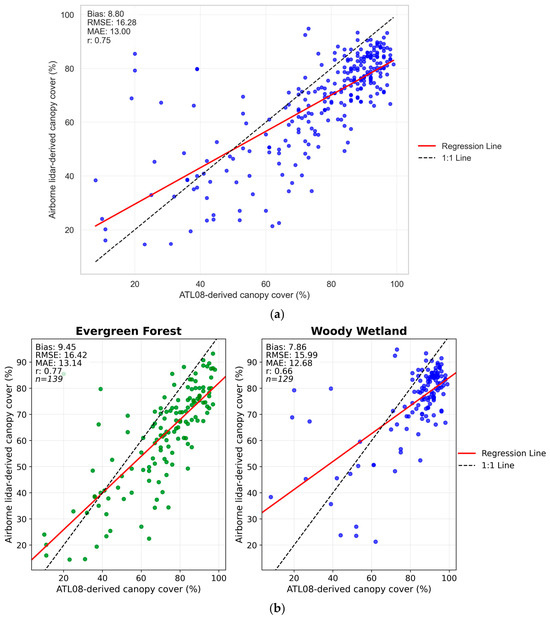
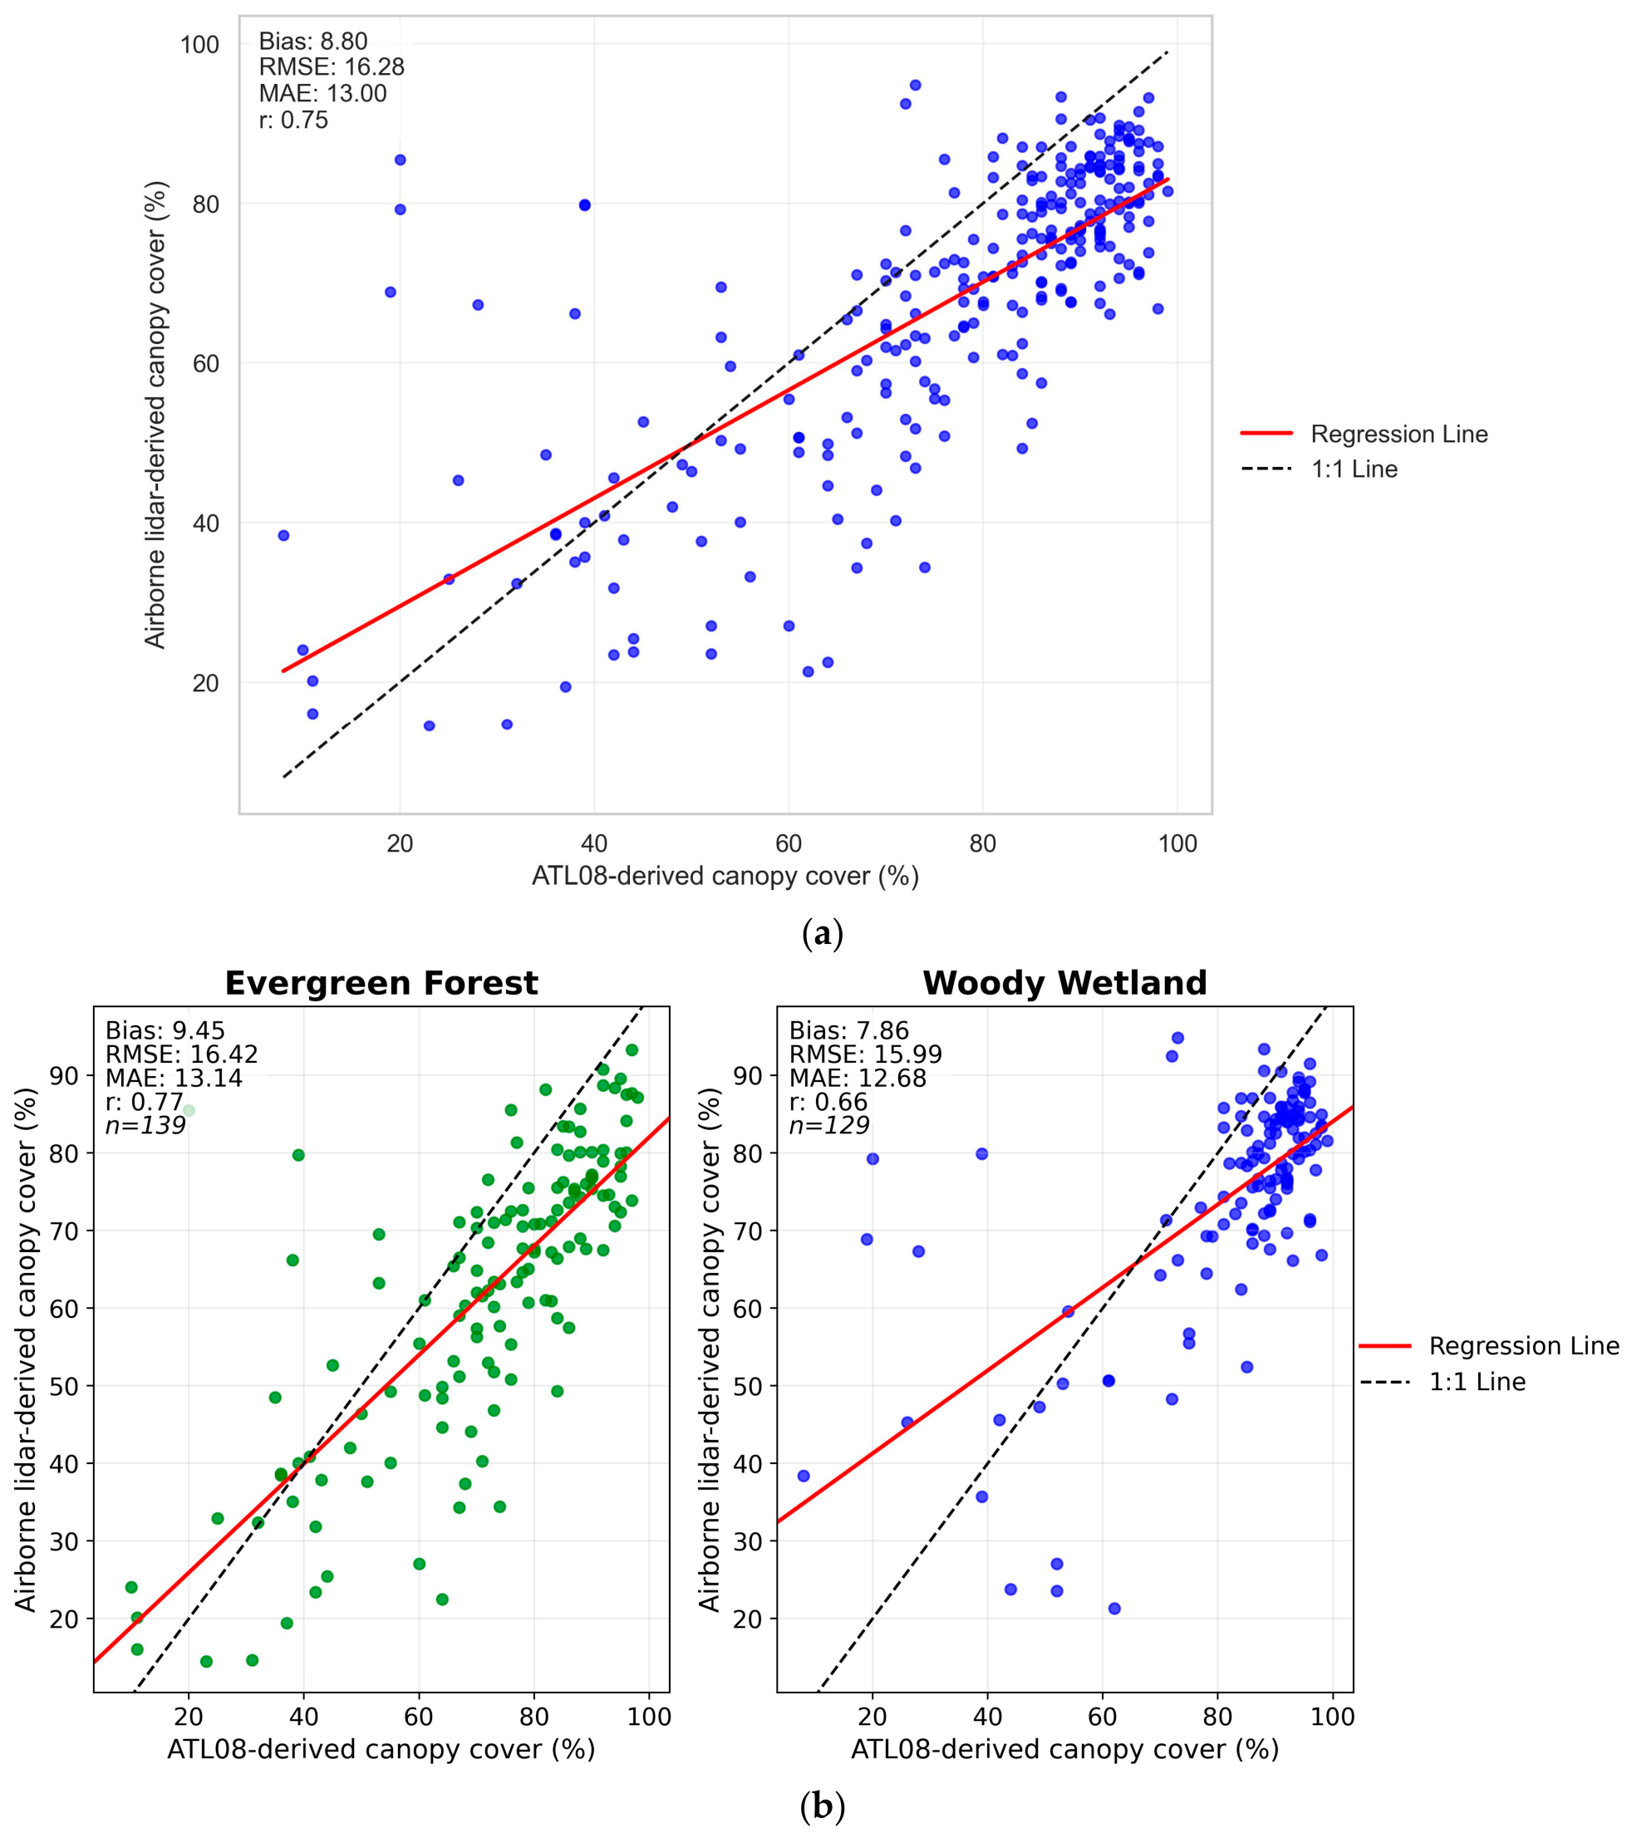
Comparisons with airborne LiDAR canopy cover indicate that ATL08 canopy cover at the segment scale (100 m) was highly biased for forests with low canopy cover (0–50%); however, the agreement showed a relatively better linear relationship for higher canopy cover (50–100%) (Figure 5a). A bias of 8.67%, MAE of 12.91%, RMSE of 16.91%, and a correlation coefficient of 0.78 were observed.
Figure 5.
(a) Scatter plot showing ATL08-derived canopy cover percentage vs. airborne LiDAR-derived canopy cover percentage at 100 m segment scale. (b) Multi-scatter plot showing ATL08-derived canopy cover percentage vs. airborne LiDAR-derived canopy cover percentage for evergreen forest (left) and woody wetland (right) land cover classes.
ATL08 canopy cover was less biased for the woody wetland class than the evergreen forest class with a bias of 7.82% compared to 9.24%, MAE of 12.57% compared to 13.07%, and RMSE of 15.89% compared to 16.34%. However, the evergreen forest class exhibited a stronger linear relationship overall for canopy cover classes (0–100%) than the woody wetland class with a correlation of 0.79 compared to 0.72 (Figure 5b).
3.2. Pre-Hurricane Assessment: 20 m Sub-Segment
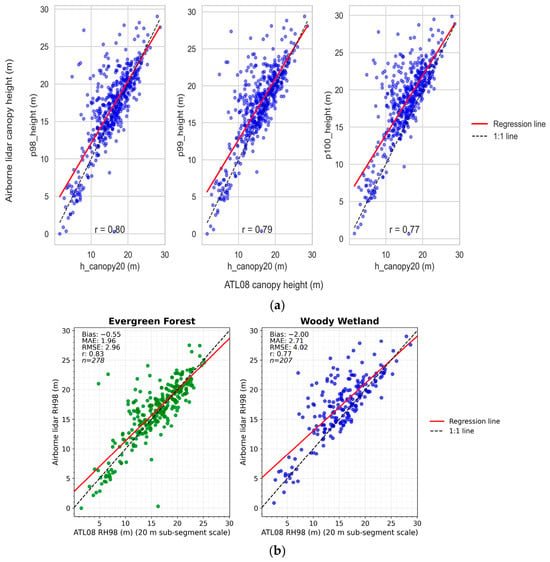
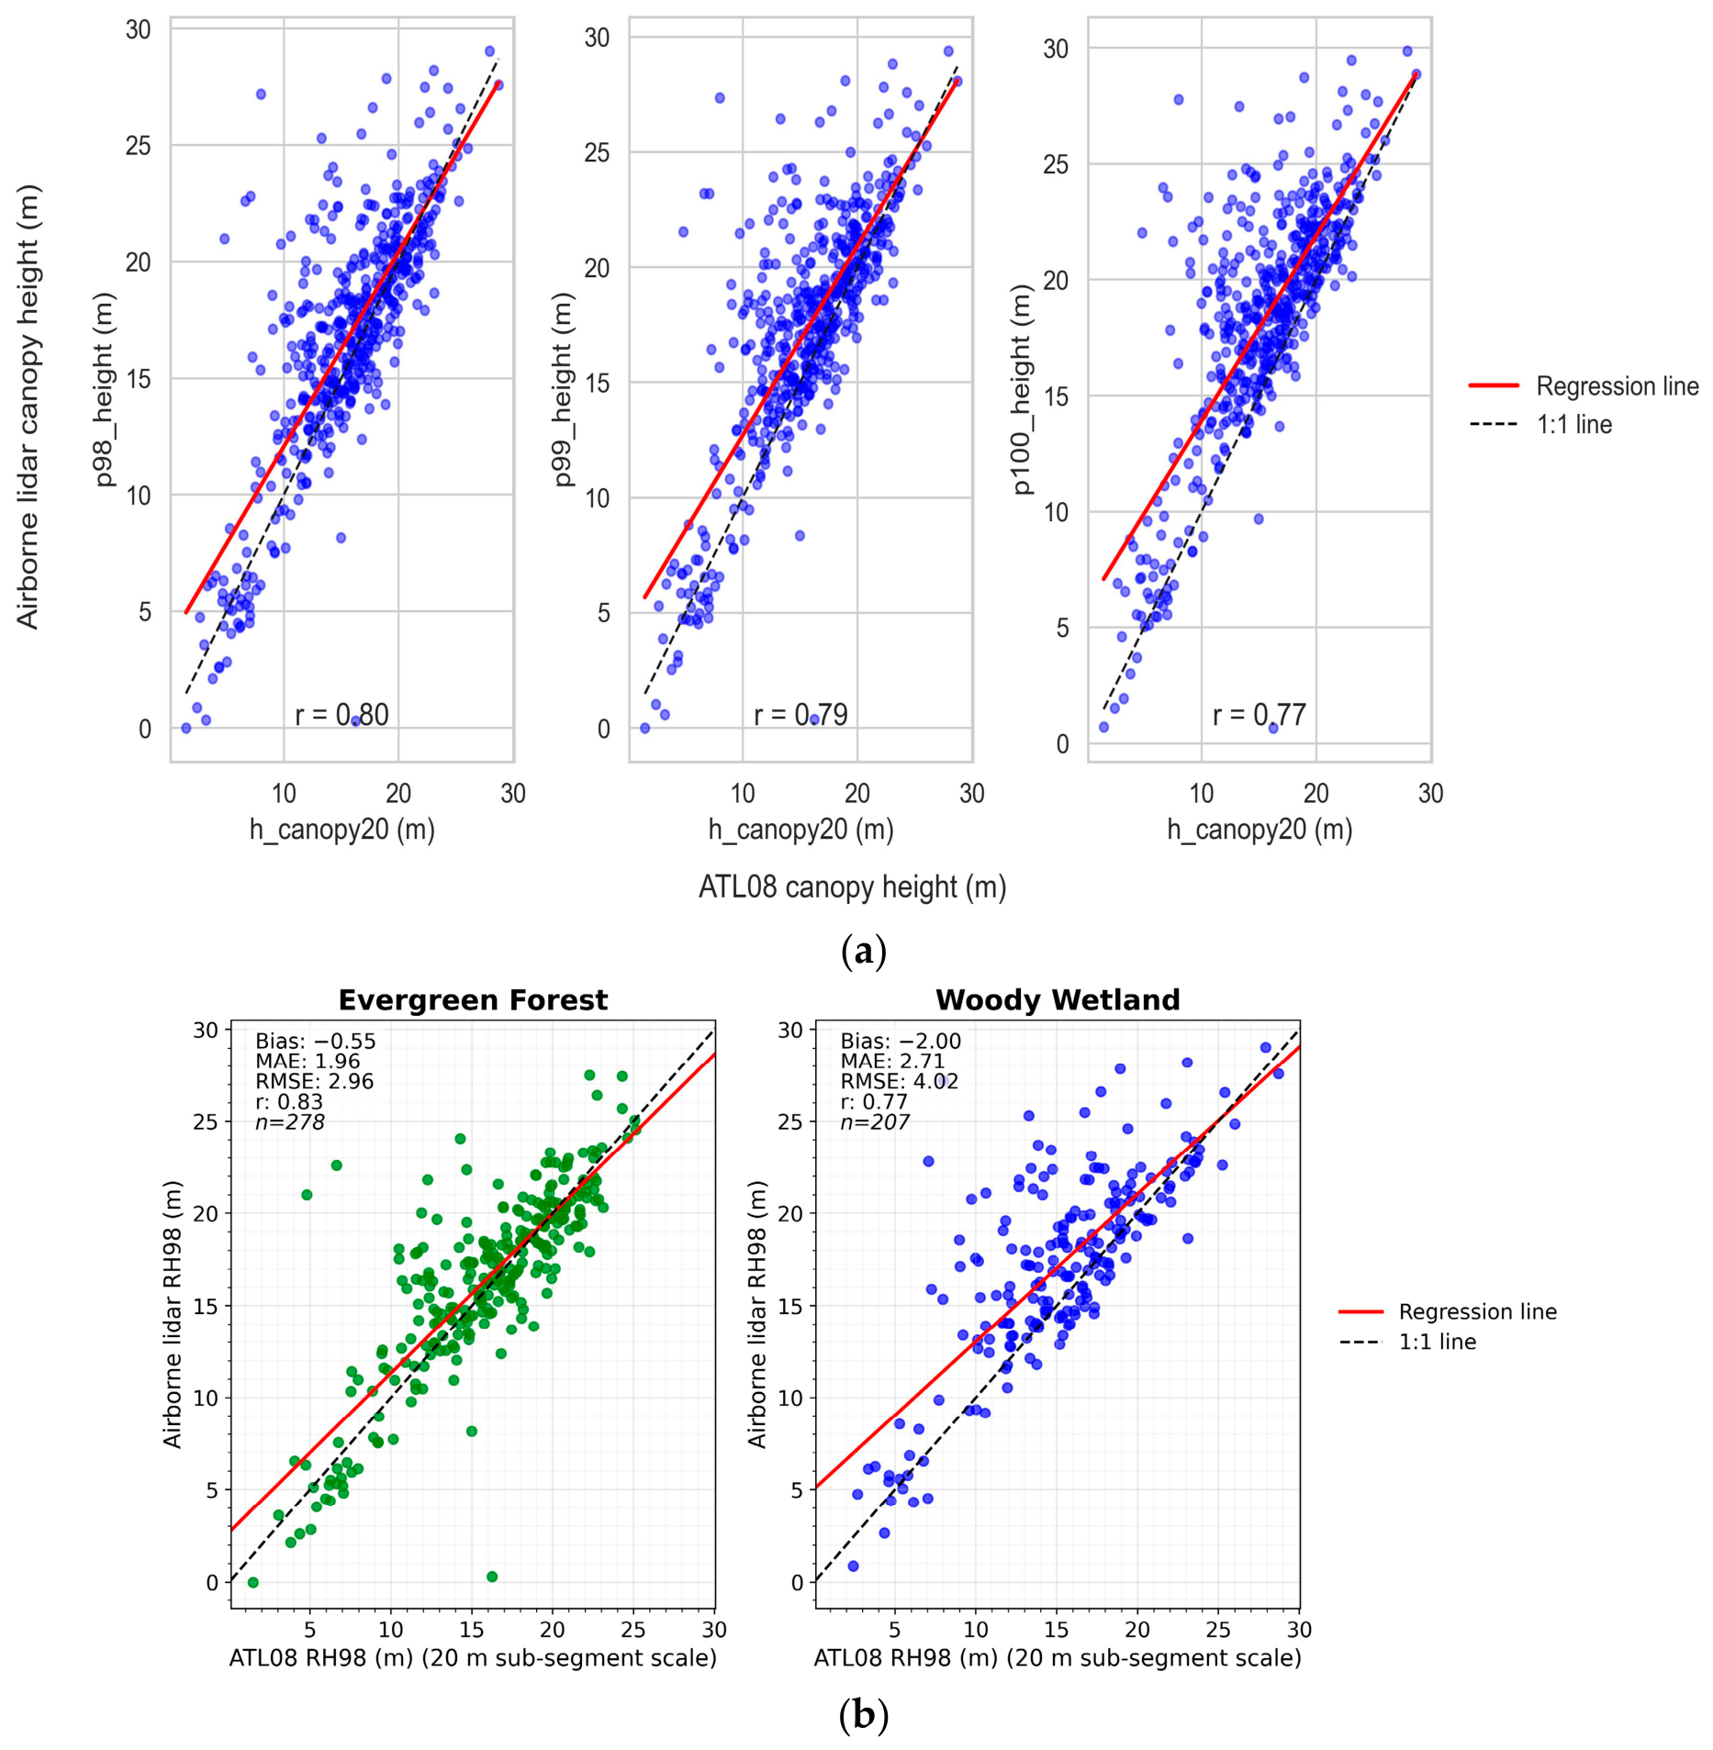
The canopy parameters extracted from ATL08 at the sub-segment scale included h_canopy20 (98th percentile canopy height), and corresponding airborne LiDAR canopy metrics included p100_height (maximum height), p98_height (98th percentile canopy height), and p99_height (99th percentile canopy height). At the sub-segment scale, the ATL08 RH98 showed strongest agreement with airborne LiDAR RH98, with a bias of −1.16, MAE of 2.28 m, and a Pearson correlation coefficient of 0.80. However, agreement was relatively weaker when compared with airborne LiDAR-derived RH99 and maximum canopy height (Figure 6a; Table 5).
Figure 6.
(a) Multi-scatter plot showing ATL08-derived canopy height parameters vs. airborne LiDAR-derived height parameters at sub-segment scale (20 m) (b) Multi-scatter plot showing ATL08 RH98 vs. airborne LiDAR RH98 at sub-segment scale (20 m) for evergreen forest (left) and woody wetland (right) forest classes.
Table 5.
Table showing agreement between ATL08-derived canopy parameters and airborne LiDAR-derived canopy parameters at sub-segment scale (20 m).
The strongest agreement at the sub-segment scale was used to assess the accuracy of ATL08 canopy height for both forest classes. Overall, the 20 m sub-segment scale provides higher agreement for each forest class with the airborne LiDAR height values, resulting in improved performance across all metrics, compared to the 100 m segment scale. Better agreement in estimating canopy height was observed for the evergreen forest than woody wetland class, consistent with findings reported in Section 3.1.2, with a bias of −2 m compared to −0.55 m, MAE of 2.71 m compared to 1.96 m, and correlation coefficient of 0.83 compared to 0.77 (Figure 6b).
3.3. Assessment of Changes in Canopy Structure
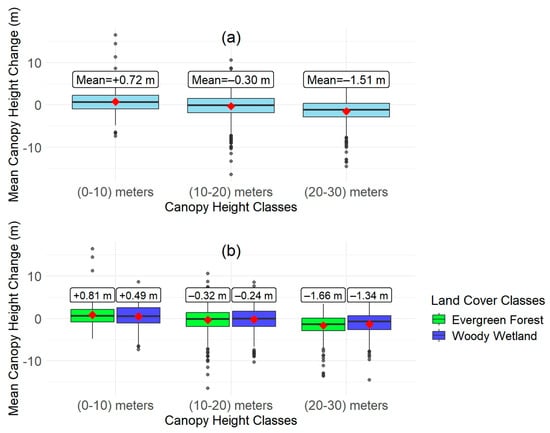
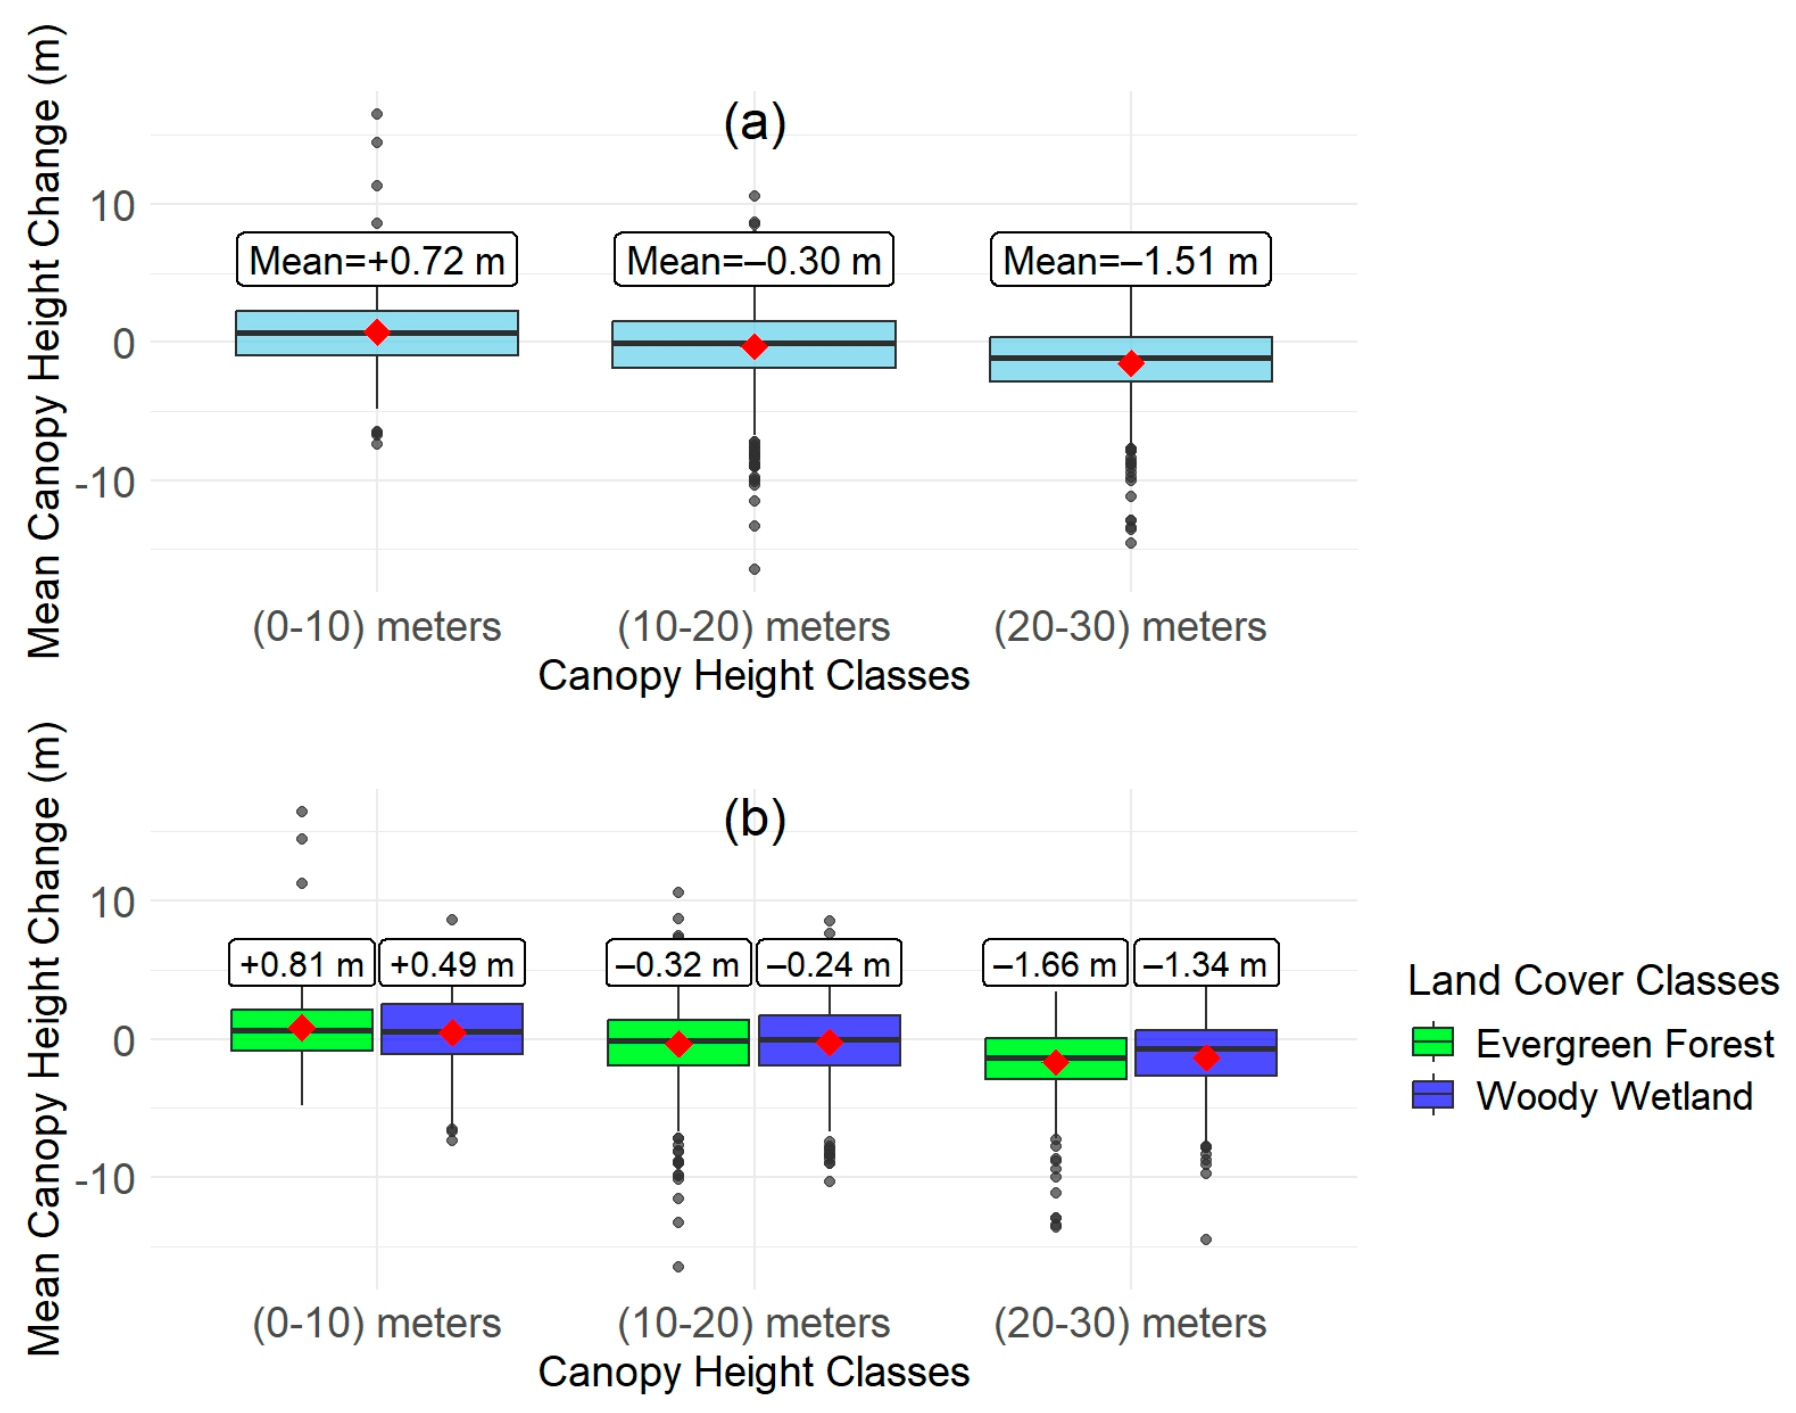
ATL08 sub-segment RH98 pre- and post-disturbance data (1802 observations each) were used to assess along-track canopy height changes two-year post-disturbance within different canopy height and forest cover classes. The 20 m sub-segment was chosen due to the availability of a higher density of repeated data points that ensures minimum bias and better reflects finer-scale variation in canopy height changes from disturbance. The mean changes were assessed for three different canopy height classes: (a) 0–10 m understory which includes saplings and poles, (b) 10–20 m sub-canopy which includes young trees, and (c) 20–30 m overstory which includes grown/mature trees. The results showed mean canopy height for short (0–10 m) canopy height classes increased by 0.77 m, whereas mean canopy height decreased by 0.3 m and 1.51 m for moderate (10–20 m) and tall (20–30 m) canopy height classes respectively (Figure 7). When these changes were assessed for different forest classes, the woody wetland class showed relatively smaller changes in mean canopy height than evergreen forest for all the canopy height classes (Figure 7).
Figure 7.
Box plot showing mean canopy height changes post-hurricane across (a) canopy height classes and (b) both canopy height and land cover classes.
4. Discussion
Previous studies have demonstrated the effectiveness of ICESat-2 ATL08 in estimating vegetation height, with Neuenschwander, et al. [35] and Malambo and Popescu [37] identifying 98th percentile canopy height (RH98) as a reliable metric for broadscale vegetation analysis. Research has also shown ICESat-2 trends of underestimating canopy height, with biases ranging from −1.5 m to −3.5 m depending on forest type [42]. Given these insights, this study evaluated pre-hurricane along-track ATL08 canopy metrics at 100 m and 20 m spatial scales to evaluate along-track-level accuracy in coastal forests and then structural changes were quantified using exact repeat pre- and post-hurricane samples, to determine ICESat-2’s potential for vegetation monitoring.
At the 100 m segment scale, ATL08 maximum canopy height showed stronger agreement with airborne LiDAR-derived RH98 than ATL08 RH98, as indicated by lower bias, MAE, and RMSE, and a slightly higher correlation. Overall, these results indicate that ATL08 maximum canopy height provides a more accurate and consistent estimate of canopy height at this scale. This suggests that maximum canopy height provides more stable metrics, minimizing outliers and better characterizing structural attributes over larger areas. In this context, maximum canopy height from ATL08 may better represent dominant canopy structure over larger spatial extents.
Land cover analyses using the strongest agreement metric (ATL08 max height vs. airborne LiDAR RH98) revealed evergreen forests exhibited better agreement than woody wetlands (bias = 0 m, MAE = 1.87 m, and r = 0.80). These results align with Rai et al. Rai, et al. [57] and Malambo and Popescu [37], who found that uniform canopies, such as evergreen forests, yield more consistent photon returns for canopy height retrieval. Conversely, woody wetlands exhibited weaker linear relationships and greater variability, likely due to their heterogeneous structure and sparse canopy cover [29].
Results showed reasonable agreement between ATL08- and airborne LiDAR-derived canopy cover, with a mean bias of 8.67% and r = 0.78. Higher agreement was observed for dense canopies (>50%) compared to sparse canopies (25–50%), corroborating findings by Malambo and Popescu [37], Narine, et al. [58], and Neuenschwander, et al. [35]. This suggests that dense canopies reduce signal return errors, whereas sparser canopies (<50%) may introduce terrain-induced errors in canopy cover estimates. Forest-type analyses indicated a stronger correlation in evergreen forests (r = 0.79) compared to woody wetlands (r = 0.72), demonstrating ATL08’s reliability in estimating canopy cover in uniform, dense forests, though heterogeneous canopies may require additional calibration. Canopy height was selected as the primary metric for structural change assessment because it showed stronger agreement with reference airborne LiDAR measurements across forest classes (bias ~1 m for canopy height, compared to bias ~9% for canopy cover) (Figure 4b and Figure 5a). Although canopy cover was derived from ATL08, canopy cover exhibited greater variability, particularly at low to moderate canopy cover, with stronger correspondence observed primarily in denser canopies (Figure 5b).
At the 20 m sub-segment scale, ATL08 RH98 demonstrated the strongest agreement with airborne LiDAR RH98, with a bias of −1.16 m, and correlation coefficient of 0.80 with airborne LiDAR-derived RH98 for canopy height retrieval. These findings align with Chen, et al. [41], supporting the sub-segment scale’s ability to capture finer structural details, while also remaining consistent with Malambo and Popescu [37] and Neuenschwander, et al. [35], who established RH98 as a robust metric for vegetation height estimation. The sub-segment scale exhibited stronger linear relationships and better captured track-level canopy variability, making it more suitable for small-area assessments. Land cover analyses at the sub-segment scale (ATL08 RH98 vs. airborne LiDAR RH98) also showed better agreement in evergreen forests (bias = −0.55 m, r = 0.83) than woody wetlands (bias = −2 m, r = 0.77). These results were consistent with segment-scale findings, reinforcing ATL08’s ability to capture canopy height with improved accuracy at finer spatial scales.
Structural canopy changes were assessed using repeat along-track ATL08 sub-segment data for two years post-disturbance, leveraging its accuracy and sample availability for repeat track-level change detection. While post-storm regrowth may complicate the change assessment, a detailed study of forest disturbance reports from the National Weather Service (NWS) and National Hurricane Center (NHC) [8] within the study period confirms no significant incidents, which suggests that the observed structural changes can be attributed to Hurricane Sally. Using the exact repeat ICESat-2 tracks (RGT 0393 and RGT 0093) pre- and post-hurricane (1802 observations) yielded an overall mean canopy height change of 0.50 m. The height variable categorized into short (0–10 m), moderate (10–20 m), and tall (20–30 m) canopy height classes showcased changes across distinct forest classes. The mature or tall canopy height class (20–30 m) experienced the largest reductions, with a mean decrease of 1.51 m, aligning with Everham and Brokaw [59] ecological theory, which suggests the vulnerability of taller trees towards hurricane wind due to increased mechanical leverage and exposure. In contrast, the younger or short canopy height class (0–10 m) increased by 0.77 m, indicating sapling establishment, recovery and regeneration, while for the medium canopy height class (10–20 m), there was only a minor reduction of 0.3 m. These findings are also consistent with Seidl, et al. [5], who highlighted the susceptibility of tall trees to disturbance, resilience of short vegetation, and neutrality of the moderate canopy. Similarly, the trend in canopy height losses was more pronounced in evergreen forests than in woody wetlands, a pattern explained byRutledge, et al. [60], suggesting tree height, tree size and forest type all influence forest vulnerability to wind disturbance. These results are also supported by Gautam, et al. [61], who showed machine learning-based upscaling of track-scale changes to overall extent, identifying greater impacts to dense and tall canopy height classes along the hurricane path. Future studies could integrate ATL08 canopy metrics with allometric variables and vulnerability frameworks [60], to provide complete ecological interpretations for biomass loss, carbon flux or habitat disruption from hurricane damage.
The successful application of ATL08 for track-level structural change assessments presents opportunities for upscaling to broader spatial extents, in support of ICESat-2’s fourth mission objective of measuring the height of vegetation in forests and other ecosystems worldwide [28,32]. With ICESat-2’s continued operation and increased availability of repeat ICESat-2 tracks over vegetated areas, future studies could leverage these data to obtain insights into forest disturbance dynamics. Further, integrating ICESat-2 data with climatic variables, such as precipitation and wind speed using data fusion methods, e.g., [62,63,64], may enhance regional damage mapping and predictive modeling of forest recovery following disturbances. Overall, findings highlight ATL08’s potential for forest change detection, particularly in damage detection, complementing previous large-scale canopy height retrieval studies [37,42].
5. Conclusions
This study provides compelling evidence of ICESat-2’s ATL08 utility for detecting and quantifying structural changes in forest canopies, particularly in response to disturbances such as hurricanes across coastal forest in the southeastern US. By comparing ATL08-derived canopy height and cover metrics with airborne LiDAR data, this study highlights the potential of ATL08 for vegetation monitoring. Furthermore, this study brings new perspective in terms of repeat track coverage from ICESat-2 for multi-temporal forest monitoring particularly following hurricanes, offering valuable insights for ecological restoration and resilience. The results indicate that ATL08 RH98 offers good agreement with airborne LiDAR RH98, especially at the sub-segment scale (20 m), where finer structural details are captured. ATL08 canopy height and canopy cover estimation exhibited strong agreement in densely forested areas like evergreen forests, underscoring its reliability for estimating canopy parameters in uniform, dense canopies. Beyond agreement, findings suggest the repeated observation of ICESat-2 can function as an operational complement to field-based disturbance assessments especially at the 20 m sub-segment scale. By advancing methods to monitor and map structural changes, this study contributes to the broader goal of sustainable forest management and recovery planning.
Author Contributions
Conceptualization, A.G. and L.L.N.; methodology, A.G.; software, A.G. and L.L.N.; validation, A.G.; formal analysis, A.G.; investigation, A.G. and L.L.N.; resources, A.G. and L.L.N.; data curation, A.G.; writing—original draft preparation, A.G. and L.L.N.; writing—review and editing, A.G. and L.L.N.; visualization, A.G.; supervision, L.L.N.; project administration, L.L.N.; funding acquisition, L.L.N. All authors have read and agreed to the published version of the manuscript.
Funding
This research is supported by an Auburn University Research Support Program (RSP) grant from the Office of the Vice President for Research and Economic Development, and the College of Forestry, Wildlife, and Environment, Auburn University.
Data Availability Statement
The data used in the study are based on entirely open-access sources. ATL08 data were downloaded from NASA Earth Data Search (Earthdata Search | Earthdata Search) (https://search.earthdata.nasa.gov/) accessed on 15 March 2024, hurricane track and landfall data were downloaded from the NOAA NHC Archive (NHC Data Archive) (https://www.nhc.noaa.gov/data/#tcr), accessed on 10 November 2023, downloaded airborne LiDAR were derived from the USGS 3DEP program (TNM Download v2) (https://apps.nationalmap.gov/downloader/) accessed on 15 March 2024, and land cover classes were downloaded from the National Land Cover Database Class Legend and Description | Multi-Resolution Land Characteristics (MRLC) Consortium (https://www.mrlc.gov/data) accessed on 15 May 2024.
Acknowledgments
We gratefully acknowledge the publicly available data and resources including the ATLAS/ICESat-2 L3A Land and Vegetation Height V006, NLCD Land Cover Product, and NOAA NHC Data Archive.
Conflicts of Interest
The authors declare no conflicts of interest.
References
- Lugo, A.E. Visible and invisible effects of hurricanes on forest ecosystems: An international review. Austral Ecol. 2008, 33, 368–398. [Google Scholar] [CrossRef] [Scilit]
- Gresham, C.A.; Williams, T.M.; Lipscomb, D.J. Hurricane Hugo Wind Damage to Southeastern U.S. Coastal Forest Tree Species. Biotropica 1991, 23, 420–426. [Google Scholar] [CrossRef] [Scilit]
- Xi, W.; Peet, R.K.; Urban, D.L. Changes in forest structure, species diversity and spatial pattern following hurricane disturbance in a Piedmont North Carolina forest, USA. J. Plant Ecol. 2008, 1, 43–57. [Google Scholar] [CrossRef] [Scilit]
- Xi, W.; Peet, R.K.; Lee, M.T.; Urban, D.L. Hurricane disturbances, tree diversity, and succession in North Carolina Piedmont forests, USA. J. For. Res. 2018, 30, 219–231. [Google Scholar] [CrossRef] [Scilit]
- Seidl, R.; Thom, D.; Kautz, M.; Martin-Benito, D.; Peltoniemi, M.; Vacchiano, G.; Wild, J.; Ascoli, D.; Petr, M.; Honkaniemi, J.; et al. Forest disturbances under climate change. Nat. Clim. Change 2017, 7, 395–402. [Google Scholar] [CrossRef] [Scilit] [PubMed]
- Cole, J.; Nowak, D.J.; Greenfield, E.J. Potential Hurricane Wind Risk to US Rural and Urban Forests. J. For. 2021, 119, 393–406. [Google Scholar] [CrossRef] [Scilit]
- Sharma, A.; Ojha, S.K.; Dimov, L.D.; Vogel, J.G.; Nowak, J. Long-term effects of catastrophic wind on southern US coastal forests: Lessons from a major hurricane. PLoS ONE 2021, 16, e0243362. [Google Scholar] [CrossRef] [Scilit] [PubMed]
- NOAA. National Hurricane Center, NHC Data Archive, Historical Tropical Cyclone Reports. Available online: https://www.nhc.noaa.gov/data/ (accessed on 10 November 2023).
- McElhinny, C.; Gibbons, P.; Brack, C.; Bauhus, J. Forest and woodland stand structural complexity: Its definition and measurement. For. Ecol. Manag. 2005, 218, 1–24. [Google Scholar] [CrossRef] [Scilit]
- Barry, P.; Doggett, C.; Anderson, R.L.; Swain, K.M. How to Evaluate and Manage Storm-Damaged Forest Areas. Available online: https://www.forestpests.org/storm/ (accessed on 10 September 2023).
- Ochoa, V.; Urbina-Cardona, N. Tools for spatially modeling ecosystem services: Publication trends, conceptual reflections and future challenges. Ecosyst. Serv. 2017, 26, 155–169. [Google Scholar] [CrossRef] [Scilit]
- Seidl, R.; Fernandes, P.M.; Fonseca, T.F.; Gillet, F.; Jönsson, A.M.; Merganičová, K.; Netherer, S.; Arpaci, A.; Bontemps, J.-D.; Bugmann, H.; et al. Modelling natural disturbances in forest ecosystems: A review. Ecol. Model. 2011, 222, 903–924. [Google Scholar] [CrossRef] [Scilit]
- Lindenmayer, D.B.; Westgate, M.J.; Scheele, B.C.; Foster, C.N.; Blair, D.P. Key perspectives on early successional forests subject to stand-replacing disturbances. For. Ecol. Manag. 2019, 454, 117656. [Google Scholar] [CrossRef] [Scilit]
- Lefsky, M.; Warren, B.C.; Parker, G.G.; Harding, D.J. LiDAR Remote Sensing for Ecosystem Studies. BioScience 2002, 52, 19–30. [Google Scholar] [CrossRef] [Scilit]
- Chave, J.; Rejou-Mechain, M.; Burquez, A.; Chidumayo, E.; Colgan, M.S.; Delitti, W.B.; Duque, A.; Eid, T.; Fearnside, P.M.; Goodman, R.C.; et al. Improved allometric models to estimate the aboveground biomass of tropical trees. Glob. Change Biol. 2014, 20, 3177–3190. [Google Scholar] [CrossRef] [Scilit] [PubMed]
- Wang, F.; Xu, Y.J. Comparison of remote sensing change detection techniques for assessing hurricane damage to forests. Environ. Monit. Assess. 2010, 162, 311–326. [Google Scholar] [CrossRef] [Scilit] [PubMed]
- Chehata, N.; Orny, C.; Boukir, S.; Guyon, D.; Wigneron, J.P. Object-based change detection in wind storm-damaged forest using high-resolution multispectral images. Int. J. Remote Sens. 2014, 35, 4758–4777. [Google Scholar] [CrossRef] [Scilit]
- Hu, T.; Smith, R. The Impact of Hurricane Maria on the Vegetation of Dominica and Puerto Rico Using Multispectral Remote Sensing. Remote Sens. 2018, 10, 827. [Google Scholar] [CrossRef] [Scilit]
- Coops, N.C.; Tompalski, P.; Goodbody, T.R.H.; Queinnec, M.; Luther, J.E.; Bolton, D.K.; White, J.C.; Wulder, M.A.; van Lier, O.R.; Hermosilla, T. Modelling LiDAR-derived estimates of forest attributes over space and time: A review of approaches and future trends. Remote Sens. Environ. 2021, 260, 112477. [Google Scholar] [CrossRef] [Scilit]
- Dassot, M.; Constant, T.; Fournier, M. The use of terrestrial LiDAR technology in forest science: Application fields, benefits and challenges. Ann. For. Sci. 2011, 68, 959–974. [Google Scholar] [CrossRef] [Scilit]
- Liu, H.; Shen, X.; Cao, L.; Yun, T.; Zhang, Z.; Fu, X.; Chen, X.; Liu, F. Deep Learning in Forest Structural Parameter Estimation Using Airborne LiDAR Data. IEEE J. Sel. Top. Appl. Earth Obs. Remote Sens. 2021, 14, 1603–1618. [Google Scholar] [CrossRef] [Scilit]
- Anderson, J.; Martin, M.E.; Smith, M.L.; Dubayah, R.O.; Hofton, M.A.; Hyde, P.; Peterson, B.E.; Blair, J.B.; Knox, R.G. The use of waveform lidar to measure northern temperate mixed conifer and deciduous forest structure in New Hampshire. Remote Sens. Environ. 2006, 105, 248–261. [Google Scholar] [CrossRef] [Scilit]
- Li, W.; Niu, Z.; Liang, X.; Li, Z.; Huang, N.; Gao, S.; Wang, C.; Muhammad, S. Geostatistical modeling using LiDAR-derived prior knowledge with SPOT-6 data to estimate temperate forest canopy cover and above-ground biomass via stratified random sampling. Int. J. Appl. Earth Obs. Geoinf. 2015, 41, 88–98. [Google Scholar] [CrossRef] [Scilit]
- Mulverhill, C.; Coops, N.C.; Hermosilla, T.; White, J.C.; Wulder, M.A. Evaluating ICESat-2 for monitoring, modeling, and update of large area forest canopy height products. Remote Sens. Environ. 2022, 271, 112919. [Google Scholar] [CrossRef] [Scilit]
- Wang, X.; Cheng, X.; Gong, P.; Huang, H.; Li, Z.; Li, X. Earth science applications of ICESat/GLAS: A review. Int. J. Remote Sens. 2011, 32, 8837–8864. [Google Scholar] [CrossRef] [Scilit]
- Dolan, K.A.; Hurtt, G.C.; Chambers, J.Q.; Dubayah, R.O.; Frolking, S.; Masek, J.G. Using ICESat’s Geoscience Laser Altimeter System (GLAS) to assess large-scale forest disturbance caused by hurricane Katrina. Remote Sens. Environ. 2011, 115, 86–96. [Google Scholar] [CrossRef] [Scilit]
- Yu, Q.; Ryan, M.G.; Ji, W.; Prihodko, L.; Anchang, J.Y.; Kahiu, N.; Nazir, A.; Dai, J.; Hanan, N.P. Assessing canopy height measurements from ICESat-2 and GEDI orbiting LiDAR across six different biomes with G-LiHT LiDAR. Environ. Res. Ecol. 2024, 3, 025001. [Google Scholar] [CrossRef] [Scilit]
- Neumann, T.A.; Martino, A.J.; Markus, T.; Bae, S.; Bock, M.R.; Brenner, A.C.; Brunt, K.M.; Cavanaugh, J.; Fernandes, S.T.; Hancock, D.W.; et al. The Ice, Cloud, and Land Elevation Satellite—2 Mission: A Global Geolocated Photon Product Derived From the Advanced Topographic Laser Altimeter System. Remote Sens. Environ. 2019, 233, 111325. [Google Scholar] [CrossRef] [Scilit] [PubMed]
- Dubayah, R.; Blair, J.B.; Goetz, S.; Fatoyinbo, L.; Hansen, M.; Healey, S.; Hofton, M.; Hurtt, G.; Kellner, J.; Luthcke, S.; et al. The Global Ecosystem Dynamics Investigation: High-resolution laser ranging of the Earth’s forests and topography. Sci. Remote Sens. 2020, 1, 100002. [Google Scholar] [CrossRef] [Scilit]
- Neuenschwander, A.; Pitts, K.; Jelley, B.; Robbins, J.; Markel, J.; Popescu, S.; Nelson, R.; Harding, D.; Pederson, D.; Klotz, B.; et al. Ice, Cloud, and Land 26 Elevation Satellite (ICESat-2) Project Algorithm Theoretical Basis Document (ATBD) for Land—Vegetation Along-Track Products (ATL08), Version 6; National Aeronautics and Space Administration (NASA) Goddard Space Flight Center: Greenbelt, MD, USA, 2022. Available online: https://icesat-2.gsfc.nasa.gov/sites/default/files/page_files/ICESat2_ATL08_ATBD_r002_v2.pdf (accessed on 15 May 2024).
- Brown, M.E.; Arias, S.D.; Chesnes, M. Review of ICESat and ICESat-2 literature to enhance applications discovery. Remote Sens. Appl. Soc. Environ. 2023, 29, 100874. [Google Scholar] [CrossRef] [Scilit]
- Abdalati, W.; Zwally, H.J.; Bindschadler, R.; Csatho, B.; Farrell, S.L.; Fricker, H.A.; Harding, D.; Kwok, R.; Lefsky, M.; Markus, T.; et al. The ICESat-2 Laser Altimetry Mission. Proc. IEEE 2010, 98, 735–751. [Google Scholar] [CrossRef] [Scilit]
- Markus, T.; Neumann, T.; Martino, A.; Abdalati, W.; Brunt, K.; Csatho, B.; Farrell, S.; Fricker, H.; Gardner, A.; Harding, D.; et al. The Ice, Cloud, and land Elevation Satellite-2 (ICESat-2): Science requirements, concept, and implementation. Remote Sens. Environ. 2017, 190, 260–273. [Google Scholar] [CrossRef] [Scilit]
- Neuenschwander, A.; Pitts, K. The ATL08 land and vegetation product for the ICESat-2 Mission. Remote Sens. Environ. 2019, 221, 247–259. [Google Scholar] [CrossRef] [Scilit]
- Neuenschwander, A.; Guenther, E.; White, J.C.; Duncanson, L.; Montesano, P. Validation of ICESat-2 terrain and canopy heights in boreal forests. Remote Sens. Environ. 2020, 251, 112110. [Google Scholar] [CrossRef] [Scilit]
- Li, W.; Niu, Z.; Shang, R.; Qin, Y.; Wang, L.; Chen, H. High-resolution mapping of forest canopy height using machine learning by coupling ICESat-2 LiDAR with Sentinel-1, Sentinel-2 and Landsat-8 data. Int. J. Appl. Earth Obs. Geoinf. 2020, 92, 102163. [Google Scholar] [CrossRef] [Scilit]
- Malambo, L.; Popescu, S.C. Assessing the agreement of ICESat-2 terrain and canopy height with airborne LiDAR over US ecozones. Remote Sens. Environ. 2021, 266, 112711. [Google Scholar] [CrossRef] [Scilit]
- Neuenschwander, A.; Pitts, K.L.; Jelley, B.P.; Robbins, J.; Markel, J.; Popescu, S.C.; Nelson, R.F.; Harding, D.; Pederson, D.; Klotz, B.; et al. ATLAS/ICESat-2 L3A Land and Vegetation Height, Version 6; NASA: Boulder, CO, USA, 2023. [Google Scholar] [CrossRef] [Scilit]
- Neuenschwander, A.; Pitts, K.L.; Jelley, B.P.; Robbins, J.; Markel, J.; Popescu, S.C.; Nelson, R.F.; Harding, D.; Pederson, D.; Klotz, B.; et al. ATLAS/ICESat-2 L3A Land and Vegetation Height, Version 5; NASA: Boulder, CO, USA, 2021. [Google Scholar] [CrossRef] [Scilit]
- Feng, T.; Duncanson, L.; Montesano, P.; Hancock, S.; Minor, D.; Guenther, E.; Neuenschwander, A. A systematic evaluation of multi-resolution ICESat-2 ATL08 terrain and canopy heights in boreal forests. Remote Sens. Environ. 2023, 291, 113570. [Google Scholar] [CrossRef] [Scilit]
- Chen, F.; Zhang, X.; Wang, L.; Du, B.; Dang, S.; Wang, L. Systematic Evaluation of Multi-Resolution ICESat-2 Canopy Height Data: A Case Study of the Taranaki Region. Remote Sens. 2023, 15, 5686. [Google Scholar] [CrossRef] [Scilit]
- Fernandez-Diaz, J.C.; Velikova, M.; Glennie, C.L. Validation of ICESat-2 ATL08 Terrain and Canopy Height Retrievals in Tropical Mesoamerican Forests. IEEE J. Sel. Top. Appl. Earth Obs. Remote Sens. 2022, 15, 2956–2970. [Google Scholar] [CrossRef] [Scilit]
- Neuenschwander, A.L.; Magruder, L.A. Canopy and Terrain Height Retrievals with ICESat-2: A First Look. Remote Sens. 2019, 11, 1721. [Google Scholar] [CrossRef] [Scilit]
- NOAA. National Hurricane Center Tropical Cyclone Report: Hurricane Sally. 2021. Available online: www.nhc.noaa.gov/data/tcr/AL152020_Omar.pdf (accessed on 15 May 2024).
- NOAA. The Saffir-Simpson Hurricane Wind Scale; Atmospheric Administration: Washington, DC, USA, 2021.
- AFC. The Alabama Forestry Commission Storm Damage Assessment Report Hurricane Sally—September 16, 2020; Alabama Forestry Commission: Montgomery, AL, USA, 2020. Available online: https://forestry.alabama.gov/Pages/News/2020/10/Hurricane_Sally_Report.pdf (accessed on 15 September 2023).
- NLCD. National Land Cover Database 2019 (NLCD 2019) for the Conterminous United States. Available online: https://www.mrlc.gov/data (accessed on 15 May 2024).
- Chen, X.; Fraser, R. Quantifying Impacts of Land Ownership on Regional Forest NDVI Dynamics: A Case Study at Bankhead National Forest in Alabama, USA. Photogramm. Eng. Remote Sens. 2009, 75, 997–1003. [Google Scholar]
- Schweitzer, C.J.; Wang, Y. Overstory tree status following thinning and burning treatments in mixed pine-hardwood stands on the william b. Bankhead national forest, alabama. In Proceedings of the 15th Biennial Southern Silvicultural Research Conference; General Technical Report SRS-GTR-175; USDA Forest Service, Southern Research Station: Asheville, NC, USA, 2013; 585p. [Google Scholar]
- ESRI. ArcGIS Pro, version 3.1.3; Esri: Redlands, CA, USA, 2024.
- USGS. US Geological Survey, USGS 3D Elevation Program Digital Elevation Model. 2020. Available online: https://apps.nationalmap.gov/ (accessed on 15 May 2024).
- Isenberg, M. LAStools—Efficient LiDAR Processing Software. Available online: https://rapidlasso.com/lastools/ (accessed on 15 March 2024).
- Roussel, J.-R.; Auty, D.; Coops, N.C.; Tompalski, P.; Goodbody, T.R.H.; Meador, A.S.; Bourdon, J.-F.; de Boissieu, F.; Achim, A. lidR: An R package for analysis of Airborne Laser Scanning (ALS) data. Remote Sens. Environ. 2020, 251, 112061. [Google Scholar] [CrossRef] [Scilit]
- Narine, L.L.; Popescu, S.; Neuenschwander, A.; Zhou, T.; Srinivasan, S.; Harbeck, K. Estimating aboveground biomass and forest canopy cover with simulated ICESat-2 data. Remote Sens. Environ. 2019, 224, 1–11. [Google Scholar] [CrossRef] [Scilit]
- Tiwari, K.; Narine, L.L. A Comparison of Machine Learning and Geostatistical Approaches for Mapping Forest Canopy Height over the Southeastern US Using ICESat-2. Remote Sens. 2022, 14, 5651. [Google Scholar] [CrossRef] [Scilit]
- Narine, L.L.; Popescu, S.C.; Malambo, L. Using ICESat-2 to Estimate and Map Forest Aboveground Biomass: A First Example. Remote Sens. 2020, 12, 1824. [Google Scholar] [CrossRef] [Scilit]
- Rai, N.; Ma, Q.; Poudel, K.P.; Himes, A.; Meng, Q. Evaluating the Uncertainties in Forest Canopy Height Measurements Using ICESat-2 Data. J. Remote Sens. 2024, 4, 0160. [Google Scholar] [CrossRef] [Scilit]
- Narine, L.; Malambo, L.; Popescu, S. Characterizing canopy cover with ICESat-2: A case study of southern forests in Texas and Alabama, USA. Remote Sens. Environ. 2022, 281, 113242. [Google Scholar] [CrossRef] [Scilit]
- Everham, E.M.; Brokaw, N.V.L. Forest Damage and Recovery from Catastrophic Wind. Bot. Rev. 1996, 62, 113–185. [Google Scholar] [CrossRef] [Scilit]
- Rutledge, B.T.; Cannon, J.B.; McIntyre, R.K.; Holland, A.M.; Jack, S.B. Tree, stand, and landscape factors contributing to hurricane damage in a coastal plain forest: Post-hurricane assessment in a longleaf pine landscape. For. Ecol. Manag. 2021, 481, 118724. [Google Scholar] [CrossRef] [Scilit]
- Gautam, A.; Narine, L.L.; Anderson, C.J.; Cristan, R. Synergistic use of ICESat-2 LiDAR data and Sentinel-2 imagery for assessing hurricane-driven forest changes. Environ. Monit. Assess. 2025, 197, 1310. [Google Scholar] [CrossRef] [Scilit] [PubMed]
- Bueno, I.T.; Silva, C.A.; Hamamura, C.; Donovan, V.M.; Sharma, A.; Qiu, J.; Xia, J.; Brock, K.M.; Schlickmann, M.B.; Atkins, J.W.; et al. Aboveground biomass density maps for post-hurricane Ian forest monitoring in Florida. Sci. Data 2025, 12, 1189. [Google Scholar] [CrossRef] [Scilit] [PubMed]
- Pourshamsi, M.; Garcia, M.; Lavalle, M.; Balzter, H. A Machine-Learning Approach to PolInSAR and LiDAR Data Fusion for Improved Tropical Forest Canopy Height Estimation Using NASA AfriSAR Campaign Data. IEEE J. Sel. Top. Appl. Earth Obs. Remote Sens. 2018, 11, 3453–3463. [Google Scholar] [CrossRef] [Scilit]
- Malambo, L.; Popescu, S. Mapping vegetation canopy height across the contiguous United States using ICESat-2 and ancillary datasets. Remote Sens. Environ. 2024, 309, 114226. [Google Scholar] [CrossRef] [Scilit]

Disclaimer/Publisher’s Note: The statements, opinions and data contained in all publications are solely those of the individual author(s) and contributor(s) and not of MDPI and/or the editor(s). MDPI and/or the editor(s) disclaim responsibility for any injury to people or property resulting from any ideas, methods, instructions or products referred to in the content. |
© 2026 by the authors. Licensee MDPI, Basel, Switzerland. This article is an open access article distributed under the terms and conditions of the Creative Commons Attribution (CC BY) license.