


Highlights
What are the main findings?
- ReSFANet, a point-level supervision deep learning framework, achieves 86.72% precision and a 75.54% F1-score in detecting individual urban trees from very-high-resolution multispectral satellite imagery at 30 cm resolution, with 1.473 m localization accuracy.
- Percentile-based threshold calibration effectively suppresses false positives in tree-free scenes while maintaining robust performance across heterogeneous urban environments, including public parks, private gardens, and industrial areas.
What are the implications of the main findings?
- The framework supports automated, cost-effective tree inventory generation at scale, overcoming field survey limitations and including private areas generally excluded from urban public inventories.
- Periodic satellite monitoring supports the EU Biodiversity Strategy 2030 and Italian legislation compliance, enabling urban canopy tracking for climate adaptation and ecosystem service assessment.
Abstract
Monitoring urban biodiversity is essential for designing resilient and sustainable cities. Urban trees provide a wide range of ecosystem services (ESs), including air pollution reduction, urban heat island mitigation, and psychological benefits for citizens. Accurate and updated tree inventories are therefore essential tools for urban environmental monitoring. However, existing urban tree inventories are often incomplete or outdated, especially in private areas, limiting accurate ES assessment and urban planning. Earth observation satellite missions, particularly very-high-resolution multispectral (VHR-MS) imagery, offer a valuable alternative to field surveys for gathering information on urban environments. This work proposes a deep learning (DL) framework based on VHR-MS satellite imagery for the automatic generation of accurate urban tree inventories. DL models reduce human effort and save operational time by automatically learning complex representations and patterns from satellite imagery. The proposed encoder–decoder architecture extends prior point-based detection approaches by integrating a ResNet-50 backbone and a percentile-based threshold calibration procedure. Given the lack of suitable training data covering heterogeneous and densely vegetated urban environments, a dedicated dataset was constructed from VHR-MS satellite imagery acquired over the Lombardy region (Italy). The dataset encompasses a wide range of land uses and land covers, including residential and industrial zones, public parks, private gardens, and agricultural areas. Through the photointerpretation of more than 2800 images, precise coordinates for more than 50,000 manually annotated trees were obtained. The DL model is trained with point-level annotations, enabling precise localization of individual trees while reducing annotation ambiguity in dense urban contexts. On the Lombardy dataset at 30 cm/px resolution, the proposed framework achieves 86.72% Precision, 66.92% Recall, an F1-score of 75.54%, and a localization error of 1.473 m.
1. Introduction
Urban trees, urban parks, private gardens, and green roofs constitute urban infrastructures employed as a nature-based and cost-effective solution for the design of sustainable and resilient cities [1]. The provided ecosystem services (ESs) benefit the urban environment, including air pollution mitigation, urban heat island mitigation, and stormwater runoff regulation [2,3]. In addition, trees in green areas enhance citizens’ quality of life by providing psychological and social benefits, such as reducing stress and promoting social interaction [4].
The importance of the benefits is reflected in national and international regulatory frameworks that promote the protection and expansion of urban green areas. Such international initiatives require the development of accurate tree inventories as a key instrument to support compliance and monitor progress towards sustainability and biodiversity targets.
Therefore, information on tree locations and characteristics such as height, crown size, species, and health status is essential for supporting urban planning, climate adaptation strategies, and urban-scale environmental monitoring. However, accurate urban tree inventories are not universally available across cities.
When present, they are frequently outdated due to the continuous evolution of urban landscapes and incomplete with respect to private areas, which are typically excluded from public inventories despite hosting a substantial fraction of the urban vegetation. According to [5,6,7], the reasons are both practical and epistemological: field campaigns for maintaining public tree inventories are time-consuming, expensive, and inefficient at scale in large municipalities. Trees on private property are subject to access restrictions and diverse management practices, which prevent accurate mapping. Moreover, for systematic studies in the past literature, private trees were considered less relevant than natural ecosystems due to their artificial structure. These limitations motivate the development of automated tools for the systematic and periodic maintenance of tree inventories across both public and private areas.
Remote sensing and Earth observation products, such as LiDAR (Light Detection and Ranging) data and aerial imagery, offer a viable alternative for large-scale monitoring. Airborne LiDAR sensors, mounted on drones or planes, provide highly accurate three-dimensional reconstructions enabling the estimation of tree position, height, and crown shape [8,9]. However, high acquisition and processing costs, together with often fragmented LiDAR coverage and infrequent data updates, reduce the applicability for large-scale or periodic urban monitoring [10].
Remote sensing imagery offers several advantages over LiDAR, including lower costs, broader spatial coverage, and the possibility for periodic acquisitions. Commercial satellite platforms for very high resolution (VHR) image acquisition, such as WorldView-2, WorldView-3, and Pléiades Neo, and Unmanned Aerial Vehicles (UAVs) equipped with multispectral (MS) cameras have further enhanced spatial and spectral resolution, supporting large-scale mapping of individual trees [10].
Recent advances in computer vision have improved the automatic analysis of large-scale remote sensing images. In particular, Deep Learning (DL) approaches, capable of learning high-level representations from images, replaced earlier methods based on pixel-level classification and hand-crafted features. Within the specific task of urban tree detection, DL-based methods can be grouped into four approaches, differing in the required supervision and in the output granularity [11].
Semantic segmentation methods classify each pixel as tree or background, producing dense maps of tree canopy coverage. Although these methods delimit vegetated areas well, they typically do not localize individual trees without additional post-processing [12,13,14,15]. Object detection approaches, by contrast, identify and localize individual trees through bounding boxes. Recent detectors based on Convolutional Neural Networks (CNNs), such as Faster R-CNN, YOLO, and RetinaNet, have been successfully applied to aerial and satellite imagery for single tree localization. However, creating individual bounding box annotations is expensive and time-consuming, especially in dense urban environments where tree crowns frequently overlap [16,17,18]. Instance segmentation approaches extend object detection by providing per-tree crown definition, combining the advantages of object detection and semantic segmentation. However, defining accurate crown contours is even more demanding than defining bounding box annotations [19,20,21,22].
Point-based detection is an alternative approach that reduces the annotation effort. Each tree is marked with a single point indicating its location, and the network learns to regress a confidence map where peaks correspond to individual trees. This approach is inspired by the crowd counting literature, where dense point annotations of humans in congested scenes are used to learn the position of individuals [23]. In the literature, point-level supervision has proven effective for tree counting even in dense and cluttered scenes [24,25,26].
Methods based on object detection or instance segmentation require substantial effort to generate new ground truth annotations, posing a significant operational constraint when fine-tuning DL models to adapt to new geographic regions. In contrast, point-based detection approaches considerably reduce supervision costs and simplify the labeling process, because annotators only need to define tree locations rather than explicitly delineate canopy boundaries. Current point-based tree detection methods rely on conventional backbones originally developed for crowd counting tasks, such as VGG-16 [24,25,26]. However, these architectures exhibit limited capability to capture and abstract the complex spectral characteristics of VHR satellite imagery, thereby limiting the extraction of discriminative features and ultimately reducing detection accuracy.
Moreover, existing annotated datasets primarily focus on densely vegetated scenes [24,26], overlooking scenarios characterized by sparse or absent trees.This limitation becomes particularly problematic during large-scale inference of urban and peri-urban contexts, where non-vegetated areas are frequent. As a consequence, DL models tend to generate a substantial amount of false positives by predicting trees in regions where none exist.
This work addresses these challenges by presenting a DL framework for automatic individual tree detection (ITD) in VHR MS satellite imagery using point-level supervision. The main contributions include:
- A tree detection architecture (ReSFANet—ResNet Scale-aware Feature Aggregation Network) that improves the state-of-the-art method [26] in two directions: (1) the replacement of the VGG-16 backbone with a ResNet-50 encoder, which reduces model complexity while enhancing feature extraction, and (2) a novel percentile-based tree localization procedure that calibrates the model on the geographical context.
- A novel dataset (Lombardy) composed of over 2800 VHR satellite images with 50,000 manually annotated tree locations in the districts of Monza e Brianza and Varese (Lombardy region, Italy). Images capture various urban land uses, including residential zones, industrial areas, public parks, private gardens, and agricultural spaces, characterized by a variable density of trees. All images are acquired by the Pléiades Neo (PNEO) mission and have a Ground Sampling Distance (GSD) of 30 cm/px and six MS bands.
- An extensive evaluation of the proposed framework conducted on the California benchmark dataset [26] and on the newly created Lombardy dataset, demonstrating improvements in localization accuracy: on the California dataset, the proposed ReSFANet achieves a 77.63% F1-score (+4.23% over the baseline), while on the more challenging Lombardy dataset at 60 cm/px GSD, it achieves 84.34% Precision, (+14.63% over the baseline), with comparable Recall of 59.08% (−1.31%). On the native PNEO resolution (30 cm/px), ReSFANet achieves 86.72% Precision and 66.92% Recall. Finally, removing smaller trees (crown radius < 2 m), which are negligible for the urban ecosystem service assessment, improves the Recall to 77.48% (+10.56%).
The rest of this paper is structured as follows: Section 2 illustrates the study area and the datasets used for the experiments; Section 3 describes the proposed framework, the DL model and the final ITD approach; Section 4 presents the results, the impact of the introduced changes, and further practical insights; Section 5 discusses the results from the perspective of real-world applications and operational implications; and Section 6 draws the conclusions.
2. Datasets
The experimental setup of this work exploits two VHR-MS satellite image datasets captured over heterogeneous geographical contexts. The Lombardy dataset, presented in Section 2.1, was manually created by annotating VHR MS satellite imagery over a study area in the Lombardy region (Italy). The California dataset, published by [26] and described in Section 2.2, is a collection of aerial imagery depicting urban environments across several California cities.
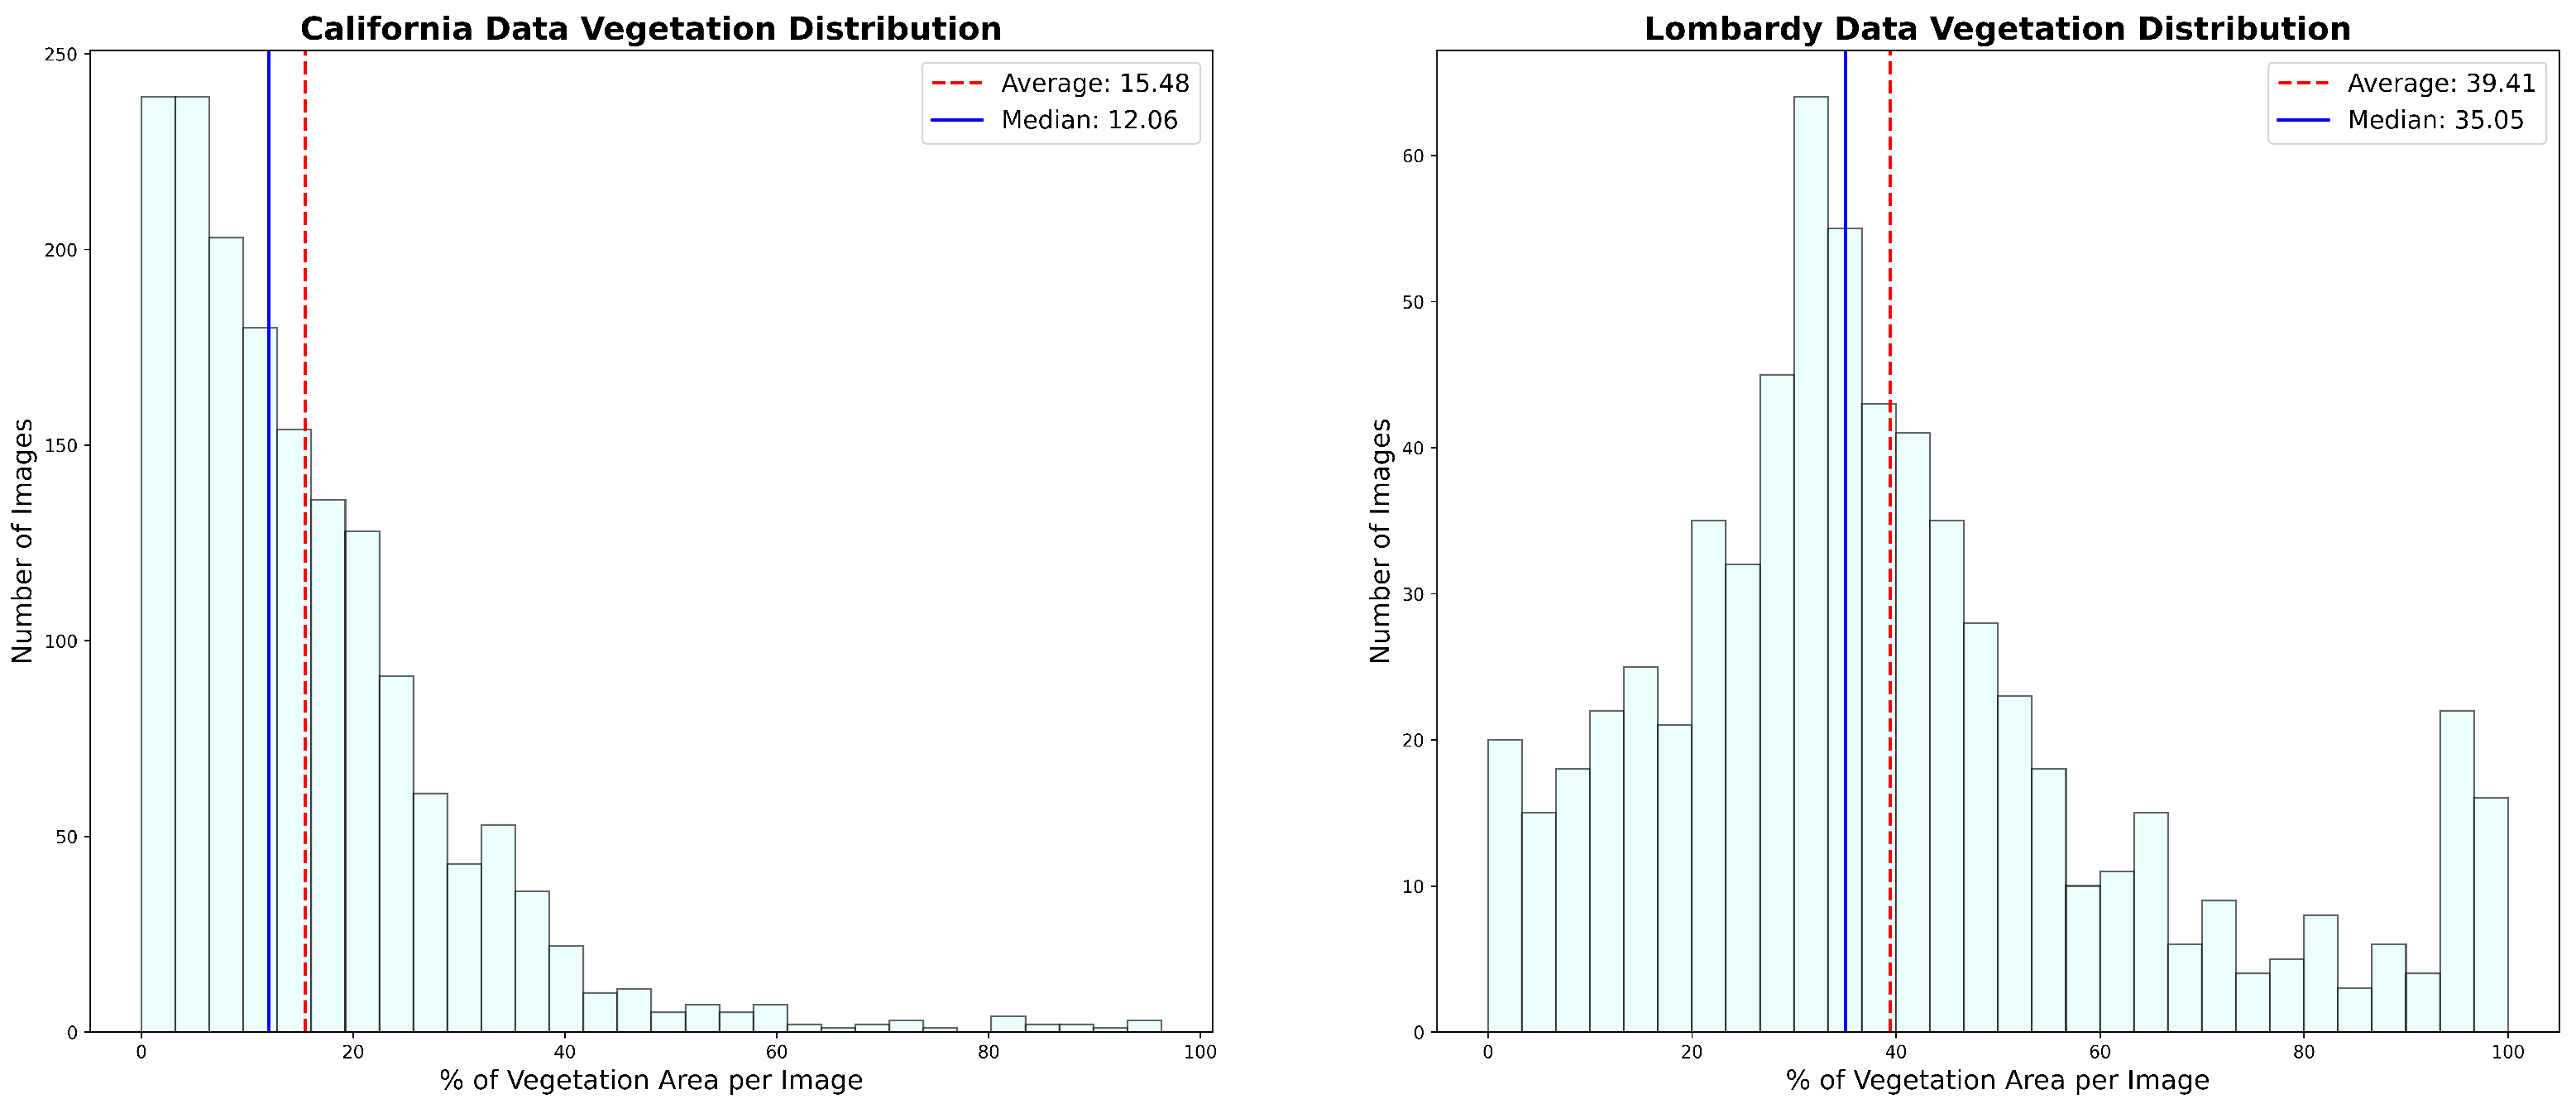
The urban landscape of Italian cities differs significantly from that found in the California dataset, being characterized by more green areas, both extensive and fragmented, embedded in the urban fabric. This fact can be appreciated by calculating the Normalized Difference Vegetation Index (NDVI) for all images in both datasets and applying a threshold of 0.3 to localize the vegetated areas. Figure 1 shows the distribution of the image fraction covered by vegetation. Images in the Lombardy dataset exhibit, on average, higher vegetation coverage than images in the California dataset. Most images of California cities are characterized by a small fraction of vegetated areas (15.5% on average), much lower than that in Italian scenes, which have an average of 39.4%. The greener scenario increases the challenge of ITD because the model must discriminate trees from other types of vegetation (e.g., shrubs, hedges, and grass). Therefore, for urban scenes in the Lombardy collection, the contrast between individual trees and the background is generally less pronounced, and the landscape appears more cluttered than the California dataset.
Figure 1.
Distribution of green area across the two datasets. Each histogram shows the percentage of green area () per image, with the x-axis reporting the percentage and the y-axis the number of images. Average and median are indicated by vertical dashed red and solid blue lines, respectively.
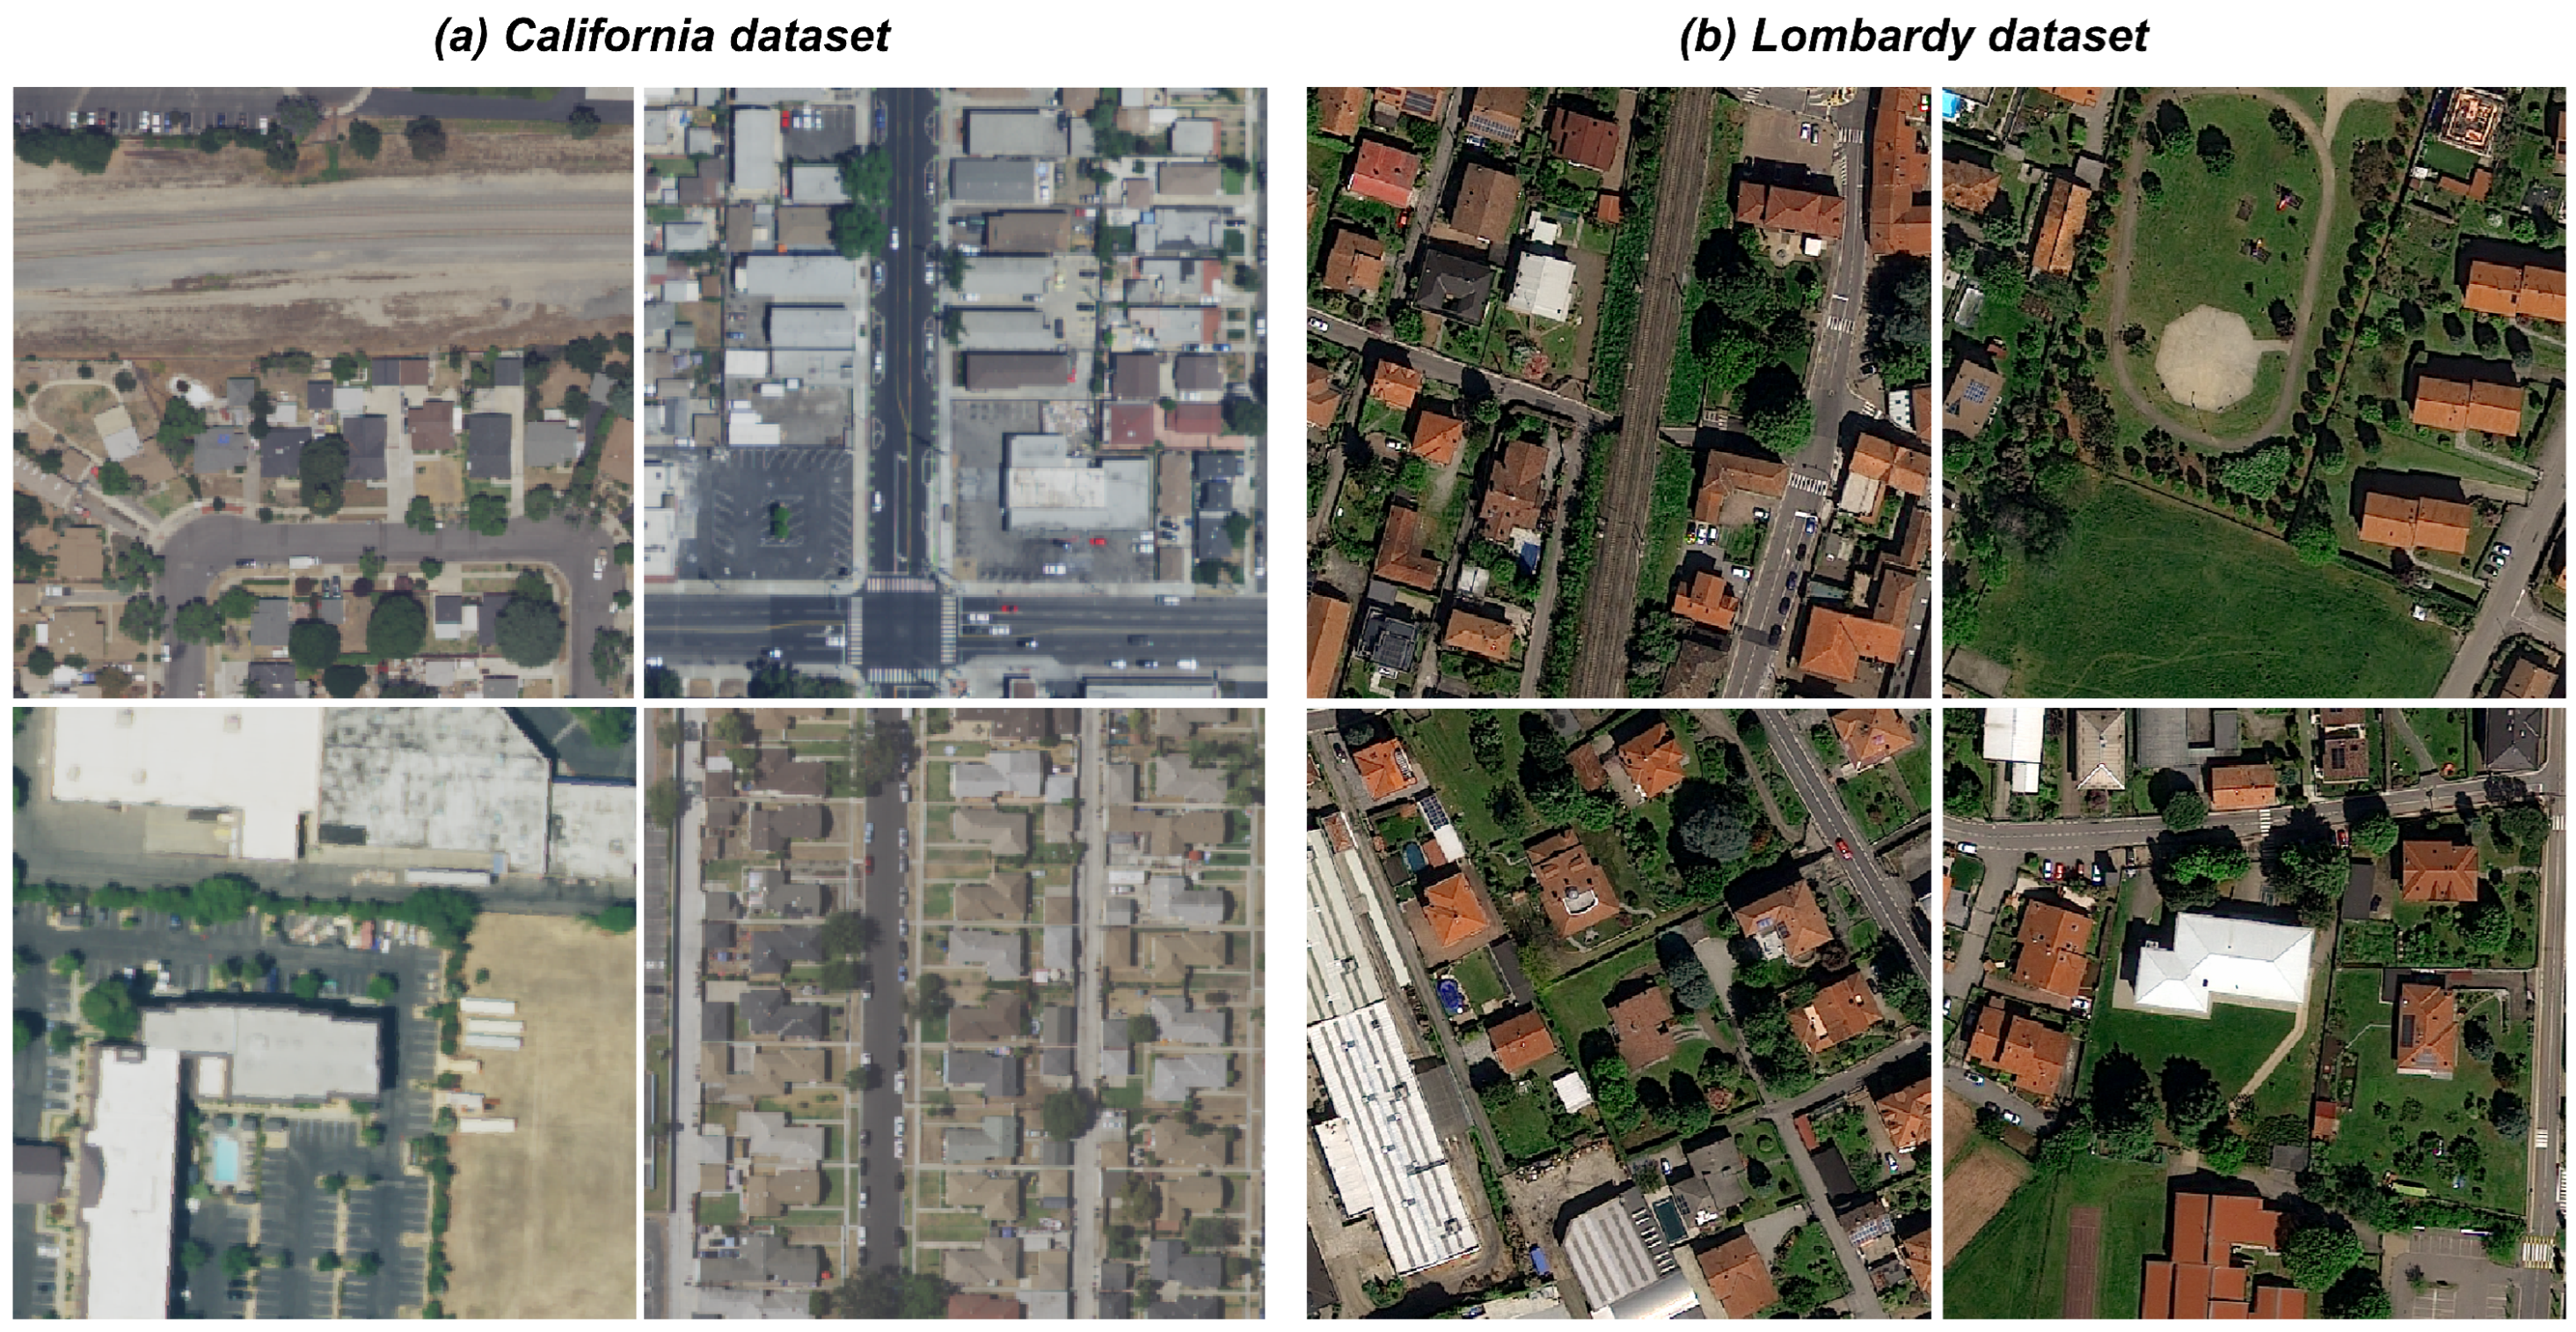
Figure 2 shows examples of images from both datasets.
Figure 2.
Examples of urban scenes from the two datasets. (a) shows images from the California dataset, while (b) illustrates images from the Lombardy dataset. A larger fraction of vegetated areas of diverse types is visible in the Lombardy dataset.
The Lombardy dataset is used to evaluate detection performance on satellite images depicting urban scenarios with greater green coverage and more diverse land use/land cover scenarios. The California dataset is employed for the performance comparison with the original method of [26] and for assessing the generalization ability of ReSFANet across very diverse geographic contexts and urban landscapes.
2.1. The Lombardy Dataset
Lombardy is an administrative region in northern Italy and one of the most densely populated spaces in Europe, with an area of 23,844 km2 hosting more than 10 million residents. The region falls within the Mediterranean climate zone with high annual precipitation favoring a rich and heterogeneous urban and peri-urban vegetation cover, comprising a diverse mix of broadleaf and evergreen species.
The 2025 municipal statistics identify four municipalities with more than 100,000 residents: Milano, Brescia, Monza, and Bergamo [27,28]. In this work, the city of Monza was selected as the primary study area. Monza is a densely populated city, characterized by high building continuity, extensive infrastructure networks, and dense residential fabric [29]. The city hosts several urban green spaces, most notably the Monza Park, one of the largest urban parks in Europe [30], as well as other scattered green areas that contribute to a heterogeneous land cover structure. This combination of dense urban fabric and vegetated surfaces makes Monza a particularly challenging study area for automatic ITD.
The Lombardy dataset contains PNEO satellite imagery, with six spectral channels (Deep Blue, Blue, Green, Red, Red Edge, Near-infrared). The PNEO product provides a panchromatic (PAN) band at 30 cm/px GSD and MS bands at 1.2 m GSD. Spectral bands were upsampled to the full PAN resolution by using the Fast Weighted Gram–Schmidt pansharpening algorithm [31], as implemented in ArcGIS (version 3.3.0).
Band-specific weights were set as follows: Red: 0.3137; Green: 0.4677; Blue: 0.0404; and NIR: 0.1782. Before pansharpening, a high-pass filter was applied to the PAN band to enhance spatial detail and edge sharpness [32]. The resulting pansharpened imagery, originally encoded at 16-bit radiometric depth, was rescaled to 8-bit through a look-up table [33].
The dataset comprises 2836 satellite images with a size of px at 30 cm/px resolution covering an area of m. To enable comparison with the California dataset, a rescaled version of the Lombardy dataset was constructed by downsampling the imagery to 60 cm/px resolution while maintaining the same input image size of px, resulting in 709 tiles covering an area of m each. The dataset comprises 16% of images depicting vegetated areas without trees (e.g., gardens, agricultural fields, shrubs) to enhance the DL model’s ability to identify trees within general vegetation.
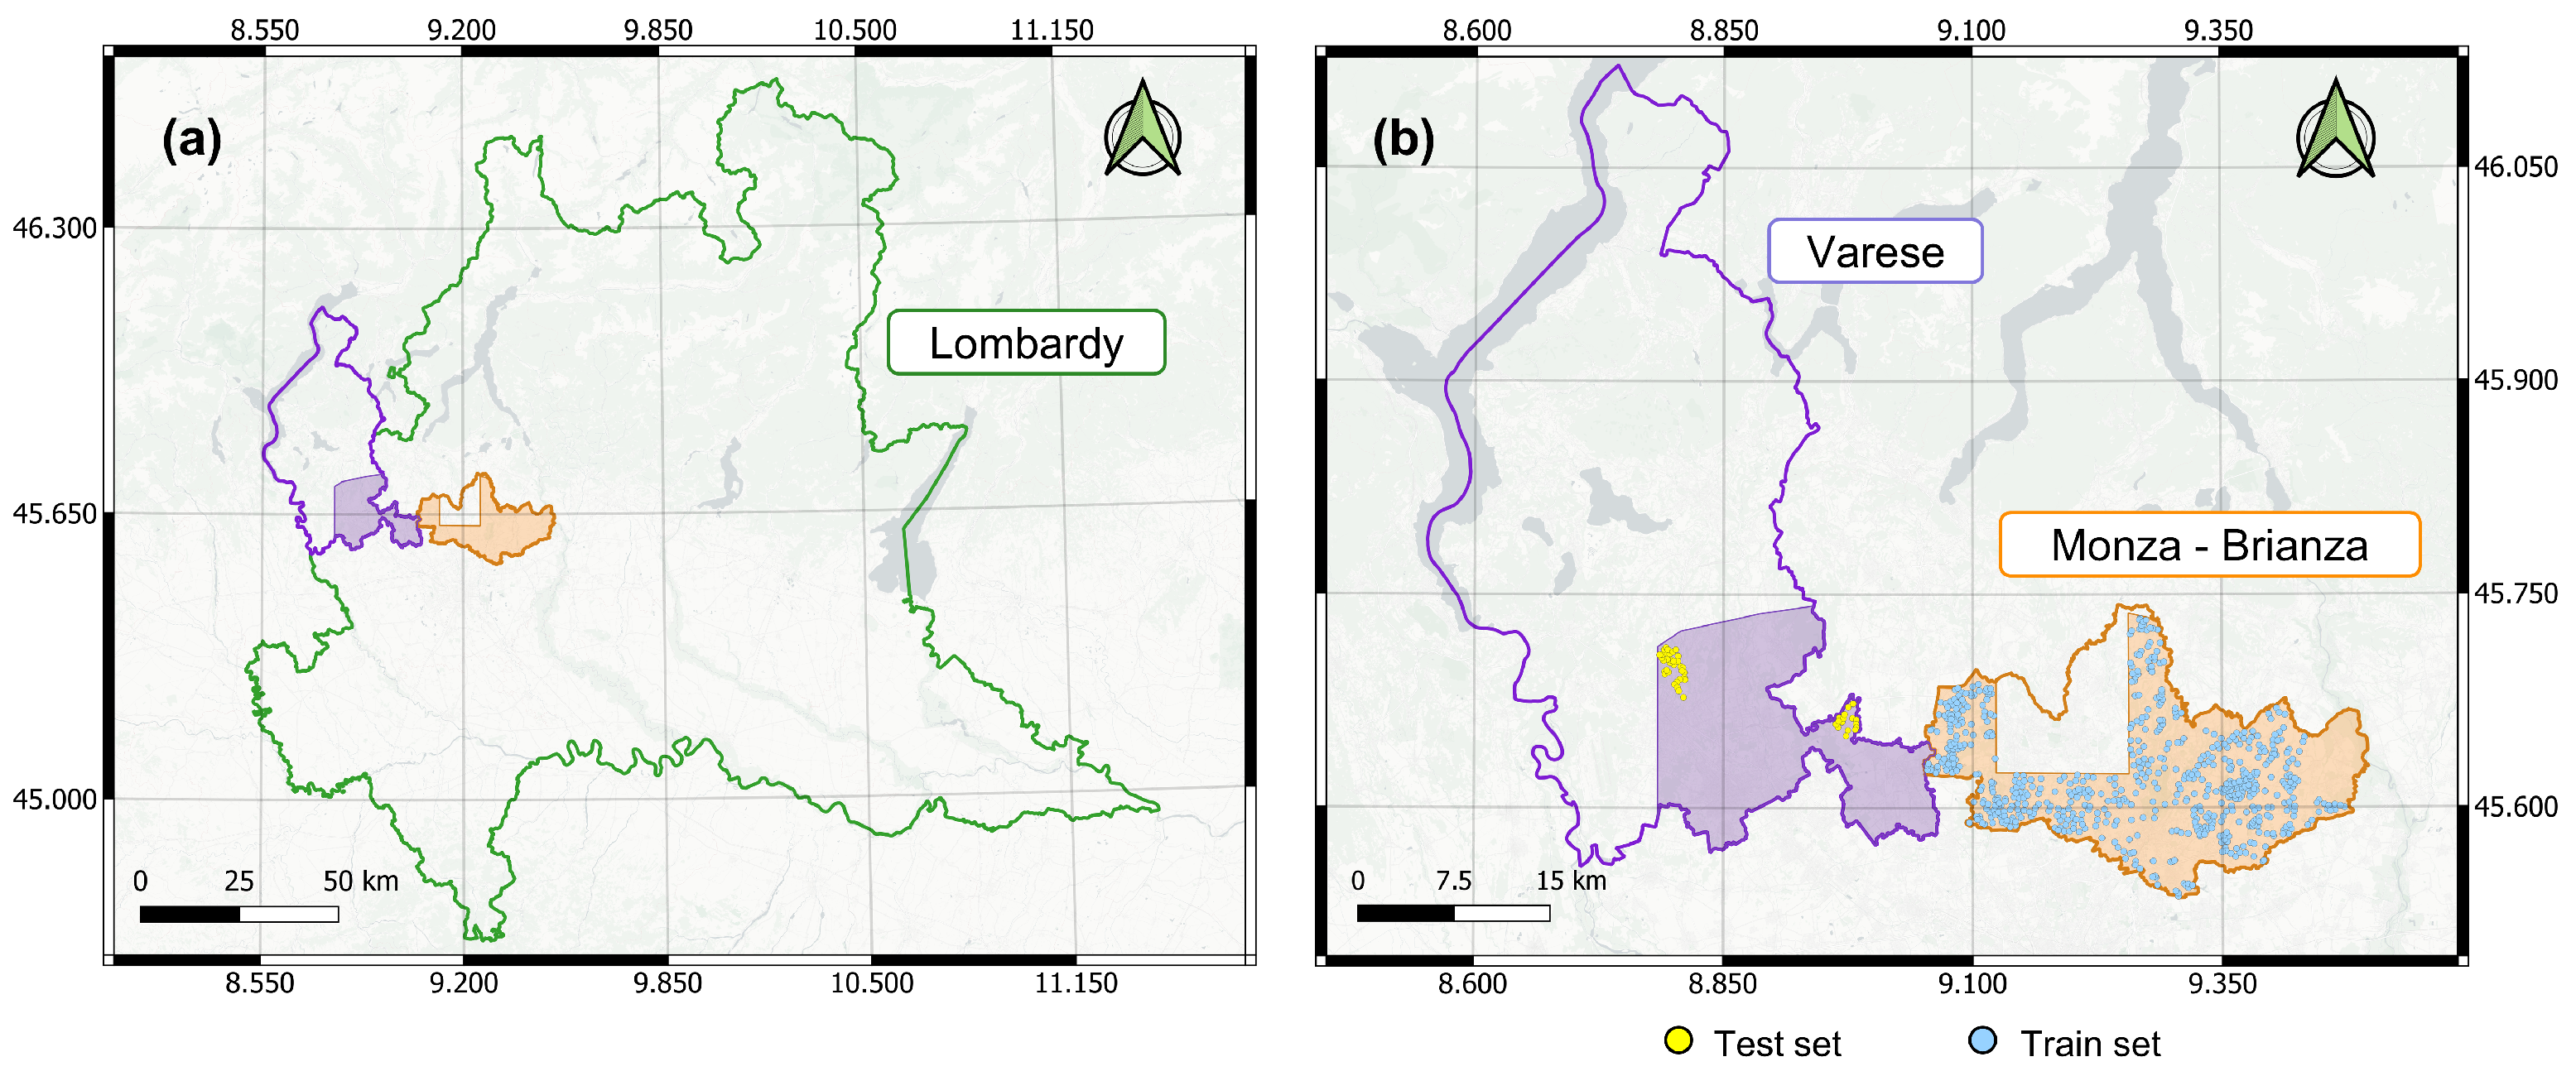
Initial tree annotations were derived from the publicly available Tree layer of the Lombardy Geoportal (Database Geo-Topografico (https://inspire-geoportal.ec.europa.eu/srv/api/records/r_lombar:0092b7ba-c697-433b-b5f2-9f9d9b8694e3, accessed on 12 June 2024). Two expert operators manually inspected all image tiles to ensure annotation quality. This revision added the trees on private land not covered by the public inventory and fixed the temporal discrepancies between the satellite acquisition date and the database creation date. Where the trunk location was not directly visible, the canopy center was adopted as the best approximation. Ambiguous cases, including small tree instances or shrubs that are hard to discern from satellite imagery, were resolved through cross-referencing with higher-resolution Google Earth imagery. Uncertain instances were flagged and independently reviewed by the second annotator to confirm tree presence. The revised dataset comprises 47,179 individual tree annotations in the training split of 2636 image tiles across the province of Monza e Brianza and 3990 trees in the test split of 200 image tiles within the province of Varese, as shown in Figure 3. Despite the similar geographical context, this strategy ensures that training and test sites are geographically disjoint, preventing data leakage between splits. A random subset comprising 10% of the training data is sampled as the validation split. The validation set preserves the class distribution of the training dataset with respect to the proportion of tree-containing and tree-free images. Specifically, tree-free images account for 15% of the validation set, compared to 16% in the full training dataset.
Figure 3.
Overview of the Lombardy study area. (a) represents the Lombardy region with the two provinces considered for data collection: Monza e Brianza (orange) and Varese (purple). In (b), a zoomed view of the two provinces shows the locations of collected images, with training samples in blue and test samples in yellow. The shaded orange and purple areas indicate regions where PNEO images are available.
2.2. The California Dataset
Urban areas in California are characterized by the structured layout typical of North American suburbs. Figure 2a displays urban environments defined by highly regular spatial patterns, where individual trees are positioned at constant intervals along road networks or within private residential plots.
The imagery in the California dataset [26] was sourced from the United States National Agriculture Imagery Program (NAIP), which provides aerial MS acquisitions at a resolution of 60 cm/px across the United States at biennial intervals. Each image measures px and comprises Blue, Green, Red, and Near-infrared (NIR) spectral channels, namely the VNIR (Visible+NIR) spectral stack. The complete dataset comprises 1651 images from multiple cities across California, capturing diverse urban ecosystems. In total, the dataset contains 96,425 manually labeled tree locations, provided as point annotations. Expert operators defined the ground truth by visually inspecting the NAIP imagery. Existing municipal tree inventories were used as a reference starting point. To minimize errors, the initial ground truth derived from tree inventories was manually revised to include all non-annotated trees on both public and private lands. The final dataset split comprises 1485 training images and 166 test images. Both images and ground truth are publicly available at the repositories provided by [26].
3. Methods
This section introduces the proposed pipeline for ITD in large-scale heterogeneous urban landscapes. The approach is based on the confidence map regression workflow presented by [24,26], improved by modifying the DL backbone and by introducing a data-driven hyperparameter optimization step. Notably, this calibration phase should be performed on different urban morphologies or tree species composition to adapt the model to diverse geographical contexts. The ground truth consists of point annotations that define the tree coordinates in a given image. Therefore, the approach is formulated as a binary segmentation task in which the DL model produces a confidence map of the same shape as the input image. Next, a peak-finding algorithm analyzes the confidence map to identify local maxima, which represent the detected tree locations that are matched to the ground truth positions [24]. The overall pipeline is introduced in Section 3.1, Section 3.2 and Section 3.3 describe the dataset preparation phase, the DL network architecture is presented in Section 3.4, and the final tree localization step is discussed in Section 3.5 and Section 3.6.
3.1. Pipeline Overview
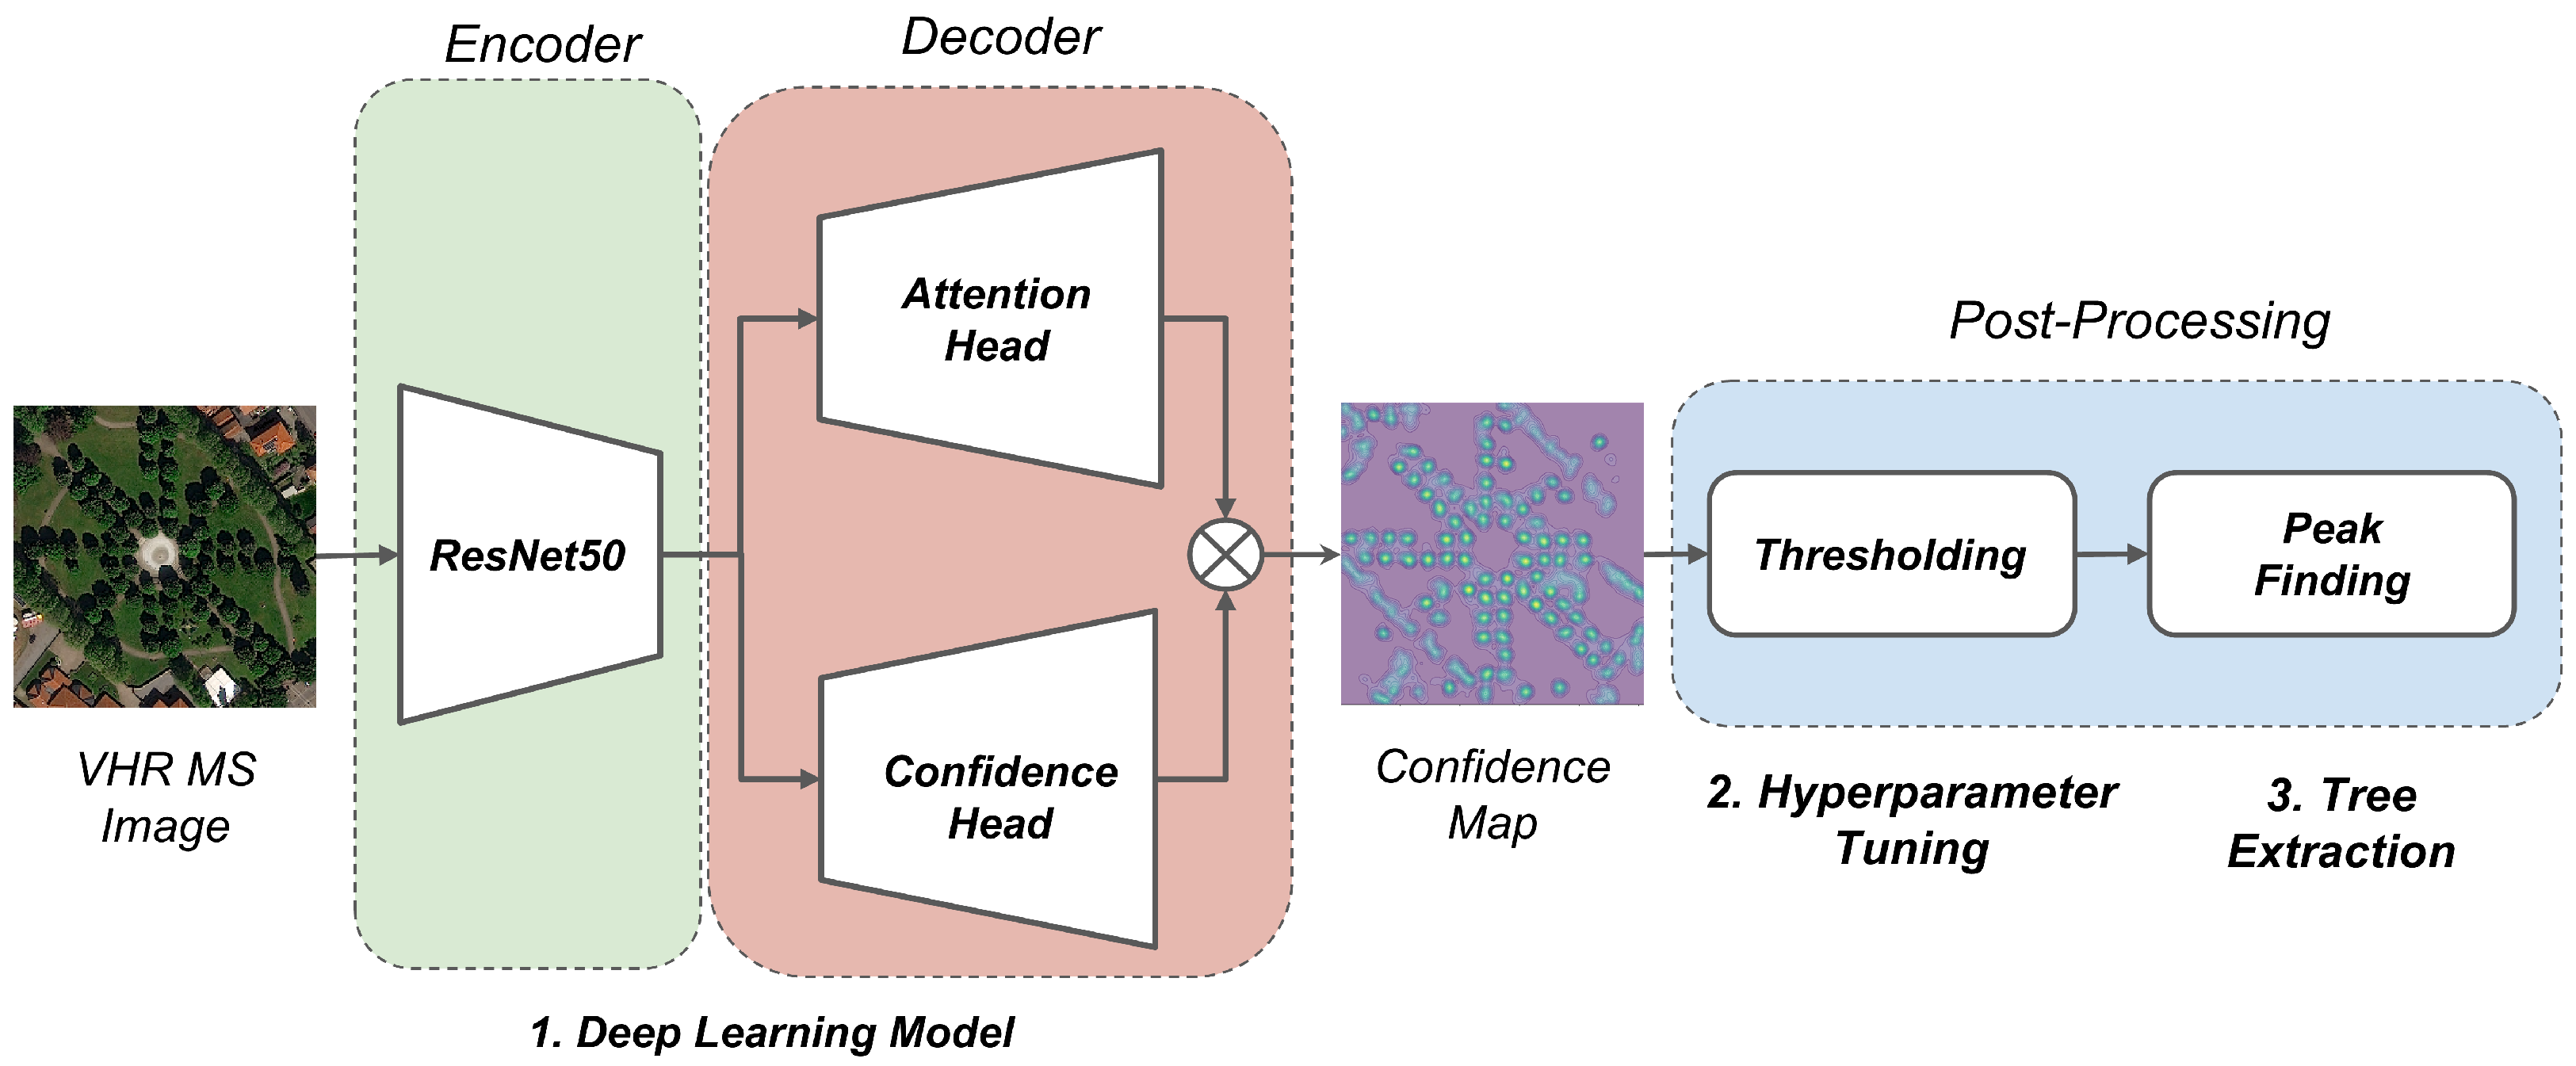
The ITD framework proposed in this work was originally introduced by [23] and subsequently applied to tree detection by [24,26]. Figure 4 illustrates its overall structure. In the first stage, a multi-channel image is fed into a CNN-based DL network. The DL model is based on an encoder–decoder architecture that extracts a high-level representation from the input image and generates an output confidence map with the same shape as the input image. Isolated peaks in the output confidence map represent locations with a high likelihood of individual tree presence. The second phase introduces a thresholding step on the confidence map to reduce false positives by suppressing low peaks. In the third final stage, a local peak-finding algorithm is applied to the confidence map to identify the coordinates of the individual trees.
Figure 4.
Overview of the ITD framework. A two-stage fully convolutional network, based on an encoder–decoder architecture with a ResNet-based backbone, processes a VHR MS image input to generate a confidence map of tree presence. The confidence map is then thresholded to suppress low responses, followed by a local peak detection step to extract tree locations.
3.2. Data Preprocessing
Before being fed to the DL model, each MS image, composed of four spectral bands acquired in the Blue (B), Green (G), Red (R), and NIR channels, undergoes a preprocessing step. For comparison among datasets, the Deep Blue and Red Edge bands are discarded from the PNEO imagery. An additional input feature, the NDVI, is derived from the Red and NIR bands according to the following expression:
and appended as the fifth channel of each image.
The spectral NDVI is extensively employed in the remote sensing literature as a reliable indicator for the presence of photosynthetically active vegetation [34,35]. In complex urban environments, the NDVI enhances the ability to distinguish the spectral response of trees from anthropogenic elements in the urban background.
Each channel in the VNIR+NDVI stack is preprocessed before being fed to the network. RGB channels (with values ranging [0, 255]) are zero-centered with respect to the ImageNet statistics [36], the NIR channel in the range [0, 255] is zero-centered by subtracting 127.5, and the NDVI, which spans the range , is multiplied by a factor of 127.5 to align the value range with the other channels.
3.3. Confidence Map Generation
During the training phase, each input image is associated with a target confidence map , with the same input shape, which the DL network is trained to predict. The target confidence map is automatically constructed from the point-level tree annotations in the ground truth. Following the procedure presented in [26], a two-dimensional Gaussian kernel is centered on the location of each annotated tree i, expressed in pixel coordinates . The ground truth confidence map for each pixel is computed as the maximum over all kernels:
The use of the maximum operator ensures that nearby trees produce distinct peaks in the confidence map, in contrast to the sum operator, proposed by [23], which may produce merged responses. This property is critical for accurate individual tree localization, especially in dense canopy conditions. The Gaussian scale parameter was treated as a fixed scalar because the point annotations lacked crown size information. As proposed in [26], a fixed value of m was applied to each Gaussian kernel.
3.4. Network Architecture
ReSFANet is based on the HR-SFANet network, presented in [26], which adopts the SFANet architecture [37] originally developed for crowd counting. The implemented DL network is based on an encoder–decoder architecture consisting of three functional components. As shown in Figure 4, the initial encoder backbone is followed by two parallel decoder heads, whose outputs are multiplied together to produce the final confidence map.
The encoder backbone processes the input image, extracts the most relevant features, and constructs a high-level representation, which is then processed by the decoder subnetworks. In this work, the VGG-16 backbone is replaced with a ResNet-50 architecture [38]. This change is motivated by several architectural advantages. First, ResNet-50 contains approximately 25.6 million trainable parameters, significantly reducing model complexity compared to 138 million parameters of VGG-16 [39]. This modification lowers memory requirements and reduces the risk of overfitting in moderately sized training datasets. Another advantage of ResNet-50 is the use of residual connections to address the vanishing gradient problem that affects deep networks.
The original ResNet-50 backbone is pre-trained on the three-channel RGB ImageNet dataset [36,38], which does not support the five-channel input stack required by the proposed ReSFANet network. Therefore, the first convolutional layer is extended with two additional filters to include the NIR and NDVI channels. The additional filters are randomly initialized using Glorot uniform initialization [40], while the three RGB channels are initialized from the ImageNet pre-trained model.
The features extracted by the ResNet-50 encoder are processed by two parallel decoder branches, which are respectively the attention head and confidence head Figure 4. The attention head generates an attention map that highlights vegetation regions and suppresses background noise. The confidence head produces the raw confidence estimation for tree locations. Both decoder heads progressively upsample the spatial resolution of the intermediate network representations, recovering the full resolution of the input image. The final output confidence map is produced by the element-wise multiplication of the two heads.
3.5. Thresholding
The confidence map output by the decoder is filtered by removing values below a minimum threshold. This step is introduced to suppress spurious low-confidence responses, thus reducing false detections.
In [24], an absolute fixed threshold of is applied, which is not generalizable to new scenarios where the confidence distribution may shift. Differently, in [26], a relative threshold is employed, which is expressed as a fraction of the global maximum of the confidence map within each image. The main limitation of this approach is that, by construction, some peaks will always be identified in every image since the relative threshold is computed separately on each confidence map. Consequently, this approach may produce a high number of false positives, especially in images without trees.
To address both issues, this work employs a threshold calibration procedure based on the overall confidence distribution across the validation set. Each image i in the validation set is processed by the DL model that predicts a confidence map . After this step, the distribution of confidence values among all confidence maps is computed. From the confidence distribution, the candidate thresholds are computed by defining a predefined set of percentiles (, , , , ), which are all tested on the validation set.
However, the confidence maps may exhibit a bimodal distribution: images containing trees tend to produce higher values at canopy locations, whereas images without trees generate predominantly low background responses. To better account for this behavior, the confidence distribution computation is stratified among these two groups of images. Sampling percentiles jointly from the pooled distribution might underrepresent one of the two regimes, biasing the candidate set towards the dominant population. By sampling each group independently, the procedure ensures adequate coverage of the confidence distribution, producing a set of candidate thresholds that more uniformly explore the operational range of the model. Finally, the union of all candidate percentiles sampled from both groups forms a single pool of candidate thresholds. Among these, the confidence threshold that maximizes the F1-score on the entire validation set is selected and fixed for all subsequent inference on unseen data.
3.6. Peak Finding
Individual tree locations are extracted from the thresholded confidence map via Non-Maximum Suppression (NMS). A pixel is designated as a detection if it represents the local maximum within a circular neighbourhood of radius pixels, where d defines the minimum permissible inter-detection distance. This parameter governs the spatial resolution at which closely spaced trees can be individually resolved. In all experiments, the radius was set to , as optimized by the hyperparameter tuning step implemented in [26].
4. Results
The performance of the proposed framework was evaluated in two independent experimental settings. In Section 4.2, the proposed ReSFANet was trained and validated on the California aerial imagery dataset to compare the proposed approach with the baseline method defined by [26]. In Section 4.3, the ITD model was further assessed in a different geographic context using the Lombardy dataset. The contributions of various architectural components are assessed, and further experiments are presented to provide a thorough analysis of the impact of spatial resolution and crown size on the tree localization accuracy in urban scenes. This dual scenario evaluation demonstrates the robustness of the proposed ITD pipeline across different imaging sensors and geographic areas.
4.1. Evaluation Metrics
Detection performance is evaluated using Precision, Recall, and F1-score to quantify the trade-off between correct detections and the number of trees identified. Precision measures the proportion of predicted tree locations that correspond to actual trees. Recall measures the proportion of annotated trees that the detection model successfully localizes. The F1-score provides an overall performance assessment by computing the harmonic mean of both metrics. In addition, Average Precision (AP) is reported, which summarizes detector performance across a range of confidence thresholds. The AP is computed by evaluating Precision and Recall at several confidence thresholds and computing the area under the Precision–Recall curve. Predicted and ground truth tree locations are matched following the procedure adopted in [26], based on minimum weight bipartite matching that minimizes the sum of Euclidean distances between matched pairs. Matching is subject to a maximum distance threshold of 6 m, beyond which a predicted detection is not assigned to any ground truth tree. Predicted detections that exceed the distance threshold or remain unmatched are counted as false positives, while unmatched ground truth trees are counted as false negatives. Finally, the Root Mean Square Error (RMSE), defined as the spatial distance between matched true positive pairs, is reported to assess localization accuracy.
4.2. Performance on the California Dataset
This section analyzes the performance of the proposed ReSFANet model and compares the results with the baseline HR-SFANet network [26]. To ensure a robust evaluation, the training cycle was repeated in three independent runs with different random seeds to introduce variations in the weight initialization at each iteration. Table 1 reports the detection results on the California dataset for the two pipelines. The results of the HR-SFANet model (first row) on the Southern California 2020 test set are taken from the original paper [26]. For ReSFANet (second row), the average and standard deviation across the three training runs are reported for each metric. ReSFANet consistently outperforms HR-SFANet [26], achieving a Precision of 77.84% (+4.24%) and a Recall of 77.43% (+4.13%), with an F1-score of 77.63% (+4.23%). Moreover, the low standard deviations (< on all metrics) indicate that similar results are achieved independently of the specific weight initialization, confirming the stability of the training phase. The introduced architectural improvements benefit both the ITD performance, as indicated by the increased AP from 70.50% to 76.33%, and the localization accuracy with a decrease in the RMSE metric of 0.33 m, corresponding to a 15% reduction in positional error, crucial for automated urban tree inventory applications.
Table 1.
Quantitative comparison on the California benchmark dataset. Results for the proposed ReSFANet are reported as the average and standard deviation on three independent training runs.
The California dataset provides a robust benchmark for evaluating ITD performance in urban environments, representing 1651 scenes with a very large number of annotated trees. However, among all the images, only six samples capture an area without any visible trees, and all such cases are assigned to the training set. Therefore, all images in both the validation and test splits contain at least one annotated tree. This precludes an effective assessment of the proposed percentile-based thresholding on tree-free images, a scenario in which the relative thresholding mechanism is expected to produce false positives. To rigorously evaluate the robustness of the percentile-based threshold in the presence of tree-free scenes, additional experiments were conducted on the Lombardy dataset, which explicitly includes images without tree annotations both in the validation and test splits.
4.3. Performance on the Lombardy Dataset
Table 2 compares the proposed ReSFANet model (third row) with the original HR-SFANet model [26] (first row) on the Lombardy dataset downscaled at 60 cm/px GSD. Also on the Lombardy dataset, ReSFANet outperforms HR-SFANet method in terms of AP (+3.67%), Precision (+14.63%), and F1-score (+4.77%). Both models achieve similar Recall with a moderate advantage for the HR-SFANet model (+1.31%). Due to the more challenging scenarios, the models miss a higher fraction of annotated trees, and both align on a Recall of 59/60%, much lower than the result obtained on the California dataset (−18.3% for ReSFANet). Nevertheless, ReSFANet achieves a Precision of 84.34%, demonstrating the effectiveness of the proposed percentile-based thresholding approach in reducing the false positives, especially in tree-free images.
Table 2.
Results on the Lombardy dataset (60 cm/px GSD). The results show the incremental impact of ReSFANet and the percentile thresholding strategy compared to the baseline HR-SFANet pipeline.
An interesting result worth noting is the stability of the RMSE metric achieved by both models on the two substantially different California and Lombardy datasets. On the Lombardy dataset, ReSFANet achieves a very similar RMSE of 1.821 m (−0.01 m gap from the California dataset), whereas HR-SFANet achieves an RMSE of 2.200 m (+0.043 m gap from the California dataset). This outcome indicates that the models maintain the same tree localization accuracy in both scenarios, but the higher complexity of the Lombardy dataset, mainly caused by the larger fraction of vegetated areas, limits the maximum Recall achievable by the two methods.
In the following sections, additional experiments on the Lombardy dataset are presented to assess the contribution of the backbone replacement and percentile-based thresholding introduced in the ReSFANet model.
4.3.1. Impact of Backbone Replacement
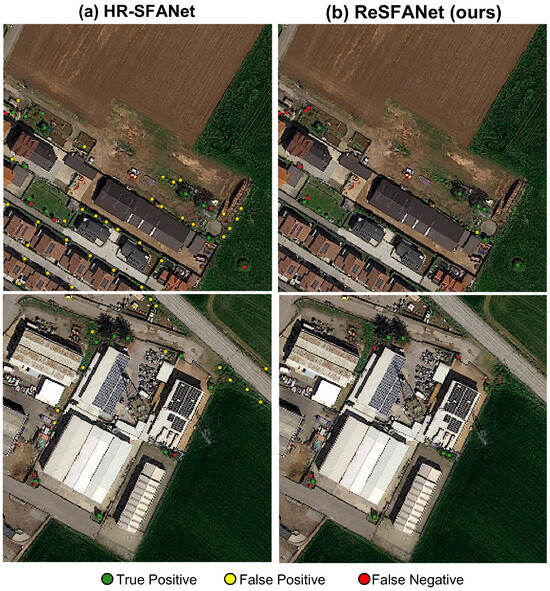
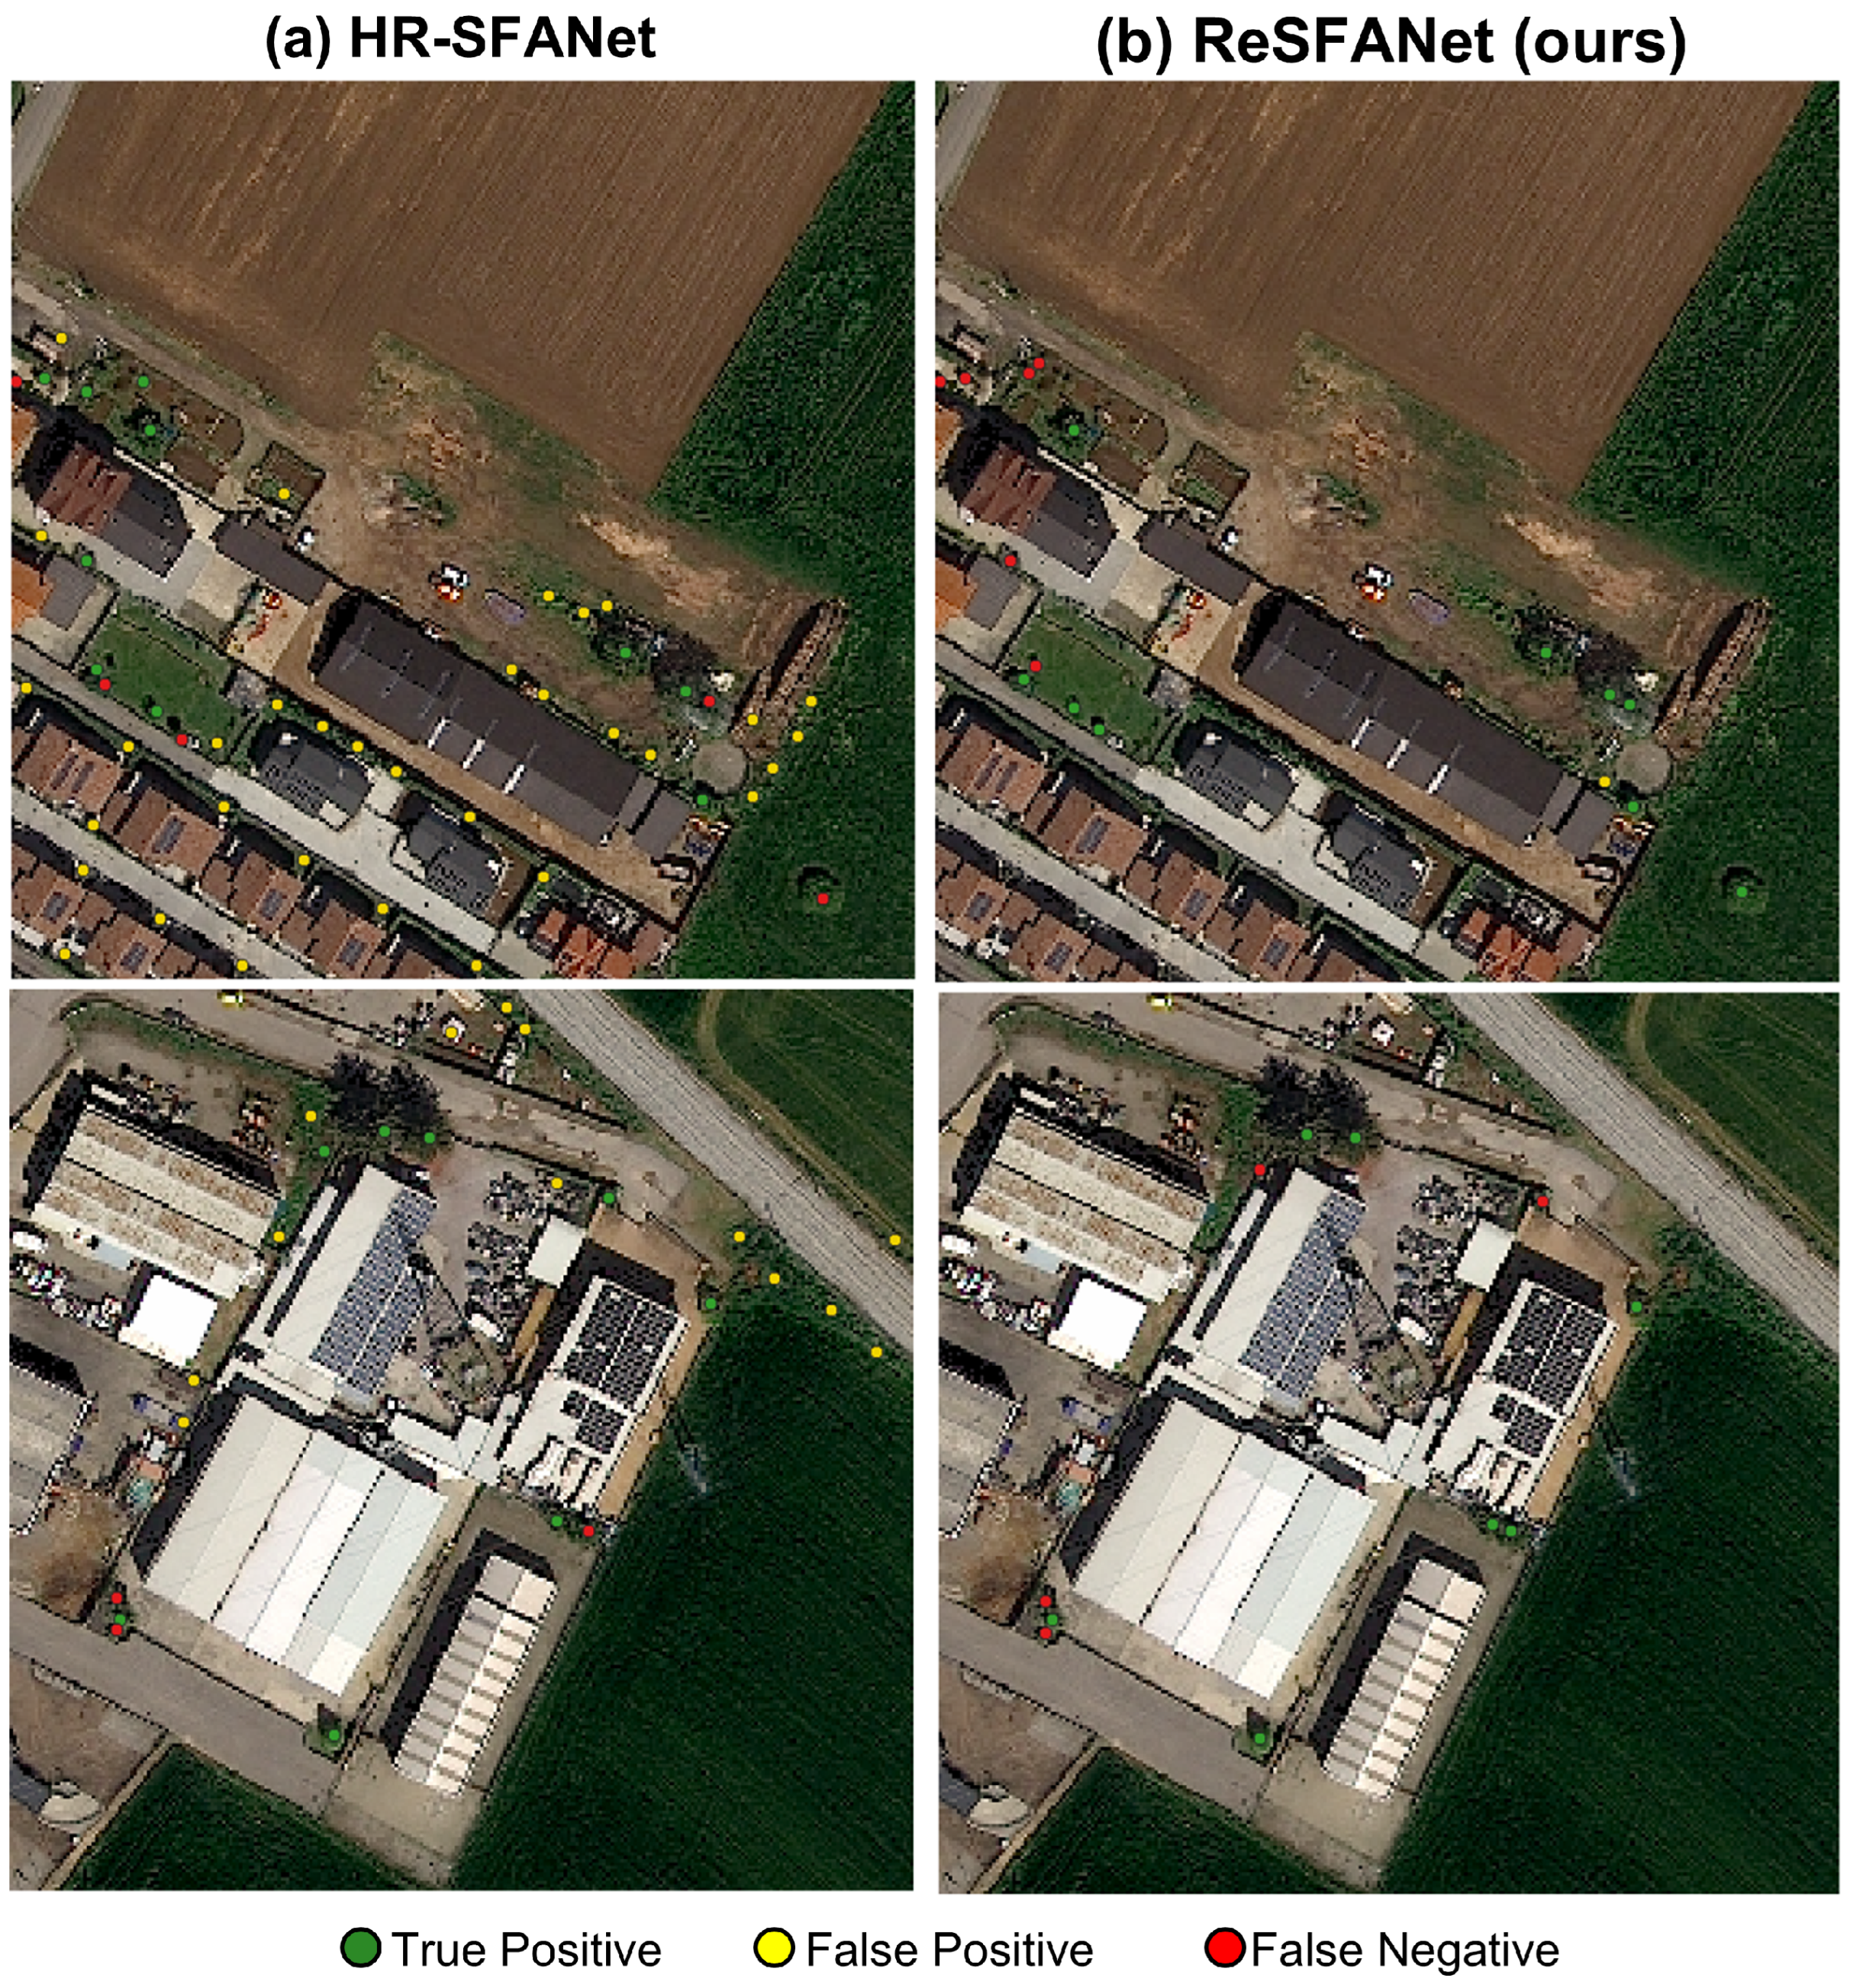
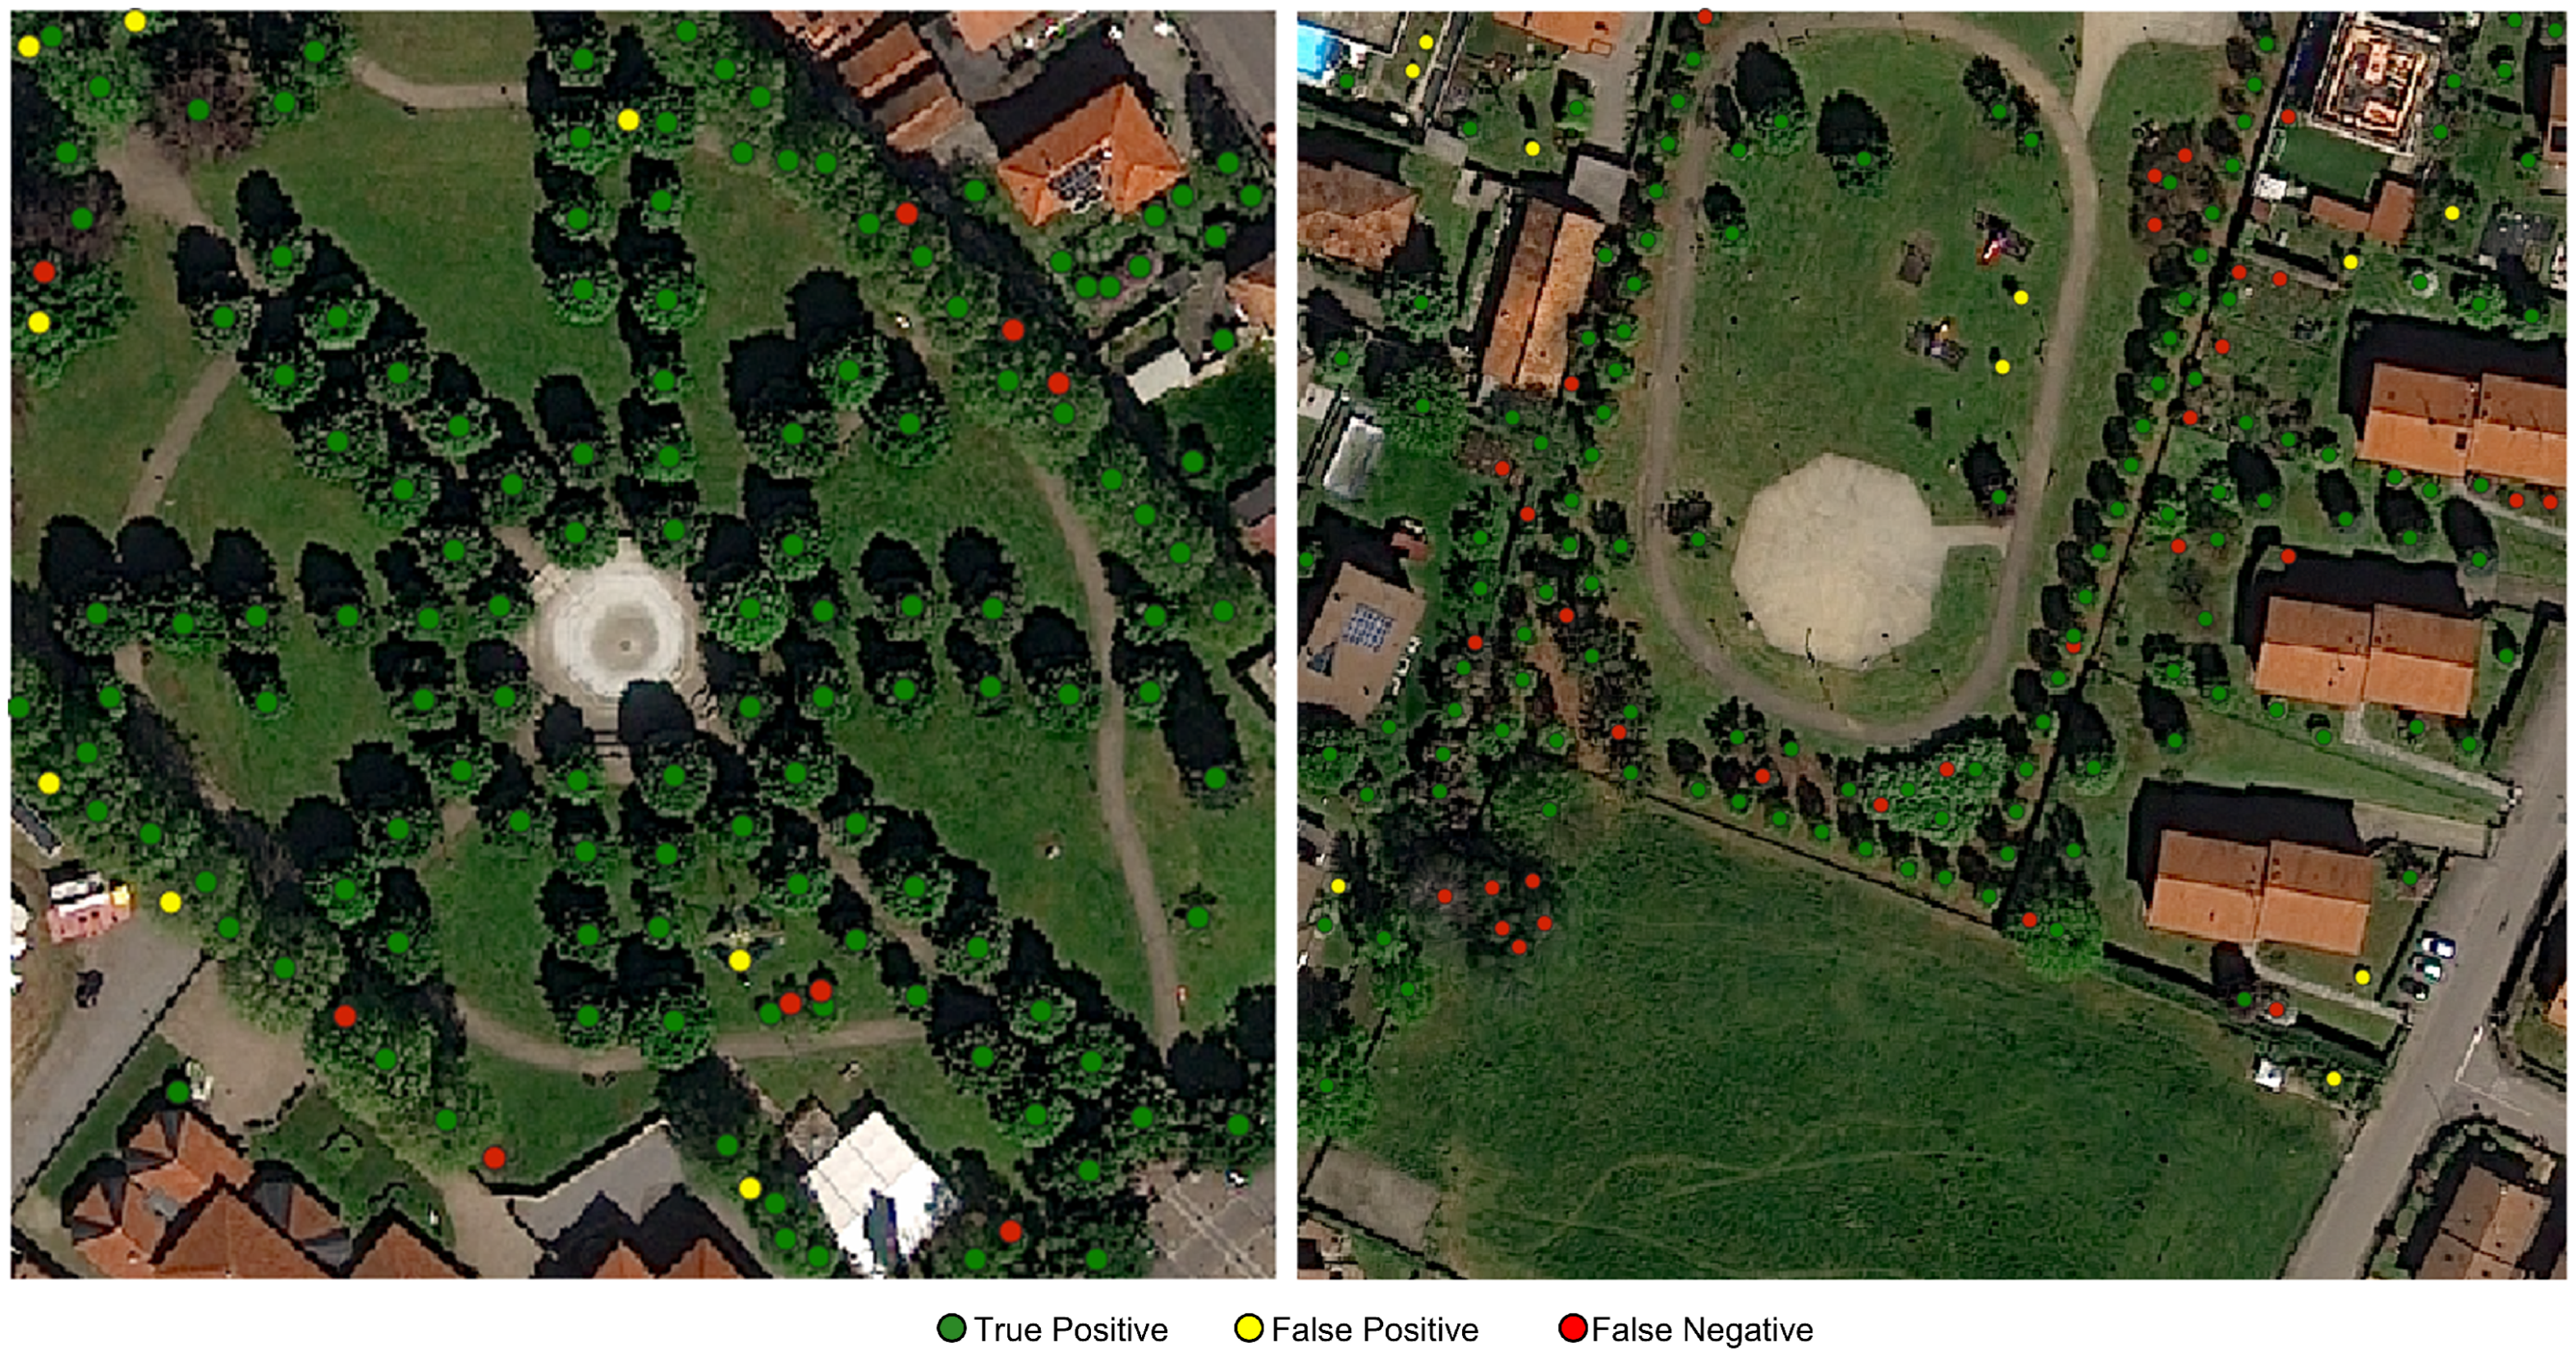
As described in Section 3.4, a fundamental architectural change introduced in ReSFANet is the replacement of the VGG-16 backbone with a deeper but more efficient ResNet-50 encoder. The quantitative impact of this substitution is reported in Table 2. Compared to the original HR-SFANet method (first row), the backbone replacement (second row) yields a substantial gain in Precision, increasing from 69.71% to 80.22% (+10.51%), alongside improvements in AP (+3.67%) and F1-score (+2.71%), and a reduction in localization error from 2.200 m to 1.797 m RMSE (−0.403 m). A marginal decrease in Recall is observed from 60.39% to 58.15% (−2.24%), indicating a slight reduction in the model sensitivity to tree instances. However, the main performance gain is driven by a major reduction in false positives, as shown by the examples in Figure 5, where ReSFANet produces noticeably fewer false predictions than the VGG-16 baseline. The improvement in accuracy can be attributed to the residual connections introduced by the ResNet-50 network, which enable training significantly deeper networks without gradient degradation [38,41]. This architectural change facilitates learning more discriminative feature representations, which are crucial to identify individual trees in vegetated urban environments.
Figure 5.
Qualitative comparison of predictions. The left column shows results obtained using the HR-SFANet approach, while the right column shows results obtained using the ReSFANet model.
4.3.2. Impact of Percentile-Based Threshold Calibration
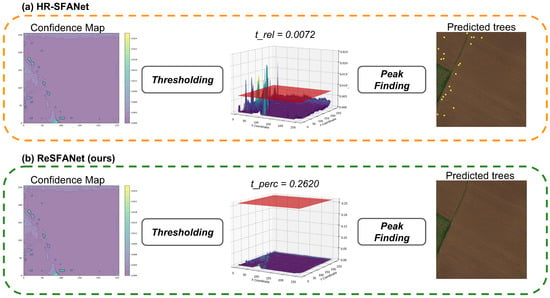
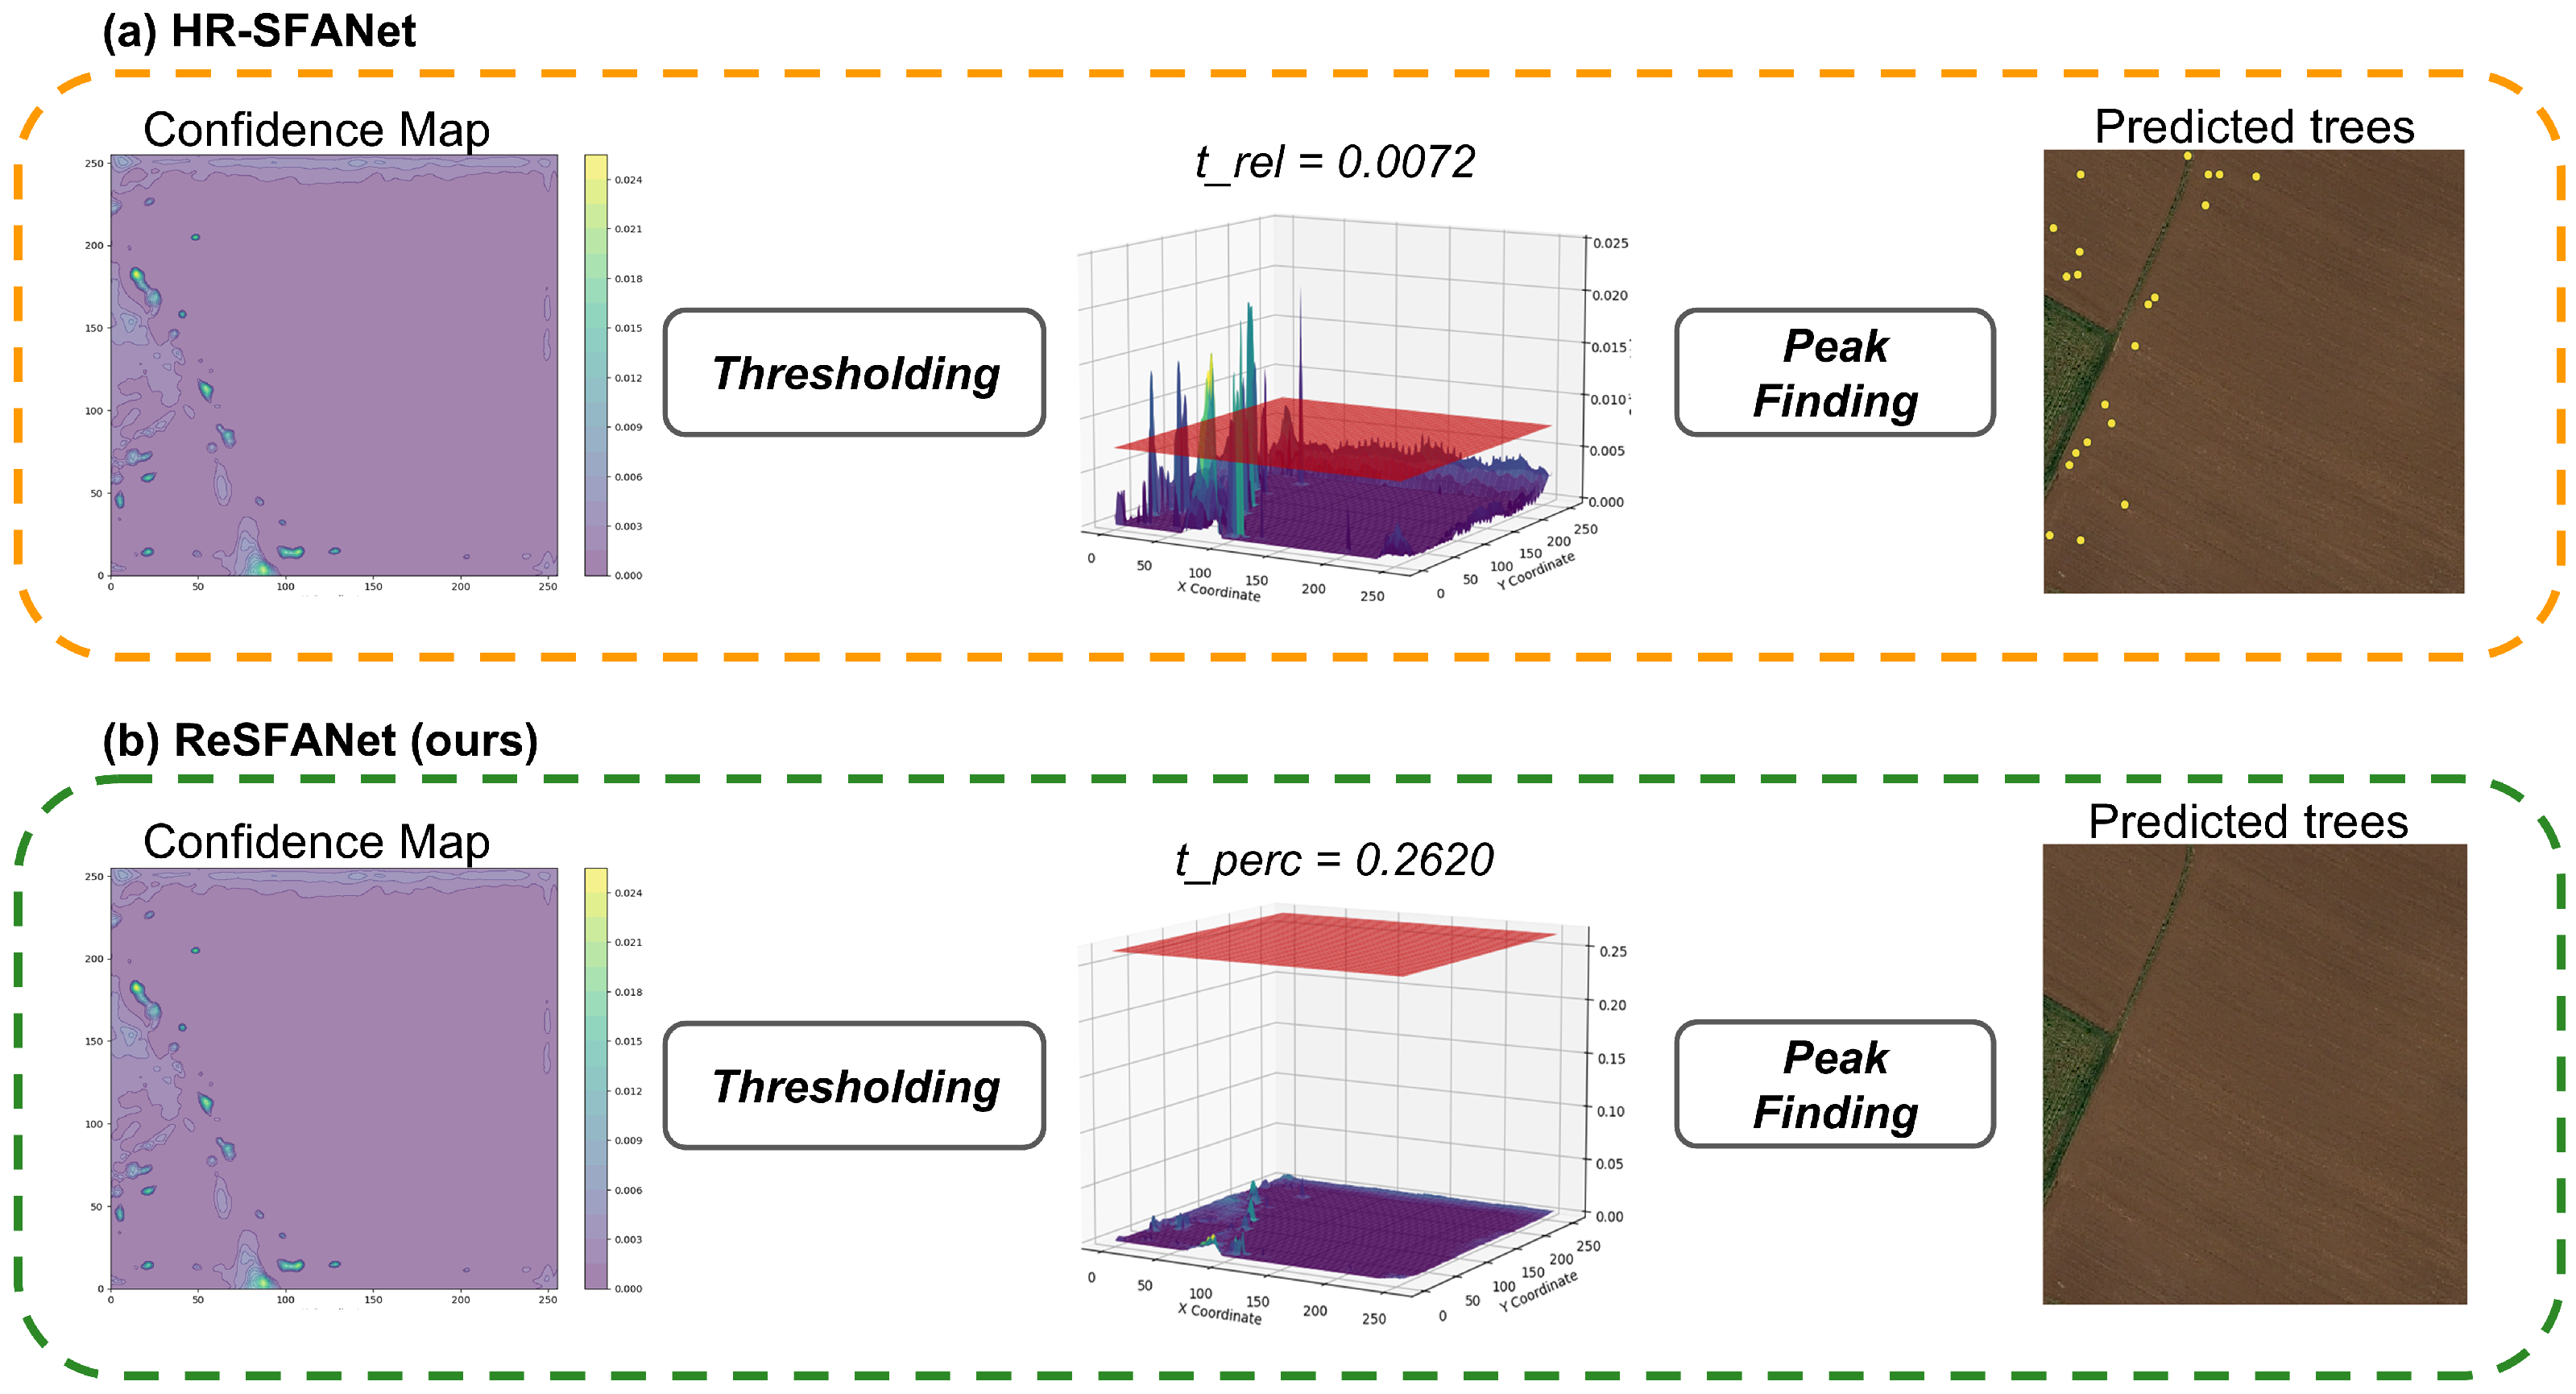
The qualitative inspection of the predictions generated by ReSFANet with the relative thresholding strategy reveals a non-negligible number of false positives in images depicting vegetated areas without trees, such as agricultural fields and park lawns. As illustrated in Figure 6a, the per-image relative threshold introduced by [26] is computed as a fraction of the confidence map maximum, which in tree-free scenes remains very low (e.g., ). Consequently, background noise in the confidence map may produce spurious peaks that survive the thresholding and peak-finding stages, yielding false detections. Even the absolute threshold approach proposed by [24] is not an optimal solution since it does not generalize properly across heterogeneous scenes with varying confidence distributions. The proposed percentile-based thresholding procedure, described in Section 3.5, addresses these limitations by computing a single threshold from the confidence map distribution, obtained on the validation set, and calibrating it to the characteristics of the target study area.
Figure 6.
The figure illustrates the post-processing step used to derive tree locations from the confidence map generated by the DL model. (a) shows the method proposed in [26], which computes a relative threshold and can incorrectly introduce spurious peaks in scenes without trees. (b) shows the method introduced in this work, which computes the threshold based on the distribution of confidence map values; as shown, this approach produces a global threshold and effectively mitigates the issue.
As reported in Table 3, percentiles computed separately for tree-containing and tree-free images show systematic differences across all percentile levels. Tree-containing images yield substantially higher candidate thresholds (0.2214–0.5780 across the 90–99th percentiles) compared to tree-free images (0.1280–0.4420), reflecting the distinct behaviors of the two populations. As discussed in Section 3.5, pooling thresholds independently sampled from each group ensures that the resulting set of candidates adequately represents both operational regimes of the model.
Table 3.
Threshold values computed from stratified percentiles for the two validation set groups. The global threshold is selected among all candidates as the value maximizing F1-score on the complete validation set.
Among the pool of candidate thresholds computed both on tree-free and tree-containing images, the percentile of the tree-containing group () is selected as the global inference threshold, as it maximizes the F1-score on the entire validation set. This value effectively balances detection sensitivity in densely vegetated areas with false positive suppression in tree-free zones, addressing a critical limitation of prior thresholding approaches. As demonstrated in Figure 6b, the calibrated threshold suppresses all residual background responses in tree-free confidence maps, correctly yielding zero predictions for such images. A detailed evaluation on the Lombardy test set confirms that ReSFANet produces zero false positives across all tree-free images. In contrast, the baseline HR-SFANet generates 103 false positive detections on the same tiles.
Quantitatively, as reported in Table 2, the introduction of the percentile-based threshold improves precision from 80.22% to 84.34% (+4.12%) and F1-score from 67.43% to 69.49% (+2.06%), with a negligible increase in RMSE (1.797 m to 1.821 m). AP remains unchanged at 64.95% across both ResNet-50 configurations, which is expected since AP is a threshold-independent metric evaluated over the full Precision–Recall curve. These results confirm that calibrating the threshold on the global confidence distribution of the study area effectively reduces false positive detections without compromising the overall detection accuracy.
It is important to note that the percentile-based threshold may require recalibration in geographical contexts significantly different from the study area analyzed in the Lombardy dataset.
4.4. Multispectral Satellite Imagery Analysis
To investigate the performance gain of the ITD pipeline on the full spatial and spectral resolution of multispectral satellite imagery, ReSFANet was additionally trained on imagery acquired at the highest spatial resolution available from the PNEO satellite product over the study area, corresponding to a GSD of 30 cm/px. The results are reported in Table 4.
Table 4.
Performance comparison on the Lombardy dataset using the proposed pipeline at two GSDs: 60 cm/px and 30 cm/px.
The transition from 60 cm/px to 30 cm/px imagery, using the same VNIR+NDVI stack, enables improvements across all evaluation metrics. Precision increases from 84.34% to 88.42% (+4.08%), Recall from 59.08% to 64.33% (+5.25%), and F1-score from 69.49% to 74.48% (+4.99%), while RMSE decreases from 1.821 m to 1.425 m, indicating improved localization accuracy. AP improves from 64.95% to 81.81% (+16.86%), indicating a gain in overall detection accuracy across all confidence thresholds. The increased spatial detail available at the higher resolution enhances the network ability to discriminate individual trees from surrounding vegetation and background elements. At 30 cm/px GSD, each tree canopy is represented by approximately four times as many pixels as the corresponding 60 cm/px GSD imagery, providing the model with richer structural and boundary information.
By training ReSFANet with the full MS stack imagery, namely incorporating the Deep Blue and Red Edge spectral bands, the Recall increases to 66.92% (+2.59%) with a minor decrease in Precision (−1.7%), resulting in a marginal overall gain in F1-score of 75.54% (+1.06%). The inclusion of additional bands leads the model to predict more trees, resulting in a consequent increase in false positives that accounts for the decrease in Precision. Finally, the AP also slightly improves from 81.81% to 82.84% (+1.03%). These results suggest that the full MS stack provides limited additional benefit for detection performance, as the Deep Blue and Red Edge bands do not contribute discriminative information beyond what is already captured by the VNIR bands.
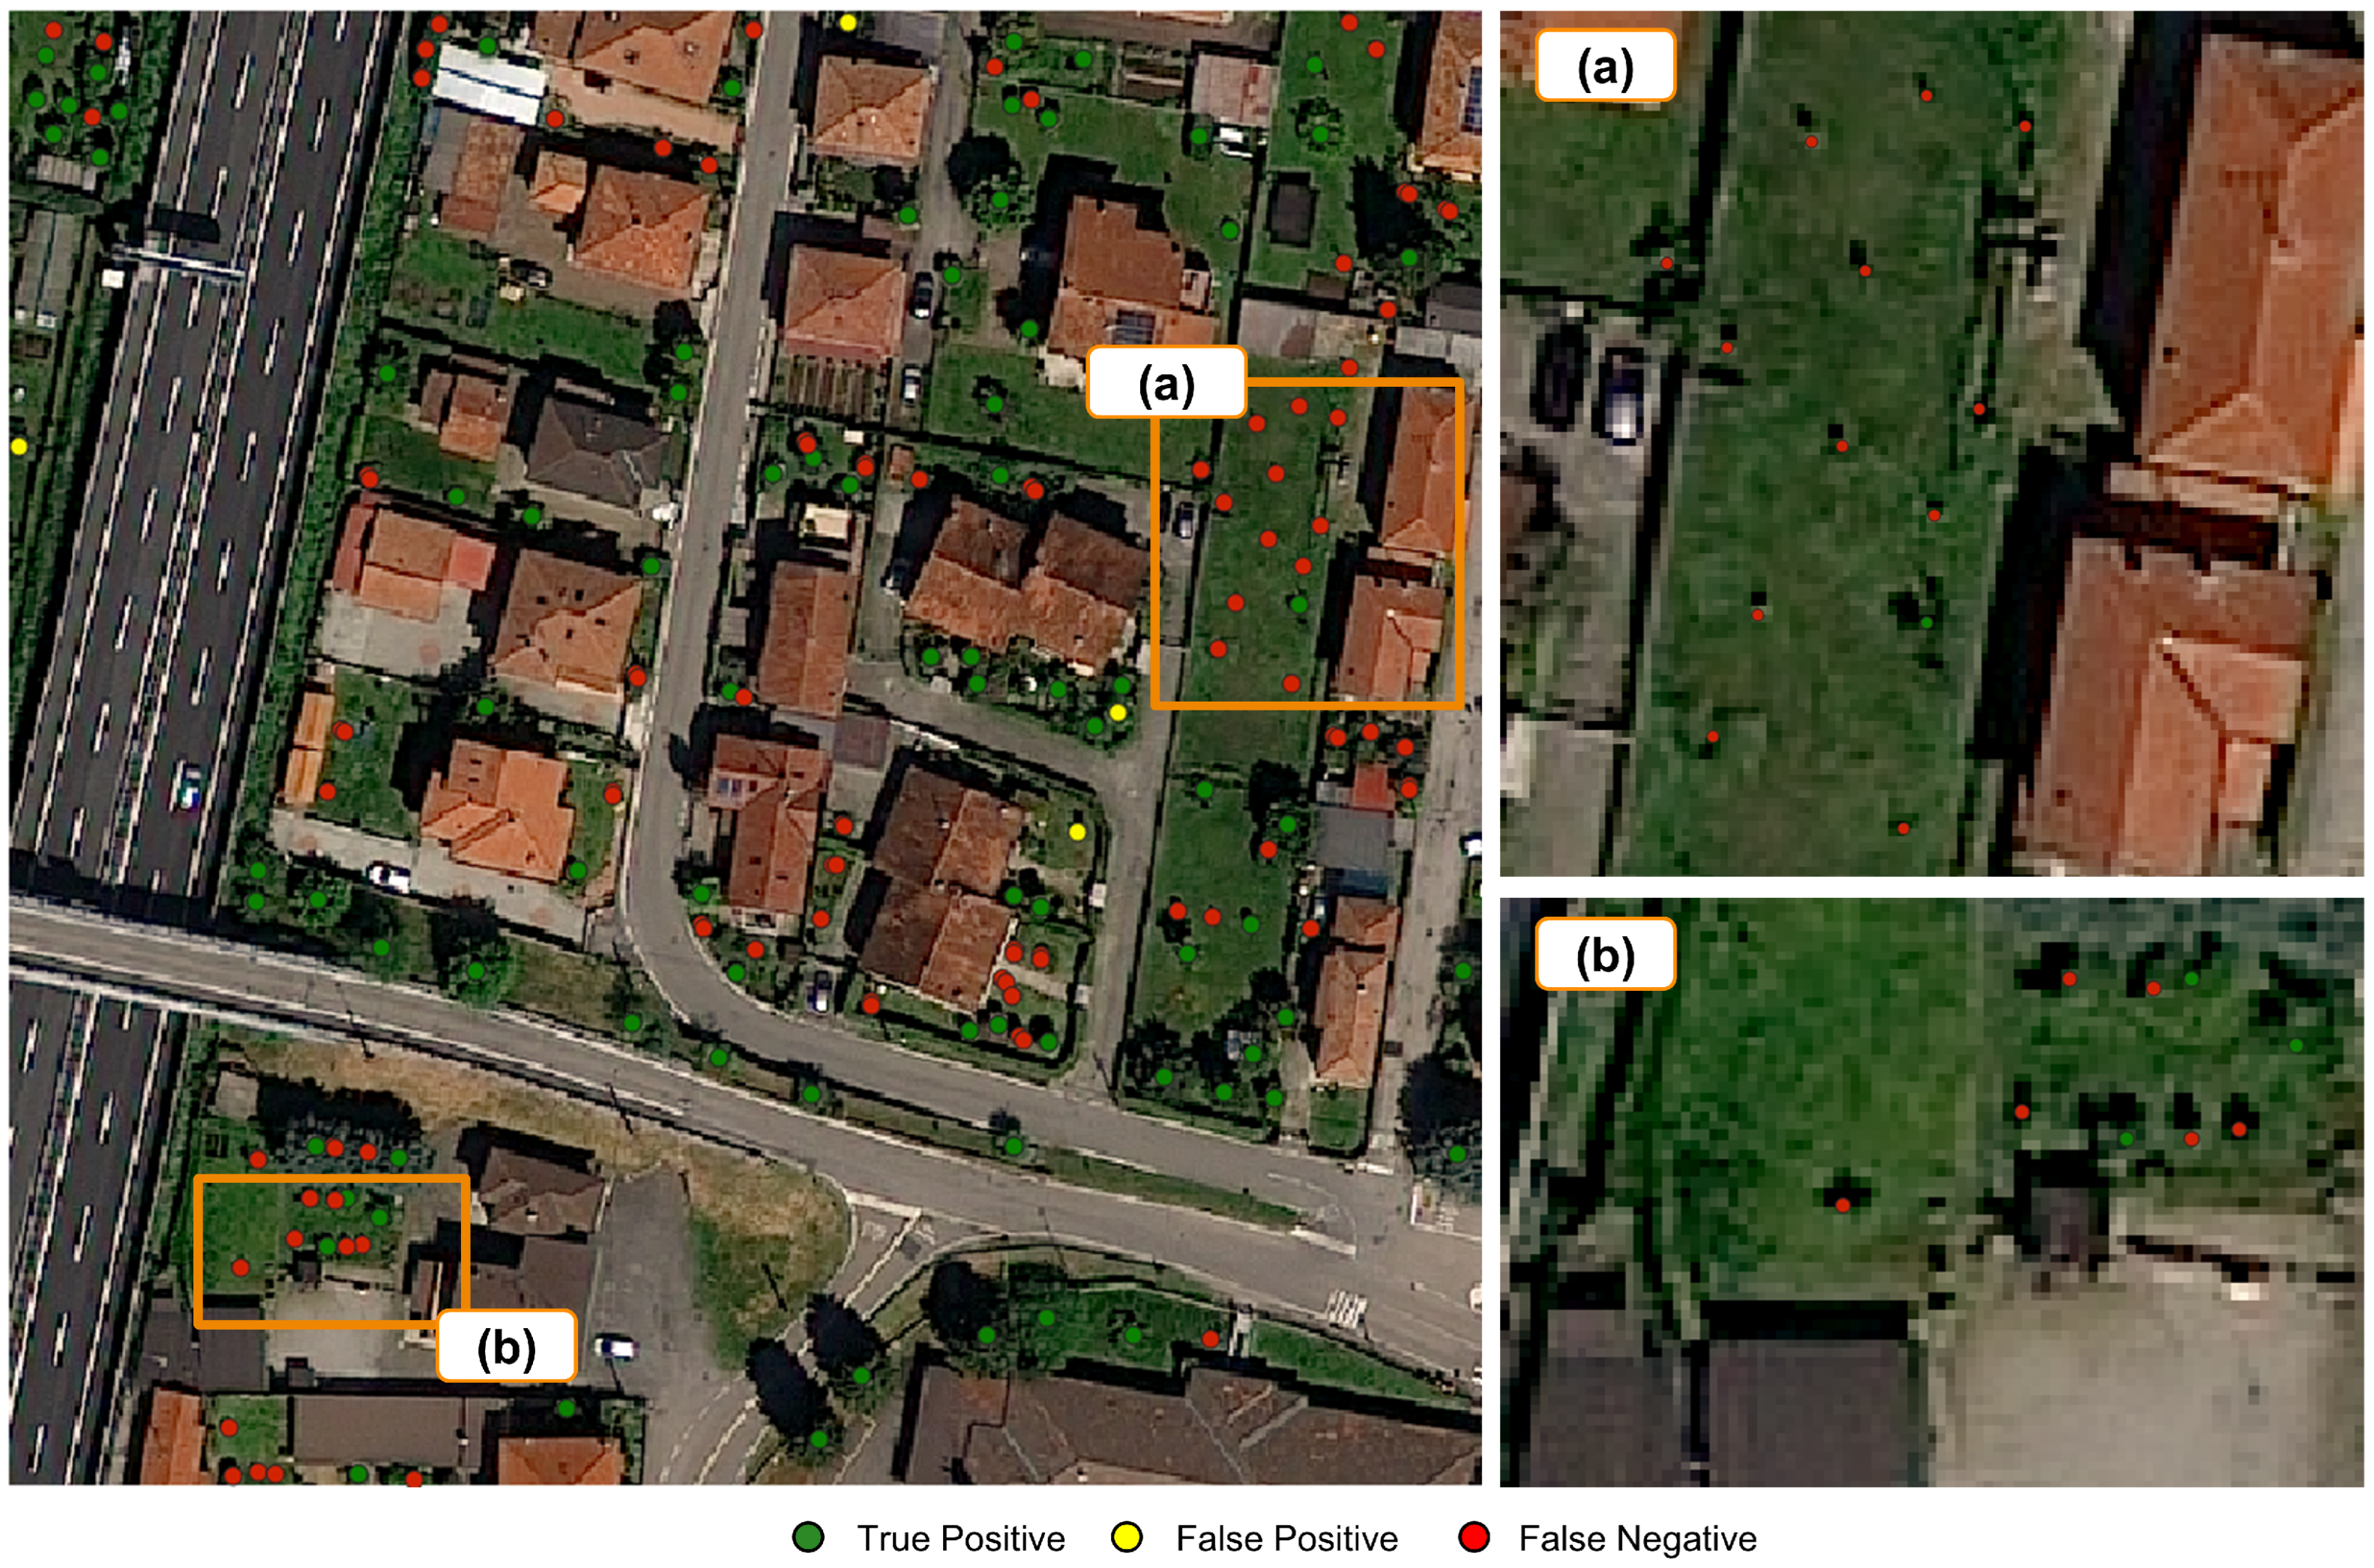
Nevertheless, the Recall value of 66.92% highlights a limitation in the tree instances in the study area that can be detected by the model. Qualitative inspection of false negative predictions, illustrated in Figure 7, indicates that the primary source of missed detections is the presence of small-canopy trees, whose spatial extent remains limited even at 30 cm/px GSD.
Figure 7.
Qualitative inspection of predictions. Images (a,b) highlight the presence of small-canopy trees within the scene, a source of missed detections, i.e., false negatives.
4.5. Crown Size Analysis
The identified primary source of missed detections is small-canopy trees that are inherently challenging to identify even at 30 cm/px GSD. To assess the impact on the ITD evaluation on the full MS stack imagery, a minimum canopy radius of 2 m (corresponding to a crown area of approximately 12.5 m2) was defined via photo-interpretation of the study area imagery. This area threshold was selected to separate mature tree crowns from smaller vegetation. The trees below this threshold were excluded from the test set and the metrics recomputed on the filtered subset are reported in Table 5, and Figure 8 shows qualitative examples of obtained predictions.
Table 5.
Performance of the ReSFANet model on the Lombardy dataset at 30 cm/px GSD. The table compares results on the full test set and by filtering only trees with radius m.
Figure 8.
Predictions obtained by applying ReSFANet to the Lombardy dataset at 30 cm/px GSD considering tree with radius m.
Restricting evaluation to trees with a minimum canopy area substantially reduces the false negatives, improving the Recall from 66.92% to 77.48% (+10.56%). AP improves from 82.84% to 84.12% (+1.28%) and F1-score from 75.54% to 79.35% (+3.81%), while RMSE remains effectively stable (1.473 m to 1.495 m). Counterintuitively, a decrease in Precision is observed, 86.72% to 81.33% (−5.39%), which requires careful interpretation. Since the model was trained without any canopy size constraint, detections corresponding to small-canopy trees, with an area below the threshold, have no correspondence in the filtered ground truth and are consequently classified as false positives. This Precision reduction, therefore, does not indicate a degradation in detection quality, but actually reflects the model’s ability to correctly localize trees that fall below the defined evaluation threshold.
From an ecological standpoint, the recognition of small trees has minor relevance in urban forest management applications. Small or newly planted trees that have not yet reached functional biological maturity contribute marginally to urban ecosystem services, such as carbon sequestration or microclimate regulation, compared to mature instances [42]. In particular, the cooling effect achieved through shading and evapotranspiration scales with canopy size and is substantially more effective in larger, mature individuals [43]. Therefore, the improved detection performance observed on the filtered test set indicates that the proposed pipeline reliably identifies the tree population most relevant to ecosystem service assessment and urban forest management.
5. Discussion
The experimental results presented in Section 4 demonstrate that the proposed ReSFANet model provides a robust solution for the automatic detection of individual trees in heterogeneous urban environments. On the challenging Lombardy dataset, the combination of the ResNet-50 backbone and the percentile-based threshold calibration achieves a Precision of 84.34% and a Recall of 59.08% at 60 cm/px GSD, with further gains on the full PNEO resolution of 30 cm/px (Precision of 86.72, Recall of 66.92%). A detailed analysis indicates that detection performance varies across land cover types, with a noticeable degradation (∼10%) in vegetated and semi-natural areas compared to anthropogenic backgrounds. This is attributable to the higher spectral similarity between tree canopies and the surrounding vegetation.
The proposed framework demonstrates the potential of combining VHR satellite imagery with DL algorithms to automate operations and monitor urban environments at scale. This automation addresses the main limitations of manual tree inventory methods relying on field campaigns. Such methods are time-consuming, difficult to scale on large municipalities, and typically limited to publicly managed trees [26].
The regulatory context emphasizes the importance of addressing these limitations. In Italy, Law 14 January 2013, n. 10 [44] requires municipalities with more than 15,000 inhabitants to periodically maintain a census of the urban trees. At the international level, the EU Biodiversity Strategy for 2030 sets the goal of no net loss of urban green areas by 2030 and the achievement of at least 10% urban tree cover in all European cities by 2050. Compliance with these obligations requires mechanisms that can operate periodically over large areas to generate automated tree inventories. Satellite-based frameworks provide repeatable solutions to generate urban tree inventories at scale, including private lands, which are typically excluded from public inventories despite their contribution to urban canopy cover.
The periodicity offered by repetitive satellite acquisitions is relevant for tracking the evolution of the urban canopy in response to urbanization pressures or tree-planting programmes. The high localization accuracy of ReSFANet enables assessment of tree distribution across neighborhoods and the prioritization of planting activities in areas with low canopy coverage [26,42].
The proposed approach presents some open challenges. First, experimental validation is limited to the California and Lombardy regions, and the percentile-based threshold (Table 3) was calibrated on a validation set drawn from the urban areas of the province of Monza e Brianza. The transferability of the proposed approach to different urban scenarios requires further exploration in future work. Second, as shown in Section 4.5, the model misses small-canopy trees, difficult to identify at the current resolution of 30 cm/px GSD offered by commercial satellites. This hinders the detection of recently planted trees, which may be relevant for monitoring the temporal evolution of the urban canopy. While small and newly planted trees contribute marginally to urban ecosystem services relative to mature individuals [42,43], they represent the future structural component of the urban forest. Accordingly, the present study intentionally focuses on mature trees, which constitute the ecologically relevant component of the urban forest for current ecosystem service assessment.
Third, in dense tree clusters, the proposed approach struggles to recognize individual instances because tree crowns merge into one canopy surface.
These limitations outline directions for future research, including the design of cross-regional generalization protocols and the development of standardized guidelines to operationalize the proposed pipeline into reproducible practices for urban forest management.
6. Conclusions
This work presents ReSFANet, a fully convolutional encoder–decoder framework for the automatic detection of individual trees in urban environments from VHR-MS satellite imagery. The proposed architecture modifies the network in [26] by replacing the original backbone with a more efficient ResNet-50 encoder [38] and introducing a percentile-based threshold calibration strategy.
The contribution of the architectural changes is demonstrated through experimental evaluations on the California benchmark and the Lombardy dataset, with the latter consisting of VHR satellite imagery. The proposed ReSFANet outperforms the HR-SFANet baseline, achieving an F1-score of 77.63% on the California dataset and of 69.49% on the Lombardy dataset. The performance on the Lombardy dataset improves with the full resolution of PNEO satellite images (30 cm/px GSD), achieving an F1-score of 75.54%. The percentile-based thresholding strategy is effective for suppressing false positives in tree-free scenes. Further analyses indicate that a significant fraction of false negatives (10.6%) is caused by small-canopy trees, which remain challenging to detect even at higher satellite spatial resolution. These results indicate that the proposed pipeline can act as an automated solution for generating and maintaining urban tree inventories at scale, supporting compliance with national legislation and international targets on urban green monitoring.
Future work will focus on exploiting the full spectral stack of VHR satellite imagery to derive additional insights, such as tree species classification and canopy health assessment. Generalization accuracy will be evaluated across a diverse set of heterogeneous urban settings to assess the model’s robustness to spatial distribution shifts. This supplementary knowledge provides a more detailed characterization of the urban tree canopy and a more precise evaluation of the associated ecosystem services.
Author Contributions
Conceptualization, T.M. and P.F.; methodology, T.M. and L.M.; software, T.M.; validation, T.M. and L.M.; formal analysis, P.F.; investigation, T.M.; resources, T.M. and P.F.; data curation, T.M.; writing—original draft preparation, T.M. and L.M.; writing—review and editing, T.M., L.M. and P.F.; visualization, T.M.; supervision, P.F.; project administration, P.F.; funding acquisition, P.F. All authors have read and agreed to the published version of the manuscript.
Funding
This work was supported by the European Union-Next Generation EU under the Italian National Recovery and Resilience Plan (NRRP), Mission 4, Component 2, Investment 1.4, CUP D43C22001250001, CN00000033-project NBFC–National Biodiversity Future Centre. This research was partially funded by the Italian Ministry of University and Research (MUR), under the National Recovery and Resilience Plan (NRRP), program “I.3.4 Borse PNRR transizioni digitali e ambientali” (PNRR grants for digital and environmental transition), and by the European Union (EU) under the NextGenerationEU project.
Data Availability Statement
The set of annotated georeferenced tree locations will be published in the future and is available upon request. The PNEO satellite imagery cannot be made publicly available due to contractual restrictions imposed by the data provider and cannot be redistributed by the authors.
Conflicts of Interest
The authors declare no conflicts of interest.
Abbreviations
The following abbreviations are used in this manuscript:
| AP | Average Precision |
| CNN | Convolutional Neural Network |
| DL | Deep Learning |
| ES | Ecosystem Service |
| GSD | Ground Sampling Distance |
| ITD | Individual Tree Detection |
| LiDAR | Light Detection and Ranging |
| MS | Multispectral |
| NAIP | National Agriculture Imagery Program |
| NDVI | Normalized Difference Vegetation Index |
| NIR | Near-InfraRed |
| NMS | Non-Maximum Suppression |
| PAN | Panchromatic |
| PNEO | Pléiades Neo |
| RMSE | Root Mean Square Error |
| UAV | Unmanned Aerial Vehicle |
| VHR | Very High Resolution |
| VNIR | Visible+NIR |
References
- Chen, Y.; Sanesi, G.; Li, X.; Chen, W.Y.; Lafortezza, R. Remote Sensing and Urban Green Infrastructure. In Urban Remote Sensing; John Wiley & Sons, Ltd.: Hoboken, NJ, USA, 2021; Chapter 20; pp. 447–468. [Google Scholar] [CrossRef] [Scilit]
- Nowak, D.J.; Hirabayashi, S.; Doyle, M.; McGovern, M.; Pasher, J. Air pollution removal by urban forests in Canada and its effect on air quality and human health. Wild urban ecosystems: Challenges and opportunities for urban development. Urban For. Urban Green. 2018, 29, 40–48. [Google Scholar] [CrossRef] [Scilit]
- Sicard, P.; Agathokleous, E.; Araminiene, V.; Carrari, E.; Hoshika, Y.; De Marco, A.; Paoletti, E. Should we see urban trees as effective solutions to reduce increasing ozone levels in cities? Environ. Pollut. 2018, 243, 163–176. [Google Scholar] [CrossRef] [Scilit] [PubMed]
- Ugolini, F.; Massetti, L.; Calaza-Martínez, P.; Cariñanos, P.; Dobbs, C.; Ostoić, S.K.; Marin, A.M.; Pearlmutter, D.; Saaroni, H.; Sauliene, I.; et al. Effects of the COVID-19 pandemic on the use and perceptions of urban green space. Urban For. Urban Green. 2020, 56, 126888. [Google Scholar] [CrossRef] [Scilit] [PubMed]
- Smith, R.; Thompson, K.; Hodgson, G.; Warren, P.; Gaston, K. Urban domestic gardens: Composition and richness of the vascular plant flora, and implications for native biodiversity. Biol. Conserv. 2006, 129, 312–322. [Google Scholar] [CrossRef] [Scilit]
- Cameron, R.; Blanusa, T.; Taylor, J.; Salisbury, A.; Halstead, A.; Henricot, B.; Thompson, K. The Domestic Garden–Its Contribution to Urban Green Infrastructure. Urban For. Urban Green. 2012, 11, 129–137. [Google Scholar] [CrossRef] [Scilit]
- Zhang, H.; Jim, C. Species diversity and performance assessment of trees in domestic gardens. Landsc. Urban Plan. 2014, 128, 23–34. [Google Scholar] [CrossRef] [Scilit]
- Singh, K.K.; Chen, G.; McCarter, J.B.; Meentemeyer, R.K. Effects of LiDAR point density and landscape context on estimates of urban forest biomass. ISPRS J. Photogramm. Remote Sens. 2015, 101, 310–322. [Google Scholar] [CrossRef] [Scilit]
- Song, Y.; Imanishi, J.; Sasaki, T.; Ioki, K.; Morimoto, Y. Estimation of broad-leaved canopy growth in the urban forested area using multi-temporal airborne LiDAR datasets. Urban For. Urban Green. 2016, 16, 142–149. [Google Scholar] [CrossRef] [Scilit]
- Shojanoori, R.; Shafri, H. Review on the use of remote sensing for urban forest monitoring. Arboric. Urban For. 2016, 42, 400–417. [Google Scholar] [CrossRef] [Scilit]
- Zhao, H.; Morgenroth, J.; Pearse, G.; Schindler, J. A Systematic Review of Individual Tree Crown Detection and Delineation with Convolutional Neural Networks (CNN). Curr. For. Rep. 2023, 9, 149–170. [Google Scholar] [CrossRef] [Scilit]
- Tong, P.; Han, P.; Li, S.; Li, N.; Bu, S.; Li, Q.; Li, K. Counting trees with point-wise supervised segmentation network. Eng. Appl. Artif. Intell. 2021, 100, 104172. [Google Scholar] [CrossRef] [Scilit]
- Ferreira, M.; Almeida, D.; Papa, D.; Minervino, J.; Veras, H.; Formighieri, A.; Santos, C.; Ferreira, M.; Figueiredo, E.; Ferreira, E. Individual tree detection and species classification of Amazonian palms using UAV images and deep learning. For. Ecol. Manag. 2020, 475, 118397. [Google Scholar] [CrossRef] [Scilit]
- Ulku, I.; Akagündüz, E.; Ghamisi, P. Deep Semantic Segmentation of Trees Using Multispectral Images. IEEE J. Sel. Top. Appl. Earth Obs. Remote Sens. 2022, 15, 7589–7609. [Google Scholar] [CrossRef] [Scilit]
- Martins, G.; Cue La Rosa, L.; Nigri Happ, P.; Teixeira Coelho, L.C.; Santos, C.; Feitosa, R.; Ferreira, M. Deep learning-based tree species mapping in a highly diverse tropical urban setting. Urban For. Urban Green. 2021, 64, 127241. [Google Scholar] [CrossRef] [Scilit]
- Zamboni, P.; Junior, J.M.; Silva, J.d.A.; Miyoshi, G.T.; Matsubara, E.T.; Nogueira, K.; Gonçalves, W.N. Benchmarking Anchor-Based and Anchor-Free State-of-the-Art Deep Learning Methods for Individual Tree Detection in RGB High-Resolution Images. Remote Sens. 2021, 13, 2482. [Google Scholar] [CrossRef] [Scilit]
- Weinstein, B.; Marconi, S.; Bohlman, S.; Zare, A.; White, E. Individual tree-crown detection in RGB imagery using semi-supervised deep learning neural networks. Remote Sens. 2019, 11, 1309. [Google Scholar] [CrossRef] [Scilit]
- Beloiu, M.; Heinzmann, L.; Rehush, N.; Gessler, A.; Griess, V.C. Individual Tree-Crown Detection and Species Identification in Heterogeneous Forests Using Aerial RGB Imagery and Deep Learning. Remote Sens. 2023, 15, 1463. [Google Scholar] [CrossRef] [Scilit]
- Freudenberg, M.; Magdon, P.; Noelke, N. Individual tree crown delineation in high-resolution remote sensing images based on U-Net. Neural Comput. Appl. 2022, 34, 22197–22207. [Google Scholar] [CrossRef] [Scilit]
- Lv, L.; Li, X.; Mao, F.; Zhou, L.; Xuan, J.; Zhao, Y.; Yu, J.; Song, M.; Huang, L.; Du, H. A Deep Learning Network for Individual Tree Segmentation in UAV Images with a Coupled CSPNet and Attention Mechanism. Remote Sens. 2023, 15, 4420. [Google Scholar] [CrossRef] [Scilit]
- Chi, Y.; Wang, C.; Chen, Z.; Xu, S. TCSNet: A New Individual Tree Crown Segmentation Network from Unmanned Aerial Vehicle Images. Forests 2024, 15, 1814. [Google Scholar] [CrossRef] [Scilit]
- Ball, J.; Hickman, S.; Jackson, T.; Koay, X.; Hirst, J.; Jay, W.; Archer, M.; Aubry-Kientz, M.; Vincent, G.; Coomes, D. Accurate delineation of individual tree crowns in tropical forests from aerial RGB imagery using Mask R-CNN. Remote Sens. Ecol. Conserv. 2023, 9, 641–655. [Google Scholar] [CrossRef] [Scilit]
- Lempitsky, V.; Zisserman, A. Learning To Count Objects in Images. In Proceedings of the Advances in Neural Information Processing Systems; Lafferty, J., Williams, C., Shawe-Taylor, J., Zemel, R., Culotta, A., Eds.; Curran Associates, Inc.: Red Hook, NY, USA, 2010; Volume 23; Available online: https://proceedings.neurips.cc/paper_files/paper/2010/file/fe73f687e5bc5280214e0486b273a5f9-Paper.pdf (accessed on 27 April 2026).
- Osco, L.P.; dos Santos de Arruda, M.; Marcato Junior, J.; da Silva, N.B.; Ramos, A.P.M.; Saito Moryia, É.A.; Imai, N.N.; Pereira, D.R.; Creste, J.E.; Matsubara, E.T.; et al. A convolutional neural network approach for counting and geolocating citrus-trees in UAV multispectral imagery. ISPRS J. Photogramm. Remote Sens. 2020, 160, 97–106. [Google Scholar] [CrossRef] [Scilit]
- Yao, L.; Liu, T.; Qin, J.; Lu, N.; Zhou, C. Tree counting with high spatial-resolution satellite imagery based on deep neural networks. Ecol. Indic. 2021, 125, 107591. [Google Scholar] [CrossRef] [Scilit]
- Ventura, J.; Pawlak, C.; Honsberger, M.; Gonsalves, C.; Rice, J.; Love, N.L.; Han, S.; Nguyen, V.; Sugano, K.; Doremus, J.; et al. Individual tree detection in large-scale urban environments using high-resolution multispectral imagery. Int. J. Appl. Earth Obs. Geoinf. 2024, 130, 103848. [Google Scholar] [CrossRef] [Scilit]
- Regione Lombardia. Territorio e Popolazione. 2026. Available online: https://www.regione.lombardia.it/wps/portal/istituzionale/HP/DettaglioRedazionale/scopri-la-lombardia/Archivio/Territorio-e-popolazione/Territorio%2Be%2Bpopolazione/red-territorio-e-popolazione-REC (accessed on 27 April 2026).
- Tuttitalia. Comuni della Lombardia per Popolazione Residente, 2025. Data updated to 1 January 2025 from ISTAT. Available online: https://www.tuttitalia.it/lombardia/20-comuni/popolazione/ (accessed on 27 April 2026).
- Comune di Monza. Piano di Governo del Territorio (PGT). n.d. Available online: https://www.comune.monza.it (accessed on 27 April 2026).
- Villa Reale e Parco di Monza. Parco di Monza-Official Website. n.d. Available online: https://www.reggiadimonza.it/parco (accessed on 27 April 2026).
- Alcaras, E.; Parente, C.; Vallario, A. Automation of Pan-Sharpening Methods for Pléiades Images Using GIS Basic Functions. Remote Sens. 2021, 13, 1550. [Google Scholar] [CrossRef] [Scilit]
- Esri. Convolution Function. 2025. Available online: https://pro.arcgis.com/en/pro-app/latest/help/analysis/raster-functions/convolution-function.html (accessed on 30 April 2026).
- Airbus Defence and Space. Pléiades Neo User Guide–Early Version 3. Technical Report, Airbus Defence and Space. 2021. Available online: https://wp-cdn.apollomapping.com/web_assets/user_uploads/2021/11/08103301/2021.10_PleiadesNeo_UserGuide-EarlyRelease_20211015.pdf (accessed on 30 April 2026).
- Tucker, C.J. Red and photographic infrared linear combinations for monitoring vegetation. Remote Sens. Environ. 1979, 8, 127–150. [Google Scholar] [CrossRef] [Scilit]
- Myneni, R.B.; Hall, F.G.; Sellers, P.J.; Marshak, A.L. The interpretation of spectral vegetation indexes. IEEE Trans. Geosci. Remote Sens. 1995, 33, 481–486. [Google Scholar] [CrossRef] [Scilit]
- Deng, J.; Dong, W.; Socher, R.; Li, L.J.; Li, K.; Li, F.-F. ImageNet: A large-scale hierarchical image database. In Proceedings of the 2009 IEEE Conference on Computer Vision and Pattern Recognition, Miami, FL, USA, 20–25 June 2009; pp. 248–255. [Google Scholar] [CrossRef] [Scilit]
- Zhu, L.; Zhao, Z.; Lu, C.; Lin, Y.; Peng, Y.; Yao, T. Dual Path Multi-Scale Fusion Networks with Attention for Crowd Counting. arXiv 2019, arXiv:1902.01115. [Google Scholar]
- He, K.; Zhang, X.; Ren, S.; Sun, J. Deep Residual Learning for Image Recognition. arXiv 2015, arXiv:1512.03385. [Google Scholar]
- Simonyan, K.; Zisserman, A. Very Deep Convolutional Networks for Large-Scale Image Recognition. arXiv 2015, arXiv:1409.1556. [Google Scholar]
- Glorot, X.; Bengio, Y. Understanding the difficulty of training deep feedforward neural networks. In Proceedings of the Thirteenth International Conference on Artificial Intelligence and Statistics, Chia Laguna Resort, Sardinia, Italy, 13–15 May 2010; Teh, Y.W., Titterington, M., Eds.; Proceedings of Machine Learning Research; 2010; Volume 9, pp. 249–256. Available online: https://proceedings.mlr.press/v9/glorot10a.html (accessed on 27 April 2026).
- Cheng, G.; Zhou, P.; Han, J. Learning Rotation-Invariant Convolutional Neural Networks for Object Detection in VHR Optical Remote Sensing Images. IEEE Trans. Geosci. Remote Sens. 2016, 54, 7405–7415. [Google Scholar] [CrossRef] [Scilit]
- Sanesi, G.; Colangelo, G.; Lafortezza, R.; Calvo, E.; Davies, C. Urban green infrastructure and urban forests: A case study of the Metropolitan Area of Milan. Landsc. Res. 2016, 42, 164–175. [Google Scholar] [CrossRef] [Scilit]
- Bowler, D.E.; Buyung-Ali, L.; Knight, T.M.; Pullin, A.S. Urban greening to cool towns and cities: A systematic review of the empirical evidence. Landsc. Urban Plan. 2010, 97, 147–155. [Google Scholar] [CrossRef] [Scilit]
- Repubblica Italiana. Legge 14 Gennaio 2013, n. 10: Norme per lo Sviluppo degli Spazi verdi Urbani, 2013. Pubblicata nella Gazzetta Ufficiale n. 27 del 1 Febbraio 2013. Available online: https://www.normattiva.it/uri-res/N2Ls?urn:nir:stato:legge:2013;10 (accessed on 27 April 2026).

Disclaimer/Publisher’s Note: The statements, opinions and data contained in all publications are solely those of the individual author(s) and contributor(s) and not of MDPI and/or the editor(s). MDPI and/or the editor(s) disclaim responsibility for any injury to people or property resulting from any ideas, methods, instructions or products referred to in the content. |
© 2026 by the authors. Licensee MDPI, Basel, Switzerland. This article is an open access article distributed under the terms and conditions of the Creative Commons Attribution (CC BY) license.