


Highlights
What are the main findings?
- Automatic AI-based models leveraging a physically interpretable radiometric feature set extracted from co-registered pre-/post-event SAR chip pairs enable robust damage-status classification after hazardous events for both high-voltage power transmission towers and power lines.
- Among the tested classifiers, the Multi-Layer Perceptron (MLP) model, even trained using only physics-based simulated SAR tower signatures, provides the best operational trade-off, combining high accuracy with low inference latency.
What are the implications of the main findings?
- A physics-guided, signature-based SAR simulator can mitigate the scarcity of labelled rare-event tower samples and support simulation-aided MLP training within the validated applicability domain of the study.
- The proposed pipeline is compatible with SAR on-board implementation towards near-real-time damage assessment, enabling more rapid and reliable triage of power transmission towers and lines over large geographic areas in the aftermath of extreme events.
Abstract
The essential role of electricity supply for public and private services highlights the need to monitor the stability of power transmission networks during, or immediately after, hazardous events. In the aftermath of calamities, traditional field inspections may be impractical or unsafe, leaving operators without timely information on the condition of critical assets. In this paper, we present and discuss the performance of two automatic Artificial Intelligence (AI)-based models (Multi-Layer Perceptron (MLP) neural network architectures and Support Vector Machine (SVM) model) designed to automatically assess the status of high-voltage transmission towers and power lines through multi-temporal spaceborne Synthetic Aperture Radar (SAR) image analysis. Model development and testing rely on real COSMO-SkyMed Stripmap observations of damaged towers and power lines affected by documented hazardous events across Italy, complemented by simulated tower data generated with a physics-guided, signature-based SAR simulator designed to preserve the observed target-to-background contrast and spatial footprint patterns of real SAR tower signatures. Results indicate that the MLP, trained on either real or simulated data, achieved 100% Overall Accuracy (OA) with no observed false positives or false negatives within the considered visibility-screened real test set, while providing inference times on the order of tenths of milliseconds per target… Computational performance characteristics, operational advantages, and the potential pathway toward satellite on-board porting are discussed to enhance situational awareness and support the prioritisation of interventions during critical events.
1. Introduction
The reliability and structural integrity of electric power transmission networks are essential in modern societies, underpinning essential public and private services, such as healthcare, transportation, telecommunications, and financial systems [1,2]. The increasing interdependence of such services has amplified societal vulnerability to power outages, whose impacts often propagate through cascading and compounding negative effects [3,4]. Thus, electric network outages can lead to widespread and negative consequences, particularly when situational awareness on the state of critical energy infrastructure is limited during the emergency phase, delaying effective damage assessment and restoration activities [5,6]. Furthermore, power outages and their cascading negative consequences can generate substantial economic losses, with total costs strongly dependent on outage duration, geographical extent of the affected area, and the restoration time [2,7].
Among others, natural hazard events are widely recognised as primary causative factors for power transmission network failures [8,9,10]. In the light of climate change, weather-related damage to power transmission networks is expected to increase, driven by the rising frequency, intensity, and duration of severe extreme weather events, which can lead to power interruptions ranging from minutes to days [8,11]. In such a context, effective risk management requires a dual approach: first, implementation of vulnerability reduction measures aimed at enhancing power transmission network resilience to extreme events [8]; and second, development of capabilities enabling rapid assessment of critical energy infrastructure status during or immediately following hazardous event occurrence, representing a key operational requirement for effectively guiding restoration operations during emergency response phases [3].
Current operational practices for assessing the physical condition of power transmission assets in real time or near real time predominantly rely on field-based and aerial inspection methodologies [12,13]. These approaches include ground patrols, helicopter-based surveys, Airborne Laser Scanning (ALS) systems, and, more recently, Unmanned Aerial Vehicle (UAV)-based video inspections [13,14,15,16]. While these methodologies can provide high-detail information of the electric transmission networks, they are intrinsically constrained in terms of spatial coverage, scalability, and personnel safety, particularly during and in the immediate aftermath of hazardous events, such as storms, hurricanes, floods, wildfires, and earthquakes [13,17]. Consequently, electric grid operators may lack timely and objective information regarding real-time or near-real-time infrastructure conditions when emergency response and restoration decisions are most urgent.
Satellite-based monitoring offers significant potential to mitigate these operational limitations, as evidenced by recent promising results on the detection of collapsed transmission power towers in high-resolution optical images [18]. Nonetheless, the operational reliability of optical acquisitions remains susceptible to atmospheric conditions, particularly cloud cover and illumination constraints. In this respect, Synthetic Aperture Radar (SAR) technology provides a complementary capability by enabling day-and-night, all-weather imaging across extensive geographic areas. Over the last decades, substantial research has investigated the interaction between SAR signals and power transmission infrastructure, demonstrating that both high-voltage transmission towers and power lines can produce distinctive backscattering signatures under appropriate geometric conditions [19,20,21,22]. Multiple studies have focused on characterising the electromagnetic scattering mechanisms of power lines, highlighting the role of some parameters, such as spatial resolution, incidence angle, polarisation, wavelength, and conductor geometry in shaping radar visibility [20,23,24,25,26]. It is worth noting that, when moving from the 3 m spatial resolution in both range and azimuth of COSMO-SkyMed (Constellation of Small Satellites for Mediterranean basin Observation) [27] and TerraSAR-X (TSX) [28] missions toward sub-meter spatial resolutions enabled by high-resolution spotlight acquisitions [29], both high voltage towers and power lines can be observed with progressively enhanced geometric and radiometric detail, evolving from sparse bright-point responses to increasingly resolved, object-like signatures that better preserve target identification [20,21,25]. Conversely, at coarser spatial resolutions exceeding metric scales, such as those provided by the Copernicus Sentinel-1 mission (20 m × 5 m spatial resolution in Interferometric Wide Swath mode [30]), power lines are generally no longer distinguishable and tend to blend into background clutter, while towers may remain weakly detectable, enabling displacement monitoring (e.g., [31,32]). However, tower shape is not resolved at this resolution scale, limiting intensity-based status assessment capabilities.
With reference to polarisation and frequency, the detectability of towers and power lines in SAR images is generally achieved by considering the co-polarised signal (Vertical–Vertical (VV) and Horizontal–Horizontal (HH) signals) across multiple frequency bands, such as the X-, C-, L-, Ka-, and P-bands [24,25,26]. Furthermore, Yan et al. [20] reported the scattering characteristics of power transmission towers and lines using co-polarised TSX SAR images of 3 m resolution, highlighting that power lines become detectable as bright spots only at specific locations along the span and under particular SAR acquisition geometries. Specifically, power line visibility is defined as optimal when the line span is approximately parallel to the azimuth direction within an angular tolerance on the order of ±10°, with the bright-spot locations along the span shifting as the relative orientation varies within this range.
Based on the scientific evidence documented in the literature, it is reasonable to investigate the feasibility of developing a SAR-based processing framework for potential damage detection of both high-voltage towers and power lines by investigating their geometric and radiometric characteristics before and after the occurrence of hazardous events [14]. It is worth noting that a SAR-based damage assessment of a high-voltage transmission network is operationally viable only when the visibility of the energy infrastructure is guaranteed. Thus, it may be hindered in the presence of radiometric distortion phenomena (e.g., layover, foreshortening, and shadowing) or by specific land-cover conditions characterised by high background backscattering overlapping the response of towers and power lines.
In the broader SAR literature, the assessment of target modifications between two acquisition times is commonly addressed within a multi-temporal change-detection framework [33,34]. Accurately co-registered SAR images are typically compared through difference, ratio, log-ratio, or statistical similarity representations, often followed by thresholding, clustering, or supervised/learning-based classification to distinguish changed from unchanged areas while mitigating speckle-related ambiguities [35,36,37]. More recent studies have further explored structural-similarity measures, improved difference-image representations, and learning-based refinements to enhance the robustness and separability of SAR change features [38].
Within this study, the SAR-based change-detection analysis of potential energy-infrastructure damage specifically focuses on COSMO-SkyMed Stripmap SAR acquisitions, which enable accurate repeat-pass co-registration and provide a suitable metre-class spatial resolution with wide kilometre-scale coverage, as required for robust multi-temporal SAR analysis over extensive geographic regions. The collection of real case-study datasets was enabled by the availability of Stripmap SAR images with a 40 km × 40 km nominal swath acquired by the operational X-band mission COSMO-SkyMed and COSMO-SkyMed Second Generation (CSK-CSG, hereafter COSMO) developed by the Italian Space Agency (Agenzia Spaziale Italiana—ASI). Specifically, ASI and the Italian Civil Protection Department established the “MapItaly” systematic acquisition plan of Stripmap SAR COSMO images, providing a full coverage of the entire Italian territories with a nominal spatial resolution of approximately 3 m and a nominal repeat cycle of 16 days since 2009, thereby providing a well-suited dataset for the conducted analyses [29,39,40,41].
It is important to note that this study has been conducted within the framework of the “TOWER-CHECK” project, which focuses on automatic Artificial Intelligence (AI)-based techniques to monitor the status of high-voltage power transmission networks through SAR satellite near real-time on-board processing. As a matter of fact, we recognise that timely status assessment of transmission towers and power lines impacted by hazardous events can only be operationally achieved if such an application is implemented on board a satellite platform, thereby reducing the latency between event occurrence and satellite overpass and supporting rapid emergency decision-making (e.g., [42,43,44,45]). As a first step toward this objective, the present study investigates the technical feasibility of a Stripmap SAR-based damage assessment framework for high-voltage power transmission network monitoring using both real and SAR-simulated data (Section 2) and describes the considered methodological approaches based on automatic AI-based change-detection algorithms (Section 3). Subsequently, results for the selected approaches are presented and discussed, highlighting both potentials and limitations and concluding remarks and overall considerations with reference to the potential SAR satellite on-board deployment are provided (Section 4 and Section 5).
2. Data Collection and Preparation: Real Case Studies and Simulated Data
The input data used to develop and test the automatic AI-based classification models (Section 3) have been organised into three subsets (training, validation and test) of both labelled (intact or collapsed) and unlabelled targets. To comprehensively assess robustness and generalisation capabilities, two experimental settings have been designed. These configurations, designated as Setting A and Setting B, differ according to whether the SAR chips were derived exclusively from real COSMO Stripmap acquisitions or whether physics-guided simulated tower chips were integrated into the training process.
2.1. Setting A: Real Intact and Collapsed Tower Data Collection and COSMO SAR Chip Extraction
Within setting A, only authentic documented cases of intact and collapsed high-voltage transmission towers and power lines were used to build the training, validation, and test datasets. To systematically identify and collect documented cases of damaged power transmission towers and lines, a comprehensive web-based review of hazardous events affecting the Italian high-voltage power transmission network was conducted. The temporal analysis focused on the Italian territory, with reference to events that occurred after 2009, consistent with the availability of COSMO SAR data acquired under the ASI MapItaly systematic acquisition plan. Event identification relied on a structured keyword-driven search strategy (e.g., “high-voltage power transmission networks”, “collapse of towers and power lines”, “Italy”), followed by detailed screening of individual documented cases. For each candidate event, comprehensive verification procedures were performed to establish the precise geolocation of the affected towers and power lines. This verification phase relied upon multiple web-based documentary sources, including local and national news reports, publicly available videos, and high- to very-high-resolution optical satellite imagery. Thus, geolocation refinement of collapsed towers was achieved through cross-validation of documentary evidence and visual interpretation of very-high-resolution optical imagery when available (Figure 1). Only events supported by sufficiently reliable spatial and contextual information were retained in the final dataset inventory.
Figure 1.
Geographic distribution across the Italian territory of documented high-voltage transmission network sites with collapsed/removed towers and power lines is considered in this study.
The resulting event inventory includes power tower collapses caused by hazardous events, as well as structural failures associated with anthropogenic factors, such as deliberate removal of structural elements at the tower base (Table 1). To augment the damaged-class sample size, the dataset of collapsed power towers was enriched with high-voltage power towers deliberately removed during extraordinary maintenance interventions. These cases were identified and geolocated through visual inspection of freely available very high-resolution optical imagery through Google Earth Pro [46].
Table 1.
Inventory of documented high-voltage transmission network sites with collapsed/removed towers and power lines considered in this study.
As reference cases of intact high-voltage towers and power lines, towers were selected at sufficiently large distances from the affected sites to minimise the likelihood of being impacted by the documented events listed in Table 1. These reference towers were further verified and confirmed to be structurally intact with reference to the time window associated with the corresponding collapse or removal events, using an optical image interpretation strategy.
Generally, each high-voltage power tower was annotated with essential attributes, including geographic coordinates (latitude, longitude and tower base elevation), tower structural height, operational status classification (intact versus collapsed/removed), and the potential collapse/removal date.
As illustrated in Figure 2, to construct a comprehensive SAR dataset of high-voltage towers and power lines, COSMO Stripmap SAR images were collected for each area listed in Table 1 over the pre-and post-event temporal periods, forming site-specific stacks that were processed independently (Table 2).
Figure 2.
A comprehensive methodological workflow for pre- and post-event Synthetic Aperture Radar (SAR) chip extraction of intact and collapsed/removed towers and power lines was performed on each SAR data stack.
Table 2.
List of COSMO -SkyMed Synthetic Aperture Radar (SAR) data stacks (Stripmap Mode, 3 m resolution) of each documented infrastructure damage site.
To support reliable co-registration and radiometric change analysis, each stack was composed of SAR images acquired with repeated acquisition geometry. The processing workflow closely reflects the pre-processing steps commonly required by Multi-Temporal Interferometric SAR (MT-InSAR) techniques, which are recognised for demanding highly accurate co-registration and calibration. Specifically, all SAR images within each stack were co-registered to a single reference acquisition (master image) with sub-pixel accuracy. Given the high spatial resolution of the employed data, a Digital Elevation Model (DEM)-assisted approach was adopted [61]. In detail, the present work relies upon Stable Point Interferometry even over Unurbanized Areas (SPINUA) MT-InSAR processing chain documented in [62], which is routinely employed also for Persistent Scatterers/Distribution Scatterers large-scale productions on high-performance computing infrastructures and has been validated extensively over the past two decades. Radiometric calibration procedures were applied to equalise SAR images, improving intensity consistency and enabling multi-temporal analyses [63]. Subsequently, a georeferencing step was performed by assigning to each master-image pixel its corresponding latitude, longitude, and elevation coordinates. All processing steps were performed while preserving the native radar acquisition geometry, requiring only minimal interpolation inherent to radar-grid alignment, thereby avoiding the introduction of additional interpolation artefacts. This avoids the additional resampling introduced by transformations into alternative geometries (e.g., geographic coordinates), which may increase noise and promote local aliasing artefacts.
It is important to note that the processing strategy was refined based on preliminary analyses. In principle, the analysis framework was conceived using a single pre-event and a single post-event acquisition. However, preliminary investigations indicated that a single-pair configuration may be sensitive to speckle-driven radiometric fluctuations. Although spatial speckle filtering with a small local window (e.g., 3 × 3 pixels) can partially mitigate this effect, such filtering may degrade effective spatial resolution and, in turn, compromise target recognition capabilities. Therefore, leveraging the availability of Stripmap SAR COSMO images of the ASI MapItaly systematic acquisition plan, a temporal averaging strategy was implemented for the pre-event image by averaging a minimum of nine acquisitions to achieve a sample size statistically comparable to a 3 × 3 spatial window while preserving native spatial resolution, with one additional pre-event image included to further stabilise radiometry. For the post-event period, a single co-registered acquisition was selected to preserve event-specific radiometric information for pre-/post-event comparative analysis.
From each processed SAR stack, paired pre-event and post-event SAR chips were extracted for each tower based upon previously determined geographic coordinates of intact and collapsed/removed power transmission towers. This chip-based strategy is enabled by the availability of accurate target coordinates, allowing focused analysis of well-defined points of interest. By isolating limited spatial extents around each infrastructure element, SAR chip extraction excludes surrounding scene areas that are not informative for the phenomenon under investigation and might introduce background variability, thereby hindering subsequent damage detection procedures. For this purpose, target-adaptive bounding boxes were delineated for each power tower. Bounding box dimensions were determined by combining the tower structural height with the acquisition geometry and DEM-based projection effects to compute the expected tower footprint in SAR coordinates. Subsequently, bounding boxes were refined according to tower footprint, effectively observed in SAR images, ensuring consistent spatial context around infrastructure elements. Therefore, each SAR chip pair captures the radiometric response of the identical scene portion before and after documented events (Figure 3). A radiometric visibility criterion was subsequently applied to retain only power towers exhibiting a clear contrast with respect to local background clutter. Specifically, if background clutter levels were below −5 dB for at least 95% of the chip pixels and the tower response exceeded 0 dB on at least four pixels, the pre-event SAR chip was submitted for operator verification and final acceptance. When the radiometric contrast criteria were not satisfied, the tower sample was rejected from the dataset. As further discussed in Section 4, this eligibility criterion also defines the operational monitorability domain of the proposed approach, since only targets satisfying the preliminary SAR visibility screening are considered suitable for reliable damage-status classification.
Figure 3.
Representative example of COSMO calibrated σ0 (dB) images and identification of SAR targets. (Left) panel: pre-event temporal average (10 acquisitions) showing enhanced target-to-background contrast and reduced speckle noise. (Right) panel: single post-event SAR acquisition exhibiting characteristic speckle variability. Green bounding boxes delineate target-adaptive spatial extents for: (1, 3) power transmission lines exhibiting bright-spot signatures aligned with azimuth direction; (2, 4) high-voltage transmission towers manifesting as spatially extended high-backscatter regions.
Regarding power transmission lines, their visibility in SAR images strongly depends on the acquisition geometry relative to the orientation of each line span orientation [20]. Targeted screening was performed, selecting only spans satisfying the ±10° azimuth-alignment requirement. Following this visibility verification procedure, SAR chips associated with visible power lines were identified and extracted from the selected spans. These samples, in addition to those extracted for power towers, were used to populate the comprehensive dataset of real cases.
2.2. Setting B: Generation of Simulation-Based Intact/Collapsed Power Transmission Towers
With reference to Setting B, simulated representations of intact and collapsed power towers were used to construct the training and validation datasets, while real documented cases of intact and collapsed/removed towers and power lines are retained only for test-set evaluation. Setting B was introduced to address a key limitation of real infrastructure damage datasets, as noted by [18]: the limited availability of cases of collapsed tower and power lines relative to intact ones. To mitigate this class-imbalance issue, we developed a data-driven, signature-based SAR simulation framework guided by real COSMO Stripmap observations of intact and collapsed towers. The simulator is founded on the identification and characterisation of the primary radiometric and geometric signatures that distinguish intact from collapsed/removed towers in the available case studies, and it generates additional pre-/post-event chip pairs by preserving the observed target-to-background contrast and spatial footprint patterns, rather than aiming for absolute radiometric σ0 realism. The objective is to provide classification models with a broader and more controlled set of damage scenarios during training and validation, while preserving an unbiased performance assessment on independent real-world cases during testing.
2.2.1. Assumptions and Scope
The simulator is intentionally lightweight and target-oriented: it does not aim at reproducing absolute radiometric σ0 values or a full electromagnetic scattering model. Instead, it captures the minimum set of assumptions required by the proposed feature-based detector, namely (i) a persistent high-contrast tower signature with respect to local clutter in pre-event conditions, and (ii) a post-event radiometric discontinuity consistent with tower collapse/removal. Therefore, the simulation preserves the background-to-target intensity contrast observed in COSMO Stripmap chips, rather than enforcing radiometrically realistic σ0 levels. This deliberate choice places the method in maximum simplicity conditions during training, so that the key question becomes whether such a simplified, contrast-preserving simulation is still sufficient for effective learning. The simulator is designed for training/validation only, while performance is assessed on independent real test data.
2.2.2. Analytical Formulation
Each synthetic sample consists of a pair of intensity chips defined on an azimuth–range grid of size pixels. We define two deterministic intensity templates and , representing the expected spatial footprint of an intact tower and of a collapsed/removed tower, respectively. Templates embed a constant background baseline level (clutter proxy), while tower-related pixels are assigned higher intensity levels according to the assumed footprint (Figure 4), so that the target-to-background contrast is controlled. Inter-sample variability is introduced through random modulation fields and , with values drawn from a uniform distribution on [0, 1]. The simulated chips are generated as:
where for intact samples and for collapsed/removed samples. This formulation preserves the spatial footprint prescribed by the templates while enforcing the desired target-to-background contrast.
Figure 4.
Examples of physics-based simulated SAR intensity chips for high-voltage power transmission towers under intact and collapsed structural configurations. (Upper) panel: Intact configuration; (Lower) panel: Collapsed configuration. (Left) side: pre-event and post-event Intensity templates; (Right) side: pre-event and post-event simulated intensities.
As illustrated in Figure 4, for the intact configuration, the tower response is modelled as a high-intensity footprint across the chip, including a lower-intensity band to emulate within-target heterogeneity. For the collapsed/removed configuration, the post-event footprint is modelled as a localised high-intensity region concentrated near the tower-base portion of the chip, representing the redistribution of dominant scatterers following structural failure.
It is worth noting that the simulation framework was specifically designed to model the radiometric response of power towers exclusively. Regarding power transmission lines, preliminary analyses indicated that their radiometric signatures are generally less challenging to interpret compared to tower responses, as power lines tend to exhibit a more spatially extended footprint, as observed in Figure 3. As a matter of fact, at Stripmap resolution scales, power lines typically appear as sparse, high-intensity bright spots [20,25], with modest temporal fluctuations in radiometric intensity across time-series observations [21]. Consequently, the simulation development effort was focused exclusively on power towers, whose SAR responses exhibit substantially greater spatial heterogeneity and radiometric complexity compared to transmission power lines.
3. Methodological Approach
To enable automated detection of potential structural damages to towers and power lines from paired pre-event and post-event SAR chips, AI-based change detection algorithms that focus on target radiometric response under two experimental configurations (Setting A and Setting B) were selected (Figure 5). To retain the physical interpretability of the underlying electromagnetic scattering phenomena, each target (tower or power lines) was represented by a comprehensive set of radiometric features computed on co-registered pre-event average intensity SAR images and a single post-event intensity SAR image. This feature-based representation explicitly encodes the expected backscatter behaviour: the absence or minimal variations for intact targets versus substantial radiometric changes for collapsed/removed ones. The feature representation approach also enables classification models to process variable-size SAR chips, as bounding boxes are target-adaptive and may differ across towers and power lines due to variations in target footprint characteristics and radar acquisition geometry. Radiometric feature selection is described in Section 3.1, while selected AI-based SAR classification models are presented in Section 3.2.
Figure 5.
Overview of the experimental workflow adopted for the development and evaluation of the Artificial Intelligence (AI)-based classification models under Setting A and Setting B (Solid arrows indicate the direct processing flow. The dashed arrow indicates that the observed real target database informs the simplified target simulator, rather than serving as a direct input).
3.1. Selection of Radiometric Features
The set of radiometric features was selected from widely established statistical and image-processing metrics documented in the scientific literature. The selected features were chosen among typical and consolidated change-detection descriptors to ensure compatibility with an on-board-oriented processing chain, where classification performance must be balanced against limited computational complexity. They were computed for each co-registered chip pair, with the pre-event average-intensity SAR image used as reference and the post-event SAR image used for comparison. The resulting feature vector provides a quantitative summary of radiometric changes between the two acquisitions that may be consistent with structural damage, such as collapsed/removed towers or power lines. These radiometric features provide input to the AI-based classification models described in Section 3.2.
3.1.1. Feature 1: Pearson’s Correlation Coefficient
The Pearson’s Correlation Coefficient (PCC) [64] quantifies the linear correlation between the intensity values of corresponding pixels in two co-registered SAR images, namely the pre-event image and the post-event image . This metric is evaluated over the chip area and ranges from −1 to 1. It is defined as:
where is the intensity of the -th pixel in images and , respectively, and are the average intensities of the two images, and is the number of pixels within the chip.
3.1.2. Feature 2 (Mean Value) and Feature 3 (Max Value) of Structural Similarity Index Measure
Structural Similarity Index Measure (SSIM) [65] evaluates local structural similarity between two intensity images (pre-event) and (post-event). It is computed locally by sliding a fixed-size window over the two co-registered images and comparing patches extracted at corresponding locations. This operation produces an SSIM spatial map in which each pixel stores the SSIM value computed over its local neighbourhood. From the SSIM map, two summary statistics are derived: Feature 2, the mean SSIM averaged over the complete SSIM map, and Feature 3, the maximum SSIM (peak value across the SSIM map). SSIM values range between −1 and 1. It is defined as:
where and are local means, and are local standard deviations, is local cross-covariance and and are stabilising constants.
3.1.3. Feature 4: Pixel-Count Ratio
Pixel-Count Ratio (PCR) quantifies the relative change in the number of high-backscatter pixels associated with the target (tower or power lines) response between pre-event and post-event conditions. It is defined as:
which corresponds to the fraction of pixels classified as target in the pre-event average intensity image () that are still classified as targets in the post-event image (). Pixel classification is obtained by selecting a high-backscatter pixel via the Otsu method [66] for automatic threshold selection. Specifically, for each target-adaptive bounding box, Otsu’s algorithm was initially applied to the pre-event average image to determine the optimal segmentation threshold, as threshold estimation is more stable when computed on a multi-temporal averaged imagery. The resulting binary mask provided the target footprint and the corresponding value . This footprint mask was subsequently transferred to the co-registered post-event image. Since images were previously radiometrically calibrated through equalisation procedures, the same threshold was applied to segment the post-event image within the predefined footprint extent. The number of active pixels in the post-event image () was then computed, and the PCR was evaluated.
For intact targets, the ratio is expected to approach unity, indicating a comparable number of active pixels in pre- and post-event conditions. Conversely, for collapsed/removed targets, the number of detected active pixels in the post-event image is expected to decrease substantially, with the ratio approaching 0.
3.1.4. Feature 5: Dice Similarity Coefficient
The Dice Similarity Coefficient (DSC), also known as the Sørensen–Dice coefficient [67,68], quantifies the spatial overlap between two binary masks derived from the pre-event average intensity SAR image and the single post-event image for each target. The DSC ranges from 0 (indicating no spatial overlap) to 1 (representing perfect spatial overlap). It is defined as:
where and denote sets of pixels classified as target in the pre-event and post-event masks, respectively. Mask and mask are those derived in feature 4 (PCR) via Otsu-based segmentation.
3.1.5. Feature 6: Jaccard Similarity Coefficient
As feature 5 (DSC), the Jaccard Similarity Coefficient (JSC) [69] quantifies spatial overlap between two binary masks derived from the pre-event average SAR intensity image and the single post-event image. It ranges from 0 (no spatial overlap) to 1 (perfect spatial overlap). It is defined as:
where and denote the sets of pixels classified as target in the pre-event and post-event masks, respectively.
The same procedure adopted for the DSC was used to derive masks and . However, feature 6 (JSC) was introduced to evaluate an independent post-event threshold not inherited from the pre-event mask, as employed for feature 5 (DSC), and it was implemented to provide complementary information to the DSC metric. Rather than re-computing DSC, we used JSC as a distinct feature. Thus, although Dice and Jaccard indices are monotonically related when computed from the same masks [70], this relationship does not hold because DSC and JSC are obtained from different thresholds.
3.2. Selected Automatic AI-Based SAR Classification Models
This study aims to define an automated, AI-based methodological approach for damage detection in towers and power lines, while simultaneously evaluating the effectiveness of different classification methods that were developed in a MATLAB (R2025b, The MathWorks, Inc., Natick, MA, USA) computational environment. Their effectiveness in terms of classification accuracy and robustness was evaluated by comparing the performances of the selected methods using identical datasets.
The methodological approach adopted in this study is based on the extraction of numerical radiometric features and was preferred over a purely image-driven approach, as radiometric features are physically meaningful, allowing enhanced model interpretability.
Additionally, the effective pixel spacing and spatial resolution of SAR images may vary with the acquisition geometry, implying that the analysed chips are not strictly uniform even when extracted from the same SAR mission. Although recent deep learning architectures, including Transformer-based models and deformable convolutional networks, can partially address variable-sized input representations [71,72], the adopted radiometric feature representation naturally overcomes the issue of heterogeneous image dimensions while preserving the original physical information content without introducing potential resampling artefacts or geometric distortions. Furthermore, purely image-driven deep learning approaches generally provide limited physical interpretability of the classification process [73], whereas feature-based representation maintains an explicit and physically interpretable relationship. For these reasons, the proposed methodology intentionally focuses on feature-based classification rather than direct image-based classification, leading to the adoption of fully connected feedforward Multi-Layer Perceptron (MLP) neural networks and Support Vector Machines (SVMs) as suitable classification approaches for the considered application scenario.
MLPs represent a class of feedforward neural networks employed for supervised learning tasks and constitute a common architecture within Non-Convolutional Neural Networks (NCNNs). An MLP consists of interconnected processing units (neurons) organised through weighted connections, organised into an input layer, one or more hidden layers, and an output layer. The input layer receives an external activation vector, which is propagated forward through successive layers until producing an output activation vector. From a functional perspective, an MLP performs a nonlinear mapping transformation between an input vector and an output vector, entirely determined by the values of the network connection weights. Computation proceeds sequentially: each neuron computes its activation as the weighted sum of its inputs, followed by application of a nonlinear activation function. Learning in MLPs occurs in a supervised framework, wherein the learning process consists of the incremental adjustment of the connection weights to reduce the distance between the network output and the target associated with the training data. This objective is formulated as the minimisation of a global error function. The most widely used supervised learning method for MLPs is the backpropagation algorithm, which computes the gradient of the error function with respect to the network weights by propagating error information from the output layer back to the previous layers. Backpropagation follows the mathematical principle of gradient descent optimisation, updating the weights in the direction that reduces overall error [74]. The effectiveness of MLPs in classification and regression problems has been previously investigated in scientific literature, including applications involving SAR data (e.g., Sharifzadeh et al., [75]).
Regarding SVMs, they represent non-parametric supervised learning techniques, which do not require prior assumptions about the statistical distribution of the input data. SVMs, which were adopted since they are particularly well established in the remote sensing domain [76,77,78,79,80], demonstrate relatively low sensitivity to training set sample size and can perform effectively even when the data quality exhibits limitations. The fundamental principle underlying SVM methodology is structural risk minimisation, which aims to reduce classification error on unseen data while preventing overfitting phenomena. During the training procedure, the SVM algorithm seeks to identify an optimal hyperplane that most effectively discriminates the classes in the labelled training dataset, maximising its generalisation capability to unseen data. The learning process is iterative and consists of determining the optimal decision boundary within a potentially multidimensional feature space. Once training is completed, the trained model applies the learned decision criterion to classify novel data instances [80].
In this work, the adopted MLP is a feedforward fully connected neural network designed for binary classification. The network weights are learned through supervised training using the labelled feature vectors defined for the considered experimental setting. Regarding the selected SVM classifier, a non-linear model with a radial basis function (RBF) kernel was adopted. Before training, the feature predictors were standardised to avoid scale-dependent effects on the separating hypersurface. The main SVM hyperparameters, namely the box constraint and kernel scale, were optimised through a validation-based procedure aimed at minimising the classification error. For both classifiers, the input predictors consisted of the selected feature vectors, while the target labels corresponded to the Intact and Collapsed/Removed classes.
4. Results and Discussion
This section presents and discusses results obtained by applying two automatic AI-based damage detection methodologies (SVM and MLP) to identify potential structural damages to high-voltage power transmission towers and power lines from co-registered pre- and post-event SAR chip pairs acquired by the COSMO SAR constellation. As already stated, these results represent a preparatory step towards a potential on-board SAR satellite implementation capable of automatically assessing the target status for each target following hazardous events, which is further discussed in subsequent sections.
4.1. Datasets and Radiometric Feature Computation
Table 3 presents the final dataset composition used for model development phases (training and validation) and for inference evaluation (testing) under experimental configurations Setting A and Setting B. In Setting A, exclusively real data were used in training, validation, and testing procedures. In Setting B, simulated data were used for training and validation, while testing was performed on real data. For Setting A, removed samples within the damaged class were incorporated exclusively into the training and validation subsets of the damaged targets. The only exception is a single removed power transmission line sample, which is the only documented case available for the collapsed/removed power lines class, which was consequently retained in the test set. In Setting B, all real cases of intact, removed or damaged high-voltage power transmission towers were included in the test set. In the following, Class I denotes intact targets, whereas Class C denotes collapsed or removed ones.
Table 3.
Final dataset of targets (towers and power lines) for training, validation, and testing phases under two experimental settings, A and B.
Table 3 shows that Setting B increased the sample size with respect to Setting A, mainly by rebalancing the minority class, Class C. For this one, the training and validation samples increased by 172, from 28 in Setting A to 200 in Setting B, which is about seven times the initial value. In the test phase, an increase of 28 samples is observed, from 6 in Setting A to 34 in Setting B, which is about six times. Consequently, the physics-based SAR simulator employed in Setting B enabled training and validation of the two AI-based damage detection models on a more balanced and numerically adequate dataset, while preserving a larger test set composed entirely of real cases. This approach substantially improved the statistical robustness of the performance estimates and enhanced the reliability of comparative evaluation between SVM and MLP models.
For both experimental settings and for all implemented methodologies, the input to the two AI-based models consisted of radiometric feature vectors computed for each pre- and post-event pair of targets (high-voltage power transmission towers or power transmission lines). These feature vectors were organised within a six-dimensional space: (i) Pearson’s Correlation Coefficient (PCC), (ii) mean Structural Similarity Index Measure (SSIM), (iii) maximum SSIM, (iv) Pixel-Count Ratio (PCR), (v) Jaccard Similarity Coefficient (JSC), and (vi) Dice Similarity Coefficient (DSC). Each feature vector was associated with a binary classification label (Class I or Class C), which was available during training and validation but concealed during testing, where it was used only for performance assessment.
The inability of individual features to consistently discriminate between Class I and Class C justifies the multi-feature approach underpinning the SVM and MLP classification models. Figure 6 compares the mean values of the radiometric features computed over the full real-data dataset used by the SVM and MLP models, with variability reported as ±2σ. For high-voltage power transmission towers, the evidence suggests that a single feature may be insufficient to achieve robust separation between the Class I and Class C. For power transmission lines, the dispersion is more limited, and, in this experimental evidence, class separation appears clearer even at the level of individual features. However, this indication remains preliminary because the Class C for power lines is represented by only one real case of removed power transmission lines. Overall, this result supports the adoption of an integrated multi-feature approach in a higher-dimensional space to exploit the complementarity of radiometric features and improve class separability beyond what can be achieved through single-feature thresholding.
Figure 6.
Radiometric feature comparison for Class I and Class C of power towers (A) and power lines (B). Bars represent the mean value of each feature, with error bars indicating ±2 standard deviations (±2σ).
4.2. Model Configuration and Comparison of the Two Automatic AI-Based Models: Computational and Inference Performances
To ensure the reliability and comparability of results obtained with SVM and MLP models under both settings, a constant hardware and software configuration was maintained across all experimental trials: (1) SVM with Setting A, (2) SVM with Setting B, (3) MLP with Setting A, and (4) MLP with Setting B. All computational analyses were run on an x64 multicore platform with an Intel® Core™ Ultra 7 258V Central Processing Unit (CPU; Intel Corporation, Santa Clara, CA, USA; 2.20 GHz base frequency) and 32 GB of high-speed Random Access Memory (RAM).
Regarding the model configurations, the SVMs were implemented as non-linear RBF-kernel classifiers and were separately trained for Setting A and Setting B, yielding optimised box-constraint/kernel-scale values of 21.19/17.65 and 50.99/1.02, respectively. In both cases, predictors were standardised, and hyperparameters were optimised by Bayesian optimisation using 5-fold cross-validation and cross-validation loss as the objective criterion.
Concerning the MLP, a feedforward, fully connected neural network was adopted in both settings, with six input features, three hidden layers of 30 neurons each, Leaky ReLU hidden activations, and a two-class Softmax output layer. The network was trained using Adam optimisation and cross-entropy loss, with z-score input normalisation.
The computational performance of both automatic AI-based classifiers was evaluated separately during model development (training and validation) and during inference (testing) for both experimental settings. The MLP architecture showed convergence times between 12 and 23 s under Setting A and between 303 and 382 s under Setting B, whereas the SVM model required 90–427 s in Setting A and approximately 3.6 × 10³ to 7.2 × 10³ s in Setting B. The substantial time advantage exhibited by MLP architecture, which naturally increases with dataset size, is consistent with the different optimisation nature. As a matter of fact, MLP estimates weights iteratively via error backpropagation and gradient-based updates [81], whereas the kernel-based SVM requires solving a convex quadratic programming problem in its dual formulation, typically exhibiting a superlinear cost that depends on dataset size and on the number of support vectors [82].
During inference operations, both classifiers exhibit per-sample latencies on the order of tenths of a millisecond, which are operationally compatible with high-throughput operational scenarios. Specifically, the MLP model requires 0.212 ms per sample, corresponding to about 4.7 × 10³ samples per second of processing throughput, whereas the SVM requires 0.451 ms per sample, corresponding to about 2.2 × 10³ samples per second. This yields a computational speed advantage for the MLP model of slightly greater than 2×. Consequently, although both solutions demonstrate computational efficiency, the lower latency of the MLP architecture implies improved scalability as the number of SAR chips to be classified increases, thereby reducing the risk of bottlenecks within the operational processing chain. From the perspective of potential on-board satellite implementation, this computational advantage, combined with the greater technical maturity and wider availability of optimised neural-network implementations, establishes MLP as a particularly competitive candidate architecture, while still requiring dedicated assessments against the constraints of the target platform.
Regarding classification results, Figure 7 and Figure 8 report test confusion matrices for the SVM and MLP under both experimental settings, respectively. As described in Section 2.1, the ground-truth labels used for post-testing validation rely on the independently verified event database, built through the cross-validation of documentary evidence, including news reports, ground photographs, videos, drone footage, and very-high-resolution optical imagery when available. SVM architecture maintains a high OA (97.8% in Setting A and 97.0% in Setting B). Under Setting B, which is more statistically representative due to the enlarged real test set, it tends to favour classification toward the Class I in ambiguous cases, with five false negatives (misclassifying Collapsed targets as Intact ones) and demonstrating recall of 85.3% for the Class C. Using the same feature vectors, the MLP model demonstrates no observed misclassifications in testing, achieving OA of 100% under both settings, suggesting a more effective separation in the multi-feature space and greater robustness to the change in setting. From an on-board implementation perspective, it should be emphasised that false negatives do not constitute false alarms but rather represent missed damage detections, whereas false positives generate false alarms. Within a damage-detection operational context, both error categories can be critical, since false negatives prevent the triggering of further verification procedures, while false positives may prompt unnecessary field inspection operations, incurring operational costs and potential risks for field personnel, particularly under adverse meteorological conditions. Therefore, the combination of lower computational latency and the absence of observed classification errors makes the MLP model the more robust candidate for an automatic classification chain focused on reliability, while retaining the need for validation on larger and more diverse cases. Between the two settings, Setting B represents the preferable configuration because it enables testing on a more extensive real dataset and, by leveraging physics-guided SAR simulation, successfully addresses the inherent limited availability of real collapsed tower and power line cases while preserving the same accuracy performance.
Figure 7.
Confusion matrices for Support Vector Machine (SVM) architecture for the test dataset (real cases) under Setting A (training and validation on real power transmission towers) and Setting B (training and validation on simulated power transmission towers). Blue cells denote correct classifications, whereas orange cells denote incorrect ones (OA = Overall Accuracy).
Figure 8.
Confusion matrices for the Multi-Layer Perceptron (MLP) model for the test dataset (real cases) under Setting A and Setting B. Blue cells denote correct classifications. Blue cells denote correct classifications, whereas orange cells denote incorrect ones.
4.3. Application Example of Methodological Workflow on Real Cases
This subsection illustrates the operational functioning of the processing chain by following the methodological workflow that starts with procedural steps described in Figure 2 and culminating in the detection of potential structural damage to high-voltage power transmission towers and lines. Figure 9 and Figure 10 show the application of the MLP model trained on simulated data to a real case of a high-voltage power transmission line affected by an adverse event (Case 3, Stack 5), wherein target SAR chips are systematically extracted from the pre-event mean calibrated σ0 and the post-event σ0 derived from COSMO Stripmap acquisitions. At the scene scale, radiometric and geometric co-registration between the mean pre- and post-event SAR images enables direct comparison of target responses relative to surrounding clutter. Visual inspection reveals that towers and power lines appear as localised high-contrast scatterers in the pre-event scene, benefiting substantially from the temporal averaging of ten pre-event SAR acquisitions (Figure 9), whereas target recognition is more challenging in the post-event scene based on a single SAR image, where speckle noise effects are more pronounced (Figure 10). Moreover, in Figure 10, the classifier output visualisation highlights green bounding boxes for targets belonging to Class I and red ones for Class C. The zoomed perspective (Figure 11) confirms spatial consistency of classification results, with target 9 (bright spots of power transmission lines) and target 11 (power tower) correctly identified as structurally intact, and targets 8 and 10 (power towers) accurately detected as collapsed, consistent with documented field verification.
Figure 9.
Pre-event mean calibrated σ0 in SAR acquisition geometry (range/azimuth) for the monitored high-power transmission line, showing the locations (blue boxes) of the analysed targets (towers and power lines). Application case 3, Stack 5, COSMO-SkyMed, ascending orbit. (blue bounding boxes = monitored targets).
Figure 10.
Post-event calibrated σ0 for the same geographic area (Case 3, Stack 5, COSMO-SkyMed, ascending orbit), where bounding boxes show the MLP classification outcome (green bounding boxes = Class I, red ones = Class C).
Figure 11.
Zoomed view of Figure 8 and Figure 9 showing a comparison between mean SAR pre- (Left) and post-event (Right) images over an area with damaged power towers, with MLP classification output. Examples of targets (blue bounding boxes = monitored targets, Left) classified as Class I (green boxes of power transmission line no. 9 and power transmission tower no. 11, Right) and Class C (red boxes of power transmission towers no. 8 and no. 10, Right) are shown.
Figure 12, Figure 13, Figure 14 and Figure 15 provide representative examples of power transmission towers classified as Class I and Class C by the MLP model, displaying for each target, the pre-event mean calibrated σ0 SAR chip and the post-event calibrated σ0 SAR chip. Green marker points indicate bright pixels selected in the pre-event chip, forming a segmentation-derived mask used for computing mask-based radiometric features, PCR, DSC, and JSC. In the examples of power towers related to Class I, the radiometric signature of the tower is substantially preserved in the post-event chip, with consistently high correlation and structural similarity values (PCC and SSIM features) along with good consistency of the bright-pixel mask (PCR, DSC, JSC). Conversely, for Class C examples, marked reduction or substantial attenuation of the target radiometric response is observed in post-event chips, leading to reduced pre-to-post consistency and a concurrent decrease in all radiometric features. This empirical observation is physically consistent with the operational assumption that structural collapse induces a local radiometric discontinuity with respect to the pre-event scenario, whereas intact structural conditions preserve the persistence of dominant scatterers.
Figure 12.
Pre-event mean and post-event calibrated σ0 chips for an intact power transmission tower (green dots indicate the binary mask). Metrics: Pearson’s Correlation Coefficient (PCC) = 0.64; Structural Similarity Index Measure (SSIM) (avg) = 0.52; SSIM (max) = 0.80; Pixel-Count Ratio (PCR) = 0.75; Dice Similarity Coefficient (DSC) = 0.86; Jaccard Similarity Coefficient (JSC) = 0.75. Multi-Layer Perceptron (MLP) prediction: Class I.
Figure 13.
Pre- and post-event calibrated σ0 chips for a second intact power transmission tower (green dots indicate the binary mask). Metrics: PCC = 0.48; SSIM (avg) = 0.46; SSIM (max) = 0.73; PCR = 0.60; DSC = 0.75; JSC = 0.60. MLP prediction: Class I.
Figure 14.
Pre- and post-event calibrated σ0 chips for a collapsed power transmission tower (green dots indicate the binary mask). Metrics: PCC = 0.30; SSIM (avg) = 0.17; SSIM (max) = 0.53; PCR = 0.19; DSC = 0.32; JSC = 0.19. MLP prediction: Class C.
Figure 15.
Example of a collapsed or removed power transmission tower (green dots indicate the binary mask). Metrics: PCC = 0.14; SSIM (avg) = 0.03; SSIM (max) = 0.50; PCR = 0.19; DSC = 0.32; JSC = 0.19. MLP prediction: Class C.
Figure 16, Figure 17 and Figure 18 provide representative examples of pre- and post-event pairs for intact power lines (Figure 16 and Figure 17) and for the single available removed case (Figure 18). Consistent with empirical observations previously presented in Figure 5, for cases of Class I, the individual features demonstrate, on average, higher numerical values compared to power transmission towers, indicating enhanced radiometric and structural consistency of the power line response between the two SAR images. In the only available real example for Class C, a simultaneous substantial decrease is observed across all radiometric metrics, which is physically consistent with the disappearance of dominant scatterer elements and with the loss of spatial correspondence of pre-event bright pixels in the post-event SAR image. This radiometric behaviour may generally be more pronounced for power lines compared to towers, since even following structural collapse, some tower portions can remain within the post-event SAR chip, leading to less severe decorrelation. In contrast, for power transmission lines, the nature of the bright spots at the 3 m spatial resolution enables, in principle, analysis capabilities extending to individual scattering-element detection, with the potential to identify localised breaks affecting single conductors.
Figure 16.
Pre-event mean and post-event calibrated σ0 chips for an intact power transmission line (green dots indicate the binary mask of bright pixels selected in the pre-event chip). Metrics: PCC = 0.81; SSIM (avg) = 0.69; SSIM (max) = 0.85; PCR = 0.63; DSC = 0.78; JSC = 0.63. MLP prediction: Class I. Three different phase conductors are visible in both pre- and post-event chips.
Figure 17.
Intact power transmission line example (green dots indicate the binary mask of bright pixels selected in the pre-event chip). Metrics: PCC = 0.77; SSIM (avg) = 0.55; SSIM (max) = 0.89; PCR = 0.68; DSC = 0.81; JSC = 0.68. MLP prediction: Class I. Three different phase conductors are visible in both pre- and post-event chips.
Figure 18.
Real example of removed power transmission lines (green dots indicate the binary mask of bright pixels selected in the pre-event chip). Metrics: PCC = 0.10; SSIM (avg) = 0.10; SSIM (max) = 0.43; PCR = 0.05; DSC = 0.09; JSC = 0.05. MLP prediction: Class C. Three different phase conductors are visible in the pre-event chip.
Therefore, although a multi-feature approach remains essential to ensure operational robustness for both target categories, empirical evidence for power lines suggests that class separability tends to emerge discernibly even in a univariate feature analysis, whereas for power transmission towers it is predominantly multivariate. Consequently, a unified detection algorithm should systematically integrate multiple radiometric features to handle both target types consistently, benefiting from clearer discrimination margins for power lines while maintaining inherently multi-feature decision frameworks essential for power tower classification.
4.4. Operational Considerations and Roadmap Towards On-Board Processing
Following the promising classification performance results obtained with the MLP model trained on both real and simulated datasets, future development activities will address target observability constraints, spatial resolution requirements, and operational maturity considerations towards a potential SAR satellite on-board processing implementation.
First, it should be noted that not all targets (power transmission towers and power lines) are effectively monitorable. Several factors contribute to this limitation, including geometric distortions such as layover, foreshortening, and shadowing, land-cover conditions associated with low signal-to-clutter ratio, and the physical orientation of towers with respect to the satellite line of sight. In addition, for power transmission lines, a physical visibility constraint persists, intrinsically linked to the conductor span orientation relative to the satellite azimuth direction, requiring alignment within approximately ±10° angular tolerance. In this context, pre-event assessment of target visibility and monitorability is essential, together with the identification of power transmission lines that are detectable as bright spots, allowing prior screening of targets for reliable post-event monitoring. Therefore, the proposed framework is demonstrated to be a reliable damage-status classifier for targets previously identified as eligible for the damage detection analysis. In a future on-board scenario, the classifier could, in principle, be applied to the entire electric power network, including targets that do not satisfy the adopted radiometric visibility criterion. However, for these ineligible targets, the resulting classification should be considered outside the validated applicability domain of the proposed approach and should be flagged accordingly. This represents a well-recognised limitation in SAR-based tower analysis, where several factors can significantly affect target visibility and detection performance [83,84]. Future developments should address more challenging targets characterised by marginal SAR visibility, strong background clutter, or unfavourable acquisition geometries, with the aim of further generalising the model applicability.
The proposed methodological approach relies upon pre- and post-event change-detection analysis, with a temporally averaged pre-event reference that exploits the advantages offered by constellations such as COSMO and the ASI MapItaly systematic acquisition plan. To investigate target detectability under progressively degraded resolution, a qualitative analysis based on a high-resolution COSMO-SkyMed SAR image at 1 m spatial resolution of an intact power transmission tower was performed by applying increasingly strong downsampling to assess the impact of resolution loss (Figure 19). As expected, target recognisability degrades as downsampling increases. Therefore, results obtained from the COSMO images processed in this application suggest that a spatial resolution of approximately 3 m is close to the practical limit for preserving sufficient radiometric and geometric information on these targets. Conversely, at resolutions of about 1 m, information content and interpretability of structural elements increase markedly, generating positive effects on radiometric and geometric separability, thereby favouring single post-event image analytical approaches [85]. Therefore, for satellite missions operating at coarser resolutions up to 3 m, the operational necessity for a pre- and post-event approach becomes evident, preferably supported by temporally averaged pre-event reference baselines to mitigate speckle noise effects. However, this limit should not be regarded as a general threshold, as target recognisability may depend on several factors, such as tower geometry, orientation with respect to the SAR acquisition, local background clutter, and radiometric distortion phenomena. Future quantitative analyses on larger and more diverse datasets are required to define sensor- and scenario-dependent resolution requirements.
Figure 19.
Power transmission tower under progressive spatial resolution degradation. An intact power transmission tower chip from a 1 m high-resolution COSMO-SkyMed image is shown in the original (1) and after downsampling by a factor of (2) = 2 × 2, (3) = 3 × 3, (4) = 4 × 4, (5) = 5 × 5. The red marker indicates the tower base location.
The potential data scarcity constraint, which could have limited model training and validation, was mitigated through the development and application of the physics-guided SAR simulator for both intact and collapsed power towers, as reflected in the promising results for Setting B with the MLP model. Furthermore, since the AI-based classifier processes feature vector inputs rather than raw imagery, it would have been theoretically feasible to generate random radiometric feature vectors within plausible numerical ranges. However, the physics-guided SAR simulation approach was deliberately selected to preserve a physically grounded representation of the target response.
From an on-board perspective, several end-to-end processing chain aspects must be consolidated and validated, including on-board focusing of raw SAR data either through conventional processing applications or mission-tailored designs [86,87,88,89], on-board co-registration strategies, algorithm porting to SAR on-board hardware platforms, dedicated hardware implementation strategies, and downlink strategies [45,90]. Within this scenario, adoption of a SAR chip-based processing strategy supports on-board computational optimisation, as processing operations can be restricted to the targeted focusing, avoiding full-frame data handling computational requirements.
5. Conclusions
This study demonstrated the feasibility of automated damage-status classification for high-voltage power transmission towers and lines using paired pre-event and post-event SAR intensity chips and a physically interpretable six-dimensional radiometric feature set. Two AI-based classifiers (SVM and MLP) were evaluated and compared under two experimental settings, including a configuration that leverages physics-based SAR simulated tower chips to mitigate the scarcity of real samples labelled as collapsed. This aspect is particularly relevant for Class C cases, whose limited representation reflects the intrinsic rarity of documented and validated events, motivating the use of simulation-supported training strategies.
As a result, the MLP model achieved the best performance, showing no observed classification errors within the considered visibility-screened test set (Overall Accuracy = 100%), with lower inference latency than the SVM in the sub-millisecond range per target, whereas the SVM retained high accuracy (down to 97.0% in the more representative Setting B) but produced both false positives and false negatives. Such accuracy levels are a practical requirement for operational use, given the low frequency but high impact of hazardous events and the need for rapid, reliable prioritisation of field inspections. However, this result should be interpreted within the validated applicability domain of the study, namely, all the SAR-visible targets that satisfy the adopted radiometric pre-screening criterion.
Thus, operational applicability remains conditional on target visibility and, consequently, monitorability (acquisition geometry, clutter conditions) and, specifically for power lines, the ±10° azimuth-alignment constraint. To improve radiometric stability while preserving the native spatial resolution, the pre-event reference SAR image was computed by temporal averaging ten pre-event acquisitions, effectively emulating spatial despeckling through temporal multi-looking. From a qualitative perspective, the transferability of the trained model mainly depends on whether the considered SAR sensor provides feature distributions comparable to those derived from COSMO data. This requires a persistent and distinguishable radiometric signature of the target in the pre-event acquisitions and a detectable radiometric modification after the event. Therefore, model transferability is expected to be feasible for SAR sensors with characteristics comparable to those of COSMO, such as metre-class X-band systems including TSX and PAZ. For lower-resolution sensors, towers and power lines may not be sufficiently resolved due to the target size relative to the SAR spatial resolution; therefore, such targets may not pass the preliminary visibility screening. Conversely, very-high-resolution SAR data enables different analytical strategies, not only by improving the radiometric and geometric separability of the target but also by allowing recognition of individual structural elements of power transmission networks, thereby making feasible single post-event SAR image approaches.
Future work might prioritise validation on broader and more diverse real-world datasets, including additional documented Class C cases and quantitative cross-sensor analyses to assess model transferability. Further activities should also investigate how the number and temporal spacing of pre-event acquisitions affect feature variability and classification robustness, as well as the design of the end-to-end on-board chain (focusing, co-registration, porting, and downlink), and systematic screening tools to pre-assess target visibility, thereby supporting near-real-time SAR chip-based on-board implementation.
Author Contributions
Conceptualization: R.N., A.P., A.M., D.O.N. and K.T.; Methodology: R.N., A.M., D.O.N., K.T. and M.D.N.; Software: R.N., A.P., A.M., D.O.N., K.T., M.D.N. and C.G.; Validation: R.N., A.P., A.M., D.O.N., K.T., M.D.N. and C.G.; Data procurement: A.P., F.C., E.S., G.P. and M.V.; Writing—original draft preparation: R.N., A.P., A.M., M.D.N. and C.G.; Writing—review and editing, R.N., A.P., A.M., D.O.N., K.T., F.C., M.D.N., E.S., A.B., G.M., G.P., M.V. and C.G.; Project administration and Management, F.C., E.S., A.B., G.M., G.P. and M.V. All authors have read and agreed to the published version of the manuscript.
Funding
This research was conducted within the framework of the TOWER-CHECK project “TOWER-CHECK: Monitoraggio real-time di tralicci con tecniche di IA a bordo di piattaforme satellitari SAR” (TOWER-CHECK: real-time monitoring of towers with SAR satellite on-board AI techniques). The project was co-managed and financed by ASI in the frame of the Contract No. 2023-5-E.0—Subco N. P22S2240-15-v0, Codice Unico di Progetto (CUP) F93D23000200001. The project was carried out using COSMO-SkyMed Products © of the Italian Space Agency (ASI), delivered under a licence to use by ASI.
Data Availability Statement
The data used in the present study have been generated and collected within the framework of the “TOWER-CHECK” project, and they are available upon request.
Acknowledgments
During the preparation of this manuscript, the authors used ChatGPT, GPT-5.2, for the purposes of language editing. The authors have reviewed and edited the output and take full responsibility for the content of this publication.
Conflicts of Interest
Authors Raffaele Nutricato, Alessandro Parisi, Alberto Morea, Davide Oscar Nitti, Khalid Tijani, Mirko Di Noia and Filomena Ciola were employed by the company Geophysical Applications Processing (GAP) Srl. Author Enrico Sain was employed by the company Planetek Italia. The remaining authors declare that the research was conducted in the absence of any commercial or financial relationships that could be construed as a potential conflict of interest.
Abbreviations
The following abbreviations are used in this manuscript:
| AI | Artificial Intelligence |
| ALS | Airborne Laser Scanning |
| ASI | Agenzia Spaziale Italiana (Italian Space Agency) |
| CNN | Convolutional Neural Network |
| COSMO | COSMO-SkyMed (Constellation of Small Satellites for Mediterranean basin Observation) |
| CPU | Central Processing Unit |
| CSG | COSMO-SkyMed Second Generation |
| CSK | COSMO-SkyMed First Generation |
| DEM | Digital Elevation Model |
| DSC | Dice Similarity Coefficient |
| HH | Horizontal–Horizontal (co-polarisation) |
| JSC | Jaccard Similarity Coefficient |
| MLP | Multi-Layer Perceptron |
| MT-InSAR | Multi-Temporal Interferometric Synthetic Aperture Radar |
| NCNN | Non-Convolutional Neural Network |
| PCC | Pearson’s Correlation Coefficient |
| PCR | Pixel-Count Ratio |
| RAM | Random Access Memory |
| RBF | Radial Basis Function |
| SAR | Synthetic Aperture Radar |
| SPINUA © | Stable Point Interferometry even over Unurbanized Areas |
| SSIM | Structural Similarity Index Measure |
| SVM | Support Vector Machine |
| TSX | TerraSAR-X |
| UAV | Unmanned Aerial Vehicle |
| VV | Vertical–Vertical (co-polarisation) |
References
- Amin, M. Toward Secure and Resilient Interdependent Infrastructures. J. Infrastruct. Syst. 2002, 8, 67–75. [Google Scholar] [CrossRef] [Scilit]
- Stankovski, A.; Gjorgiev, B.; Locher, L.; Sansavini, G. Power Blackouts in Europe: Analyses, Key Insights, and Recommendations from Empirical Evidence. Joule 2023, 7, 2468–2484. [Google Scholar] [CrossRef] [Scilit]
- Castillo, A. Risk Analysis and Management in Power Outage and Restoration: A Literature Survey. Electr. Power Syst. Res. 2014, 107, 9–15. [Google Scholar] [CrossRef] [Scilit]
- Pescaroli, G.; Alexander, D. Understanding Compound, Interconnected, Interacting, and Cascading Risks: A Holistic Framework. Risk Anal. 2018, 38, 2245–2257. [Google Scholar] [CrossRef] [Scilit]
- Alexander, D.; Pescaroli, G. What Are Cascading Disasters? UCL Open Environ. 2019, 1, e003. [Google Scholar] [CrossRef] [Scilit]
- Chen, C.; Bie, Z. Situational Awareness for Resilient Power Systems. In Power Grid Resilience; Springer: Cham, Switzerland, 2025; pp. 17–45. [Google Scholar]
- Shuai, M.; Chengzhi, W.; Shiwen, Y.; Hao, G.; Jufang, Y.; Hui, H. Review on Economic Loss Assessment of Power Outages. Procedia Comput. Sci. 2018, 130, 1158–1163. [Google Scholar] [CrossRef] [Scilit]
- Panteli, M.; Mancarella, P. Influence of Extreme Weather and Climate Change on the Resilience of Power Systems: Impacts and Possible Mitigation Strategies. Electr. Power Syst. Res. 2015, 127, 259–270. [Google Scholar] [CrossRef] [Scilit]
- Schweikert, A.; Nield, L.; Otto, E.; Deinert, M. Resilience and Critical Power System Infrastructure; World Bank: Washington, DC, USA, 2019. [Google Scholar]
- Karaman, B.; Basturk, I.; Taskin, S.; Zeydan, E.; Kara, F.; Beyazit, E.A.; Camelo, M.; Björnson, E.; Yanikomeroglu, H. Solutions for Sustainable and Resilient Communication Infrastructure in Disaster Relief and Management Scenarios. IEEE Commun. Surv. Tutor. 2025, 28, 716–760. [Google Scholar] [CrossRef] [Scilit]
- Gkika, A.V.; Zacharis, E.A.; Skikos, D.N.; Lekkas, E.L. Battling the Extreme: Lessons Learned from Weather-Induced Disasters on Electricity Distribution Networks and Climate Change Adaptation Strategies. Hydrol. Res. 2023, 54, 1196–1226. [Google Scholar] [CrossRef] [Scilit]
- Sriram, A.; Sudhakar, T.D. Technology Revolution in the Inspection of Power Transmission Lines—A Literature Review. In Proceedings of the 2021 7th International Conference on Electrical Energy Systems (ICEES), Chennai, India, 11–13 February 2021; pp. 256–262. [Google Scholar]
- Ahmed, F.; Mohanta, J.C.; Keshari, A. Power Transmission Line Inspections: Methods, Challenges, Current Status and Usage of Unmanned Aerial Systems. J. Intell. Robot. Syst. Theory Appl. 2024, 110, 54. [Google Scholar] [CrossRef] [Scilit]
- Matikainen, L.; Lehtomäki, M.; Ahokas, E.; Hyyppä, J.; Karjalainen, M.; Jaakkola, A.; Kukko, A.; Heinonen, T. Remote Sensing Methods for Power Line Corridor Surveys. ISPRS J. Photogramm. Remote Sens. 2016, 119, 10–31. [Google Scholar] [CrossRef] [Scilit]
- Nguyen, V.N.; Jenssen, R.; Roverso, D. Intelligent Monitoring and Inspection of Power Line Components Powered by UAVs and Deep Learning. IEEE Power Energy Technol. Syst. J. 2019, 6, 11–21. [Google Scholar] [CrossRef] [Scilit]
- Yang, L.; Fan, J.; Liu, Y.; Li, E.; Peng, J.; Liang, Z. A Review on State-of-the-Art Power Line Inspection Techniques. IEEE Trans. Instrum. Meas. 2020, 69, 9350–9365. [Google Scholar] [CrossRef] [Scilit]
- Jalil, B.; Leone, G.R.; Martinelli, M.; Moroni, D.; Pascali, M.A.; Berton, A. Fault Detection in Power Equipment via an Unmanned Aerial System Using Multi Modal Data. Sensors 2019, 19, 3014. [Google Scholar] [CrossRef] [Scilit]
- Huanyu, C.; Yingcheng, G.; Mengting, X.; Qiuyuan, Z.; Liu, W. A Few-Shot Collapsed Transmission Tower Detection Method Combining Large and Small Models in Remote Sensing Image. IEEE Access 2025, 13, 41670–41681. [Google Scholar] [CrossRef] [Scilit]
- Essen, H.; Boehmsdorff, S.; Biegel, G.; Wahlen, A. On the Scattering Mechanism of Power Lines at Millimeter-Waves. IEEE Trans. Geosci. Remote Sens. 2002, 40, 1895–1903. [Google Scholar] [CrossRef]
- Yan, L.; Ailing, H.; Sha, L.; Xingkai, L.; Wenhao, W.; Tao, L. High Voltage Power Line Scattering Feature Analysis in Multi SAR Sensors and Dual Polarization. In Proceedings of the 2012 Second International Workshop on Earth Observation and Remote Sensing Applications, Shanghai, China, 8–11 June 2012; pp. 225–229. [Google Scholar]
- Sha, L.; Tao, L.; Mingzhou, W.; Ailing, H.; Wenhao, W.; Kan, X.; Yan, L. Study on Extra-High Voltage Power Line Scatterers in Time Series SAR. In Proceedings of the 2014 Third International Workshop on Earth Observation and Remote Sensing Applications (EORSA), Changsha, China, 11–14 June 2014; pp. 47–51. [Google Scholar]
- Schwarz, G.; Soccorsi, M.; Chaabouni-Chouayakh, H.; Espinoza-Molina, D.; Cerra, D.; Rodriguez-Gonzales, F.; Datcu, M. Automated Information Extraction from High Resolution SAR Images: TerraSAR-X Image Interpretation Applications. In Proceedings of the IGARSS 2009; IEEE: Cape Town, South Africa, 2009; pp. 667–680. [Google Scholar]
- Sarabandi, K.; Pierce, L.; Oh, Y.; Ulaby, F.T. Power Lines: Radar Measurements and Detection Algorithm for Polarimetric SAR Images. IEEE Trans. Aerosp. Electron. Syst. 1994, 30, 632–643. [Google Scholar] [CrossRef] [Scilit]
- Sarabandi, K.; Park, M. Extraction of Power Line Maps from Millimeter-Wave Polarimetric SAR Images. IEEE Trans. Antennas Propag. 2000, 48, 1802–1809. [Google Scholar] [CrossRef] [Scilit]
- Shi, S.; Ailing, H.; Yan, L.; Cheng, L.; Chen, Z. Scattering Characteristics of Ultra-High-Voltage Power Lines in Spaceborne Sar Images. Prog. Electromagn. Res. M 2021, 102, 13–26. [Google Scholar] [CrossRef] [Scilit]
- Shi, S.; Wang, S.; Li, T.; Liu, Y.; Sun, H. Numerical Simulation of the Radar Cross Section of UHV/EHV Power Lines Illuminated by X-, C-, L-, and P-Band Spaceborne SAR. IEEE Trans. Geosci. Remote Sens. 2023, 61, 2002514. [Google Scholar] [CrossRef] [Scilit]
- Covello, F.; Battazza, F.; Coletta, A.; Lopinto, E.; Fiorentino, C.; Pietranera, L.; Valentini, G.; Zoffoli, S. COSMO-SkyMed an Existing Opportunity for Observing the Earth. J. Geodyn. 2010, 49, 171–180. [Google Scholar] [CrossRef] [Scilit]
- Werninghaus, R.; Buckreuss, S. The TerraSAR-X Mission and System Design. IEEE Trans. Geosci. Remote Sens. 2010, 48, 606–614. [Google Scholar] [CrossRef] [Scilit]
- D’Errico, M. Evolution of Spaceborne SAR Missions in Earth Orbit. Remote Sens. 2025, 17, 3773. [Google Scholar] [CrossRef] [Scilit]
- Berger, M.; Moreno, J.; Johannessen, J.A.; Levelt, P.F.; Hanssen, R.F. ESA’s Sentinel Missions in Support of Earth System Science. Remote Sens. Environ. 2012, 120, 84–90. [Google Scholar] [CrossRef] [Scilit]
- Tarighat, F.; Foroughnia, F.; Perissin, D. Monitoring of Power Towers’ Movement Using Persistent Scatterer SAR Interferometry in South West of Tehran. Remote Sens. 2021, 13, 407. [Google Scholar] [CrossRef] [Scilit]
- Zhang, K.; Zhang, N.; Shi, C.; Lu, Q.; Zheng, X.; Cao, Y.; Zhang, X.; Yang, J. YOLOv9-GDV: A Power Pylon Detection Model for Remote Sensing Images. Remote Sens. 2025, 17, 2229. [Google Scholar] [CrossRef] [Scilit]
- Gens, R.; van Genderen, J.L. Review Article SAR Interferometry—Issues, Techniques, Applications. Int. J. Remote Sens. 1996, 17, 1803–1835. [Google Scholar] [CrossRef] [Scilit]
- Cheng, G.; Huang, Y.; Li, X.; Lyu, S.; Xu, Z.; Zhao, H.; Zhao, Q.; Xiang, S. Change Detection Methods for Remote Sensing in the Last Decade: A Comprehensive Review. Remote Sens. 2024, 16, 2355. [Google Scholar] [CrossRef] [Scilit]
- Bazi, Y.; Bruzzone, L.; Melgani, F. An Unsupervised Approach Based on the Generalized Gaussian Model to Automatic Change Detection in Multitemporal SAR Images. IEEE Trans. Geosci. Remote Sens. 2005, 43, 874–886. [Google Scholar] [CrossRef] [Scilit]
- Inglacla, J.; Mercier, G. A New Statistical Similarity Measure for Change Detection in Multitemporal SAR Images and Its Extension to Multiscale Change Analysis. IEEE Trans. Geosci. Remote Sens. 2007, 45, 1432–1445. [Google Scholar] [CrossRef] [Scilit]
- Gong, M.; Zhao, J.; Liu, J.; Miao, Q.; Jiao, L. Change Detection in Synthetic Aperture Radar Images Based on Deep Neural Networks. IEEE Trans. Neural Netw. Learn. Syst. 2016, 27, 125–138. [Google Scholar] [CrossRef] [Scilit]
- Kang, M.; Baek, J. SAR Image Change Detection via Multiple-Window Processing with Structural Similarity. Sensors 2021, 21, 6645. [Google Scholar] [CrossRef] [Scilit]
- Calabrese, D.; Croce, A.; Spera, G.; Venturini, R.; De Luca, G.F.; Serva, S. COSMO SG, System Overview and Performance. In Proceedings of the EUSAR 2014—10th European Conference on Synthetic Aperture Radar, Berlin, Germany, 3–5 June 2014; pp. 1–4. [Google Scholar]
- Caltagirone, F.; Capuzi, A.; Coletta, A.; De Luca, G.F.; Scorzafava, E.; Leonardi, R.; Rivola, S.; Fagioli, S.; Angino, G.; Labbate, M.; et al. The COSMO-SkyMed Dual Use Earth Observation Program: Development, Qualification, and Results of the Commissioning of the Overall Constellation. IEEE J. Sel. Top. Appl. Earth Obs. Remote Sens. 2014, 7, 2754–2762. [Google Scholar] [CrossRef] [Scilit]
- Virelli, M.; Coletta, A.; Battagliere, M.L. ASI COSMO-SkyMed: Mission Overview and Data Exploitation. IEEE Geosci. Remote Sens. Mag. 2014, 2, 64–66. [Google Scholar] [CrossRef] [Scilit]
- Romano, D.; Mele, V.; Lapegna, M. The Challenge of Onboard SAR Processing: A GPU Opportunity. In Proceedings of the Computational Science—ICCS 2020; Krzhizhanovskaya, V.V., Závodszky, G., Lees, M.H., Dongarra, J.J., Sloot, P.M.A., Brissos, S., Teixeira, J., Eds.; Springer International Publishing: Cham, Switzerland, 2020; pp. 46–59. [Google Scholar]
- Breit, H.; Wiehle, S.; Mandapati, S.R.; Günzel, D.; Balss, U. Demonstrating a SAR Satellite Onboard Processing Chain. In Proceedings of the ESA Advanced RF Sensors and Remote Sensing Instruments (ARSI) and ESA Ka-Band Earth Observation Radar Missions (KEO), Noordwijk, The Netherlands, 10–12 May 2022. [Google Scholar]
- Cascelli, G.; Guaragnella, C.; Nutricato, R.; Tijani, K.; Morea, A.; Ricciardi, N.; Nitti, D.O. Use of a Residual Neural Network to Demonstrate Feasibility of Ship Detection Based on Synthetic Aperture Radar Raw Data. Technologies 2023, 11, 178. [Google Scholar] [CrossRef] [Scilit]
- García, L.P.; Furano, G.; Ghiglione, M.; Zancan, V.; Imbembo, E.; Ilioudis, C.; Clemente, C.; Trucco, P. Advancements in Onboard Processing of Synthetic Aperture Radar (SAR) Data: Enhancing Efficiency and Real-Time Capabilities. IEEE J. Sel. Top. Appl. Earth Obs. Remote Sens. 2024, 17, 16625–16645. [Google Scholar] [CrossRef] [Scilit]
- Google Earth Pro. Available online: https://earth.google.com/web/# (accessed on 27 February 2026).
- Davolio, S.; Fera, S.D.; Laviola, S.; Miglietta, M.M.; Levizzani, V. Heavy Precipitation over Italy from the Mediterranean Storm “Vaia” in October 2018: Assessing the Role of an Atmospheric River. Mon. Weather Rev. 2020, 148, 3571–3588. [Google Scholar] [CrossRef] [Scilit]
- VAIA Storm. Available online: https://www.guidedolomiti.com/varie/tempesta-vaia/# (accessed on 27 February 2026).
- Localteam-Video-Dolomiti-Disastro. Available online: https://www.localteam.it/video/dolomiti-nel-cuore-del-disastro-edifici-sommersi-dal-fango# (accessed on 15 May 2026).
- Localteam-Video-Tralicci-Abbattuti. Available online: https://www.localteam.it/video/tralicci-abbattuti-dal-vento-sottoguda-gravi-danni# (accessed on 15 May 2026).
- Youtube-E-distribuzione-Emergenza-Triveneto. Available online: https://www.youtube.com/watch?v=940HwYpelf0# (accessed on 15 May 2026).
- Localteam-Video-Veneto-Tralicci-Piegati-Tempesta. Available online: https://www.localteam.it/video/veneto-grandi-tralicci-piegati-la-violenza-della-tempesta# (accessed on 15 May 2026).
- Youtube-Localteam-Disastro-Dolomiti. Available online: https://www.youtube.com/watch?v=BZico44EaNU# (accessed on 15 May 2026).
- Youtube-Localteam-Rocca-Pietore-Disastro. Available online: https://www.youtube.com/watch?v=Ec-KEPFtTz8# (accessed on 15 May 2026).
- Bari Collapse. Available online: https://www.trmtv.it/cronaca/2022_10_29/350336.html# (accessed on 27 February 2026).
- Bari Collapse. Available online: https://www.baritoday.it/cronaca/traliccio-caduto-alta-tensione-carbonara.html# (accessed on 27 February 2026).
- De Martin, F.; Pavan, F.; Carlon, N.; Cioni, G.; Rozoff, C.; Poli, V.; Carpentari, S.; Miglietta, M.M. A Significant Tornado Event near a Dryline Bulge in Northern Italy. Weather Forecast. 2025, 40, 2293–2315. [Google Scholar] [CrossRef] [Scilit]
- Alfonsine Tornado. Available online: https://www.ravennatoday.it/cronaca/maltempo-meteo-oggi-22-luglio2023-alfonsine-bagnacavallo-ravenna.html# (accessed on 27 February 2026).
- Youtube-Localteam-Maltempo-Ravenna-Tralicci-Accartocciati. Available online: https://www.youtube.com/watch?v=QLSE2O60C_A# (accessed on 15 May 2026).
- Youtube-Localteam-Maltempo-Ravennate-Traliccio-Accartocciato-Voltana. Available online: https://www.youtube.com/watch?v=6DA-t6nOpTc# (accessed on 15 May 2026).
- Nitti, D.O.; Hanssen, R.F.; Refice, A.; Bovenga, F.; Nutricato, R. Impact of DEM-Assisted Coregistration on High-Resolution SAR Interferometry. IEEE Trans. Geosci. Remote Sens. 2011, 49, 1127–1143. [Google Scholar] [CrossRef] [Scilit]
- Bovenga, F.; Refice, A.; Guerriero, L.; Bovenga, F.; Nutricato, R.; Refice, A.; Guerriero, L.; Chiaradia, M.T. SPINUA: A Flexible Processing Chain for ERS/ENVISAT Long Term Interferometry. In Proceedings of the ESA-ENVISAT Symposium 2004, Salzburg, Austria, 6–10 September 2004. [Google Scholar]
- Bovenga, F.; Refice, A.; Nutricato, R.; Pasquariello, G.; De Carolis, G. Automated Calibration of Multi-Temporal ERS SAR Data. In Proceedings of the IEEE International Geoscience and Remote Sensing Symposium, Kuala Lumpur, Malaysia, 17–22 July 2022; Volume 6, pp. 3655–3657. [Google Scholar]
- Pearson, K., VII. Note on Regression and Inheritance in the Case of Two Parents. Proc. R. Soc. Lond. 1895, 58, 240–242. [Google Scholar] [CrossRef] [Scilit]
- Wang, Z.; Bovik, A.C.; Sheikh, H.R.; Simoncelli, E.P. Image Quality Assessment: From Error Visibility to Structural Similarity. IEEE Trans. Image Process. 2004, 13, 600–612. [Google Scholar] [CrossRef] [Scilit]
- Otsu, N. A Threshold Selection Method from Gray-Level Histograms. IEEE Trans. Syst. Man Cybern. 1979, 9, 62–66. [Google Scholar] [CrossRef] [Scilit]
- Dice, L.R. Measures of the Amount of Ecologic Association Between Species. Ecology 1945, 26, 297–302. [Google Scholar] [CrossRef] [Scilit]
- Sørensen, T.A. A Method of Establishing Group of Equal Amplitude in Plant Sociobiology Based on Similarity of Species Content and Its Application to Analyses of the Vegetation on Danish Commons. K. Dan. Vidensk. Selsk. Biol. Skr. 1948, 5, 1–34. [Google Scholar]
- Jaccard, P. The Distribution of the Flora in the Alpine Zone. New Phytol. 1912, 11, 37–50. [Google Scholar] [CrossRef] [Scilit]
- Taha, A.A.; Hanbury, A. Metrics for Evaluating 3D Medical Image Segmentation: Analysis, Selection, and Tool. BMC Med. Imaging 2015, 15, 29. [Google Scholar] [CrossRef] [Scilit]
- Liu, Z.; Lin, Y.; Cao, Y.; Hu, H.; Wei, Y.; Zhang, Z.; Lin, S.; Guo, B. Swin Transformer: Hierarchical Vision Transformer Using Shifted Windows. In Proceedings of the IEEE/CVF International Conference on Computer Vision (ICCV); IEEE: Montreal, QC, Canada, 2021; pp. 9992–10012. [Google Scholar]
- Dai, J.; Qi, H.; Xiong, Y.; Li, Y.; Zhang, G.; Hu, H.; Wei, Y. Deformable Convolutional Networks. In Proceedings of the IEEE International Conference on Computer Vision, Venice, Italy, 22–29 October 2017; pp. 764–773. [Google Scholar]
- Su, S.; Cui, Z.; Guo, W.; Zhang, Z.; Yu, W. Explainable Analysis of Deep Learning Methods for Sar Image Classification. In Proceedings of the IGARSS 2022—2022 IEEE International Geoscience and Remote Sensing Symposium, Kuala Lumpur, Malaysia, 17–22 July 2022; pp. 2570–2573. [Google Scholar]
- Riedmiller, M. Advanced Supervised Learning in Multi-Layer Perceptrons—From Backpropagation to Adaptive Learning Algorithms. Comput. Stand. Interfaces 1994, 16, 265–278. [Google Scholar] [CrossRef] [Scilit]
- Sharifzadeh, F.; Akbarizadeh, G.; Seifi Kavian, Y. Ship Classification in SAR Images Using a New Hybrid CNN–MLP Classifier. J. Indian Soc. Remote Sens. 2019, 47, 551–562. [Google Scholar] [CrossRef] [Scilit]
- Zhao, Q.; Principe, J.C. Support Vector Machines for SAR Automatic Target Recognition. IEEE Trans. Aerosp. Electron. Syst. 2001, 37, 643–654. [Google Scholar] [CrossRef] [Scilit]
- Anagnostopoulos, G.C. SVM-Based Target Recognition from Synthetic Aperture Radar Images Using Target Region Outline Descriptors. Nonlinear Anal. Theory Methods Appl. 2009, 71, e2934–e2939. [Google Scholar] [CrossRef] [Scilit]
- El-Darymli, K.; Gill, E.W.; Mcguire, P.; Power, D.; Moloney, C. Automatic Target Recognition in Synthetic Aperture Radar Imagery: A State-of-the-Art Review. IEEE Access 2016, 4, 6014–6058. [Google Scholar] [CrossRef] [Scilit]
- Tian, L.; Zeng, Z.; Chang, Z.; Zhang, S. Radar Signal Recognition Method Based on SVM Model. In Proceedings of the Third International Conference on Computer Science and Communication Technology (ICCSCT 2022); Lu, Y., Cheng, C., Eds.; SPIE: Beijing, China, 2022; Volume 12506, p. 125062K. [Google Scholar]
- Mountrakis, G.; Im, J.; Ogole, C. Support Vector Machines in Remote Sensing: A Review. ISPRS J. Photogramm. Remote Sens. 2011, 66, 247–259. [Google Scholar] [CrossRef] [Scilit]
- Gardner, M.W.; Dorling, S.R. Artificial Neural Networks (the Multilayer Perceptron)—A Review of Applications in the Atmospheric Sciences. Atmos. Environ. 1998, 32, 2627–2636. [Google Scholar] [CrossRef] [Scilit]
- Cortes, C.; Vapnik, V.; Saitta, L. Support-Vector Networks Editor; Kluwer Academic Publishers: Dordrecht, The Netherlands, 1995; Volume 20. [Google Scholar]
- Li, J.; Li, Y.; Jiang, H.; Zhao, Q. Hierarchical Transmission Tower Detection from High-Resolution SAR Image. Remote Sens. 2022, 14, 625. [Google Scholar] [CrossRef] [Scilit]
- Wu, B.; Wang, H.; Chen, J. Feature Enhancement Using Multi-Baseline SAR Interferometry-Correlated Synthesis Images for Power Transmission Tower Detection in Mountain Layover Area. Remote Sens. 2023, 15, 3823. [Google Scholar] [CrossRef] [Scilit]
- Massimi, V.; Montescarchio, E.; Sposito, A.; Viola, S.; Forteleoni, M.; Samarelli, S.; Nutricato, R.; Nitti, D.O. Innovativa Metodologia di Rilevamento di Strutture Deformate o Danneggiate Basata Sull’uso di Singole Immagini SAR [Innovative Methodology for Detecting Deformed or Damaged Structures Based on the Use of Single SAR Images]. Italian Patent 102021000029729, 26 January 2024. UIBM Patent Database. Available online: https://www.uibm.gov.it/bancadati/ (accessed on 8 June 2026).
- Cafforio, C.; Prati, C.; Rocca, F. SAR Data Focusing Using Seismic Migration Techniques. IEEE Trans. Aerosp. Electron. Syst. 1991, 27, 194–207. [Google Scholar] [CrossRef] [Scilit]
- Bamler, R. A Comparison of Range-Doppler and Wavenumber Domain SAR Focusing Algorithms. IEEE Trans. Geosci. Remote Sens. 1992, 30, 706–713. [Google Scholar] [CrossRef] [Scilit]
- Amein, A.S.; Soraghan, J.J. Fractional Chirp Scaling Algorithm: Mathematical Model. IEEE Trans. Signal Process. 2007, 55, 4162–4172. [Google Scholar] [CrossRef] [Scilit]
- Guaragnella, C.; D’Orazio, T. A Data-Driven Approach to SAR Data-Focusing. Sensors 2019, 19, 1649. [Google Scholar] [CrossRef] [Scilit]
- Kerr, M.; Tonetti, S.; Carnara, S.; Bravo, J.I.; Hinz, R.; Latorre, A.; Membibre, F.; Ramos, A.; Wiehle, S.; Koudelka, O.; et al. EO-Alert: A Satellite Architecture for Detection and Monitoring of Extreme Events in Real Time. In Proceedings of the 2021 IEEE International Geoscience and Remote Sensing Symposium IGARSS, Brussels, Belgium, 11–16 July 2021; pp. 168–171. [Google Scholar]
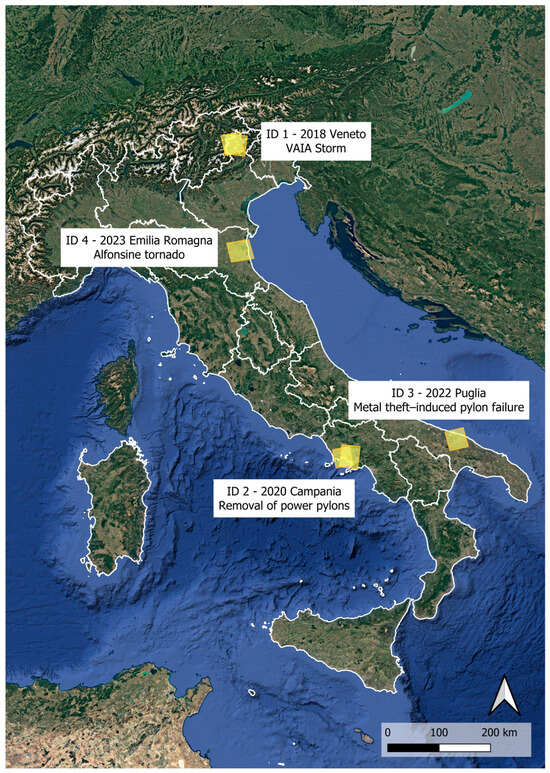
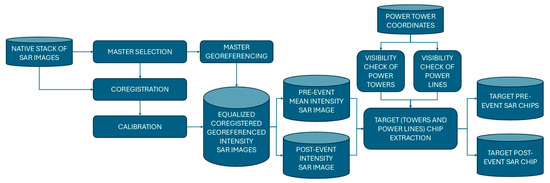
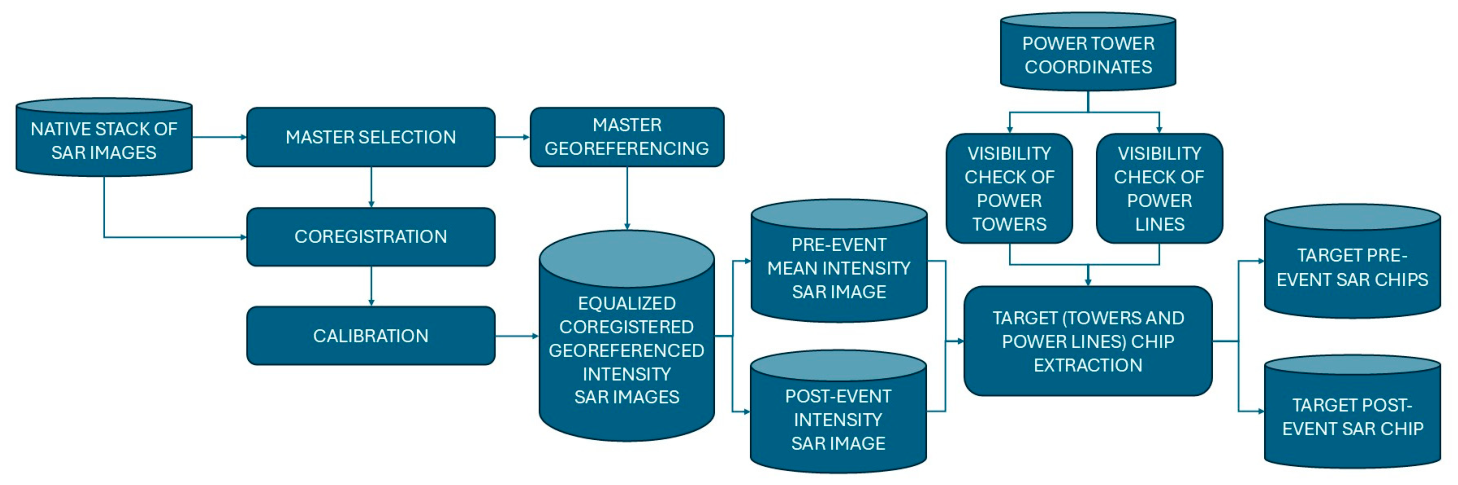
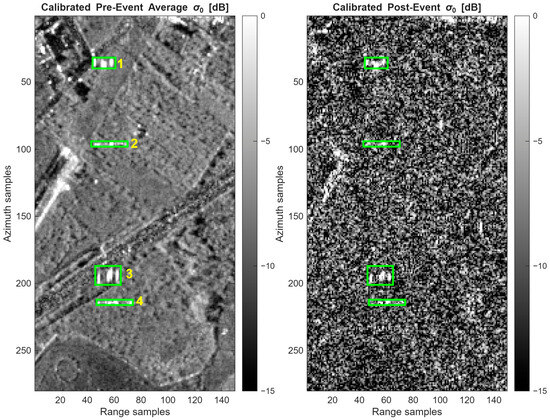
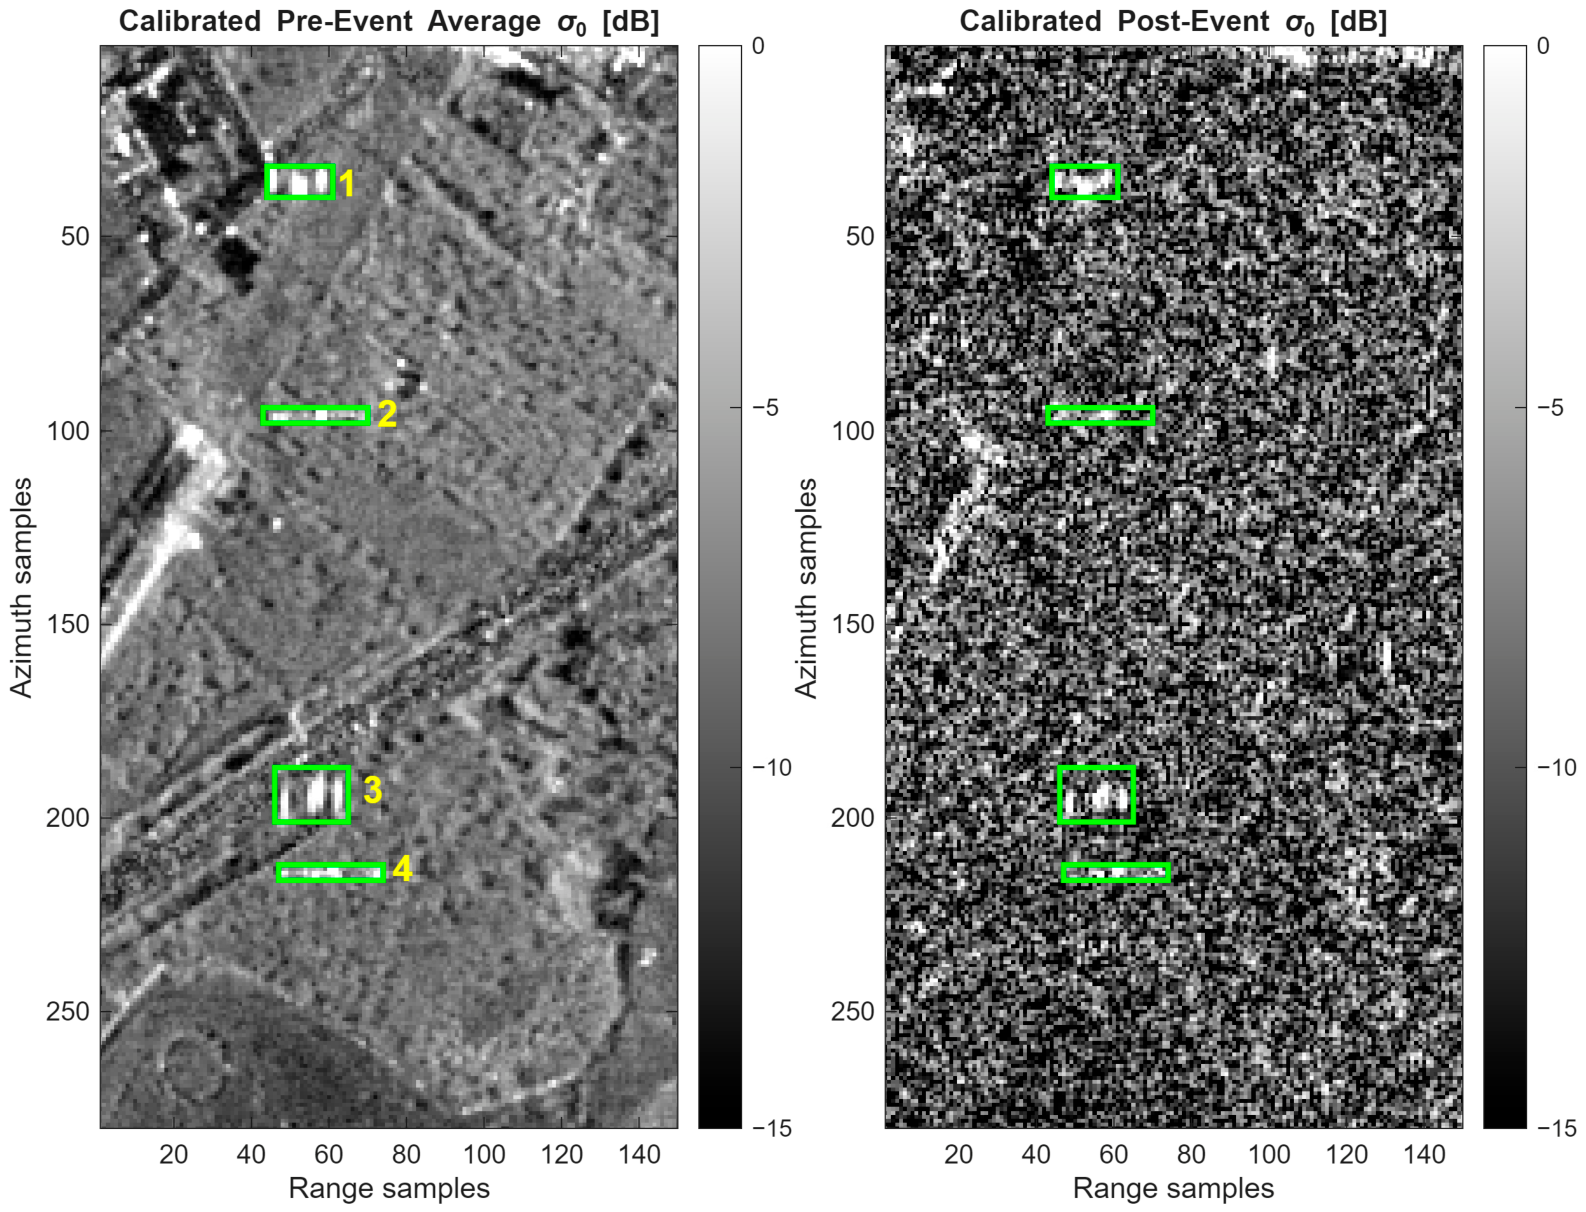
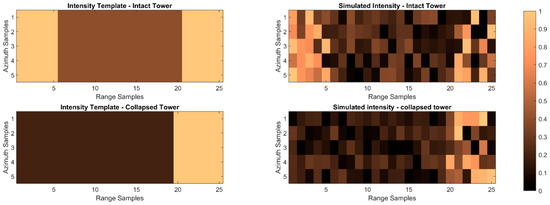
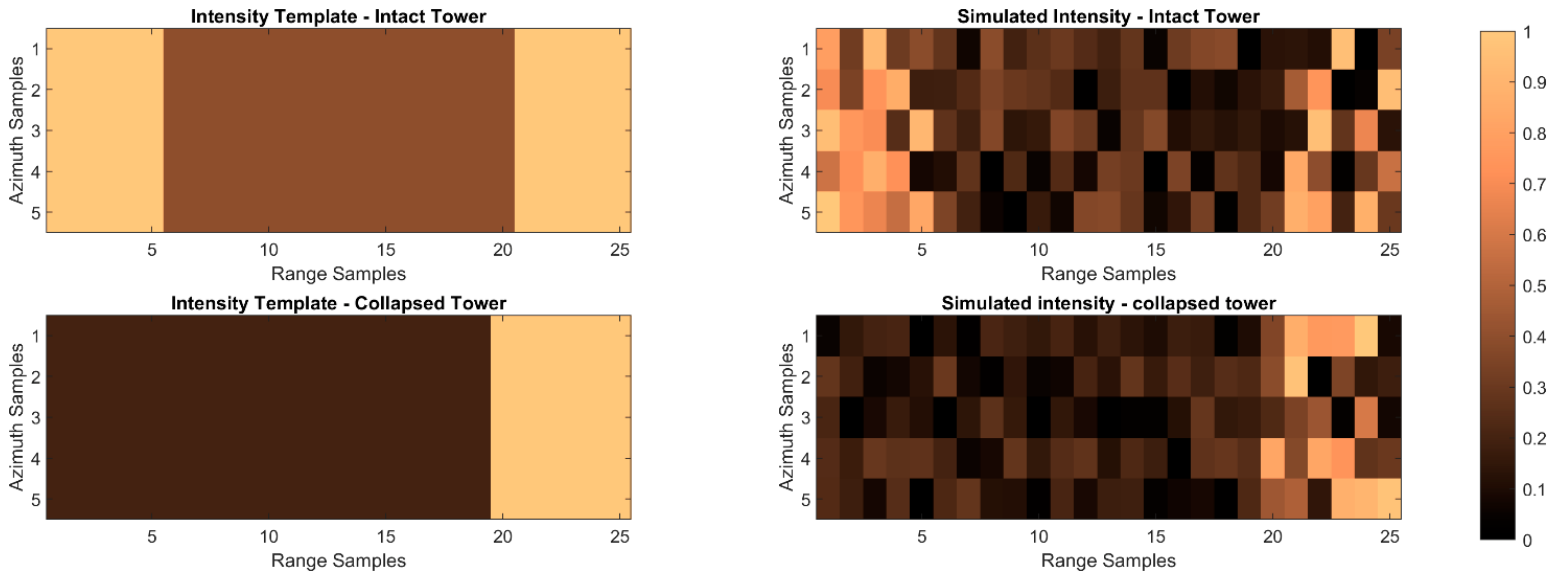
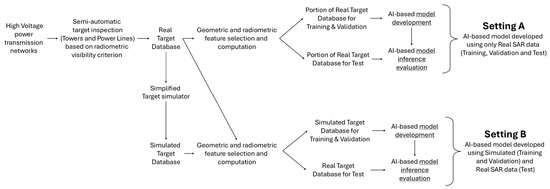
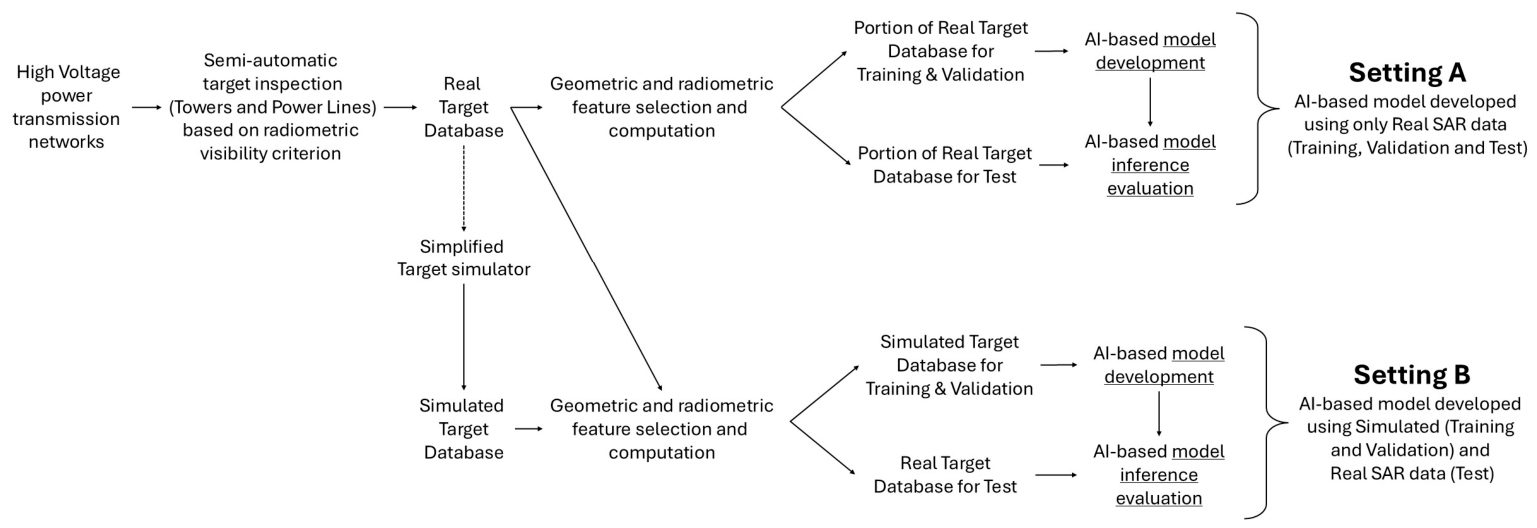
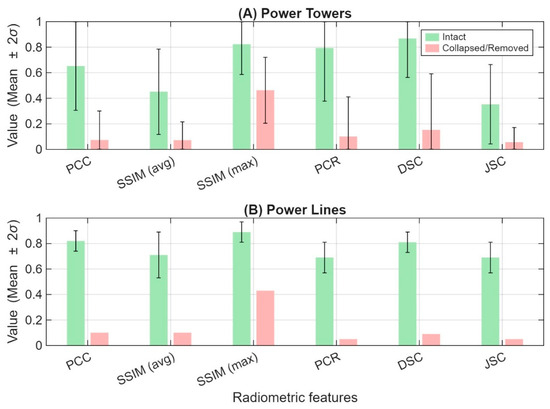
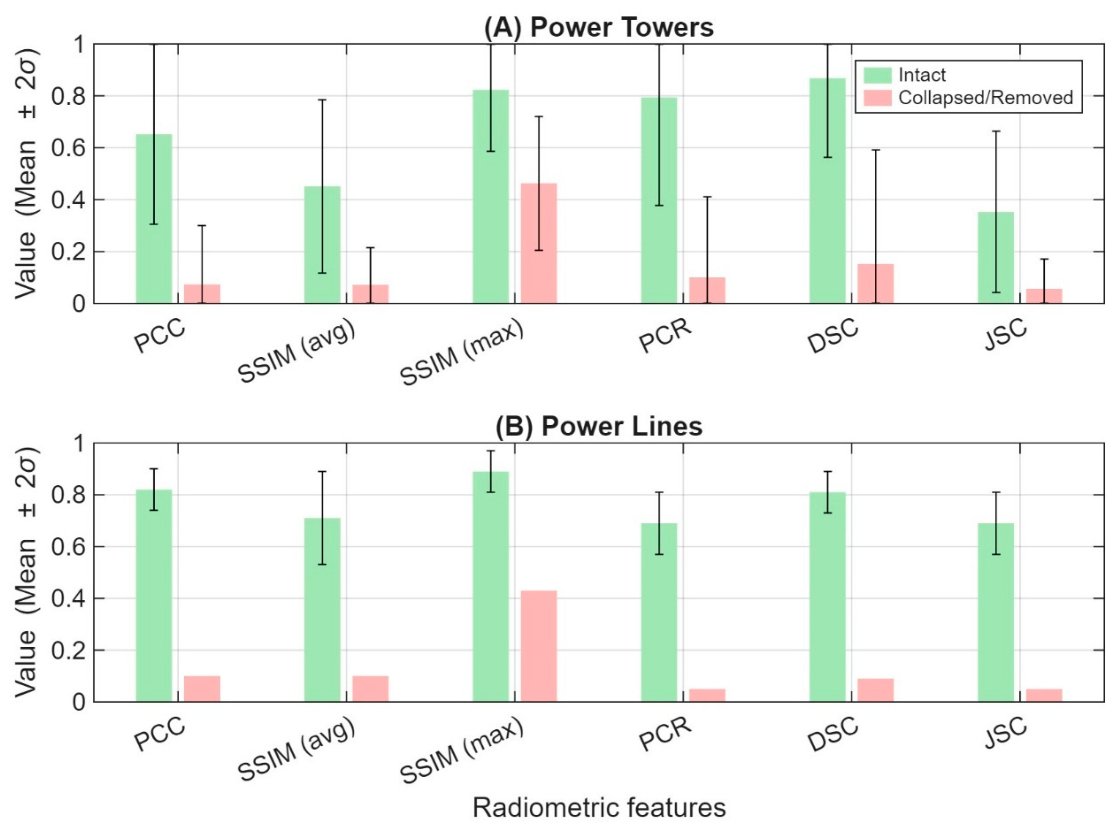
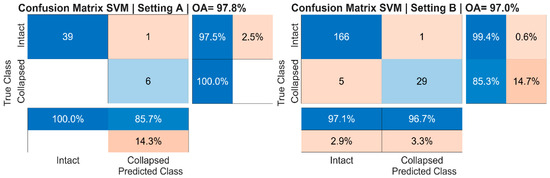
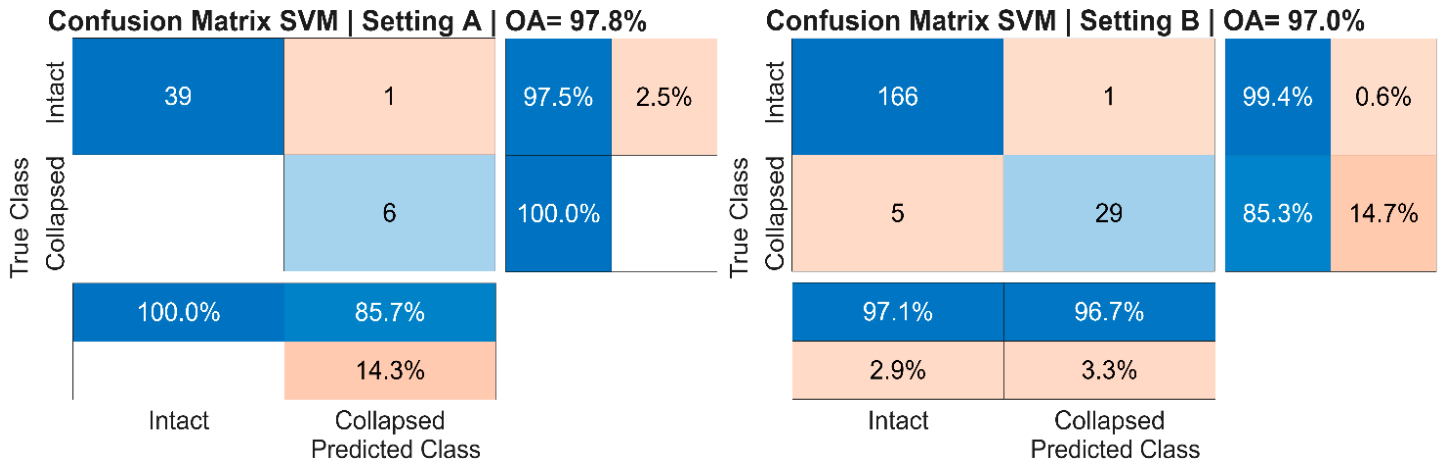
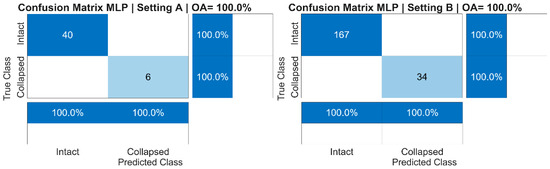
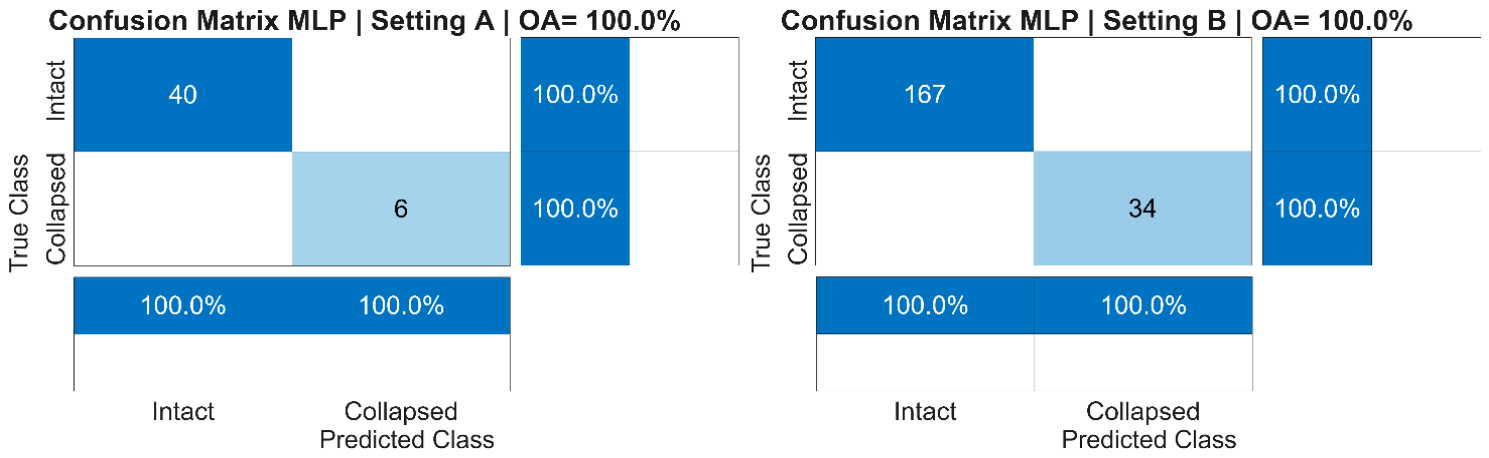
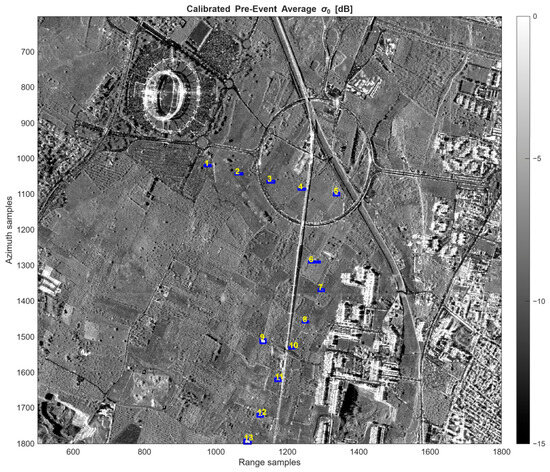
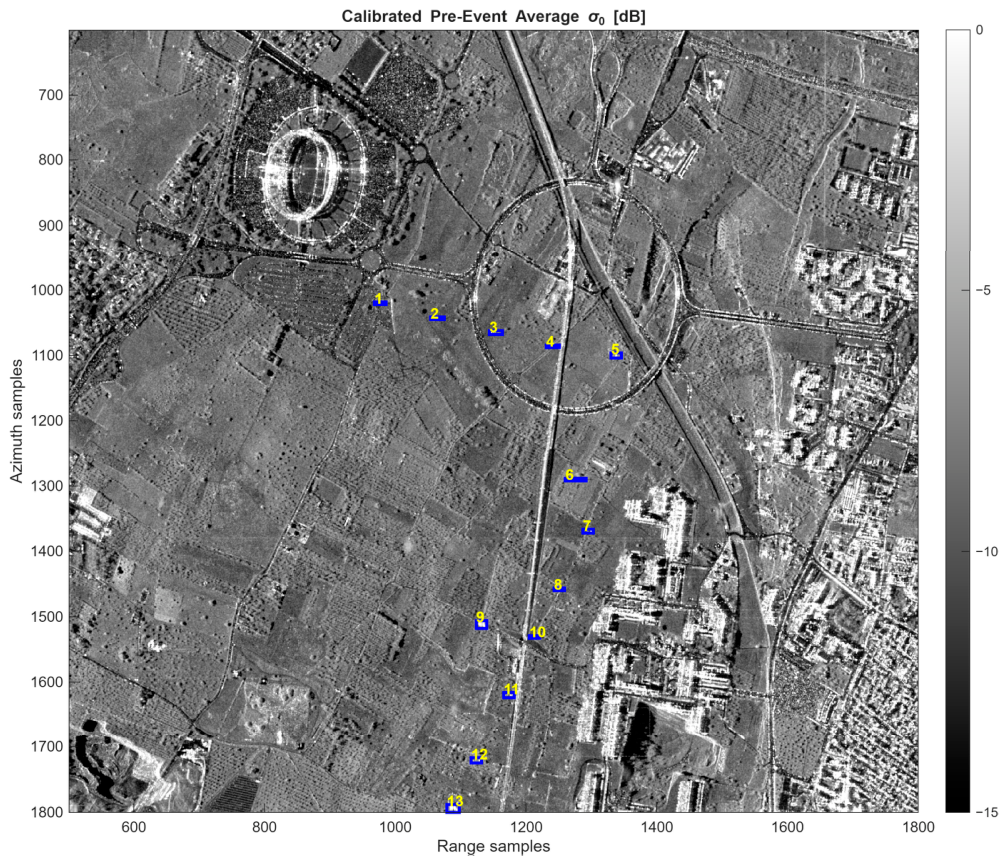
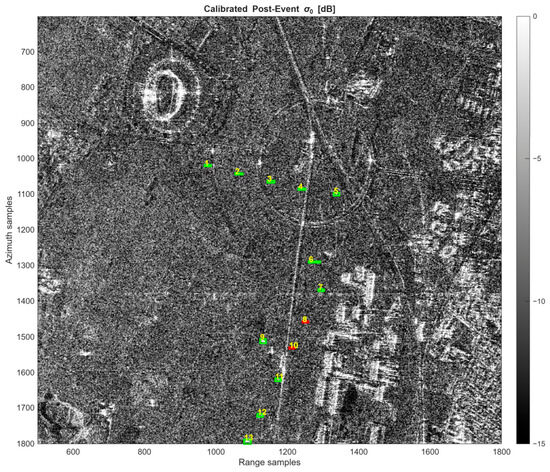
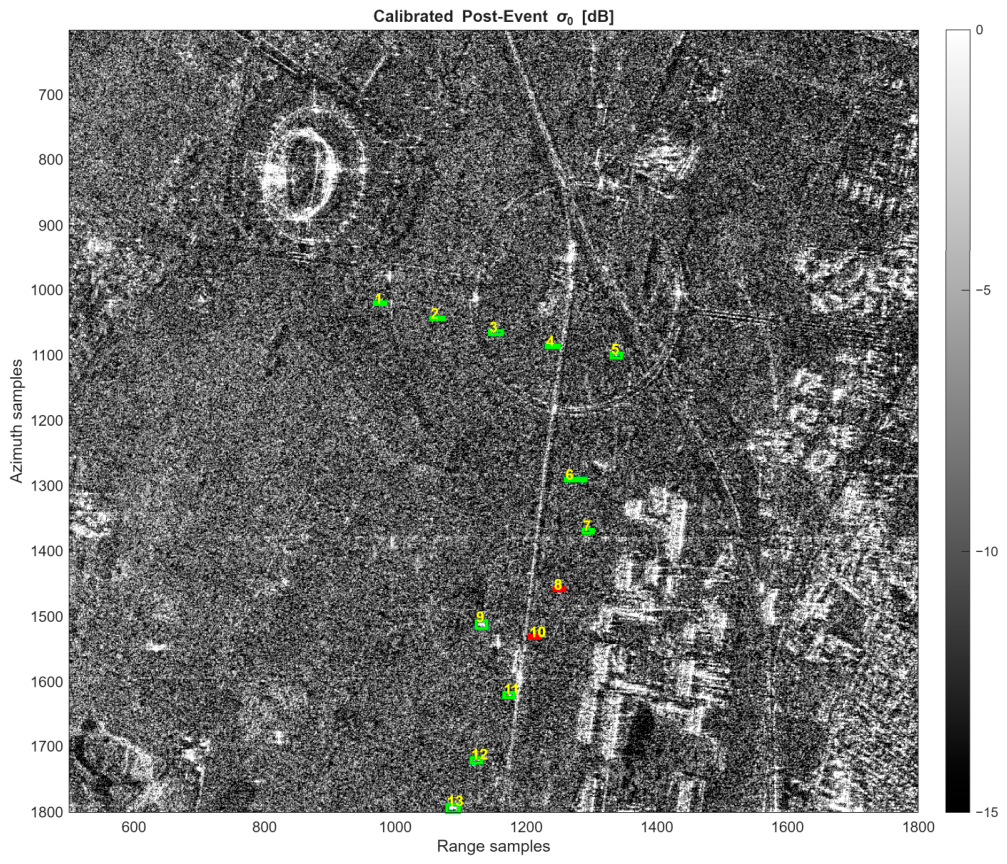
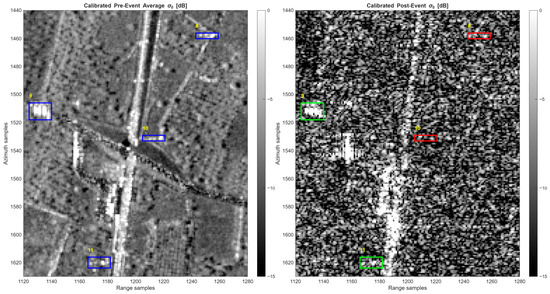
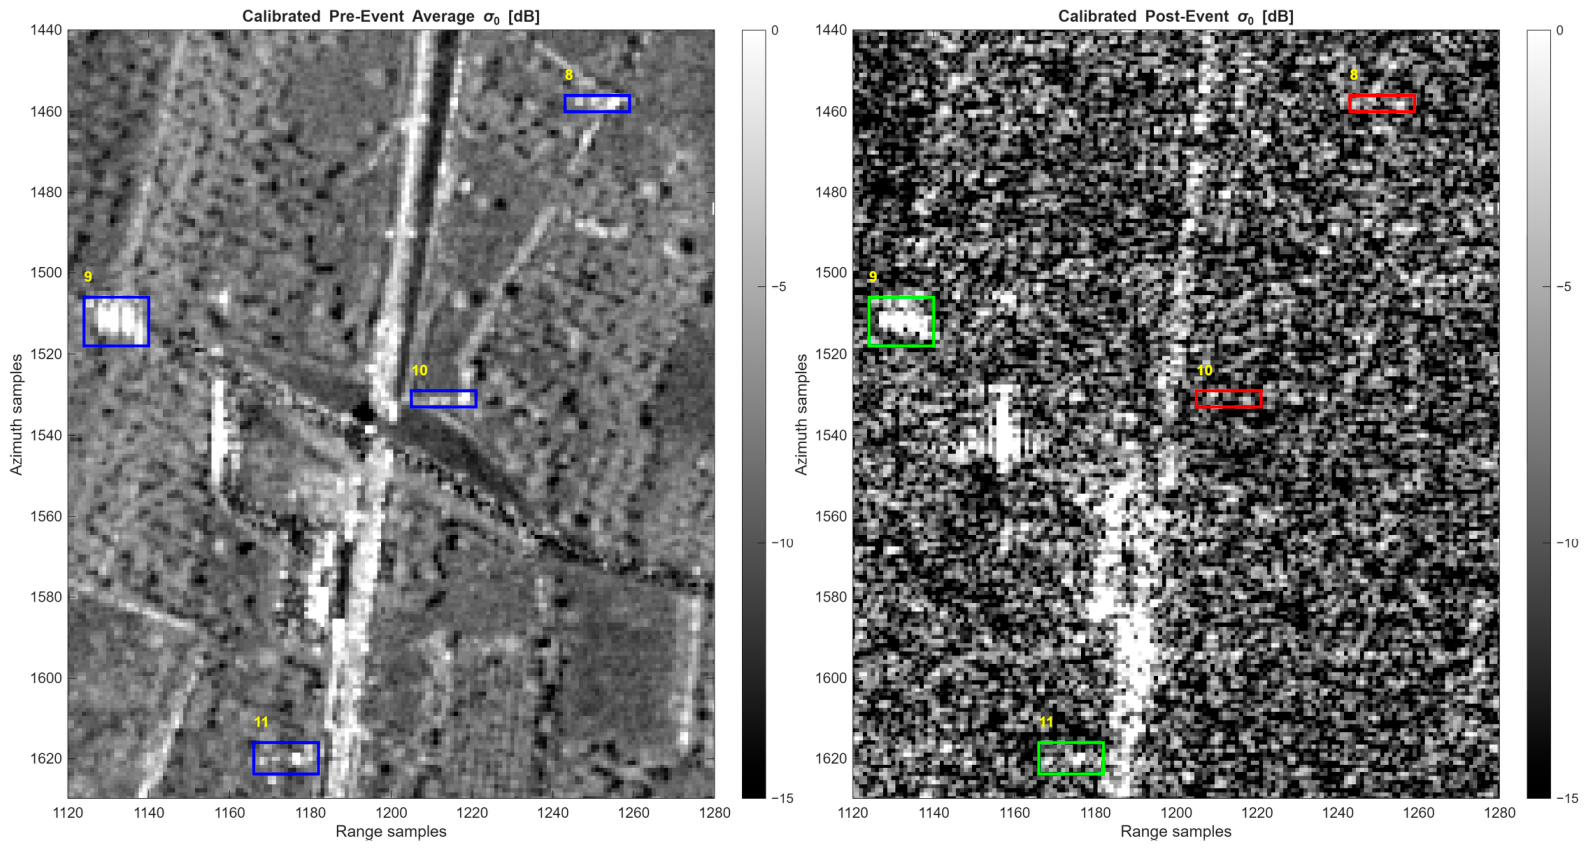








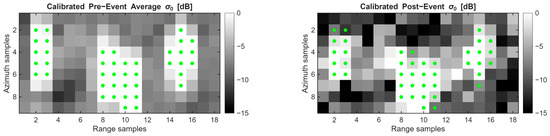
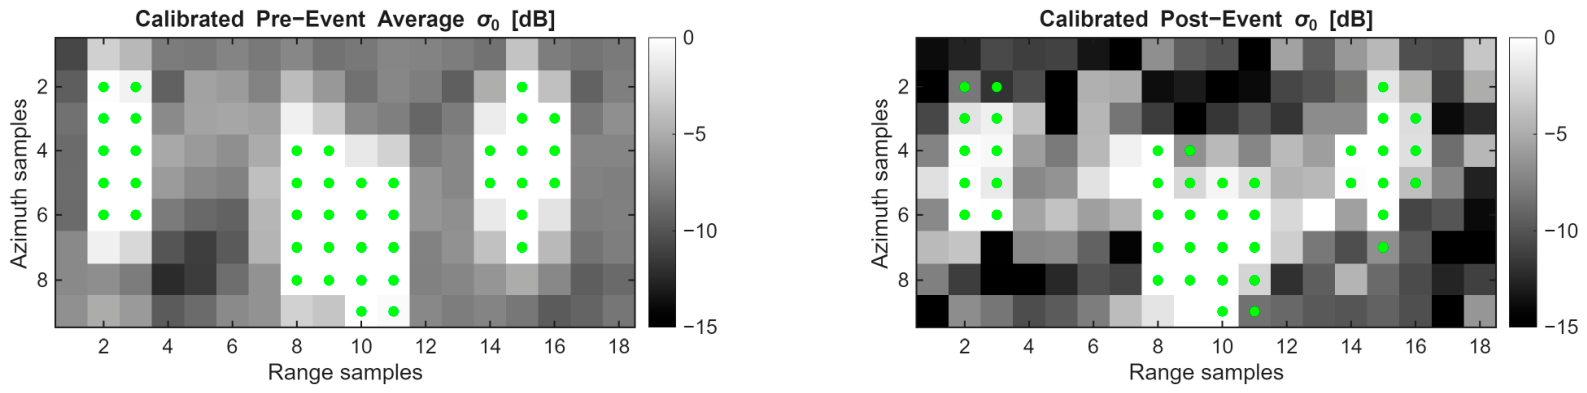
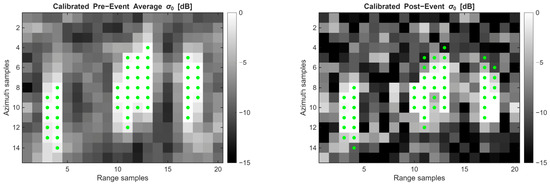
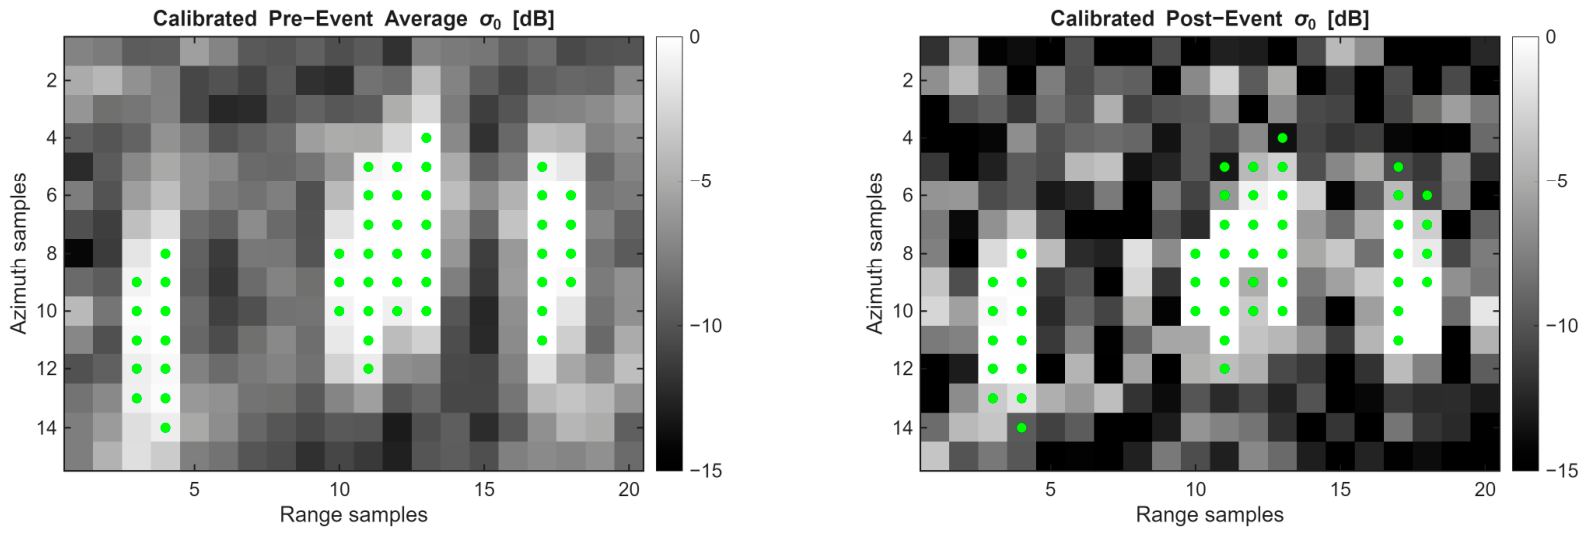
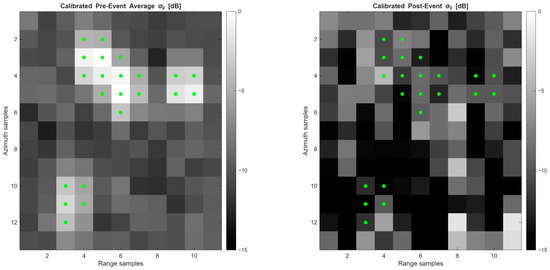
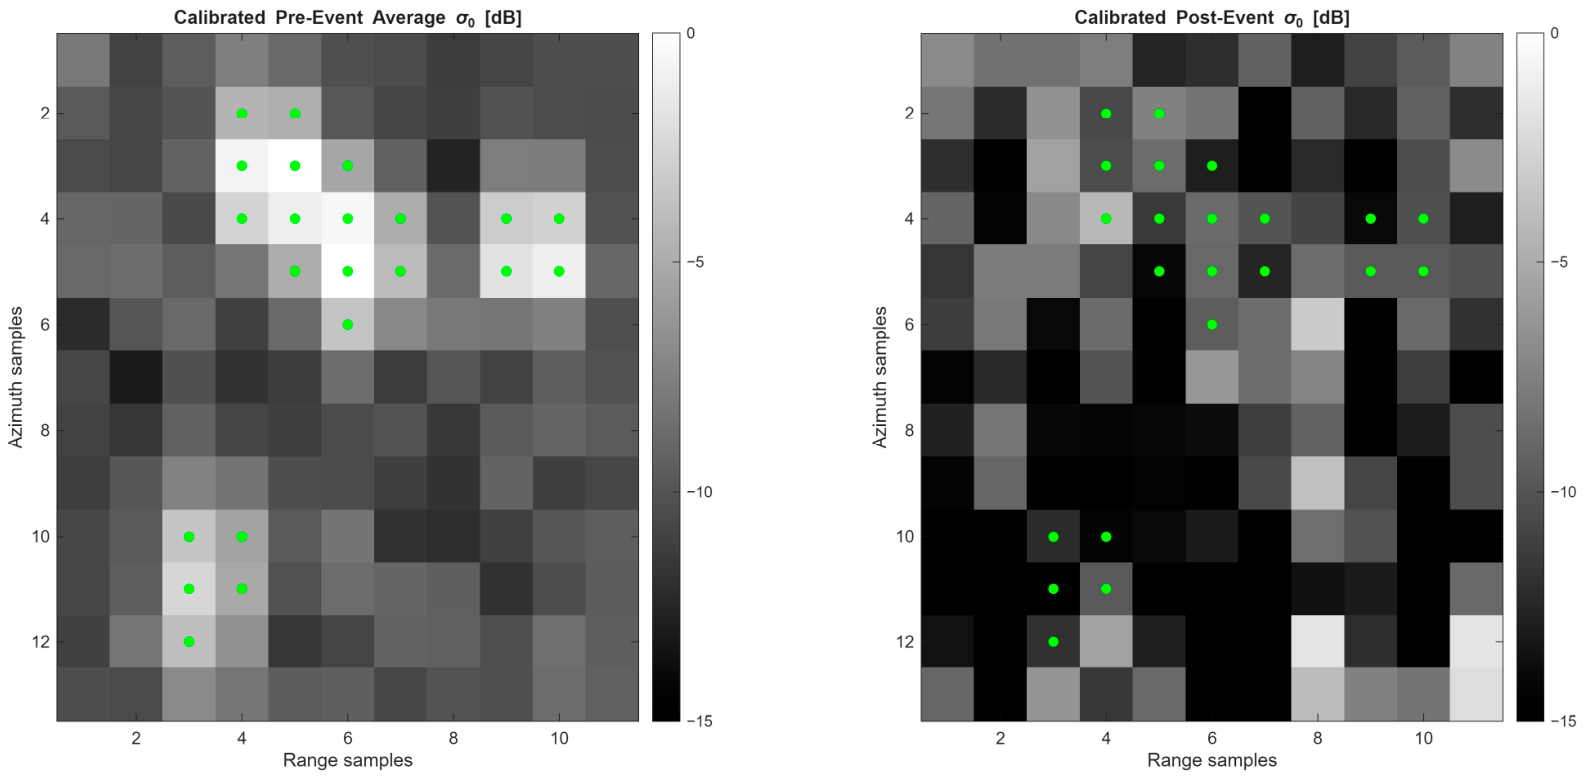
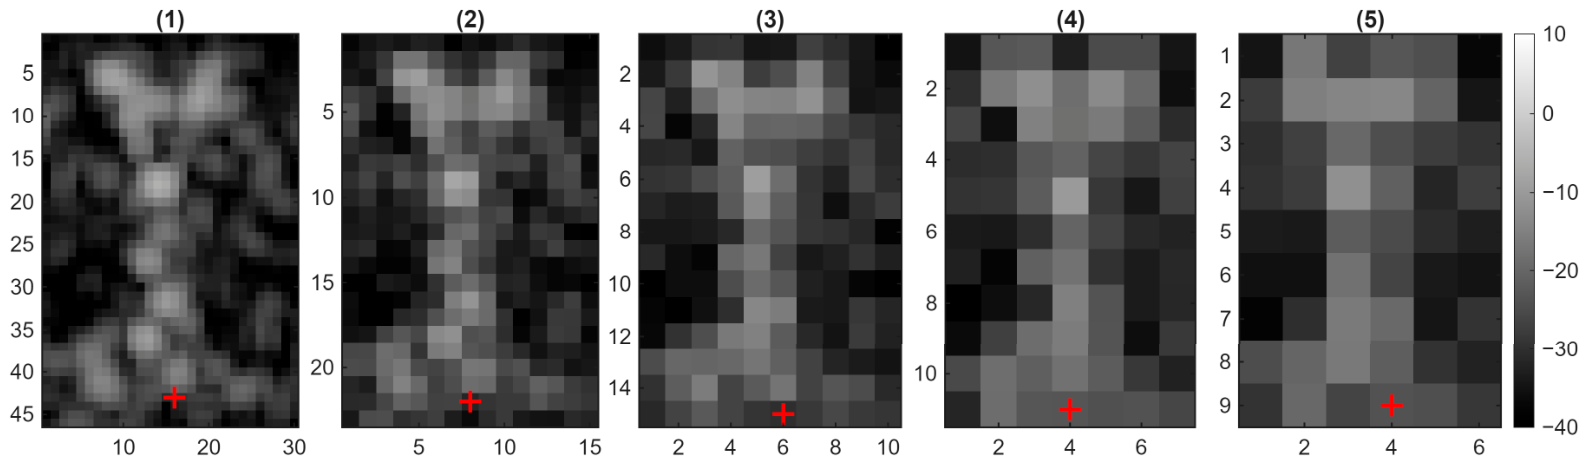

Disclaimer/Publisher’s Note: The statements, opinions and data contained in all publications are solely those of the individual author(s) and contributor(s) and not of MDPI and/or the editor(s). MDPI and/or the editor(s) disclaim responsibility for any injury to people or property resulting from any ideas, methods, instructions or products referred to in the content. |
© 2026 by the authors. Licensee MDPI, Basel, Switzerland. This article is an open access article distributed under the terms and conditions of the Creative Commons Attribution (CC BY) license.