


Highlights
What are the main findings?
- Coastline change along Jiangsu is dominated by erosion, accounting for over half of the total coastline length, with clear spatial heterogeneity.
- Accretion mainly occurs near river mouths and aquaculture areas, whereas erosion is more common at interfaces between forested land and engineered coastlines.
What are the implications of the main findings?
- The proposed tide-independent method enables efficient and consistent coastline extraction without relying on tidal correction data.
- The results provide scientific support for coastal management and improve understanding of human–natural interactions in muddy coasts.
Abstract
Accurate coastline extraction in muddy and macro-tidal environments is challenging due to tidal variability and complex coastal surfaces. The Jiangsu coast of China, characterized by extensive tidal flats, silty coastlines, and strong land–sea interactions, provides an ideal case for long-term coastline change analysis. This study investigates the spatiotemporal evolution of the Jiangsu coastline from 2018 to 2025 using multi-temporal Sentinel-2 imagery. A tide-independent coastline extraction framework was developed by integrating the Normalized Difference Water Index, Modified Normalized Difference Water Index, and Normalized Difference Vegetation Index for different coastal environments. An annual maximum spectral index composite was applied to approximate the highest water-level conditions without explicit tidal correction. Coastline dynamics were quantified using fractal dimension analysis and a transect-based method. The extracted coastlines yielded an average Root Mean Square Error (RMSE) of 13.14 m and an average Mean Absolute Distance Error (MADE) of 9.39 m. Results show that the total coastline length varied within 5% during the study period, with a maximum of 1079.84 km in 2022 and a minimum of 1004.99 km in 2018. Coastline change was dominated by erosion, accounting for 56.21% of the total coastline length. Land cover analysis revealed that accretion mainly occurred near river mouths and aquaculture areas, whereas erosion was more common at interfaces between forested land and engineered coastlines. The proposed framework provides an efficient and consistent approach for short-term coastline monitoring in muddy coastal environments.
1. Introduction
The coastline represents the spatial boundary formed by interactions between terrestrial and marine systems, and its morphology and position are jointly controlled by geomorphic evolution, hydrodynamic processes, and human activities. While many coastlines exhibit relatively stable or gradual evolutionary trends under natural conditions [1], coastlines in areas characterized by complex sediment dynamics, such as extensive tidal flats, are highly sensitive to variations in hydrodynamic forcing and sediment transport, and therefore tend to undergo rapid adjustments [2]. In recent decades, global climate change has intensified these dynamics through sea-level rise and an increasing frequency of extreme storm events, thereby exacerbating coastal erosion risks [3]. Concurrently, large-scale human interventions, including land reclamation, port construction, and coastal protection engineering, have continuously reshaped coastal environments, further increasing the complexity of coastline evolution [4,5]. Given the critical role of coastlines in ecosystem conservation, disaster risk mitigation, and coastal spatial planning, accurate monitoring of spatiotemporal coastline variations is essential for understanding coastal evolution and supporting sustainable coastal management [6,7].
Coastline data are primarily obtained through in situ field surveys and remote sensing-based image interpretation [8,9]. In situ measurements typically rely on high-precision Global Navigation Satellite System (GNSS) devices or geodetic stations to delineate coastline positions under specific tidal conditions [10,11], offering high accuracy and reliability. However, their application is constrained by high costs and limited spatial coverage, making them unsuitable for large-scale, long-term monitoring. With the development of remote sensing technologies, coastline extraction based on remote sensing imagery offers broader spatial coverage and stronger temporal continuity, and has become the primary method for regional-scale coastline extraction and monitoring. Existing studies have widely applied threshold-based segmentation [12], edge detection [13], and region-growing [14] methods for automated coastline extraction, while object-based image analysis [15], wavelet transforms [16], and deep learning models [17] have increasingly been adopted to address complex coastal environments. Compared with more sophisticated approaches, threshold-based methods remain the most commonly used techniques in large-scale coastline extraction because of their simplicity, computational efficiency, and strong adaptability to multi-temporal remote sensing imagery.
Nevertheless, in muddy coasts with strong tidal influence and extensive tidal flats, coastline positions extracted from instantaneous satellite imagery are highly dependent on the tidal stage at the time of image acquisition [18,19]. Tidal water-level variability therefore remains one of the primary sources of uncertainty affecting coastline extraction accuracy and temporal comparability. To mitigate tidal effects, many studies have introduced tidal correction techniques to reference coastlines to a common tidal datum [20,21]; however, such approaches typically require high-quality tide gauge data and nearshore topographic information, and their accuracy is often limited by data availability and terrain complexity when applied over large spatial extents and long time series. Alternative strategies, including multi-temporal compositing [22], tide-constrained image synthesis [23], and the integration of satellite altimetry data [24], have been explored to reduce the reliance on real-time tidal data. In this context, Sentinel-2 Multispectral Instrument (MSI) imagery, with its relatively high spatial resolution, short revisit cycle, and stable radiometric quality, provides a valuable data source for detailed characterization of tidal flats and nearshore land–sea boundaries and for long-term coastline monitoring [25].
The Jiangsu coast of China is characterized by extensive tidal flats and diverse coastline types [26]. From 1128, when the Yellow River diverted southward into the Huaihe River and entered the sea, until its northward return in 1855, large amounts of sediment were transported to the Jiangsu coast, forming a unique muddy coastal geomorphology. After the Yellow River shifted northward, sediment supply to the abandoned Yellow River Delta was drastically reduced, causing the coastal system to transition from accretion to erosion and gradually evolve into one of the most typical erosional coasts in China [27,28,29]. In recent decades, under the combined influences of sea-level rise, reduced watershed sediment discharge, and intensified human activities, the tidal flats along the Jiangsu coast have gradually transitioned from accretion to erosion, leading to significant coastline evolution [30]. These erosion–accretion dynamics exhibit strong coupling relationships with sediment supply, tidal hydrodynamics, and coastal engineering activities [31].
Against this background, this study focuses on the Jiangsu coast and utilizes multi-temporal Sentinel-2 MSI imagery acquired from 2018 to 2025 to develop a tide-independent framework for coastline extraction and spatiotemporal change analysis. By integrating multiple spectral indices and applying an annual maximum spectral index composite strategy, coastlines representing annual highest water-level conditions are delineated without explicit tidal correction. Geometric smoothing, fractal dimension analysis, and a transect-based method are then employed to quantitatively characterize coastline length variations, morphological complexity, and erosion–accretion dynamics along the Jiangsu coast. In addition, land cover classification based on Landsat-8 OLI imagery is used to examine the spatial differentiation of coastline changes under different land cover conditions and to explore their potential driving mechanisms. Using the Jiangsu coast as a case study, this research further investigates the reliability of extracting the highest water-level coastline without tidal correction, as well as the influence of human activities and natural processes on coastline change.
2. Methods
2.1. Study Area and Data
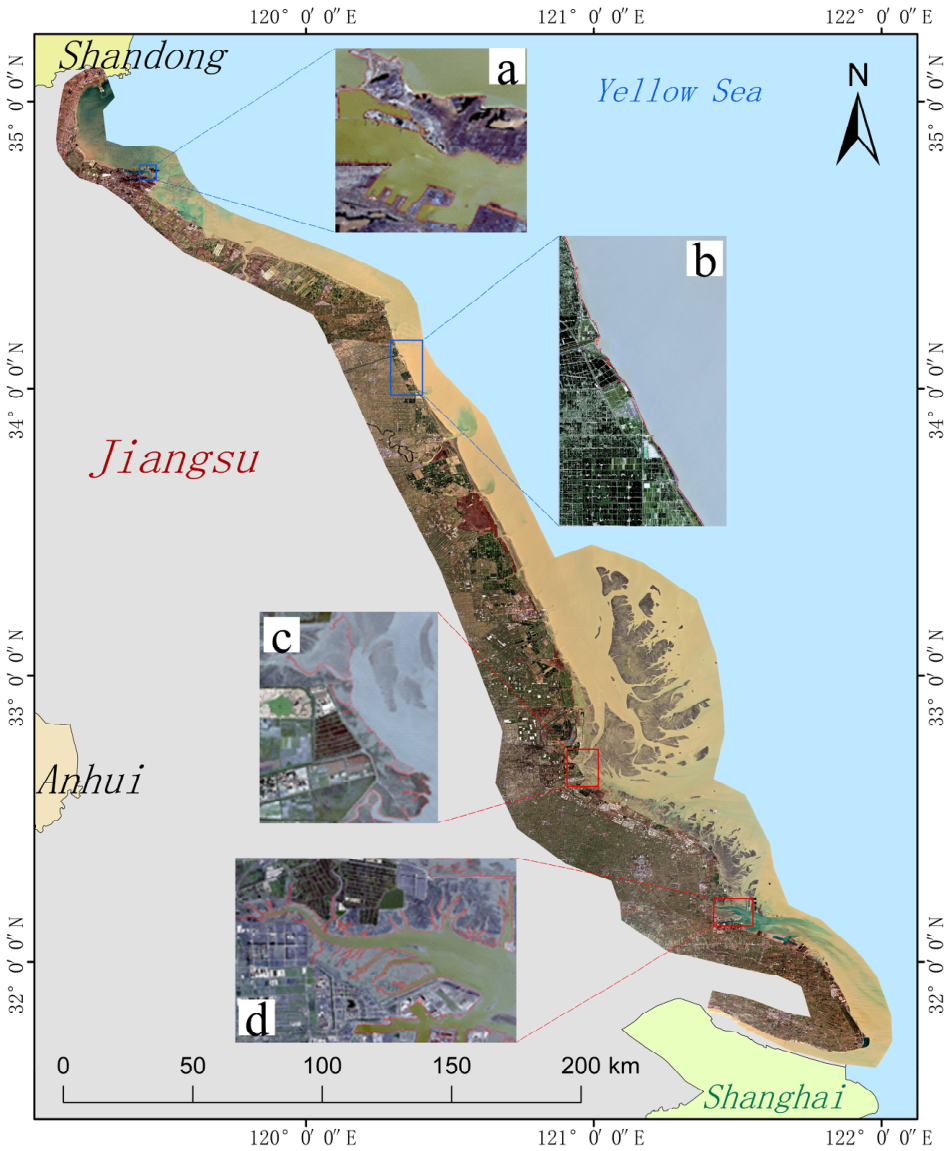
The study area is located along the central segment of the eastern coast of mainland China, extending approximately from 30°45′ to 35°20′N and from 119°10′ to 121°56′E. The coastline of Jiangsu Province extends approximately 954 km and encompasses a marine area of about 34,766 km2 (Jiangsu Provincial Department of Natural Resources). In terms of coastal geomorphology, the region is situated within a transitional coastal zone influenced by large-scale sedimentary systems, where muddy and silty coastlines with extensive tidal flats constitute the dominant coastal type, while bedrock coastlines occur only in limited segments [32]. The study area is shown in Figure 1. It should be noted that the geographic extent shown in Figure 1 only illustrates the coastal zone where land cover features are presented, rather than the full spatial domain corresponding to the above statistics.
Figure 1.
Location of the study area. The coastal region of Jiangsu Province derived from Landsat-8 imagery. Panels (a,b) represent coastlines with relatively low complexity, while panels (c,d) represent coastlines with higher complexity.
In this study, Sentinel-2 MSI optical satellite imagery is employed as the primary data source for coastline extraction. All data acquisition and preprocessing procedures are implemented on the cloud-based Google Earth Engine (GEE) platform [33]. The dataset consists of Sentinel-2 Level-2A surface reflectance products acquired over an eight-year period from 2018 to 2025, with spatial resolutions ranging from 10 to 20 m. Only the visible bands, together with Band 8 (near-infrared) and Band 11 (shortwave infrared), are utilized in this study. The temporal sampling interval is set to approximately 30 days to ensure sufficient temporal coverage while maintaining data continuity. During preprocessing, images with cloud cover exceeding 40% are initially excluded. For images with cloud cover lower than 40%, the Scene Classification Layer (SCL) is applied to remove pixels identified as cloud shadow, medium-probability cloud, high-probability cloud, and cirrus. This multi-stage cloud and cloud-shadow masking strategy effectively reduces atmospheric interference in coastline detection and enables the construction of a high-quality, short-term, cloud-free image time series suitable for robust coastline extraction. The acquisition dates and temporal information of the downloaded Sentinel-2 imagery are provided in Supplementary Materials S1.
Landsat-8 Operational Land Imager (OLI) imagery was selected as the primary data source for land cover classification in the coastal zone of Jiangsu Province. The imagery has a spatial resolution of 30 m, and all selected scenes have cloud coverage below 10%, ensuring the reliability of land cover classification in the study area. Therefore, multi-temporal Landsat-8 images from 2018 to 2025 were utilized for annual land cover classification, and the classification results were further employed as auxiliary data for analyzing the driving mechanisms of coastline change. The classification maps for each year are presented in Supplementary Materials S2.
2.2. Processing Framework
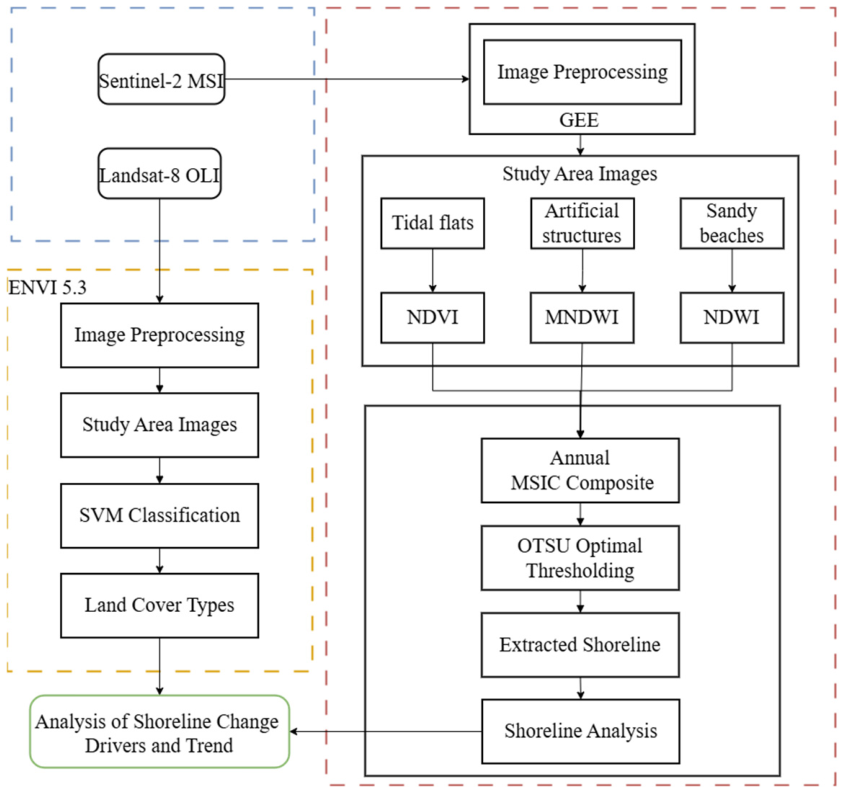
In this study, the coastline is consistently defined as the land–sea boundary at the highest marine water level. A non-tidal-correction-based threshold segmentation method is employed to accurately extract coastline positions, which are then integrated with land cover information to analyze coastline changes along the Jiangsu coast. The overall methodological framework and analytical workflow of the study are illustrated in Figure 2. The main objectives of this study are to extract coastlines along the Jiangsu coast from 2018 to 2025 using multi-temporal Sentinel-2 imagery, analyze their spatiotemporal evolution, and investigate the driving factors and changing trends by integrating land cover information.
Figure 2.
Flowchart of coastline extraction and spatiotemporal change analysis along the Jiangsu coast.
2.3. Coastline Extraction
Different coastal environments are strongly influenced by factors such as water turbidity, substrate characteristics, and coastline types. High turbidity waters, wave-induced whitecaps, and land surfaces with high moisture content can substantially reduce the effectiveness of a single water index, leading to high possibilities of misclassification in complex coastal settings. To address these limitations, this study employs three commonly used spectral indices—NDVI, NDWI, and MNDWI—defined as follows:
where is the reflectance of the near-infrared band, is the reflectance of the red band, is the reflectance of the green band, and is the reflectance of the shortwave infrared band. This combined use of water and vegetation indices enhances the robustness of coastline extraction under heterogeneous coastal conditions and provides a reliable spectral basis for subsequent composite analysis.
According to our experimental analysis, the performance of NDWI, MNDWI, and NDVI for coastline extraction varies substantially across different coastal environments. In muddy coasts characterized by high turbidity and in soil-dominated coastlines with high moisture content, NDWI generally performs less effectively than MNDWI. This difference is primarily attributed to the stronger absorption of water in the shortwave infrared (SWIR) band used by MNDWI (Band 11 in Sentinel-2), compared with the near-infrared (NIR) band employed by NDWI (Band 8). However, the coarser spatial resolution of the SWIR band (20 m) may blur the land–water boundary, introducing additional uncertainty in coastline delineation, particularly in areas with narrow beaches or complex boundary geometry.
NDWI and MNDWI therefore exhibit complementary strengths in enhancing water extent and preserving boundary details. In coastal zones with dense vegetation cover, optical imagery often exhibits ambiguous water boundaries, leading to discrepancies between extracted coastlines and actual inundation extents. To address this limitation, NDVI is incorporated due to its strong contrast between vegetated surfaces and water bodies, with higher values corresponding to vegetation. Experimental results demonstrate that NDVI outperforms both NDWI and MNDWI in delineating the boundary between seawater and vegetated tidal flats, making it particularly suitable for such environments.
To account for the strong spatial heterogeneity of the Jiangsu coastline, coastline zoning was established based on the Landsat-8 land-cover classification results. The coastline was classified into three dominant types: tidal flats, artificial structures, and sandy beaches. According to the classification map, the geographic extent of each coastline type was delineated, and the corresponding Sentinel-2 imagery within each extent was exported from GEE. Coastline extraction was then performed independently for each coastal type using the spectral index identified as the most suitable for that environment. Finally, the extracted coastline segments were merged to generate a continuous coastline for the entire Jiangsu coast. It should be noted that manual intervention was only required during the delineation of regional extraction boundaries and the subsequent integration of coastline segments derived from different coastal types, whereas the coastline extraction process itself was performed automatically.
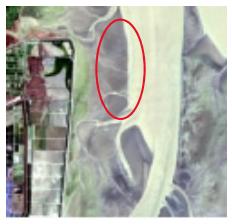
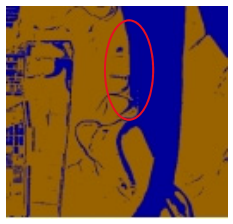
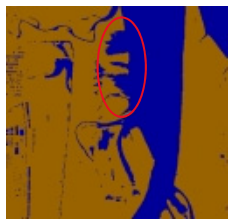
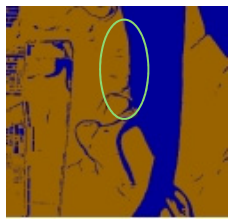
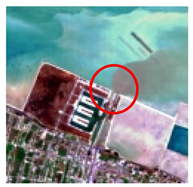
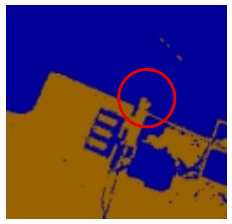
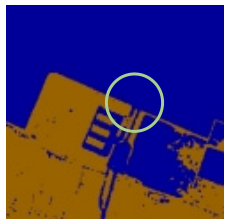
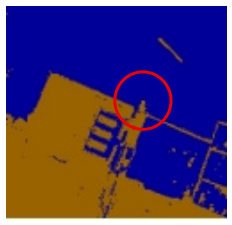
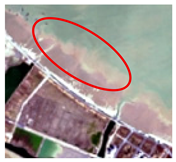
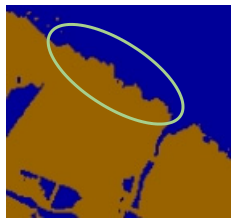
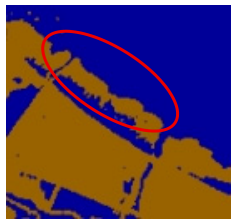
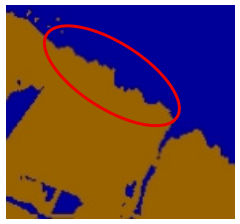
Based on a comparative assessment of these three spectral indices across different coastal settings, region-specific indices were manually selected according to local coastline characteristics to accommodate spatial heterogeneity in the coastal environment, as summarized in Table 1. NDVI is adopted in coastal zones dominated by extensive vegetated tidal flats, where NDWI and MNDWI tend to produce omission errors and fail to adequately detect water–land boundaries. MNDWI is applied along engineered or highly turbid coastlines to suppress the influence of water turbidity, as NDWI and NDVI are prone to misclassifying turbid water as land in such environments. NDWI is preferred in sandy beach areas where higher spatial resolution is critical for accurate boundary detection, as illustrated by the circled regions in Table 1. The integrated use of multiple spectral indices substantially improves the stability and reliability of land–water boundary identification across diverse coastline types, thereby enhancing the overall robustness of the extracted coastlines.
Table 1.
Comparison of NDWI, MNDWI, and NDVI under different coastal environments in Jiangsu Province.
To reduce the effect of the tide on coastline extraction, this study uses the Maximum Spectral Index Composite (MSIC) method. Multi-temporal spectral index images acquired within a single year are stacked and processed on a pixel-by-pixel basis. For each pixel location, spectral index values from different acquisition dates are ranked, and the annual maximum value of the selected index is used to construct the annual maximum spectral index composite image, which can be expressed as:
where (x, y) denotes the pixel location, t represents the image index, and N is the total number of images acquired within a year. Under high-water or high-tide conditions, water-related spectral indices typically reach their annual peak values. Consequently, the maximum-value composite effectively represents the spatial extent of water bodies under annual highest water level conditions. By adopting this strategy, inconsistencies arising from tidal stage differences at image acquisition times are substantially reduced, thereby enhancing the interannual comparability of the extracted coastlines across different years.
This study validated whether the MSIC method can effectively extract the highest water-level coastline. Tide level records corresponding to the Sentinel-2 acquisition times in 2025 were obtained from four tidal stations, namely Lianyun Port, Qiong Port, Dafeng Port, and Yangkou Port, through the National Marine Data Center. These stations cover representative coastline types along the Jiangsu coast. Based on the recorded tide levels, the Sentinel-2 images were divided into two groups: relatively high-water-level images and relatively low-water-level images. All Sentinel-2 images were acquired at approximately 10:38, 10:48, or 10:58 Beijing Time. For each validation group, three relatively high-water-level images and three relatively low-water-level images were selected for analysis.
Using NDWI as an example, the MSIC method was applied to generate a maximum NDWI composite image, which represents the highest water-level composite derived from the selected scenes. The capability of the MSIC method to identify the highest water-level coastline was quantitatively assessed by calculating the proportion of pixels from each image that contributed to the final highest water-level composite image. As shown in Table 2, pixels originating from the three relatively high-water-level images accounted for 65.05% of the total valid pixels in the composite image at the Lianyun Port tidal station. The best performance was observed at the Qiong Port tidal station, where pixels from the relatively high-water-level images contributed 85.06% of the valid pixels. Corresponding proportions at the Dafeng Port and Yangkou Port tidal stations were 63.18% and 63.68%, respectively.
Table 2.
Proportions of Pixel Contributions from Relatively High- and Low-Water-Level Images in the Composite Image.
The proportion of high-water-level pixels in the composite image is not expected to reach 100%, because NDWI differences between high- and low-water-level conditions are relatively small in inland areas and offshore deep-water regions. In these areas, NDWI values are more strongly influenced by soil moisture conditions and water distribution patterns than by tidal fluctuations. Consequently, some pixels from relatively low-water-level images were also incorporated into the MSIC image. Nevertheless, the validation results demonstrate that the MSIC method can effectively identify and integrate the highest water-level information from multi-temporal imagery, thereby enabling reliable extraction of the highest water-level coastline.
Following the generation of annual maximum spectral index composites, the Otsu adaptive thresholding method is employed to perform binary image segmentation. This algorithm automatically determines the optimal threshold by maximizing inter-class variance while minimizing intra-class variance, thus objectively separating water and land without the need for manually defined thresholds. Based on the derived threshold, the land–water boundary is identified and extracted as an initial coastline. The extracted boundary is subsequently converted into a vector polyline format and smoothed using the Savitzky–Golay algorithm with a window size of 11 vertices and a second-order polynomial to suppress high-frequency jagged noise while preserving the overall morphological characteristics of the coastline, thereby providing a reliable basis for subsequent quantitative analyses.
2.4. Spatiotemporal Analysis of Coastline Change
Coastline length variation and coastline position changes along cross-shore transects are adopted as key indicators to represent coastline change characteristics [34]. Accordingly, this study evaluates coastline complexity and overall length variation using fractal analysis and further quantifies localized erosion and accretion processes through a transect-based method.
Fractal dimension is a key parameter used to characterize the geometric complexity and tortuosity of coastlines and can be estimated using grid-based or ruler-based methods [35]. Owing to the pronounced fractal nature of coastlines, their measured length varies with the measurement scale. In this study, the box-counting [35] method is adopted to calculate the fractal dimension and estimate coastline length. The coastline is overlaid with grids of multiple spatial resolutions, and the number of grids intersecting the coastline is counted to derive length estimates under different scales. Grid resolutions of 10 m, 20 m, 30 m, 60 m, 120 m, 240 m, 360 m, and 500 m are used to calculate coastline lengths across multiple scales, thereby reducing scale-dependent length inflation effects.
The transect-based method is used to analyze temporal patterns of coastline erosion and accretion. An artificial baseline is constructed within the study area, along which a series of transects perpendicular to the baseline are generated at fixed intervals. Then, the intersection points between each transect and the extracted coastline are identified, and the perpendicular distance from the coastline to the baseline is used as an indicator to describe the changes in the coastlines. By establishing a relationship between coastline position and time, and applying year-to-year differencing and linear regression analyses, erosion or accretion trends for each transect are quantified over the period from 2018 to 2025.
3. Results
3.1. Accuracy of Coastline
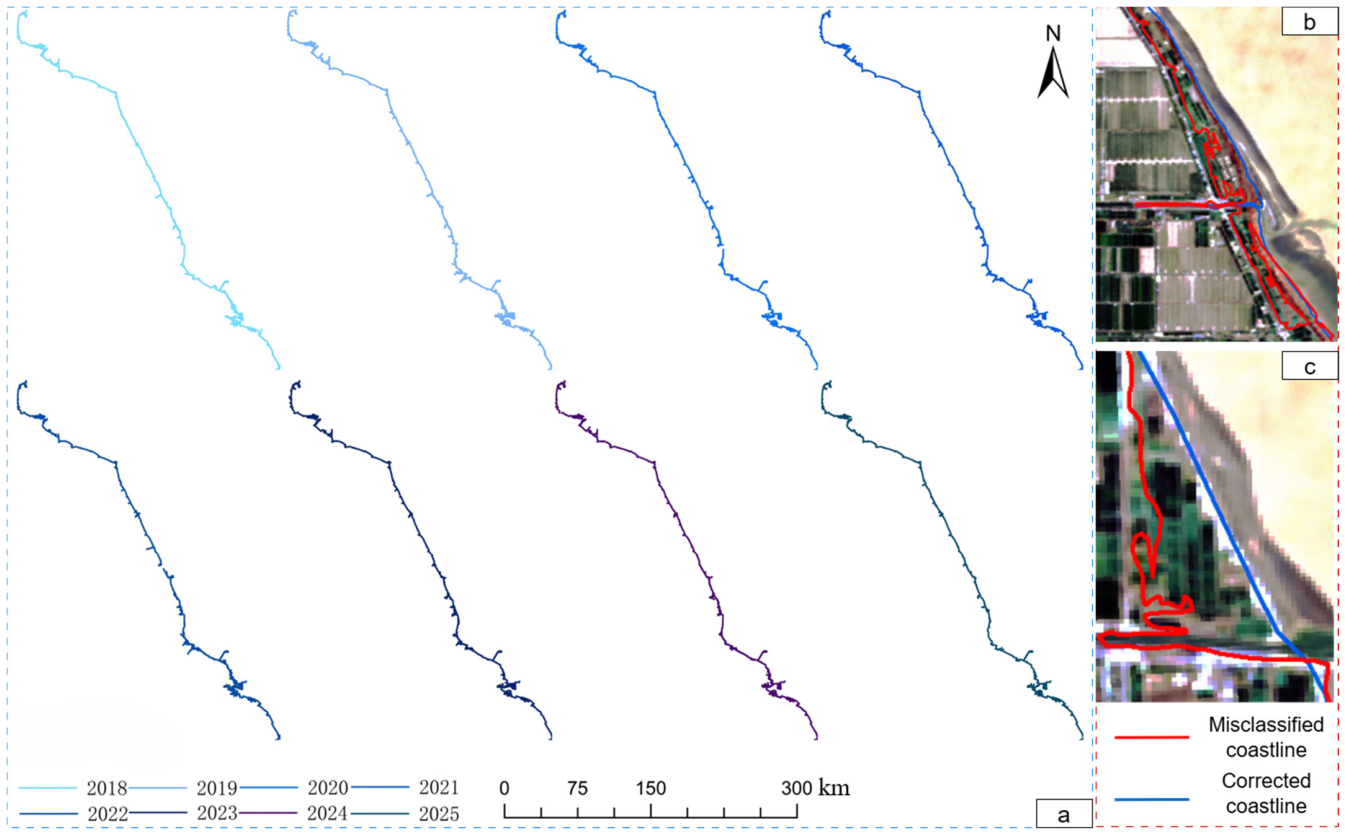
The extracted coastlines of Jiangsu Province for the eight periods from 2018 to 2025 are shown in Figure 3a. Areas with evident incorrect delineation (as illustrated in Figure 3b,c) were corrected through manual editing. These corrections were primarily concentrated in nearshore aquaculture zones, where water bodies within coastal aquaculture ponds were occasionally misclassified as open water, leading to local errors in coastline extraction. The average manually corrected coastline length was approximately 5 km per year, representing less than 0.5% of the total coastline length. Because the corrected sections were spatially limited and exhibited no significant interannual variation, their influence on the subsequent coastline length statistics and spatiotemporal change analysis was considered negligible.
Figure 3.
Extracted Coastlines of Jiangsu Province from 2018 to 2025. (a) Extracted coastlines of Jiangsu Province for the period 2018–2025; (b,c) areas with erroneous identification, which were corrected through manual editing.
The buffer-based method [36], together with the Root Mean Square Error (RMSE) and Mean Absolute Distance Error (MADE), is adopted as a quantitative approach to evaluate the accuracy of coastline extraction. For each year, approximately 200 km of reference coastline from tidal flats, artificial structures, and sandy beaches is manually delineated from the maximum spectral index composite and used as ground truth to assess the performance of the automatically extracted coastlines. The buffer-based method employs Commission Error (COM) and Omission Error (OM) to evaluate the completeness and extraction consistency of the coastline results, whereas RMSE and MADE quantify the spatial deviation between the extracted coastline and the reference coastline. Together, these metrics provide a comprehensive assessment of coastline extraction performance under different coastal conditions.
The calculation formulas of RMSE and MADE are expressed as follows:
where di represents the shortest distance between the automatically extracted coastline and the reference coastline at the i corresponding point, and n denotes the total number of points involved in the calculation.
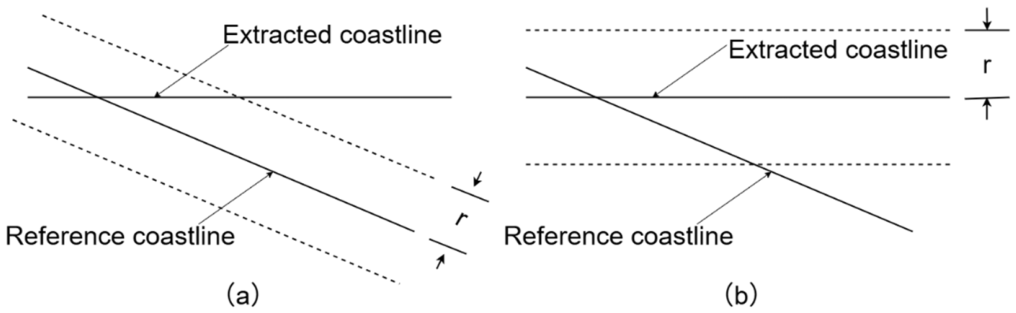
The calculation principles of COM and OM are illustrated in Figure 4a,b, respectively. Based on these principles, the COM and OM are calculated as follows:
where Nz denotes the total number of points of the automatically extracted coastline, and Nzr represents the number of automatically extracted coastline points that fall within the buffer zone of the reference coastline. Nc denotes the total number of points of the reference coastline, and Ncr represents the number of reference coastline points that fall within the buffer zone of the automatically extracted coastline.
Figure 4.
Schematic Illustration of the Coastline Accuracy Assessment Method. (a) COM; (b) OM; r denotes the buffer radius, which is set to 20 m corresponding to the maximum pixel size.
The accuracy assessment results are summarized in Table 3. The extracted coastlines from 2018 to 2025 exhibit an average RMSE of 13.14 m and an average MADE of 9.39 m. With the positional error constrained within a single-pixel scale, the extracted coastlines satisfy the accuracy requirements for subsequent coastline change analysis [23].
Table 3.
Accuracy Assessment of Coastline Extraction and Variations in Coastline Length from 2018 to 2025.
3.2. Spatiotemporal Analysis of Coastline Change
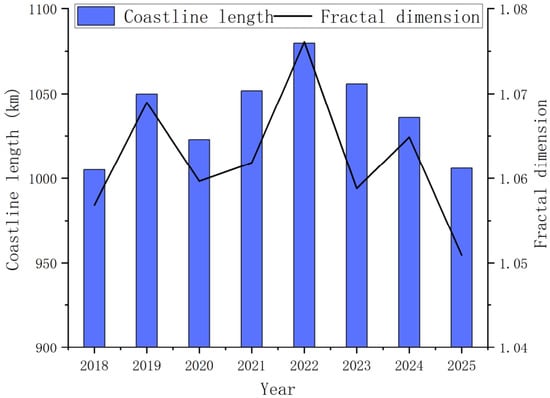
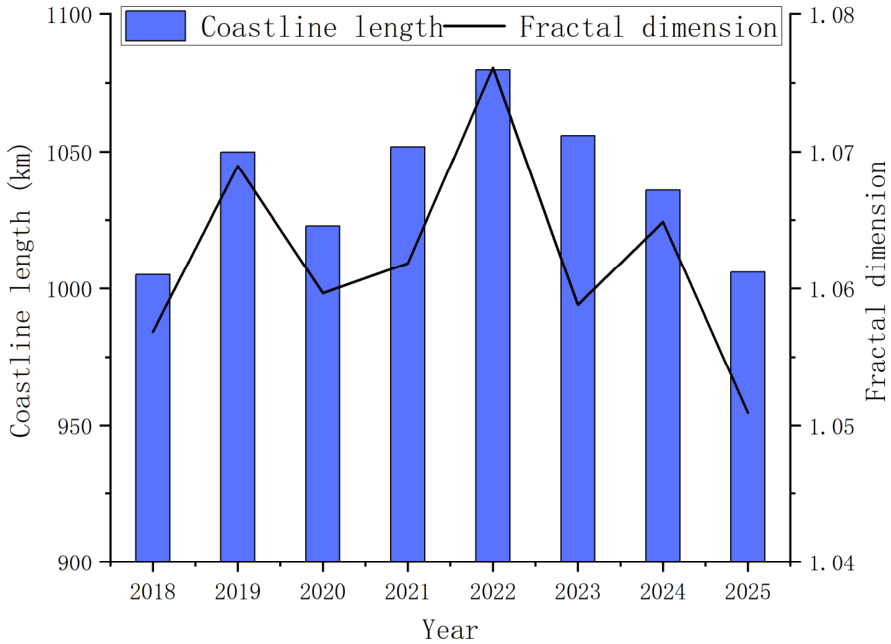
The coastline lengths for each year are shown in Table 3 and Figure 5. The total coastline length of Jiangsu Province exhibited relatively small interannual variability during 2018–2025, with the largest change (4.47%) occurring between 2018 and 2019, while variations in subsequent years remained within 1–3%. An increasing trend in coastline length is evident from 2018 to 2022, during which the most significant increase occurs between 2018 and 2019, with an expansion of approximately 45 km. In contrast, from 2022 to 2025, the coastline length exhibits a decreasing trend, gradually returning to a level comparable to that of 2018.
Figure 5.
Relationship between Coastline Length and Fractal Dimension. The coastline length shows a positive relationship with the fractal dimension, indicating that greater coastline complexity corresponds to a longer coastline length.
Fractal dimension is employed in this study as an indicator of coastline complexity in Jiangsu Province, with higher values representing greater geometric irregularity and complexity. As illustrated in Figure 5, coastline length varies consistently with the degree of geometric complexity. The coastline exhibits the highest complexity in 2022, with a fractal dimension of 1.076 and a corresponding coastline length of 1079.84 km. In contrast, the coastline in 2025 shows a relatively lower level of complexity, with a fractal dimension of 1.051 and a coastline length of 1005.98 km. Overall, the temporal variation in the fractal dimension of the Jiangsu coastline demonstrates a pattern that closely mirrors changes in coastline length, characterized by an initial increase followed by a subsequent decrease over the study period.
The primary factor influencing coastline complexity in Jiangsu Province is the extensive distribution of tidal flats in the nearshore zone. In areas with widespread tidal flats, particularly in the southern coastal sector of Jiangsu Province, the horizontal distance between high-tide and low-tide coastline positions can reach up to approximately 4 km. As a result, coastlines extracted from instantaneous satellite imagery in these areas tend to exhibit highly irregular and sinuous geometries, as shown in Figure 1c,d. This pronounced tidal influence substantially increases the apparent geometric complexity of the extracted coastline. In contrast, the central and northern coastal regions of Jiangsu Province are less affected by tidal flats. In these areas, coastline morphology is primarily controlled by river estuaries, local topography, and engineered coastal structures, resulting in relatively lower coastline complexity, as shown in Figure 1a,b. Consequently, short-term coastline variations are more strongly influenced by tidal flat dynamics, highlighting the dominant role of tidal processes in shaping coastline complexity over the study period.
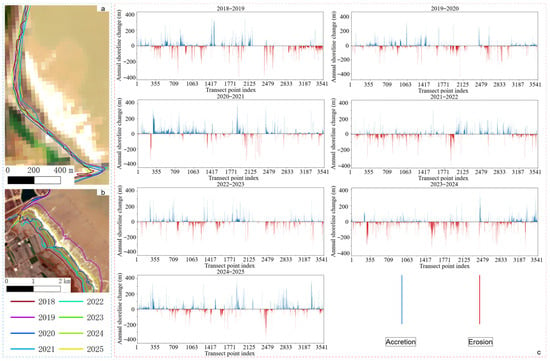
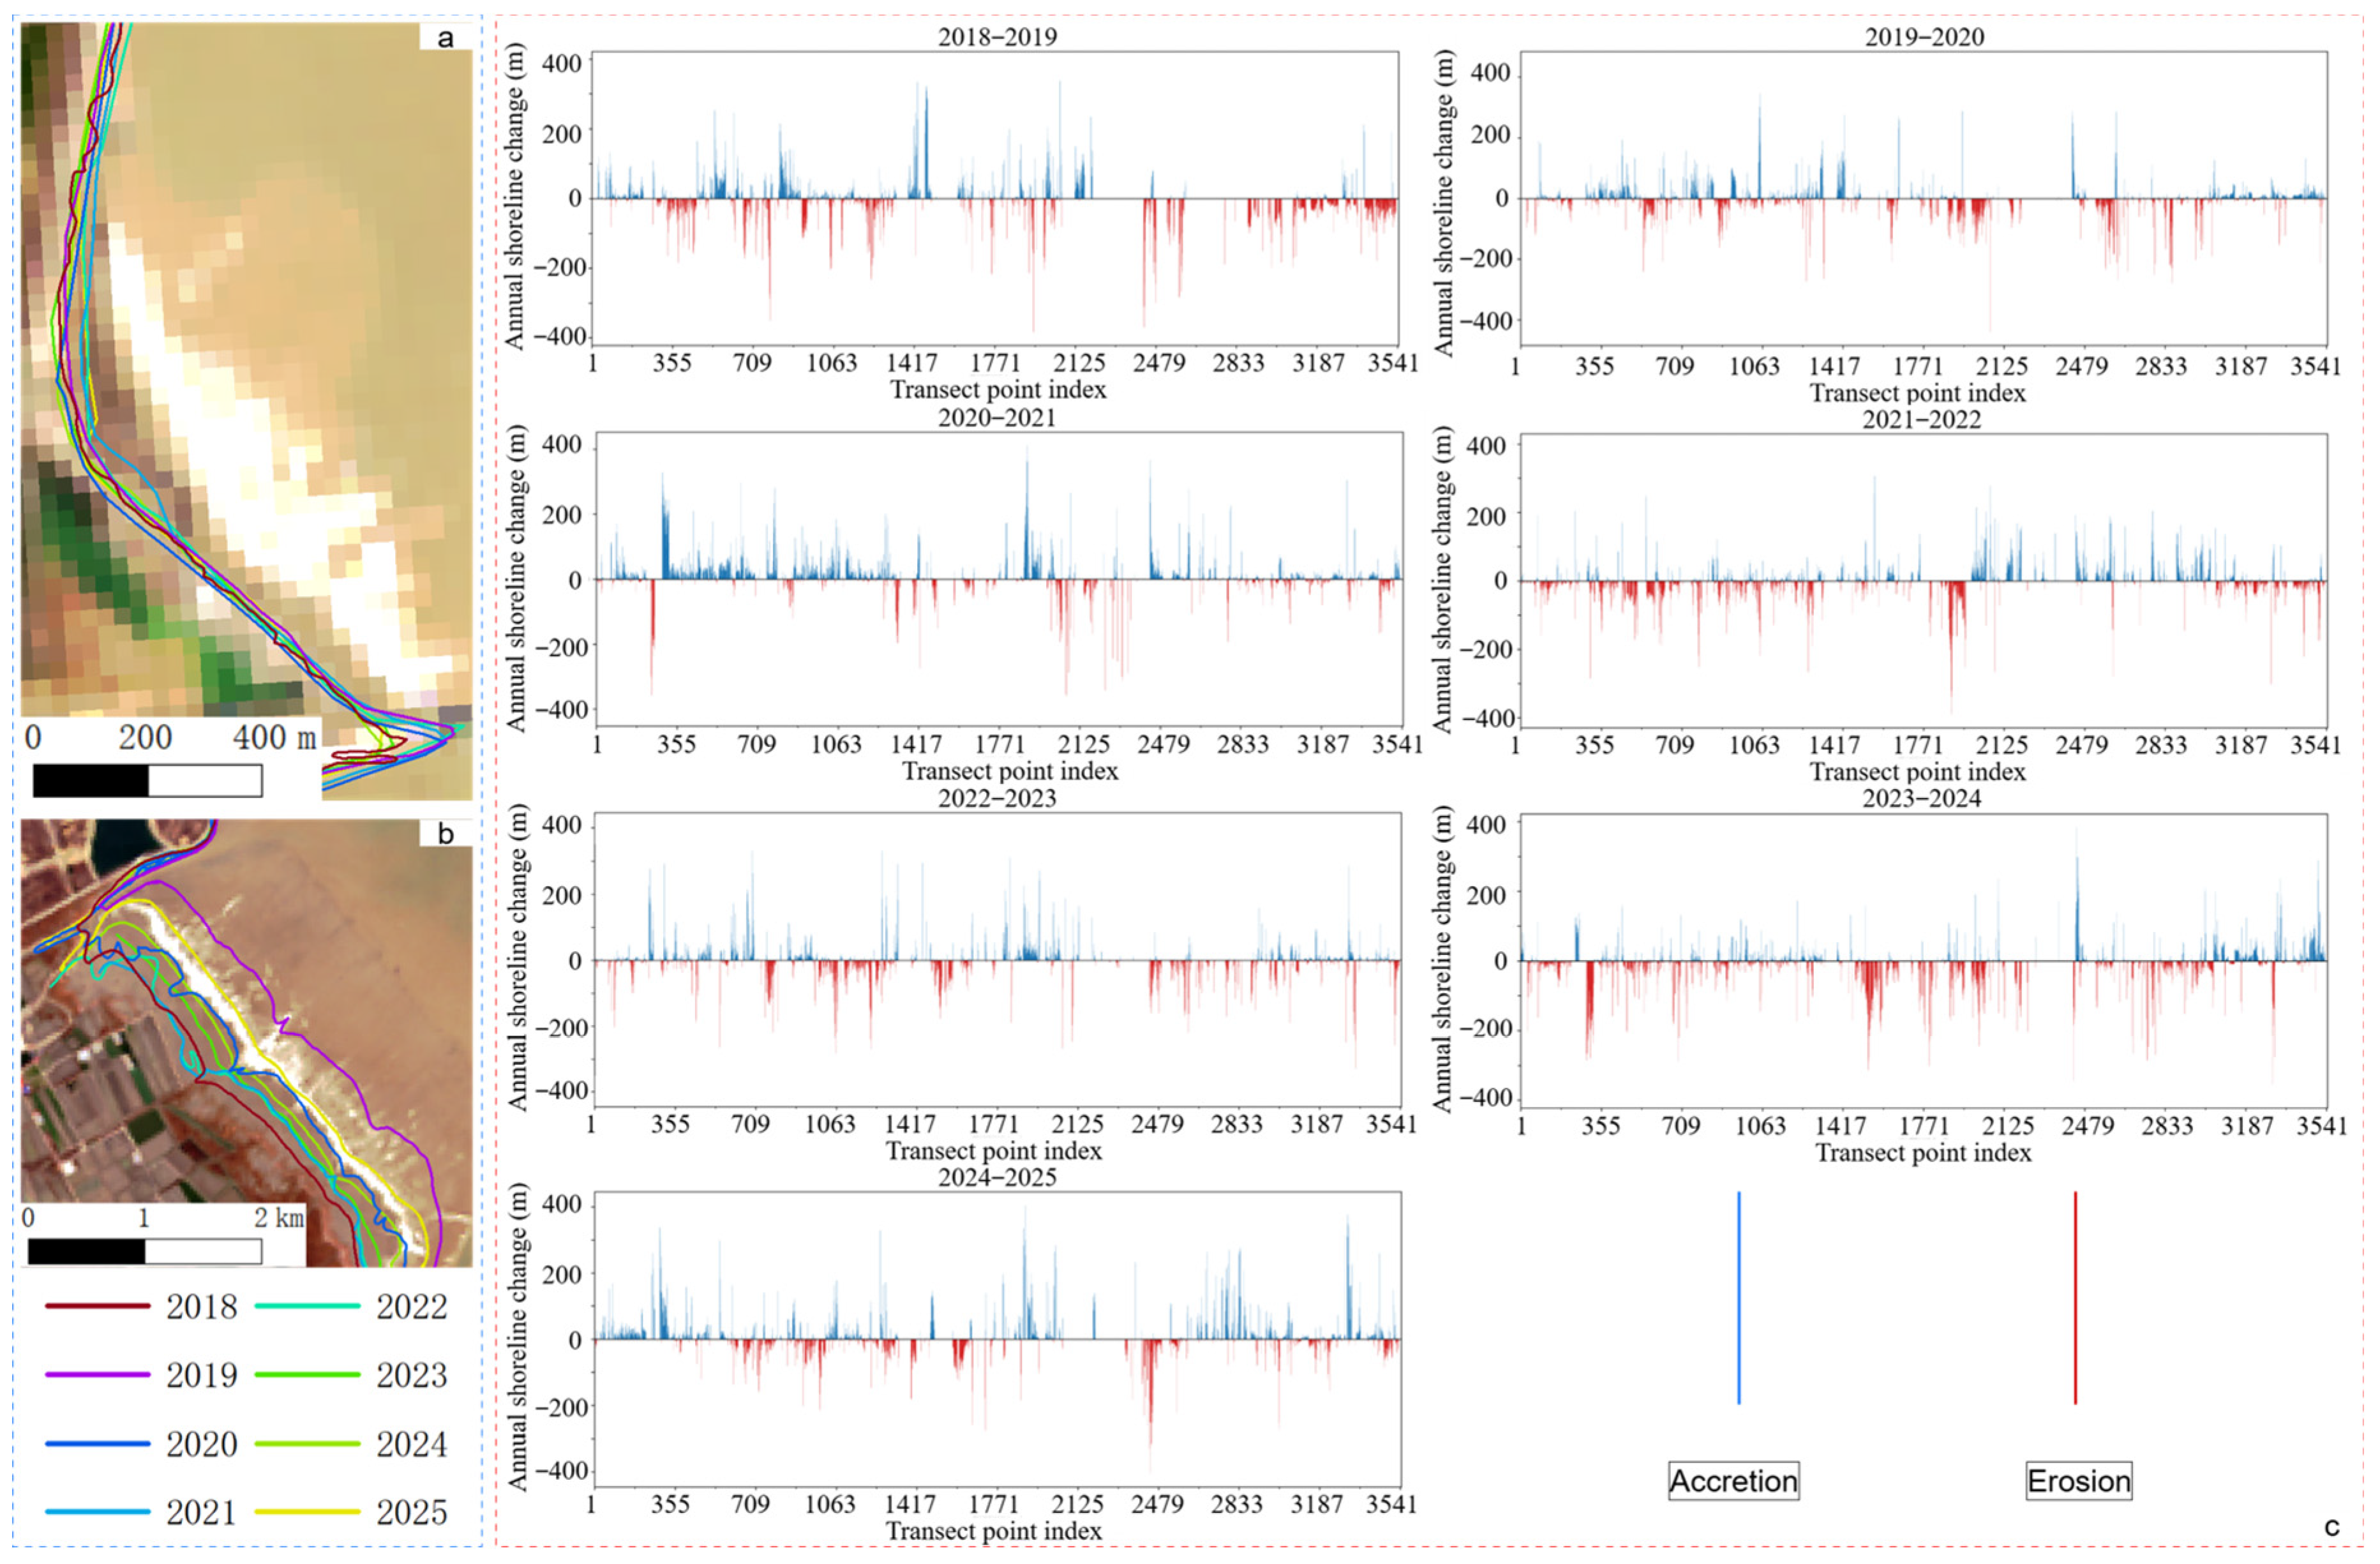
The transect-based method is applied to quantify spatial patterns of coastline accretion and erosion along the Jiangsu coast. A manually delineated baseline was first constructed landward of and approximately parallel to the general orientation of the coastline. Transects were then generated at 200 m intervals along this baseline, extending from the northernmost to the southernmost section of the Jiangsu coastline, oriented perpendicular to the local baseline direction to ensure consistent measurement of shoreline displacement. Intersection points between each transect and the eight extracted coastlines were identified, and the perpendicular distances from these points to the baseline were calculated to represent accretion or erosion distances from 2018 to 2025. In cases where multiple intersections occurred within a single transect—typically in complex coastal sections with offshore structures, tidal creeks, or small islands—only the landward-most intersection was retained to maintain a consistent land–sea boundary definition. The resulting measurements are summarized in Figure 6c and used to examine year-to-year variability in coastline change across the study area.
Figure 6.
Annual erosion and accretion distances along individual transects. (a,b) Most coastline transects exhibit alternating phases of erosion and accretion from 2018 to 2025. (c) Interannual changes in coastline position along all transects across Jiangsu Province, showing an overall pattern of erosion in the northern sections and accretion in the southern sections.
The results show that the Jiangsu coastline has undergone rapid and pronounced changes since 2018, characterized by the coexistence of significant accretion and erosion processes. The maximum accretion and erosion distances reach 410 m and 440 m, respectively, with mean annual accretion and erosion distances of 36 m and 38 m. These magnitudes reveal strong temporal variability in coastline position, suggesting that many coastal segments experience alternating phases of accretion and erosion rather than a unidirectional trend. Such cyclic behavior is further evidenced by regional differences through time; for instance, the northern coastline shows dominant accretion from 2018 to 2021, followed by a transition to erosion during the period from 2021 to 2024, highlighting the dynamic and nonstationary nature of coastal evolution along the Jiangsu coast, as illustrated in Figure 6a,b. Considering the average coastline extraction RMSE of 13.14 m, the estimated 95% positional uncertainty (25.8 m) remains lower than the mean annual accretion and erosion distances, suggesting that the observed coastline changes generally exceed the extraction uncertainty.
4. Discussion
4.1. Drivers and Interpretation of Coastline Change Trends
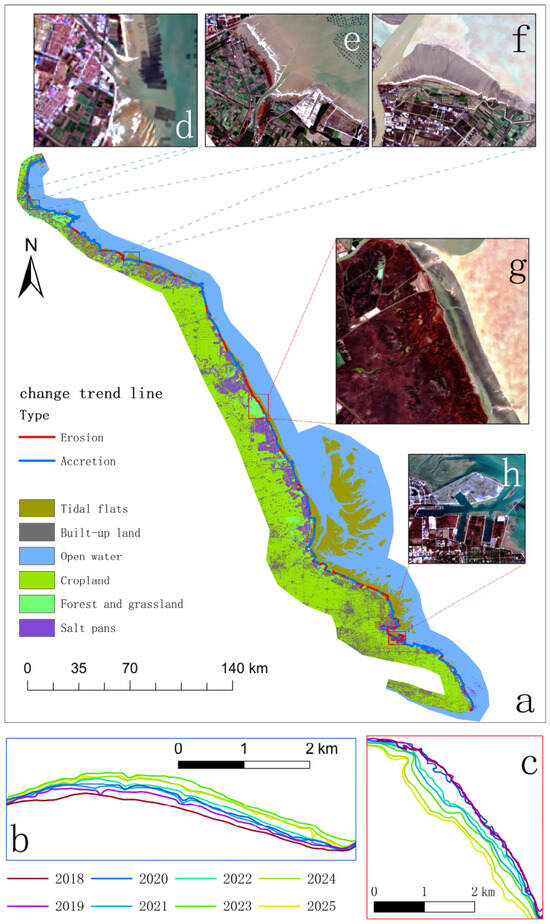
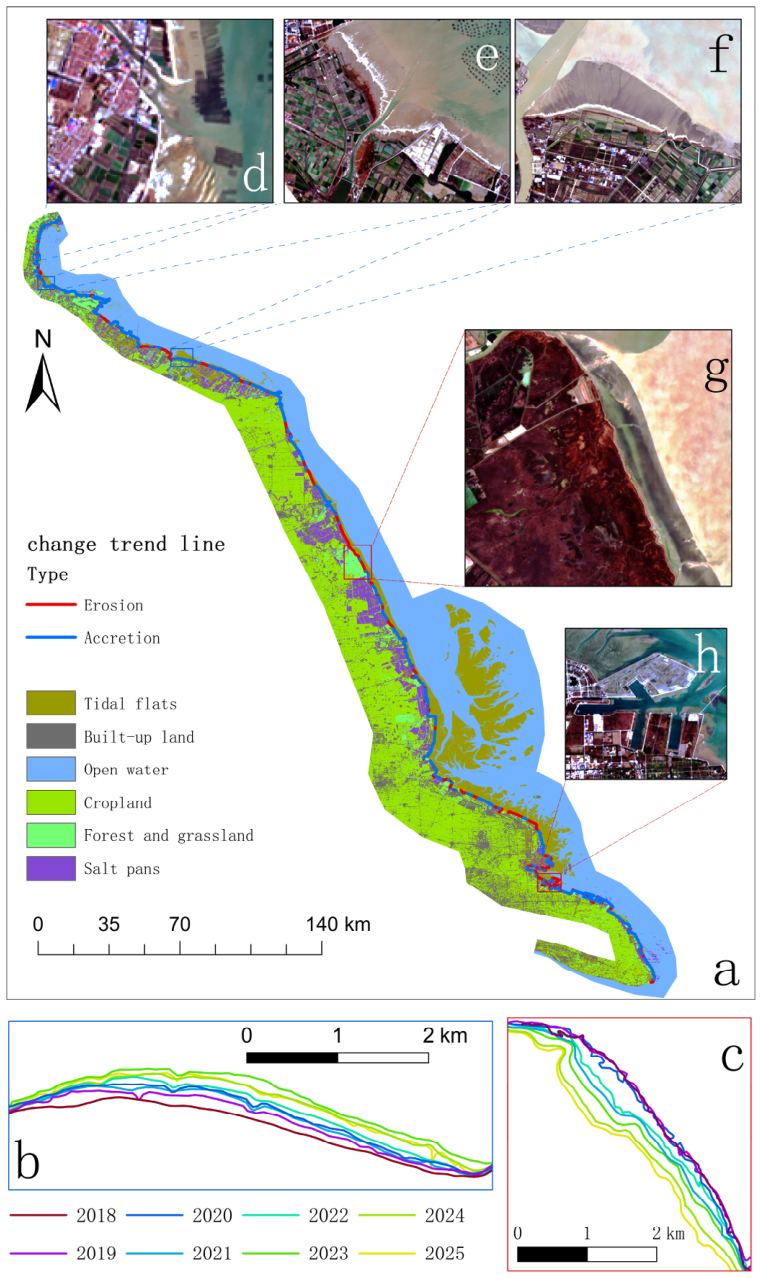
Linear regression analysis based on transect–coastline intersection positions reveals pronounced spatial heterogeneity in coastline change along the Jiangsu coast from 2018 to 2025 (Figure 7a). Overall, erosion is mainly concentrated in the northern coastal regions, whereas accretion is more prevalent in the southern sections. Nevertheless, at the provincial scale, erosion remains the dominant mode of coastline change, accounting for approximately 56.21% of the total coastline length. It is noteworthy that local-scale patterns do not entirely conform to the overall spatial trend. Significant accretion can still be observed in several northern river–sea interaction zones (blue boxes in Figure 7a; Figure 7b corresponding to Figure 7f), while localized erosion also occurs in parts of the southern coast, primarily distributed in forest- or grassland-dominated areas and regions adjacent to engineered coastlines and coastal infrastructure (red boxes in Figure 7a; Figure 7c corresponding to Figure 7g).
Figure 7.
Spatial distribution of coastline change trends. (a) Spatial patterns of coastline change trends along the Jiangsu coast, together with the distribution of coastal land cover types. (b) Interannual coastlines corresponding to area f in panel (a), showing a clear accretion trend. (c) Interannual coastlines corresponding to area g in panel (a), exhibiting pronounced erosion characteristics. Areas (d–f) in panel (a) indicate regions showing accretion features, whereas areas (g,h) indicate regions showing erosion features.
To further investigate the trends of coastline change, land cover classification derived from Landsat-8 OLI imagery was integrated with the coastline change results, as shown in Figure 7a. Figure 7a presents the land-cover classification for 2018, whereas the classification results for the other years are provided in Supplementary Materials S2. The classification results indicate that the Jiangsu coast is characterized by extensive tidal flats and predominantly engineered coastlines, forming a highly complex coastal system. Accretion-dominated areas are mainly distributed around certain estuaries, broad tidal flats, and aquaculture-related land-use regions such as salt pans and croplands. These areas generally exhibit relatively weak hydrodynamic conditions and enhanced sediment retention capacity, which favor coastline progradation. In contrast, erosion is more frequently observed in forest- or grassland-dominated regions and transitional zones between long-term exposed tidal flats and artificially protected coastlines. Such areas are more susceptible to localized scouring due to insufficient sediment supply and abrupt changes in local hydrodynamic conditions.
These results suggest that the spatiotemporal evolution of the Jiangsu coastline is jointly controlled by natural processes and human activities [37]. From the perspective of natural drivers, sediment supply from river estuaries, tidal dynamics, wave action, and sea-level rise collectively regulate coastal sediment transport and redistribution processes. Sea level along the China coast has shown a continuous rising trend in recent decades [38], while the extensive muddy tidal flats along the Jiangsu coast are highly sensitive to sea-level fluctuations, exhibiting strong tidal currents and frequent sediment resuspension processes that substantially influence coastline evolution [30]. In addition, accretion is mainly observed near the Yangtze River Estuary, whereas erosion is more evident near the abandoned Yellow River Delta. Although sediment discharge from the Yangtze River has decreased under the influence of upstream reservoir regulation in recent years [39], the estuary still provides abundant sediment input to the southern Jiangsu coast, thereby promoting tidal-flat development and coastline accretion. By contrast, after the historical northward shift in the Yellow River, sediment supply to the abandoned Yellow River Delta sharply declined. Combined with indirect anthropogenic disturbances, continuous wave and tidal actions have accelerated coastal erosion and tidal-flat degradation in this region [40].
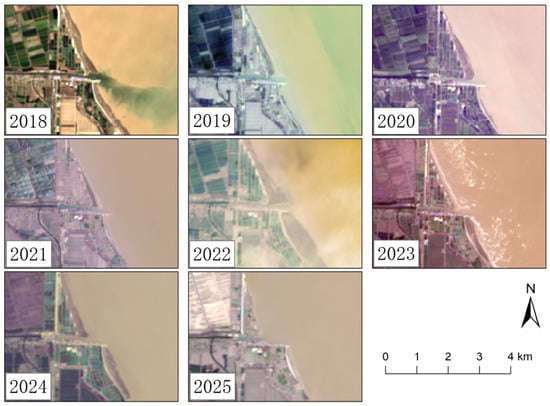
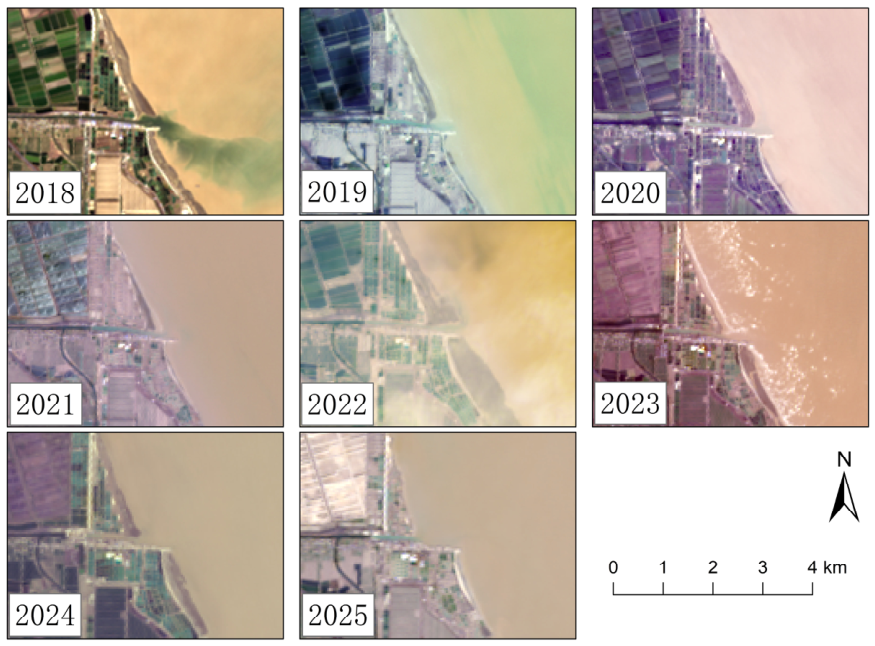
From the perspective of anthropogenic influences, reclamation projects, coastal protection engineering, and aquaculture activities have further altered nearshore hydrodynamic conditions and sediment transport pathways, thereby promoting local coastline stabilization or seaward expansion [41,42,43]. During 2018–2025, continuous coastal engineering activities were conducted along the Jiangsu coast, including port expansion, artificial revetment construction, and aquaculture pond enlargement. For example, the expansion of Lianyun Port, coastal development in Nantong, and aquaculture expansion in Yancheng may all modify local tidal current structures and sediment transport processes. Aquaculture ponds and reclamation areas tend to enhance sediment deposition, whereas seawalls, ports, and revetment structures may obstruct natural sediment exchange, resulting in localized erosion and scouring in adjacent regions. Furthermore, erosion hotspots are mainly concentrated near engineered coastlines and transitional zones between artificial coastlines and forest- or grassland-dominated areas, suggesting that human engineering activities may increase local coastal erosion risk. Although artificial seawalls, ports, and revetment structures can reduce local wave energy, they also modify nearshore tidal dynamics and sediment transport pathways. Abrupt hydrodynamic transitions near engineering boundaries can easily induce localized scouring. In addition, navigation channel dredging and port construction may reduce nearshore sediment supply, thereby intensifying erosion adjacent to engineered coastlines, particularly in the abandoned Yellow River Delta region (as shown in Figure 8).
Figure 8.
Coastline erosion phenomena in the abandoned Yellow River delta area (2018–2025), with a cumulative retreat of approximately 550 m over the study period.
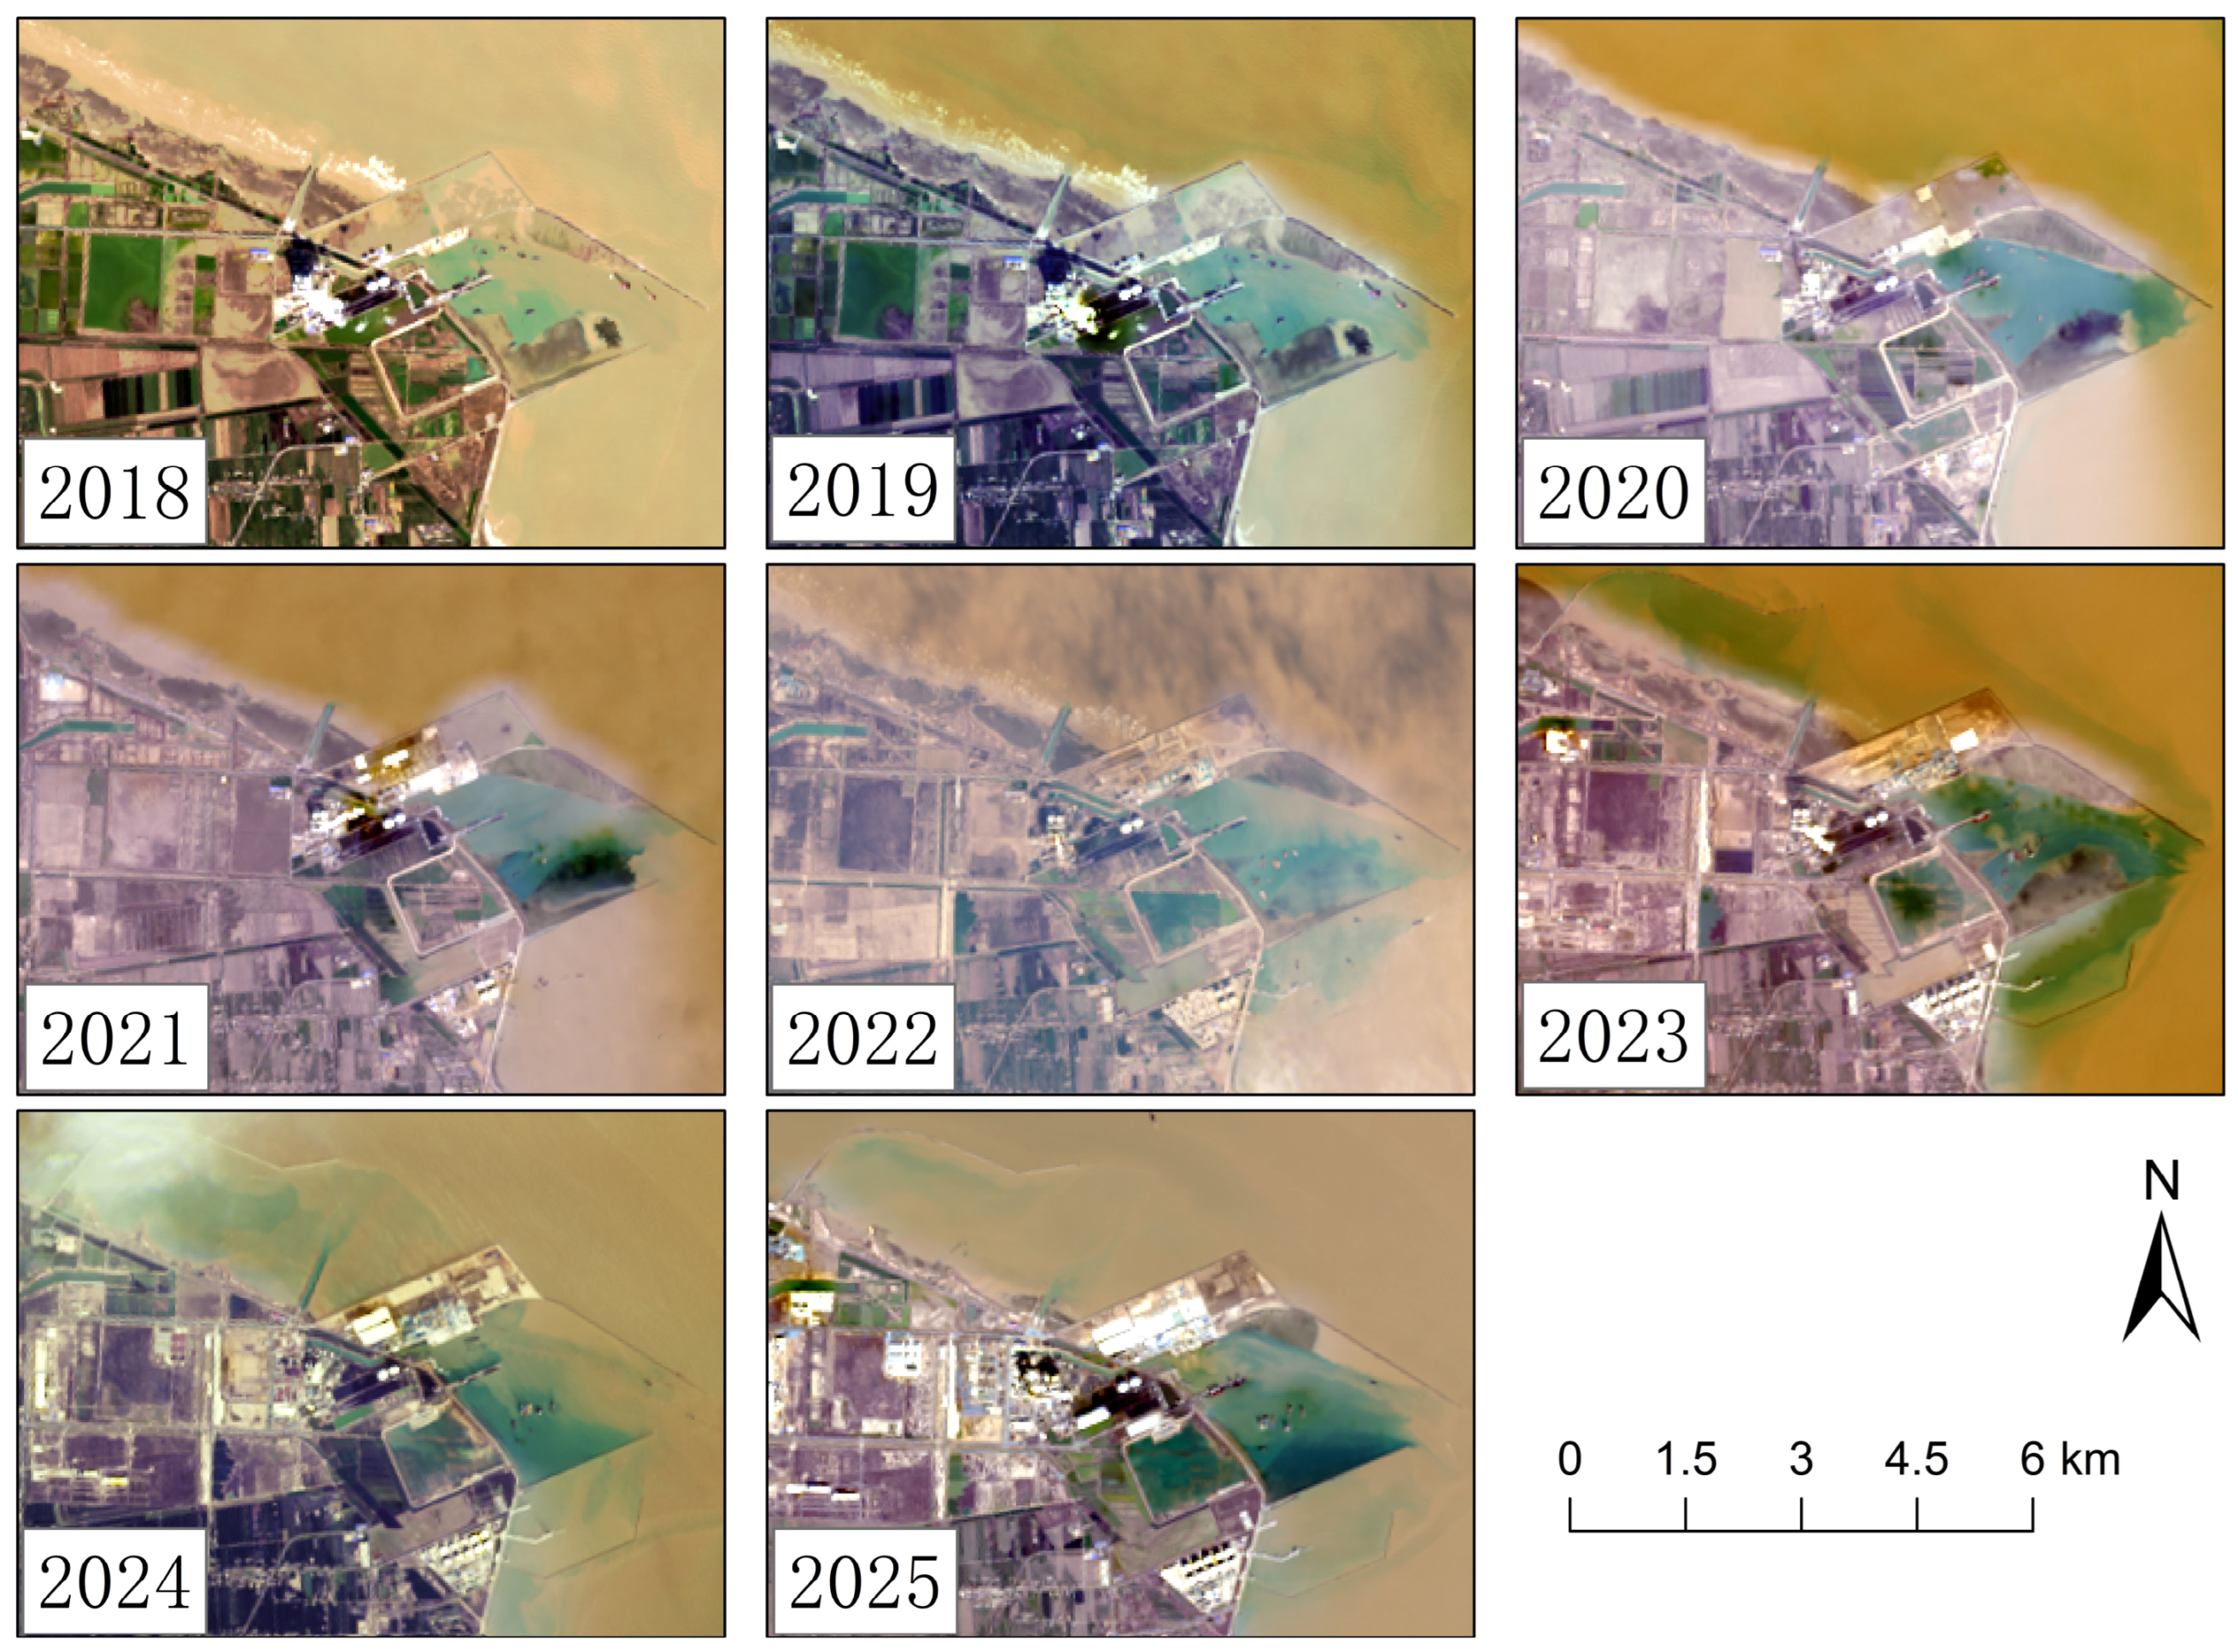
Beyond the spatial distribution of erosion and accretion, the temporal evolution of coastline morphology also reflects the combined influence of coastal engineering activities and management policies. The coastline length and fractal dimension exhibited a similar pattern during the study period, increasing from 2018 to 2022 and then declining after 2022. Specifically, coastline length increased from 1004.99 km in 2018 to 1079.84 km in 2022, accompanied by a corresponding increase in fractal dimension, indicating a progressive increase in coastline complexity. This trend is associated with the continued implementation of coastal infrastructure projects that had been approved before the nationwide reclamation restrictions introduced in 2018. Large-scale engineering activities, including the expansion of Dafeng Port, Yangkou Port, Binhai Port (Figure 9), and associated coastal industrial zones, continued during the early years of the study period and contributed to local seaward coastline advancement. In addition, artificial structures such as breakwaters, seawalls, and port facilities increased coastline irregularity and geometric complexity, resulting in higher fractal dimension values.
Figure 9.
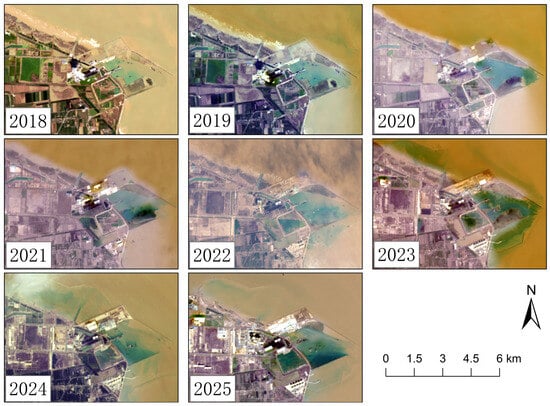
Coastline changes at Binhai Port, Jiangsu Province (2018–2025).
After 2022, however, both coastline length and fractal dimension showed a declining trend. This transition reflects the combined effects of intensified coastal erosion and the gradual implementation of stricter coastal management policies. According to official coastal monitoring reports and the findings of this study, erosion along the Jiangsu coast has expanded considerably in recent years, particularly in the abandoned Yellow River Delta region, where sediment supply has remained limited since the historical northward diversion of the Yellow River. Under the combined influence of sea-level rise, wave action, and reduced sediment availability, coastal retreat has accelerated in several sections of the northern coast. Meanwhile, the long-term effects of reclamation control policies and ecological restoration programs, including wetland restoration, aquaculture pond removal, and Spartina alterniflora management, have reduced large-scale artificial coastline expansion. These processes collectively contributed to coastline retreat and the simplification of coastline morphology during the later stage of the study period. Overall, the synchronous variations in coastline length and fractal dimension suggest that engineering-driven coastline expansion tends to increase geometric complexity, whereas erosion and ecological restoration generally promote coastline smoothing and length reduction.
This study also found that coastline smoothing processing may influence fractal dimension results. Comparative experiments indicate that excessive Savitzky–Golay smoothing weakens local sinuosity characteristics of the coastline, thereby reducing the fractal dimension and resulting in lower coastline complexity and shorter coastline length. This is mainly because numerous fine-scale tidal creeks and boundary irregularities in muddy tidal-flat coasts are suppressed during over-smoothing. Nevertheless, all coastlines in this study were processed using the same smoothing scale and parameter settings; therefore, coastline length and fractal dimension among different years remain comparable, and the influence on the overall temporal evolution analysis is relatively limited.
In addition, the accuracy assessment results reveal significant differences in error levels among different coastline types. In particular, RMSE values in sandy beach areas are noticeably higher than those in engineered coastlines and relatively stable tidal-flat regions [44,45]. This is primarily because coastline positions on sandy beaches are strongly affected by tides, waves, and instantaneous hydrodynamic conditions, resulting in a wider range of coastline movement and stronger spatiotemporal variability. Consequently, even under similar image conditions, coastline positions in beach areas may still fluctuate considerably, leading to larger spatial positioning errors. This phenomenon suggests that for highly dynamic beach coasts, uncertainties remain when relying solely on coastline positions extracted from single-temporal imagery.
4.2. Methodological Limitations
Although the annual MSIC method proposed in this study can reduce the influence of tidal variability on coastline extraction to a certain extent, several limitations still remain. The annual maximum spectral index composite does not necessarily correspond to the actual highest water-level condition. Due to the limited revisit frequency of Sentinel-2 imagery, as well as the influence of cloud contamination, image gaps, and temporal differences in observations, valid images acquired under high-tide conditions may not always be available in some regions, thereby introducing uncertainties into the extraction results. This limitation is particularly evident in areas with complex tidal-flat morphology, where rapid transitions among tidal creeks, water bodies, and exposed tidal flats may further increase coastline identification errors. Such uncertainties may partly contribute to the relatively high coastline change rate observed during 2018–2019, particularly in highly dynamic tidal-flat environments.
To further evaluate whether the proposed MSIC framework can effectively represent coastline positions under near-maximum water-level conditions, the extracted 2023 coastline was compared with the publicly available S2Coast-2023 dataset [46], which represents the first global 10m coastline product derived from annual Sentinel-2 composite imagery. Because both approaches rely on multi-temporal image compositing to reduce tidal effects without explicit tidal correction, S2Coast provides an independent benchmark for assessing the reliability of the MSIC-derived coastline. The comparison yielded an RMSE of 15.66 m and a MADE of 13.51 m, indicating good agreement between the two coastline products. Nevertheless, localized discrepancies remain in highly dynamic tidal-flat environments, where coastline positions are strongly influenced by tidal-creek migration, sediment redistribution, and short-term geomorphological adjustments.
Furthermore, the S2Coast-2023 dataset was used to quantitatively evaluate the region-specific spectral index selection strategy adopted in this study. Representative coastline sections corresponding to tidal flats, artificial structures, and sandy beaches were selected, and coastlines were independently extracted using NDWI-, MNDWI-, and NDVI-based MSIC. For each coastal type, the 2023 coastlines extracted using different spectral indices were compared with the corresponding S2Coast-2023 coastline using RMSE and MADE metrics. As shown in Table 4, the quantitative results are consistent with the qualitative observations summarized in Table 1. NDVI achieved the highest accuracy in vegetated tidal-flat environments, indicating superior capability in delineating vegetation–water boundaries. MNDWI produced the lowest errors along engineered and highly turbid coastlines, benefiting from the strong water absorption characteristics of the SWIR band. In contrast, NDWI performed best in sandy beach environments, where its finer spatial resolution preserved coastline details more effectively. Although the differences among the three indices were relatively small in some coastal settings, the results consistently identified the same optimal index for each coastline type, providing quantitative support for the region-specific index selection strategy adopted in this study.
Table 4.
RMSE and MADE comparison of different spectral indices across representative coastline types.
In this study, NDWI and NDVI were calculated using 10 m spatial resolution bands, whereas MNDWI employed the SWIR band with a spatial resolution of 20 m. Differences in spatial resolution may lead to inconsistencies in coastline positioning results, especially in regions characterized by sharp coastline gradients, complex boundary details, or dense artificial structures. Compared with the 10 m resolution results, the 20 m resolution tends to produce smoother coastline boundaries, thereby affecting local extraction accuracy. In addition, the Landsat-8 OLI imagery used for land cover classification has a spatial resolution of 30 m, which introduces a spatial scale discrepancy relative to the 20 m coastline extraction results and may further influence the interpretation and analysis of coastline dynamics.
The OTSU threshold segmentation method is primarily based on global grayscale statistical characteristics and does not fully consider the spatial heterogeneity of suspended sediment concentration, tidal-flat moisture, and turbid water conditions along the Jiangsu coast [47]. Consequently, local misclassification is more likely to occur in estuarine zones, aquaculture areas, and highly turbid waters. In particular, in regions with strong tidal-flat moisture variability, the spectral contrast between exposed tidal flats and shallow water areas may become weakened, thereby increasing coastline extraction uncertainty.
5. Conclusions
This study developed a tide-independent coastline extraction framework based on multi-temporal Sentinel-2 spectral index compositing and applied it to analyze the spatiotemporal evolution of the Jiangsu coastline from 2018 to 2025. By separately applying NDWI, MNDWI, and NDVI to sandy beaches, artificial structures, and tidal flats, respectively, and selecting annual maximum water-related spectral responses, the extracted coastlines effectively represent the land–sea boundary under high-water conditions without explicit tidal correction. This strategy reduces the sensitivity of coastline position to instantaneous tidal stages and mitigates misclassification issues commonly encountered in muddy, tidal-flat-dominated coastal environments, thereby improving computational efficiency and temporal consistency for large-scale, short-term coastline monitoring.
Based on the extracted coastlines, coastline dynamics were quantified using a combination of transect-based analysis and fractal dimension metrics. The results indicate that the total coastline length remained relatively stable during the study period, with variations within 5%, reaching a maximum of 1079.84 km in 2022 and a minimum of approximately 1004.99 km in 2018. Coastline change was dominated by erosion, accounting for 56.21% of the total coastline length, although significant local accretion and erosion were observed, with maximum distances of 410 m and 440 m, respectively. Spatially, erosion prevailed in the northern coastal sections, whereas accretion was more common in the southern regions.
Further analysis incorporating land cover classification reveals that coastline change is strongly associated with nearshore surface characteristics. Accretion-dominated segments are mainly distributed near river estuaries and aquaculture-related areas, while erosion is more frequently observed at the interfaces between forested or grass-covered land and artificially protected coastlines. These patterns highlight the combined influence of sediment supply, hydrodynamic conditions, and human activities on coastline evolution along the Jiangsu coast.
Overall, this study demonstrates the reliability of the proposed tide-independent approach for extracting high-water-level coastlines in macro-tidal muddy environments, and confirms that both human activities—including port construction, reclamation, and ecological restoration—and natural processes—such as sediment starvation and intensified wave erosion in the abandoned Yellow River Delta—have jointly shaped the recent spatiotemporal dynamics of the Jiangsu coastline. The proposed framework provides a robust and efficient tool for analyzing coastline change, and the findings offer valuable insights into coastal management, environmental protection, and short-term monitoring efforts in similar coastal settings.
Supplementary Materials
The following supporting information can be downloaded at: https://www.mdpi.com/article/10.3390/rs18121962/s1.
Author Contributions
Conceptualization, G.L., D.T. and D.G.; methodology, G.L., D.T. and D.G.; software, G.L., D.T. and D.G.; validation, G.L., D.T. and D.G.; formal analysis, G.L., D.T., D.G. and M.L.; investigation, G.L., D.T. and D.G.; resources, G.L., D.T., D.G., M.L. and W.J.; data curation, G.L., D.T. and D.G.; writing—original draft preparation, G.L.; writing—review and editing, D.T., D.G. and M.L.; visualization, G.L., D.T. and D.G.; supervision, D.T., D.G. and M.L.; project administration, D.T. and D.G.; funding acquisition, W.J. All authors have read and agreed to the published version of the manuscript.
Funding
This research was supported by the Jiangsu Provincial Department of Natural Resources through the Jiangsu Natural Resources Science and Technology Project (Grant No. JSZRKJ202406) and the Open Fund of the Key Laboratory of Natural Resources Monitoring, Jiangsu Provincial Department of Natural Resources (Grant No. JSNRM-2025B10).
Data Availability Statement
The Sentinel-2 and Landsat 8 imagery used in this study are publicly available via the Google Earth Engine platform (https://earthengine.google.com/) and the USGS EarthExplorer website (https://earthexplorer.usgs.gov/). The coastline data and processing code used in this study are available from the authors upon reasonable request.
Acknowledgments
The authors gratefully acknowledge the European Space Agency (ESA) Copernicus Programme for providing the Sentinel-2 satellite imagery, and the United States Geological Survey (USGS) and NASA for providing Landsat 8 data. We also extend our gratitude to Google for providing the Google Earth Engine (GEE) platform, which greatly facilitated the efficient data acquisition and large-scale computational processing required for this study.
Conflicts of Interest
The authors declare no conflicts of interest. The funders had no role in the design of the study; in the collection, analyses, or interpretation of data; in the writing of the manuscript; or in the decision to publish the results.
References
- Luijendijk, A.; Hagenaars, G.; Ranasinghe, R.; Baart, F.; Donchyts, G.; Aarninkhof, S. The State of the World’s Beaches. Sci. Rep. 2018, 8, 6641. [Google Scholar] [CrossRef] [Scilit]
- Nienhuis, J.H.; Ashton, A.D.; Edmonds, D.A.; Hoitink, A.J.F.; Kettner, A.J.; Rowland, J.C.; Törnqvist, T.E. Global-scale human impact on delta morphology has led to net land area gain. Nature 2020, 577, 514–518. [Google Scholar] [CrossRef] [Scilit] [PubMed]
- Tebaldi, C.; Ranasinghe, R.; Vousdoukas, M.; Rasmussen, D.J.; Vega-Westhoff, B.; Kirezci, E.; Kopp, R.E.; Sriver, R.; Mentaschi, L. Extreme sea levels at different global warming levels. Nat. Clim. Change 2021, 11, 746–751. [Google Scholar] [CrossRef] [Scilit]
- Xu, N.; Gong, P. Significant coastline changes in China during 1991–2015 tracked by Landsat data. Sci. Bull. 2018, 63, 883–886. [Google Scholar] [CrossRef] [Scilit] [PubMed]
- Sengupta, D.; Choi, Y.R.; Tian, B.; Brown, S.; Meadows, M.; Hackney, C.R.; Banerjee, A.; Li, Y.; Chen, R.; Zhou, Y. Mapping 21st century global coastal land reclamation. Earth’s Future 2023, 11, e2022EF002927. [Google Scholar] [CrossRef] [Scilit]
- Leuven, J.R.; Pierik, H.J.; Vegt, M.V.D.; Bouma, T.J.; Kleinhans, M.G. Sea-level-rise-induced threats depend on the size of tide-influenced estuaries worldwide. Nat. Clim. Change 2019, 9, 986–992. [Google Scholar] [CrossRef] [Scilit]
- Kytt, M.; Deborah, B.; Hasim, E.; Gordon, M.; Rya, I. Estimating population and urban areas at risk of coastal hazards, 1990–2015: How data choices matter. Earth Syst. Sci. Data 2021, 13, 5747–5801. [Google Scholar] [CrossRef] [Scilit]
- Wu, Y.; Liu, Z. Research progress on methods of automatic coastline extraction based on remote sensing images. J. Remote Sens. 2019, 23, 582–602. [Google Scholar] [CrossRef] [Scilit]
- O’Neill, A.C.; Batiste, S.F.; Buscombe, D.D.; Burgess, J.; Doran, K.S.; Gibbs, A.E.; Henderson, R.E.; Heslin, J.L.; Janda, C.N.; Lundine, M.A. Comparisons of Shoreline Positions from Satellite-Derived and Traditional Field-and Remote-Sensing Techniques; 2331-1258; US Geological Survey: Reston, VA, USA, 2025. [Google Scholar] [CrossRef] [Scilit]
- Fabris, M.; Balin, M.; Monego, M. High-resolution real-time coastline detection using GNSS RTK, optical, and thermal SfM photogrammetric data in the Po River delta, Italy. Remote Sens. 2023, 15, 5354. [Google Scholar] [CrossRef] [Scilit]
- Sbai, A.; Mouadili, O.; Benrbia, K.; Hlal, M.; Amghar, A. Contribution of GPS and GIS in the Study of the Dynamics of the Coastline and the Mouth of the Moulouya (Northeast Morocco). In E3S Web of Conferences; EDP Sciences: Les Ulis, France, 2025; p. 03006. [Google Scholar]
- Pardo-Pascual, J.E.; Almonacid-Caballer, J.; Ruiz, L.A.; Palomar-Vázquez, J. Automatic extraction of shorelines from Landsat TM and ETM+ multi-temporal images with subpixel precision. Remote Sens. Environ. 2012, 123, 1–11. [Google Scholar] [CrossRef] [Scilit]
- Karantzalos, K.; Argialas, D.; Georgopoulos, A. Towards automatic detection of coastlines from satellite imagery. In 2002 14th International Conference on Digital Signal Processing Proceedings. DSP 2002 (Cat. No. 02TH8628); IEEE: New York, NY, USA, 2002; pp. 897–900. [Google Scholar]
- Zhan, Y.; Zhu, L.; Sun, Y.; Su, X.; Hou, H. Automatic extraction of coastline via spectral angle-distance similarity growth model. J. Remote Sens. 2017, 21, 458–469. [Google Scholar] [CrossRef] [Scilit]
- Jia, M.; Liu, D.; Wang, Z.; Tang, X.; Dong, Z. Coastline changes in Hangzhou Bay based on object-oriented method using multi-source remote sensing data. J. Geo-Inf. Sci. 2013, 15, 262–269. [Google Scholar] [CrossRef] [Scilit]
- Xu-kai, Z.; Qiong-qiong, L.; Baig, M.H.A. Automated detection of coastline using Landsat TM based on water index and edge detection methods. In 2012 Second International Workshop on Earth Observation and Remote Sensing Applications; IEEE: New York, NY, USA, 2012; pp. 153–156. [Google Scholar]
- Seale, C.; Redfern, T.; Chatfield, P.; Luo, C.; Dempsey, K. Coastline detection in satellite imagery: A deep learning approach on new benchmark data. Remote Sens. Environ. 2022, 278, 113044. [Google Scholar] [CrossRef] [Scilit]
- Konstantinou, A.; Scott, T.; Masselink, G.; Stokes, K.; Conley, D.; Castelle, B. Satellite-based shoreline detection along high-energy macrotidal coasts and influence of beach state. Mar. Geol. 2023, 462, 107082. [Google Scholar] [CrossRef] [Scilit]
- Angelini, R.; Di Ciaccio, F.; Angelats, E.; Ribas, F.; Luzi, G.; Masiero, A. Evaluating tidal and wave corrections on shoreline extraction from satellite imagery in Mediterranean microtidal beaches. In 2024 IEEE International Workshop on Metrology for the Sea; Learning to Measure Sea Health Parameters (MetroSea); IEEE: New York, NY, USA, 2024; pp. 347–352. [Google Scholar]
- Chen, W.-W.; Chang, H.-K. Estimation of shoreline position and change from satellite images considering tidal variation. Estuar. Coast. Shelf Sci. 2009, 84, 54–60. [Google Scholar] [CrossRef] [Scilit]
- Liu, Y.; Huang, H.; Qiu, Z.; Fan, J. Detecting coastline change from satellite images based on beach slope estimation in a tidal flat. Int. J. Appl. Earth Obs. Geoinf. 2013, 23, 165–176. [Google Scholar] [CrossRef] [Scilit]
- Xukai, Z.; Xia, Z.; Banghui, Y.; Zhi, Z.; Kun, S. Coastline extraction using remote sensing based on coastal type and tidal correction. Remote Sens. Land Resour. 2013, 25, 91–97. [Google Scholar] [CrossRef]
- Bishop-Taylor, R.; Nanson, R.; Sagar, S.; Lymburner, L. Mapping Australia’s dynamic coastline at mean sea level using three decades of Landsat imagery. Remote Sens. Environ. 2021, 267, 112734. [Google Scholar] [CrossRef] [Scilit]
- Sun, M.; Feng, W.; Wang, X.; Xu, N.; Peng, F.; Chen, X.; An, D.; Fenoglio, L.; Yang, M.; Zhong, M. Deriving intertidal topography from SWOT data and Sentinel-2 data. Geophys. Res. Lett. 2025, 52, e2025GL117329. [Google Scholar] [CrossRef] [Scilit]
- Christofi, D.; Mettas, C.; Evagorou, E.; Stylianou, N.; Eliades, M.; Theocharidis, C.; Chatzipavlis, A.; Hasiotis, T.; Hadjimitsis, D. A review of open remote sensing data with GIS, AI, and UAV support for shoreline detection and coastal erosion monitoring. Appl. Sci. 2025, 15, 4771. [Google Scholar] [CrossRef] [Scilit]
- Liu, C.; Zhang, Z.; Zhang, X.; Ren, H.; Liu, B.; Bao, Z.; Xiaoxiang, Z. Coastal development history and tidal flat ecosystem conservation along the coast of Jiangsu Province, China. J. Coast. Conserv. 2019, 23, 857–867. [Google Scholar] [CrossRef] [Scilit]
- Zhang, R. 苏北黄河三角洲及滨海平原的成陆过程 [The formation process of the abandoned Yellow River Delta and coastal plain in northern Jiangsu]. Acta Geogr. Sin. 1984, 2, 173–184. (In Chinese) [Google Scholar]
- Zhang, L.; Chen, S.; Liu, X. 800年来苏北废黄河三角洲的演变模式 [Evolution model of the abandoned Yellow River Delta in northern Jiangsu over the past 800 years]. Oceanol. Limnol. Sin. 2014, 45, 626–636. (In Chinese) [Google Scholar]
- Su, M.; Yao, P.; Wang, Z.B.; Zhang, C.K.; Stive, M.J.F. Exploratory morphodynamic modeling of the evolution of the Jiangsu coast, China, since 1855: Contributions of old Yellow River-derived sediment. Mar. Geol. 2017, 390, 306–320. [Google Scholar] [CrossRef] [Scilit]
- Zhu, S.; Gao, S.; Li, M.; Wang, Y.P. Evolution Modeling and Protection Scheme for Tidal Flats Under Natural Change and Human Pressure, Central Jiangsu Coast. Earth’s Future 2024, 12, e2023EF003913. [Google Scholar] [CrossRef] [Scilit]
- Yu, Q.; Wang, Y.; Shi, B.; Wang, Y.P.; Gao, S. Physical and sedimentary processes on the tidal flat of central Jiangsu Coast, China: Headland induced tidal eddies and benthic fluid mud layers. Cont. Shelf Res. 2017, 133, 26–36. [Google Scholar] [CrossRef] [Scilit]
- Kuai, Y.; Tao, J.; Zhou, Z.; Aarninkhof, S.; Wang, Z.B. Sediment Characteristics and Intertidal Beach Slopes along the Jiangsu Coast, China. J. Mar. Sci. Eng. 2021, 9, 347. [Google Scholar] [CrossRef] [Scilit]
- Yang, G.; Huang, K.; Zhu, L.; Sun, W.; Chen, C.; Meng, X.; Wang, L.; Ge, Y. Spatio-temporal changes in China’s mainland shorelines over 30 years using Landsat time series data (1990–2019). Earth Syst. Sci. Data 2024, 16, 5311–5331. [Google Scholar] [CrossRef] [Scilit]
- Boak, E.H.; Turner, I.L. Shoreline definition and detection: A review. J. Coast. Res. 2005, 21, 688–703. [Google Scholar] [CrossRef] [Scilit]
- Hu, X.; Wang, Y. Coastline Fractal Dimension of Mainland, Island, and Estuaries Using Multi-temporal Landsat Remote Sensing Data from 1978 to 2018: A Case Study of the Pearl River Estuary Area. Remote Sens. 2020, 12, 2482. [Google Scholar] [CrossRef] [Scilit]
- Li, Y.; Li, J.; Lu, Y. A fuzzy segmentation-based approach to extraction of coastlines from IKONOS imagery. Geomatica 2008, 62, 407–417. [Google Scholar] [CrossRef]
- Shen, Z.; Wang, C.; Chen, H.; Zhang, Z.; Wang, B.; Xia, Y.; Zhang, Q.; Wu, X.; Li, Q.; Peng, T. Spatiotemporal evolution of typical silt-muddy coastlines and tidal flats and their response to human activities: A case study of the Yancheng Coast, China. Ocean Coast. Manag. 2025, 269, 107851. [Google Scholar] [CrossRef] [Scilit]
- Wang, H.; Li, W.; Xiang, W. Sea level rise along China coast in the last 60 years. Acta Oceanol. Sin. 2022, 41, 18–26. [Google Scholar] [CrossRef] [Scilit]
- Xie, Q.; Yang, J.; Lundström, T.S. Sediment and morphological changes along Yangtze River’s 500 km between Datong and Xuliujing before and after Three Gorges Dam commissioning. Sci. Rep. 2021, 11, 13662. [Google Scholar] [CrossRef] [Scilit]
- Zhang, Z.; Zhou, K.; Chen, P. Muti-indicator integrated assessment of coastal erosion vulnerablity in the Abandoned Yellow River Delta using geospatial approaches. Front. Mar. Sci. 2025, 12, 1540760. [Google Scholar] [CrossRef] [Scilit]
- Han, X.; Fan, D.; Huang, J.; Tu, J.; Meng, L.; Chen, S. Cumulative impact of human activities on hydro-sediment dynamics and morphodynamics in the highly altered Yangtze Estuary. J. Hydrol. 2025, 651, 132625. [Google Scholar] [CrossRef] [Scilit]
- Kang, Y.; Lei, J.; Wang, M.; Li, G.; Ding, X. Topographic evolution of tidal flats based on remote sensing: An example in Jiangsu coast, Southern Yellow Sea. Front. Mar. Sci. 2023, 10, 1163302. [Google Scholar] [CrossRef] [Scilit]
- Yao, H.; Li, M.; Liu, X.; Li, W.; Song, Y.; Chen, J.; Liu, Y.; Zeng, J.; Roos, P.C. Joint effect of aquaculture and land reclamation on sediment dynamics. J. Hydrol. Reg. Stud. 2025, 60, 102561. [Google Scholar] [CrossRef] [Scilit]
- Vos, K.; Splinter, K.D.; Palomar-Vázquez, J.; Pardo-Pascual, J.E.; Almonacid-Caballer, J.; Cabezas-Rabadán, C.; Kras, E.C.; Luijendijk, A.P.; Calkoen, F.; Almeida, L.P.; et al. Benchmarking satellite-derived shoreline mapping algorithms. Commun. Earth Environ. 2023, 4, 345. [Google Scholar] [CrossRef] [Scilit]
- Pardo-Pascual, J.E.; Almonacid-Caballer, J.; Cabezas-Rabadán, C.; Fernández-Sarría, A.; Armaroli, C.; Ciavola, P.; Montes, J.; Souto-Ceccon, P.E.; Palomar-Vázquez, J. Assessment of satellite-derived shorelines automatically extracted from Sentinel-2 imagery using SAET. Coast. Eng. 2024, 188, 104426. [Google Scholar] [CrossRef] [Scilit]
- Duan, Y.; Sanchez-Azofeifa, A.; Chen, C.; Tian, B.; Li, X.; Sengupta, D.; Zhou, Y. S2Coast-2023: The first global 10-meter resolution coastline dataset derived from enhanced Sentinel-2 composite imagery using Google Earth Engine. Remote Sens. Environ. 2026, 334, 115186. [Google Scholar] [CrossRef] [Scilit]
- Xing, F.; Wang, Y.P.; Jia, J. Hydrodynamics and sediment transport patterns on intertidal flats along middle Jiangsu coast. Anthr. Coasts 2022, 5, 12. [Google Scholar] [CrossRef] [Scilit]

Disclaimer/Publisher’s Note: The statements, opinions and data contained in all publications are solely those of the individual author(s) and contributor(s) and not of MDPI and/or the editor(s). MDPI and/or the editor(s) disclaim responsibility for any injury to people or property resulting from any ideas, methods, instructions or products referred to in the content. |
© 2026 by the authors. Licensee MDPI, Basel, Switzerland. This article is an open access article distributed under the terms and conditions of the Creative Commons Attribution (CC BY) license.