Article

Landslide Deformation Remote Monitoring in Alpine Mountains Using UAV Photogrammetry and Infrared Thermography: A Case Study in Wumeng Mountain Region, China

1
Evaluation and Utilization of Strategic Rare Metals and Rare Earth Resource Key Laboratory of Sichuan Province, Sichuan Institute of Comprehensive Geological Survey, Chengdu 610081, China
2
China Geological Survey, China Institute of Geo-Environment Monitoring, Beijing 100081, China
3
Chengdu Center of China Geological Survey, Chengdu 611734, China
*
Author to whom correspondence should be addressed.
Remote Sens. 2026, 18(12), 1961; https://doi.org/10.3390/rs18121961
Submission received: 17 April 2026 / Revised: 9 June 2026 / Accepted: 10 June 2026 / Published: 12 June 2026
(This article belongs to the Special Issue Advances in GIS and Remote Sensing Applications in Natural Hazards)

Highlights

What are the main findings?
  • Cracks with elevated land surface temperature (LST) are likely connected to subsurface goaf zones, revealing active heat transfer pathways in mining-induced landslides.
  • Excessively widened cracks show no thermal anomalies due to enhanced air convection, which distinguishes them from thermally active fissures.
What are the implications of the main findings?
  • Thermal anomaly mapping enables remote identification of high-risk cracks linked to deep mining voids, allowing targeted intervention for slope stabilization.
  • The absence of thermal signals in widened cracks indicates that air convection can mask subsurface connections; thus, UAV thermal surveys in high-altitude winter environments must be conducted under overcast, fog-free conditions to avoid false negatives.

Abstract

Land surface temperature (LST) is crucial for understanding winter landslide evolution. This study combines Unmanned Aerial Vehicle (UAV) photogrammetry and infrared thermography (IRT) to monitor winter landslides in China’s Wumeng Mountain region. Using the Yangjiazhai landslide—induced by underground coal mining—as a case study, we demonstrate significant correlations between IRT-detected LST anomalies and surface cracks: (1) cracks with elevated temperatures are likely connected to subsurface goaf zones; (2) excessively widened cracks show no thermal anomalies due to enhanced air convection. The research reveals that key landslide components have distinct LST signatures, governed by differential soil–rock moisture and crack networks. For accurate high-altitude winter LST acquisition, UAV thermal surveys should be conducted under overcast, fog-free conditions to reduce solar interference. This validates UAV visible–infrared fusion for extracting landslide boundaries, cracks, slumping zones, bedrock patterns, and moisture distribution. The methodology establishes a new pathway for investigating winter landslide deformation and instability, confirming IRT’s operational viability in high-altitude alpine regions.

1. Introduction

Landslide refers to the phenomenon in which rock or soil mass on a slope slides downward along a certain weak plane or shear plane under the action of gravity. Globally, landslides have resulted in considerable loss of life and extensive property damage. The statistics [1] show a 20-year fatal landslide assessment (3876 events, 163,658 deaths, 1995–2014). Recent 2024 disaster figures from China’s Ministry of Emergency Management show that there were 53.45 million people affected, 709 missing/fatalities due to flood and geological disasters, and 263.04 billion RMB in direct economic losses [2].
The Wumeng Mountain region is located in the transitional zone between the Qinghai–Tibet Plateau and the Yunnan–Guizhou Plateau in China. In recent years, large-scale landslides have occurred repeatedly in winter. On 11 January 2013, a landslide occurred in Zhaojiagou, Zhenxiong County (ZXC), Yunnan Province, located in this region, resulting in 46 deaths [3]. On 22 January 2024, a landslide occurred in Liangshuicun, ZXC, located in this region, resulting in 44 deaths and 150 million RMB in loss [4]. On 8 February 2025, a landslide debris flow occurred in Jinping Village, Junlian County, Sichuan Province, located in this region, resulting in 10 deaths and 19 missing persons [5].
Generally, high and steep terrain, special rock mass structure, strong weathering and unloading, rainfall and snowfall are considered four primary triggers for landslides [6,7,8,9,10]. For such landslides occurring in winter under low-temperature conditions and in the absence of heavy rainfall, the traditional theory attributing landslides primarily to intense precipitation fails to provide an adequate explanation [8]. Traditional engineering geology theory believes that heavy rainfall generates substantial amounts of liquid water infiltration into slopes, weakening the mechanical parameters of rock and soil masses. This alters the internal stress state of the slope, reducing its stability and ultimately triggering landslides [9,11,12]. However, landslides in winter occur during periods of no rainfall or minimal rainfall and snowfall, lacking a clear external hydraulic drive that alters the mechanical properties of rock and soil masses. Therefore, the occurrence of winter landslides is more related to changes in the mechanical properties of rock and soil masses under low-temperature conditions [13,14,15]. Extensive research conducted by numerous scholars has demonstrated that frost heaving force, induced by low temperatures, is recognized as one of the primary triggering factors for winter landslides [16,17,18].
As a useful remote sensing technology, infrared thermography (IRT) enables remote acquisition of surface temperature data from rock and soil masses. It has found extensive application across diverse fields including volcanic monitoring [19], engineering construction [20], geothermal surveys [21], agricultural and forestry surveys [22,23], and architectural conservation [24]. The technology was first applied to landslide research in the 1990s [25]. Subsequently, driven by continuous improvements in the performance and accuracy of thermal imaging sensors, significant advancements have been achieved by numerous researchers in areas such as rock mass structure detection [26,27], identification of deformed cracks [28], analysis of landslide drainage patterns [29], and landslide stability assessment [30,31].
The temperature of rock and soil masses is critically important for investigating landslides occurring in winter. Because the temperature of the rock and soil masses is the core factor driving the freeze–thaw cycle under winter conditions, freeze–thaw cycles can significantly reduce the strength of the rock and soil mass, and are considered one of the key triggering factors for winter landslides [32,33,34]. IRT technology offers a relatively convenient way to remotely acquire surface temperature data over extensive slope areas. Mineo and his colleagues applied UAV and IRT technologies to conduct extensive landslide identification and investigation in Italy and other regions [26,27,30,31,35]. This study selects a representative area within the Wumeng Mountain region—a locale that has experienced multiple catastrophic landslide events during recent winters—as the research area. By applying IRT integrated with UAV aerial photogrammetry to landslide investigation and thermal infrared detection in this alpine mountainous region, we analyze and explore the relationship between the thermal anomaly distribution of winter landslides and surface temperature. This study introduces several methodological novelties tailored for winter landslide thermal infrared detection in high-altitude regions:
(1)
We propose a dedicated winter UAV-IRT survey protocol, conducting flights under overcast, fog-free conditions to effectively suppress solar radiation interference and isolate deformation-related thermal signatures.
(2)
We present an integrated visible–thermal framework that links crack surface temperature anomalies to subsurface goaf connectivity, and further identifies a crack-width threshold (1.0–2.0 m) beyond which enhanced air convection masks deep-seated heat transfer, thereby preventing false negatives in fracture assessment.
(3)
We conduct a systematic multi-element thermal characterization of landslide components (cracks, debris grain-size accumulations, moisture-rich channels, rock-mass structures, and slope gradients), revealing distinct seasonal thermal responses governed by differential moisture content and crack networks.
By applying this novel methodology to the Yangjiazhai landslide, we analyze the relationship between winter landslide deformation evolution and surface temperature, providing transferable insights for instability mechanism research and demonstrating the operational viability of IRT technology in alpine environments.

2. Materials and Methods

2.1. The Study Area

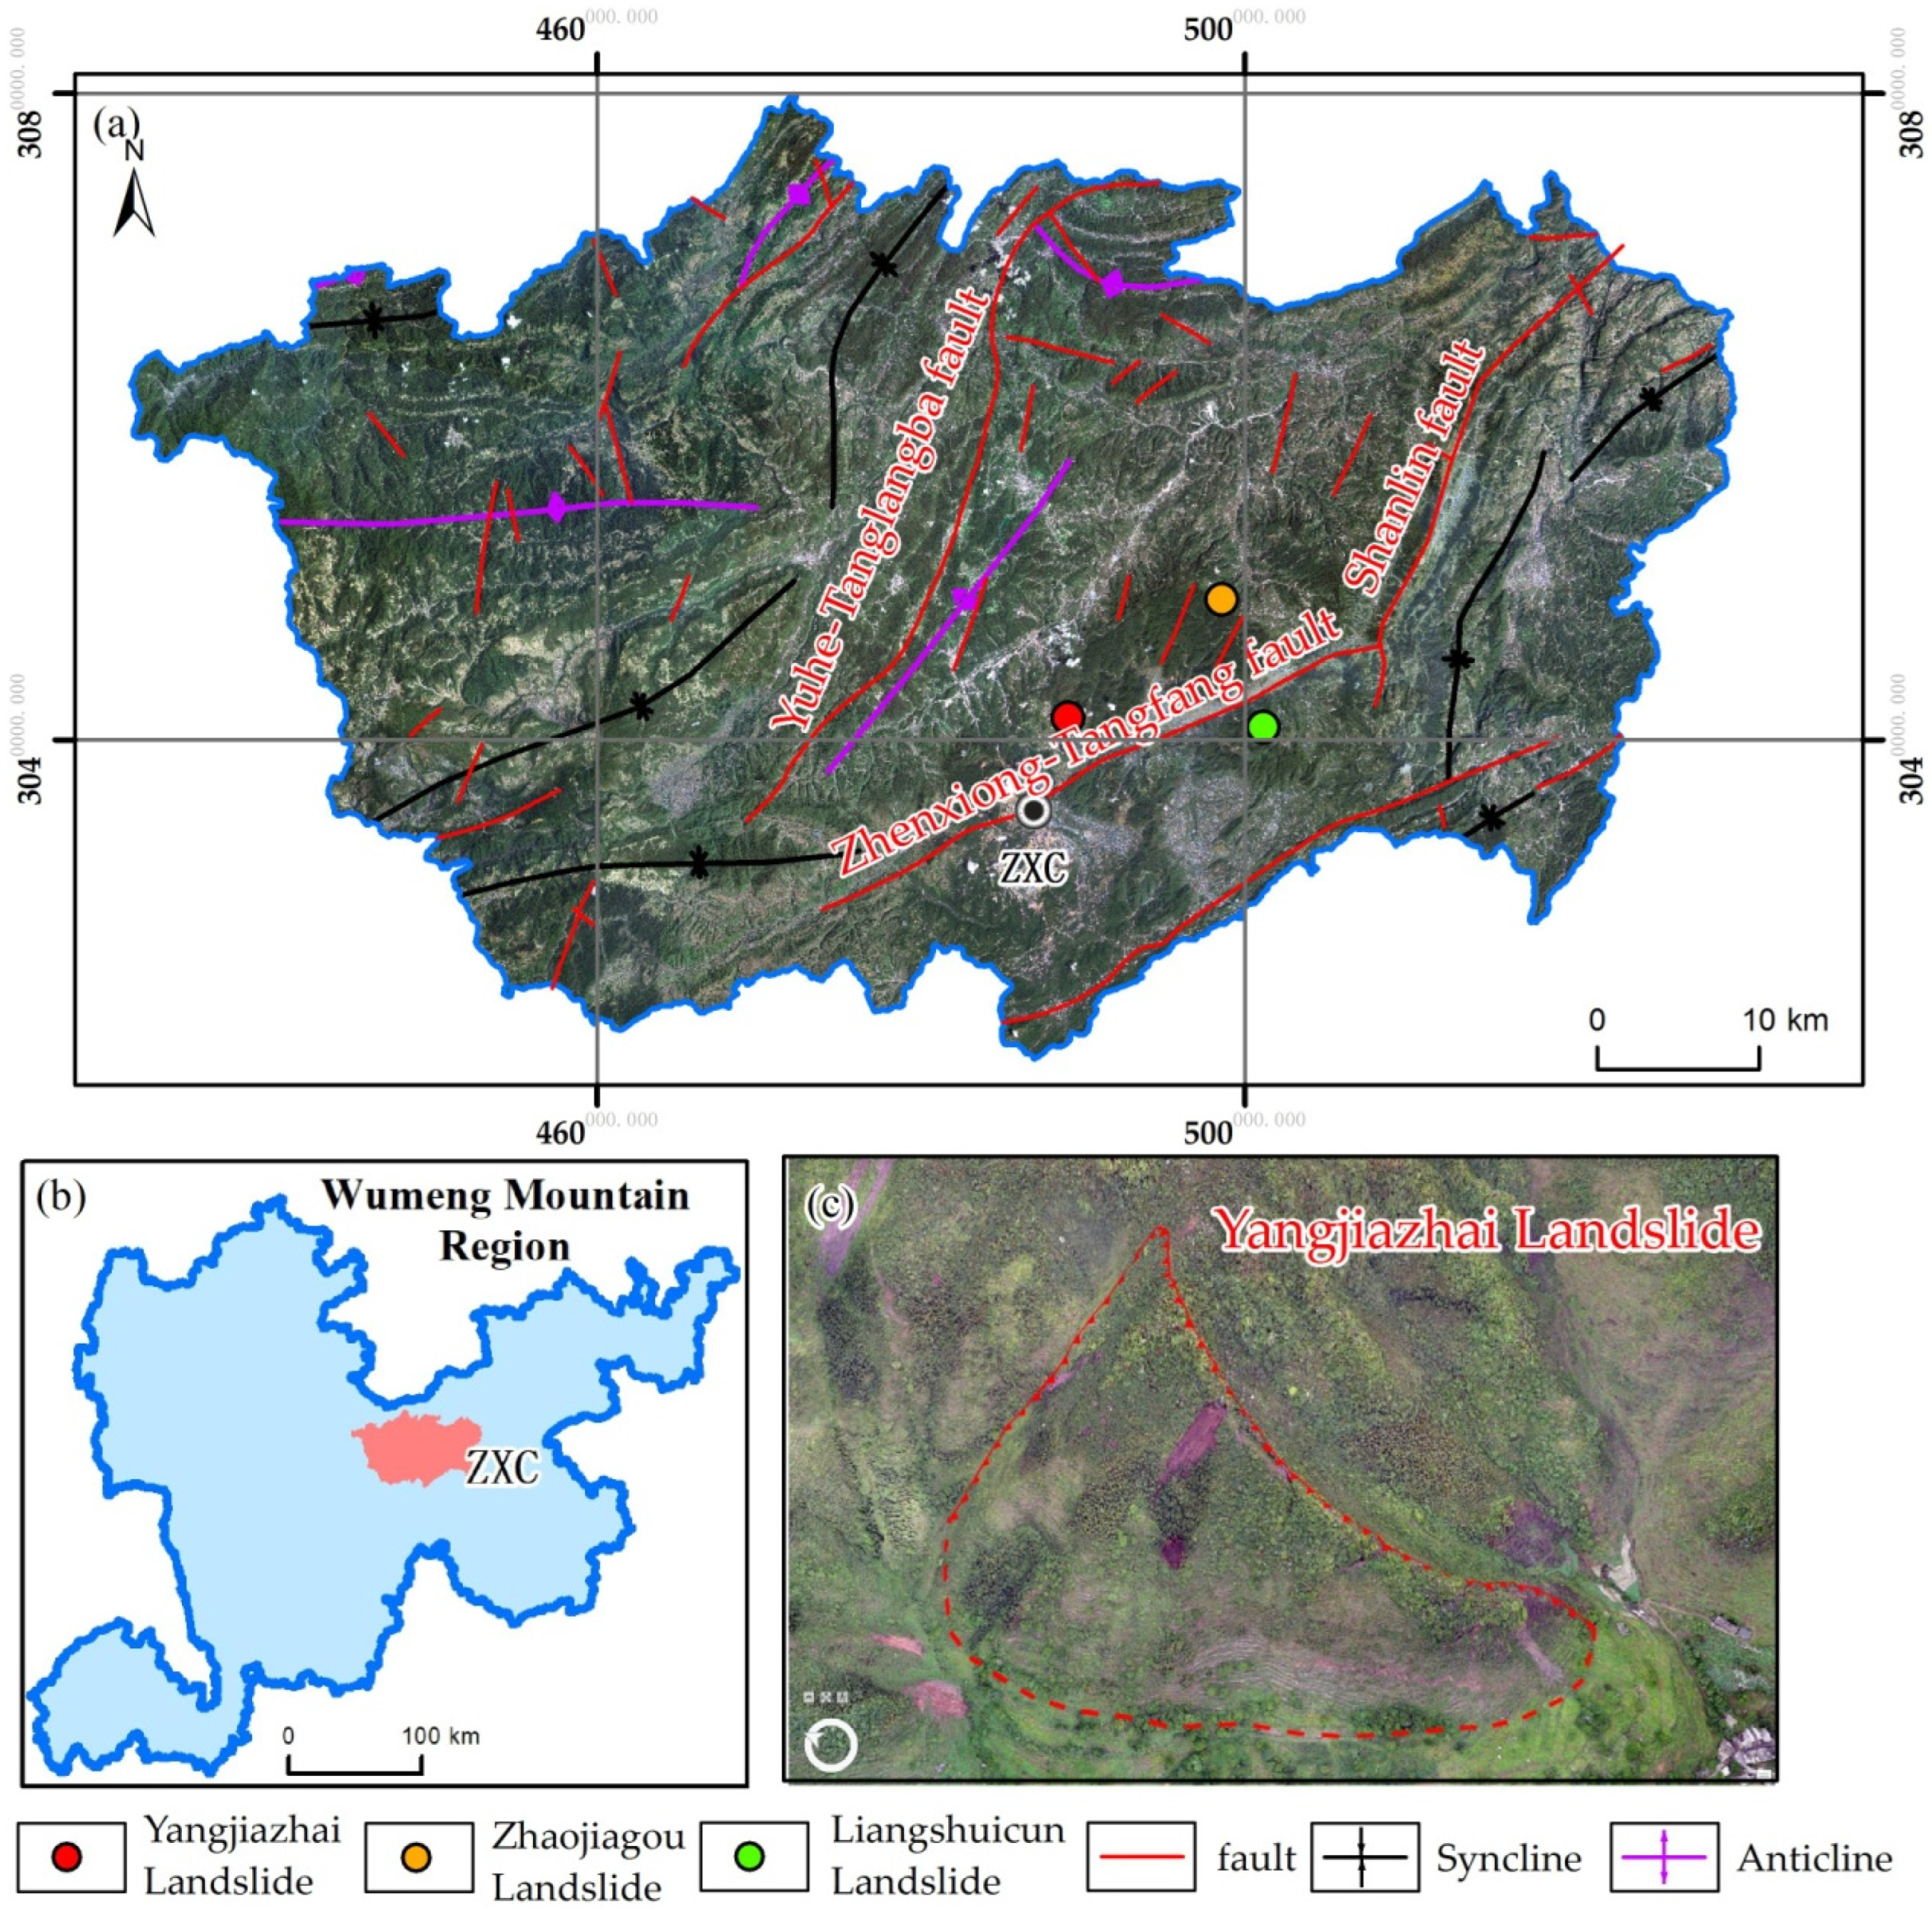
The study area is located in Zhenxiong County (ZXC), Guizhou Province. Situated in the central part of the Wumeng Mountain area, the location of ZXC ranges within E104°18′~105°19′, N27°17′~27°50′ (Figure 1b). ZXC has an altitude from 630 to 2400 m. Generally speaking, ZXC is higher in the southwest and lower in the northeast. ZXC features significant topographic relief and intense dissection, forming multi-level step-like landforms and deep river valleys (Figure 1a). Influenced by the convergence of the Yangtze Block and the Kangdian Block, prolonged tectonic movements have produced a series of large-to-medium-sized folds with roughly parallel, en-echelon arrangement within ZXC, intersected at near-right angles by tensional fractures crossing shear fractures. Anticlines and synclines tend to extend in the direction of 40°~60° northeast. The northern wing is steep while the southern wing is gentle. Synclines are long and wide, while anticlines are short and tight. The main structures include the Zhenxiong–Tangfang fault, the Yuhe–Tanglangba torsional fault, and the Shanlin fault [36]. The region is dominated by Permian and Triassic strata, characterized by inter-bedded sandstone, shale, limestone, and multiple coal seams, forming an inter-bedded hard and soft rock mass structure [37]. As a major coal mining county, frequent mining activities have further impacted the regional geological environment. Catastrophic landslides such as the Zhaojiagou landslide and the Liangshuicun landslide are both located within coal mining areas (Figure 1a).
The key study target of this paper, the Yangjiazhai landslide (Figure 1c), is located in the central part of ZXC, at an elevation of approximately 1800–2100 m. It belongs to a tectonically eroded alpine landform, with terrain generally higher in the northeast and lower in the southwest. It is situated about 12.2 km northeast of the Zhaojiagou landslide and approximately 12.1 km east of the Liangshuicun landslide (Figure 1a). The exposed strata in the Yangjiazhai landslide area primarily consist of the Triassic Feixianguan Formation, the Permian Changxing Formation, and the Longtan Formation (Permian). The predominant lithologies include argillaceous limestone, argillaceous siltstone, mudstone, and coal seams. The strata generally exhibit a subhorizontal attitude, with well-developed joints and fractures fragmenting the rock mass [36]. Coal underground mining began in the landslide and its surrounding areas in 2010. The main underlying mined-out areas formed during 2013–2014 and 2021–2024 [38].
The Yangjiazhai landslide belongs to a high-position long-distance debris flow landslide, which can be specifically classified as a debris flow landslide induced by collapse [39,40]. Prevention and control of debris flow landslides include strengthening slope drainage to reduce water infiltration, removing or reinforcing loose deposits, installing retaining structures such as anti-slide piles and walls at the toe, constructing multiple check dams and flexible barriers in the transport zone to intercept debris, building diversion channels downstream, and implementing real-time monitoring and early warning systems to evacuate people from hazardous areas.

2.2. Photogrammetry

UAV photography is now a mature aerial imaging method, widely applied across various domains. Its fundamental principles of image stitching are as follows: Overlapping Acquisition: UAVs follow predefined flight paths to ensure sufficient overlap between adjacent images, providing the foundation for feature matching; Feature Point Matching: software automatically identifies common feature points across adjacent images and establishes connections (UAV Manager v.2.4.6); Aerial Triangulation and Geometric Correction; Seam Blending and Mosaicking, the orthophoto maps (DOM) or 3D models are generated.
The application areas include: Surveying and Geoinformatics, rapid generation of large-scale topographic maps and digital elevation models (DEMs) [41]; Environmental Monitoring: tracking forest cover changes, soil erosion, and ecological restoration [42]; Disaster Response: rapid acquisition of post-disaster panoramic imagery to assess damages (e.g., landslides, floods) [43].

2.3. Infrared Thermography

Thermal infrared imaging is based on the law of thermal radiation (Stefan–Boltzmann Law):
W = ε σ T 4
where W is the total radiant energy from the object surface (Watt/m2), ε is the emissivity of a blackbody; if it is an absolute blackbody, then ε = 1 , σ is the Stefan–Boltzmann constant (5.6697 × 10⁻⁸ Wm−2 K−4), T is the absolute temperature in K. The equation shows that all objects emit infrared radiation and the power has a linear relationship with T 4 . Drone-mounted thermal cameras could transfer infrared radiation into electrical signals. And false-color thermal maps can be generated according to different temperature gradients.
The application areas include agricultural monitoring, such as crop stress diagnosis and irrigation efficiency assessment; environmental protection, such as water pollution tracing, and detecting thermal anomalies in forests caused by illegal logging-induced dryness [44]; geohazard early warning, such as landslide monitoring [45,46] and volcanic activity detection [19].

2.4. UAV and Cameras

The data collection for this study utilized the Feima D2000 UAV (DJI, Shenzhen, China) as the flight platform. It was equipped with a SONY a6000 camera (SONY, Tokyo, Japan) for visible-light imaging and a D-TIRV1000 thermal infrared camera (Feima Robotics, Shenzhen, China). The main parameters of the UAV and cameras are listed in Table 1. The research team conducted aerial visible-light and thermal infrared data acquisition at the Yangjiazhai landslide area on 14 August 2024, and 11 January 2025.
To ensure the reliability of subsequent comparative analysis, the flight paths for data acquisition across different periods must remain consistent. Mission planning was performed using the UAVManager software developed by Feima UAV Company. The parameters for visible-light data acquisition were set as follows: flight altitude at 200 m above ground level (AGL), forward overlap of 80%, side overlap of 60%, flight speed of 13.5 m/s, and a Ground Sampling Distance (GSD) of 3.1 cm/pixel. For thermal infrared data acquisition, the parameters were: flight altitude at 150 m AGL, forward overlap of 85%, side overlap of 80%, flight speed of 10 m/s, and a GSD of 13.8 cm/pixel.

2.5. Data Processing

2.5.1. Temperature Accuracy of the Thermal Camera

The thermal camera used in this study is the D-TIRV1000 model. Upon reviewing the manufacturer’s technical specifications, the camera has an accuracy specification of ±2% of reading or ±2 °C, whichever is larger, over the −20 °C to +900 °C measurement range. We note that temperature accuracy in microbolometer-based uncooled thermal cameras can be influenced by environmental conditions and the time elapsed since calibration. To mitigate this, we performed a two-point radiometric calibration using a blackbody reference source both before and after each UAV flight mission. This in situ calibration procedure effectively captured any temperature drift of the sensor during operation.

2.5.2. Emissivity Setting

We set the emissivity value to 0.95, which is the recommended default value for most natural surfaces and non-metallic materials. For the typical land cover types in our study area, which consisted of bare soil, sparse vegetation, and dry debris, emissivity values generally fell within the range of 0.92–0.97. Our field survey confirmed the absence of highly reflective materials such as metal surfaces or standing water bodies. Therefore, an emissivity value of 0.95 represents a reasonable approximation for our study site.

2.5.3. Radiometric Calibration Protocol

Our radiometric calibration consisted of three steps. First, we acquired the raw digital number (DN) values from the thermal camera. Second, we converted the DN values to at-sensor radiance using the manufacturer’s radiometric calibration coefficients, which were derived from laboratory blackbody measurements. Third, we applied a two-point linear calibration using in situ observations of reference blackbody targets (with known temperatures covering the range of surface temperatures encountered in the field) to convert at-sensor radiance to at-sensor brightness temperature. All raw thermal images were converted to at-sensor brightness temperature prior to atmospheric correction.

2.5.4. Atmospheric Correction

We applied atmospheric correction using the open-source R package theRmalUAV v1.1.1. This package integrates state-of-the-art correction methods into a flexible framework for deriving land surface temperature (LST) from UAV-based thermal imagery. It offers two processing workflows: an orthomosaic-based approach and an image-based approach. We opted for the image-based workflow, which applies atmospheric and background temperature corrections to individual raw thermal images prior to orthomosaic generation using external photogrammetry software UAV Manager. Key components of the package include correcting for atmospheric absorption and emission along the sensor-to-target path, as well as compensating for downwelling sky irradiance. Atmospheric parameters—including air temperature, relative humidity, and atmospheric transmittance—were measured in situ at the time of flight and supplied as inputs to the RmalUAV package.

2.5.5. Topographic Correction for Thermal Data

Our study area has relatively gentle terrain, with a maximum slope angle less than 10°, as confirmed by a digital elevation model (DEM) derived from UAV photogrammetry. Topographic effects on thermal radiation—such as slope-aspect modifications to incoming solar radiation and adjacency effects from adjacent slopes—are negligible under such low-relief conditions. Nevertheless, we used ENVI 5.3 to perform geometric co-registration, which implicitly accounts for terrain-induced geometric distortions through the use of a DEM (when available) and automatically generated tie points. If significant topographic relief were present, a more rigorous topographic correction accounting for local illumination geometry would be necessary; however, this is not required for the current study area.

2.5.6. Thermal Consistency After Image Mosaicking

The geometric co-registration and orthomosaic generation were performed using ENVI 5.3-Image Registration Workflow. This workflow uses ENVI’s patented Registration Engine to automatically and accurately generate tie points, which are then used to align and resample the images into a common coordinate system. A key feature of this workflow is that it applies geometric transformations and resampling to the raw thermal images before stitching them into a mosaic, thereby minimizing temperature discrepancies at seamlines. Following mosaicking, we manually inspected all seamlines for abrupt temperature discontinuities. No significant thermal inconsistencies were observed across adjacent image boundaries.

2.6. Surface Temperature Monitors

At the Yangjiazhai landslide, we arranged 5 shallow surface temperature monitors and 4 sets of deep temperature fiber optic monitors along the cracks. The coordinates of the 5 shallow surface temperature monitors are shown in Table 2.

3. Results

3.1. UAV Orthophotos of Yangjiazhai Landslide

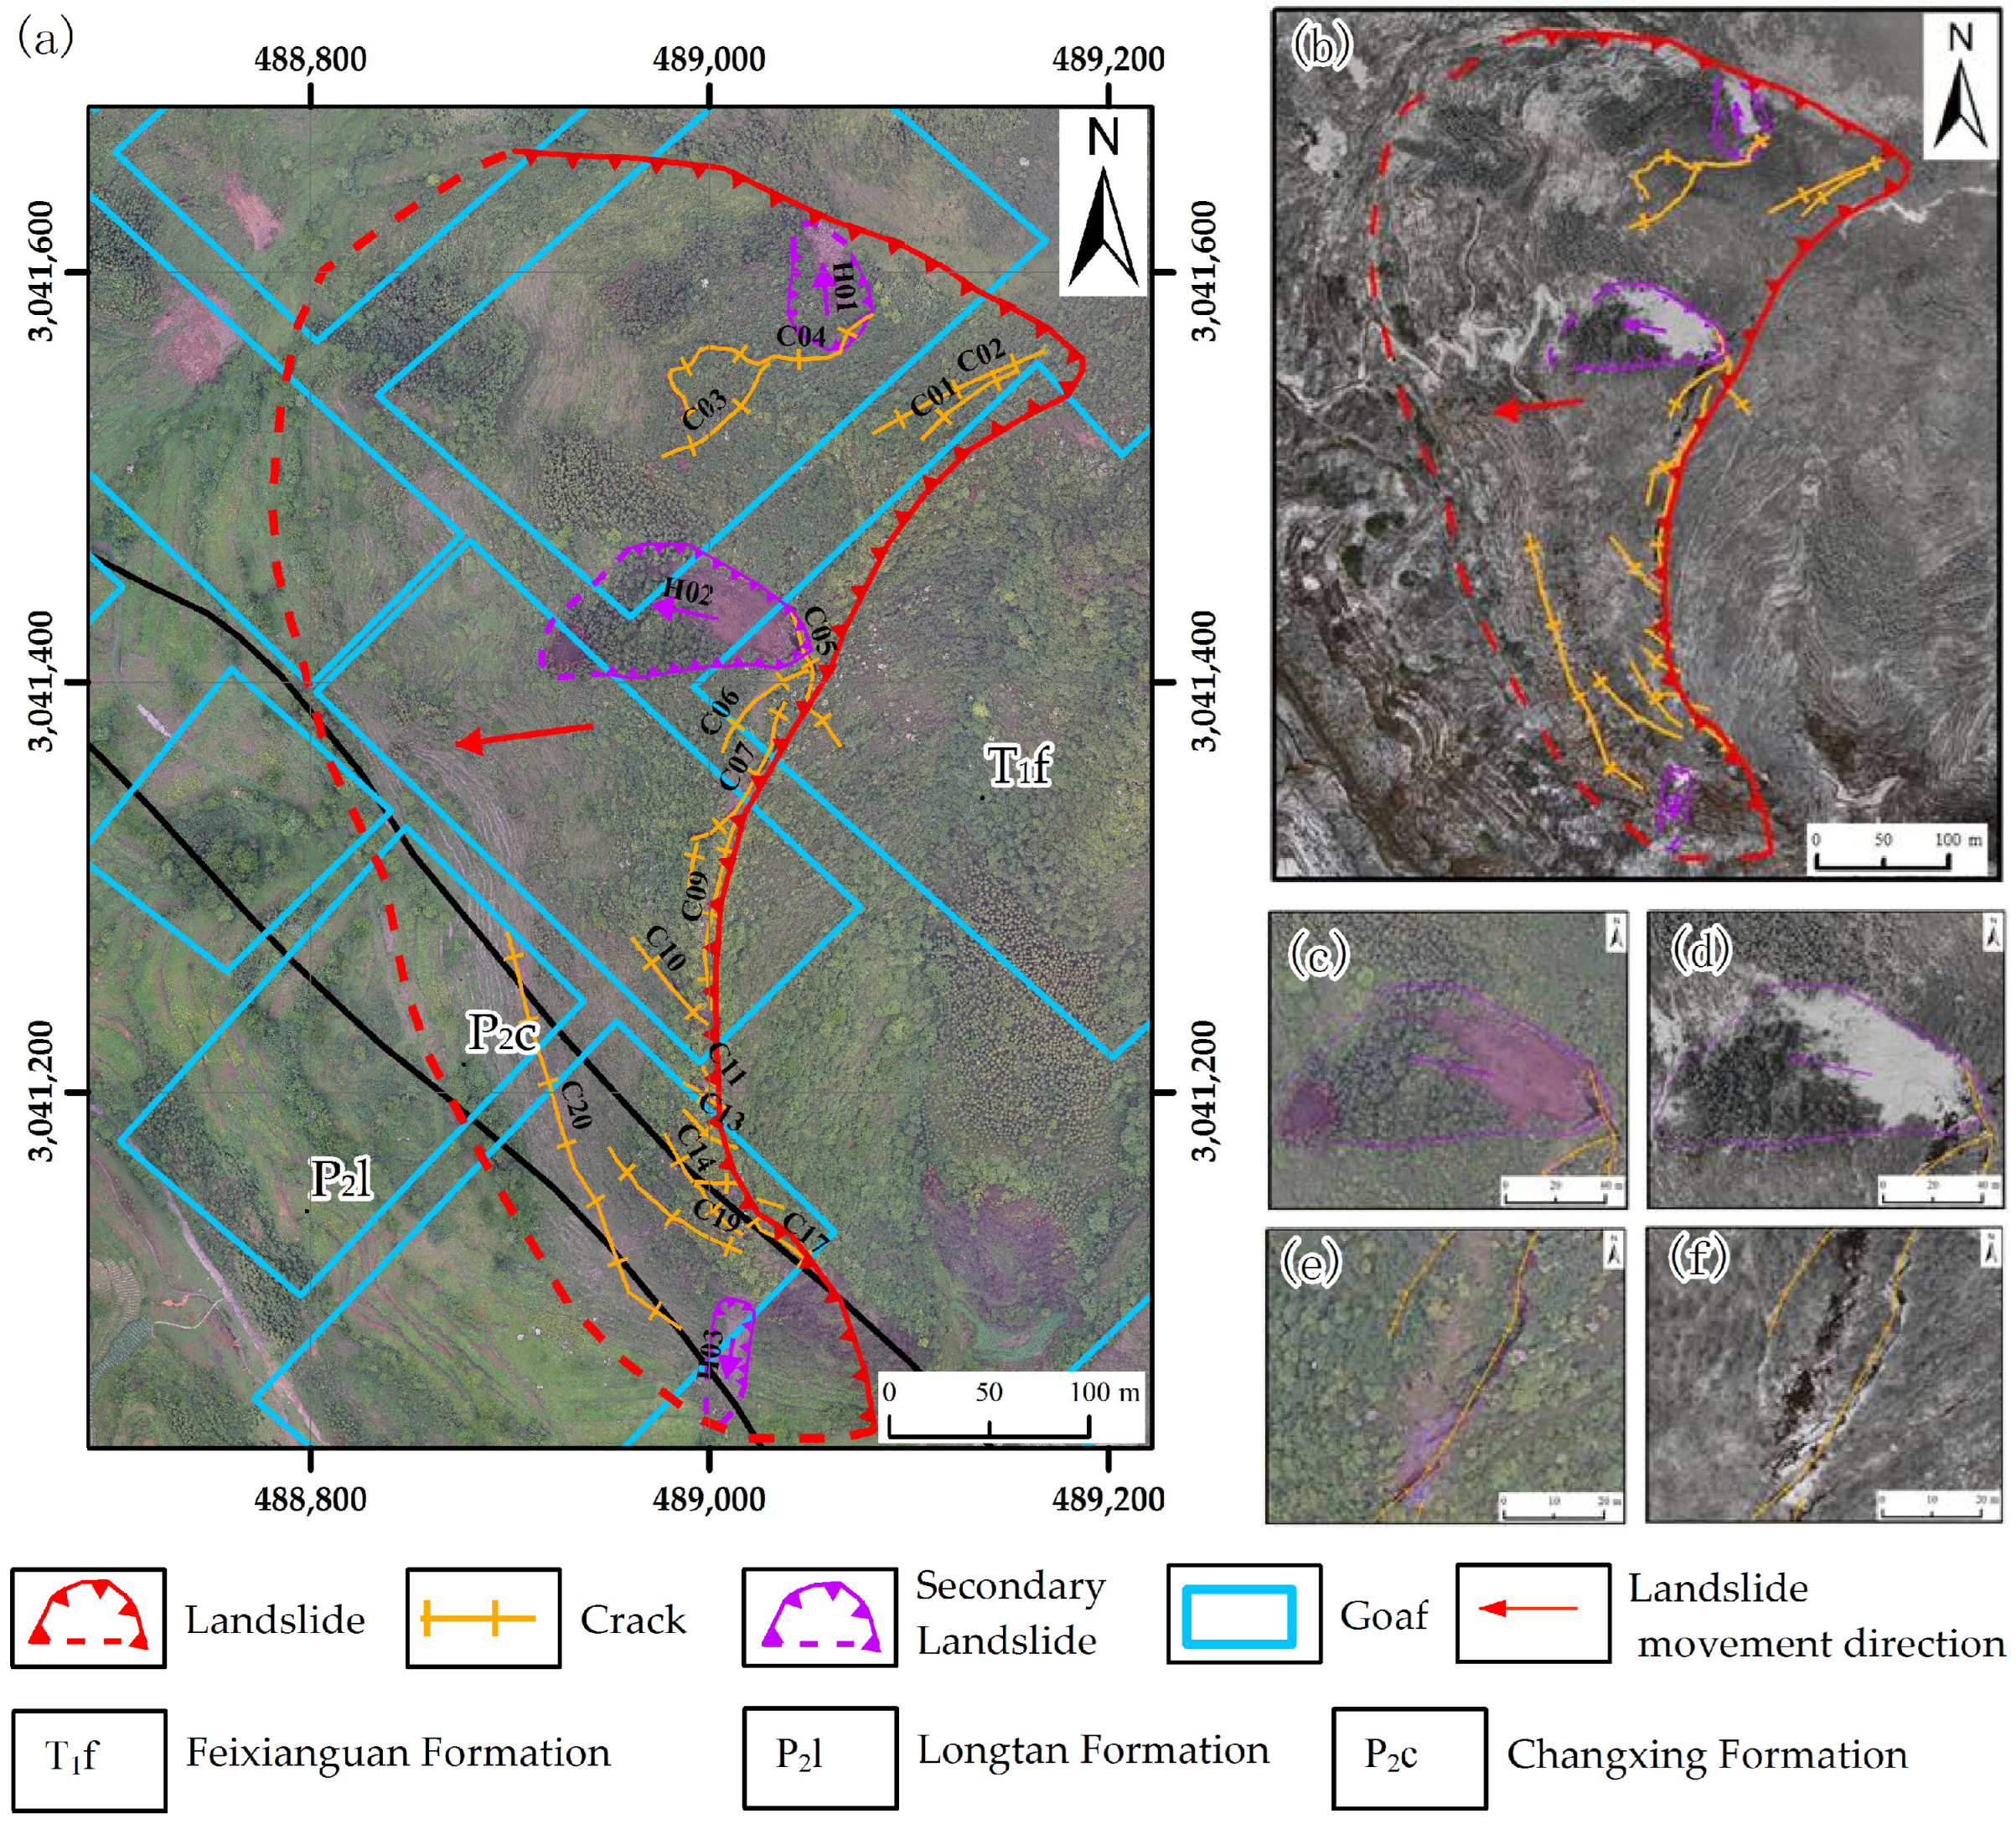
Based on visible-light image data from two survey campaigns, image processing was performed using UAV Manager software to generate high-precision orthomosaics for both periods. Professional experts in landslides then manually interpreted these optical images, and boundaries and deformation features of the Yangjiazhai landslide are identified. The landslide exhibits an approximately triangular platform, bounded by an approximately east–west trending gully on its right flank, a near-north–south oriented ridge on its left flank, and the transition line between gentle and steep slopes at its toe. The landslide body measures approximately 360 m in length, with a maximum width of 580 m, covering an area of about 135,300 m2 (13.53 × 10⁴ m2). Its main sliding direction is 263° (WSW). The landslide surface features dense vegetation dominated by shrubs, and local farmers previously residing nearby have been relocated (Figure 2a). There is snow cover on the landslide (Figure 2b). The vegetation on the surface of the slope was already dense before the local residents moved away. After their relocation, no engineering measures were taken to treat the landslide, which has been continuously deforming ever since. Figure 2c,d show secondary landslide H02 on 14 August 2024 and 11 January 2025. Figure 2e,f show crack 07 on 14 August 2024 and 11 January 2025. Through Figure 2a, we can clearly distinguish the lithological combination, the spatial relationship between goaf and slope.
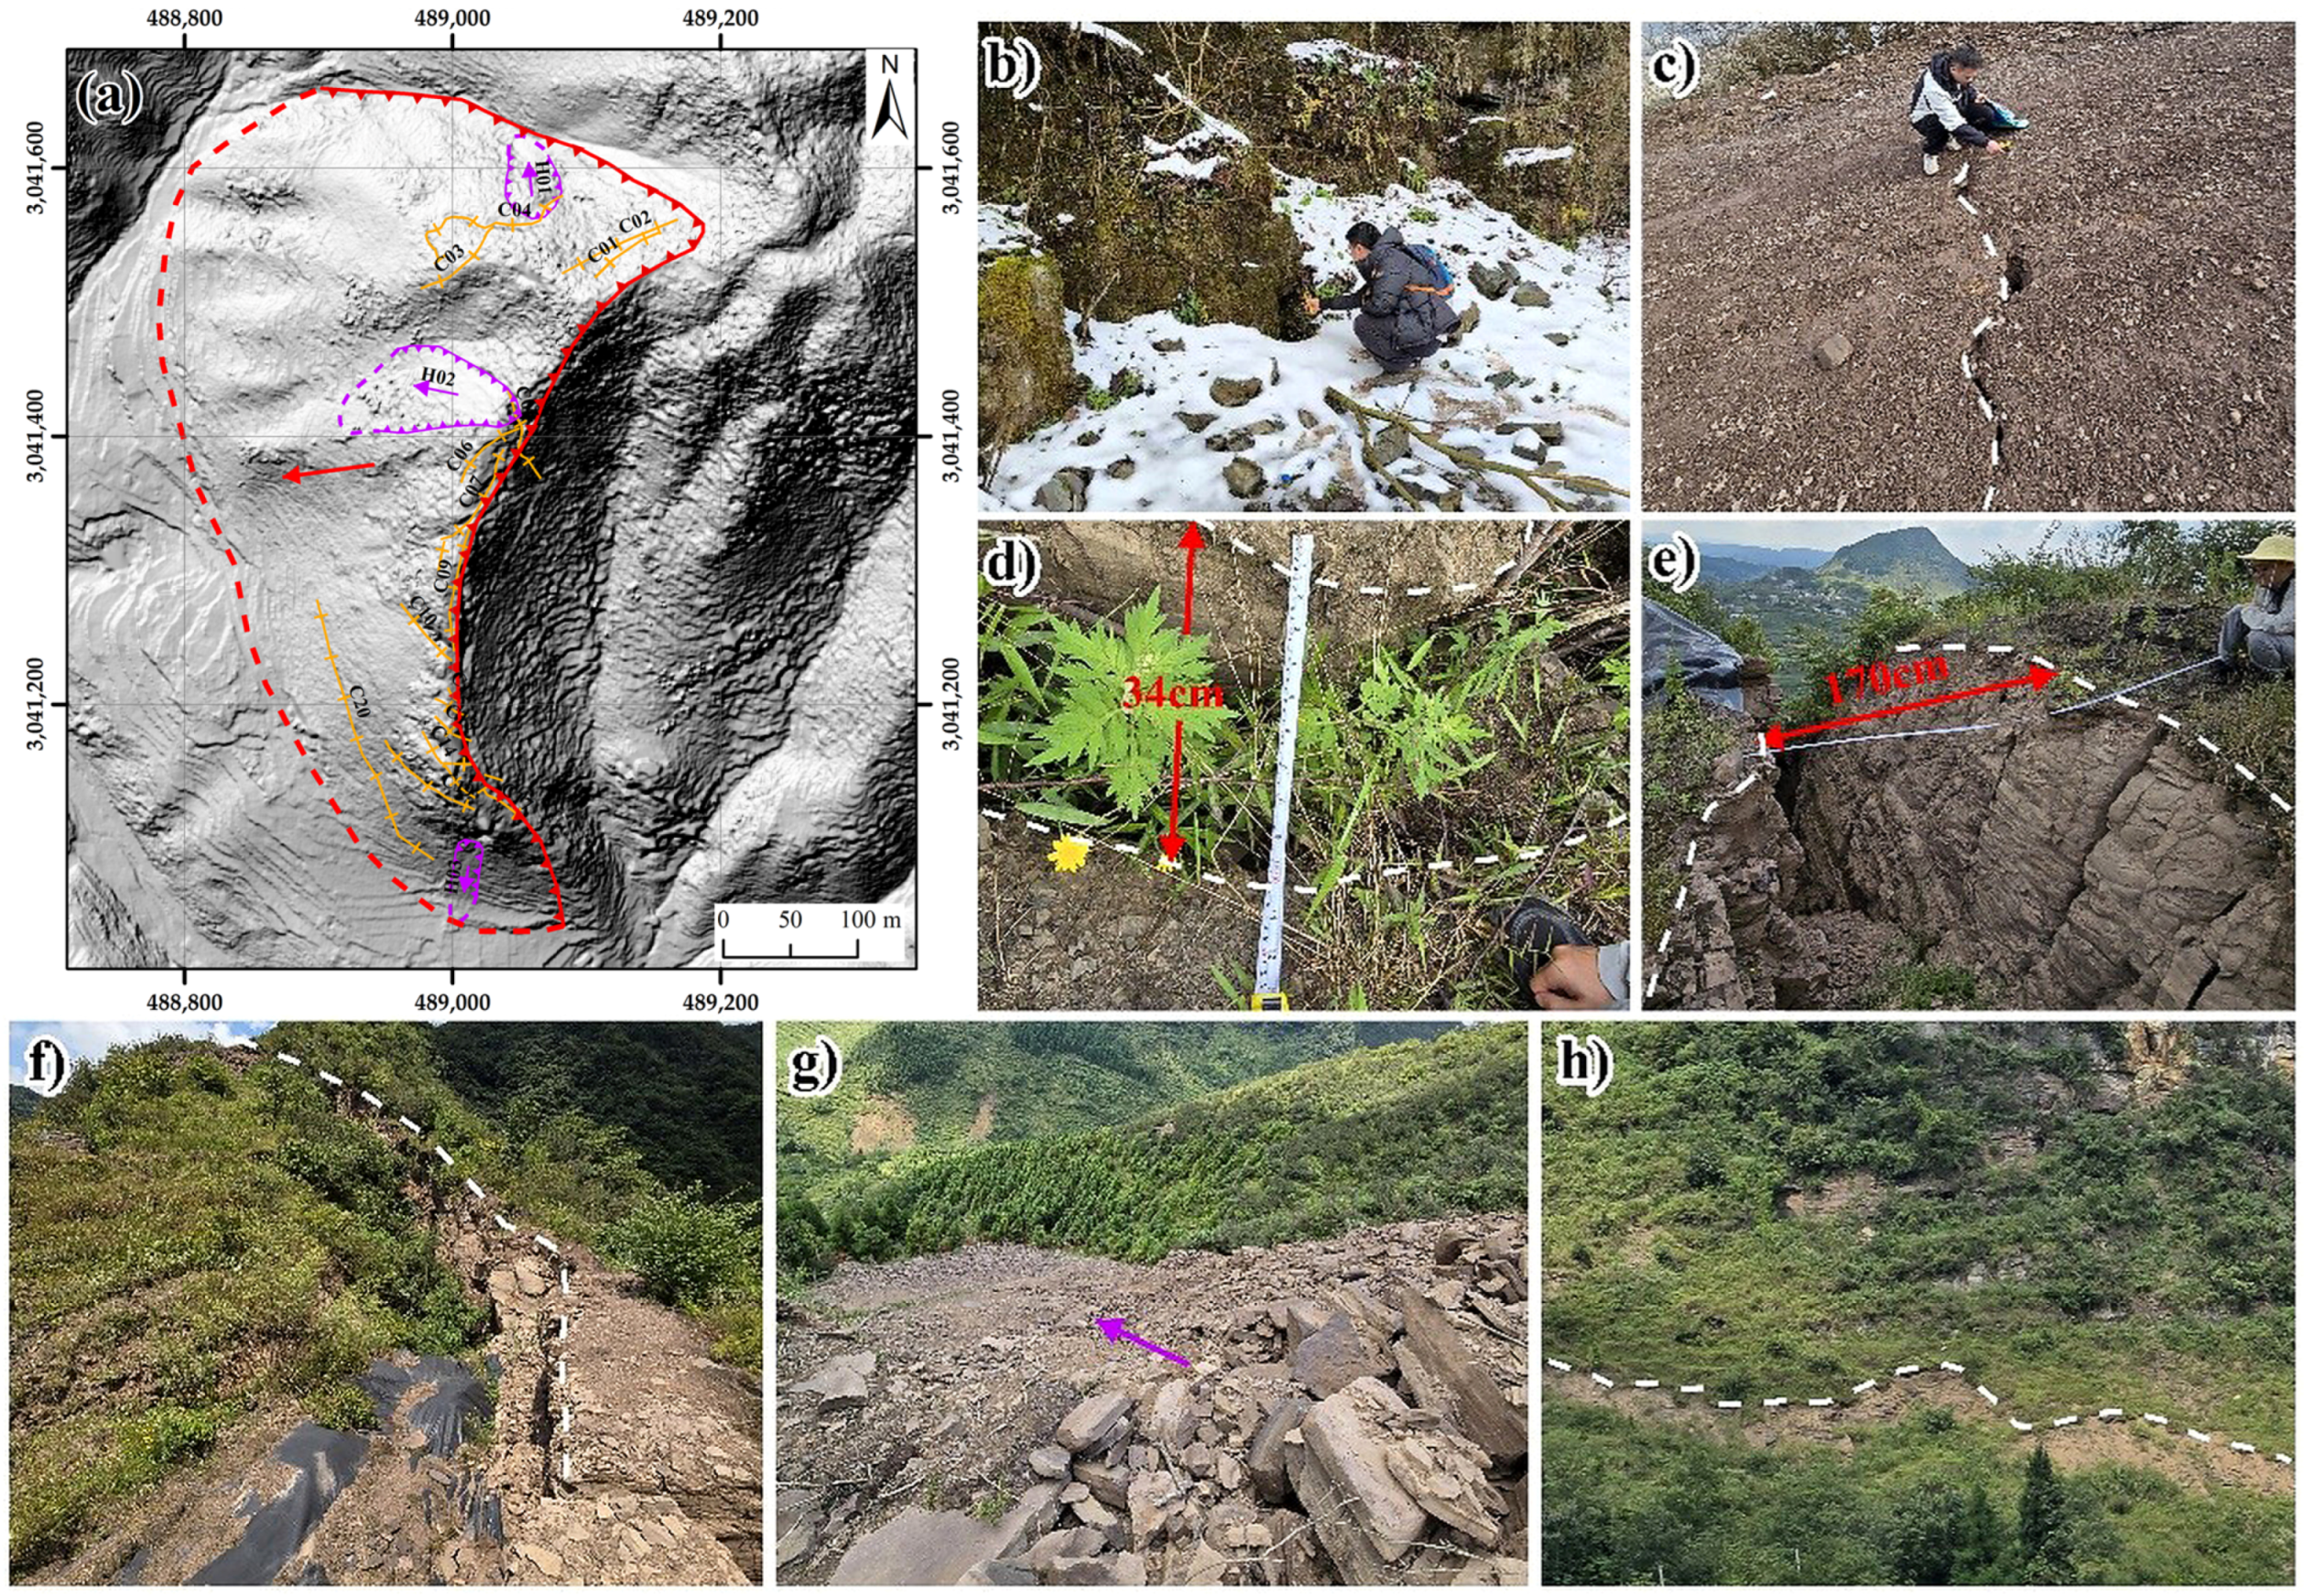
Deformation features of the Yangjiazhai landslide primarily show as secondary landslides (secondary landslide refers to small-scale sliding that occurs locally) and cracks. Due to snowfall influence, substantial snow accumulation covered the slope surface on 11 January 2025. The landslide area exhibited a predominantly gray–white hue, with most deformation features obscured by snow cover, resulting in less distinct optical signatures. In contrast, UAV aerial imagery acquired on 14 August 2024 provided better identification of deformation elements (Figure 2a). In addition, on the day of conducting UAV data collection twice, we simultaneously conducted on-site investigations of the landslide, including the measurement of landslide boundaries, cracks, and secondary landslide deformation characteristics, as well as the application of industrial thermometers to measure surface temperature in some areas. Figure 3a shows the terrain of the Yangjiazhai landslide. Figure 3b shows the field investigation work. Figure 3c–f,h show the cracks of the Yangjiazhai landslide. Figure 3g shows the sliding direction.
Three small-scale secondary landslides are distributed within the landslide area. Secondary landslide H01, located in the northern sector, covers an area of approximately 1900 m2 with a sliding direction of 355° (NNW). Secondary landslide H02 in the central sector spans about 6100 m2, sliding toward 280° (WNW). Secondary landslide H03 in the southern sector occupies approximately 1000 m2 with a sliding direction of 185° (S) (Figure 2a).
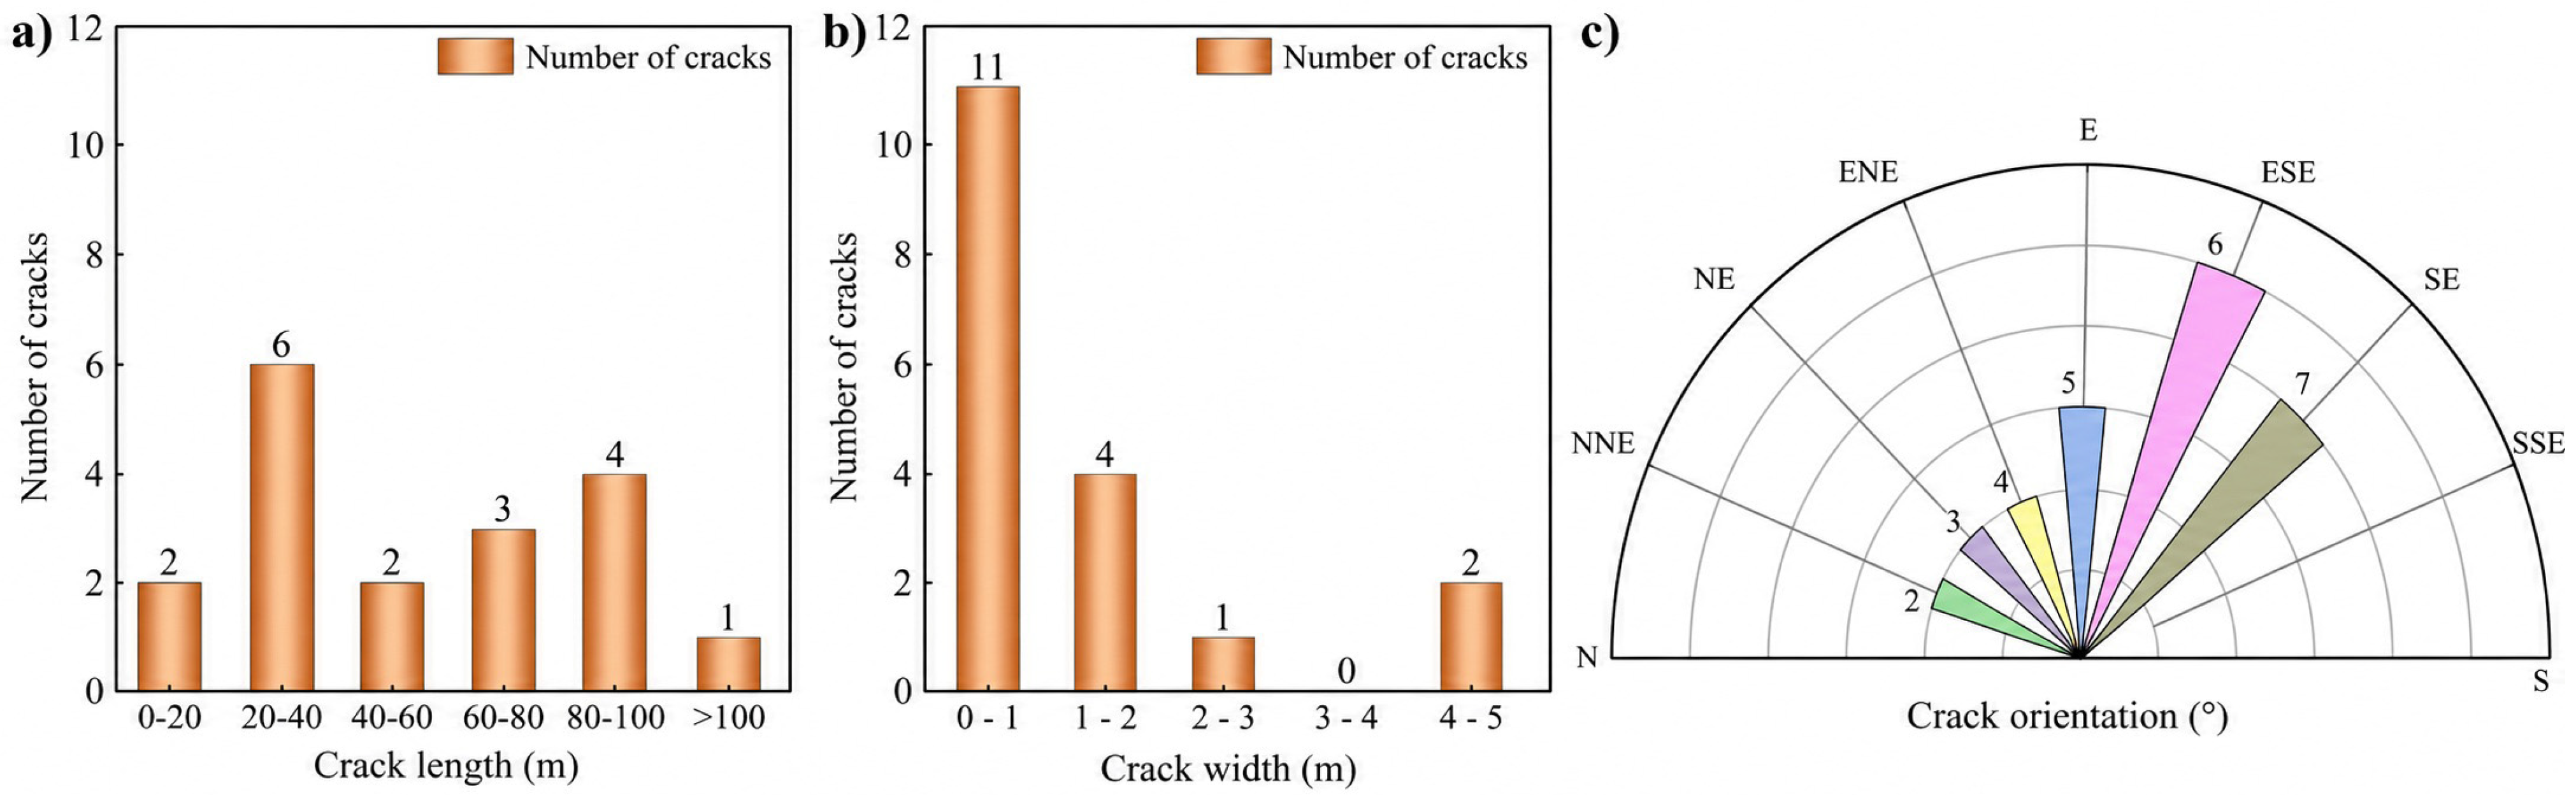
A total of 20 cracks have developed within the landslide area, primarily distributed along the eastern ridge of the landslide body and the southern sector behind secondary landslide H01. These cracks predominantly range from 20 to 90 m in length, with the longest reaching 220 m (Figure 4a). Their widths vary between 0.5 and 5 m (Figure 4b), and most cracks exhibit orientations perpendicular to the main sliding direction (255–275°) of the landslide (Figure 4c).

3.2. IRT of Yangjiazhai Landslide

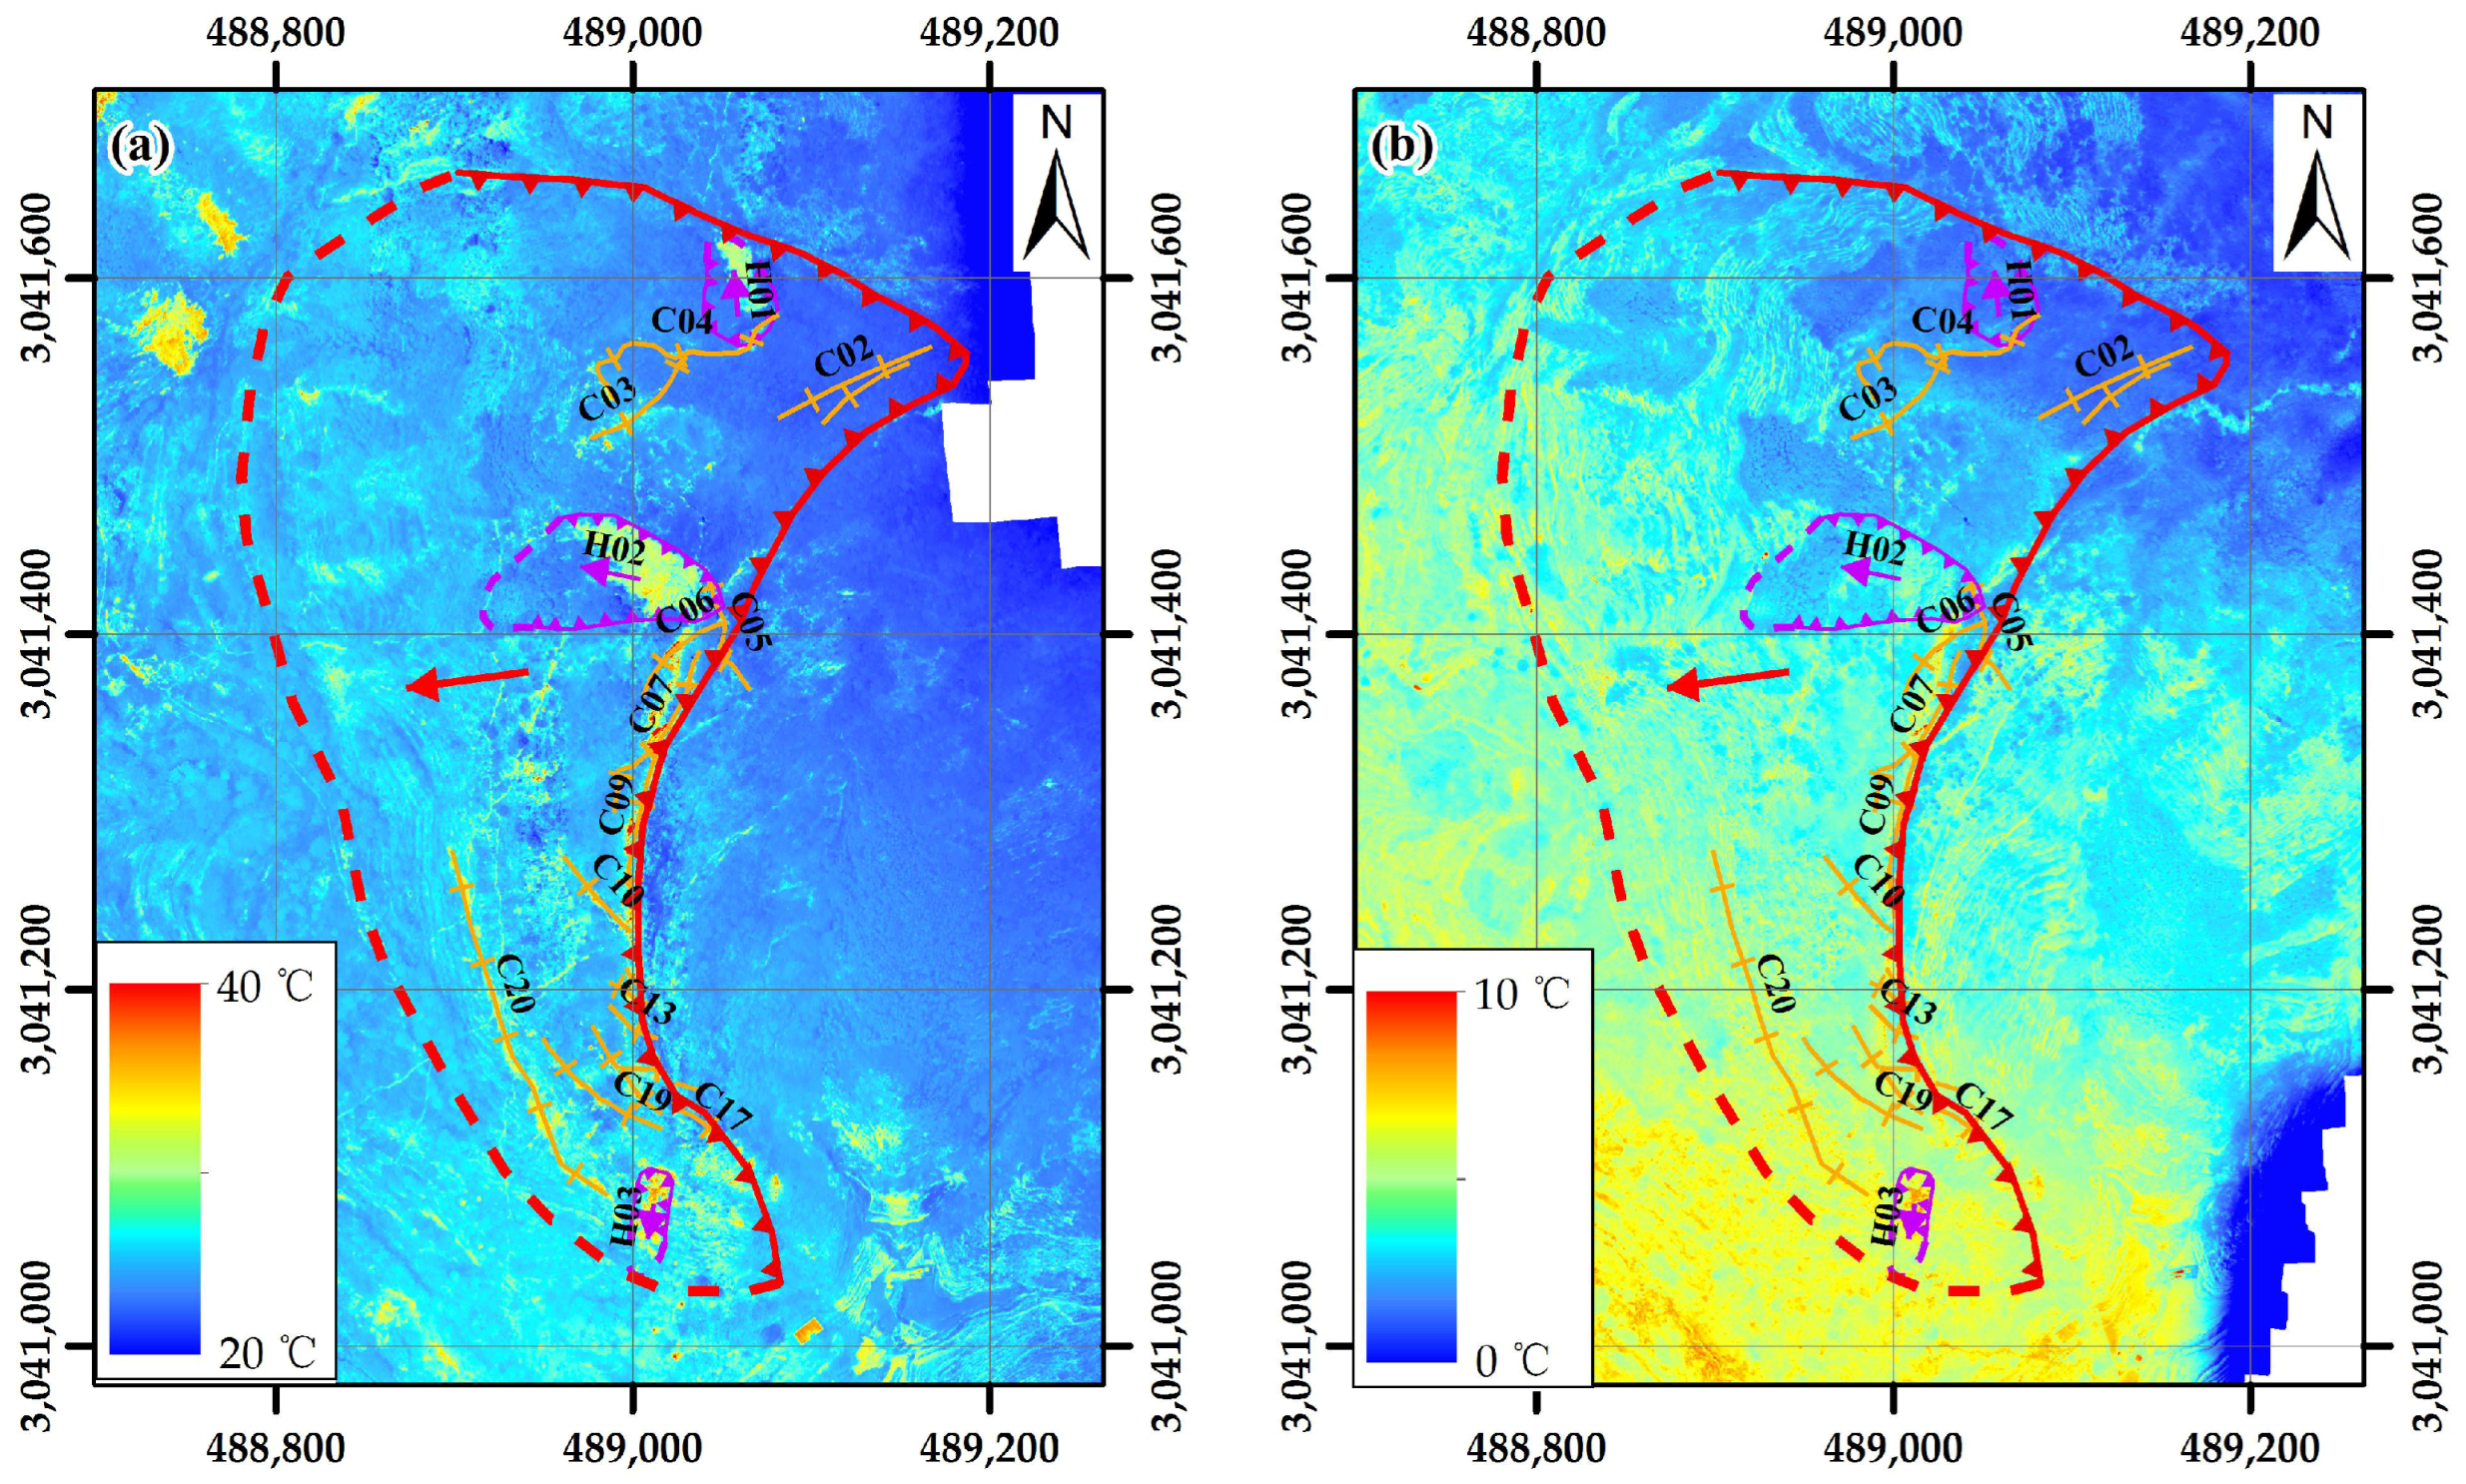
Building upon two campaigns of thermal infrared data acquisition, image processing was conducted using UAV Manager software to generate UAV thermal infrared imagery for both periods (Figure 5). Located in the Northern Hemisphere, the landslide area was surveyed during summer conditions on 14 August 2024. According to field records, data collection occurred from 12:00 p.m. to 2:00 p.m. under sunny skies, with ambient air temperature approximately 28 °C. The thermal data revealed ground surface temperatures of 20–40 °C across the landslide area (Figure 5a). The winter survey on 11 January 2025 was conducted from 12:00 p.m. to 2:00 p.m. under overcast conditions, with recorded air temperature around 3 °C. Thermal imagery indicated ground surface temperatures ranging from 0 °C to 10 °C in the landslide zone (Figure 5b).
The surface temperature of the landslide area exhibited significant spatial variability on 14 August 2024, with localized areas showing markedly elevated thermal signatures. Integrated analysis with UAV aerial imagery revealed that these high-temperature zones corresponded closely to areas of sparse vegetation cover. This indicates that during summer months, surface temperatures are overwhelmingly controlled by solar radiation. As a result, summer thermal imagery primarily reflects differences in land cover types (e.g., vegetation vs. bare soil) rather than subsurface geological features. While unsuitable for identifying deep-seated thermal anomalies, these data provide a valuable high-contrast baseline for surface classification and for interpreting the more geologically significant winter thermal patterns.
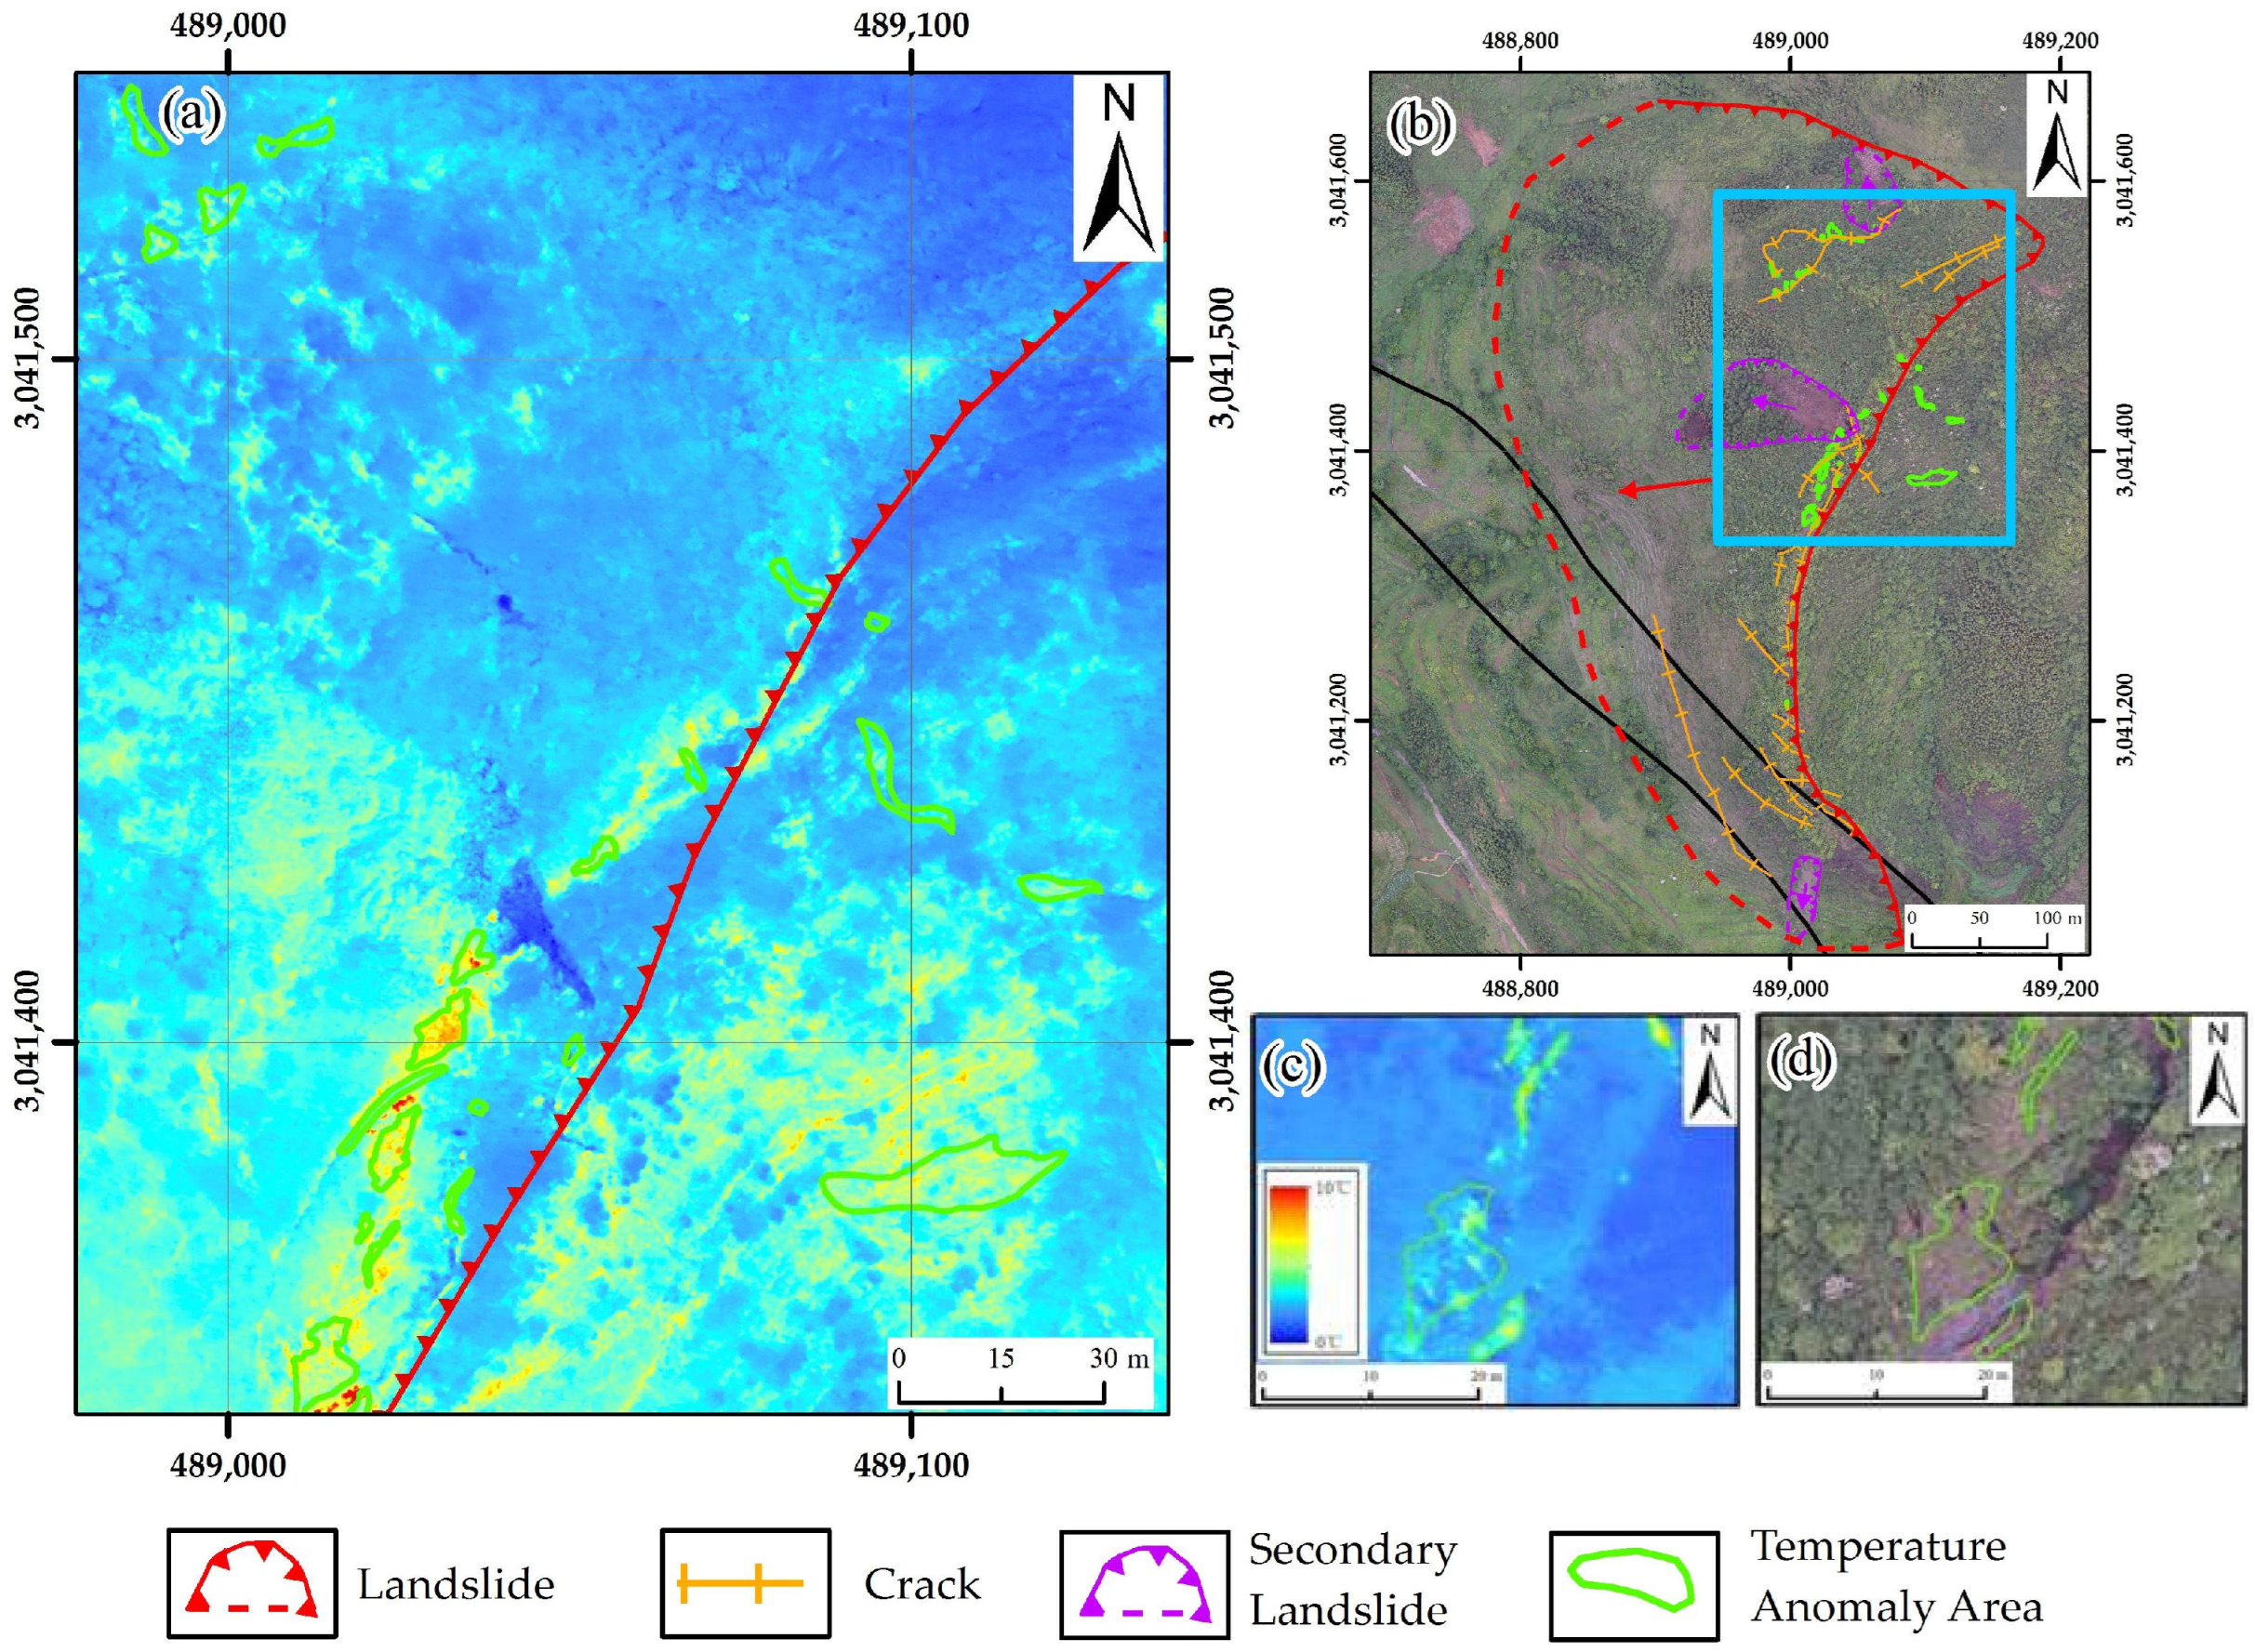
In contrast, the surface temperature data acquired from the IRT (infrared thermography) landslide area on 11 January 2025 better meets the requirements for winter landslide research. Initial analysis of the thermal infrared imagery identified 29 anomalously elevated surface temperature zones within the landslide area, ranging from 2 to 200 m2 in size and exhibiting temperature anomalies of 1.4 °C to 4.4 °C above ambient conditions (Figure 6a). We identify the temperature anomaly area through subjective judgment, with the main criteria being that the area is no smaller than 1 square meter and the temperature within the area is at least 2 °C higher than that of the surrounding slopes. On that day, we also conducted on-site measurements of surface temperature in typical areas using industrial thermometers, and the measured results were basically consistent with the inversion results of Unmanned Aerial Vehicle thermal infrared data. Correlation with deformation features revealed these thermal anomalies were predominantly distributed along the left boundary of the main landslide and the rear margins of secondary landslides H01 and H02, showing significant spatial correspondence with crack distributions (Figure 6b). Figure 6c shows the infrared thermography (IRT) derived temperature of crack concentrations. Figure 6d shows the optical image of cracks.
Multiple studies have demonstrated that open and partially open cracks exhibit positive thermal anomalies in infrared imagery [27,35]. This phenomenon occurs due to convective heat transfer from depth to the surface through air circulation within fracture networks [28]. Consequently, the bottom-to-surface heat transport mechanism and crack distributions at the Yangjiazhai landslide are possible factors which make thermal anomalies.

3.3. Surface Temperature and Underground Coal Mining

Combining the distribution of deformation signs in the Yangjiazhai landslide with the distribution of surface temperature anomaly zones (Figure 5b), it can be observed that surface temperatures are elevated in some crack zones (e.g., C03~C07), while no significant temperature anomalies are present in others (e.g., C09~C20). Elevated surface temperatures at crack locations are often caused by circulating air within the crack network transporting heat from depth to the surface, and a large area of coal mine goaf (mined-out area) exists beneath the Yangjiazhai landslide zone where deformation of the overlying rock mass has led to the formation of mountain cracks [38]. This suggests that cracks exhibiting elevated surface temperatures (such as C03~C07) are more likely to be connected to the underground goaf, whereas cracks showing no significant surface temperature anomalies (such as C09~C20) are less likely to have such connectivity.
To further verify this hypothesis, simulations were performed using the Partial Differential Equation Toolbox in MATLAB R2023b to model the relationship between the connectivity of underground goafs and cracks, and the surface temperature of cracks. The cracks were simplified as three-dimensional cubes. The actual shape of the cracks on the surface of the landslide mass is very complex, and the path from bottom to top may even be distorted. We use this simplified model here to explore whether this model is feasible, and it cannot represent the real situation.
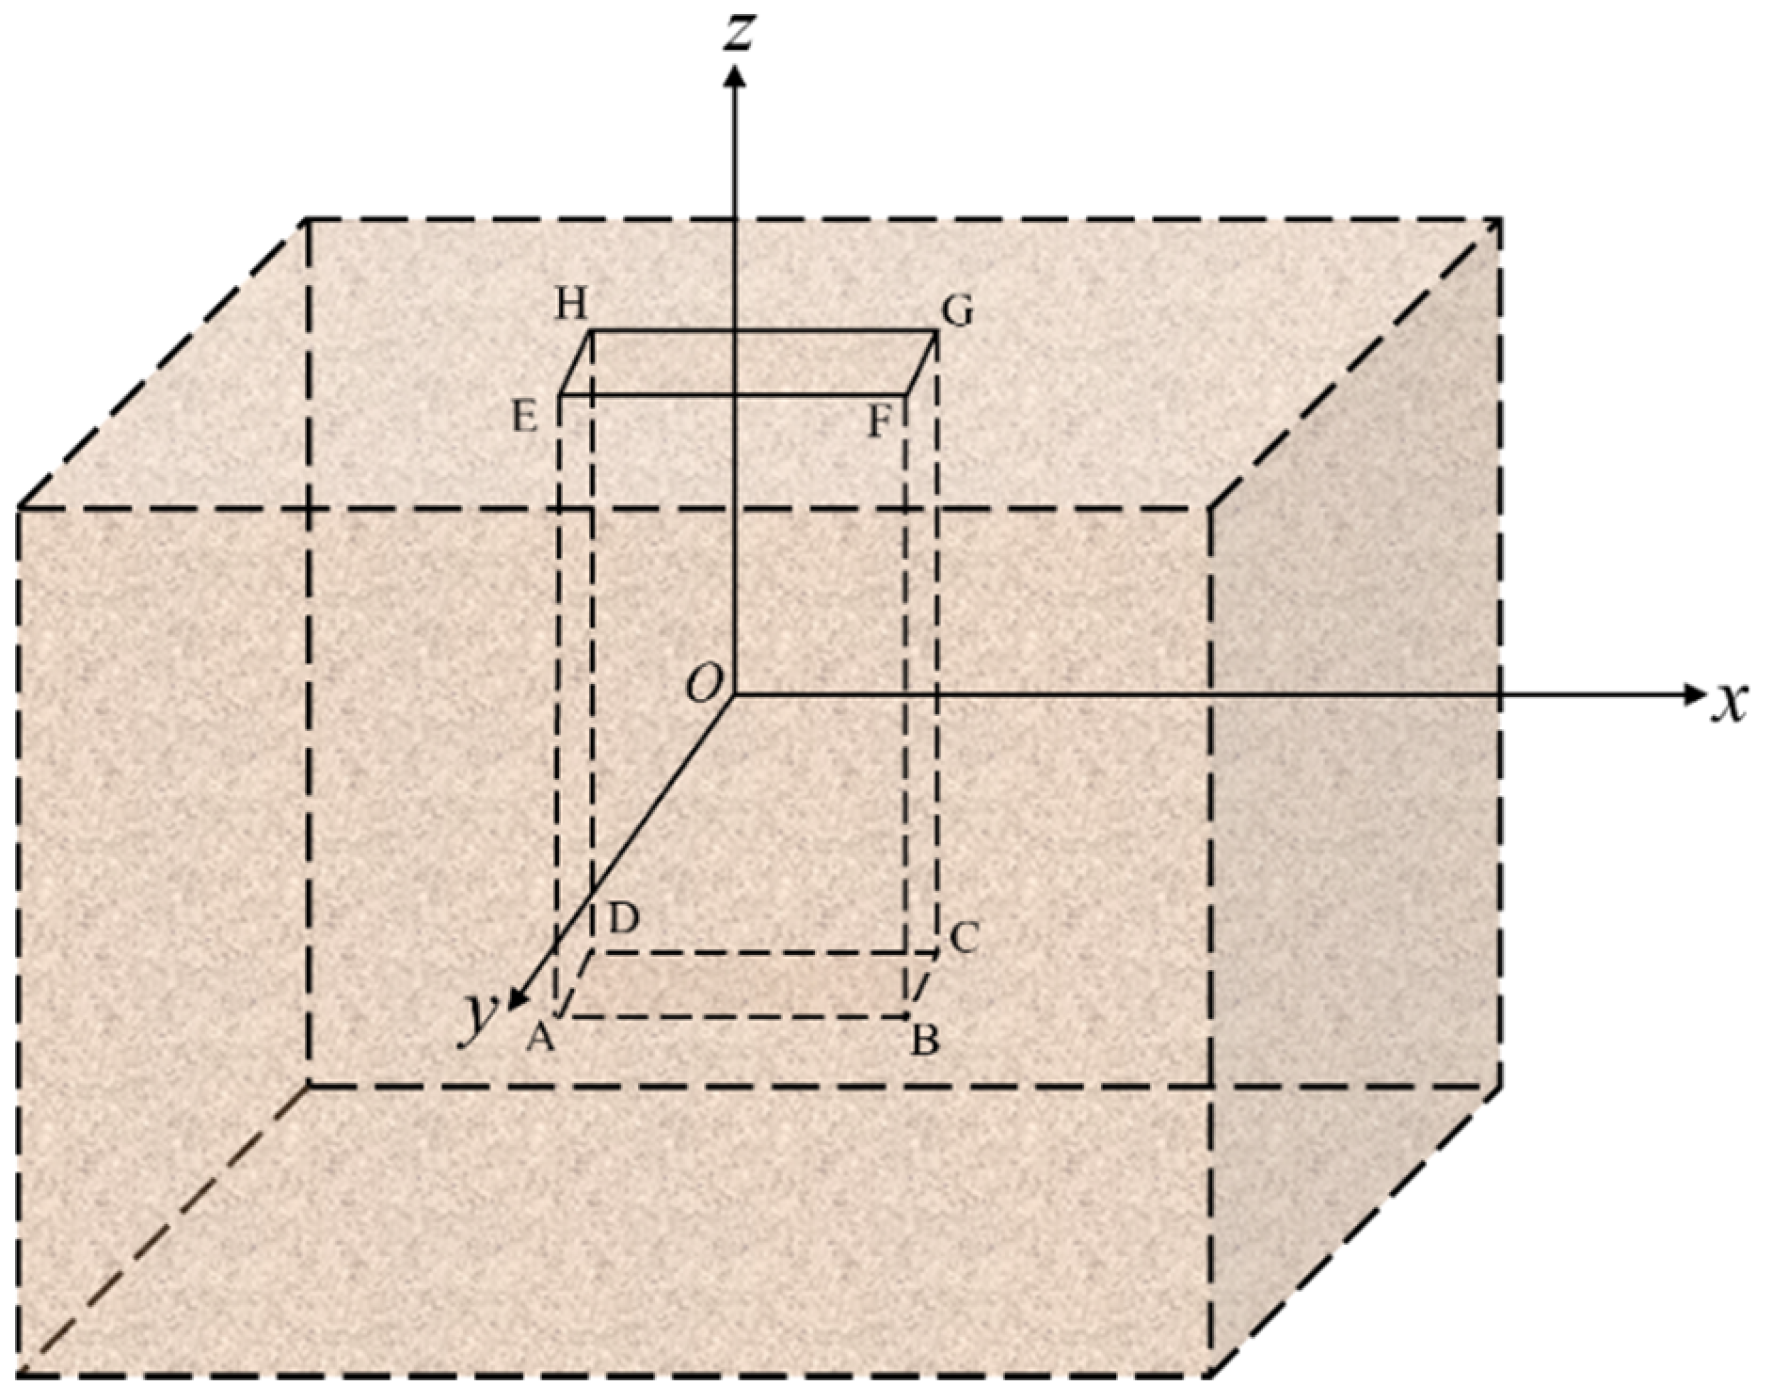
We use this simplified cube model to briefly illustrate the heat conduction of cracks, while the actual situation of cracks can be much more complex in this model (Figure 7):
Plane ABCD represents the crack bottom. Planes ADHE, ABFE, BCGF, and CDHG represent the surrounding soil/rock mass forming the crack sidewalls. Given the high specific heat capacity of the soil/rock mass, its temperature was set as a depth-dependent constant value. The simulation only accounted for heat transfer from air within an underground goaf, if present, at the crack bottom.
The PDE toolbox is used to set up the model. In the beginning, the temperature at the top is set at 0 °C, and the temperature at the bottom is set at 16 °C. The left and right sides of the crack satisfy Dirichlet conditions. The top side of the crack satisfies Neumann conditions, and the top side satisfies the Robin condition. The simulation length is set at 12 h. The parabolic equation (ρCp∂t∂T − ∇·(k∇T) = Q) is chosen, where d (ρ·Cp) is the heat storage capacity of the material; ρ is density of the material (mass per unit volume); Cp is specific heat capacity at constant pressure; ρ·Cp represents the volumetric heat capacity; c is the thermal conductivity of the material; a is the heat exchange term with the environment; and f is the internal heat source term. In this simulation, we set c = 0.024, a = 0, f = 0, d = 1.247 × 1000.
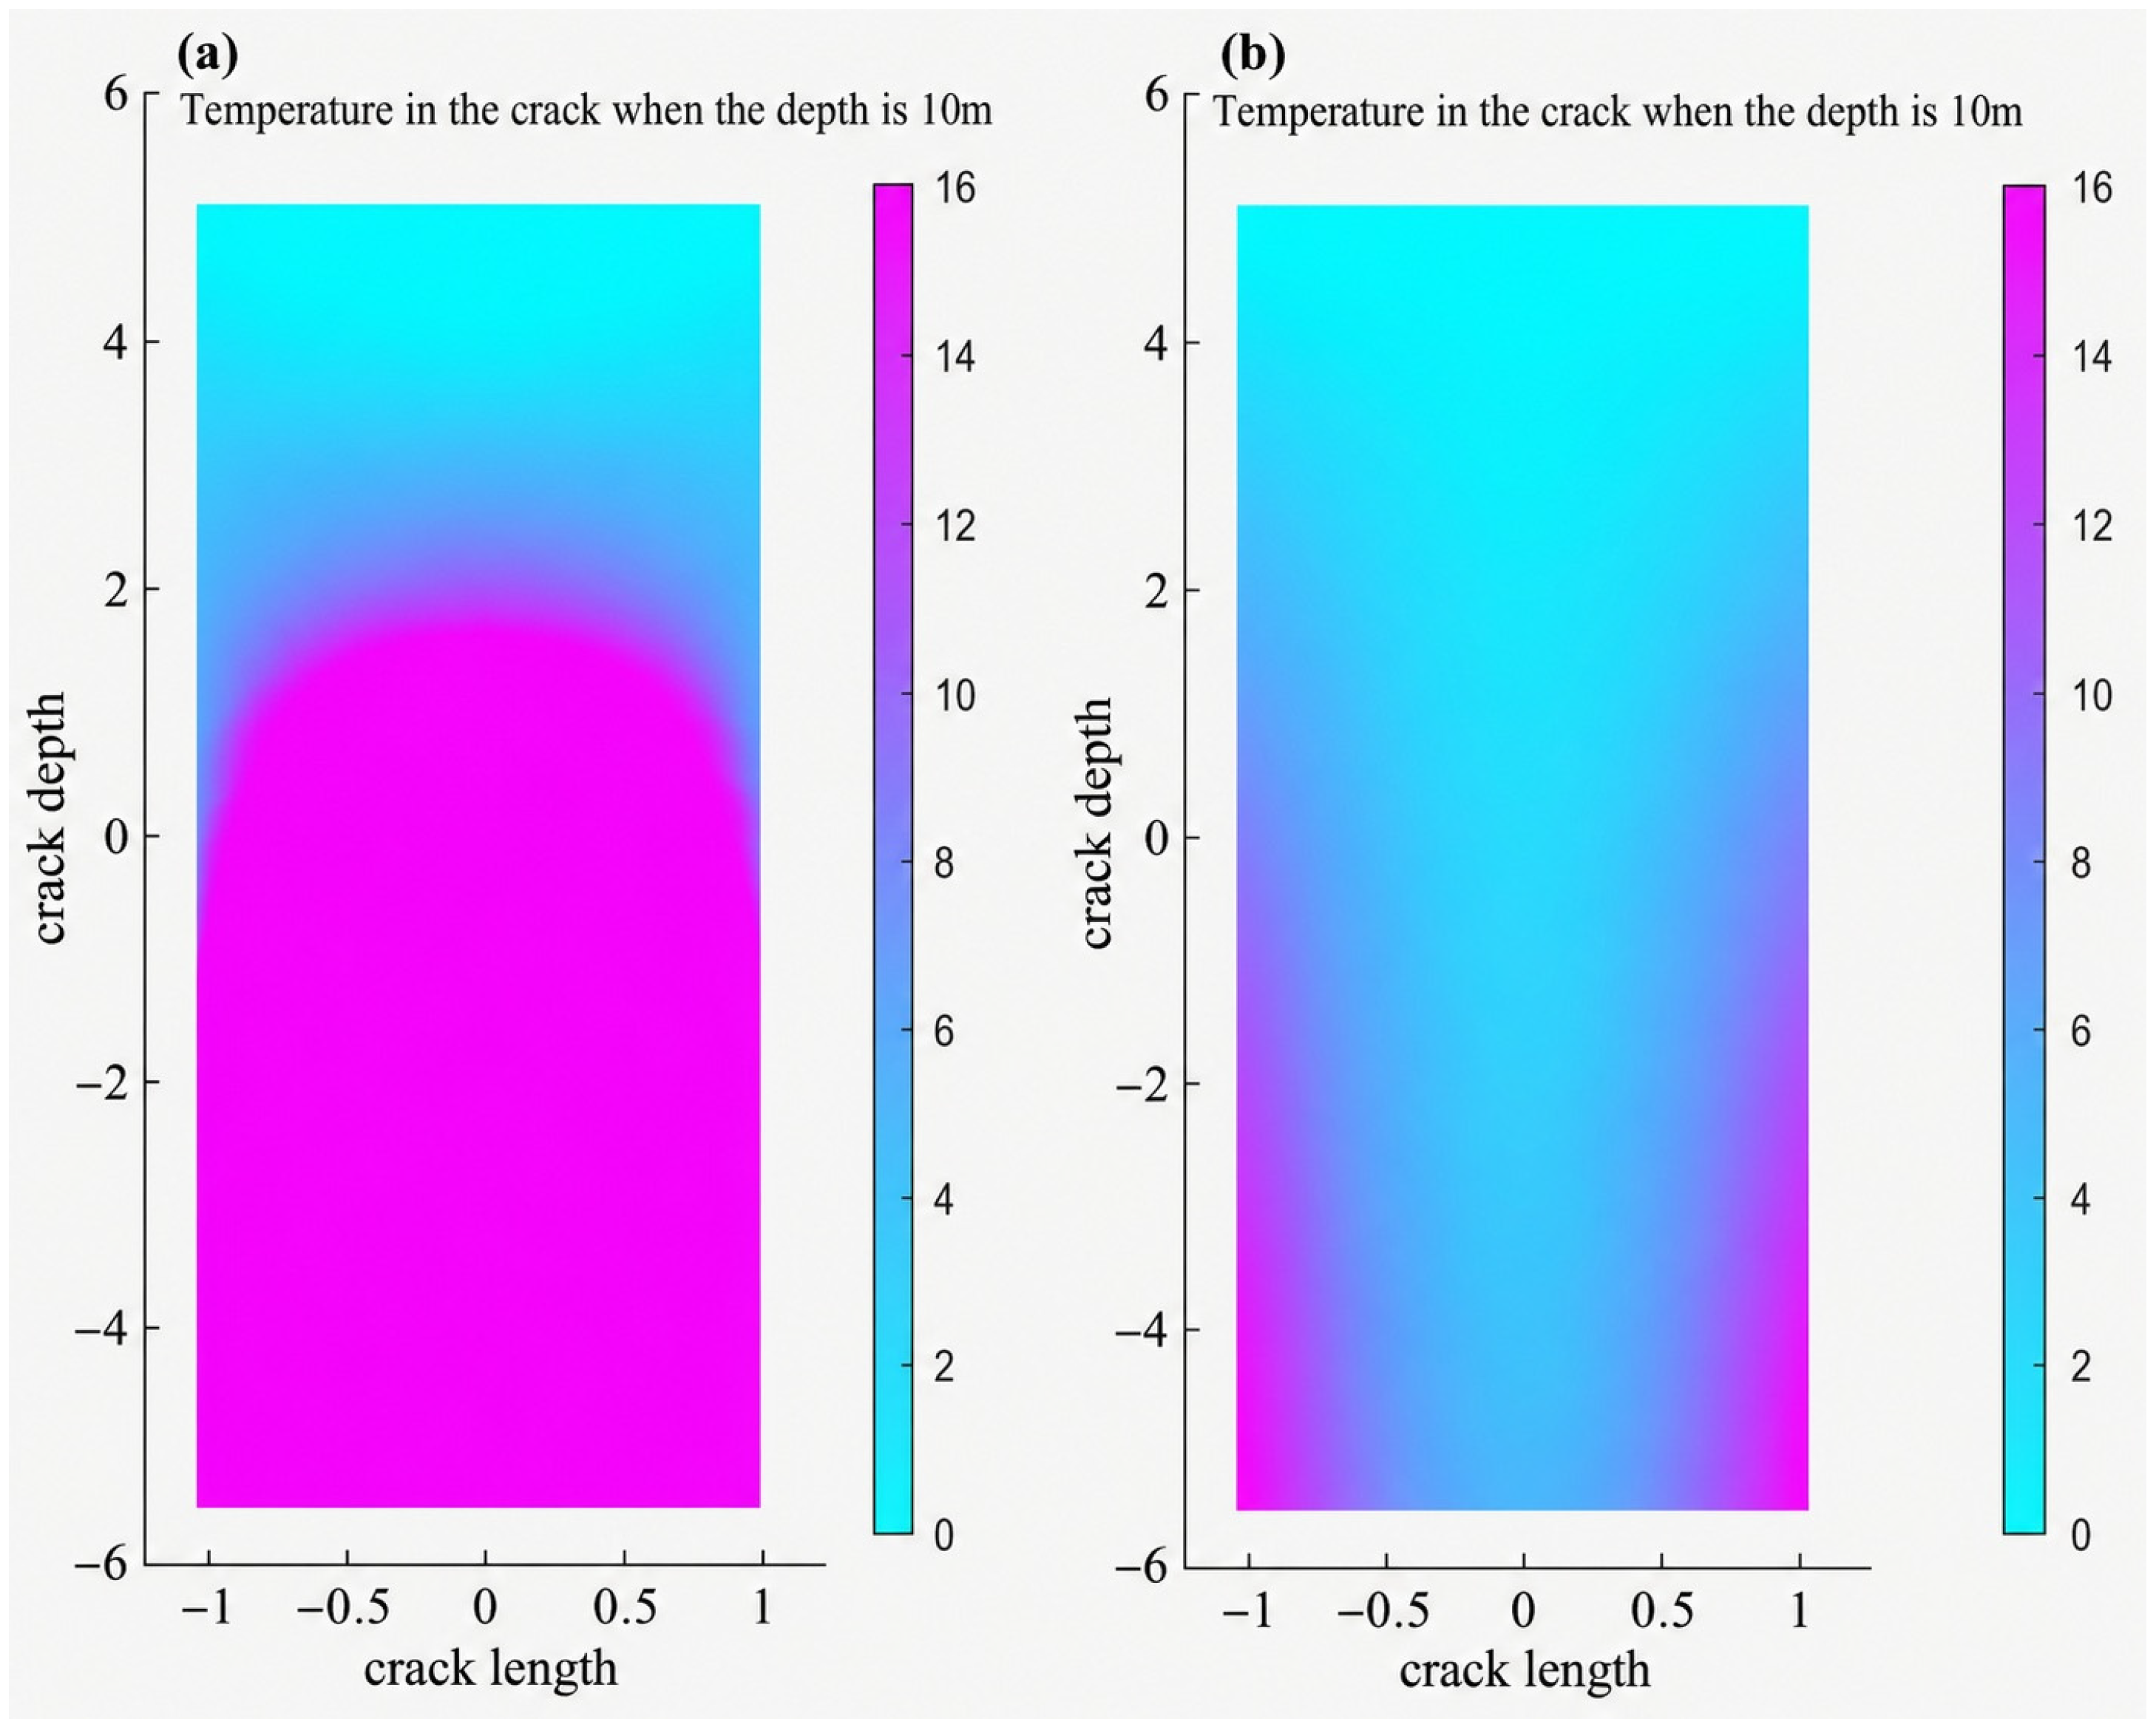
In situation (a) when the crack is not connected to the goaf, the parameters of the bottom side are set as: g = 0.1, q = 0; in situation (b) when the crack is connected to the goaf, the parameters of the bottom side are set as: g = 5, q = 0. For the left and right sides, the parameters are set as: h = 1, r = −1.6 × y + 8. In the PDE toolbox, the Dirichlet condition is hu = r (with h being a weighting coefficient and r the prescribed value), and the Neumann condition is n c u + q u = g (with q being the reactive boundary coefficient and g the boundary source); u is the temperature vector field.
To analyze the impact of heat transfer from air within the underground goaf on crack temperatures, a parallel cross-section in the XOZ plane was selected. The ambient temperature above the fracture was set to 0 °C as a boundary condition.
Case 1 (connected to the goaf): When the crack bottom was connected to the underground goaf, it was assumed that the bottom continuously transferred heat to the air inside the fracture. The simulation results for this case are shown in Figure 8a.
Case 2 (not connected to the goaf): When the crack bottom was not connected to the underground goaf, it was assumed that the bottom contributed negligible heat transfer to the air inside the crack. The simulation results for this case are shown in Figure 8b.
The results demonstrate that, under identical conditions of crack width, depth, and external ambient temperature, cracks connected to the goaf may likely experience a higher surface temperature difference due to the conductive heat transfer from air at their base.
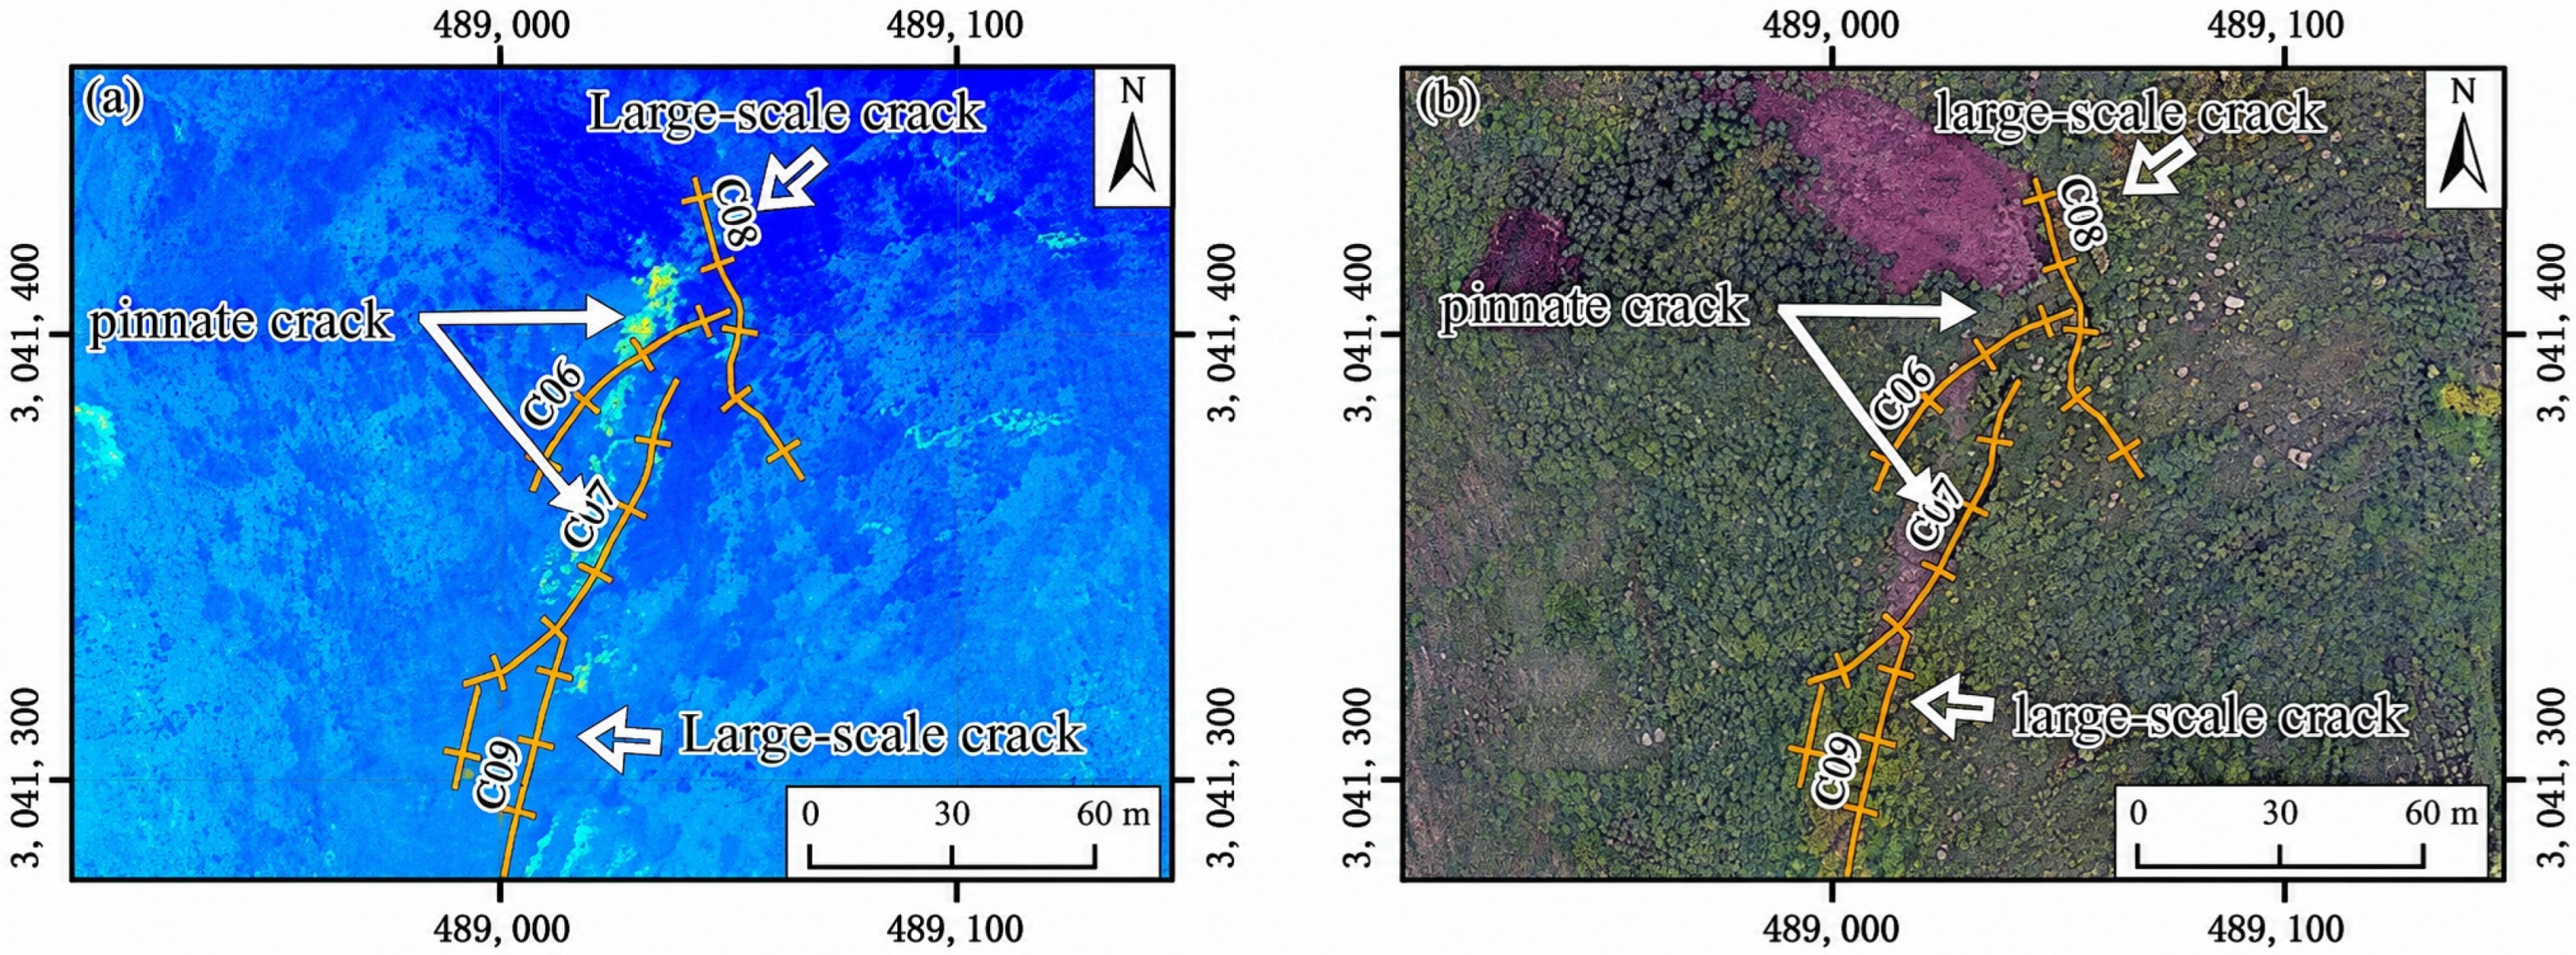
Furthermore, when analyzing the surface temperature in the key area of large-scale cracks C01~C20 (we have 20 observation points in total), it was observed that surface temperature anomalies are concentrated in zones of developed feather cracks (feather cracks refer to numerous small-scale cracks arranged like feathers on both sides of the main crack) surrounding these major cracks. Figure 9a shows the infrared thermography (IRT)-derived temperature image of the large crack distribution area, and Figure 9b shows the UAV orthophoto of this area. Notably, it is hard to find elevated surface temperatures in the Yangjiazhai landslide area where the crack width was great than 1–2 m in this experiment. It is preliminarily inferred that this occurs because excessive crack width facilitates sufficient heat exchange between the air within the crack and the cooler ambient environment. Consequently, even if minor heat is transported from deeper crack air to the surface, the surface temperatures of large-scale cracks hardly manifest significant elevation.
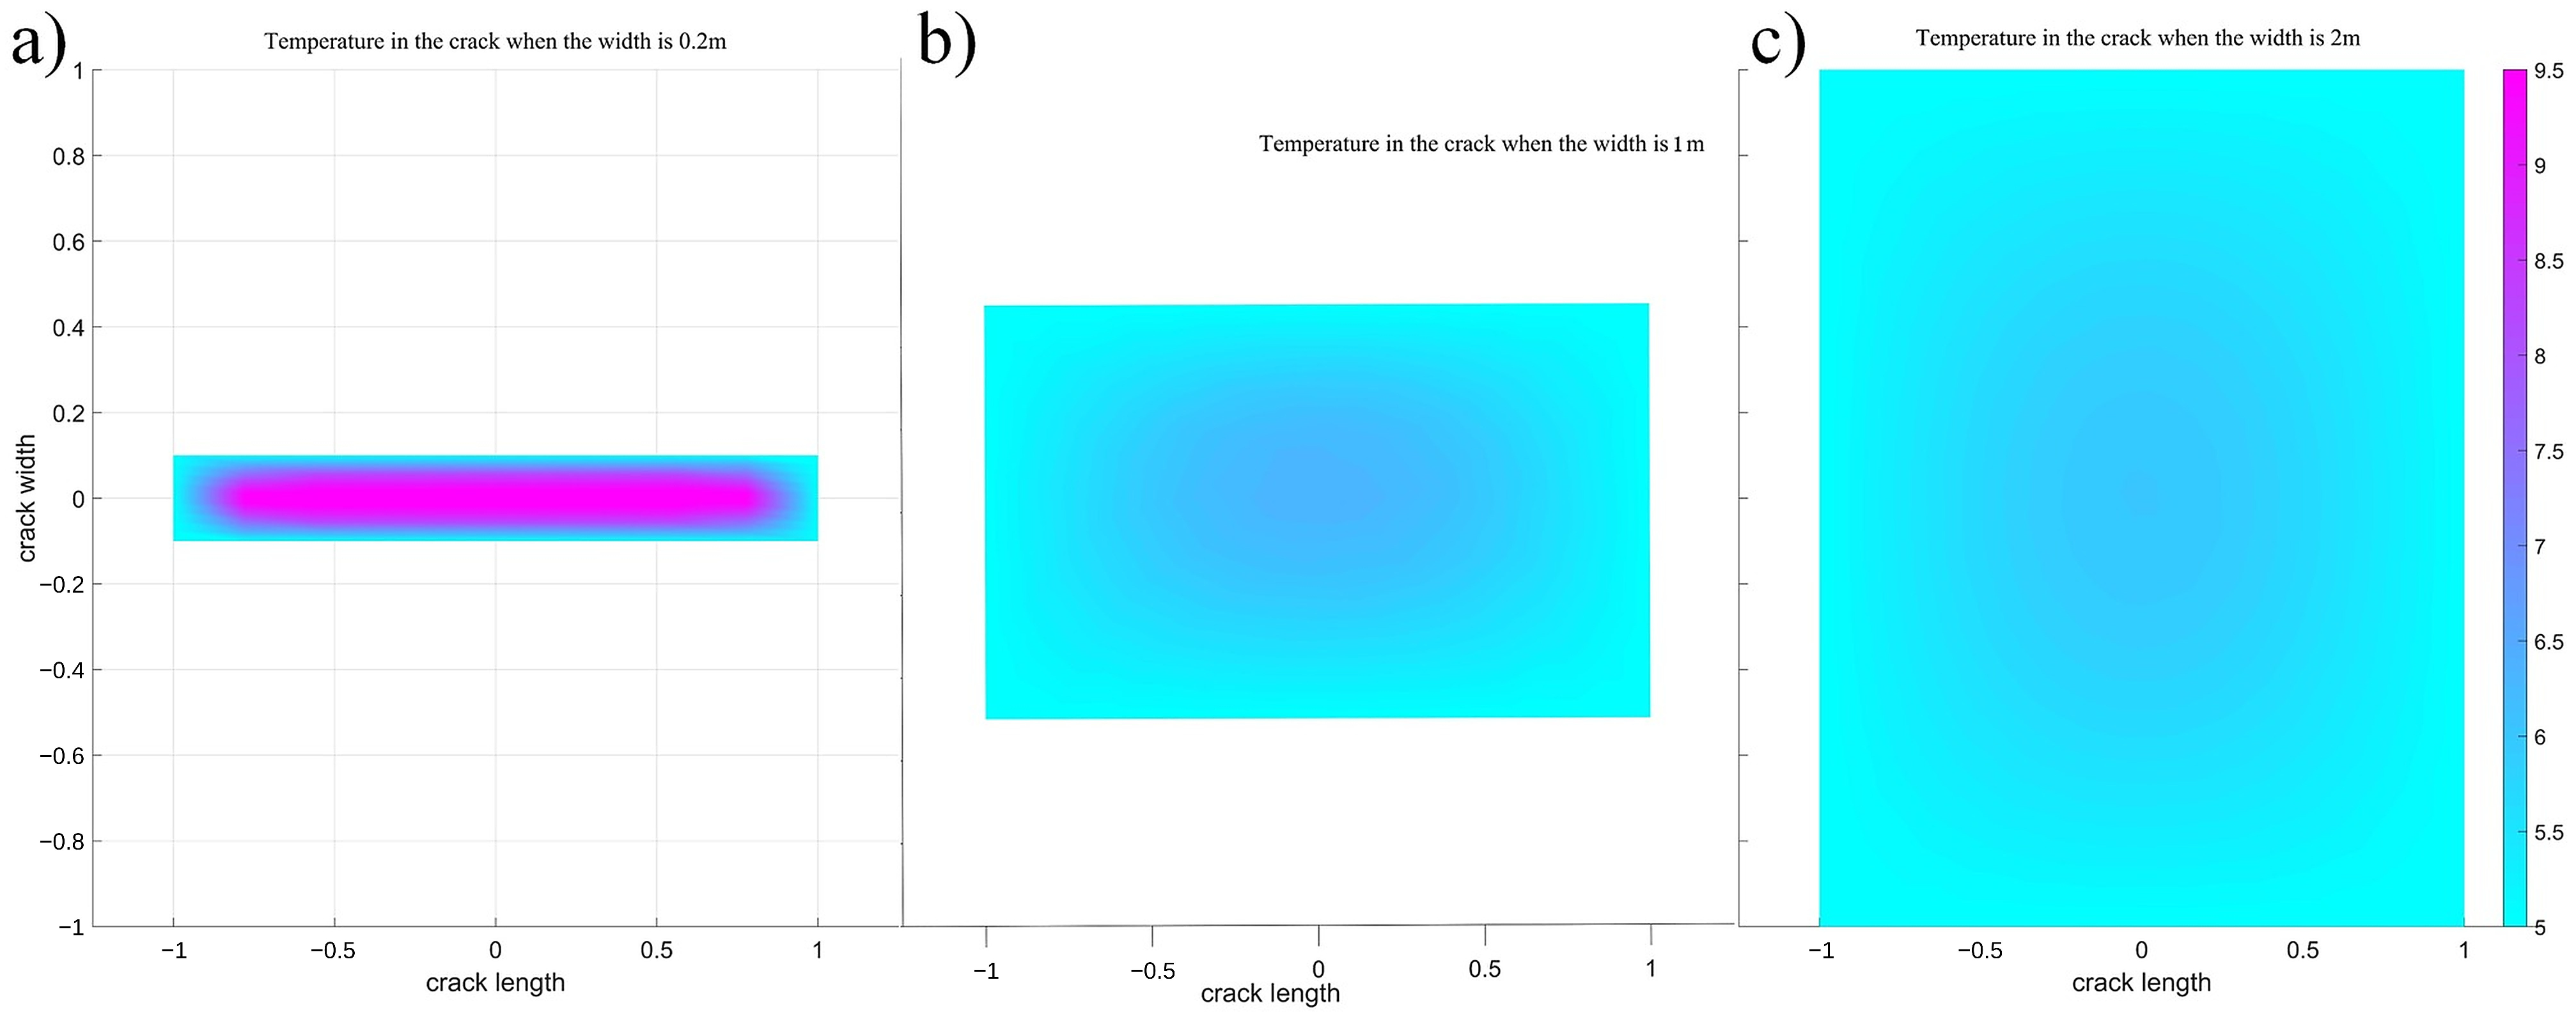
To verify this concept, a parallel cross-section in the XOY plane was analyzed to investigate the influence of crack width on crack surface temperature under conditions where internal air transports heat from depth to the surface (Figure 7), with constant heat conduction at the crack bottom, crack depth, and external ambient temperature. Simulation results for a crack width of 0.2 m are shown in Figure 10a. Simulation results for a crack width of 1.0 m are shown in Figure 10b. Simulation results for a crack width of 2.0 m are shown in Figure 10c.
It was found that the internal temperature of the 0.2 m wide crack was significantly higher than that of the 1.0 m wide and 2.0 m wide cracks. This occurs because excessive crack width enhances heat exchange between the air inside the crack and the external environment. Consequently, the surface temperature of the crack converges with the ambient temperature, thereby obscuring the phenomenon of deep-seated heat transport to the surface via circulating air within the crack.
Therefore, for landslides disturbed by underground mining, the connectivity between cracks and underground goafs can be preliminarily assessed by integrating the distribution of deformation signs with winter surface temperature characteristics on slopes. This analysis aids in evaluating the development and deformation extent of surface fractures on the landslide, providing critical reference information for understanding crack evolution and assessing landslide stability.
However, it is essential to note that to mitigate the influence of solar radiation on landslide surface temperatures, thermal infrared data acquisition should be conducted under overcast, fog-free conditions. Analysis should focus on the surface temperatures of fractures within 1.0 m width to avoid inaccuracies in deformation extent assessment caused by excessive crack width.

4. Discussion

4.1. Surface Temperature Characteristics of Landslide Elements

4.1.1. Surface Temperature Characteristics of Land Cover Types

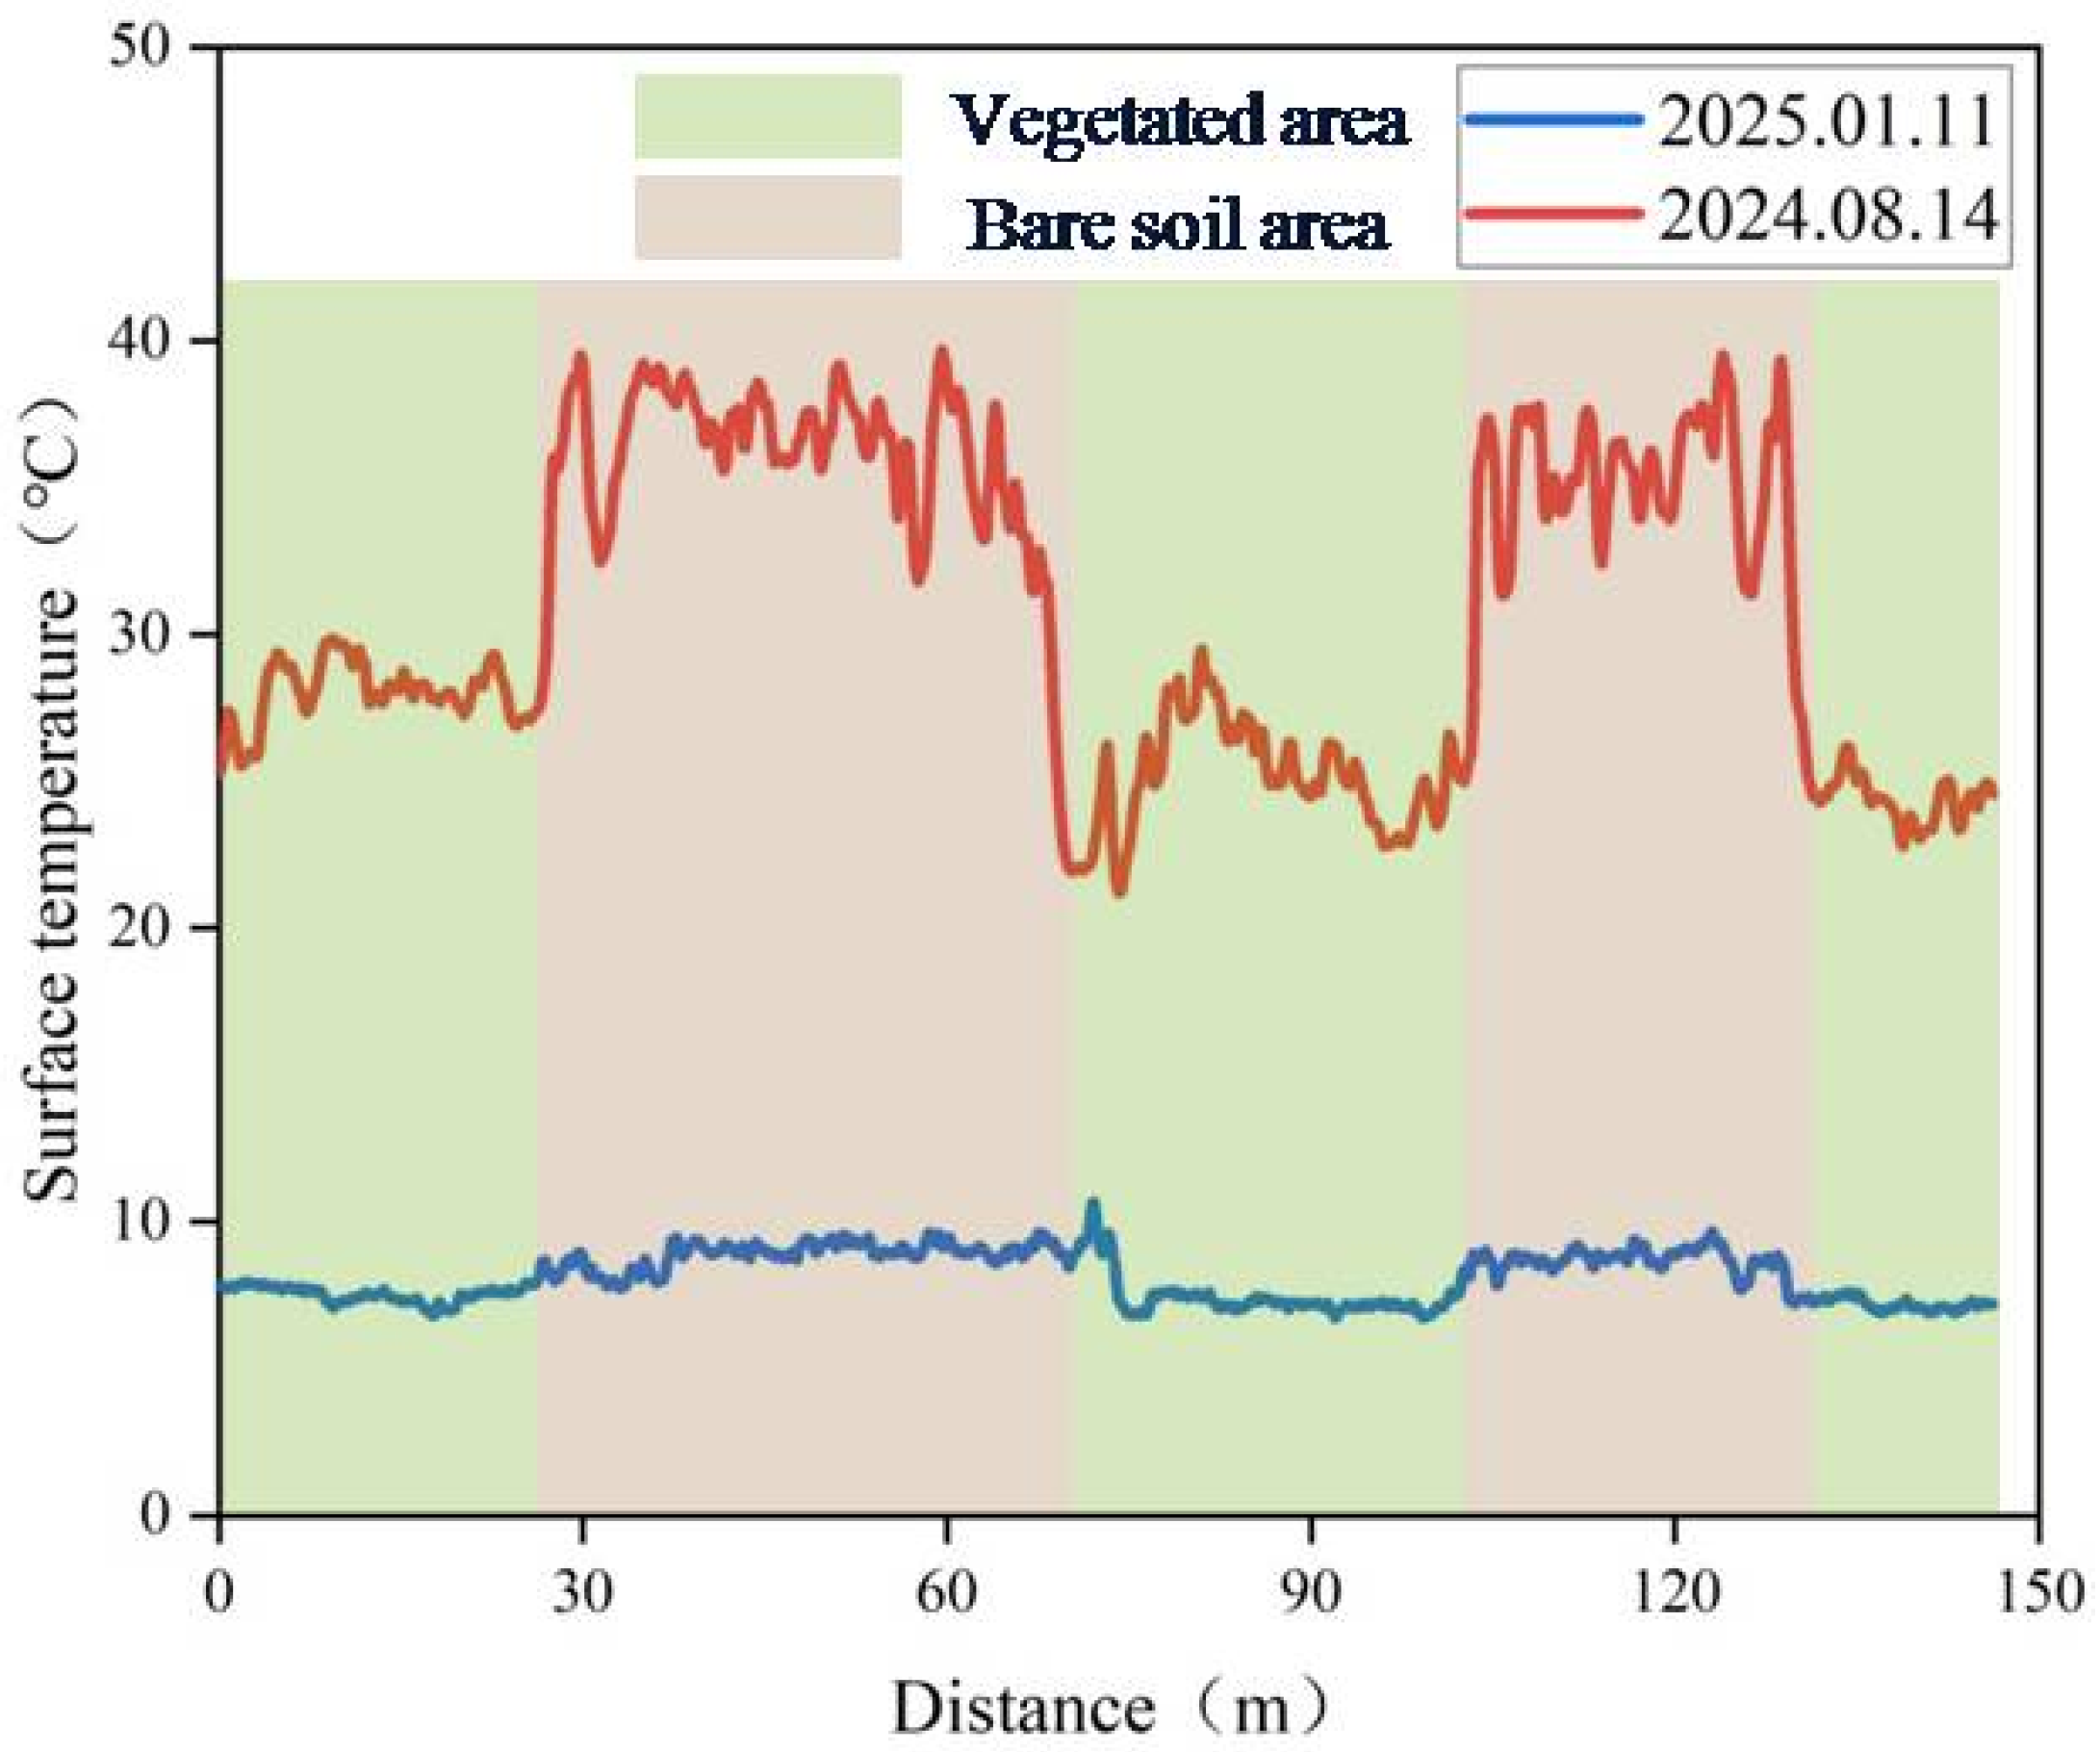
To establish a baseline for land cover classification and to illustrate the contrasting thermal regimes between seasons, we compared summer and winter surface temperatures across typical surface types. It must be noted that summer thermal patterns are dominated by solar heating and only reflect short-wave absorption properties, whereas winter data—acquired under minimized solar influence—more closely reflect thermal inertia and subsurface conditions. The observed differences are thus useful for discriminating surface features, not for inferring deep thermal anomalies. The research team analyzed the land surface temperature characteristics of geological environmental elements in the landslide area. Vegetated areas generally exhibit lower surface temperatures than bare soil areas, which aligns with empirical findings from the literature [26,30]. Further comparative analysis revealed that, because the study area is located in the China, Northern Hemisphere, which makes this phenomenon. Figure 11a shows the vegetation distribution of the study area. On 11 January 2025 (winter), the temperature difference between vegetated areas and bare soil areas was approximately 2–4 °C (Figure 11b). During the summer (14 August 2024), this temperature difference reached 8–10 °C (Figure 11c). Solar radiation energy is significantly higher in summer than in winter. Besides causing an overall increase in land surface temperatures across the landslide area, this also results in a greater temperature difference between vegetated and bare soil zones (Figure 12).

4.1.2. Surface Temperature Characteristics of Cracks

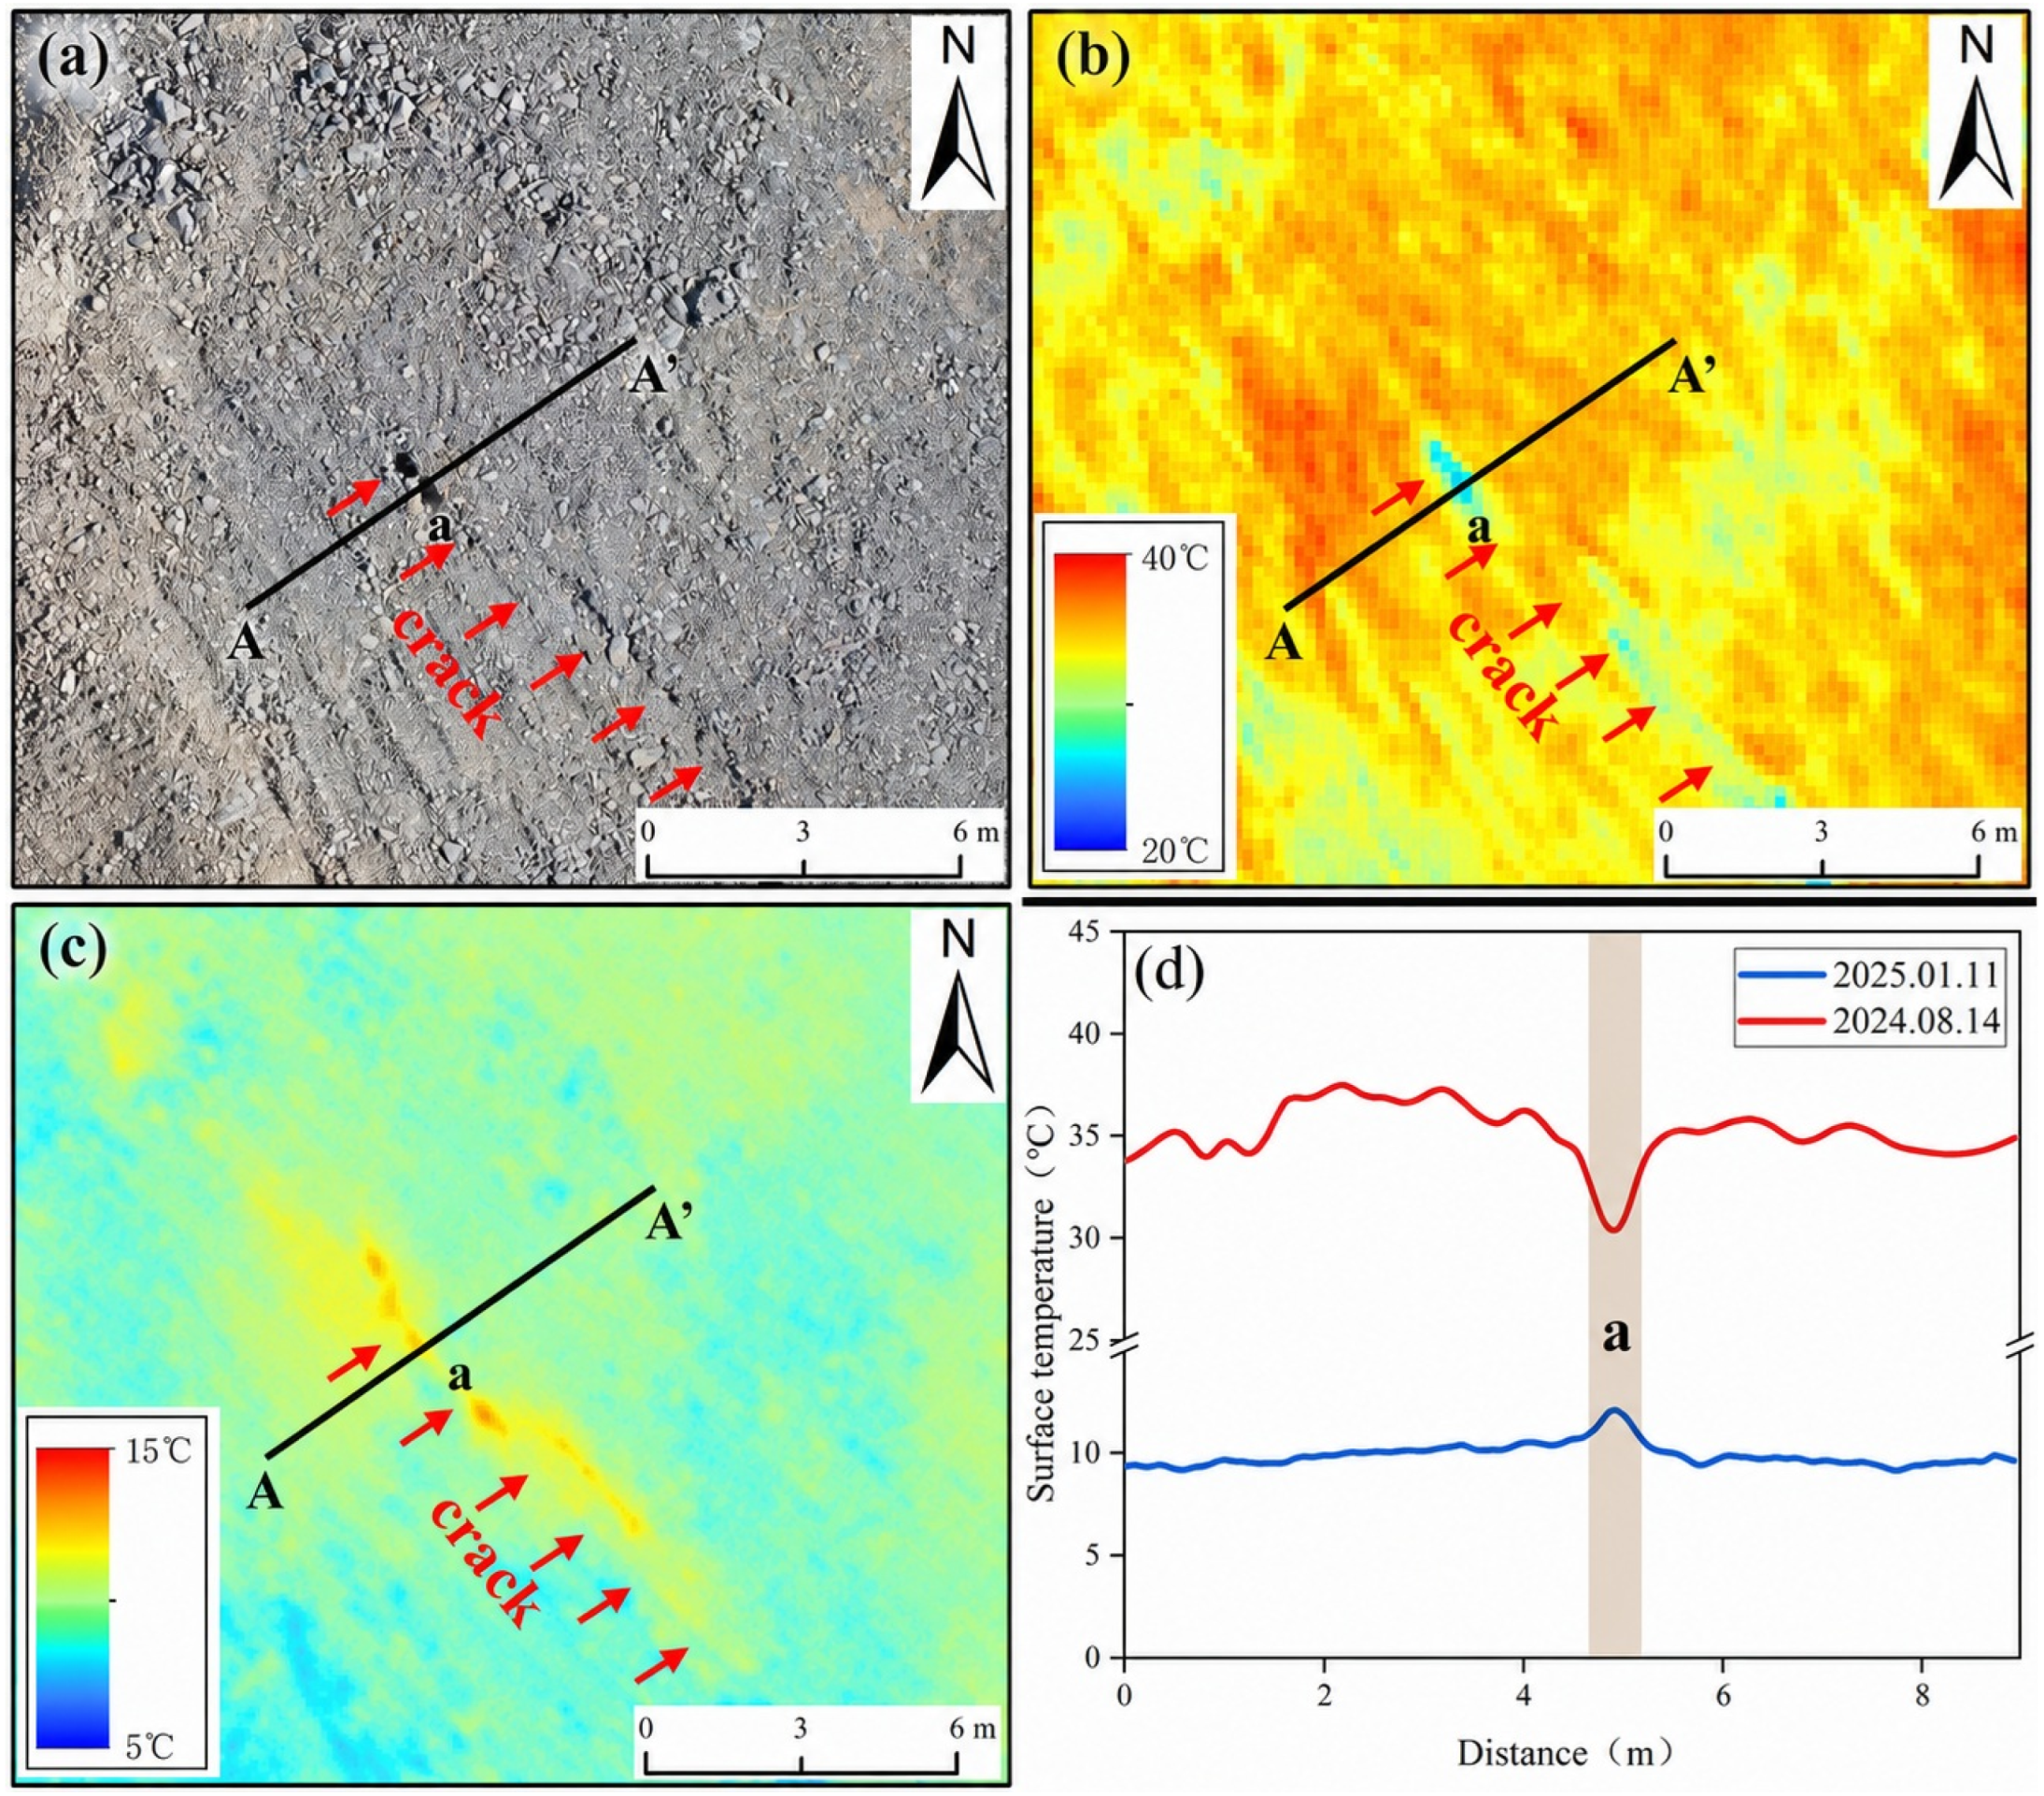
Although summer crack temperatures are primarily controlled by shading and thermal inertia, the seasonal inversion (cooler in summer, warmer in winter) provides a practical diagnostic signature for crack detection in multi-temporal IRT surveys. The anomalous surface temperature characteristics of cracks represent a key focus in thermal infrared remote sensing research for landslide studies. Numerous publications indicate that air circulating within crack networks transfers heat from deeper ground layers to the surface, resulting in higher surface temperatures over cracks compared to surrounding areas [27,28,30,35,46,47,48]. To comparatively analyze crack surface temperature characteristics in summer versus winter, we selected an 8–10 m long, 0.3–0.5 m wide crack in a bare soil area (Figure 13a). Observations revealed that during winter (11 January 2025), the crack’s surface temperature was approximately 3–4 °C higher than adjacent zones (Figure 13c,d). Conversely, during summer (14 August 2024), it measured 3–6 °C lower than the surroundings (Figure 13b,d). This seasonal inversion occurs because air circulating within cracks remains relatively thermostable due to reduced solar radiation exposure. Consequently, crack surface temperatures exceed adjacent areas in winter but fall below them in summer.

4.1.3. Surface Temperature Characteristics of Accumulation Bodies with Different Grain Sizes

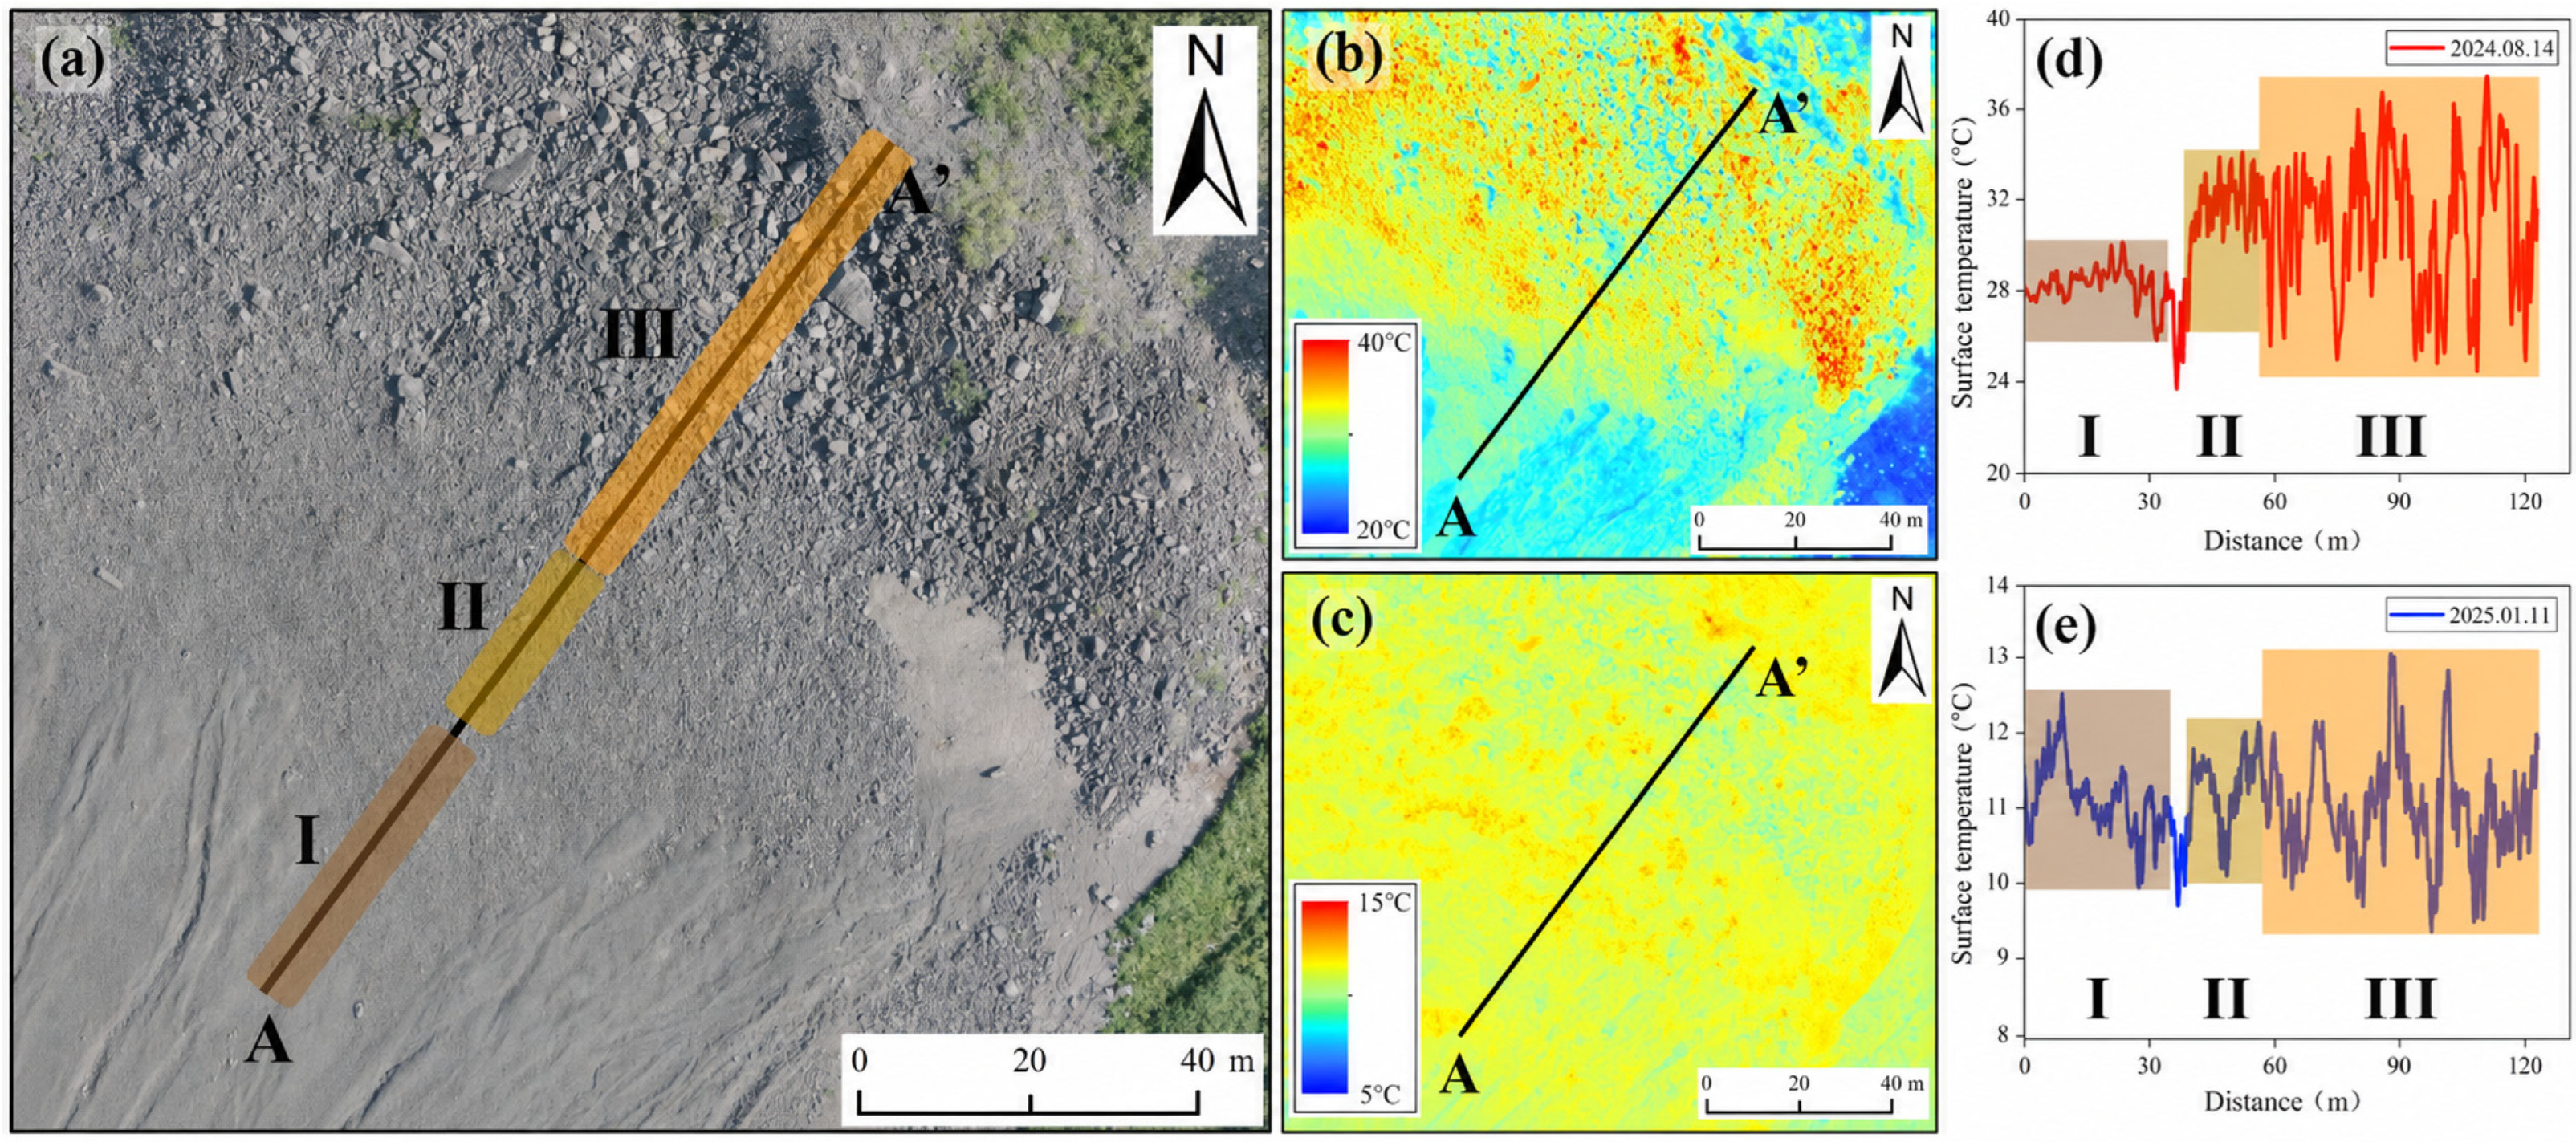
The exaggerated thermal contrasts in summer facilitate the delineation of debris grain-size zones and drainage channels, which can then be monitored for winter anomalies. Moisture-rich terrain with varying roughness exhibits distinct thermal response characteristics (Pappalardo et al. 2018) [30]. To analyze land surface temperature features, we selected accumulation zones composed of rock blocks with different grain sizes: Zone I (0.1–0.3 m), Zone II (0.3–0.7 m), and Zone III (0.7–3.0 m) (Figure 14a). Significant temperature differences were observed across these zones on 14 August 2024. Zone I registered 26–30 °C, Zone II 27–34 °C, and Zone III 25–38 °C (Figure 14b,d). Overall, accumulation areas with larger block sizes demonstrated greater diurnal surface temperature fluctuations during summer. However, this pattern was less pronounced in winter (Figure 14c,e). This phenomenon arises because coarser-grained accumulations have higher surface roughness, creating differential solar radiation incidence angles across micro-topography. Consequently, surface temperatures become more variable—an effect amplified by intense summer solar radiation—whereas reduced winter energy input minimizes thermal contrasts.

4.1.4. Surface Temperature Characteristics of Accumulation Bodies with Varying Moisture Contents

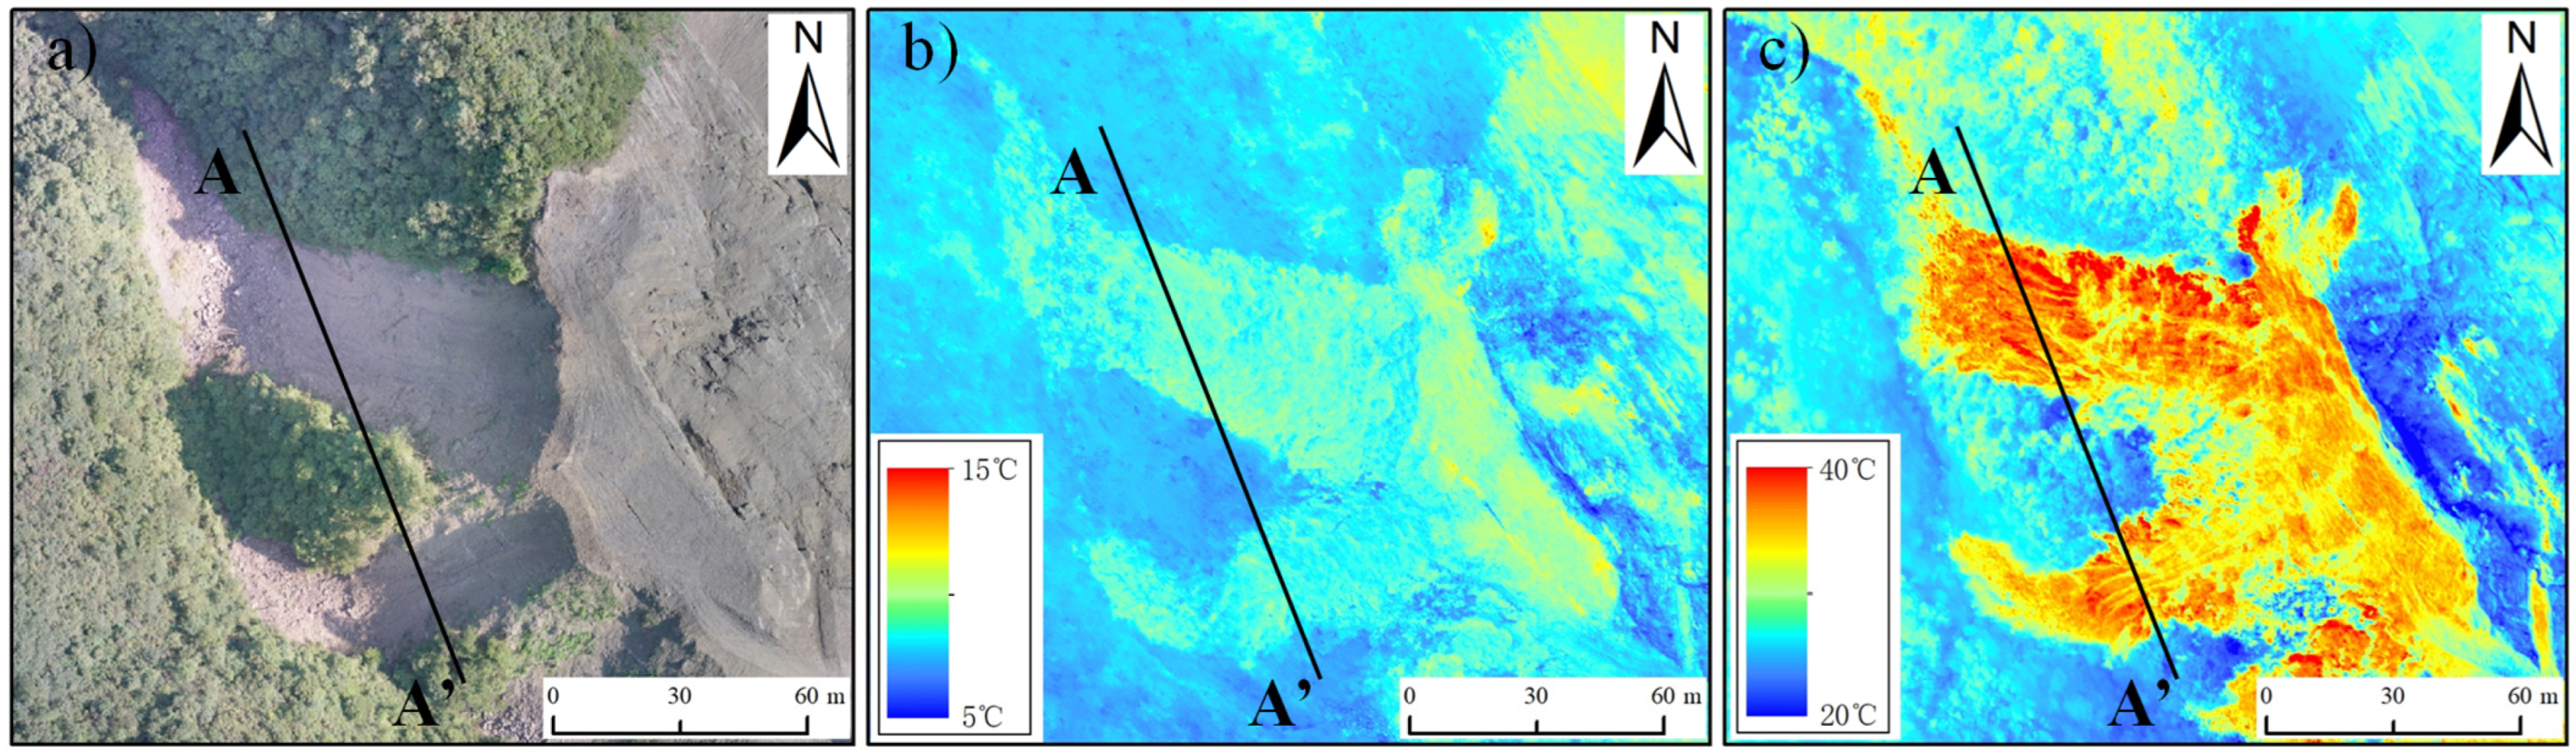
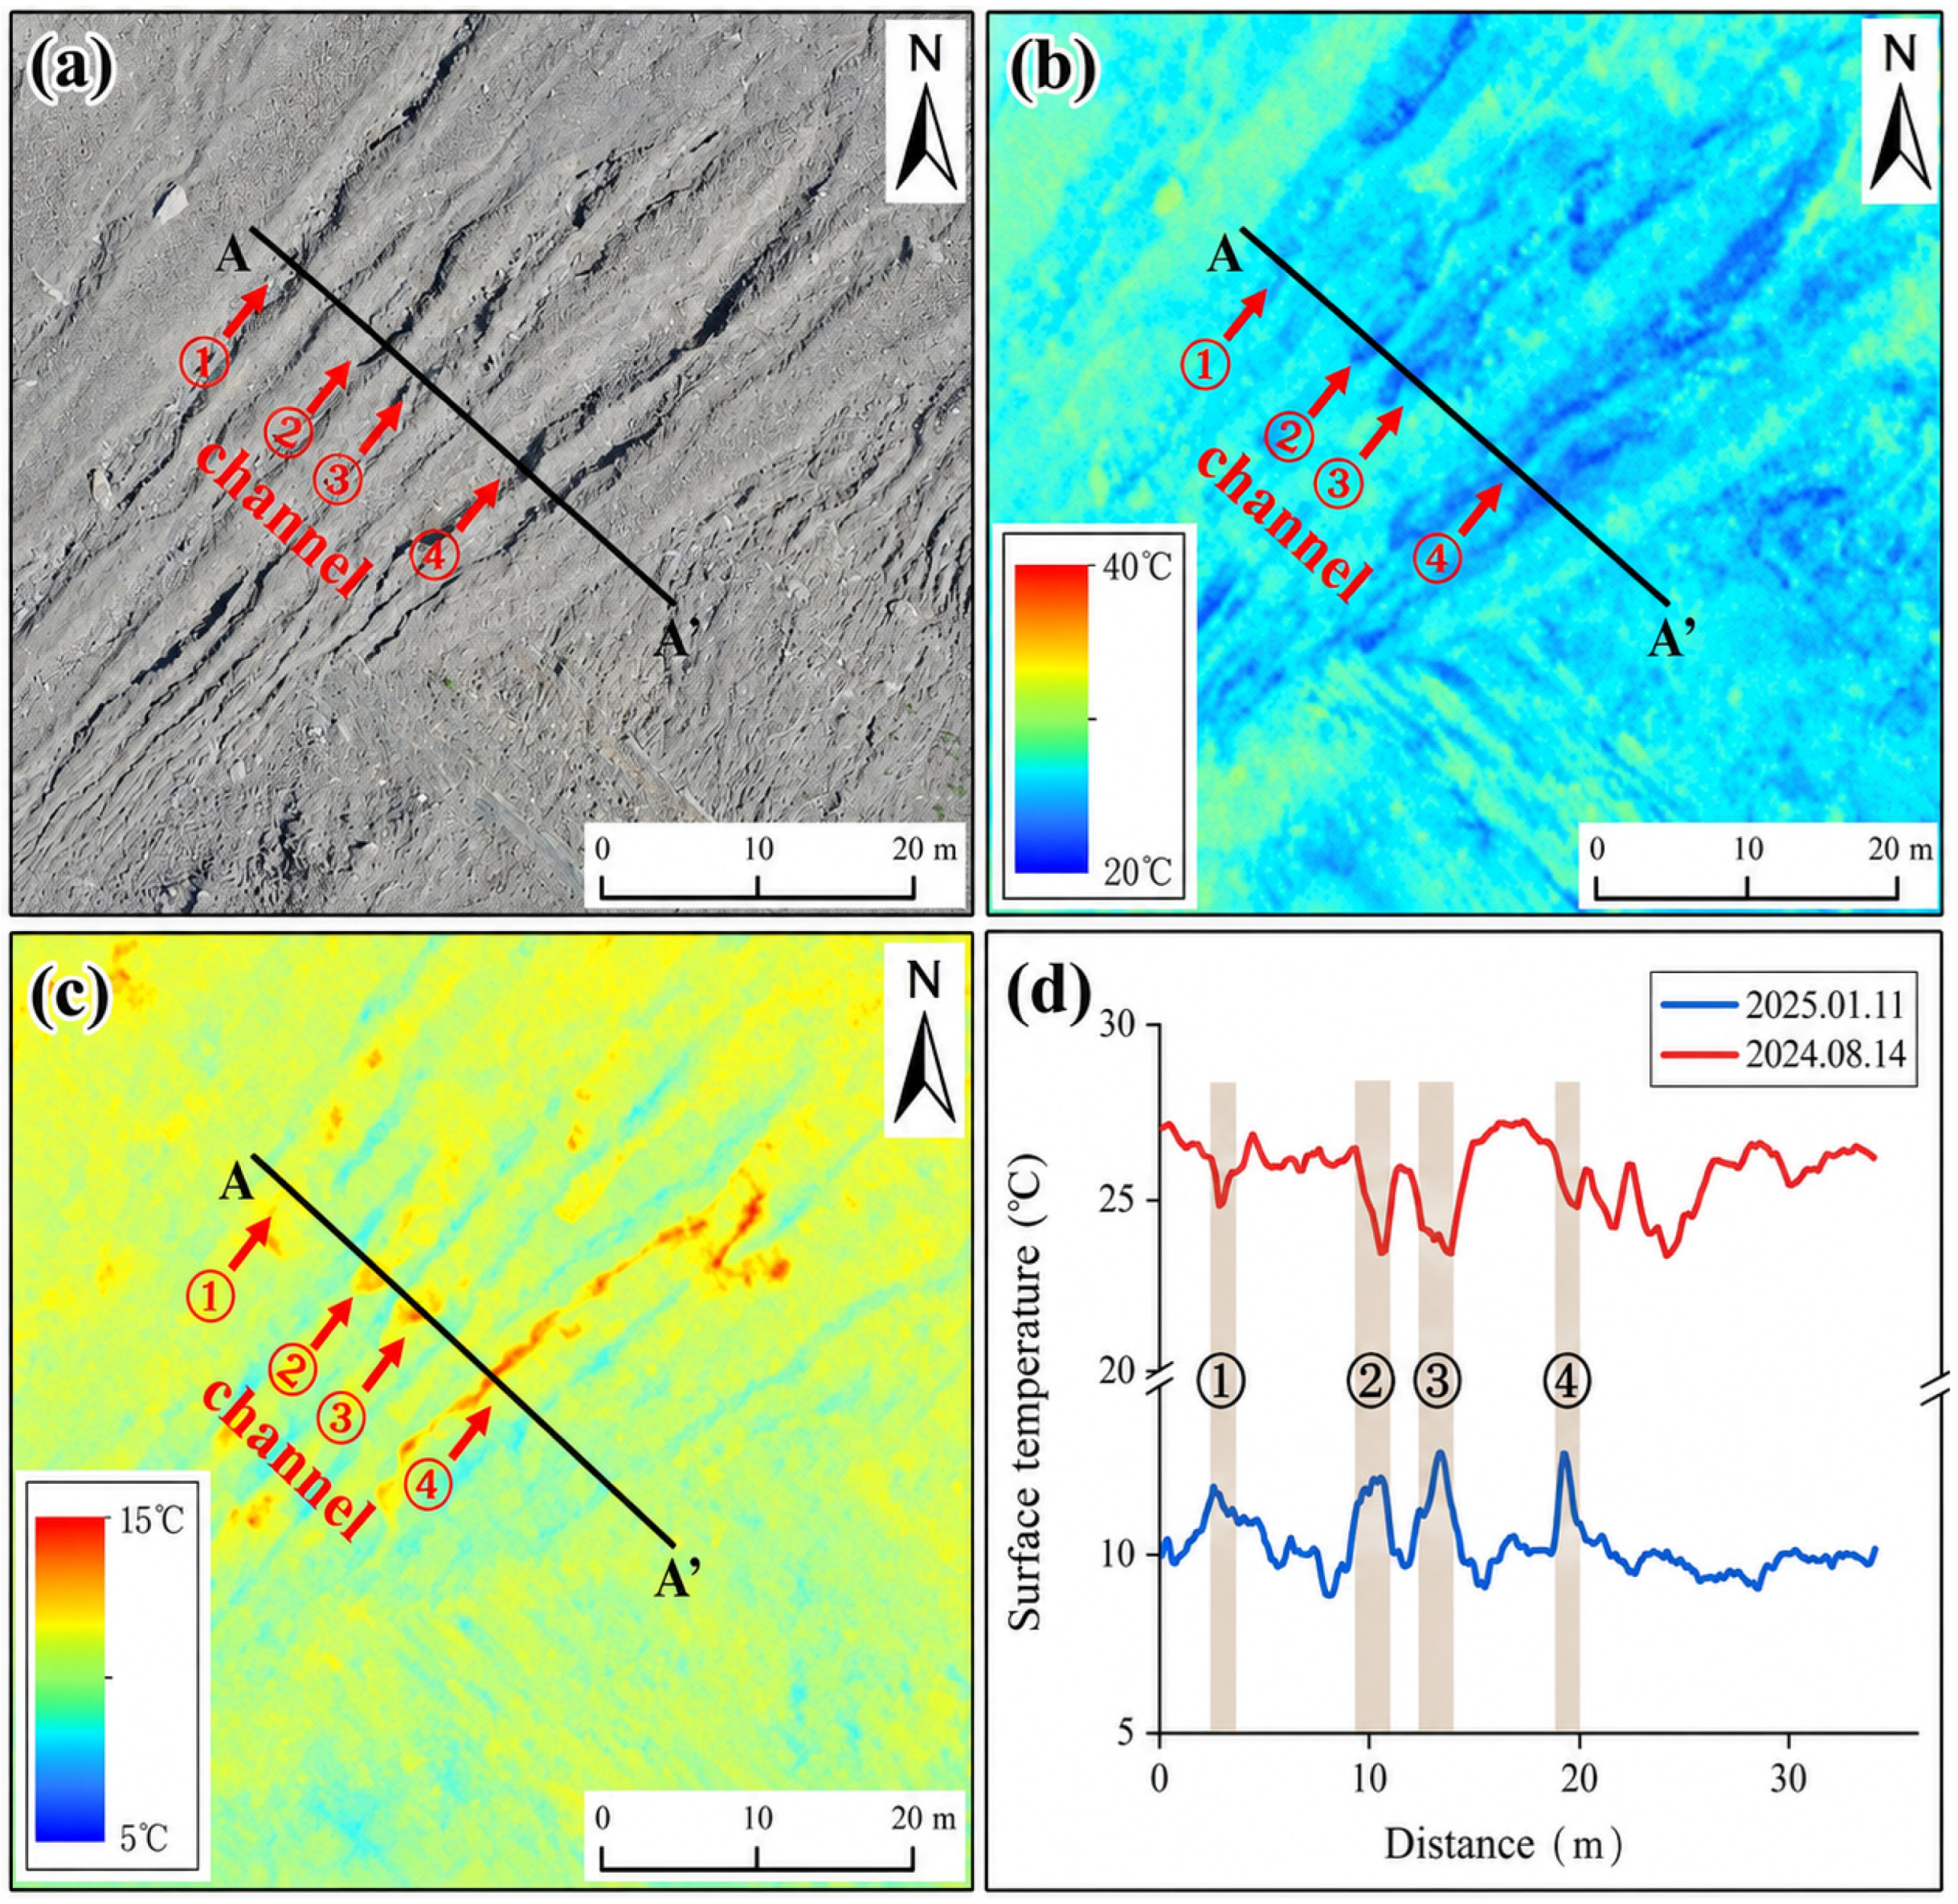
We selected an area of the landslide accumulation body showing evident surface erosion traces to analyze the impact of surface runoff on its surface temperature (Figure 15). This zone contains four small channels (1–2 m wide) formed by runoff erosion (Figure 15a). Observations revealed depressed temperatures within these channels on 14 August 2024 (Figure 15b), but elevated temperatures on 11 January 2025 (Figure 15c). The temperature curve along the A-A’ profile demonstrates that during summer, channel zones were 3–5 °C cooler than adjacent areas, whereas in winter they were 2–3 °C warmer (Figure 15d). Runoff scouring significantly increases moisture content in channel areas, giving rise to pronounced thermal differentials—consistent with the established literature indicating moisture variations influence landslide surface temperatures [28,49]. Further analysis confirms that water’s higher specific heat capacity enhances its thermal buffering capacity. Hence, moisture-enriched zones exhibit elevated surface temperatures in winter and depressed temperatures in summer.

4.1.5. Surface Temperature Characteristics of Rock Mass Structures

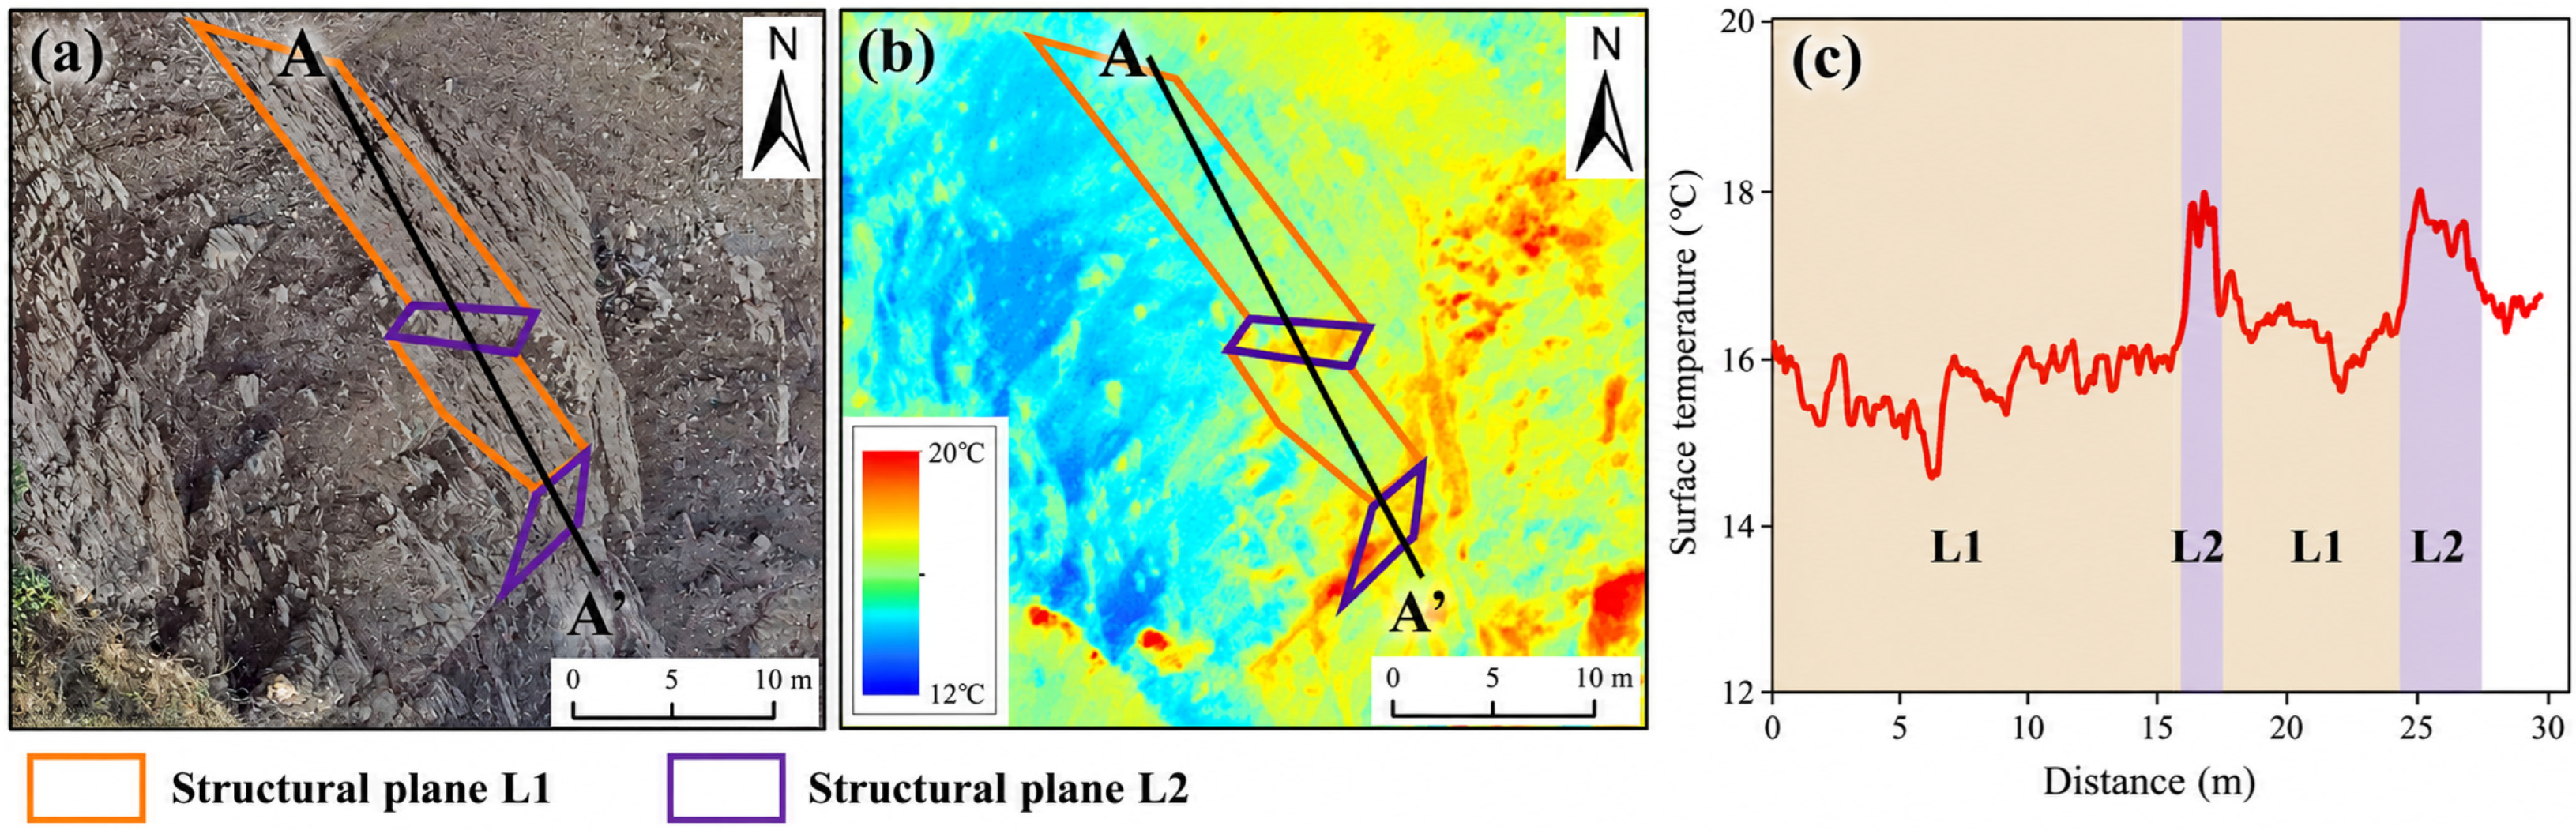
Rock mass structures constitute critical factors in rock slope stability. We analyzed the thermal response characteristics of such structures in a bedrock-distributed area at the upper section of the landslide (Figure 16). This zone primarily contains two discontinuity sets, L1 and L2 (Figure 16a). On the thermal infrared imagery, the surface temperatures across discontinuities within the L1 set show consistency, registering lower values than those in the L2 set (Figure 16b). The temperature curve along the A-A’ profile reveals temperatures of 15–17 °C for L1 discontinuities versus 17–18 °C for L2 (Figure 16c). Uniform temperatures within the same discontinuity set occur primarily because bedrock sharing identical orientations receives solar radiation at consistent incidence angles, resulting in homogeneous surface temperatures.

4.1.6. Surface Temperature Characteristics of Slope

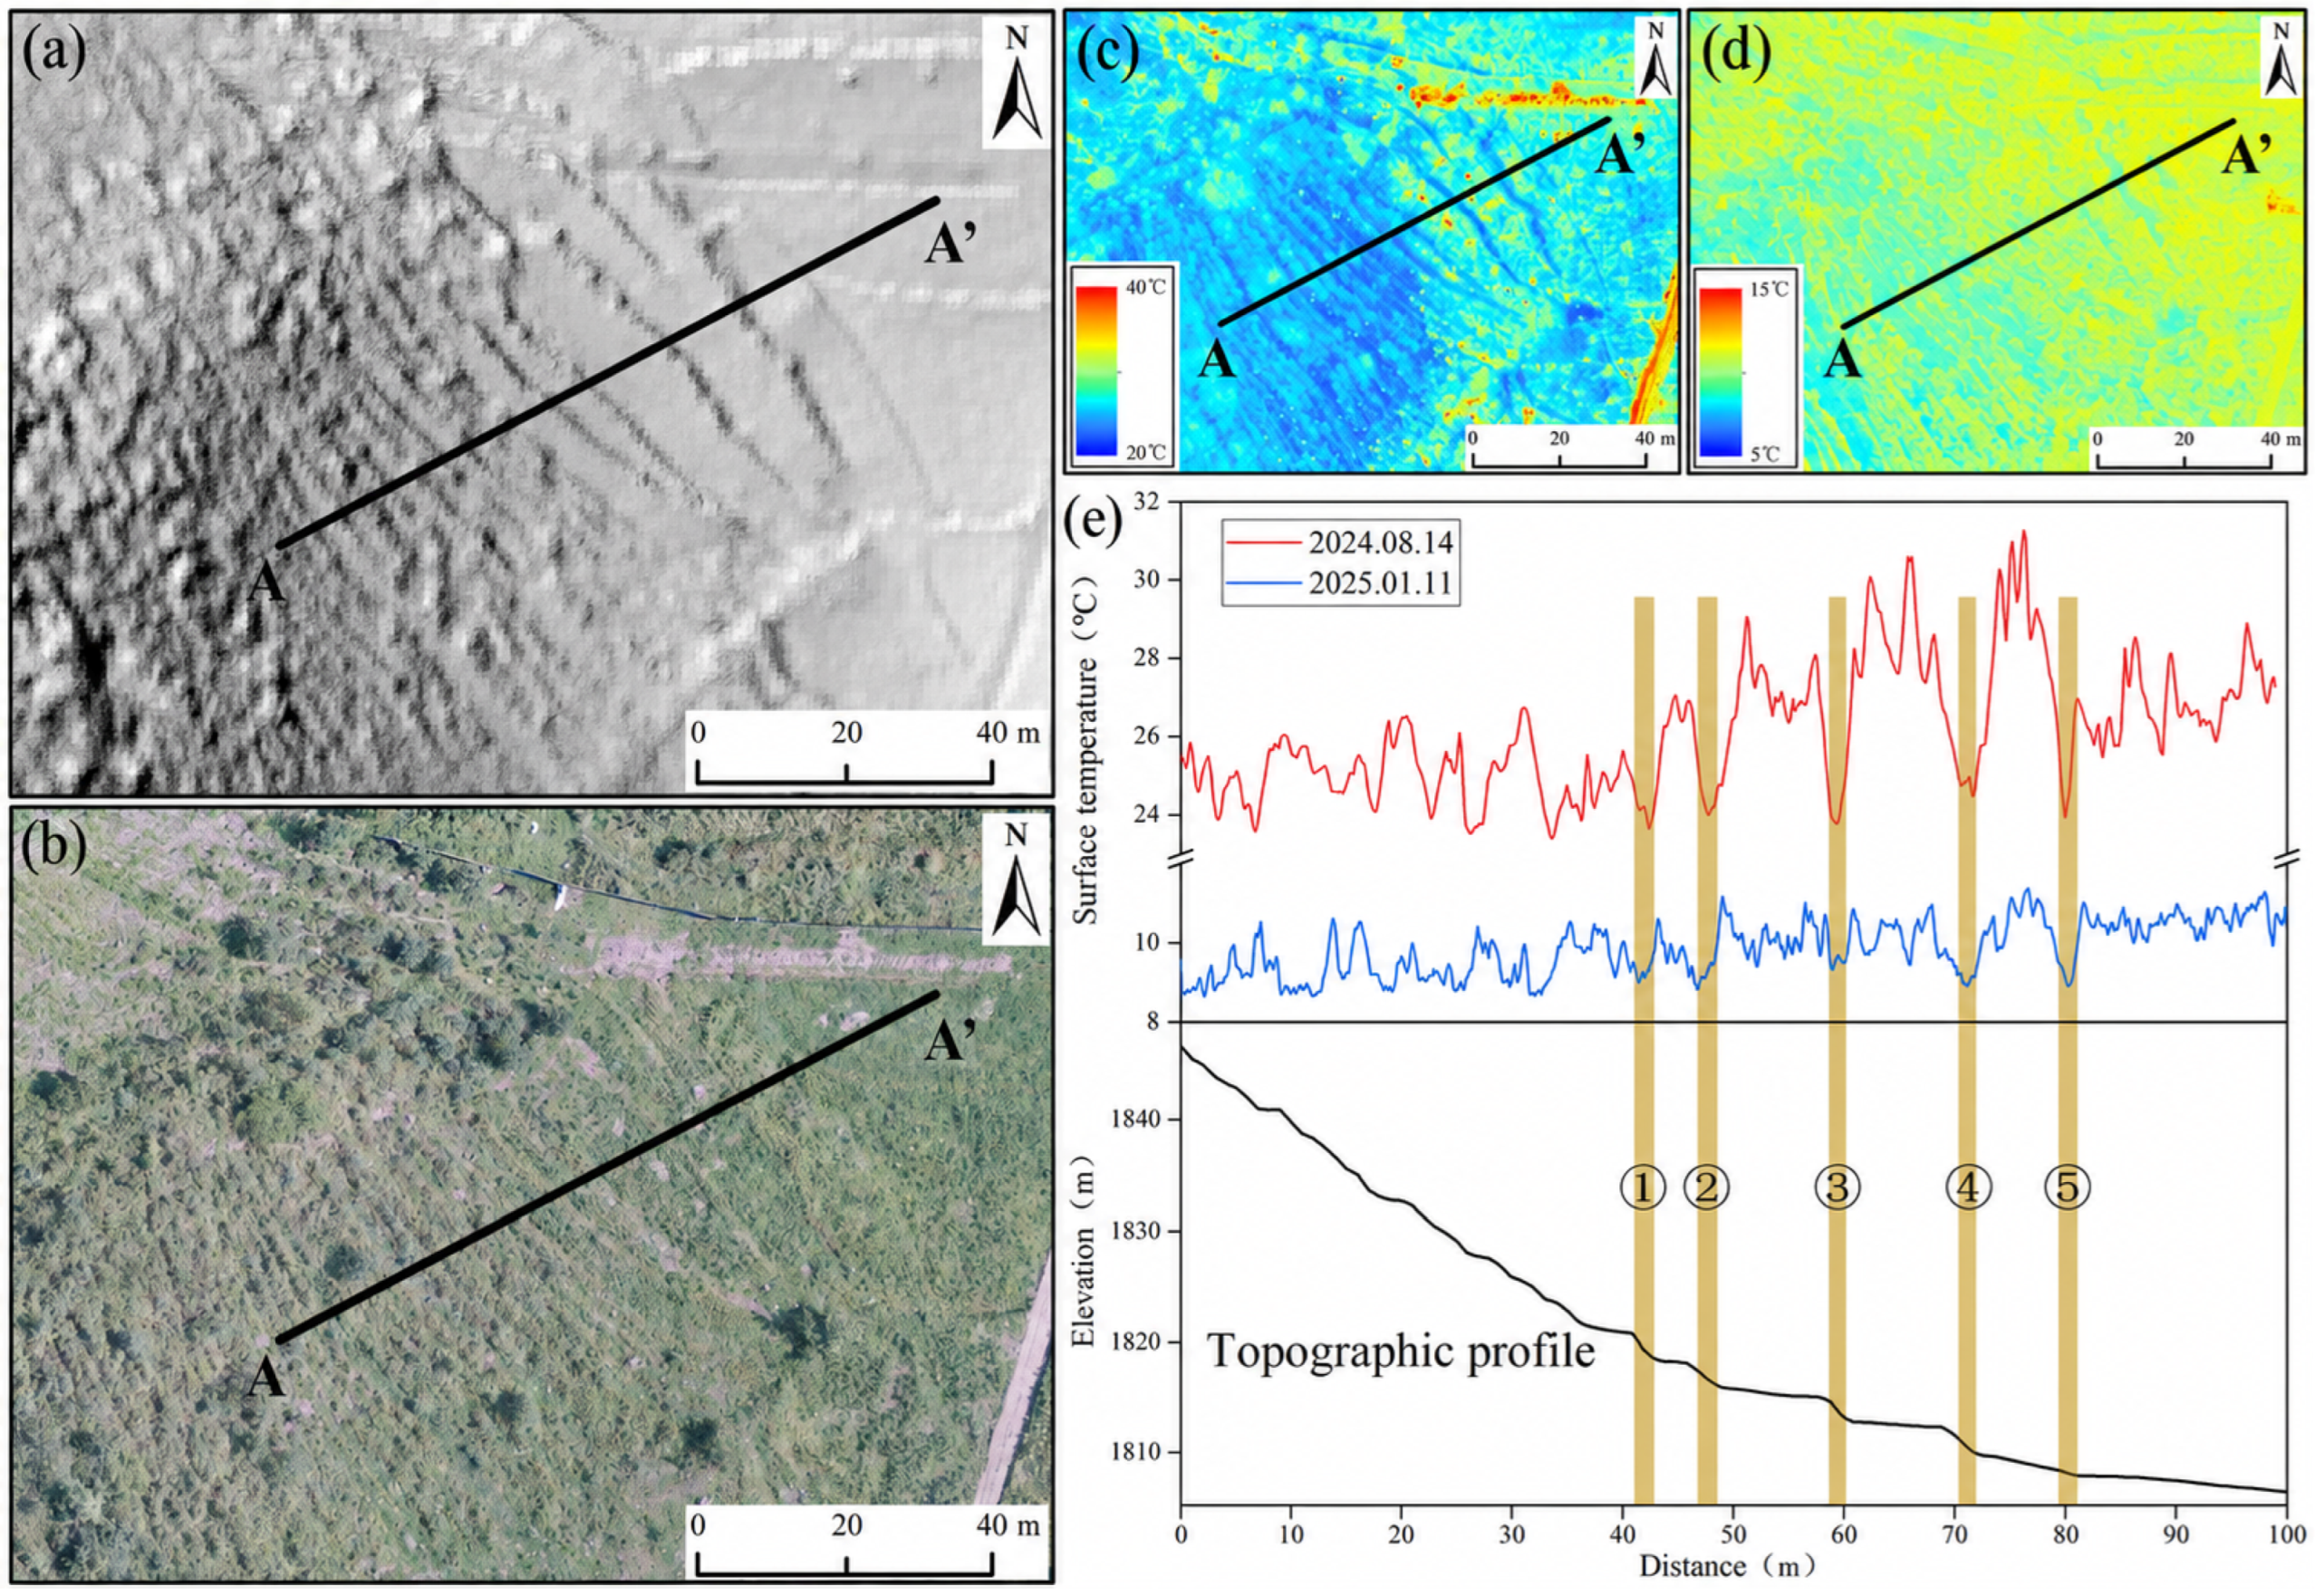
We select a slope area with significant changes in slope gradient to analyze the impact of the slope gradient on surface temperature. The slope direction in this area is northeast, with no significant difference in vegetation coverage type. The slope is steep at the top and gentle at the bottom, and multiple steep ridges can be seen on the surface of the slope (Figure 17a,b). The average slope of the upper part is about 30–40°. On 14 August 2024, the overall surface temperature of the area was about 23–27 °C (Figure 17c), and on 11 January 2025, the overall surface temperature of the area was about 8–10 °C (Figure 17d); the average slope of the lower part was about 10–20°. On 14 August 2024, the overall surface temperature of the area was about 26–30 °C (Figure 17c), and on 11 January 2025, the overall surface temperature of the area was about 9–11 °C (Figure 17d). In addition, by combining the terrain curve and surface temperature curve of A-A′, it can be found that there are obvious low points in the surface temperature curve of multiple steep ridges distributed in the slope area. In summer, the surface temperature in the steep ridge area is 4–5 °C lower than that in the surrounding area, and in winter, the surface temperature in the steep ridge area is 1–2 °C lower than that in the surrounding area (Figure 17e).
Overall, in the absence of significant changes in other factors, when the slope gradient is large, the surface temperature is relatively low. When the slope gradient is relatively small, its surface temperature is relatively high. The difference in surface temperature caused by this slope is more significant in summer. The main reason is that slopes with different degrees receive varying amount of solar radiation energy. When the slope is steeper, the less solar radiation it receives, and the lower the surface temperature. The solar radiation energy in summer is greater than that in winter, so the difference in surface temperature in summer is also greater.
Through the technical means proposed in this article, it is demonstrated to a certain extent that the mountain body was fractured and penetrated due to coal mining, thus forming the Yangjiazhai landslide. Therefore, this article proposes that the main preventive measure for this type of landslide is to strengthen the monitoring of coal mining activities.

4.2. The Influence of Snow Cover

It should be noted that the presence of patchy snow cover during the January 2025 survey may introduce additional uncertainty in surface temperature readings. While the key thermal anomalies discussed here were observed in largely snow-free fracture zones, a dedicated quantitative assessment of snow effects on IRT interpretation is merited in future studies.

5. Conclusions

This study takes the Yangjiazhai landslide in the Wumeng Mountain area as a case study to analyze the effectiveness of integrated UAV-based infrared thermography (IRT) and visible-light remote sensing for winter landslide thermal infrared detection. It aims to provide transferable methodologies for promoting IRT technology in high-altitude landslide surveillance. The key conclusions are as follows:
Influenced by underground goaf areas, the Yangjiazhai landslide exhibits intense surface deformation, including three secondary landslides and 20 cracks. Cracks with a high probability of connection to underground goaf zones show significantly elevated surface layer temperatures. By correlating crack aperture with temperature differentials, we can preliminarily assess the probability of crack–goaf connection, providing critical references for deformation trend prediction and stability analysis.
As infrared thermography (IRT) data reflects land surface temperatures within specific timeframes, we recommend conducting UAV thermal surveys under cloudy, fog-free conditions for high-altitude winter landslides. This protocol minimizes solar radiation interference, ensuring data validity and reliability.
Seasonal thermal inversions observed at cracks and moisture-rich channels are consistent with established principles of thermal inertia. While these patterns do not constitute novel physical findings, their systematic mapping across a complex landslide body demonstrates that multi-temporal IRT can effectively discriminate landslide surface elements—such as cracks, water pathways, and debris zones—under varying climatic conditions. When combined with the winter-specific protocol, this approach significantly enhances the detectability of deformation features.
For the Yangjiazhai case, the integration of UAV infrared thermography (IRT) and visible-light remote sensing proved effective in comprehensively detecting landslide boundaries, deformed cracks, localized slumping zones, rock mass structures, and moisture anomalies. Combined with geological and mining data, this integrated approach allowed a detailed characterization of the landslide’s deformation features and surface thermal patterns. While the findings are site-specific, the demonstrated methodology offers a practical and transferable workflow for winter landslide thermal infrared detection in similar high-altitude, mining-affected terrains.
Natural resource departments (including geological survey institutions), emergency management departments, and transportation departments (roads and railways) can benefit from the results of this study. Thermal infrared remote sensing detection provides technical support for the disaster investigation in winter and spring proposed by China’s natural resources management department.

Author Contributions

Conceptualization, M.W., Y.Y. and Y.T.; Methodology, C.Z. and S.Z. (Sainan Zhu); Data curation, J.L. and B.S.; Investigation, C.Z., J.F. and X.L.; Writing—original draft preparation, S.Z. (Su Zhang) and J.F.; Writing—review and editing, C.Z., M.W. and X.L. All authors have read and agreed to the published version of the manuscript.

Funding

This study was supported by the Yunnan Province science and technology plan project (202403AA080001), Ministry and Province Cooperation Key R&D Project (2023ZRBSHZ049), and Scientific research project of Sichuan Institute of Geological Survey (SCIGS-CZDXM-2024006).

Data Availability Statement

The data used in the current study are available from the corresponding author on reasonable request.

Acknowledgments

The authors gratefully acknowledge the reviewers and Editor for constructive comments and suggestions, which greatly improved the quality of the manuscript.

Conflicts of Interest

The authors declare no competing interests.

References

  1. Haque, U.; da Silva, P.F.; Devoli, G.; Pilz, J.; Zhao, B.; Khaloua, A.; Wilopo, W.; Andersen, P.; Lu, P.; Lee, J.; et al. The human cost of global warming: Deadly landslides and their triggers (1995–2014). Sci. Total Environ. 2019, 682, 673–684. [Google Scholar] [CrossRef] [PubMed]
  2. Ministry of Emergency Management of the People’s Republic of China. Basic Information of National Natural Disasters in 2024. 2025. Available online: https://www.mem.gov.cn/xw/xwfbh/2025n01y15xwfbh_6337/ (accessed on 15 January 2025).
  3. Yin, Y.; Liu, C.; Chen, H.; Ren, J.; Zhu, C. Investigation on Catastrophic Landslide of January 11, 2013 at Zhaojiagou, Zhenxiong County, Yunnan province. J. Eng. Geol. 2013, 21, 6–15. Available online: http://www.gcdz.org/en/article/id/11244 (accessed on 15 January 2025). (In Chinese)
  4. Li, B.; Li, Y.; Niu, R.; Xue, T.; Duan, H. Early warning of landslides based on statistical analysis of landslide motion characteristics and AI Earth Cloud InSAR processing system: A case study of the Zhenxiong landslide in Yunnan Province, China. Landslides 2024, 21, 3137–3148. [Google Scholar] [CrossRef]
  5. Chen, B.; Song, C.; Li, Z.; Li, Y.; Liu, H.; Yu, C.; Li, S.; Liu, M.; Chen, Y.; Zhang, L.; et al. Pre-Failure Deformation mechanism and geomorphological change of the Jinpingcun Landslide, Junlian, Sichuan. Geomat. Inf. Sci. Wuhan Univ. 2025, 50, 2154–2162. [Google Scholar] [CrossRef]
  6. Emberson, R.; Kirschbaum, D.; Stanley, T. Global connections between EI Nino and landslide impacts. Nat. Commun. 2021, 12, 2262. [Google Scholar] [CrossRef] [PubMed]
  7. Kargel, J.S.; Leonard, G.J.; Shugar, D.H.; Haritashya, U.K.; Bevington, A.; Fielding, E.J.; Fujita, K.; Geertsema, M.; Miles, E.S.; Steiner, J.; et al. Geomorphic and geologic controls of geohazards induced by Nepal’s 2015 Gorkha earthquake. Science 2016, 351, aac8353. [Google Scholar] [CrossRef]
  8. Piciullo, L.; Calvello, M.; Cepeda, J.M. Territorial early warning systems for rainfall-induced landslides. Earth Sci. Rev. 2018, 179, 228–247. [Google Scholar] [CrossRef]
  9. Yin, Y.; Cheng, Y.; Liang, J.; Wang, W. Heavy-rainfall-induced catastrophic rockslide-debris flow at Sanxicun, Dujiangyan, after the Wenchuan Ms 8.0 earthquake. Landslides 2016, 13, 9–23. [Google Scholar] [CrossRef]
  10. Van Asch, T.; Buma, J.; Van Beek, L. A view on some hydrological triggering systems in landslides. Geomorphology 1999, 30, 25–32. [Google Scholar] [CrossRef]
  11. Chen, S.-C.; Chou, H.-T.; Chen, S.-C.; Wu, C.-H.; Lin, B.-S. Characteristics of rainfall-induced landslides in Miocene formations: A case study of the Shenmu watershed, Central Taiwan. Eng. Geol. 2014, 169, 133–146. [Google Scholar] [CrossRef]
  12. Dai, F.; Lee, C. Frequency-volume relation and prediction of rainfall-induced landslides. Eng. Geol. 2001, 69, 253–266. [Google Scholar] [CrossRef]
  13. Calamita, G.; Gallipoli, M.; Gueguen, E.; Sinisi, R.; Summa, V.; Vignola, L.; Stabile, T.; Bellanova, J.; Piscitelli, S.; Perrone, A. Integrated geophysical and geological surveys reveal new details of the large Montescaglioso (Southern Italy) landslide of December 2013. Eng. Geol. 2023, 313, 106984. [Google Scholar] [CrossRef]
  14. Govi, M.; Pasuto, A.; Silvano, S.; Siorpaes, C. An example of a low-temperature-triggered landslide. Eng. Geol. 1993, 36, 53–65. [Google Scholar] [CrossRef]
  15. Jing, J.; Wu, Z.; Yan, W.; Ma, W.; Liang, C.; Lu, Y.; Chen, D. Experimental study on progressive deformation and failure mode of loess fill slopes under freeze-thaw cycles and earthquakes. Eng. Geol. 2022, 310, 106896. [Google Scholar] [CrossRef]
  16. Hori, M.; Morihiro, H. Micromechanical analysis on deterioration due to freezing and thawing in porous brittle materials. Int. J. Eng. Sci. 1998, 36, 511–522. [Google Scholar] [CrossRef]
  17. Qiao, G.; Wang, Y.; Chu, F.; Yang, X. Failure mechanism of slope rockmass due to freeze-thaw weathering. J. Eng. Geol. 2015, 23, 469–476. (In Chinese) [Google Scholar] [CrossRef]
  18. Wu, M.; Li, A.; Li, Z.; Chen, N.; Tian, S.; Hou, R.; Habumugisha, J.M.; Huang, N. Frost-heaving may triggered the catastrophic landslide in Zhenxiong on January 22, 2024. Landslides 2024, 22, 1153–1166. [Google Scholar] [CrossRef]
  19. Spampinato, L.; Calvari, S.; Oppenheimer, C.; Boschi, E. Volcano surveillance using infrared cameras. Earth Sci. Rev. 2011, 106, 63–91. [Google Scholar] [CrossRef]
  20. Barla, G.; Antolini, F.; Gigli, G. 3D Laser scanner and thermography for tunnel discontinuity mapping. Géoméch. Tunn. 2016, 9, 29–36. [Google Scholar] [CrossRef]
  21. Frodella, W.; Gigli, G.; Morelli, S.; Lombardi, L.; Casagli, N. Landslide mapping and characterization through infrared themography (IRT): Suggestions for a methodological approach from some case studies. Remote Sens. 2017, 9, 1281. [Google Scholar] [CrossRef]
  22. Moran, M.S.; Peters-Lidard, C.D.; Watts, J.M.; McElroy, S. Estimating soil moisture at the watershed scale with satellite-based radar and land surface models. Can. J. Remote Sens. 2004, 30, 805–826. [Google Scholar] [CrossRef]
  23. Price, J. The potential of remotely sensed thermal infrared data to infer surface soil moisture and evaporation. Water Resour. Res. 2010, 16, 787–795. [Google Scholar] [CrossRef]
  24. Frodella, W.; Elashvili, M.; Spizzichino, D.; Gigli, G.; Adikashvili, L.; Vacheishvili, N.; Kirkitadze, G.; Nadaraia, A.; Margottini, C.; Casagli, N. Combining infrared themography and UAV digital photogrammetry for the protection and conservation of rupestrian cultural heritage sites in Georgia: A methodological application. Remote Sens. 2020, 12, 892. [Google Scholar] [CrossRef]
  25. Fiorillo, F.; Tulipano, L. Alcune Applicazioni dell’Infrarosso Termico a Tematiche Geoapplicative. Geol. Romana 1994, 30, 395–402. Available online: https://hdl.handle.net/20.500.12070/1491 (accessed on 15 January 2025).
  26. Mineo, S.; Pappalardo, G.; Rapisarda, F.; Cubito, A.; Di Maria, G. Integrated geostructural, seismic and infrared themography surveys for the study of an unstable rock slope in the Peloritani Chain (NE Sicily). Eng. Geol. 2015, 195, 225–235. [Google Scholar] [CrossRef]
  27. Pappalardo, G.; Mineo, S.; Zampelli, S.P.; Cubito, A.; Calcaterra, D. Infrared thermography proposed for the estimation of the Cooling Rate Index in the remote survey of rock mass. Int. J. Rock Mech. Min. Sci. 2016, 83, 182–196. [Google Scholar] [CrossRef]
  28. Vivaldi, V.; Bordoni, M.; Mineo, S.; Crozi, M.; Pappalardo, G.; Meisina, C. Airborne combined photogrammetry-infrared themography applied to landslide remote monitoring. Landslides 2023, 20, 297–313. [Google Scholar] [CrossRef]
  29. Frodella, W.; Fidolini, F.; Morelli, S.; Pazzi, V. Application of infrared themography for landslide mapping: The Rotolon DSGDS case study. Rend. Online Soc. Geol. Ital. 2015, 35, 144–147. [Google Scholar] [CrossRef]
  30. Pappalardo, G.; Mineo, S.; Angrisani, A.C.; Di Martire, D.; Calcaterra, D. Combining field data with infrared thermography and DInSAR surveys to evaluate the activity of landslides: The case study of Randazzo Landslide (NE Sicily). Landslides 2018, 15, 2173–2193. [Google Scholar] [CrossRef]
  31. Mineo, S.; Caliò, D.; Intelisano, M.; Pappalardo, G. Landslide studying and monitoring by combining digital models from aerial visible and infrared photogrammetry. Landslides 2025, 22, 1789–1804. [Google Scholar] [CrossRef]
  32. Wang, Q.; Li, B.; Xing, A.; Liu, Y.; Zhuang, Y.; Bilal, M. Failure process analysis of a catastrophic landslide in Zhenxiong triggered by prolonged low-intensity rainfall using centrifuge tests. Eng. Geol. 2025, 351, 108044. [Google Scholar] [CrossRef]
  33. Qi, C.; Ma, X.; Guo, W. Deterioration of fresh sandstone caused by experimental freeze-thaw weathering. Cold Reg. Sci. Technol. 2023, 214, 103956. [Google Scholar] [CrossRef]
  34. Li, T.; Zhang, L.; Gong, W.; Tang, H.; Jiang, R. Initiation mechanism of landslides in cold regions: Role of freeze-thaw cycles. Int. J. Rock Mech. Min. Sci. 2024, 183, 105906. [Google Scholar] [CrossRef]
  35. Mineo, S.; Caliò, D.; Pappalardo, G. UAV-based photogrammetry and infrared thermography applied to rock mass survey for geomechanical purposes. Remote Sens. 2022, 14, 473. [Google Scholar] [CrossRef]
  36. Wang, Q.; Xing, A.; Liao, L.; Liu, Y.; Zhuang, Y. Insights into small landslides inducing major disasters in Wumeng Mountain area from the Liangshui landslide. Landslides 2024, 22, 857–875. [Google Scholar] [CrossRef]
  37. Yin, Y.; Xing, A.; Wang, G.; Feng, Z.; Li, B.; Jiang, Y. Experimental and numerical investigations of a catastrophic long-runout landslides in Zhenxiong, Yunnan, Southwestern China. Landslides 2017, 14, 649–659. [Google Scholar] [CrossRef]
  38. Zhu, S.; Yin, Y.; Gao, F.; Yang, C.; Zhang, L.; Yang, L.; Tan, W.; Wang, M.; Zhang, Y. Coal-mining induced rockmass landslide with layered fractured structure in Yangjiazhai, Wumeng Mountain area, China. Landslides 2025, 22, 3474–3491. [Google Scholar] [CrossRef]
  39. Cruden, D.M.; Varnes, D.J. Landslide types and processes. In Landslides Investigation and Mitigation; Turner, A.K., Schuster, R.L., Eds.; Transportation Research Board, Special Report; National Research Council, National Academy Press: Washington, DC, USA, 1996; Volume 247, pp. 36–75. [Google Scholar]
  40. Hungr, O.; Leroueil, S.; Picarelli, L. The Varnes classification of landslide types, an update. Landslides 2014, 11, 167–194. [Google Scholar] [CrossRef]
  41. Pirasteh, S.; Li, J. Landslides investigations from geoinformatics perspective: Quality, challenges, and recommendations. Geomat. Nat. Hazards Risk 2016, 8, 448–465. [Google Scholar] [CrossRef]
  42. Joyce, K.E.; Belliss, S.E.; Samsonov, S.V.; McNeill, S.J.; Glassey, P.J. A review of the status of satellite remote sensing and image processing techniques for mapping natural hazards and disasters. Prog. Phys. Geogr. 2009, 33, 183–207. [Google Scholar] [CrossRef]
  43. Casagli, N.; Frodella, W.; Morelli, S.; Tofani, V.; Ciampalini, A.; Intrieri, E.; Raspini, F.; Rossi, G.; Tanteri, L.; Lu, P. Spaceborne, UAV and groundbased remote sensing techniques for landslide mapping, monitoring and early warning. Geoenviron. Disasters 2017, 4, 9. [Google Scholar] [CrossRef]
  44. Eccel, E.; Arman, G.; Zottele, F.; Gioli, B. Thermal infrared remote sensing for high resolution minimum temperature mapping. Ital. J. Agrometeorol. 2008, 13, 52–61. Available online: http://hdl.handle.net/10449/15873 (accessed on 15 January 2025).
  45. Teza, G.; Marcato, G.; Pasuto, A.; Galgaro, A. Integration of laser scanning and thermal imaging in monitoring optimization and assessment of rockfall hazard: A case history in the Carnic Alps (Northeastern Italy). Nat. Hazards 2015, 76, 1535–1549. [Google Scholar] [CrossRef]
  46. Baron, I.; Beckovsky, D.; Mica, L. Application of infrared thermography for mapping open fractures in deep-seated rockslides and unstable cliffs. Landslides 2014, 11, 15–27. [Google Scholar] [CrossRef]
  47. Kurylyk, B.; MacQuarrie, K.; McKenzie, J. Climate change impacts on groundwater and soil temperatures in cold and temperate regions: Implications, mathematical theory, and emerging simulation tools. Earth Sci. Rev. 2014, 138, 313–334. [Google Scholar] [CrossRef]
  48. Schläpfer, D.; Richter, R. Geo-atmospheric processing of airborne imaging spectrometry data: Part 1: Parametric orthorectification. Int. J. Remote Sens. 2002, 23, 2609–2630. [Google Scholar] [CrossRef]
  49. Melis, M.T.; Da Pelo, S.; Erbì, I.; Loche, M.; Deiana, G.; Demurtas, V.; Meloni, M.A.; Dessì, F.; Funedda, A.; Scaioni, M.; et al. Thermal Remote Sensing from UAVs: A Review on Methods in Coastal Cliffs Prone to Landslides. Remote Sens. 2020, 12, 1971. [Google Scholar] [CrossRef]
Figure 1. The study area ((a) ZXC with 3 main landslides; (b) ZXC in Wumeng Mountain Region; (c) Yangjiazhai landslide).
Remotesensing 18 01961 g001
Figure 2. Aerial remote sensing images of Yangjiazhai landslide ((a) landslide area on 14 August 2024; (b) landslide area on 11 January 2025; (c) secondary landslide H02 on 14 August 2024; (d) secondary landslide H02 on 11 January 2025; (e) crack C07 on 14 August 2024; (f) crack C07 on 11 January 2025) (source: UAV visible-light orthophoto).
Remotesensing 18 01961 g002
Figure 3. On-site investigation photos. (a) Lidar imgae of Yangjiazhai Landslide. (b) field work photo of Yangjiazhai Landslide in winter. (c) checking cracks on the surface. (d) detail of cracks. (e) large crack on the surface. (f) detail of crack on the landslide (g) the move materials of landslide (h) detail of crack on the landslide.
Remotesensing 18 01961 g003
Figure 4. Statistics of crack parameters in Yangjiazhai landslide ((a) statistics of crack length; (b) statistics of crack width; (c) statistics of crack extension direction).
Remotesensing 18 01961 g004
Figure 5. Thermal infrared imagery of Yangjiazhai landslide ((a) data acquired on 14 August 2024; (b) data acquired on 11 January 2025) (source: UAV-borne thermal infrared sensor).
Remotesensing 18 01961 g005
Figure 6. Anomalously elevated surface temperature zones ((a) infrared thermography (IRT) of critical sectors; (b) full-extent orthomosaic; (c) infrared thermography (IRT) detail of crack concentrations; (d) optical close-up of cracks).
Remotesensing 18 01961 g006
Figure 7. Schematic diagram of the simplified crack.
Remotesensing 18 01961 g007
Figure 8. Crack temperature simulation results ((a) crack connected to underground goaf; (b) crack not connected to underground goaf).
Remotesensing 18 01961 g008
Figure 9. Large crack distribution area ((a) thermal infrared image; (b) orthophoto).
Remotesensing 18 01961 g009
Figure 10. Crack temperature simulation results ((a) 0.2 m width; (b) 1.0 m width; (c) 2.0 m width).
Remotesensing 18 01961 g010
Figure 11. Land surface temperature by land cover types ((a) orthophoto from UAV; (b) infrared thermography (IRT) data on 11 January 2025; (c) infrared thermography (IRT) data on 14 August 2024).
Remotesensing 18 01961 g011
Figure 12. Land surface temperature curve along the A-A’ profile.
Remotesensing 18 01961 g012
Figure 13. Land surface temperature of deformed cracks ((a) UAV orthophoto; (b) infrared thermography (IRT) data on 14 August 2024; (c) infrared thermography (IRT) data on 11 January 2025; (d) temperature curve along A-A’ profile).
Remotesensing 18 01961 g013
Figure 14. Land surface temperature of accumulation bodies with varying grain sizes ((a) UAV orthophoto; (b) infrared thermography (IRT) data on 14 August 2024; (c) infrared thermography (IRT) data on 11 January 2025; (d) temperature curve along A-A’ profile (14 August 2024); (e) temperature curve along A-A’ profile (11 January 2025)).
Remotesensing 18 01961 g014
Figure 15. Land surface temperature in accumulation bodies with varying moisture content ((a) UAV orthophoto; (b) infrared thermography (IRT) data on 14 August 2024; (c) infrared thermography (IRT) data on 11 January 2025; (d) temperature curve along A-A’ profile).
Remotesensing 18 01961 g015
Figure 16. Land surface temperature of rock mass structures ((a) UAV orthophoto of plane L1 and L2; (b) infrared thermography (IRT) data of L1 and L2; (c) temperature curve along A-A’ profile).
Remotesensing 18 01961 g016
Figure 17. Land surface temperature of slope ((a) DEM; (b) UAV orthophoto; (c) infrared thermography (IRT) data on 14 August 2024; (d) infrared thermography (IRT) data on 11 January 2025; (e) surface temperature curve and terrain curve of A-A′ profile).
Remotesensing 18 01961 g017
Table 1. The specific parameters of the UAV and cameras employed for data collection.
UAVTypeEmpty weightMaximum payload capacityMaximum flight speedMaximum endurance
Feima D20002.6 kg750 g20 m/s74 min
visible-light cameraTypeSensor typeSensor sizePixelsFocal length
SONY a6000APS-C23.5 × 15.6 mm24.3 million25 mm
thermal infrared cameraTypeSpectral band widthImage sizeFocal lengthTemperature measurement range
D-TIRV10008–14 μm640 × 512 px13 mm−20 °C~150 °C
Table 2. Temperature monitor distribution.
IDLongitudeLatitude
1104.8904627.48632
2104.8896927.48592
3104.8891327.48529
4104.888727.48426
5104.8888827.48257
Disclaimer/Publisher’s Note: The statements, opinions and data contained in all publications are solely those of the individual author(s) and contributor(s) and not of MDPI and/or the editor(s). MDPI and/or the editor(s) disclaim responsibility for any injury to people or property resulting from any ideas, methods, instructions or products referred to in the content.