


Highlights
What are the main findings?
- A non-iterative DSEP framework is proposed for infrared moving target detection, integrating background decoupling, scale-consistent spatial screening, and response purification in a feedforward manner.
- Experiments on self-collected infrared sequences and the public SIRST dataset show that the method achieves a good balance between detection performance and computational efficiency.
What are the implications of the main findings?
- Relatively stable detection performance is maintained under challenging conditions, including structured clutter, smoke interference, speckle noise, and low-contrast backgrounds.
- The lightweight and non-iterative design shows good potential for low-latency infrared remote sensing applications, such as low-altitude surveillance and UAV monitoring.
Abstract
Detecting infrared moving targets in low-altitude remote sensing scenes remains challenging due to strong clutter, scale inconsistency, and residual interference. Because these factors are often coupled in complex scenes and cannot be handled effectively by a single operation, a three-stage progressive Decoupled Separation, Enhancement, and Purification (DSEP) framework is proposed. The method integrates edge-preserving background decoupling, scale-consistent spatial screening, and residual-response purification into a non-iterative feedforward pipeline. Experiments on six representative self-collected infrared sequences and six selected scenes from the public SIRST dataset suggest that DSEP produces relatively compact and spatially continuous target responses while suppressing background interference. On the self-collected dataset, the method can achieve SCRG and BSF values up to 10.61 and 7.38, respectively, with a processing time of 0.009–0.016 s per frame. Compared with representative spatial filtering, local contrast, and low-rank decomposition methods, DSEP shows a relatively favorable balance between detection performance and low-latency processing efficiency. Although the performance gain becomes smaller in some SIRST scenes, the proposed method still shows generally stable detection performance across the evaluated scenes.
1. Introduction
Infrared remote sensing plays an important role in low-altitude observation because it can provide passive perception under complex illumination and adverse weather conditions. In practical tasks such as airspace surveillance, UAV monitoring, and near-ground scene observation, infrared sensors are able to deliver stable radiometric information without depending on visible-light texture or external illumination [1,2].
Detecting targets in such scenes, however, is still challenging, especially when the target no longer appears as an ideal point but instead exhibits an extended spatial response [3,4]. In low-altitude infrared images, these targets often occupy several connected pixels and tend to show uneven intensity distribution rather than a compact and concentrated pattern. Their boundaries may also become blurred, and local structural details can be weakened by long-range imaging, atmospheric attenuation, and background interference [5].
At the same time, the background in low-altitude infrared scenes is often highly complex. Structured ground objects, uneven thermal radiation, atmospheric transmission disturbances, and local reflection effects may together introduce strong non-stationary clutter into the image [6,7]. Under these conditions, the conventional point-target assumption is often insufficient for describing targets in real low-altitude infrared remote sensing environments [8].
Existing infrared target detection methods can generally be grouped into spatial filtering and morphological methods, saliency-based methods, and low-rank sparse representation methods [9]. Spatial filtering and morphological methods, such as the Top-hat operator and maximum median filtering, are simple and computationally efficient [10,11]. However, their performance is often sensitive to filtering scale, and fixed-scale processing may enhance high-frequency background structures together with true targets in complex scenes [12]. Saliency-based methods, represented by the Local Contrast Measure (LCM) and its variants, can enhance local target–background contrast [13,14]. Nevertheless, when the target exhibits a spatially extended and non-uniform response, local contrast computation may weaken part of the target itself and reduce response stability under non-Gaussian background statistics [15,16]. Low-rank sparse representation methods, including IPI and its tensor-based extensions such as RIPT and PSTNN, provide stronger background modeling ability [17,18,19,20]. However, their dependence on iterative optimization and matrix or tensor decomposition usually leads to high computational cost, which limits their practicality for low-latency frame-level detection.
Different from methods that mainly depend on a single filtering, contrast, or decomposition mechanism, the proposed framework is designed to progressively handle background, scale, and statistical interference factors within a unified non-iterative pipeline.
Deep learning methods have also shown strong potential in infrared target detection. However, their performance usually depends on large-scale annotated training data, which remain limited for low-altitude infrared scenes, especially when the background is complex and the targets exhibit spatially extended responses. In this situation, a training-free and interpretable method is still valuable for practical real-time applications.
Temporal information can be useful for infrared target detection, but in many low-altitude monitoring tasks, rapid frame-level response is of greater practical importance. Therefore, single-frame detection remains a highly relevant and practical problem. In this study, we do not attempt to address all possible difficulties in low-altitude infrared remote sensing. Instead, we focus on three specific and coupled interference factors that frequently degrade the detection performance of infrared moving targets with spatially extended responses.
First, slowly varying background interference is commonly caused by non-uniform thermal radiation, ground structures, smoke, clouds, and atmospheric fluctuations. Such interference may weaken the separability between the target and the surrounding background. Second, scale-inconsistent pseudo-responses, including isolated bright noise, small clutter fragments, and local edge responses, may be enhanced together with true targets and lead to false alarms. Third, even after preliminary background suppression and spatial filtering, residual clutter may still remain. This residual clutter often exhibits non-Gaussian statistical characteristics, making simple thresholding unreliable in complex scenes.
These three factors are different in nature and cannot be effectively handled by a single operation. Since most existing methods only address part of these issues, their robustness becomes limited when strong clutter and extended targets appear together. In essence, the main limitation of current methods is the lack of a unified and efficient framework for dealing with these coupled sources of interference in a progressive manner.
To address this problem, a three-stage progressive Decoupled Separation, Enhancement, and Purification (DSEP) framework is proposed. The framework organizes three processing stages according to the main interference factors in low-altitude infrared scenes. First, edge-preserving background decoupling is used to suppress slowly varying background interference. Second, scale-consistent spatial screening is introduced to remove pseudo-responses that do not match the expected target scale. Finally, residual-response purification is applied to suppress statistically abnormal residual clutter. In this way, DSEP establishes a clear correspondence between the major interference factors and the processing stages, providing an efficient non-iterative solution for single-frame infrared target detection in low-altitude complex scenes.
The main contributions of this study are summarized as follows:
- The main interference factors in low-altitude infrared moving target detection are clarified and decomposed into three aspects: slowly varying background interference, scale-inconsistent pseudo-responses, and residual clutter with non-Gaussian statistical characteristics.
- A three-stage progressive DSEP framework is constructed to address these factors in a non-iterative feedforward manner, consisting of edge-preserving background decoupling, scale-consistent spatial screening, and residual-response purification.
- The proposed method provides a training-free and interpretable detection scheme for infrared moving targets with spatially extended responses, without relying on large annotated datasets or iterative low-rank optimization.
- Experiments on self-collected infrared sequences and selected scenes from the SIRST dataset, together with parameter sensitivity and ablation analyses, verify the effectiveness, efficiency, and limitations of the proposed framework.
The remainder of this paper is organized as follows: Section 2 reviews the related work and positions the proposed method. Section 3 introduces the proposed DSEP framework and its three progressive stages. Section 4 outlines the datasets, evaluation metrics, implementation details, and comparison methods used in the experiments. Section 5 presents the experimental results on the self-collected infrared sequences and the public SIRST dataset, covering visual comparisons, quantitative evaluation, ROC analysis, localization error analysis, runtime comparison, parameter sensitivity analysis, and ablation study. Section 6 discusses the experimental findings, limitations, and potential future directions. Finally, Section 7 concludes this paper.
2. Related Work
Infrared target detection has been extensively studied over the past decades. Most existing methods, however, were originally developed for small point-like targets. Although these methods provide valuable insights, their underlying assumptions become less appropriate when the target occupies a continuous region with noticeable spatial structure. In low-altitude remote sensing scenes, such mismatch often leads to degraded detection performance. In general, existing approaches can be grouped into three categories: spatial filtering and morphological methods, saliency-based methods inspired by the human visual system (HVS), and low-rank sparse representation-based methods. A brief review of these categories is provided below.
2.1. Spatial Filtering and Morphological Methods
Early studies on infrared target detection mainly focused on spatial-domain filtering. The core idea is to separate targets from the background by exploiting differences in spatial frequency or morphological scale. Representative methods include the Top-hat operator [10] and dual-structure-element morphological filtering [11]. These approaches estimate the local background using structural elements and extract anomalous high-frequency regions through background subtraction. In addition, local filtering methods based on third-order central moments [21] and the Robinson guarded filter [22] have also been introduced for background estimation and anomaly enhancement.
To better handle target scale variations, researchers have developed several multiscale extensions. For example, the multiscale ring Top-hat transformation [23] and morphological contour analysis [24] use multiple structural elements for targets of different sizes. Edge-preserving filtering has also been introduced into infrared background modeling. The bilateral filter [25] and anisotropic diffusion [26] are representative methods, as they suppress slowly varying background components while retaining strong gradient structures. Guided filtering [27], built on a local linear model, further provides an efficient option for background estimation in practical applications.
Although these methods are simple and computationally efficient, they remain sensitive to fixed or semi-adaptive scale settings. This issue is especially noticeable in low-altitude remote sensing scenes. When the target size is close to the structural element, filtering may weaken the target boundary and reduce local contrast. Meanwhile, strong radiation gradients and structured backgrounds can introduce high-frequency clutter that overlaps with target-like features, leading to false alarms. Overall, the performance of these methods is still constrained by local scale assumptions. Once scale mismatch occurs, extended targets are more likely to suffer from boundary degradation, response attenuation, and residual clutter leakage.
2.2. HVS-Based Methods
Saliency-based models, inspired by the human visual system, are commonly used to enhance infrared targets in complex backgrounds. Representative methods include the Local Contrast Measure (LCM) [13] and its weighted variant, WSLCM [14], which evaluate saliency through grayscale differences between inner and outer neighborhoods. These methods are generally effective in relatively simple and homogeneous backgrounds.
To better handle structured clutter, researchers have proposed a series of multiscale contrast-based methods. The multiscale patch-based contrast measure (MPCM) [28], for instance, uses neighborhood differences in multiple directions to reduce the influence of directional edges. The relative local contrast model (RLCM) [29] and the three-layer local contrast model (TLLCM) [30] further combine ratio and difference operations, leading to more stable local contrast responses.
Other studies have considered the problem of non-uniform target intensity. Methods such as DILCM [31] and ADMD [32] introduce directional gradient information to distinguish true targets from isolated high-frequency interference. For dynamic imaging conditions, motion-related cues have also been incorporated. As reported in [33], combining Gaussian similarity with motion outlier significance can improve detectability for infrared scenes captured by moving cameras.
Even so, most HVS-based methods are still mainly developed for point-like targets or backgrounds with relatively ideal statistical distributions. When the target appears as an extended region covering multiple connected pixels, their performance may degrade. If the target size exceeds the local support region used for contrast computation, target pixels may be included in background estimation, which can weaken or destabilize the saliency response. This problem is usually more evident in complex scenes with non-Gaussian gray-level distributions, where abnormal local responses may interfere with statistical estimation and lead to more false alarms.
2.3. Low-Rank and Sparse Representation Methods
Low-rank and sparse representation (LRSR) methods have also been widely studied for infrared target detection in complex scenes. Among them, the Infrared Patch-Image (IPI) model [17], derived from robust principal component analysis (RPCA) [18], is a representative method. Under this framework, the infrared image is separated into a low-rank background component and a sparse target component. In this way, structured background patterns can be distinguished from anomalous target responses in a unified formulation.
Later studies further improved decomposition quality by introducing additional prior constraints. For instance, the non-negative robust principal component analysis (NRAM) model [34] and the TV-PCP model [35] use spatial continuity to suppress edge residuals and sparse clutter. The non-overlapping patch-based structure (NIPPS) [36] also improves patch construction, while reducing redundant computation during decomposition.
With the development of tensor modeling, low-rank representation has been extended from matrices to tensors. Representative methods include RIPT [19] and PSTNN [20], both of which use tensor nuclear norm approximations to characterize multidimensional background structures. On this basis, some studies further explored non-local correlations in complex scenes, such as tensor ring decomposition [37] and the spatial–temporal reweighted sparse tensor model (SRWS) [38]. Other methods placed more emphasis on target preservation. For example, approaches based on the partial sum of singular values (PSSV) [39] and the improved logarithmic norm and sparse structure refinement model (ILN-SSR) [40] enhance weak-target responses through non-convex regularization and structural refinement. More recently, TGCM [41] and PTCTV-KMC [42] have also shown improved detection performance under complex infrared backgrounds. TGCM improves target representation from the perspective of global contrast, whereas PTCTV-KMC uses tensor regularization together with clustering-based clutter suppression. Even so, these methods may still struggle in strongly interfered low-altitude scenes, especially when targets show extended spatial structures.
While LRSR and tensor decomposition methods can effectively suppress complex backgrounds, they often rely on iterative optimization schemes like ADMM or APG. For an image of size , singular value decomposition typically has a computational complexity of , and convergence often requires multiple iterations. The computational cost further increases when block reconstruction or tensor unfolding is introduced. In low-altitude monitoring applications, where low-latency frame-level response is often required, this can limit the practicality of such methods for real-time single-frame processing. Therefore, achieving a better balance between separation performance and computational cost remains an important issue for practical deployment.
Existing methods still have limitations in low-altitude infrared scenes, particularly for extended targets. Spatial filtering and morphological methods are prone to scale mismatch and false alarms in structured backgrounds. HVS-based methods may weaken target responses under non-Gaussian clutter, whereas low-rank and sparse decomposition methods often require heavy computation. These issues suggest the need for a more efficient and robust strategy that can address different types of interference in low-altitude infrared target detection.
2.4. Deep Learning-Based Methods
Deep learning has also been introduced into infrared target detection in recent years. Representative methods, such as ISTDU-Net and DNANet, rely on encoder–decoder architectures and dense feature fusion to preserve small-target features more effectively [43,44]. Transformer-based methods further introduce long-range dependency modeling to enhance feature representation under complex backgrounds [45]. In addition, lightweight YOLO-based infrared detectors have been proposed to improve detection speed and localization ability [46,47].
However, these methods usually require sufficient annotated data for supervised training or fine-tuning. This differs from the focus of this study, which aims to develop a training-free and interpretable single-frame detection framework. The self-collected dataset used in this study contains limited low-altitude infrared sequences with spatially extended moving targets, whereas many public infrared datasets and pre-trained deep models are mainly designed for small-target detection. Direct use of these models may introduce domain mismatch in target scale, imaging distance, background type, and response morphology. Therefore, deep learning methods are discussed here but are not used as direct baselines in the experiments.
2.5. Positioning of the Proposed Method
The proposed DSEP framework is related to the above three categories, but it is not intended to be a direct extension of any single one of them. Compared with spatial filtering and morphological methods, DSEP retains the advantage of low computational cost, but further introduces a progressive structure to reduce the influence of scale-inconsistent pseudo-responses and residual clutter. Compared with saliency-based methods, DSEP does not rely solely on local gray-level contrast. Instead, it first separates slowly varying background components and then refines the target response through scale and statistical constraints, which is more suitable for targets with spatially extended responses. Compared with low-rank and sparse representation methods, DSEP avoids iterative optimization and matrix or tensor decomposition, making it more practical for frame-level processing.
Therefore, the proposed method can be regarded as a training-free and non-iterative progressive detection framework. Its main purpose is to organize efficient image-processing operations according to the different interference factors observed in low-altitude infrared scenes. In this sense, DSEP serves as a bridge between lightweight spatial-domain processing and more structured target enhancement, aiming to achieve a practical balance between target enhancement, background suppression, and computational efficiency.
3. Proposed Method
3.1. Overall Framework
To address infrared target detection in low-altitude remote sensing scenes, this paper proposes a three-stage progressive Decoupled Separation, Enhancement, and Purification (DSEP) framework. It is designed for single-frame infrared moving targets with spatially extended responses, where detection is often affected by slowly varying background interference, scale-inconsistent pseudo-responses, and residual clutter with non-Gaussian characteristics. The framework aims to enhance target responses while avoiding the high computational cost of low-rank and sparse representation methods [19,20]. Although the targets are moving in the acquired sequences, the proposed method processes each frame independently. Therefore, the term “moving target” in this study refers to the target type and application scenario, rather than the use of temporal motion cues in the algorithm.
As shown in Figure 1, DSEP consists of three successive stages: edge-preserving background decoupling, scale-consistent spatial screening, and residual-response purification. In Stage 1, guided filtering is used to estimate the background, and the difference operation with non-negative truncation is then applied to obtain a residual map. This stage mainly suppresses slowly varying background components while preserving local structural continuity around the target. In Stage 2, morphological opening is performed under a physical scale prior, namely the minimum expected target size, to remove scale-inconsistent pseudo-responses. In Stage 3, hard thresholding and power-law mapping are applied under a global statistical prior to suppress non-Gaussian residual clutter and refine the final response map.
Figure 1.
Overview of the proposed three-stage progressive DSEP framework. The framework consists of edge-preserving background decoupling, scale-consistent spatial screening, and residual-response purification. The images on the right show the intermediate outputs, including the background estimate, non-negative residual map, scale-screened response map, purified response map, and final detection map.
To avoid ambiguity, several terms are clarified here. “Infrared target detection” refers to locating target-related responses in infrared images. “Saliency map” or “saliency response” refers to the intermediate response map generated by the proposed framework or comparison methods. “Target extraction” refers to obtaining candidate target regions or target locations from the final saliency map. “Response purification” denotes the third stage of DSEP, where residual clutter is suppressed and target–background separability is improved. Here, “statistical suppression” is one operation within response purification, rather than an independent detection task. In addition, “false alarm” refers to a non-target pixel or region that is incorrectly enhanced or detected as a target. “Clutter” refers to background structures, noise, or local interference that may produce target-like responses. “Mixed responses” refer to residual maps that contain both target-related responses and background-related interference before further purification.
It should be noted that guided filtering, morphological opening, statistical thresholding, and power-law transformation are established image-processing techniques. They are not treated as new individual operators in this study. The contribution of DSEP lies in how these operations are organized and adapted for low-altitude infrared scenes. The parameters are determined according to the image resolution and expected target scale, enabling clutter suppression while preserving spatially extended target responses.
The three stages are not arranged arbitrarily. Background decoupling first produces a cleaner residual map. Spatial screening is then applied before statistical purification, because isolated noise and undersized clutter may affect threshold estimation. Finally, residual-response purification further improves target–background separability. Therefore, DSEP should be understood as a problem-driven coarse-to-fine detection framework, rather than a simple sequential stacking of existing operators.
3.2. Edge-Preserving Background Decoupling
The first stage aims to suppress slowly varying background interference while preserving structural information near target boundaries. In low-altitude remote sensing scenes, infrared targets are often embedded in fluctuating backgrounds and typically exhibit weak gray-level contrast relative to their surroundings [6,48]. Conventional isotropic smoothing methods, such as mean filtering and Gaussian filtering, apply uniform weights in all directions and therefore fail to distinguish slowly varying background components from meaningful structural edges. As a result, target boundary gradients may be absorbed into the estimated background, weakening the residual response and potentially causing over-suppression in subsequent processing [15,49]. Previous studies have also indicated that separating high- and low-frequency components can improve target enhancement in complex infrared scenes [50].
To overcome this limitation, guided filtering (GF) [27] is adopted for background modeling. Guided filtering is a local linear filtering method with linear-time complexity and strong edge-preserving capability. In this study, the original infrared image serves as both the input and the guidance image, so that the estimated background remains consistent with the structural distribution of the source image.
For a local window centered at pixel with radius , the background estimate is modeled as
where and are the linear coefficients within window . These parameters are obtained by minimizing the local reconstruction error:
where is a regularization parameter controlling sensitivity to local variance. After optimization, the output at each pixel is obtained by averaging the estimates from all overlapping windows, resulting in a background image that is globally smooth while preserving local edge structures.
The window radius and smoothing parameter are fixed according to the typical spatial scale of the target. This configuration effectively suppresses slowly varying background fluctuations while preserving structural continuity near edge regions. The initial saliency response is then defined as
This non-negative truncation suppresses background-related responses and retains positive residuals associated with potential targets.
As shown in Figure 2, the guided filtering effectively suppresses the slowly varying background while preserving structural information near target boundaries. The residual map before truncation still contains mixed target–background responses, whereas the non-negative truncation removes most negative components and retains the positive residuals associated with potential targets. As a result, the target regions are highlighted with improved contrast, providing a more reliable input for subsequent processing.
Figure 2.
Visualization of edge-preserving background decoupling: (a) original infrared image; (b) estimated background obtained by guided filtering; (c) raw residual map before non-negative truncation; (d) residual map after truncation.
3.3. Scale-Consistent Spatial Screening
After background decoupling, spatial screening is applied to the residual map under a target-size prior to eliminate scale-inconsistent responses. Although low-frequency background components have been largely suppressed, the residual map may still contain isolated bright spots, high-frequency noise, and locally discontinuous artifacts. Although these responses may appear salient, they do not correspond to actual targets and therefore tend to increase false alarms.
In infrared imagery, real targets typically occupy spatially connected regions with a certain area on the sensor plane, rather than appearing as isolated pixels or extremely small bright points [5,51]. This property makes the minimum target size a useful prior for spatial screening.
Based on this prior, morphological opening is introduced to remove small-scale responses that are inconsistent with the expected target size. Let denote the structuring element used for morphological processing. The opening operation of by is defined as
where denotes the structuring element, or denotes the morphological opening operator defined by , and and represent erosion and dilation, respectively. In this operation, acts as a spatial-scale constraint rather than a convolution kernel. The erosion step removes small-scale and isolated responses, whereas the dilation step restores the overall morphology of the retained structures. In this way, responses that do not satisfy the expected spatial scale are effectively suppressed.
A disk-shaped structuring element with radius is selected according to the minimum target size under the current imaging resolution. This setting allows the screening stage to suppress undersized responses while preserving spatially connected target regions.
Figure 3 shows that morphological opening removes many scattered pseudo-responses from the residual map while maintaining the main target structure. The removed components in Figure 3c are mainly sparse and isolated, suggesting that this stage primarily discards clutter responses that do not conform to the expected target extent.
Figure 3.
Visualization of scale-consistent spatial screening: (a) input residual map; (b) refined map after morphological opening; (c) removed components.
3.4. Residual-Response Purification
After spatial screening, the saliency map is further refined through suppression of residual clutter with abnormal statistical characteristics. In low-altitude remote sensing scenes, strong non-target responses may still remain because of local brightness variations, edge scattering, or non-uniform radiation. These responses often deviate from Gaussian-like behavior [16,52], making simple thresholding less effective for suppression.
To address this issue, a hard-thresholding strategy based on global statistics is employed. The global mean and standard deviation of the saliency map are computed as
An adaptive threshold is defined as
where is a penalty factor controlling the threshold strength.
Responses below the threshold are removed:
This step removes statistically weak responses and improves the purity of the saliency map. However, it may also suppress weak target signals under low-SCR conditions. To compensate for this effect, a nonlinear power-law transformation is applied:
where is the nonlinear exponent. This operation enhances strong responses while suppressing weaker ones, thereby improving target–background separability in the final saliency map [53].
Finally, the saliency map is normalized to the range [0, 1]:
where is a small constant used to avoid division by zero. The normalized map is then used for subsequent target extraction and performance evaluation.
Figure 4 shows that the adaptive thresholding stage effectively suppresses most low-intensity responses associated with non-Gaussian background fluctuations while retaining only a few candidate regions. After nonlinear enhancement, the dominant target response becomes further amplified, producing a highly sparse detection map in which the true target stands out clearly from the residual clutter.
Figure 4.
Visualization of residual-response purification: (a) saliency map before statistical suppression; (b) result after adaptive thresholding; (c) result after nonlinear enhancement; (d) final normalized detection map.
4. Experiments
Comparative experiments were conducted on two types of datasets to assess the effectiveness and robustness of the proposed method in low-altitude infrared remote sensing scenes. One consists of six representative self-collected infrared sequences, and the other includes six representative scenes selected from the public SIRST dataset. The self-collected data were used as the primary benchmark because they are more consistent with the characteristics of high-speed extended targets in low-altitude complex backgrounds. The SIRST dataset was further introduced as a supplementary public benchmark to provide additional evidence of the method’s generalization capability.
The comparison methods include Top-hat [10], LCM [13], WSLCM [14], IPI [17], RIPT [19], PSTNN [20], and ADMD [32], together with two recent high-performing methods, TGCM [41] and PTCTV-KMC [42]. These recently reported methods were selected to represent the latest progress in infrared target detection under complex backgrounds. Although some of these methods were originally developed for infrared small-target detection, they have also been widely used for single-frame target enhancement and background suppression. These methods cover several mainstream directions, including spatial filtering, local contrast analysis, low-rank sparse decomposition, and recent structural modeling, and were therefore selected for comparison.
4.1. Datasets
4.1.1. Self-Collected Infrared Dataset
To evaluate the proposed method under complex low-altitude infrared conditions, six representative infrared sequences were selected for experiments, as shown in Figure 5 and Table 1. All sequences were acquired using a long-wave uncooled infrared camera manufactured by InfiRay Technology Co., Ltd. (Yantai, China), with a resolution of pixels, a pixel pitch of 12 μm, a focal length of 25 mm, and a frame rate of 240 Hz.
Figure 5.
Representative frames of the six low-altitude infrared sequences used for performance evaluation. (a–f) correspond to Seq. A–Seq. F, respectively.
Table 1.
Scene composition and main characteristics of the self-collected infrared datasets.
The dataset includes several types of interference common in low-altitude infrared scenes, such as thermal trailing, isolated high-contrast targets, non-stationary smoke occlusion, structured ground clutter, strong speckle noise, and low-contrast fluctuating backgrounds. All sequences were processed consistently across the tested methods without sequence-specific parameter tuning, ensuring a fair evaluation. Representative frames are shown in this study. Due to experimental constraints, the full dataset is not public, but it can be shared upon reasonable request. The targets in the sequences typically occupy multiple connected pixels, with an approximate size ranging from about 5 × 5 to 15 × 15 pixels. This indicates that the targets exhibit spatially extended characteristics rather than ideal point-like structures.
Therefore, the self-collected dataset is referred to as an infrared moving extended-target dataset in this study. Here, “extended target” means that the target response occupies multiple connected pixels and may contain blurred boundaries, uneven intensity distribution, or trailing structures.
All methods were evaluated on the original infrared sequences without additional preprocessing. Ground truth was annotated frame by frame using the center of the main target body rather than the trailing structure. Since the targets considered in this study are spatially extended and may vary in shape across frames, it is difficult to define consistent pixel-wise annotations. Therefore, the annotated center was used to represent the target location. For ROC evaluation, a small neighborhood centered at the annotated position was defined as the effective target region, while the remaining pixels were treated as background. The ROC curves were obtained by threshold sweeping on the saliency maps. Unless otherwise stated, all parameters of the proposed method were fixed across the six sequences according to the sensitivity analysis.
The six sequences represent different low-altitude infrared conditions. Seq. A contains thermal trailing, Seq. B contains an isolated high-contrast target, Seq. C includes smoke disturbance, Seq. D contains structured ground clutter, Seq. E presents strong speckle noise, and Seq. F corresponds to a low-contrast fluctuating background.
4.1.2. Public SIRST Dataset
To examine the performance of the proposed method on public data, additional experiments were carried out on the SIRST dataset. As a commonly used benchmark in infrared target detection, SIRST includes a variety of background conditions and interference patterns, and thus serves as a useful public complement to the self-collected data.
It should be noted that SIRST mainly focuses on infrared small-target detection, whereas this study focuses on moving targets with relatively extended spatial responses in low-altitude complex scenes. Therefore, the selected SIRST samples are described as infrared small-target scenes in this study. The term “UAV target” is used only when referring to the target category in the selected SIRST examples.
Six representative UAV target scenes were selected from SIRST, as shown in Figure 6 and Table 2. In Figure 6a, the target has relatively high contrast and appears under cloud interference. Figure 6b presents a scene with ground-building clutter. In Figure 6c, the target is affected by thick clouds and shows relatively low contrast. Figure 6d corresponds to a scene disturbed by mountainous background structures. The selected scenes were chosen to cover different types of interference rather than to emphasize favorable examples. Figure 6e includes a complex ground background with structural textures and local clutter responses. Figure 6f presents a low-contrast small-target scene under a slowly varying background. These scenes reflect several typical challenges discussed in the Introduction, including slowly varying background interference, scale-inconsistent pseudo-responses, and residual clutter under complex gray-level distributions.
Figure 6.
Representative UAV target scenes selected from the public SIRST dataset: (a) a high-contrast target under cloud interference; (b) a scene with ground-building clutter; (c) a low-contrast target under thick cloud interference; (d) a scene with mountainous background interference; (e) a scene with complex ground clutter and structural textures; (f) a low-contrast small-target scene under a slowly varying background.
Table 2.
Description of the selected SIRST scenes used for evaluation.
Compared with the self-collected dataset, the selected SIRST samples contain smaller targets and more diverse backgrounds. They are therefore used as a supplementary public benchmark for evaluating the adaptability of the proposed method.
All selected SIRST images were tested at their original resolutions without additional preprocessing. The same parameter settings as those used for the self-collected dataset were directly applied, with no scene-specific tuning. The dataset-provided ground truth was used, and all metrics were calculated following the protocol in Section 4.3.
4.2. Experimental Environment
All experiments were conducted on the same hardware and software platform to ensure a fair comparison. The test environment consisted of a 64-bit system equipped with an 11th Gen Intel(R) Core(TM) i7-1165G7 CPU operating at 2.80 GHz, 16.0 GB RAM, and MATLAB R2021b. All methods were evaluated under identical operating conditions.
All comparison methods were implemented and evaluated under the same experimental environment. For each method, the main parameters were set according to the recommendations in the original papers or commonly used settings in related infrared target detection studies. When only parameter ranges were provided, representative values were selected according to the image resolution and the typical target size in the evaluated sequences. To ensure fairness, no sequence-specific parameter tuning was performed. Once determined, the parameters of each method were fixed across all self-collected sequences and selected SIRST scenes. The same input images, ground-truth annotations, evaluation metrics, and threshold-sweeping protocol were used for all methods. For methods originally designed for infrared small-target detection, their standard implementation procedures were retained as much as possible, and only necessary adjustments related to image size or target scale were made when required.
4.3. Evaluation Metrics
To objectively evaluate the proposed method in terms of target enhancement, background suppression, detection reliability, and real-time performance, four primary metrics were adopted: signal-to-clutter ratio gain (SCRG), background suppression factor (BSF), receiver operating characteristic (ROC) curve, and average single-frame processing time (Time). In addition, localization error (LE) was used as a supplementary metric for the self-collected dataset.
The signal-to-clutter ratio (SCR) measures target saliency within its local neighborhood and is defined as
where denotes the mean intensity of the target region, and and denote the mean intensity and standard deviation of the local background around the target, respectively. The local background is typically defined by a rectangular ring surrounding the target.
Based on SCR, the signal-to-clutter ratio gain (SCRG) and background suppression factor (BSF) are defined as
where and denote the local SCR values of the original image and the processed result, respectively, and and denote the global background standard deviations before and after processing. A higher SCRG indicates stronger target enhancement, whereas a higher BSF reflects more effective background suppression.
To evaluate detection reliability and false-alarm suppression under different segmentation thresholds, the receiver operating characteristic (ROC) curve was adopted. It describes the relationship between detection probability and false alarm rate :
where is the number of detected pixels falling inside the reference target region, is the total number of pixels in that region, is the number of falsely detected pixels outside the reference target region, and is the total number of pixels in the background region. Under the adopted center-based evaluation protocol, the background region is defined as all pixels outside the reference target neighborhood. Therefore, the ROC curve mainly reflects the concentration of detected responses around the annotated target location rather than strict pixel-level segmentation accuracy. In general, a curve closer to the upper-left corner indicates better detection performance with lower false alarm levels.
To further evaluate the localization reliability for spatially extended targets, localization error (LE) was added as a supplementary metric. The original center-based ROC evaluation mainly reflects whether the response is concentrated around the annotated target center. However, for spatially extended targets, it is also necessary to examine whether the detected response can provide stable target-level localization.
Since the self-collected targets exhibit changing spatial extent, blurred boundaries, and trailing responses, it is difficult to define consistent pixel-wise masks for all frames. Therefore, IoU and pixel-level F1-score were not used as primary metrics in this study. Instead, the annotated center of the main target body was used as the reference location, which is consistent with the adopted center-based annotation protocol.
For each frame, the predicted target location was obtained from the centroid of the detected connected component with the strongest response. The localization error is defined as
where denotes the predicted target location, and denotes the annotated target-center location. A smaller LE indicates higher localization accuracy.
This metric was applied mainly to the self-collected dataset, where the extended-target characteristics are more evident. For the SIRST dataset, which mainly contains small targets and serves as a supplementary public benchmark, the original center-based evaluation protocol based on the provided annotations was retained.
Finally, the average processing time per frame was used to evaluate computational cost and runtime efficiency. All reported metrics were calculated consistently for the corresponding methods. SCRG and BSF were obtained from local pixel statistics, while ROC curves were generated by threshold sweeping on the saliency maps. For the self-collected dataset, LE was calculated from the predicted target location and the annotated target-center location. This setting ensures a fair and consistent comparison among the tested methods.
5. Results
5.1. Analysis of 2D Saliency Detection Results
This subsection visually compares the target enhancement and background suppression results of different methods. The 2D saliency maps are included because they show the spatial distribution of target responses and residual clutter. This makes it easier to assess response continuity, false alarms, and local interference.
5.1.1. Results for the Self-Collected Dataset
Figure 7 presents the 2D saliency maps generated by different methods for the six representative sequences. The maps highlight noticeable differences in how each method enhances targets, suppresses background, and preserves the shape of the targets.
Figure 7.
Comparison of 2D saliency maps obtained by different methods on the six representative sequences from the self-collected dataset. (a–f) correspond to Seq. A–Seq. F, respectively. Row labels indicate the corresponding methods. Red boxes indicate the target locations, and enlarged views are provided for better visualization.
In Seq. C and Seq. D, many false responses appear around smoke boundaries and structured ground contours after Top-hat processing, indicating that its robustness is limited in cluttered scenes. For Seq. A and Seq. B, LCM and WSLCM produce relatively weak target responses, and some target regions are not fully preserved. This result suggests that local contrast-based methods may be less effective for spatially extended targets. The low-rank methods, including IPI, RIPT, and PSTNN, generally yield cleaner backgrounds. Even so, some residual texture, speckle-like interference, and slight over-smoothing can still be observed, especially in Seq. E and Seq. F. PTCTV-KMC also exhibits obvious missed detections in several sequences, indicating that its response stability is still insufficient under the low-altitude infrared conditions considered in this study.
In comparison, the proposed method generally produces compact and spatially continuous target responses across the six sequences, while suppressing much of the background interference. It remains effective under smoke disturbance, structured clutter, speckle noise, and low-contrast backgrounds. Spatial filtering methods are more prone to false alarms in structured scenes, and local contrast methods may suffer from response attenuation when handling extended targets. Low-rank methods can suppress part of the background, but residual clutter or loss of local target details is still observed. PTCTV-KMC also shows missed detections in some cases. Overall, DSEP provides relatively balanced visual performance across the evaluated low-altitude infrared scenes.
5.1.2. Results for the Public SIRST Dataset
Figure 8 presents the 2D saliency maps of different methods on the selected SIRST scenes. Compared with the self-collected data, the targets in SIRST are usually smaller and embedded in more diverse backgrounds, making reliable detection more difficult.
Figure 8.
Comparison of 2D saliency maps obtained by different methods on the selected SIRST scenes. (a–f) correspond to Seq. 1–Seq. 6 from the public SIRST dataset, respectively. Row labels indicate the corresponding methods. Red boxes indicate the target locations, and enlarged views are provided for better visualization.
In Figure 8a,c, cloud interference is the main source of disturbance. Under this condition, Top-hat and several contrast-based methods tend to generate scattered background responses, which lead to obvious false alarms. LCM and WSLCM can enhance the target in some cases, but their responses are not consistently stable, especially when the target contrast is weak. Low-rank methods, such as IPI, RIPT, and PSTNN, can remove part of the background, but some residual clutter remains visible. In several cases, the target responses also become slightly blurred. ADMD preserves the target response to some extent, yet its suppression of background interference is still insufficient in certain regions. TGCM produces relatively cleaner maps overall, but its stability is reduced when the cloud structure becomes more complex or the target contrast is weak.
The scenes shown in Figure 8b,d contain stronger structured backgrounds, including buildings and mountainous textures. Under these conditions, spatial filtering methods are more likely to respond to background structures, while local contrast methods also show limited robustness. Although low-rank methods provide relatively cleaner results, some target details are weakened. ADMD is still influenced by structural clutter in these scenes, while TGCM suppresses part of the background but does not always maintain a sufficiently compact target response. PTCTV-KMC shows evident missed detections in several cases, indicating that its responses are not sufficiently stable under complex background conditions.
Figure 8e further shows the results under complex ground clutter. The background contains irregular textures and local clutter responses, which make it difficult to distinguish the target from surrounding interference. Top-hat and contrast-based methods retain noticeable background responses, while low-rank methods suppress part of the clutter but may still leave residual texture. The proposed method produces a clearer and more compact response at the target location, with most surrounding clutter suppressed.
Figure 8f corresponds to a low-contrast small-target scene under a slowly varying background. In this case, the target response is weak, and several comparison methods either enhance background structures together with the target or produce an unstable target response. The proposed method still keeps the target distinguishable and suppresses most background responses. However, the target response is less prominent than in easier scenes, indicating that low target–background contrast remains challenging.
By comparison, the proposed method generally produces relatively compact and clear target responses across the six representative sequences. Most background interference is effectively suppressed, and the target remains distinguishable under both cloud disturbance, structured clutter, complex ground backgrounds, and slowly varying low-contrast conditions. The responses are generally more concentrated, which is beneficial for target localization.
Overall, the results on SIRST do not fully mirror those obtained on the self-collected dataset, mainly due to differences in target characteristics and scene complexity. Since the selected SIRST scenes contain smaller targets and more diverse backgrounds, the advantage of the proposed method becomes less pronounced in some cases. Nevertheless, DSEP still maintains relatively stable performance in most evaluated scenes. Spatial filtering methods are more prone to false alarms, contrast-based methods may produce weakened or unstable responses, and low-rank methods can still leave residual clutter. Although ADMD and TGCM improve the results in some cases, their robustness decreases when the background becomes more complex or the target response becomes weak.
5.2. Analysis of 3D Saliency Detection Results
This subsection uses 3D saliency surfaces to further analyze the spatial distribution and concentration of saliency responses. These surfaces complement the 2D maps by showing response magnitude, target peak concentration, and background fluctuations more clearly.
5.2.1. Results for the Self-Collected Dataset
Figure 9 shows the 3D saliency energy surfaces of different methods on the six representative sequences. Compared with the 2D saliency maps, the 3D surfaces more directly reflect target enhancement and background suppression.
Figure 9.
Comparison of 3D saliency energy surfaces obtained by different methods on the six representative sequences from the self-collected dataset. (a–f) correspond to Seq. A–Seq. F, respectively. Row labels indicate the corresponding methods, and red circles mark the target locations.
In Seq. C and Seq. D, Top-hat produces obvious multi-peak distributions, indicating insufficient suppression of structured clutter. In Seq. A and Seq. B, LCM and WSLCM show flattened or partially collapsed target peaks, and some responses become dispersed, forming ring-like or split-peak patterns. This suggests limited energy aggregation for extended targets.
The low-rank methods, including IPI, RIPT, and PSTNN, generally produce smoother surfaces. However, background fluctuations remain visible, especially in Seq. E, where the base surface stays above zero, indicating residual responses under complex backgrounds. In Seq. F, the target peaks are relatively weak, and the target–background contrast is still limited. ADMD preserves the target peak to some extent, but background undulations remain in several sequences. TGCM usually gives smoother surfaces than spatial filtering methods, but its stability decreases in cluttered scenes, where multiple local peaks can still be observed.
PTCTV-KMC also shows unstable energy distributions in several sequences. In some cases, the target peak is weakened or even absent, while noticeable fluctuations remain in the background, indicating limited stability under complex interference conditions.
By contrast, the proposed method generally produces a dominant peak at the target location marked by the red circle, while keeping most background regions close to the zero plane. The target response is more concentrated and sharper, resulting in clearer separation from the background. This behavior is particularly evident in Seq. C and Seq. E, where the background surface becomes relatively flat and the main target peak remains clearly identifiable.
However, in Seq. F, where the background is relatively complex and the target contrast is low, the proposed method also shows certain limitations. Although the target peak can still be identified, its prominence is reduced, and slight background fluctuations remain. This indicates that the method may be less effective in scenarios with extremely weak target–background contrast.
5.2.2. Results for the Public SIRST Dataset
Figure 10 shows the 3D saliency energy surfaces obtained by different methods on the selected SIRST scenes. Compared with the self-collected dataset, the SIRST targets are smaller and appear in more diverse backgrounds, so the differences in target concentration and background fluctuation can be seen more clearly in the 3D view.
Figure 10.
Comparison of 3D saliency energy surfaces obtained by different methods on the selected SIRST scenes. (a–f) correspond to Seq. 1–Seq. 6 from the public SIRST dataset, respectively. Row labels indicate the corresponding methods. Red circles indicate the target locations.
In Figure 10a, most methods can roughly locate the target, but their background suppression ability is clearly different. Top-hat, ADMD, and several contrast-based methods still retain visible background undulations and secondary peaks. The low-rank methods suppress part of the clutter, although slight residual fluctuations remain. By comparison, the proposed method forms a more concentrated target peak and keeps the surrounding background relatively flat.
Figure 10b corresponds to a scene with building interference, where structured background components have a stronger effect on several comparison methods. Top-hat, LCM, WSLCM, and TGCM show elevated backgrounds or multiple local peaks, which reduces target prominence. IPI, RIPT, and PSTNN produce relatively smoother surfaces, but residual responses are still visible. PTCTV-KMC suppresses much of the background, although its target peak remains unstable. By comparison, the proposed method maintains a clearer target peak and a cleaner background.
Figure 10c is more challenging because thick clouds introduce strong non-uniform interference. Under this condition, several methods show obvious background fluctuations or irregular surface structures, and the target peak becomes less distinguishable from surrounding clutter. This is particularly evident for Top-hat, TGCM, and PTCTV-KMC. The low-rank methods improve the results to some extent, but residual local peaks still remain. The proposed method preserves the main target peak, although slight background undulations can also be observed, indicating reduced suppression capability under severe cloud interference.
In Figure 10d, mountainous structures dominate the background. Many comparison methods therefore produce elevated background surfaces or dispersed peaks, making the target less prominent in the overall energy distribution. The proposed method again yields a relatively concentrated peak and a flatter background than most competing methods.
Figure 10e examines a scene with complex ground clutter. In this case, irregular background textures and several local high-response regions can easily produce pseudo-target peaks. Spatial filtering and contrast-based methods still show noticeable surface fluctuations, and some methods leave multiple local peaks near cluttered areas. Although low-rank methods reduce part of the background variation, residual clutter can still be observed. The proposed method produces a clearer dominant peak at the target location and suppresses most surrounding clutter responses, showing better response concentration in this complex ground scene.
Figure 10f shows a low-contrast small-target scene with a slowly varying background. Here, the target response is weak and can be easily buried in background fluctuation. Several comparison methods either generate weak target peaks or retain residual background responses, making the separation between the target and background less distinct. The proposed method still preserves a recognizable target peak and keeps the background surface relatively flat. Nevertheless, the peak is less prominent than in easier scenes, indicating that the method still has limitations when the target–background contrast is extremely low.
Overall, the 3D results on SIRST are consistent with the 2D comparisons. Spatial filtering and contrast-based methods are more sensitive to clouds, buildings, terrain textures, complex ground clutter, and slowly varying backgrounds. Low-rank methods usually produce smoother surfaces, but residual clutter may still remain. TGCM and PTCTV-KMC perform well in some relatively simple scenes, but their stability decreases when the background becomes more complex or the target response becomes weak. In contrast, the proposed DSEP framework generally produces more concentrated target responses and lower background fluctuation in most evaluated scenes. However, its advantage becomes less obvious in difficult scenes such as Figure 10c,f, where severe residual interference or weak target contrast still affects the response.
5.3. Analysis of SCRG and BSF Results
This subsection quantitatively evaluates target enhancement and background suppression performance using SCRG and BSF metrics.
5.3.1. Results for the Self-Collected Dataset
Table 3 presents the SCRG and BSF results of different methods on six representative sequences. In general, the proposed method maintains relatively stable quantitative performance across different scenes, although it does not achieve the best value for every metric or sequence. Its SCRG values remain high in most cases, and its BSF values are also competitive. This indicates that the method can preserve a reasonable balance between target enhancement and background suppression.
Table 3.
Quantitative comparison of SCRG and BSF for different methods on the self-collected infrared dataset. Larger values indicate better performance for both SCRG and BSF.
In Seq. A and Seq. C, the proposed method achieves the highest SCRG values, reaching 9.71 and 8.57, respectively. This suggests that the method remains effective under thermal trailing and smoke interference. By comparison, LCM and WSLCM show relatively low SCRG values, which reflects limited robustness for spatially extended targets. ADMD also gives weak enhancement in these two sequences. TGCM shows some improvement, but the overall result is still lower than that of the proposed method. PTCTV-KMC behaves somewhat differently. Its BSF values are relatively high in both sequences, but its SCRG values remain low. This means that stronger background suppression does not necessarily produce stronger target saliency.
In Seq. B, the proposed method again gives the highest SCRG, and its BSF is also relatively high. This indicates that the target can be enhanced while the background remains well suppressed. ADMD and TGCM also perform reasonably well in this sequence, but both are still below the proposed method in overall quantitative performance. PTCTV-KMC again shows a relatively high BSF, whereas its SCRG remains limited. This further suggests that its suppression ability and enhancement ability are not well balanced.
Seq. D is more strongly affected by structured background interference. In this sequence, the proposed method achieves the highest SCRG and also maintains a competitive BSF, showing relatively stable performance under cluttered background conditions. Top-hat and ADMD obtain relatively high BSF values, but their SCRG values remain low, which indicates that the background is suppressed without sufficient target enhancement. TGCM produces moderate SCRG and BSF values, and this is broadly consistent with its visual performance. PTCTV-KMC also yields a relatively high BSF, but its SCRG is still limited, indicating that its response is not sufficiently concentrated on the true target.
Seq. E is particularly challenging because the background shows clear non-Gaussian behavior. In this sequence, most methods degrade noticeably in both SCRG and BSF. Even under this condition, the proposed method still achieves an SCRG of 4.42 and a BSF of 4.70, indicating comparatively better robustness than most competing methods in this sequence. ADMD and TGCM perform better than several traditional methods, but their results are still influenced by background fluctuations. PTCTV-KMC maintains a relatively high BSF, whereas its SCRG remains low. This suggests that, in such scenes, suppressing the background alone is not sufficient.
In Seq. F, all methods show reduced SCRG values because the target contrast is low. TGCM obtains the highest SCRG in this sequence, while the proposed method achieves a comparable SCRG and maintains a moderate BSF. This indicates that the advantage of the proposed method becomes less pronounced under very weak target–background contrast. Nevertheless, the proposed method still shows a relatively balanced behavior between target enhancement and background suppression, although its advantage over the best competing method becomes less obvious in this sequence.
It should also be noted that the proposed method still has some limitations. In highly challenging scenes such as Seq. E and Seq. F, the gain in SCRG becomes smaller, and the advantage over other methods is less pronounced. This suggests that the robustness of the method can still be improved when the target contrast is very low or the background interference is particularly strong.
Overall, the quantitative results agree well with the visual comparisons in Figure 7 and Figure 9. Some methods can suppress the background strongly, but their target responses are not always sufficiently concentrated. In contrast, the proposed method shows a more balanced behavior across different scenes, since it maintains both effective suppression and relatively stable target enhancement.
5.3.2. Results for the Public SIRST Dataset
Table 4 lists the SCRG and BSF results on the selected SIRST scenes. The proposed method gives relatively strong target responses and low background fluctuations. These results indicate that it can maintain a stable balance between enhancement and suppression under different scene conditions.
Table 4.
Quantitative comparison of SCRG and BSF for different methods on six selected scenes from the public SIRST dataset. Larger values indicate better performance for both SCRG and BSF.
In Seq. 1, the target remains identifiable, although cloud interference is present. The proposed method gives the strongest target response, reflected by the highest SCRG, and its BSF also stays at a competitive level. IPI, RIPT, TGCM, and ADMD can enhance the target to some degree, but their responses are generally less compact. PTCTV-KMC, by contrast, achieves a relatively high BSF but only a weak SCRG, indicating that background suppression alone does not necessarily lead to effective target enhancement.
Seq. 2 contains clear structural interference from buildings. Even in this case, the proposed method still produces the strongest target response, while its BSF remains close to that of several competing methods. IPI, RIPT, and ADMD retain reasonable enhancement capability, whereas LCM, WSLCM, and PSTNN perform less well. PTCTV-KMC suppresses part of the background, but the response at the target location is still weak.
Seq. 3 is more difficult because of dense cloud coverage and low target contrast. Under this condition, most methods show noticeable degradation in both SCRG and BSF. The proposed method still maintains a relatively strong SCRG, suggesting that the target remains distinguishable to some extent even in heavy interference. ADMD reaches a relatively high BSF in this sequence, which implies stronger background smoothing, but its target response is not prominent enough. Most of the other methods produce weak or scattered responses, which limits their effectiveness in this scene.
In Seq. 4, the mountainous background introduces strong structural clutter. The proposed method again produces the clearest target response, while keeping the background at a moderate level. ADMD and TGCM suppress background fluctuations more strongly in some regions, but their responses are less focused on the target. PTCTV-KMC performs poorly in both metrics, which suggests limited robustness under strong structural interference.
Seq. 5 corresponds to a complex ground background with structural textures and local clutter. Several methods show limited target enhancement or leave residual clutter. ADMD obtains a relatively high BSF, but its SCRG is lower than that of the proposed method. The proposed method gives higher SCRG and BSF values, indicating a clearer target response and better suppression of ground clutter.
Seq. 6 is a low-contrast small-target scene under a slowly varying background. In this case, the performance gap among methods becomes smaller. IPI, RIPT, ADMD, and TGCM still show reasonable enhancement or suppression ability. The proposed method obtains the highest SCRG and BSF, but the improvement is less evident than in easier scenes, suggesting that weak target–background contrast remains challenging.
Overall, the quantitative results are broadly consistent with the visual comparisons. Some methods are more effective in background suppression, while others enhance the target but may retain residual clutter. The proposed method shows relatively stable performance across the six selected SIRST scenes, especially in terms of maintaining target response. However, its advantage becomes less obvious in low-contrast or heavily cluttered scenes, where further improvement is still needed.
5.4. ROC Results Analysis
This subsection evaluates detection reliability under different false-alarm levels using ROC curves.
5.4.1. Results for the Self-Collected Dataset
Figure 11 presents the ROC curves of all methods on the six representative sequences, with the false alarm rate plotted on a semi-logarithmic scale. Using this scale makes the differences in the low-false-alarm region easier to distinguish, which is important for evaluating infrared target detection performance.
Figure 11.
ROC curve comparison of different methods on the six representative sequences from the self-collected dataset. (a–f) correspond to Seq. A–Seq. F, respectively. The false alarm rate is displayed on a semi-logarithmic scale from to to highlight performance differences under strict false-alarm constraints.
For Seq. A, the proposed method performs well over most of the operating range, but it is not consistently the best in the extremely low-false-alarm region. In this scene, the target is relatively bright and exhibits an elongated structure with clear trailing energy. Under such conditions, methods based on global modeling, especially RIPT, can preserve the overall target response more effectively and therefore achieve slightly better performance in part of the strict low-false-alarm interval. By comparison, the proposed method places more emphasis on response concentration and background suppression, which may weaken part of the extended trailing structure. As a result, its advantage in this sequence is not as clear as in the more challenging scenes.
In Seq. B, the target remains distinguishable, although background structures begin to introduce interference. The proposed method still reaches the upper-left region earlier than most competing methods, indicating a better balance between detection probability and false alarm control. IPI and Top-hat remain relatively competitive in parts of the curve, while LCM, WSLCM, and RIPT require a higher false alarm rate to achieve similar detection probability. PTCTV-KMC again shows a clear gap in the low-false-alarm range.
The differences become more pronounced in Seq. C. Once smoke interference is introduced, the ROC curves of several methods shift noticeably to the right. The proposed method generally performs better and reaches high detection probability at lower false alarm rates than most competing methods. IPI and TGCM still maintain some detection ability, but their curves are relatively less compact. ADMD and PTCTV-KMC show improvement only at higher false alarm rates, which reduces their effectiveness in stricter detection settings.
Seq. D is dominated by structured ground clutter, and this further enlarges the gap between methods. The proposed method stays closer to the upper-left region and shows better robustness than most competing approaches. IPI and TGCM remain usable, but their overall trajectories are still weaker. Spatial filtering and local contrast methods degrade more clearly in this scene, especially in the low-false-alarm interval.
In Seq. E, the background becomes more complex and non-Gaussian. Most methods therefore show a clear rightward shift in the ROC curve. The proposed method still preserves a relatively good trade-off between detection probability and false alarm rate, although its lead over the other methods is smaller than in Seq. C and Seq. D. IPI and WSLCM remain competitive in part of the operating range, while ADMD, TGCM, and PTCTV-KMC require a larger false alarm rate before their detection probability rises substantially.
Seq. F is the most difficult case because the target contrast is weak and the background disturbance is stronger. The ROC curves are compressed, and the differences among methods become smaller. The proposed method still shows the best overall tendency in the low-false-alarm region, but the margin is limited. In several local intervals, RIPT and IPI achieve comparable behavior. This indicates that when target–background separation becomes very weak, the advantage of the proposed framework is reduced.
The ROC results are consistent with the visual comparisons and the SCRG/BSF metrics. In most sequences, the proposed method achieves a stable balance between detection probability and false alarm suppression. Its advantage, however, is less pronounced in all cases. In high-contrast scenes such as Seq. A, where the target is already clear and accompanied by strong trailing structures, methods that preserve broader target responses may perform slightly better in part of the extremely low-false-alarm region. In weak-target scenes such as Seq. F, the performance gap also narrows, as all methods are constrained by limited target–background separability. It should also be noted that, under the adopted center-based evaluation protocol, the ROC curves mainly reflect response concentration around the annotated target location rather than strict pixel-level accuracy.
5.4.2. Results for the Public SIRST Dataset
The ROC curves on the public SIRST dataset provide an additional view of how the compared methods behave under different scene conditions (Figure 12). In Seq. 1, the proposed method follows a relatively favorable trajectory over a broad operating range and attains higher detection probability at low false-alarm levels. This suggests that the target response is still sufficiently concentrated, while the surrounding interference is reasonably controlled.
Figure 12.
ROC curve comparison of different methods on six representative scenes from the public SIRST dataset. (a–f) correspond to Seq. 1–Seq. 6, respectively. The false alarm rate is displayed on a semi-logarithmic scale from to to highlight performance differences under strict false-alarm constraints.
A different situation appears in Seq. 2. Since the target is already well separated from the background, most methods achieve nearly saturated detection performance. The ROC curves therefore gather near the top boundary. Under such conditions, the ROC metric becomes less discriminative, and the performance differences among methods are therefore not clearly reflected by the curves.
Seq. 3 and Seq. 4 are more challenging. Although the UAV can be visually recognized, the background is more complicated and makes stable detection harder. For Seq. 3, the thick cloud layer introduces clear non-uniform intensity variations, which weaken local contrast around the target. In Seq. 4, the mountainous background contains strong structural patterns, and these structures can generate responses similar to the target. As a result, several methods need a higher false-alarm rate before their detection probability rises to a comparable level.
Seq. 5 contains complex ground clutter with local structural responses. The background textures may produce pseudo-target responses, so some methods show a slower increase in detection probability. The proposed method keeps a relatively stable ROC trend, indicating that the target response can still be separated from the clutter to some extent.
Seq. 6 corresponds to a low-contrast small-target scene with a slowly varying background. In this case, the target response is weak, and the differences among methods become smaller. The proposed method remains competitive, but its advantage is less obvious than in high-contrast scenes. This suggests that weak target–background contrast still affects detection stability.
It is worth noting that the proposed method does not consistently achieve the best ROC performance on the selected SIRST scenes. This is partly because SIRST mainly focuses on infrared small targets, while the proposed framework emphasizes spatial consistency and structured responses for extended targets. Under a pixel-wise ranking criterion, sharper local peaks may sometimes be favored over spatially continuous responses. Overall, the proposed method shows relatively stable detection behavior across the six selected SIRST scenes, but its advantage becomes less obvious in simpler backgrounds or low-contrast small-target cases, indicating that further improvement is still needed for broader adaptability.
5.5. Localization Evaluation for Extended Targets
This subsection evaluates target-level localization reliability for extended targets under the adopted center-based annotation protocol.
Table 5 reports the LE results on the self-collected infrared dataset. The proposed method gives relatively low LE values in most sequences, which means that the detected response is generally close to the annotated target center. It should be noted that the proposed method is not the best in every sequence. For example, RIPT, TGCM, or Top-hat obtain smaller LE values in Seq. A, and RIPT gives a smaller value in Seq. C. Even so, the proposed method does not show the large localization deviations observed in several comparison methods.
Table 5.
Localization evaluation on the self-collected infrared dataset. LE is measured in pixels, and smaller values indicate better localization accuracy.
In Seq. B, most methods achieve small LE values, indicating that the target is easier to localize in this scene. In more complex scenes, the differences become clearer. For Seq. C, Seq. D, Seq. E, and Seq. F, several methods produce very large LE values, suggesting that their strongest responses may shift to background clutter, edge structures, or noise-like regions. By contrast, the proposed method keeps the localization error within a relatively small range in these challenging scenes, showing more stable target-level localization.
These results support the localization stability of the proposed method under the adopted center-based annotation protocol. However, LE only measures the distance between the predicted target location and the annotated target center, and does not evaluate pixel-level segmentation accuracy of the entire target region. Therefore, Table 5 should be regarded as supplementary evidence of response localization reliability, rather than strict region-level detection accuracy.
5.6. Processing Time and Computational Complexity Analysis
This subsection analyzes the computational efficiency and low-latency processing capability of different methods.
5.6.1. Results for the Self-Collected Dataset
Table 6 summarizes the average single-frame processing time of different methods on the six representative sequences from the self-collected dataset. A clear gap in computational cost can be observed among different categories of methods, which is closely related to their underlying algorithmic structures.
Table 6.
Average single-frame processing time (s) of all algorithms across six representative sequences from the self-collected dataset. A smaller value indicates better runtime efficiency.
Spatial filtering and local contrast methods, including Top-hat, LCM, WSLCM, and ADMD, exhibit the highest efficiency. Their runtimes remain at the millisecond level, generally below 0.01 s per frame. This is mainly because these methods rely on local operations such as sliding-window filtering, simple statistical measures, or morphological processing, all of which can be implemented efficiently without iterative procedures. However, such simplicity also limits their robustness in complex backgrounds.
By contrast, low-rank and tensor-based methods, including IPI, RIPT, and PSTNN, are much more computationally demanding. Their average runtime is about 0.14 s to 0.53 s per frame. This is mainly because they rely on iterative optimization. In practice, such methods usually involve repeated matrix decomposition, singular value thresholding, or tensor factorization, all of which add substantial computational overhead. As a result, although they are effective at suppressing background clutter, their runtime efficiency is relatively low.
For TGCM and PTCTV-KMC, the computational cost is even higher. Their per-frame runtime reaches several seconds or even tens of seconds. A main reason is that these methods introduce more complex global modeling strategies. TGCM relies on graph-based or global correlation modeling, which increases both computation and memory access cost. PTCTV-KMC further includes multi-stage optimization together with clustering or reconstruction steps, so the whole image needs to be processed repeatedly. This greatly increases the runtime and limits its practicality for low-latency applications.
The proposed method requires about 0.009 s to 0.016 s to process one frame. Although it is not the fastest method, its computational cost remains close to that of lightweight approaches. This is largely due to its fully feedforward design. The framework avoids iterative optimization and expensive matrix decomposition, and instead uses guided filtering and local morphological operations, both of which can be implemented efficiently. As a result, the runtime remains relatively stable across different sequences.
From a practical point of view, the proposed method is not intended to pursue minimum runtime alone. Rather, it aims to achieve a better balance between detection performance and computational efficiency. Some methods are slightly faster, but their detection stability is limited. Others offer stronger modeling capability, but at the cost of much heavier computation. The proposed method lies between these two cases, providing reliable detection performance with low-latency frame-level processing capability.
The self-collected infrared camera operates at 240 Hz, corresponding to approximately 0.0042 s per frame. The current MATLAB CPU implementation of the proposed method requires about 0.009–0.016 s per frame on the self-collected dataset, corresponding to approximately 62–111 frames per second. Therefore, although the proposed method shows low-latency frame-level processing capability, it cannot guarantee full-frame processing at the original 240 Hz acquisition rate under the current implementation. For applications requiring full-rate processing, further code optimization, parallel acceleration, frame-skipping strategies, or deployment on dedicated hardware may be needed.
5.6.2. Results for the Public SIRST Dataset
Table 7 gives the average single-frame runtime of different methods on the six selected SIRST scenes. Similar to the results on the self-collected dataset, the difference in computational cost between lightweight methods and more complex approaches is still obvious.
Table 7.
Average single-frame processing time (s) of different methods on six selected scenes from the public SIRST dataset. A smaller value indicates better runtime efficiency.
Top-hat, LCM, WSLCM, and ADMD remain highly efficient, with most runtimes at the millisecond level. This is mainly because they are based on local filtering or simple statistical operations. Their low computational cost, however, is often accompanied by limited robustness in more complex scenes.
IPI, RIPT, and PSTNN require noticeably more computation. Their runtimes are generally higher than those of lightweight filtering and contrast-based methods. The additional cost mainly comes from iterative optimization and repeated matrix or tensor operations.
TGCM and PTCTV-KMC show higher computational cost in most scenes, mainly due to their global modeling or multi-stage processing procedures. Although their runtimes vary across different SIRST scenes, such computational cost may limit their use in low-latency frame-level detection.
The proposed method requires 0.0086 s to 0.0442 s per frame on the selected SIRST scenes. Although it is not as fast as the simplest methods such as LCM and WSLCM, it remains much faster than most low-rank and global modeling methods. This is mainly due to its non-iterative feedforward structure, in which the main operations are guided filtering, morphological screening, and statistical purification.
Overall, the proposed method is not intended to achieve the lowest runtime alone. Instead, it offers a practical balance between efficiency and detection performance, making it more suitable for low-latency infrared detection tasks, although full-rate real-time deployment still requires further implementation optimization.
5.7. Sensitivity Analysis of Key Parameters
This subsection evaluates the sensitivity of the proposed framework to key parameters. Figure 13 presents the sensitivity analysis of four key parameters on the six representative sequences. The analysis was conducted on the self-collected dataset, which is the primary benchmark and better represents low-altitude infrared moving extended targets. The public SIRST dataset was used only for supplementary validation. These parameters correspond to the three main stages of the proposed framework, namely background decoupling, scale-consistent screening, and residual-response enhancement. Although the six sequences differ clearly in scene conditions, their overall response trends remain similar.
Figure 13.
Sensitivity analysis of key parameters in terms of SCRG on the six representative sequences from the self-collected dataset.: (a) guided filter window radius ; (b) morphological structuring element radius ; (c) penalty coefficient ; (d) power-law exponent .
As shown in Figure 13a, SCRG first increases as the guided filter window radius becomes larger, and then gradually decreases after reaching its peak. The best overall performance appears around . In Figure 13b, SCRG reaches its maximum at , which is consistent with the minimum target size under the current imaging resolution. For the penalty coefficient , the curves in Figure 13c indicate that a value close to 5 provides a relatively balanced trade-off between target enhancement and background suppression. Figure 13d shows that SCRG increases with the power-law exponent at first and then becomes relatively stable. A moderate value of enhances target–background separability, while an overly large value may weaken low-contrast target responses.
The regularization parameter in guided filtering is not included in Figure 13. In all experiments, it was fixed at a small constant value of . Its main role is to control the trade-off between local edge preservation and background smoothing. Preliminary tests showed that, within a reasonable range, variations in had only a limited influence on the detection results.
Overall, the results indicate that the proposed method is not overly sensitive to moderate parameter changes and can maintain stable performance across different scene types. The selected parameters provide a stable balance between clutter suppression and target preservation.
5.8. Ablation Study
To examine the role of each component, an ablation study was conducted on the self-collected infrared dataset. This dataset is used as the main benchmark because it better represents low-altitude infrared moving targets with spatially extended responses. Seven variants were tested: BD, SS, RP, BD + SS, BD + RP, SS + RP, and the full proposed method. Here, BD, SS, and RP denote background decoupling, scale-consistent spatial screening, and residual-response purification, respectively. The visual results are shown in Figure 14, and the quantitative results are given in Table 8.
Figure 14.
Ablation results of the proposed DSEP framework on the self-collected infrared dataset, where (a–f) correspond to the six representative sequences.
Table 8.
SCRG and BSF results of different DSEP variants on the self-collected dataset. Larger values indicate better performance for both SCRG and BSF.
As shown in Figure 14, SS alone retains much of the original background because it only removes scale-inconsistent structures and cannot suppress slowly varying background interference. Therefore, its SCRG and BSF values remain close to 1 in Table 8. BD improves the target response by removing part of the background component, but residual clutter and small pseudo-responses are still visible in several sequences.
RP alone produces sparse response maps in some cases. However, a darker response map does not necessarily indicate better detection. In Seq. C, Seq. E, and Seq. F, RP suppresses not only the background but also part of the target response, leading to very low SCRG values. This shows that residual-response purification is unreliable when applied without prior background decoupling and spatial screening.
The two-stage variants further reveal the interaction among the modules. BD + SS performs better than BD in most sequences because spatial screening removes isolated and undersized responses after background decoupling. For example, in Seq. A, SCRG increases from 5.62 to 7.94 and BSF from 4.35 to 6.05. In Seq. C, SCRG increases from 4.92 to 7.05 and BSF from 2.12 to 2.91. These results indicate that SS is effective only after a cleaner residual map has been obtained.
BD + RP and SS + RP show stronger background suppression in some scenes, as reflected by relatively high BSF values. However, their SCRG values are not consistently improved. In Seq. E and Seq. F, these variants produce nearly black response maps, indicating that the target response is also weakened or removed. This confirms that background suppression alone is insufficient for reliable detection.
Compared with all incomplete variants, the full proposed method achieves the best overall performance. It preserves compact target responses while maintaining strong background suppression. This advantage is especially clear in complex or low-contrast scenes. For example, in Seq. E and Seq. F, the full method obtains the highest SCRG values, whereas RP, BD + RP, and SS + RP suffer from target over-suppression. These results demonstrate that the three stages are complementary: BD suppresses slowly varying background interference, SS removes scale-inconsistent pseudo-responses, and RP further purifies residual clutter after the first two stages. Therefore, the proposed DSEP framework works as a coordinated progressive pipeline rather than a simple stacking of independent operations.
To further verify the rationality of the processing order, an additional order ablation experiment was conducted. Four representative orders were tested: BD → SS → RP, BD → RP → SS, SS → BD → RP, and RP → BD → SS. The results are summarized in Table 9. The proposed order, BD → SS → RP, achieves the best overall balance between SCRG and BSF. This is because BD first suppresses slowly varying background components and provides a cleaner residual map. SS is then applied before RP to remove isolated and undersized pseudo-responses, which may otherwise affect threshold estimation. Finally, RP further suppresses residual clutter and improves target–background separability. In contrast, when RP is performed too early, part of the target response may be over-suppressed. When SS or RP is placed before BD, the background components are not sufficiently removed at the early stage, which weakens the stability of later refinement. These results support the proposed coarse-to-fine processing order.
Table 9.
Order ablation results of the proposed DSEP framework on the self-collected dataset.
Table 9 shows that BD → SS → RP gives the best mean SCRG and BSF. This indicates that the proposed order provides a better balance between target preservation and clutter suppression. In contrast, applying RP too early may over-suppress the target response, while placing SS or RP before BD leaves slowly varying background interference insufficiently removed. Therefore, the proposed order better supports coarse-to-fine response refinement.
6. Discussion
The proposed DSEP framework achieves a practical balance between target enhancement, background suppression, and computational efficiency in low-altitude infrared scenes. Its performance benefits from the progressive design. Background decoupling first suppresses slowly varying components while preserving local structures near the target. Spatial screening then removes scale-inconsistent responses using a minimum target-size prior. Finally, residual-response purification suppresses non-Gaussian clutter through statistical thresholding and nonlinear remapping. Since the framework is fully feedforward, it avoids iterative optimization and maintains millisecond-level processing speed.
Several limitations remain. In extremely low-false-alarm regions, low-rank or tensor-based methods such as RIPT may provide stronger suppression when computational cost is less constrained. In very low-contrast scenes, the performance gap among different methods also becomes smaller. In addition, the center-based evaluation protocol mainly reflects response concentration rather than exact pixel-level segmentation accuracy. Although SIRST was used as a public benchmark, it mainly focuses on small targets and does not fully match the extended-target characteristics of the self-collected dataset.
Deep learning-based detectors were not included as direct baselines because this study focuses on training-free, interpretable, and low-latency single-frame detection under limited annotated data. Most deep models require supervised training or fine-tuning, while the self-collected dataset is not large enough for fair network training. Directly using public pre-trained models may also introduce domain mismatch, since many are trained on small-target or different-scene datasets. Therefore, this study compares DSEP mainly with representative training-free methods under consistent settings.
Overall, DSEP offers a feasible solution for low-latency infrared target detection in complex low-altitude scenes. In future research, we will further improve its scale adaptability, make better use of temporal information, refine the implementation for higher efficiency, and test the method on larger and more diverse datasets.
7. Conclusions
This study proposes a three-stage progressive framework, called Decoupled Separation, Enhancement, and Purification (DSEP), for single-frame infrared moving target detection in low-altitude remote sensing scenes. By integrating edge-preserving background decoupling, scale-consistent spatial screening, and residual-response purification, DSEP tackles slowly varying background interference, scale-inconsistent pseudo-responses, and residual non-Gaussian clutter in a non-iterative, feedforward manner.
Experiments on six self-collected infrared sequences and six selected SIRST scenes show that DSEP produces compact and spatially continuous target responses under challenging backgrounds. The results show that DSEP achieves competitive SCRG, BSF, ROC, and localization performance while maintaining low processing time, reflecting a good balance between detection accuracy and computational efficiency. Further analyses of localization errors, parameter sensitivity, and ablation studies confirm the framework’s overall stability and robustness.
Although DSEP maintains relatively stable performance in the evaluated low-altitude infrared scenes, its advantage is less pronounced in extremely low-contrast cases and in some public small-target scenarios. In future research, we will improve its adaptability to different target scales, make use of temporal information, further optimize the implementation efficiency, and validate the method on larger and more diverse datasets.
Author Contributions
Conceptualization, D.L. and Z.B.; methodology, Z.B.; software, Z.T. and T.C.; validation, Z.T., Z.B. and Y.Z.; formal analysis, Z.B.; investigation, Z.B.; resources, D.L.; data curation, D.L.; writing—original draft preparation, Z.B.; writing—review and editing, D.L. and J.G.; visualization, T.C.; supervision, D.L. and J.G. All authors have read and agreed to the published version of the manuscript.
Funding
This research received no external funding.
Data Availability Statement
The public SIRST dataset used in this study is available from its original source. The self-collected infrared sequences have not been publicly released due to experimental and data-sharing restrictions, but they can be provided by the corresponding author upon reasonable request. To improve reproducibility, the main algorithmic steps, mathematical formulations, parameter settings, evaluation protocol, and implementation details are provided in the manuscript. The core implementation of the proposed DSEP framework, including the main detection procedure and parameter configuration, is being organized into a clean and shareable version and can be provided by the corresponding author upon reasonable request.
Acknowledgments
The suggestions from the relevant editors and reviewers have improved the quality of this paper, and we would like to express our gratitude to them.
Conflicts of Interest
The authors declare no conflicts of interest.
References
- Zhao, M.; Li, W.; Li, L.; Hu, J.; Ma, P.; Tao, R. Single-frame infrared small-target detection: A survey. IEEE Geosci. Remote Sens. Mag. 2022, 10, 87–119. [Google Scholar] [CrossRef] [Scilit]
- Han, J.; Wei, Y.; Peng, Z.; Zhao, Q.; Chen, Y.; Qin, Y.; Li, N. Infrared dim and small target detection: A review. Infrared Laser Eng. 2022, 51, 20210393. [Google Scholar] [CrossRef] [Scilit]
- Liu, C.; Song, X.; Yu, D.; Gu, Y. Infrared small target detection based on prior guided dense nested network. IEEE Trans. Geosci. Remote Sens. 2025, 63, 5002015. [Google Scholar] [CrossRef] [Scilit]
- Li, C.; Zhu, W. Infrared small target detection based on adaptive size estimation by multidirectional gradient filter. IEEE Trans. Geosci. Remote Sens. 2024, 62, 10757439. [Google Scholar] [CrossRef] [Scilit]
- Deng, H.; Sun, X.; Liu, M.; Ye, C.; Zhou, X. Small infrared target detection based on weighted local difference measure. IEEE Trans. Geosci. Remote Sens. 2016, 54, 4204–4214. [Google Scholar] [CrossRef] [Scilit]
- Liu, F.; Gao, C.; Chen, F.; Meng, D.; Zuo, W.; Gao, X. Infrared small-dim target detection with transformer under complex backgrounds. IEEE Trans. Image Process. 2023, 32, 5921–5932. [Google Scholar] [CrossRef] [Scilit]
- Dai, Y.; Li, X.; Zhou, F.; Qian, Y.; Chen, Y.; Yang, J. One-stage cascade refinement networks for infrared small target detection. IEEE Trans. Geosci. Remote Sens. 2023, 61, 5000917. [Google Scholar] [CrossRef] [Scilit]
- Liu, Q.; Liu, R.; Zheng, B.; Wang, H.; Fu, Y. Infrared small target detection with scale and location sensitivity. In Proceedings of the 2024 IEEE/CVF Conference on Computer Vision and Pattern Recognition (CVPR); IEEE: New York, NY, USA, 2024; pp. 29644–29653. [Google Scholar] [CrossRef] [Scilit]
- Huang, S.; Peng, Z.; Wang, Z.; Wang, X.; Li, M. Infrared small target detection by density peaks searching and maximum-gray region growing. IEEE Geosci. Remote Sens. Lett. 2019, 16, 1919–1923. [Google Scholar] [CrossRef] [Scilit]
- Bai, X.; Zhou, F. Analysis of new top-hat transformation and the application for infrared dim small target detection. Pattern Recognit. 2010, 43, 2145–2156. [Google Scholar] [CrossRef] [Scilit]
- Peng, L.; Lu, Z.; Lei, T.; Jiang, P. Dual-structure elements morphological filtering and local z-score normalization for infrared small target detection against heavy clouds. Remote Sens. 2024, 16, 2343. [Google Scholar] [CrossRef] [Scilit]
- Zhang, M.; Yue, K.; Li, B.; Guo, J.; Li, Y.; Gao, X. Single-frame infrared small target detection via Gaussian curvature inspired network. IEEE Trans. Geosci. Remote Sens. 2024, 62, 5001414. [Google Scholar] [CrossRef] [Scilit]
- Chen, C.; Li, H.; Wei, Y.; Xia, T.; Tang, Y. A local contrast method for small infrared target detection. IEEE Trans. Geosci. Remote Sens. 2013, 52, 574–581. [Google Scholar] [CrossRef] [Scilit]
- Han, J.; Ma, Y.; Zhou, B.; Fan, F.; Liang, K.; Fang, Y. A robust infrared small target detection algorithm based on human visual system. IEEE Geosci. Remote Sens. Lett. 2014, 11, 2168–2172. [Google Scholar] [CrossRef] [Scilit]
- Guan, X.; Peng, Z.; Huang, S.; Chen, Y. Gaussian scale-space enhanced local contrast measure for small infrared target detection. IEEE Geosci. Remote Sens. Lett. 2020, 17, 327–331. [Google Scholar] [CrossRef] [Scilit]
- Liu, Y.; Liu, X.; Hao, X.; Zhai, S. Single-frame infrared small target detection by high local variance, low-rank and sparse decomposition. IEEE Trans. Geosci. Remote Sens. 2023, 61, 5614317. [Google Scholar] [CrossRef] [Scilit]
- Gao, C.; Meng, D.; Yang, Y.; Wang, Y.; Zhou, X.; Hauptmann, A.G. Infrared patch-image model for small target detection in a single image. IEEE Trans. Image Process. 2013, 22, 4996–5009. [Google Scholar] [CrossRef] [Scilit] [PubMed]
- Candès, E.J.; Li, X.; Ma, Y.; Wright, J. Robust principal component analysis? J. ACM 2011, 58, 11. [Google Scholar] [CrossRef] [Scilit]
- Dai, Y.; Wu, Y. Reweighted infrared patch-tensor model with both nonlocal and local priors for single-frame small target detection. IEEE J. Sel. Top. Appl. Earth Obs. Remote Sens. 2017, 10, 3752–3767. [Google Scholar] [CrossRef] [Scilit]
- Guan, X.; Zhang, L.; Huang, S.; Peng, Z. Infrared small target detection via non-convex tensor rank surrogate joint local contrast energy. Remote Sens. 2020, 12, 1520. [Google Scholar] [CrossRef] [Scilit]
- Xu, D.; Gou, S.; Liu, Z. A novel local contrast method based on third-order central moments for infrared small target detection. Front. Phys. 2024, 12, 1477253. [Google Scholar] [CrossRef] [Scilit]
- Lou, C.; Zhang, Y.; Yin, J. Small target detection method based on Robinson-Guard filter and pixel convergence. Acta Opt. Sin. 2020, 40, 1504001. [Google Scholar] [CrossRef] [Scilit]
- Zhu, H.; Zhang, Z. Balanced ring top-hat transformation for infrared small-target detection with guided filter kernel. IEEE Geosci. Remote Sens. Lett. 2021, 18, 157–161. [Google Scholar] [CrossRef] [Scilit]
- Zhao, M.; Li, L.; Li, W.; Tao, R.; Li, L.; Zhang, W. Infrared small-target detection based on multiple morphological profiles. IEEE Trans. Geosci. Remote Sens. 2021, 59, 6077–6091. [Google Scholar] [CrossRef] [Scilit]
- Tomasi, C.; Manduchi, R. Bilateral filtering for gray and color images. In Proceedings of the Sixth International Conference on Computer Vision; IEEE: New York, NY, USA, 1998; pp. 839–846. [Google Scholar] [CrossRef] [Scilit]
- Perona, P.; Malik, J. Scale-space and edge detection using anisotropic diffusion. IEEE Trans. Pattern Anal. Mach. Intell. 1990, 12, 629–639. [Google Scholar] [CrossRef] [Scilit]
- He, K.; Sun, J.; Tang, X. Guided image filtering. IEEE Trans. Pattern Anal. Mach. Intell. 2013, 35, 1397–1409. [Google Scholar] [CrossRef] [Scilit]
- Wei, Y.; You, X.; Li, H. Multiscale patch-based contrast measure for small infrared target detection. Pattern Recognit. 2016, 58, 216–226. [Google Scholar] [CrossRef] [Scilit]
- Han, J.; Ma, Y.; Huang, J.; Mei, X.; Ma, J. Infrared small target detection utilizing the multiscale relative local contrast measure. IEEE Geosci. Remote Sens. Lett. 2018, 15, 612–616. [Google Scholar] [CrossRef] [Scilit]
- Han, J.; Moradi, S.; Faramarzi, I.; Liu, C.; Zhang, H.; Zhao, Q. A local contrast method for infrared small-target detection utilizing a tri-layer window. IEEE Geosci. Remote Sens. Lett. 2020, 17, 1822–1826. [Google Scholar] [CrossRef] [Scilit]
- Zhang, Y.; Zheng, Y.; Li, X. Multi-scale strengthened directional difference algorithm based on the human vision system. Sensors 2022, 22, 10009. [Google Scholar] [CrossRef] [Scilit]
- Moradi, S.; Moallem, P.; Sabahi, M.F. Fast and robust small infrared target detection using absolute directional mean difference algorithm. Signal Process. 2020, 177, 107727. [Google Scholar] [CrossRef] [Scilit]
- Xu, Y.; Liu, P.; Qian, W.; Zhang, J.; Kong, X.; Wan, M. Small and dim target detection under strong clutter based on similarly of Gaussian and motion outlier significance using moving infrared camera. IEEE Sens. J. 2025, 25, 13357–13373. [Google Scholar] [CrossRef] [Scilit]
- Zhang, L.; Peng, L.; Zhang, T.; Cao, S.; Peng, Z. Infrared Small Target Detection via Non-Convex Rank Approximation Minimization Joint l2,1 Norm. Remote Sens. 2018, 10, 1821. [Google Scholar] [CrossRef] [Scilit]
- Wang, X.; Peng, Z.; Kong, D.; Zhang, P.; He, Y. Infrared dim target detection based on total variation regularization and principal component pursuit. Image Vis. Comput. 2017, 63, 1–9. [Google Scholar] [CrossRef] [Scilit]
- Wang, G.; Tao, B.; Kong, X.; Peng, Z. Infrared small target detection using non-overlapping patch spatial-temporal tensor factorization with capped nuclear norm regularization. IEEE Trans. Geosci. Remote Sens. 2022, 60, 5001417. [Google Scholar] [CrossRef] [Scilit]
- Wu, F.; Yu, H.; Liu, A.; Zhang, P.; Peng, Z. Infrared small target detection using spatiotemporal 4-D tensor train and ring unfolding. IEEE Trans. Geosci. Remote Sens. 2023, 61, 5002922. [Google Scholar] [CrossRef] [Scilit]
- Zhu, H.; Liu, S.; Deng, L.; Li, Y.; Xiao, F. Infrared small target detection via low-rank tensor completion with top-hat regularization. IEEE Trans. Geosci. Remote Sens. 2020, 58, 1004–1016. [Google Scholar] [CrossRef] [Scilit]
- Dai, Y.; Wu, Y.; Song, Y.; Guo, J. Non-negative infrared patch-image model: Robust target-background separation via partial sum minimization of singular values. Infrared Phys. Technol. 2017, 81, 182–194. [Google Scholar] [CrossRef] [Scilit]
- Liu, L.; Zhang, R.; Mei, J.; Ni, X.; Li, L.; Su, X.; Chen, F. ILN-SSR: Improved logarithmic norm and sparse structure refinement for infrared small target detection. Remote Sens. 2024, 16, 4018. [Google Scholar] [CrossRef] [Scilit]
- Han, J.; Moradi, S.; Zhou, B.; Wang, W.; Zhao, Q.; Luo, Z. A true global contrast method for IR small target detection under complex background. IEEE Trans. Geosci. Remote Sens. 2025, 63, 5004424. [Google Scholar] [CrossRef] [Scilit]
- Huang, Z.; Zhao, E.; Zheng, W.; Wen, Y.; Peng, X.; Niu, W. PTCTV-KMC: Infrared small target detection using joint partial tensor correlated total variation and K-means clustering. IEEE J. Sel. Top. Appl. Earth Obs. Remote Sens. 2025, 18, 1252–1271. [Google Scholar] [CrossRef] [Scilit]
- Hou, Q.; Zhang, L.; Tan, F.; Xi, Y.; Zheng, H.; Li, N. ISTDU-Net: Infrared Small-Target Detection U-Net. IEEE Geosci. Remote Sens. Lett. 2022, 19, 7506205. [Google Scholar] [CrossRef] [Scilit]
- Li, B.; Xiao, C.; Wang, L.; Wang, Y.; Lin, Z.; Li, M.; An, W.; Guo, Y. Dense Nested Attention Network for Infrared Small Target Detection. IEEE Trans. Image Process. 2023, 32, 1745–1758. [Google Scholar] [CrossRef] [Scilit]
- Yuan, S.; Qin, H.; Yan, X.; Akhtar, N.; Mian, A. SCTransNet: Spatial-Channel Cross Transformer Network for Infrared Small Target Detection. IEEE Trans. Geosci. Remote Sens. 2024, 62, 5002615. [Google Scholar] [CrossRef] [Scilit]
- Hao, Z.; Wang, Z.; Xu, X.; Jiang, Z.; Sun, Z. YOLO-ISTD: An Infrared Small Target Detection Method Based on YOLOv5-S. PLoS ONE 2024, 19, e0303451. [Google Scholar] [CrossRef] [Scilit]
- Cao, L.; Wang, Q.; Luo, Y.; Hou, Y.; Cao, J.; Zheng, W. YOLO-TSL: A Lightweight Target Detection Algorithm for UAV Infrared Images Based on Triplet Attention and Slim-Neck. Infrared Phys. Technol. 2024, 143, 105487. [Google Scholar] [CrossRef] [Scilit]
- Dai, Y.; Wu, Y.; Zhou, F.; Barnard, K. Attentional local contrast networks for infrared small target detection. IEEE Trans. Geosci. Remote Sens. 2021, 59, 9813–9824. [Google Scholar] [CrossRef] [Scilit]
- Shi, Y.; Wei, Y.; Yao, H.; Pan, D.; Xiao, G. High-boost-based multiscale local contrast measure for infrared small target detection. IEEE Geosci. Remote Sens. Lett. 2018, 15, 33–37. [Google Scholar] [CrossRef] [Scilit]
- Qin, Y.; Bruzzone, L.; Gao, C.; Li, B. Infrared small target detection based on facet kernel and random walker. IEEE Trans. Geosci. Remote Sens. 2019, 57, 7104–7118. [Google Scholar] [CrossRef] [Scilit]
- Soille, P. Morphological Image Analysis: Principles and Applications; Springer: Berlin/Heidelberg, Germany, 2004. [Google Scholar] [CrossRef] [Scilit]
- Sangston, K.J.; Gini, F.; Greco, M.S. Coherent radar target detection in heavy-tailed compound-Gaussian clutter. IEEE Trans. Aerosp. Electron. Syst. 2012, 48, 64–77. [Google Scholar] [CrossRef] [Scilit]
- Cao, X.; Rong, C.; Bai, X. Infrared small target detection via center-surround gray difference measure with local image block analysis. IEEE Trans. Aerosp. Electron. Syst. 2022, 58, 1152–1166. [Google Scholar] [CrossRef] [Scilit]
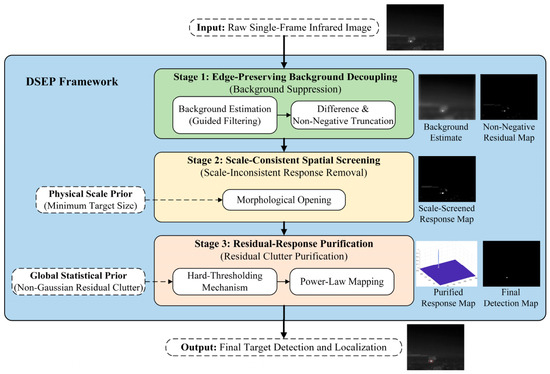
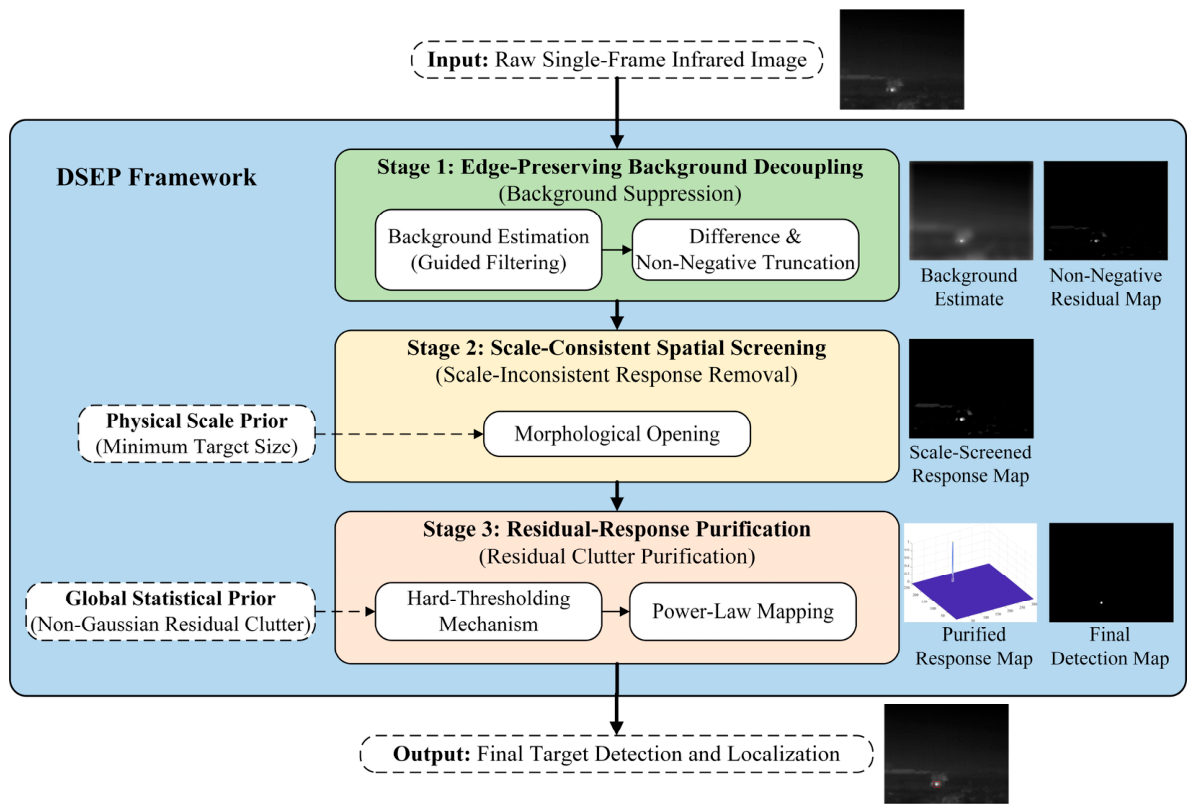
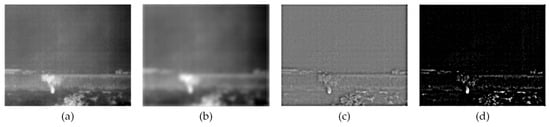
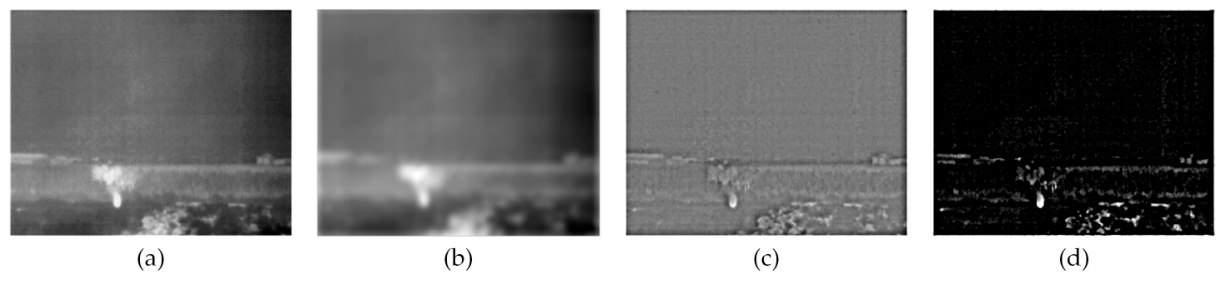
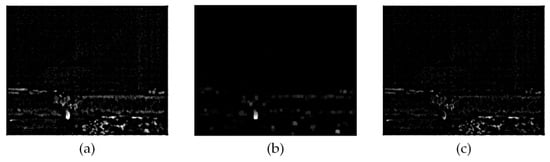
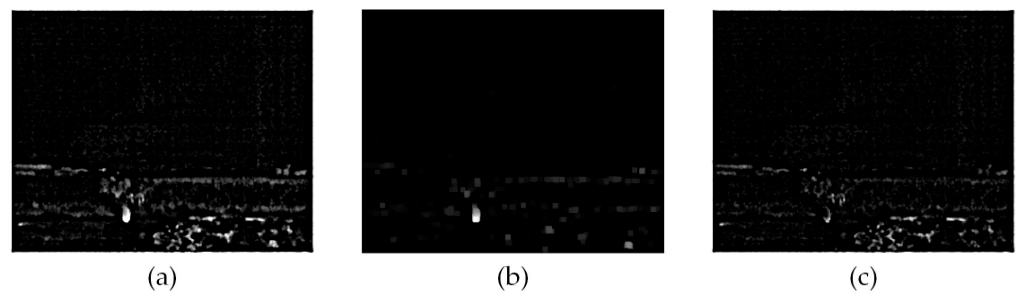
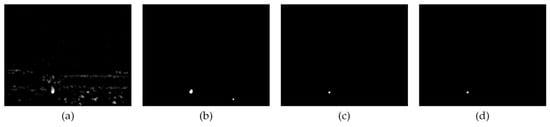
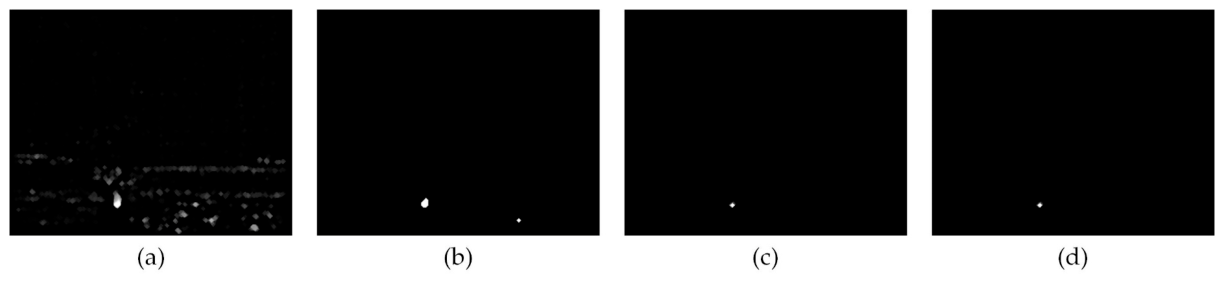
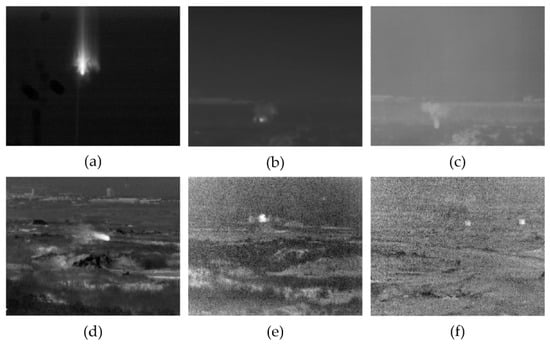
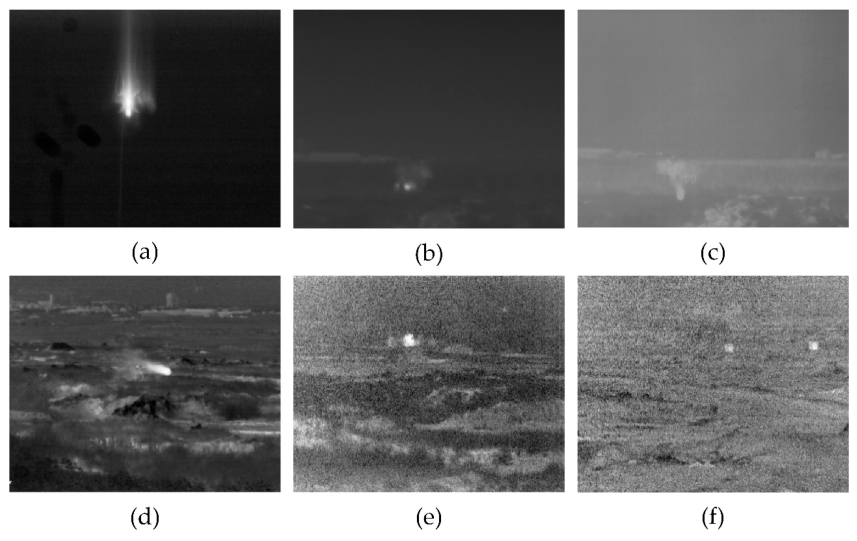
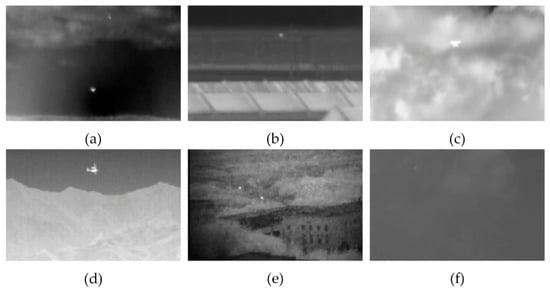
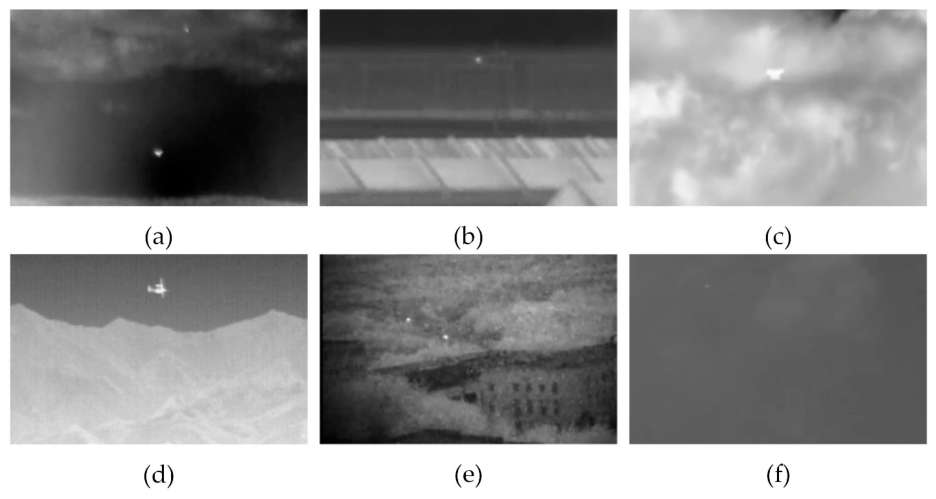
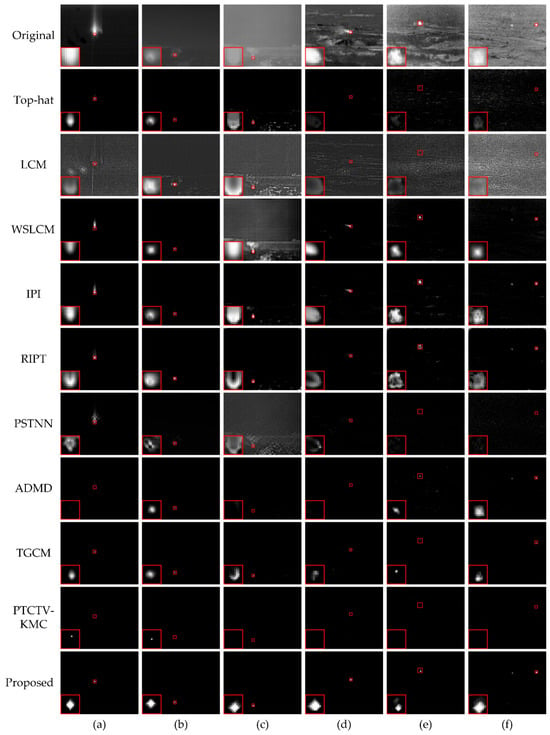
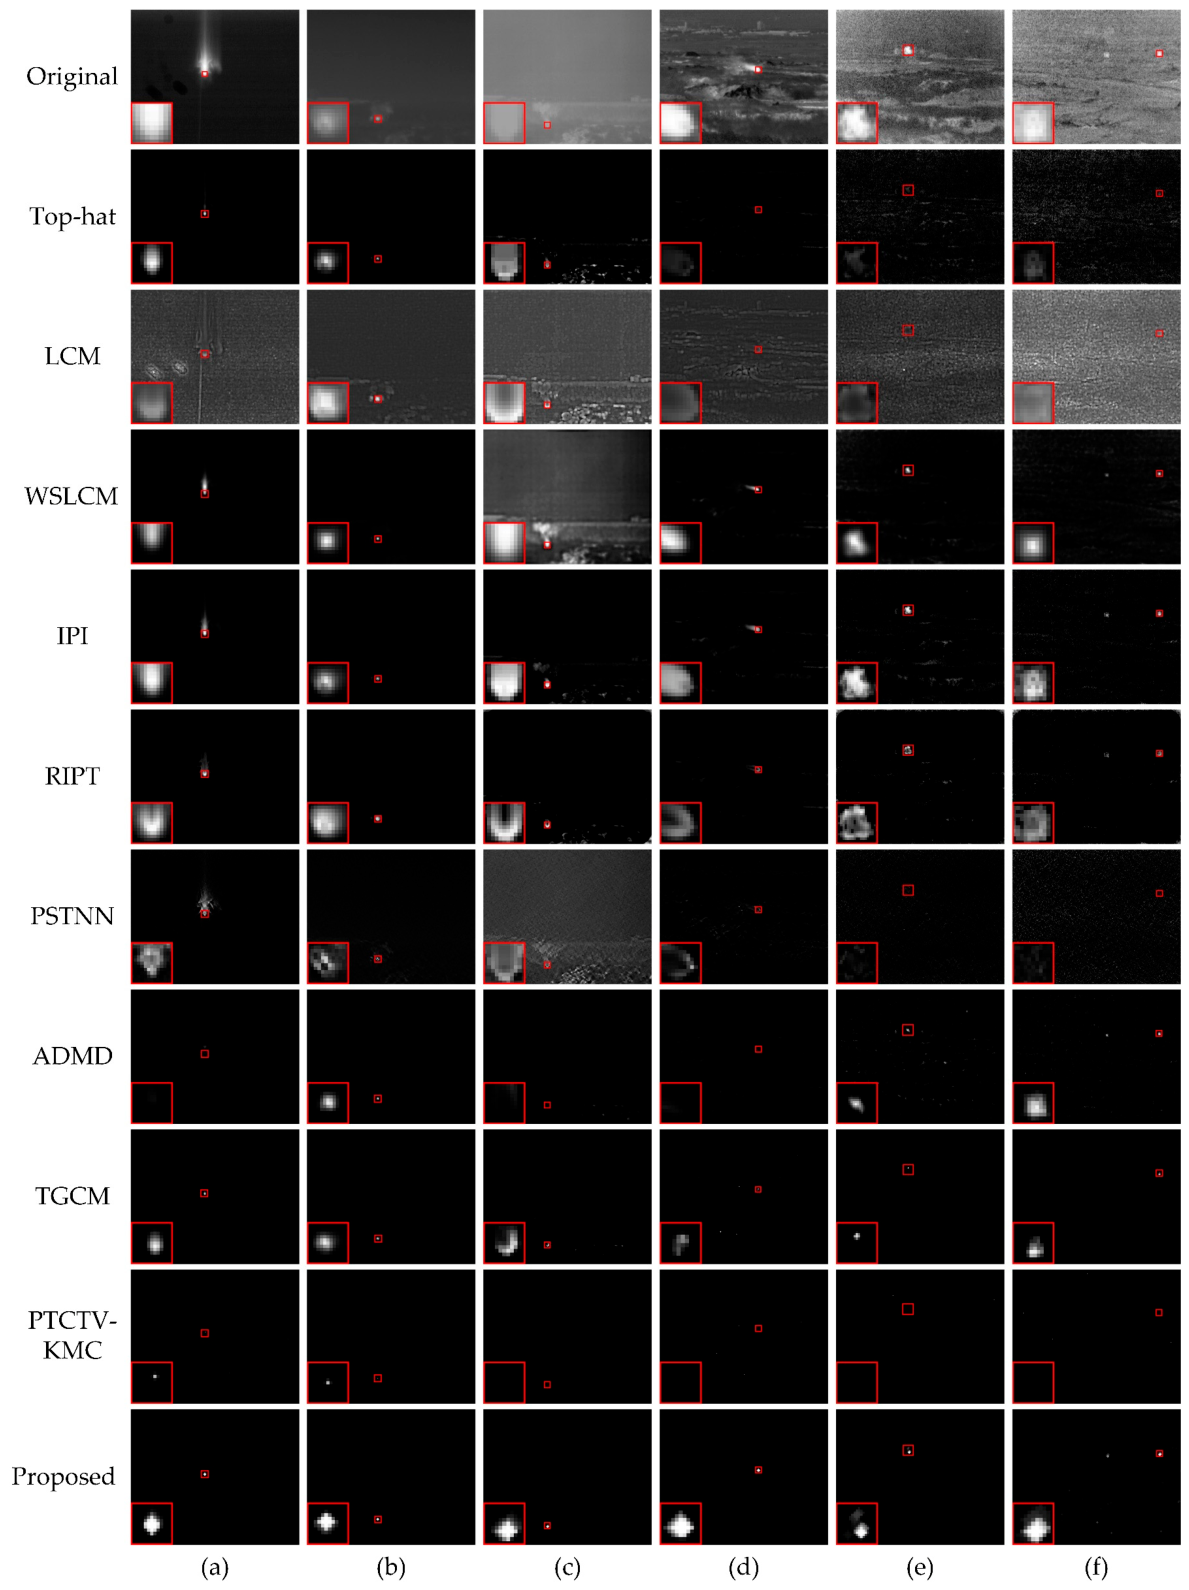
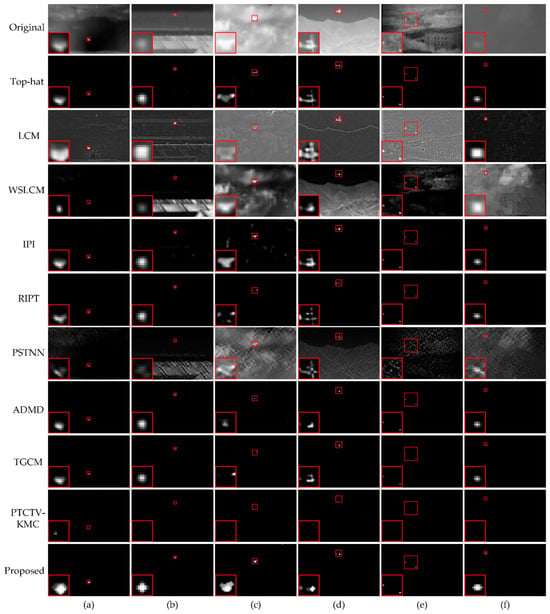
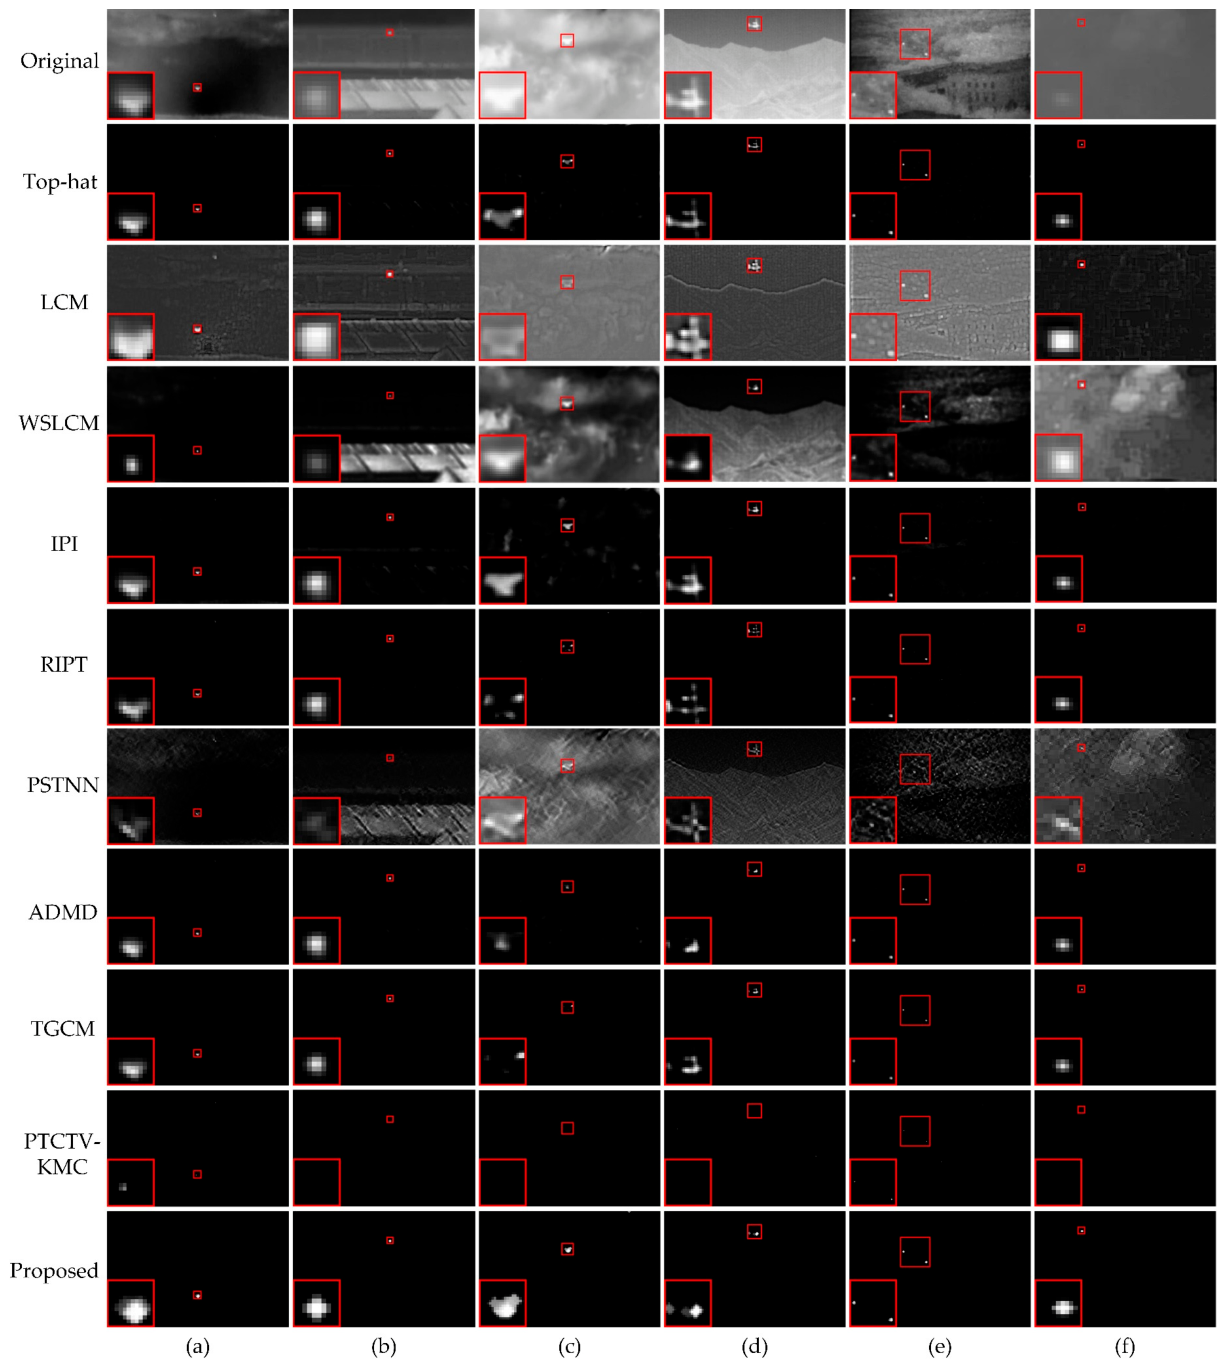
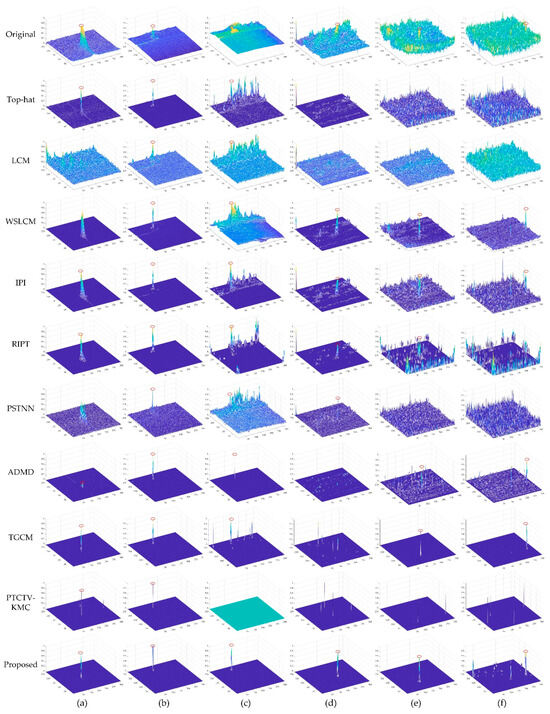
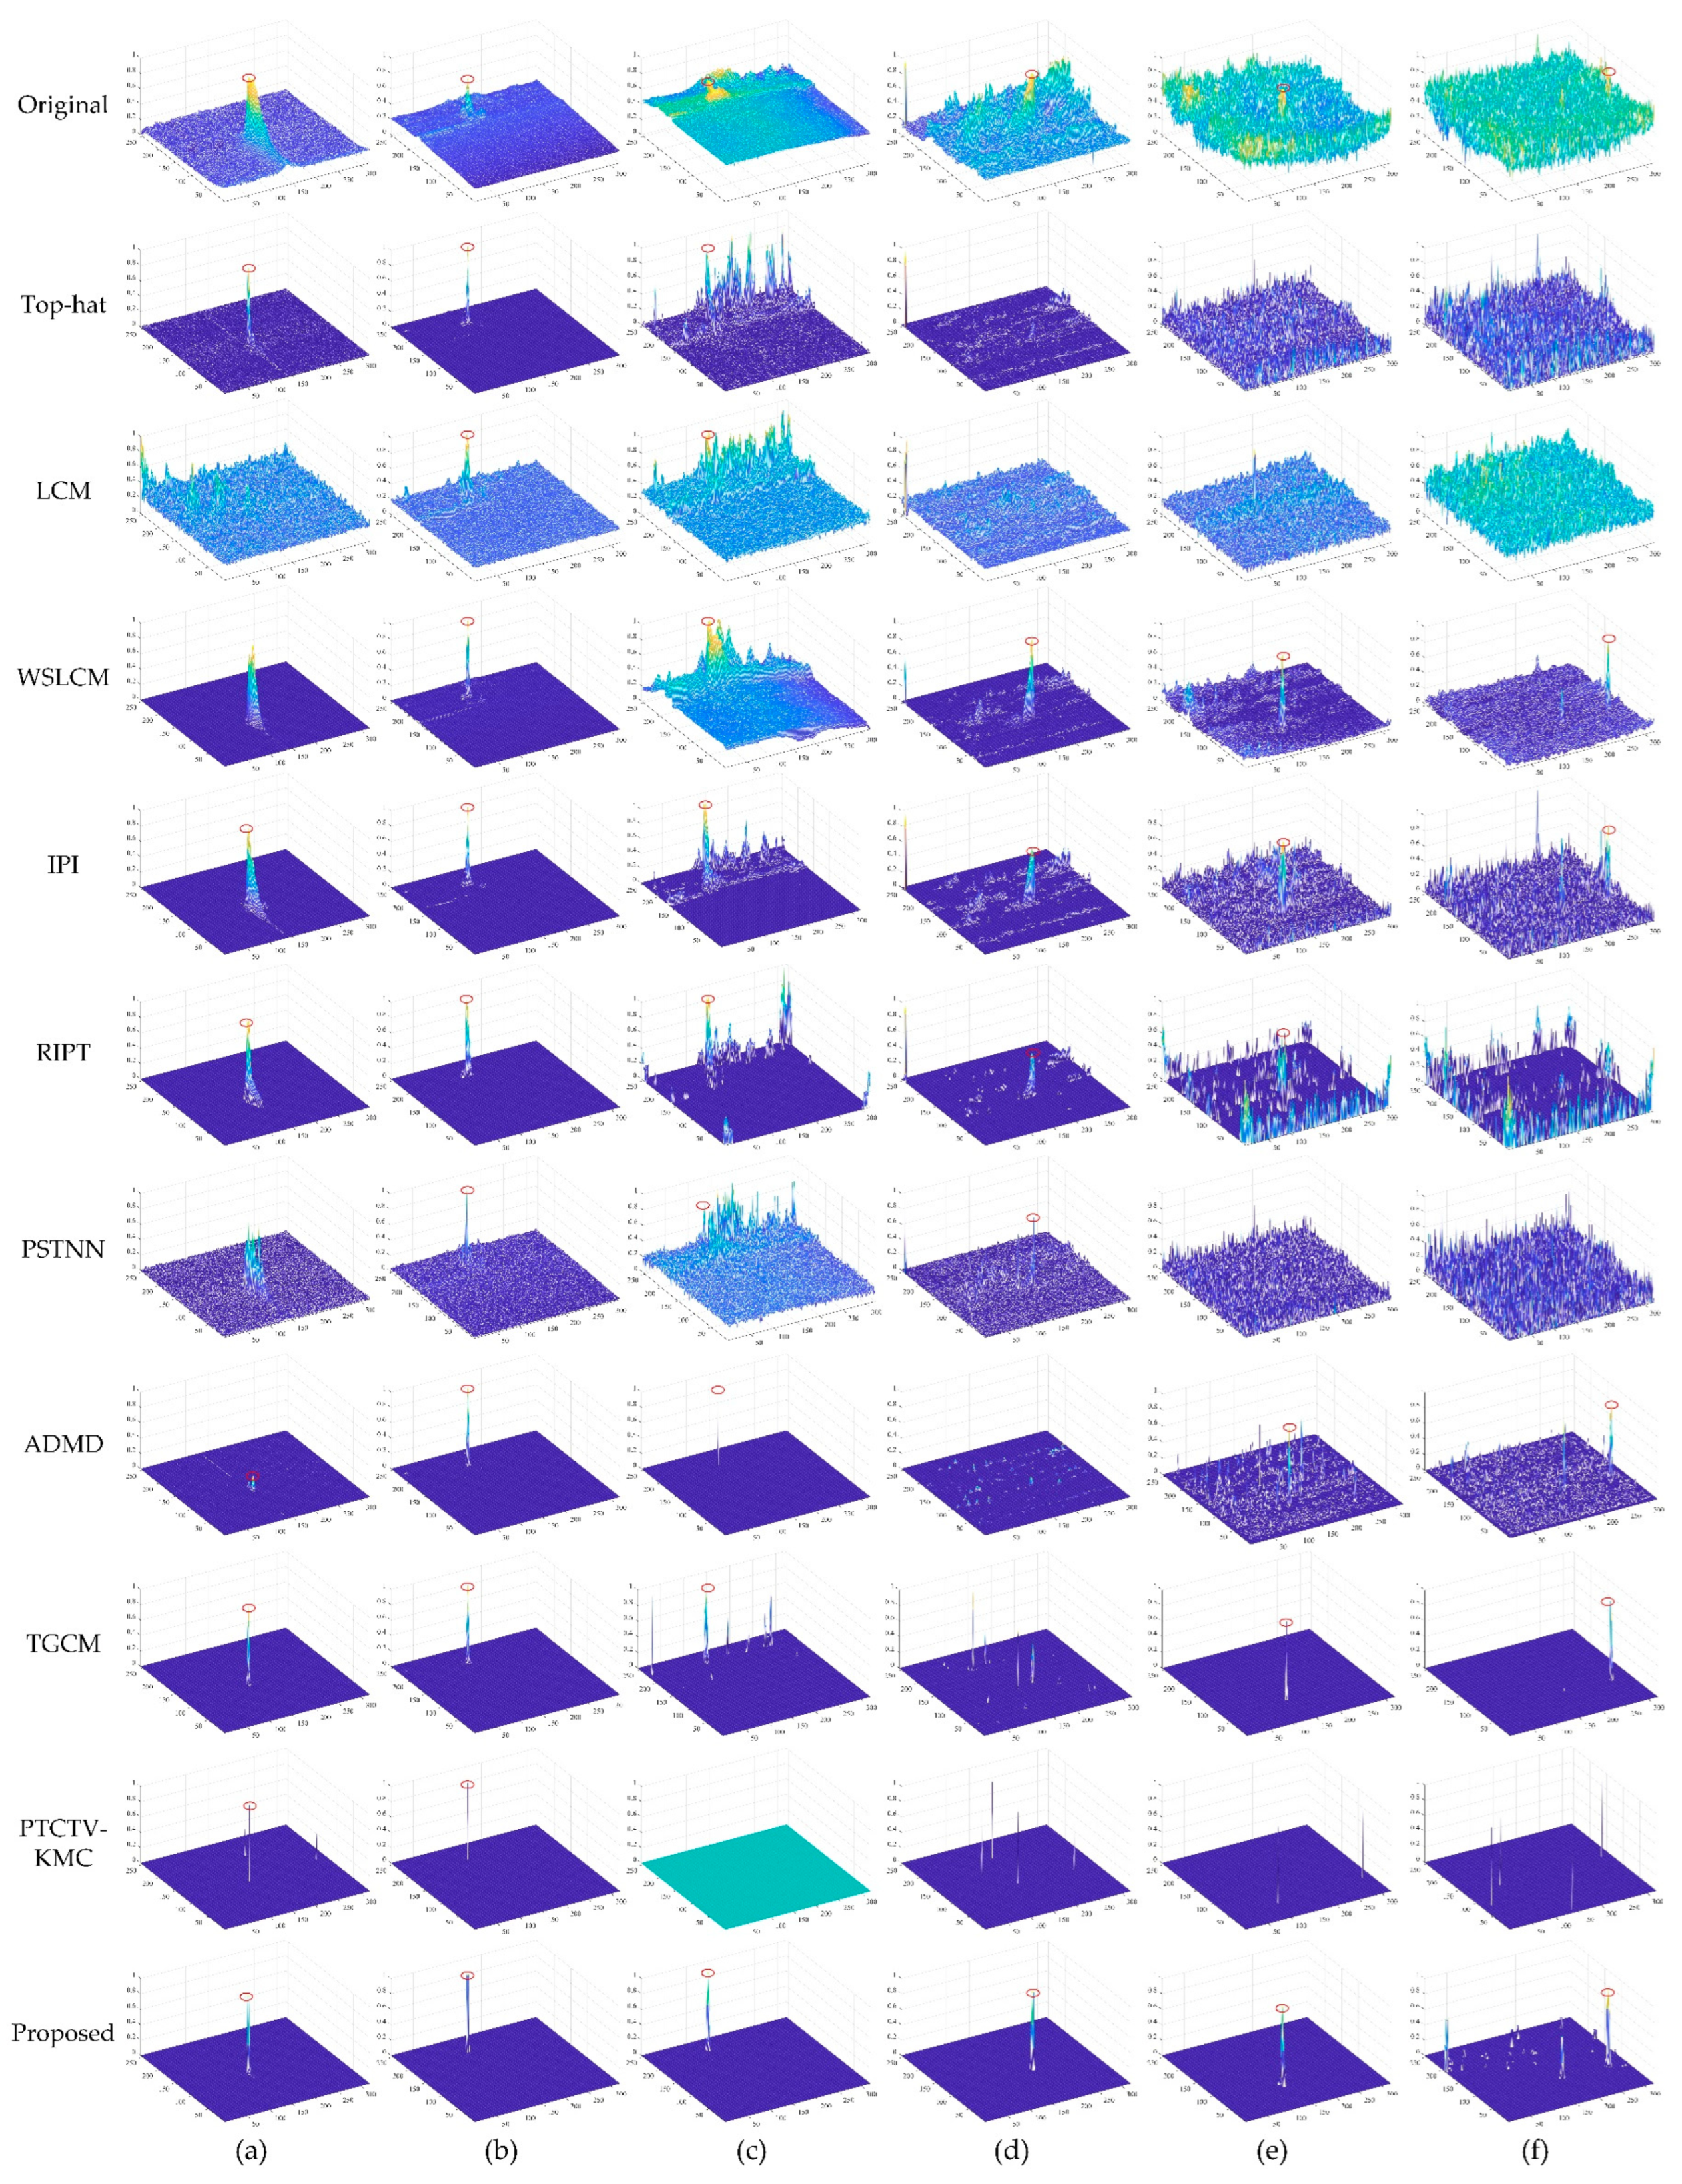
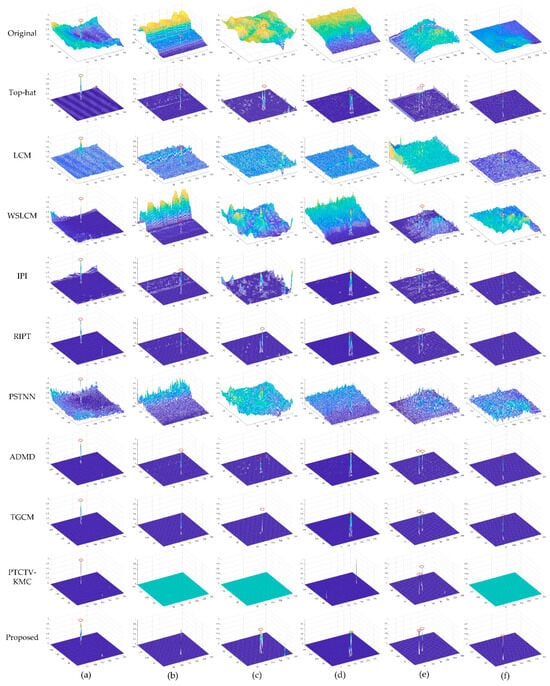
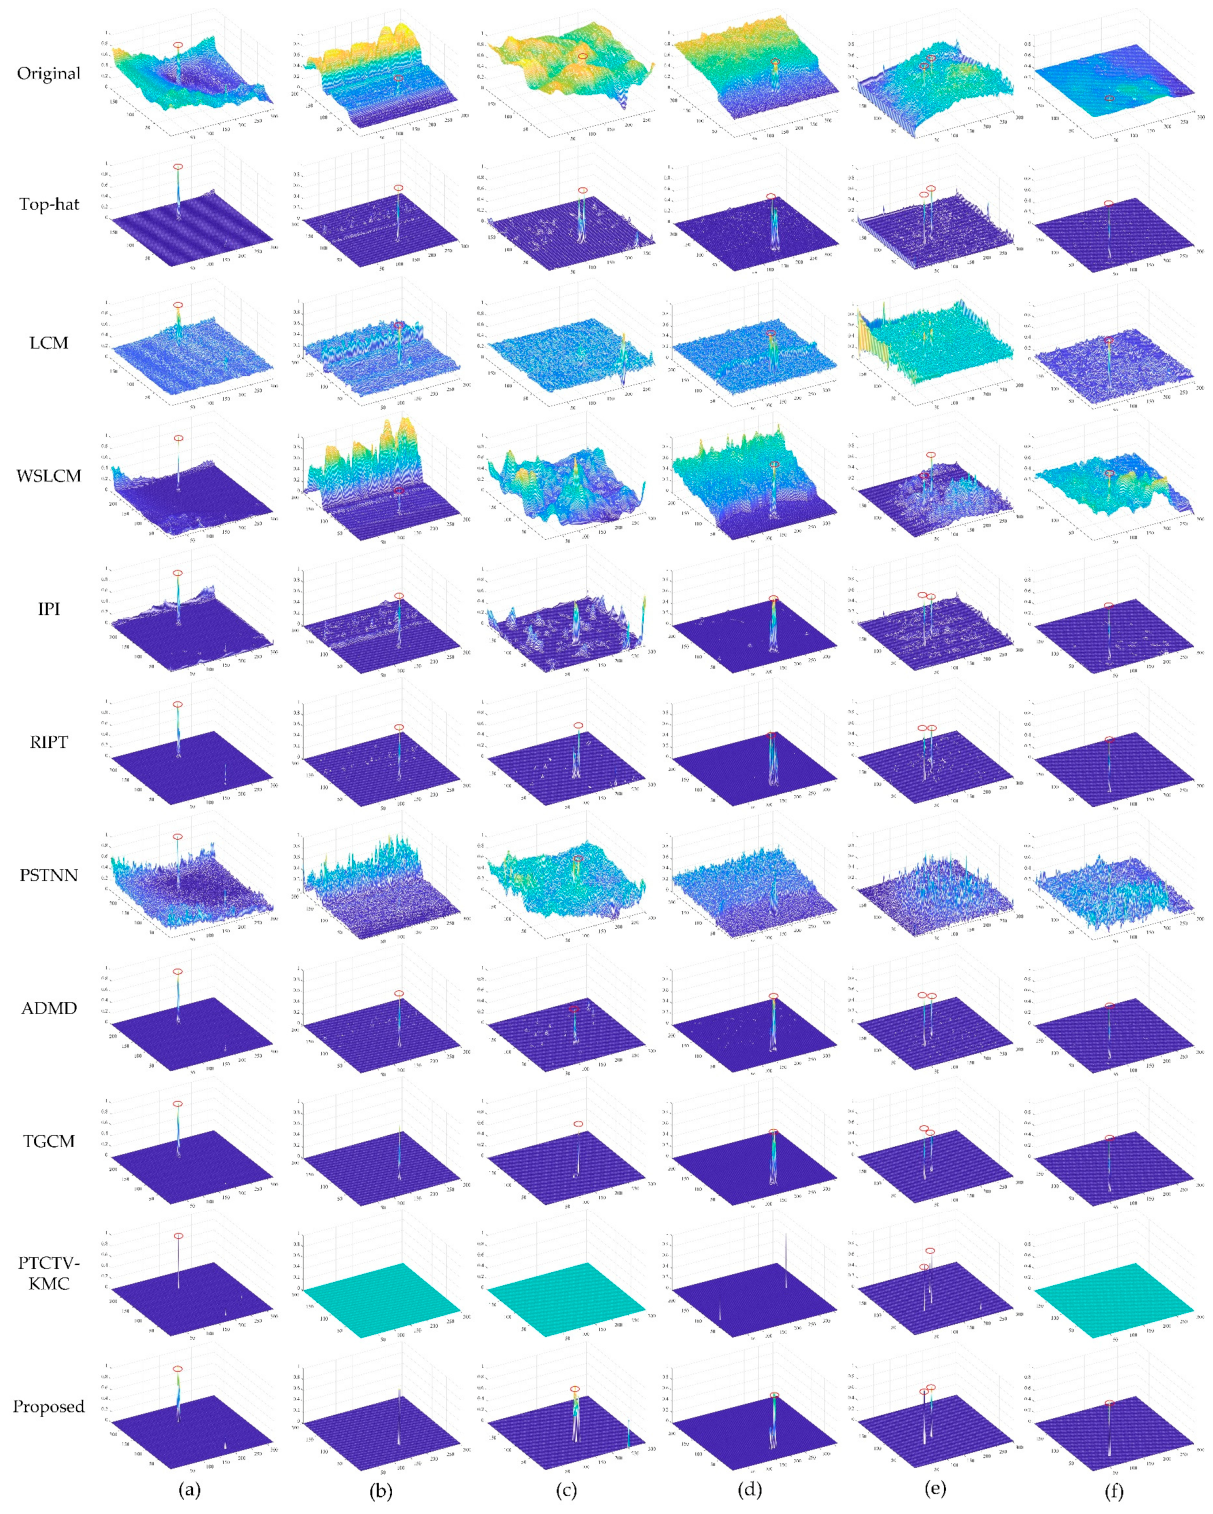
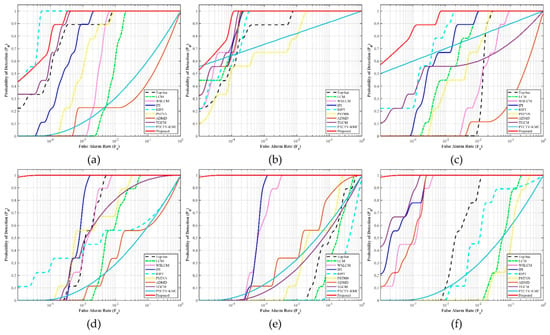
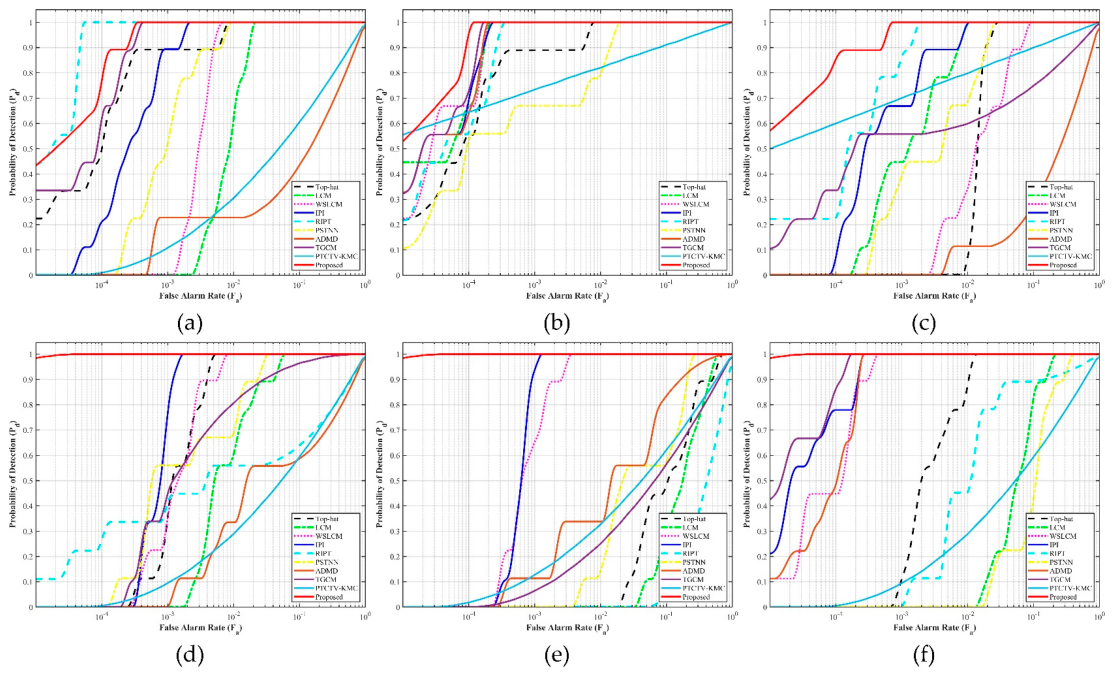
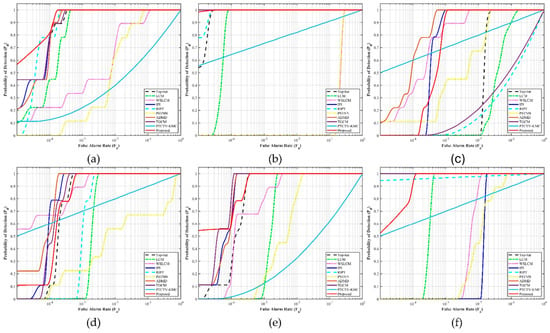
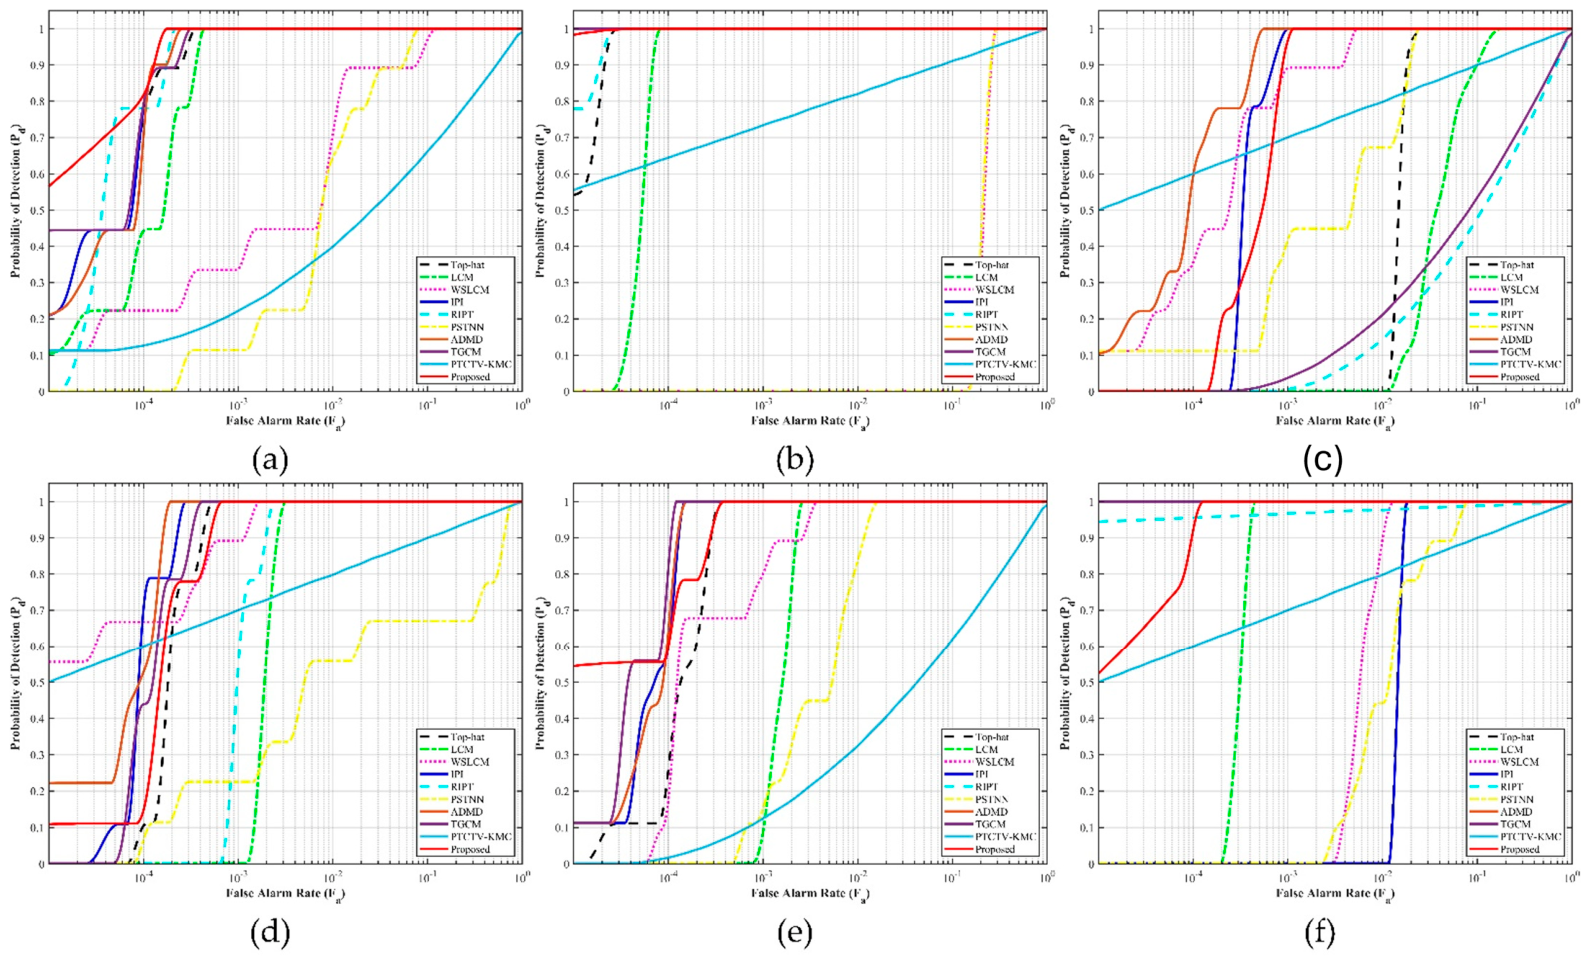
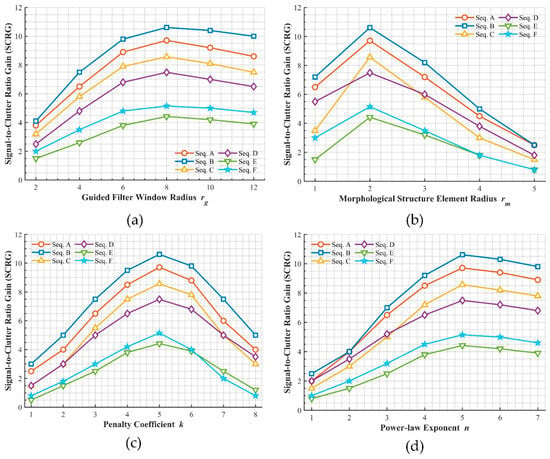
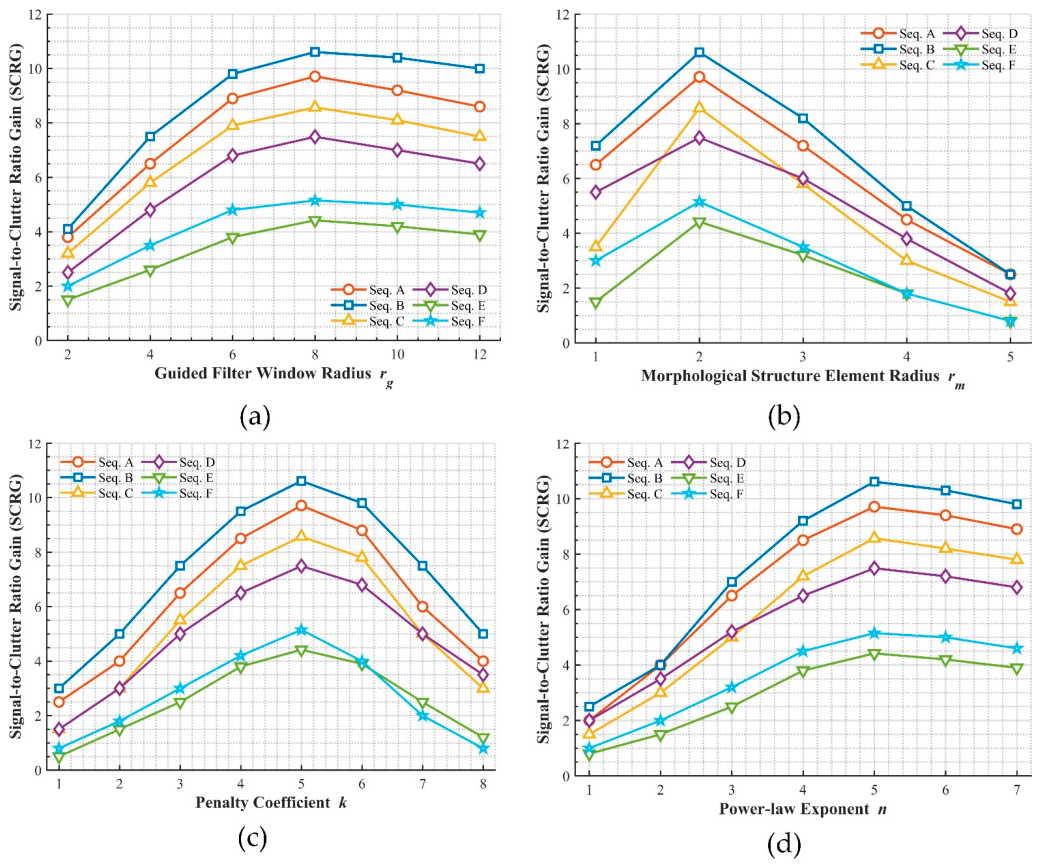
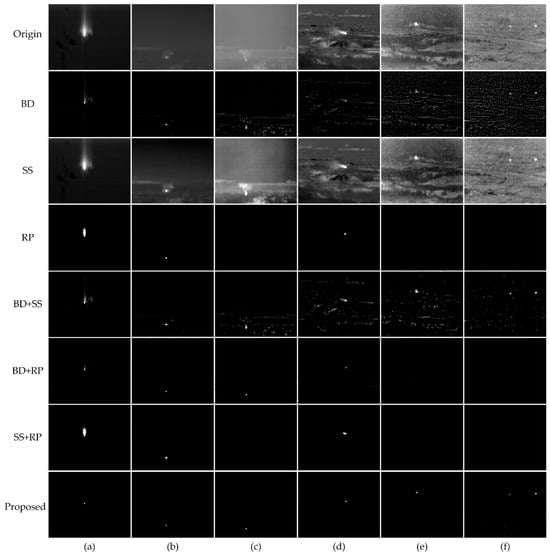
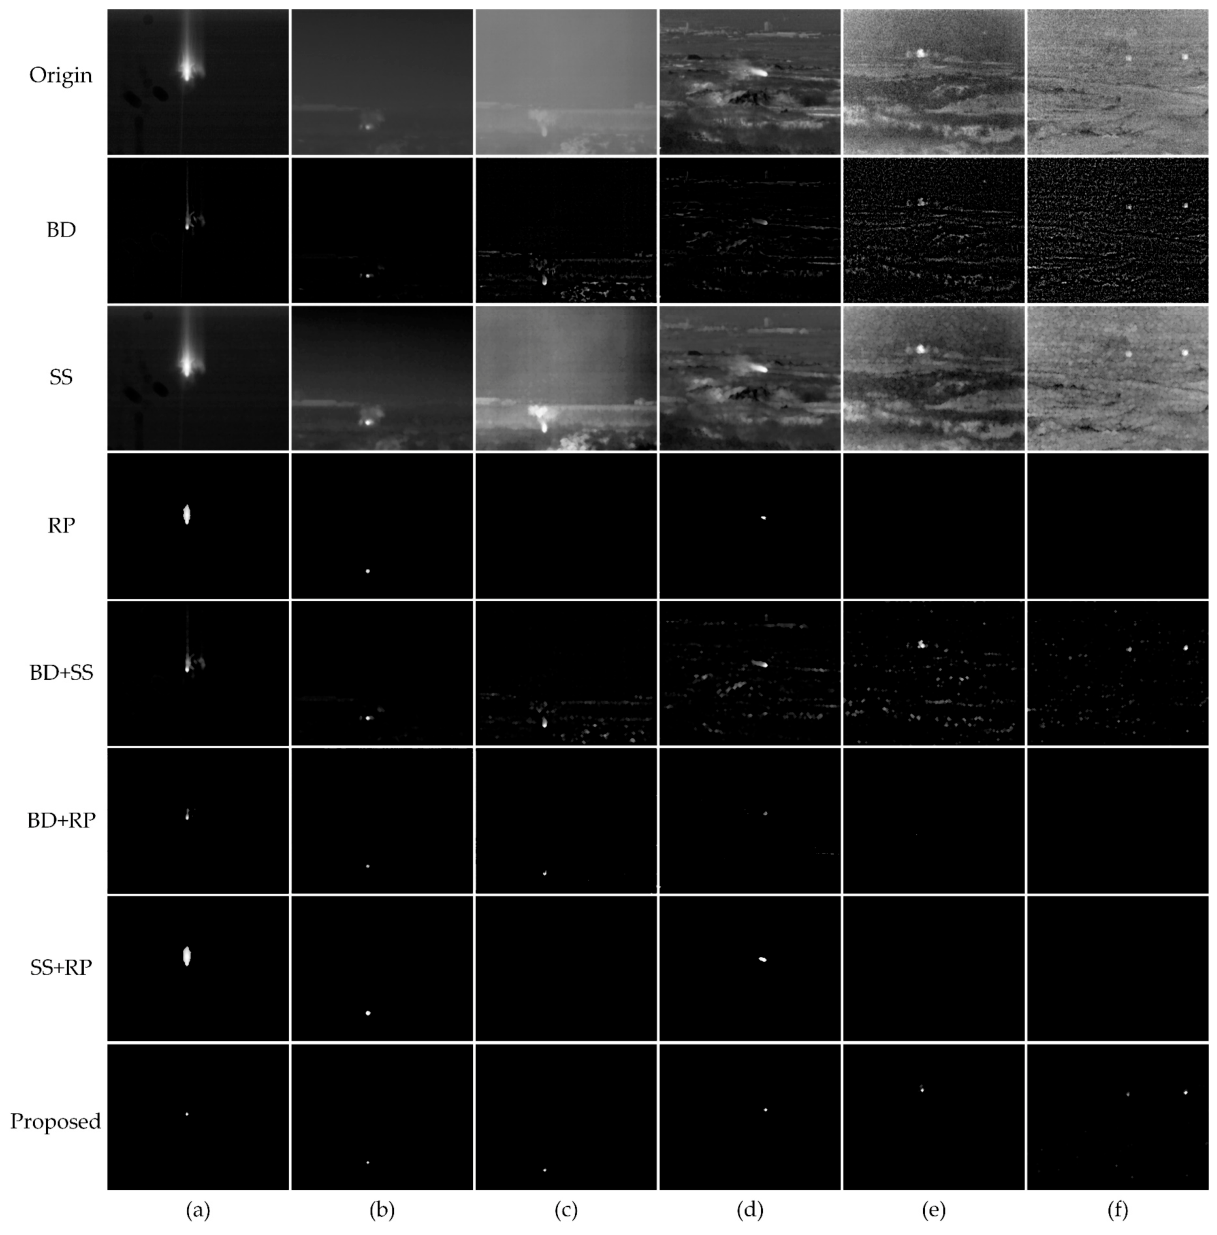

Disclaimer/Publisher’s Note: The statements, opinions and data contained in all publications are solely those of the individual author(s) and contributor(s) and not of MDPI and/or the editor(s). MDPI and/or the editor(s) disclaim responsibility for any injury to people or property resulting from any ideas, methods, instructions or products referred to in the content. |
© 2026 by the authors. Licensee MDPI, Basel, Switzerland. This article is an open access article distributed under the terms and conditions of the Creative Commons Attribution (CC BY) license.