


Highlights
- This study evaluates the impact of assimilating GOES-derived Atmospheric Motion Vectors (AMVs) on the predictability of Tropical Cyclone Akará using the Numerical Modeling and Assimilation System (SMNA) at CPTEC/INPE, the only South American center producing global Numerical Weather Prediction (NWP).
- The results show a positive impact of GOES AMV assimilation on the cyclone representation, with clear improvements in track, intensity, and circulation structure.
- These findings are particularly relevant given the observed increase in the frequency and intensity of South Atlantic cyclones under climate change, highlighting the growing need for high-quality weather forecasts in the region.
Abstract
Atmospheric Motion Vectors (AMVs) from geostationary satellites are a critical observational source for data assimilation, particularly in regions with sparse observations, such as the Southern Hemisphere. This study evaluates the impact of assimilating AMVs from the Geostationary Operational Environmental Satellite (GOES) series into the Numerical Modeling and Assimilation System (SMNA) used at the Center for Weather Forecasting and Climate Studies of the National Institute for Space Research (CPTEC/INPE). The SMNA consists of the Brazilian Global Atmospheric Model (BAM) coupled with the Gridpoint Statistical Interpolation (GSI) data assimilation system. Two experiments were conducted in February 2024: a control experiment that assimilated all conventional observations along with AMVs from GOES-16 and GOES-18 satellites, and a second experiment (data denial), in which the AMVs were excluded. This time period coincided with the formation of the tropical cyclone Akará offshore the southeast coast of Brazil. The diagnostic analysis of the assimilation process indicates a substantial increase in the relative contribution of wind observations to the cost function and a reduction in the differences between the background and the analysis, particularly in the mid and upper troposphere. Forecast verification showed that assimilating AMV data led to a reduction in RMSE and an increase in anomaly correlations for several variables, including wind and temperature at various vertical levels. The positive impact of GOES AMV data on the representation of the tropical cyclone Akará is evident in the improved positioning, intensity, and circulation structure of the cyclone, particularly during its intensification phase. With tropical cyclone events over South America becoming more frequent in recent years, results from this study indicate the critical need to assimilate AMV data to improve forecast skill. Furthermore, the assimilation of GOES AMVs significantly enhances the representation of atmospheric circulation over South America, particularly improving the predictability of large-scale events such as cyclones in the South Atlantic.
1. Introduction
Numerical weather prediction (NWP) aims to predict the future state of the atmosphere as accurately and realistically as possible, where the efficiency of the processes involved depends on the quality of the initial conditions used. This initial condition, commonly called an analysis, is obtained by combining short-term forecasts with observations in a data assimilation process. This process explores statistical methods to obtain a minimal uncertainty analysis, taking into account the deficiencies and limitations of the model and of the observation systems used [1]. Among the different atmospheric variables considered in data assimilation, wind speed and direction play an important role, since they carry information on mass fluxes at different levels and consequently allow access to the patterns of the general atmospheric circulation [2]. Wind data obtained from satellite-based remote sensing techniques are widely used among observational data sources because of their extensive spatial and temporal coverage. In particular, Atmospheric Motion Vectors (AMVs) contribute approximately 5–7% of the total 24 h forecast impact, as indicated by Forecast Sensitivity to Observation Impact (FSOI) statistics aggregated over 2020–2024 [3]. Nonetheless, some limitations exist, such as uncertainties in the height assignment of AMVs, which constitute a significant source of observational error and have been highlighted in previous studies [4,5,6,7].
AMV data are observational estimates of horizontal wind speed and direction in the atmosphere, derived from the automatic tracking of cloud or water-vapor features in consecutive satellite images. These features are tracked using cross-correlation algorithms applied to target pixel windows, allowing the estimation of horizontal wind components at different levels of the troposphere in an efficient and low-cost way [7,8]. This derivation method enables the observation of vast regions not covered by radiosondes, such as oceanic and remote continental areas, where the number of ground stations is limited, thereby reducing the impact of observation gaps in data assimilation. These AMV data can be obtained from both polar orbiting and geostationary satellites. For polar orbiting satellites, their application is more restricted because cloud tracking is only possible in regions close to the poles, where there is an overlapping of passages in sufficiently short intervals (less than one hour). On the other hand, for geostationary satellites, which are positioned around the Equator, the wind data are limited to latitudes lower than 60° [9]. Over the past decade, modern composite AMV products have been developed to bridge the coverage gap between polar and geostationary satellites, extending wind retrievals into mid- and low-latitude regions and providing a more continuous global dataset [10]. Consequently, AMV data allow monitoring the atmospheric flows in a wide area and with an excellent temporal resolution, generating an extensive and robust database, especially in the Southern Hemisphere, where there are deficiencies in the conventional database.
Over South America, wind data derived using the AMV technique are currently obtained from two satellites of the Geostationary Operational Environmental Satellite (GOES) series [11], whose combined coverage spans the entire continent. GOES-18, positioned at 137.2°W, provides coverage of the eastern Pacific and portions of South America, while GOES-19, positioned at 75.2°W, provides eastern coverage of South America. These satellites replaced GOES-17 and GOES-16, respectively, in January 2023 and April 2025 [12]. These observations represent one of the most comprehensive datasets for the region [13], with substantial potential to enhance data assimilation. Their assimilation can improve the representation of the atmosphere in numerical models, particularly during extreme events such as cyclonic systems impacting both the South Atlantic and the Pacific adjacent to the South American coast.
Previous studies have shown that the assimilation of AMV products has a significantly positive impact on weather forecasting in the Southern Hemisphere [14]. Recent studies have employed geostationary satellite data to monitor and forecast the dynamic evolution of Southern Hemisphere tropical cyclones. Ciardullo et al. [15] conducted a diagnostic analysis, using remote sensing data, of the physical and dynamic evolution of tropical cyclone Faraji, which occurred in the central Indian Ocean in early February 2021. Liu et al. [16] analyzed the predictability of tropical cyclone Freddy, which occurred in the southwestern Indian Ocean between February and March 2023, to understand the factors that limited the accuracy of its forecasts along its trajectory. In particular, [17] evaluated the hourly assimilation of AMV (in the visible, infrared, and clear-air water vapor channels) in 25 tropical cyclones over the North Atlantic, reporting significant improvements in track and intensity forecasts. Complementarily, [18] analyzed the impact of dynamic information derived from GOES-16 rapid-scan imagery within the Hurricane Weather Research and Forecasting (HWRF) model, showing that the inclusion of high-frequency AMV enhances the accuracy of hurricane track and structure forecasts in the North Atlantic. Similar results were obtained by [19], who optimized the assimilation of AMV derived from the GOES-16/17 satellites, covering cyclones in both the Atlantic and eastern Pacific basins, and observed consistent gains in the representation of upper-level circulation.
Cyclonic systems in South America occur frequently, bringing intense rainfall and strong winds. The vast majority are extratropical, although some can be classified as subtropical or even tropical. Accurately predicting the intensity of these phenomena is crucial for society. NWP models are the main tool for this, and their ability to forecast formation, life cycle, path, and precipitation depends on the quality of the analyses, which are determined by the observational data used. In February 2024, the Akará cyclone had its genesis near the coast of the state of Rio de Janeiro, presenting tropical characteristics and moving towards the ocean [20]. This event began at 12 UTC 15 February 2024 with a lifetime of 7 days, which presented a peculiar and unusual genesis for the South Atlantic and attracted the attention of several meteorological centers in Brazil and worldwide [21]. This event was new in several specialized newspapers and on social media.
Despite previous studies demonstrating the positive impact of AMVs in the Northern Hemisphere [14,17,18], there is still a lack of detailed assessment of their impact over South America, particularly using operational systems such as SMNA. Therefore, this study contributes to filling this gap by evaluating the impact of GOES-derived AMVs on the predictability of the Akará cyclone and providing both diagnostic and forecast-based quantitative assessments. The goal of this study is to evaluate the contribution of assimilating AMV data from the GOES satellite series to improving weather forecast performance over South America. The experiments are carried out using the Numerical Modeling and Assimilation System (SMNA, the Portuguese acronym for Sistema de Modelagem Numérica e Assimilação) at the Center for Weather Forecasting and Climate Studies of the National Institute for Space Research (CPTEC/INPE), which integrates the Brazilian Global Atmospheric Model (BAM) [22] and the Gridpoint Statistical Interpolation (GSI) analysis system [23]. The evaluation focuses on the predictability of the Akará cyclone, enabling an assessment of the impact of these observations on the forecasting of cyclonic events in the region. To achieve this goal, Section 2 presents the methodology used, with details of the data with emphasis on a characterization of the Akará event, as well as the configuration of the experiments and the evaluation method used. Section 3 presents the results generated in the evaluation of the impact of the AMV data from GOES-16 and GOES-18 in terms of three different aspects: (1) in the diagnosis of the data assimilation process carried out by GSI in the improvement of the quality of the analyses obtained; (2) in the impact of these data in the forecasts generated by the BAM model; and (3) the impact of the assimilation of the AMV data from GOES in the predictability of the Akará event, in a case study. In Section 4, general considerations and conclusions are presented, based on the evaluations performed and the results obtained in this study.
2. Materials and Methods
In recent decades, technological and computational advances have expanded the relevance of remote sensing in the data assimilation process, significantly contributing to the improvement of numerical forecasts [24]. Currently, remote sensing data constitute the majority of assimilated observations [3]. Although they present uncertainties because they are estimates based on algorithms with different levels of processing, this information is integrated into data assimilation systems through statistical minimization techniques, allowing even less precise data to contribute positively to the final quality of forecasts [25]. In order to evaluate the contribution of assimilating AMV data from the GOES satellite series, GOES-16 and GOES-18 platforms, over South America, the period chosen for this study was February 2024, during which the tropical cyclone Akará formed offshore the southeast coast of Brazil. This section presents an inventory of AMV data used in this study and details about the methodology used for forecasting and evaluation of results.
2.1. AMV Data from GOES over South America
The principle of their generation is based on the tracking of cloud patterns or water vapor structures in successive images, separated by intervals of about 10 to 15 min (for GOES-R series). The use of this technique dates back to the pioneering work of Leese et al. [8], considered the first study to propose the derivation of winds by tracking clouds in geostationary images. It was later improved by Velden et al. [26] and consolidated in more recent applications [13,27,28,29]. The technique consists of applying cross-correlation methods between target windows of pixels, assuming that the observed displacements predominantly reflect the action of the winds. In this way, it is possible to estimate the direction and intensity at different atmospheric levels. Height assignment is then determined via the Advanced Baseline Imager (ABI) Cloud Height Algorithm (ACHA), which utilizes multiple spectral bands to estimate the pressure level of the tracked features [30]. In addition, the identification of regions of interest can be assisted by the use of the brightness temperature difference () between spectral channels, defined as
where and represent the brightness temperatures in different spectral channels. This information helps to highlight convective tops and water vapor layers, increasing the robustness of AMV generation. The AMV data used in this study were derived from three spectral sources of the GOES-R series: the infrared longwave (IRLW) channel, centered at 10.3 µm and sensitive to the top of clouds and representative of the middle and upper levels; the cloud-top (CTOP) channel, obtained from bands near 6.2 µm and capturing characteristic motions of the middle and upper troposphere; and the water vapor deep-layer (WVDL) channel, based on the 7.3 µm band, which emphasizes thick cloud systems and regions of strong vertical development [9]. These products undergo cloud classification and quality-control algorithms that ensure the spatial and temporal consistency of the generated wind vectors [31,32]. The AMV data from the infrared shortwave (IRSW) channel, centered at 3.9 µm, were turned off in the GSI configuration and not taken into consideration in this study because the GSI system rejects all AMV data from this channel during the quality control process due to larger uncertainties in height assignment and the sensitivity of this channel to low cloud.
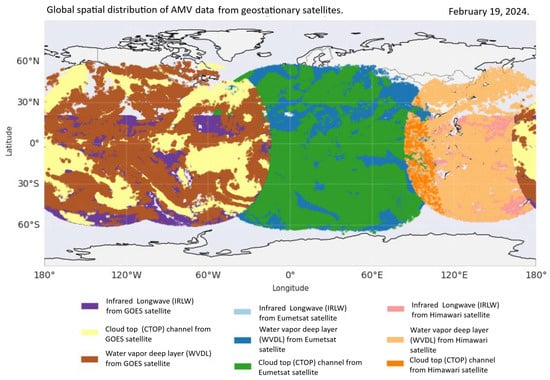
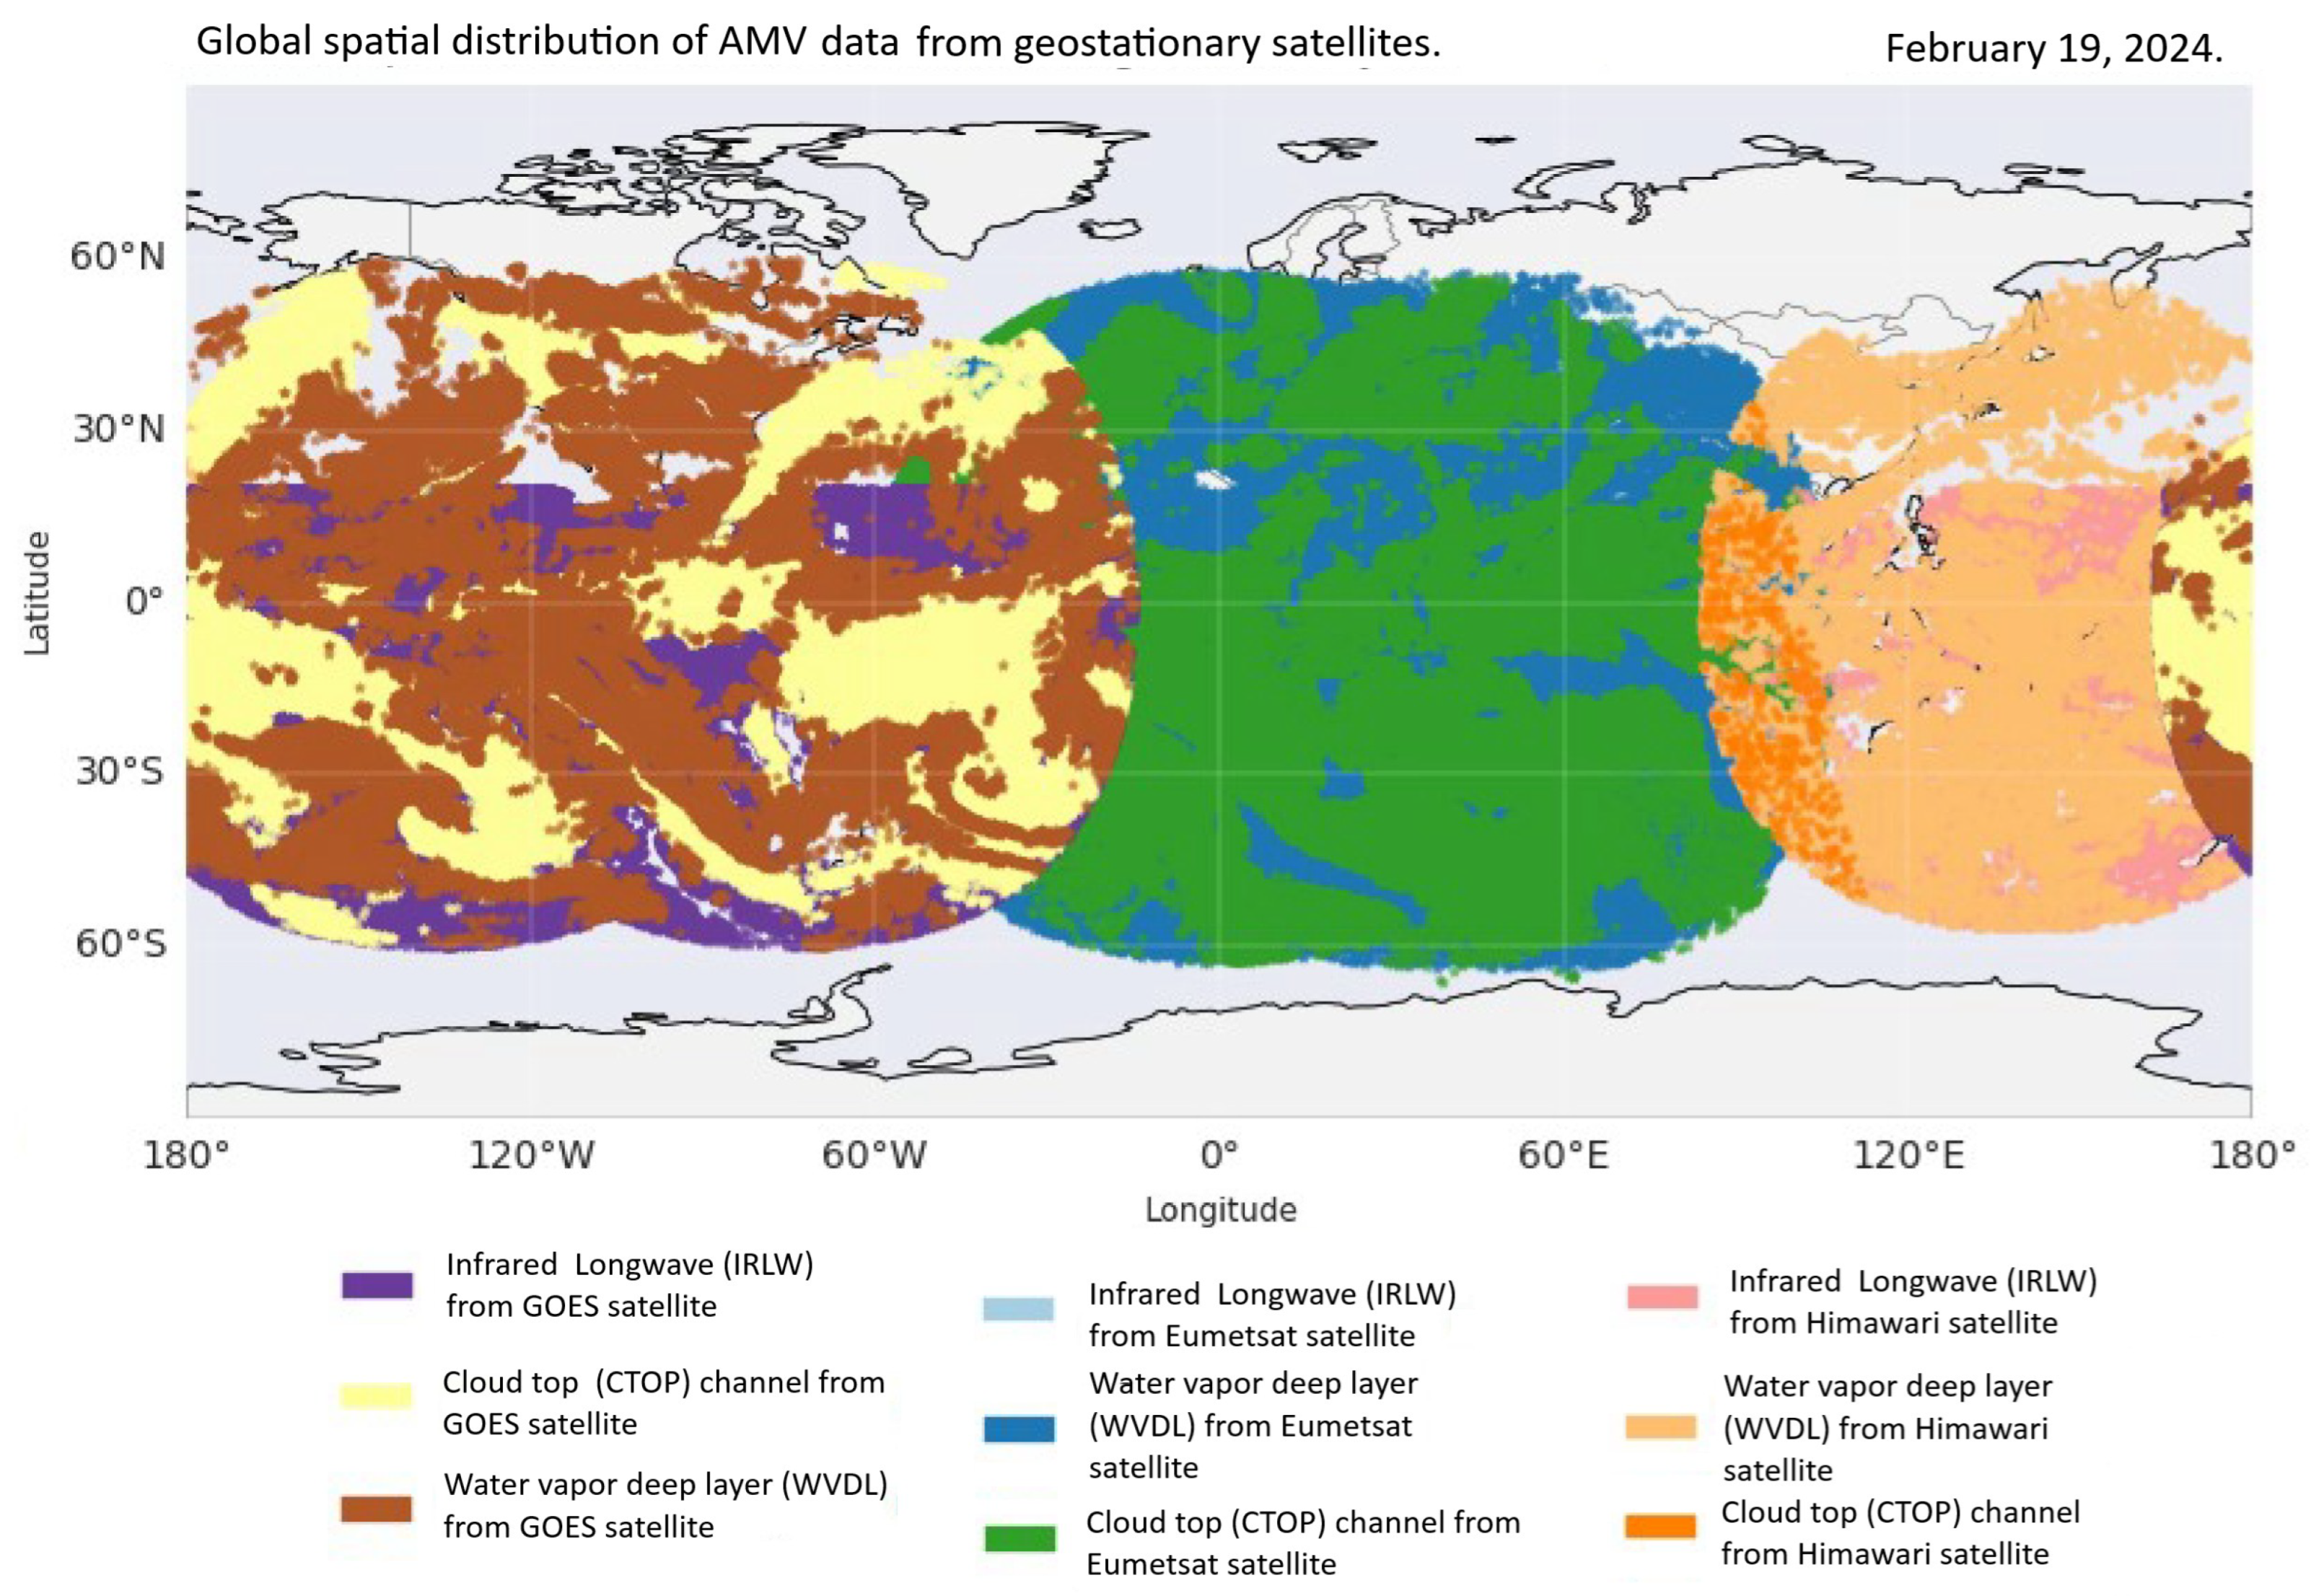
Figure 1 presents the global spatial distribution of AMV data at 12 UTC on 19 February 2024, considering the three types used and described above (IRLW, CTOP and WVDL) originating from different geostationary platforms, such as Himawari (JMA), Meteosat (EUMETSAT), and the GOES satellites, which are highlighted over South America, as they are the focus of this study. During the study period, encompassing the Akará cyclone event, the GOES data were obtained from GOES-18 and GOES-16. The complementarity of these two satellites results in a high density and spatial continuity of wind vectors over the Americas and adjacent oceanic regions, such as the tropical sectors of the Atlantic and the Pacific, regions known for the scarcity of conventional observations. This distribution reinforces the importance of AMV data from the GOES satellites, particularly in monitoring tropical and subtropical circulations in this region, which is a fundamental condition for the adequate representation of cyclonic systems.
Figure 1.
Spatial distribution of AMV data from geostationary satellites at 12 UTC on 19 February 2024.
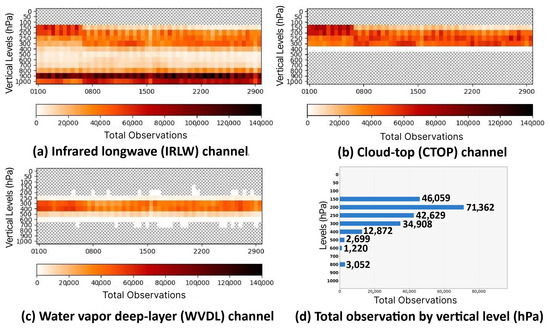
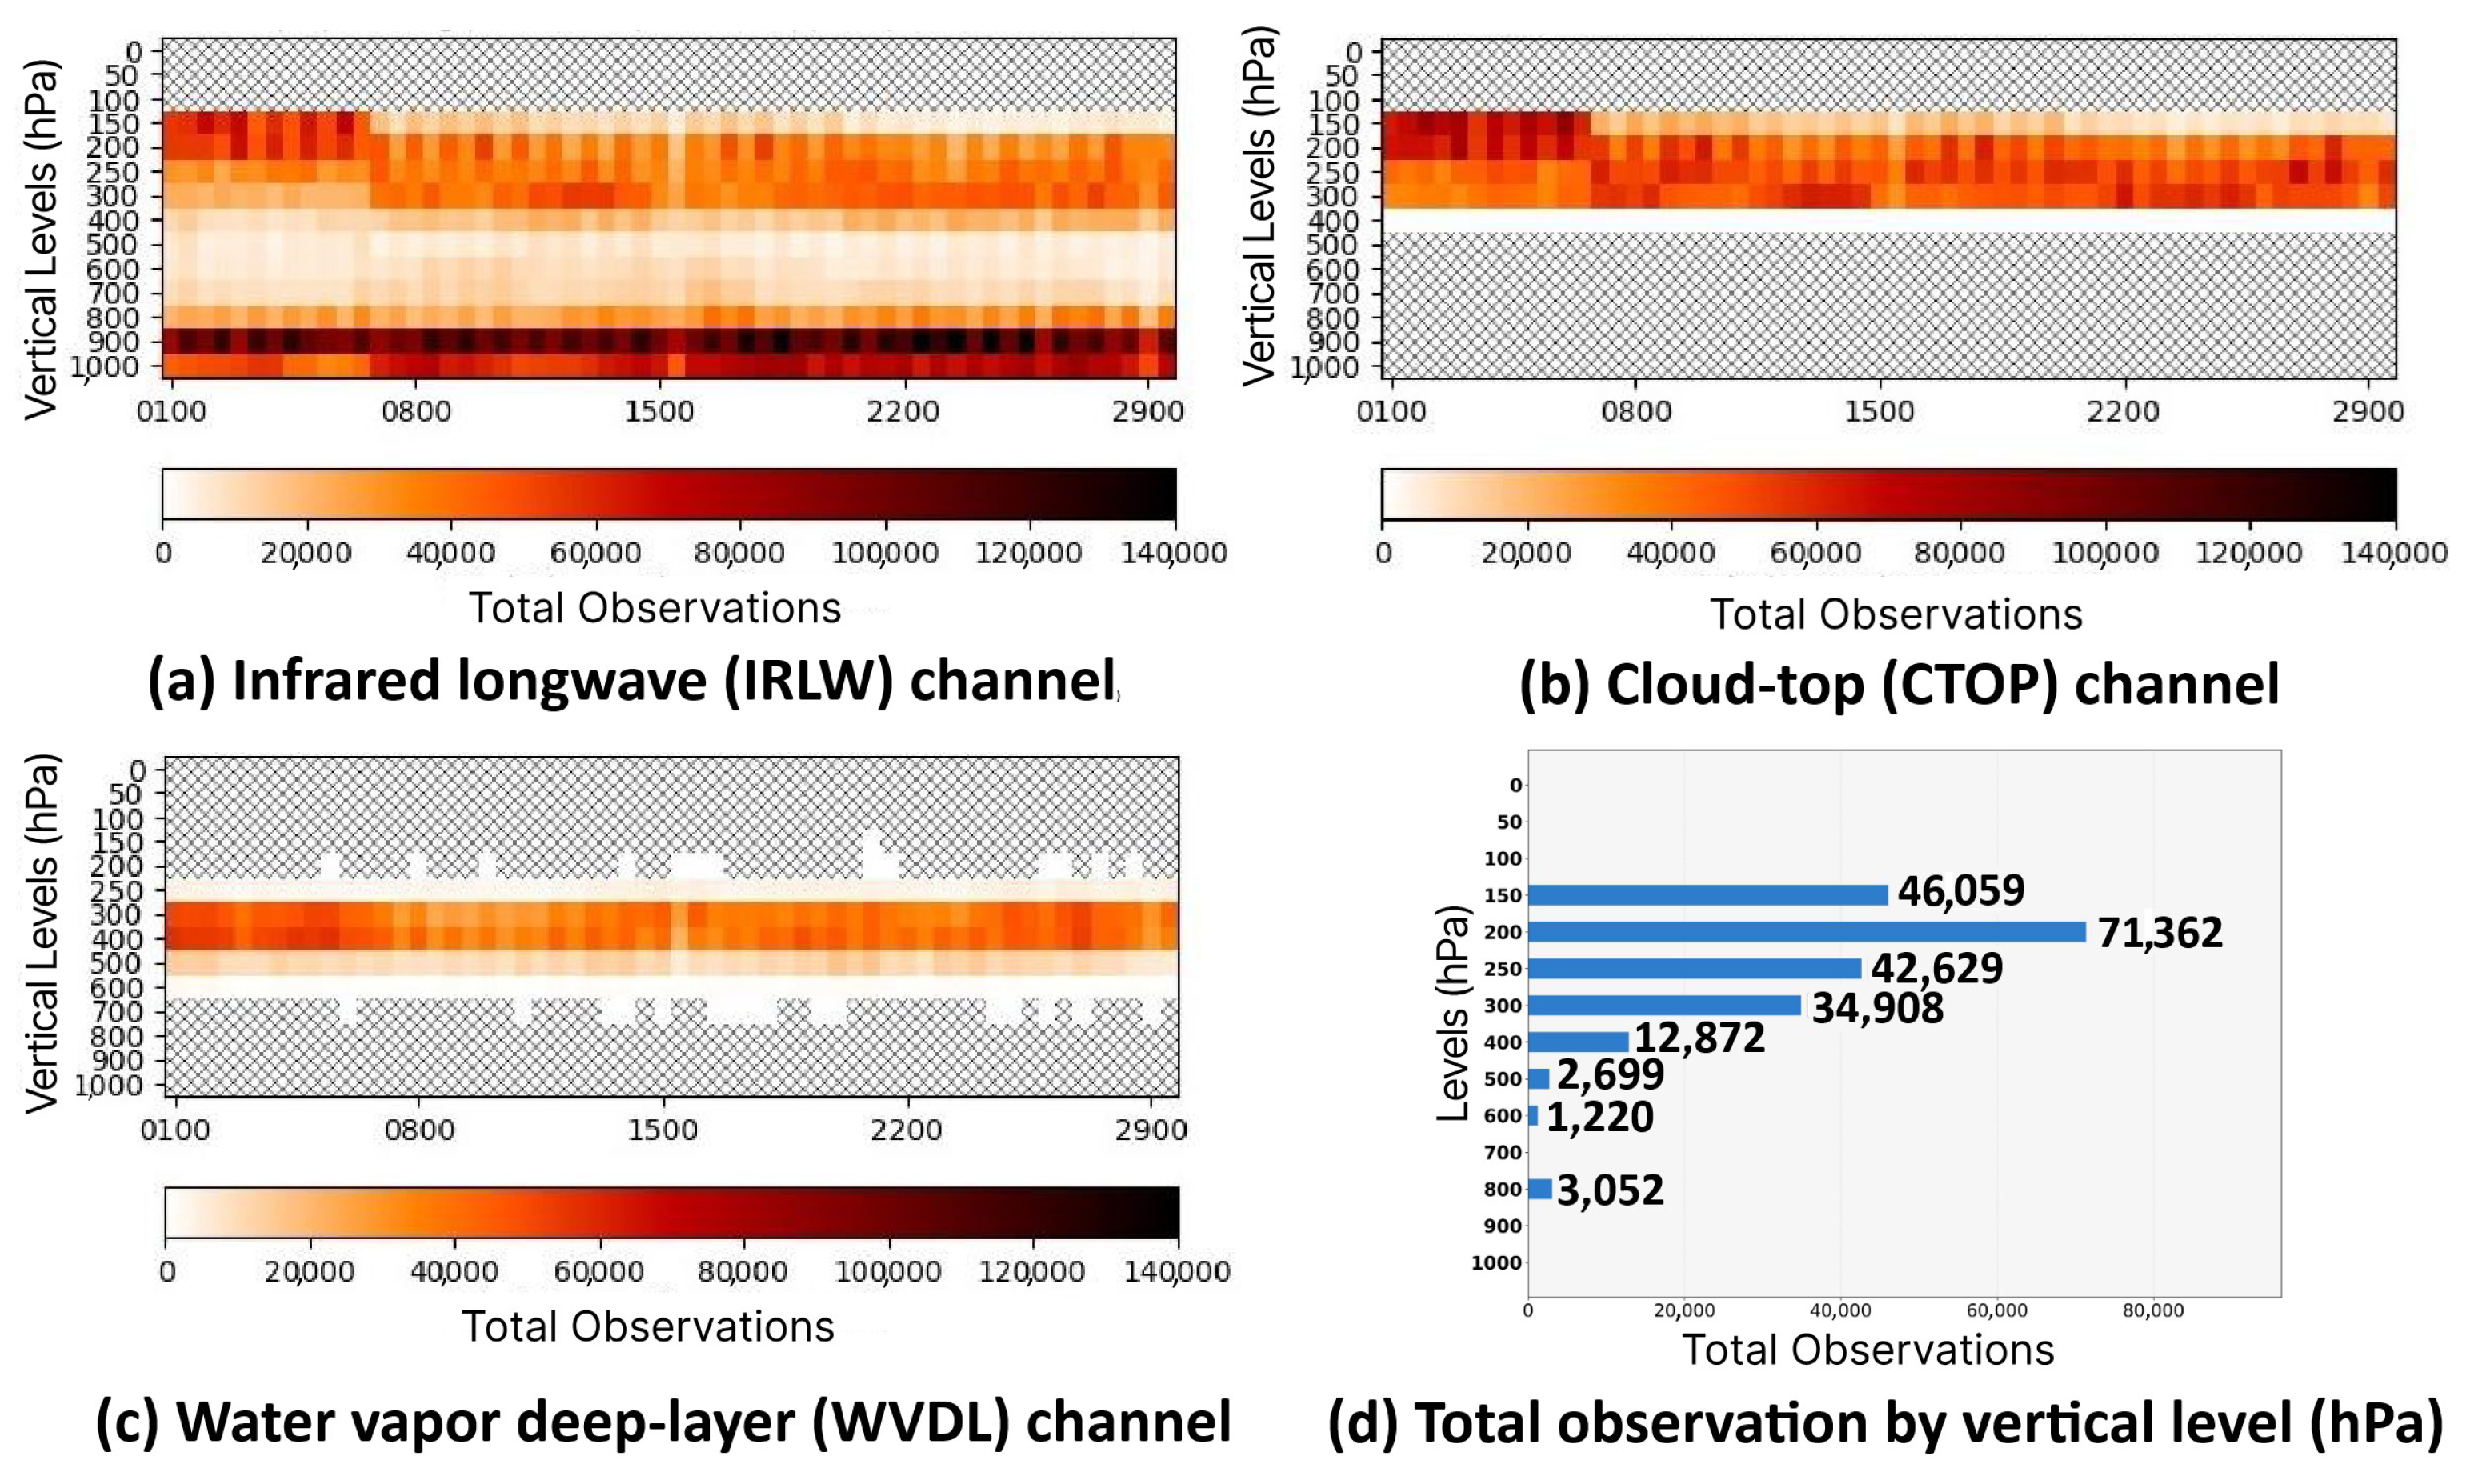
Beyond spatial characterization, it is equally relevant to examine the temporal variability and vertical distribution of the different types of AMV data in this study. This analysis makes it possible to identify not only where the GOES-derived wind observations are located, but also at which levels of the troposphere they are concentrated and how they are distributed across the different assimilation cycles. Figure 2 shows the temporal distribution of these three types of AMV from 1 to 29 February 2024, organized into three panels: (a) IRLW, (b) CTOP, and (c) WVDL. These panels show the vertical distribution of the observations, with data grouped by pressure level and by 6 h daily windows (corresponding to the assimilation cycles). Panel (d) of the same figure complements the analysis by showing the total daily distribution of observations by pressure level, for 1 February 2024. Temporally, a homogeneous and regular distribution is observed during the study period. Vertically, it is possible to identify that the data are predominantly concentrated between the levels of 150 and 300 hPa, especially in the water vapor products, reflecting the greater sensitivity of this channel to middle and upper altitudes. This pattern is consistent with the generation of AMV from the tracking of cold and moist clouds, typically located at these levels of the troposphere.
Figure 2.
Vertical distribution of GOES satellite wind data for February 2024, for (a) infrared longwave (IRLW) channel, (b) water vapor associated with cloud top (CTOP), and (c) water vapor deep-layer (WVDL). Panel (d) presents the distribution of the total daily number of observations per pressure level (hPa) (1 February 2024).
2.2. The Akará Cyclone
Although the Akará cyclone [20] was not the first tropical system recorded in the South Atlantic, its unusual genesis attracted considerable attention from operational centers and the meteorological community, as pointed out before. Two similar systems had occurred previously: Hurricane Catarina in 2004 [33] and Tropical Storm Ibá in 2019 [34]. The development of the Akará cyclone was influenced by several factors, starting at 12 UTC on 15 February 2024. Its genesis was associated with the passage of a cold front, high sea surface temperatures, and intense convection, which was enhanced by the release of latent heat. Vertical wind shear played a significant role in maintaining its subtropical characteristics during the early stages [20]. The transition to a tropical cyclone occurred when this shear decreased, allowing for a more efficient organization of convection and the development of a symmetric warm core, characteristic of tropical systems. As the system moved into regions with cooler waters, there was a decrease in its intensity due to the reduction in the temperature gradient between the ocean and the atmosphere. In addition, there was an increase in wind shear in the region. These factors led to the system’s reclassification as subtropical and, subsequently, its dissipation on 23 February 2024 [21]. Unlike Hurricane Catarina, in the case of Akará, there were no reports of damage to cities along the Brazilian coast, as it developed offshore and propagated away from the coast [21,35].
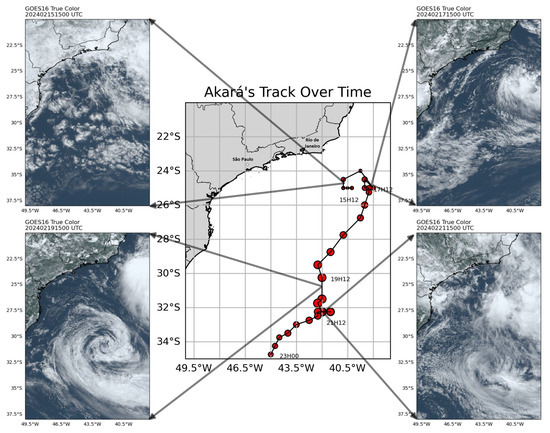
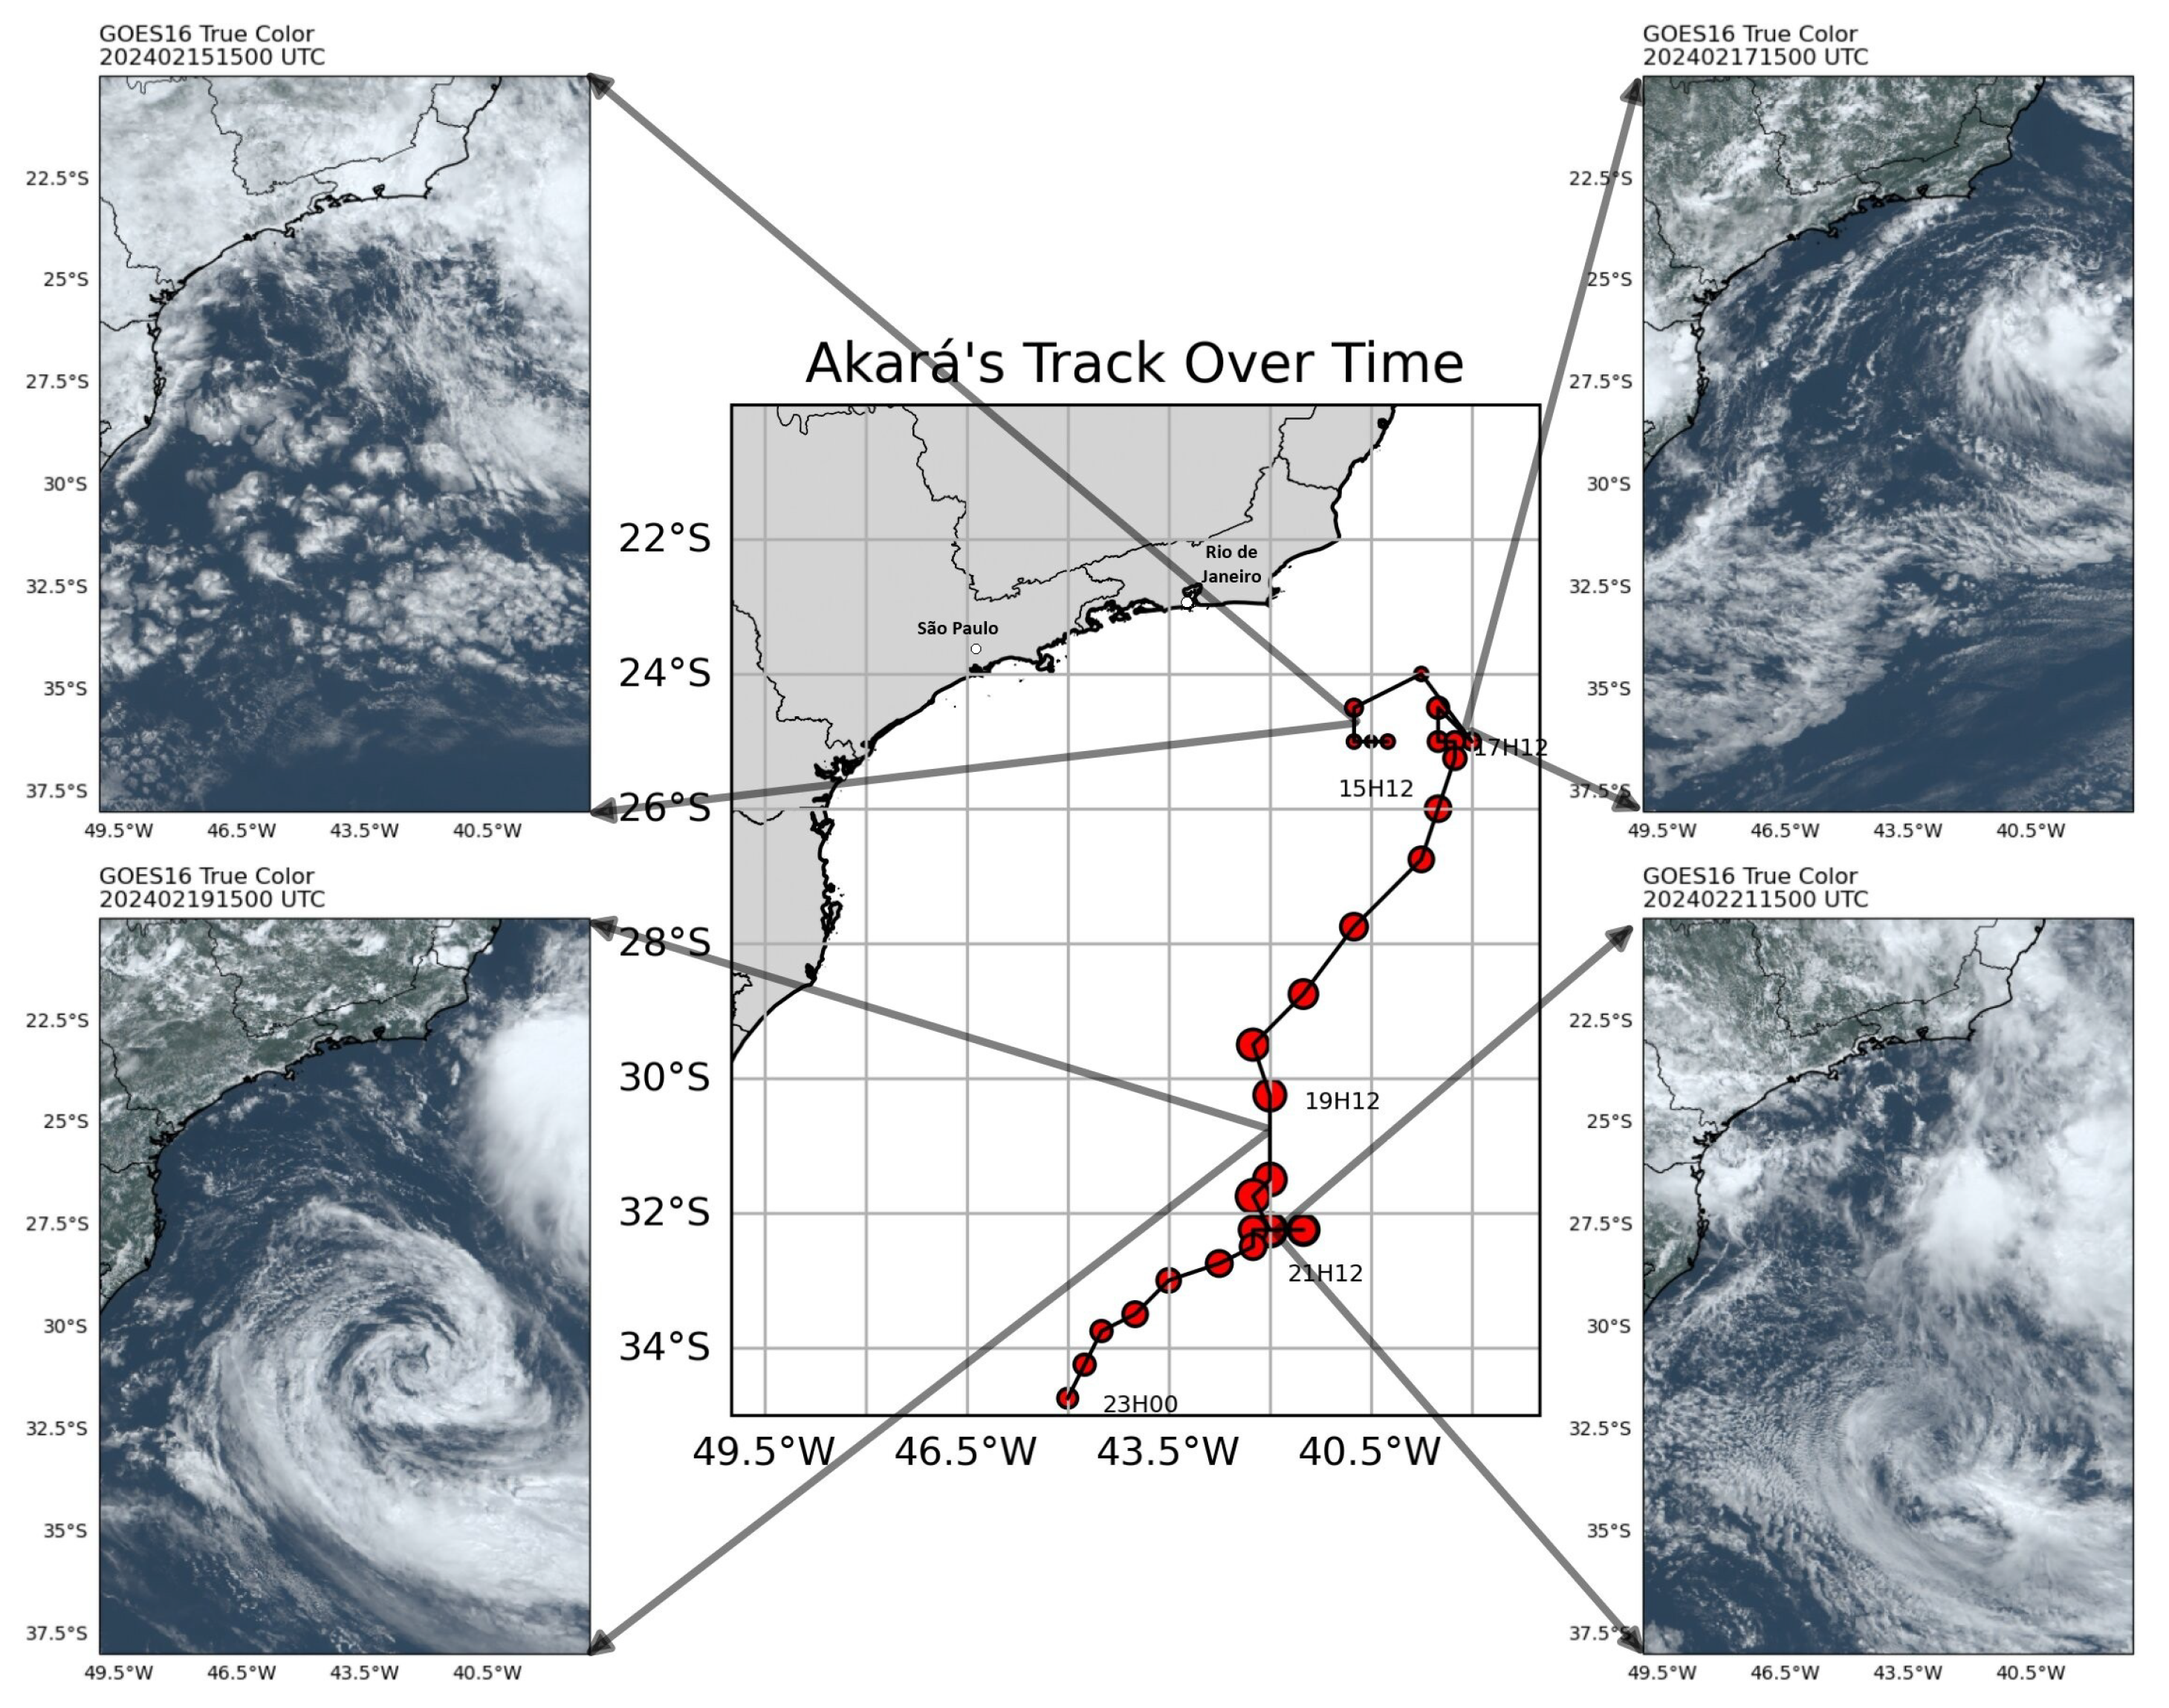
To illustrate the life cycle of the Akará event, Figure 3 presents images from GOES-16 obtained using red, green, and blue (True color products) parts of the visible light observed by this satellite. In this figure, it is possible to observe the different stages of the cyclone’s development, from its genesis (upper left corner), development (upper right corner), and mature stage (lower left corner), to its dissipation (lower right corner). In the center of the figure, the movement of the cyclone throughout its life cycle is depicted [21].
Figure 3.
Akará cyclone in different phases of its evolution. The central image shows the entire path of the cyclone based on track information reported by [21]. In the upper left corner, the beginning of its formation is observed; in the upper right corner, its development. The lower left corner represents the period when it was classified as a tropical storm, and the lower right corner shows the beginning of its dissipation.
2.3. Numerical Modeling and Data Assimilation System (SMNA) and Experimental Design
In this study, the SMNA is used in its usual configuration at CPTEC/INPE. The BAM is used as the forecast component of the system, and its configuration follows Banos et al. [36], while the GSI provides the data assimilation component. The GSI system supports multiple data assimilation approaches, including variational, ensemble-based, and hybrid methods. This study employs the three-dimensional variational (3DVar) scheme used operationally at CPTEC/INPE, in which the incremental form of the cost function is minimized using a preconditioned conjugate gradient method [37]. Table 1 summarizes the main options for the dynamics and physics packages used in the configuration of the BAM numerical model and the GSI data assimilation employed in this study.
Table 1.
The main options for the dynamics and physics packages used in the configuration of the BAM numerical model and the GSI data assimilation system.
Within the 3DVar framework, the cost function combines the model’s first guess with observational information from multiple sources. The system can assimilate a wide range of conventional non-radiance observations along with several types of satellite data, which are grouped into three main categories: (i) satellite-derived wind vectors obtained through the AMV technique [28]; (ii) Global Navigation Satellite System radio occultation (GNSSRO) data providing high-resolution vertical profiles [36]; and (iii) radiances from passive sensors onboard a global constellation of satellites operated by multiple space agencies.
Two experiments were conducted from 1 to 29 February 2024 to assess the impact of GOES AMV data assimilation over South America, using a 6 h assimilation cycle (00, 06, 12, and 18 UTC) and including data within ±3 h of each analysis time. The GOES AMV data was derived from GOES-16 and GOES-18 platforms. The first experiment (CNT) corresponds to the control configuration, with the assimilation of the GOES SatWind wind vectors. In the second experiment (NoGOES), the GOES AMV wind data were denied in the assimilation. In both experiments all the other observational data used were kept the same, which included conventional data (continental and oceanic surface stations, sensors on ships and aircraft, radiosondes and dropsondes, and profilers), GNSSRO bending angle profiles, AMV data from geostationary and polar orbit satellites, and radiances from the Advanced Microwave Sounding Unit-A (AMSU-A) aboard NOAA and MetOp satellites. Although this work has as its main focus the wind vectors derived from satellites, it is important to highlight that the complete database also plays a fundamental role in the assimilation process, especially in regions with low density of conventional observations, which cannot be disregarded in these experiments. All data files used in the experiment were obtained from the NCEP perational data server in Binary Universal Form for the Representation of meteorological data (BUFR) format to be assimilated by GSI. Within the GSI framework, the variational data control evaluates the AMV height based on the BAM background vertical profile, allowing the system to re-weight or reject data physically inconsistent with the background, thereby mitigating the impact of height assignment errors on the final analysis increments. Furthermore, the observation error statistics for these vectors are defined according to the standard GSI error tables [38,39]. The model BAM was integrated by up 120 h using the analysis obtained in both experiments.
2.4. Verification
The impact of GOES AMV assimilation on analysis quality is assessed using observations as reference. For this purpose, a diagnostic evaluation of the assimilation process is carried out, exploring the spatial distribution of assimilated data and time series of statistical metrics of OmF (Observation Minus Forecast) and OmA (Observation Minus Analysis). This evaluation focuses on regions and on the most relevant atmospheric levels where these data are more concentrated.
Forecast performance is evaluated using statistical metrics including the mean error (BIAS), root mean square error (RMSE), and the anomaly correlation coefficient (ACC), computed relative to the analysis. The ACC is a measure of model skill, defined as the correlation between the forecast and analysis anomaly fields. The climatology used for calculating the ACC is the average of 10 years from the BAM model. This statistical analysis is carried out from forecasts up to 120 h obtained by both the experiments (CNT and NoGOES), which highlight the gains obtained with the assimilation of the GOES data. A case study of the Akará cyclone was also conducted to assess the performance of the SMNA in predicting this event. Additionally, a comparison of Akará forecasts with the European Centre for Medium-range Weather Forecasting (ECMWF) Reanalysis 5 (ERA5) [40] is presented.
3. Results
3.1. Evaluation of the Contribution of GOES AMVs to Data Assimilation
Before evaluating the specific AMV data, it is useful to perform a general analysis of the complete dataset used in this study, which can be obtained by exploring the results provided during the 3DVar minimization process. The conjugate gradient method used in the GSI at CPTEC/INPE (see [38,39]) provides the contribution of each observation type to the cost function at all iterations, enabling an assessment of their relative impact during the minimization process. Equation (2) defines the fraction of reduction (as used in [36]) that relates the variation in the quantity of contribution of the observation type () to the variation in the total quantity () of the cost function between the first () and last () iterations.
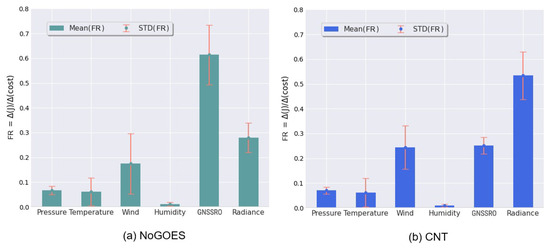
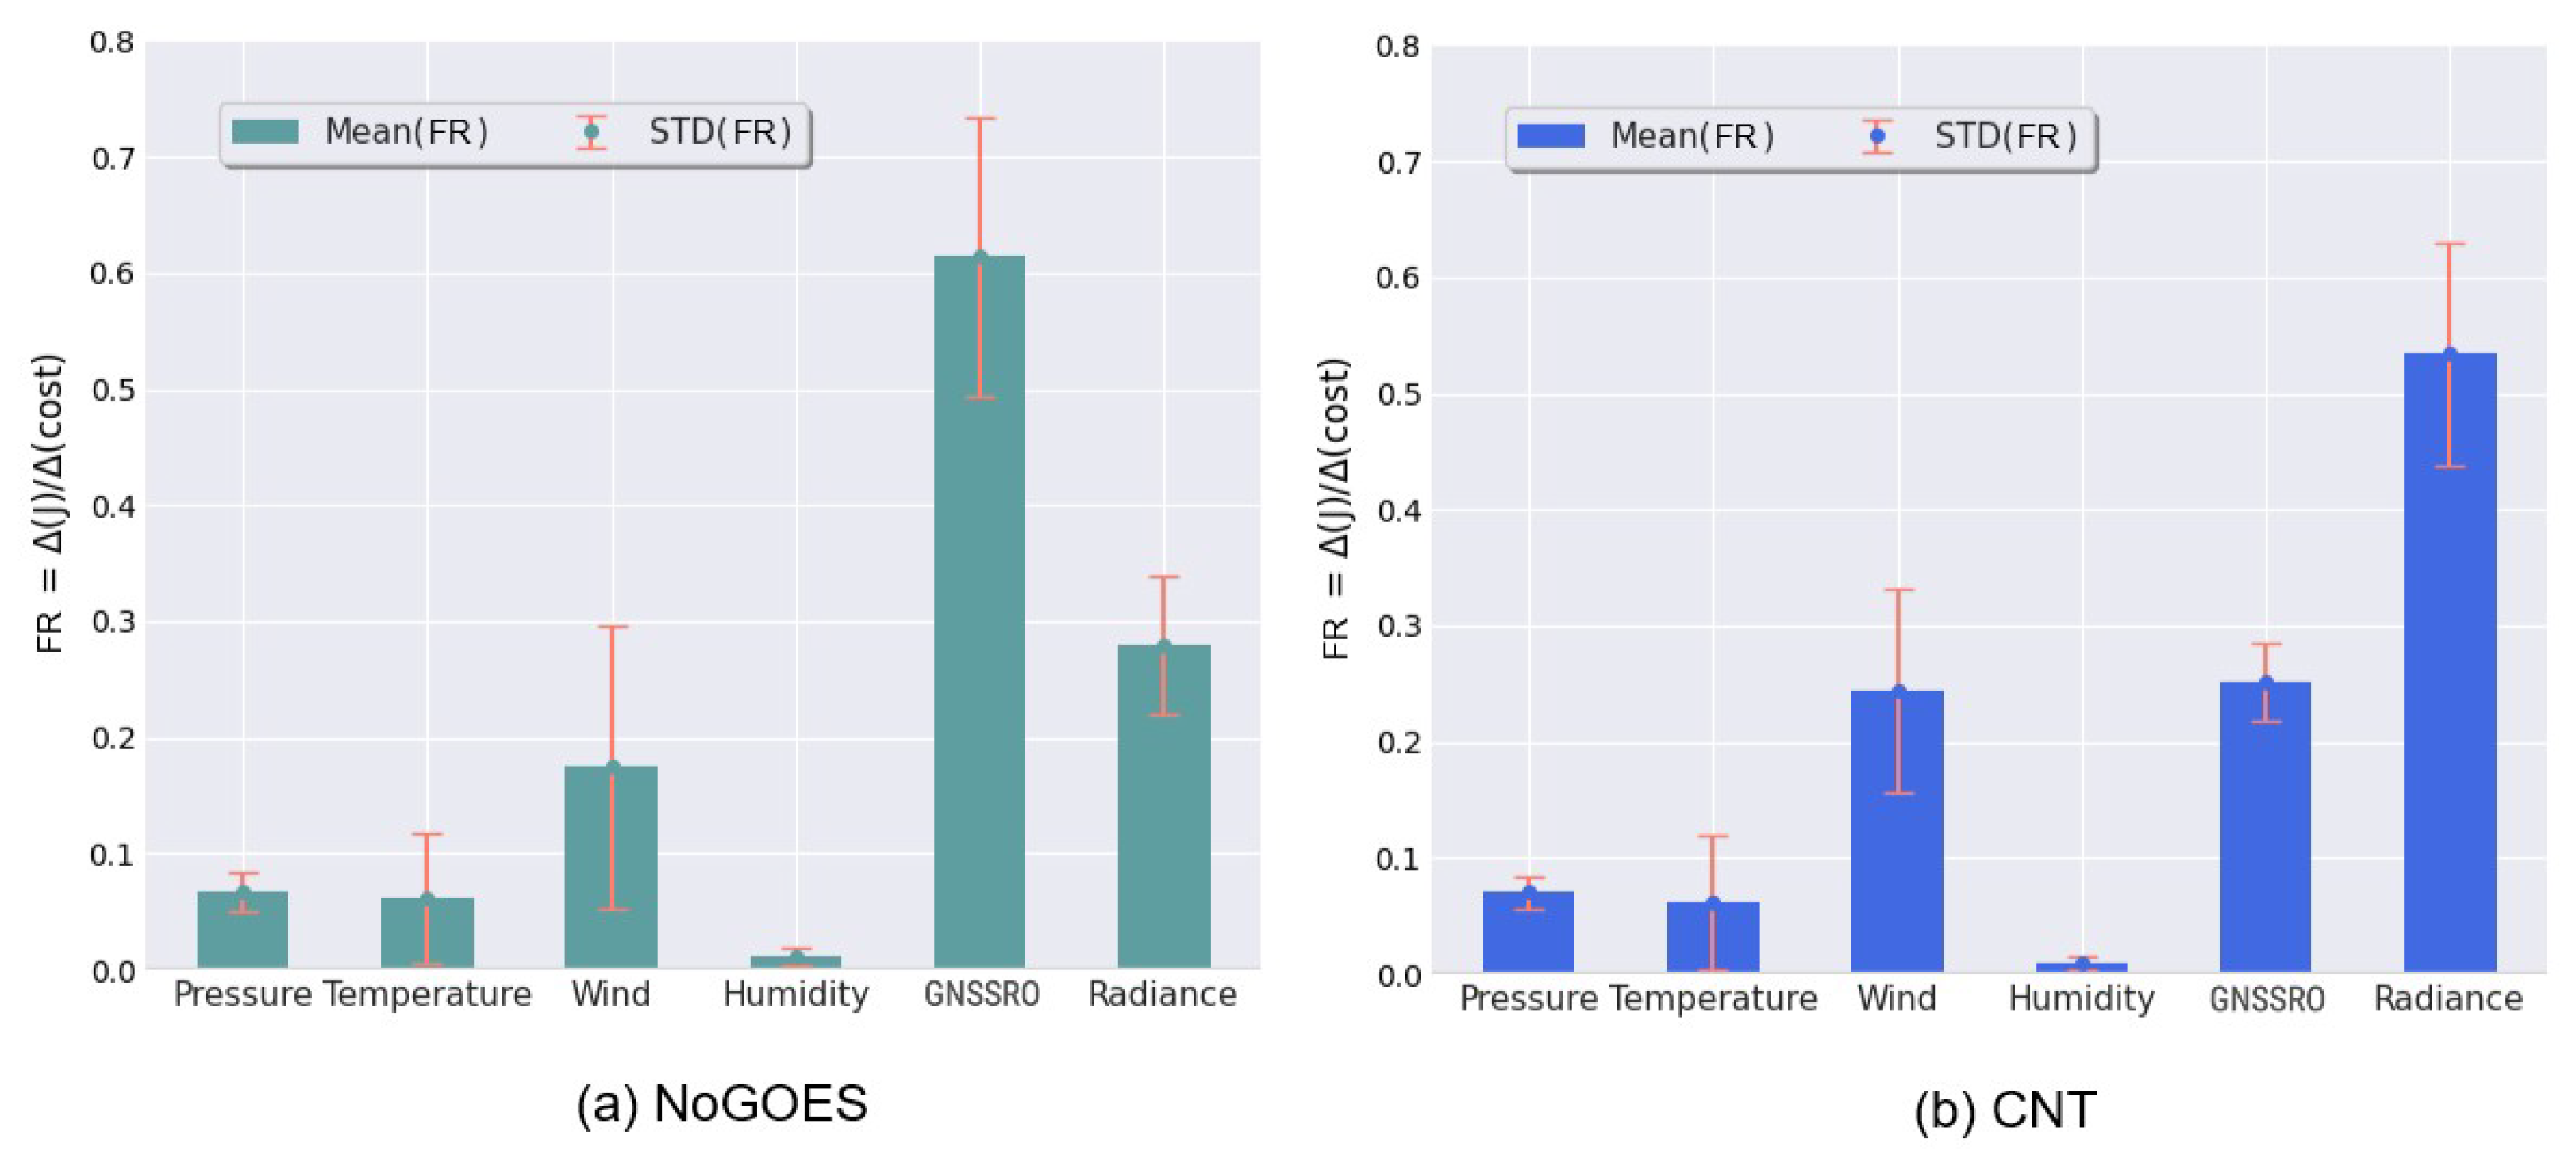
This formulation enables an objective quantification of the contribution of each observation type, and comparison between the two experiments highlights the positive impact of the added data. It is important to emphasize that this diagnostic reflects the relative contribution of different observation types to the minimization process, rather than a direct measure of forecast improvement. Figure 4 summarizes the results of this analysis, emphasizing the role of GOES AMV data in the minimization of the cost function. In both experiments [(a) NoGOES and (b) CNT], the following observation types were considered in the assimilation process: pressure, temperature, wind, humidity, GNSSRO bending angles, and radiance. The height of the bars indicates the average contribution rate for each observation type globally, while the vertical lines (red) represent the standard deviation of .
Figure 4.
Mean and standard deviation of the fraction of reduction of observations to the cost function in the GSI minimization process for the experiments (a) NoGOES and (b) CNT on 18 February 2024.
Since the only difference between the NoGOES and CNT experiments is the inclusion of GOES wind data in CNT, differences in the contribution of observation types to the minimization process can be attributed to the impact of the GOES data, as evidenced by the changes observed between the two experiments. In Figure 4a, corresponding to the NoGOES experiment, the observation type with the highest contribution is GNSSRO. This can be attributed to the absence of GOES wind data; although fewer in number, GNSSRO observations play a more prominent role in the minimization process. However, when GOES data are included (Figure 4b), radiance data become the largest contributor, as expected due to the large volume of global data provided by this system. The figure shows that the CNT experiment has a higher average contribution of wind observations than NoGOES, reflecting the inclusion of GOES AMVs in CNT. Consequently, with increasing contribution from wind observations, the average contribution of the most abundant data type (radiance) becomes more significant. AMV observations are known to improve the positioning of large-scale synoptic systems, with subsequent benefits for the representation of cloud cover. Under these conditions, radiance data assimilation becomes particularly effective, since an improved background state produces simulated radiances that better match observations and supports more reliable clear-sky pixel selection.
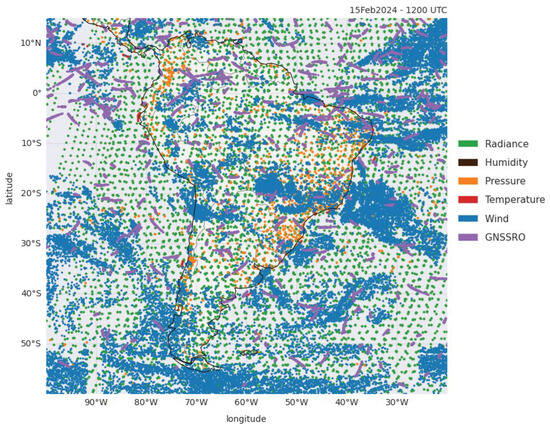
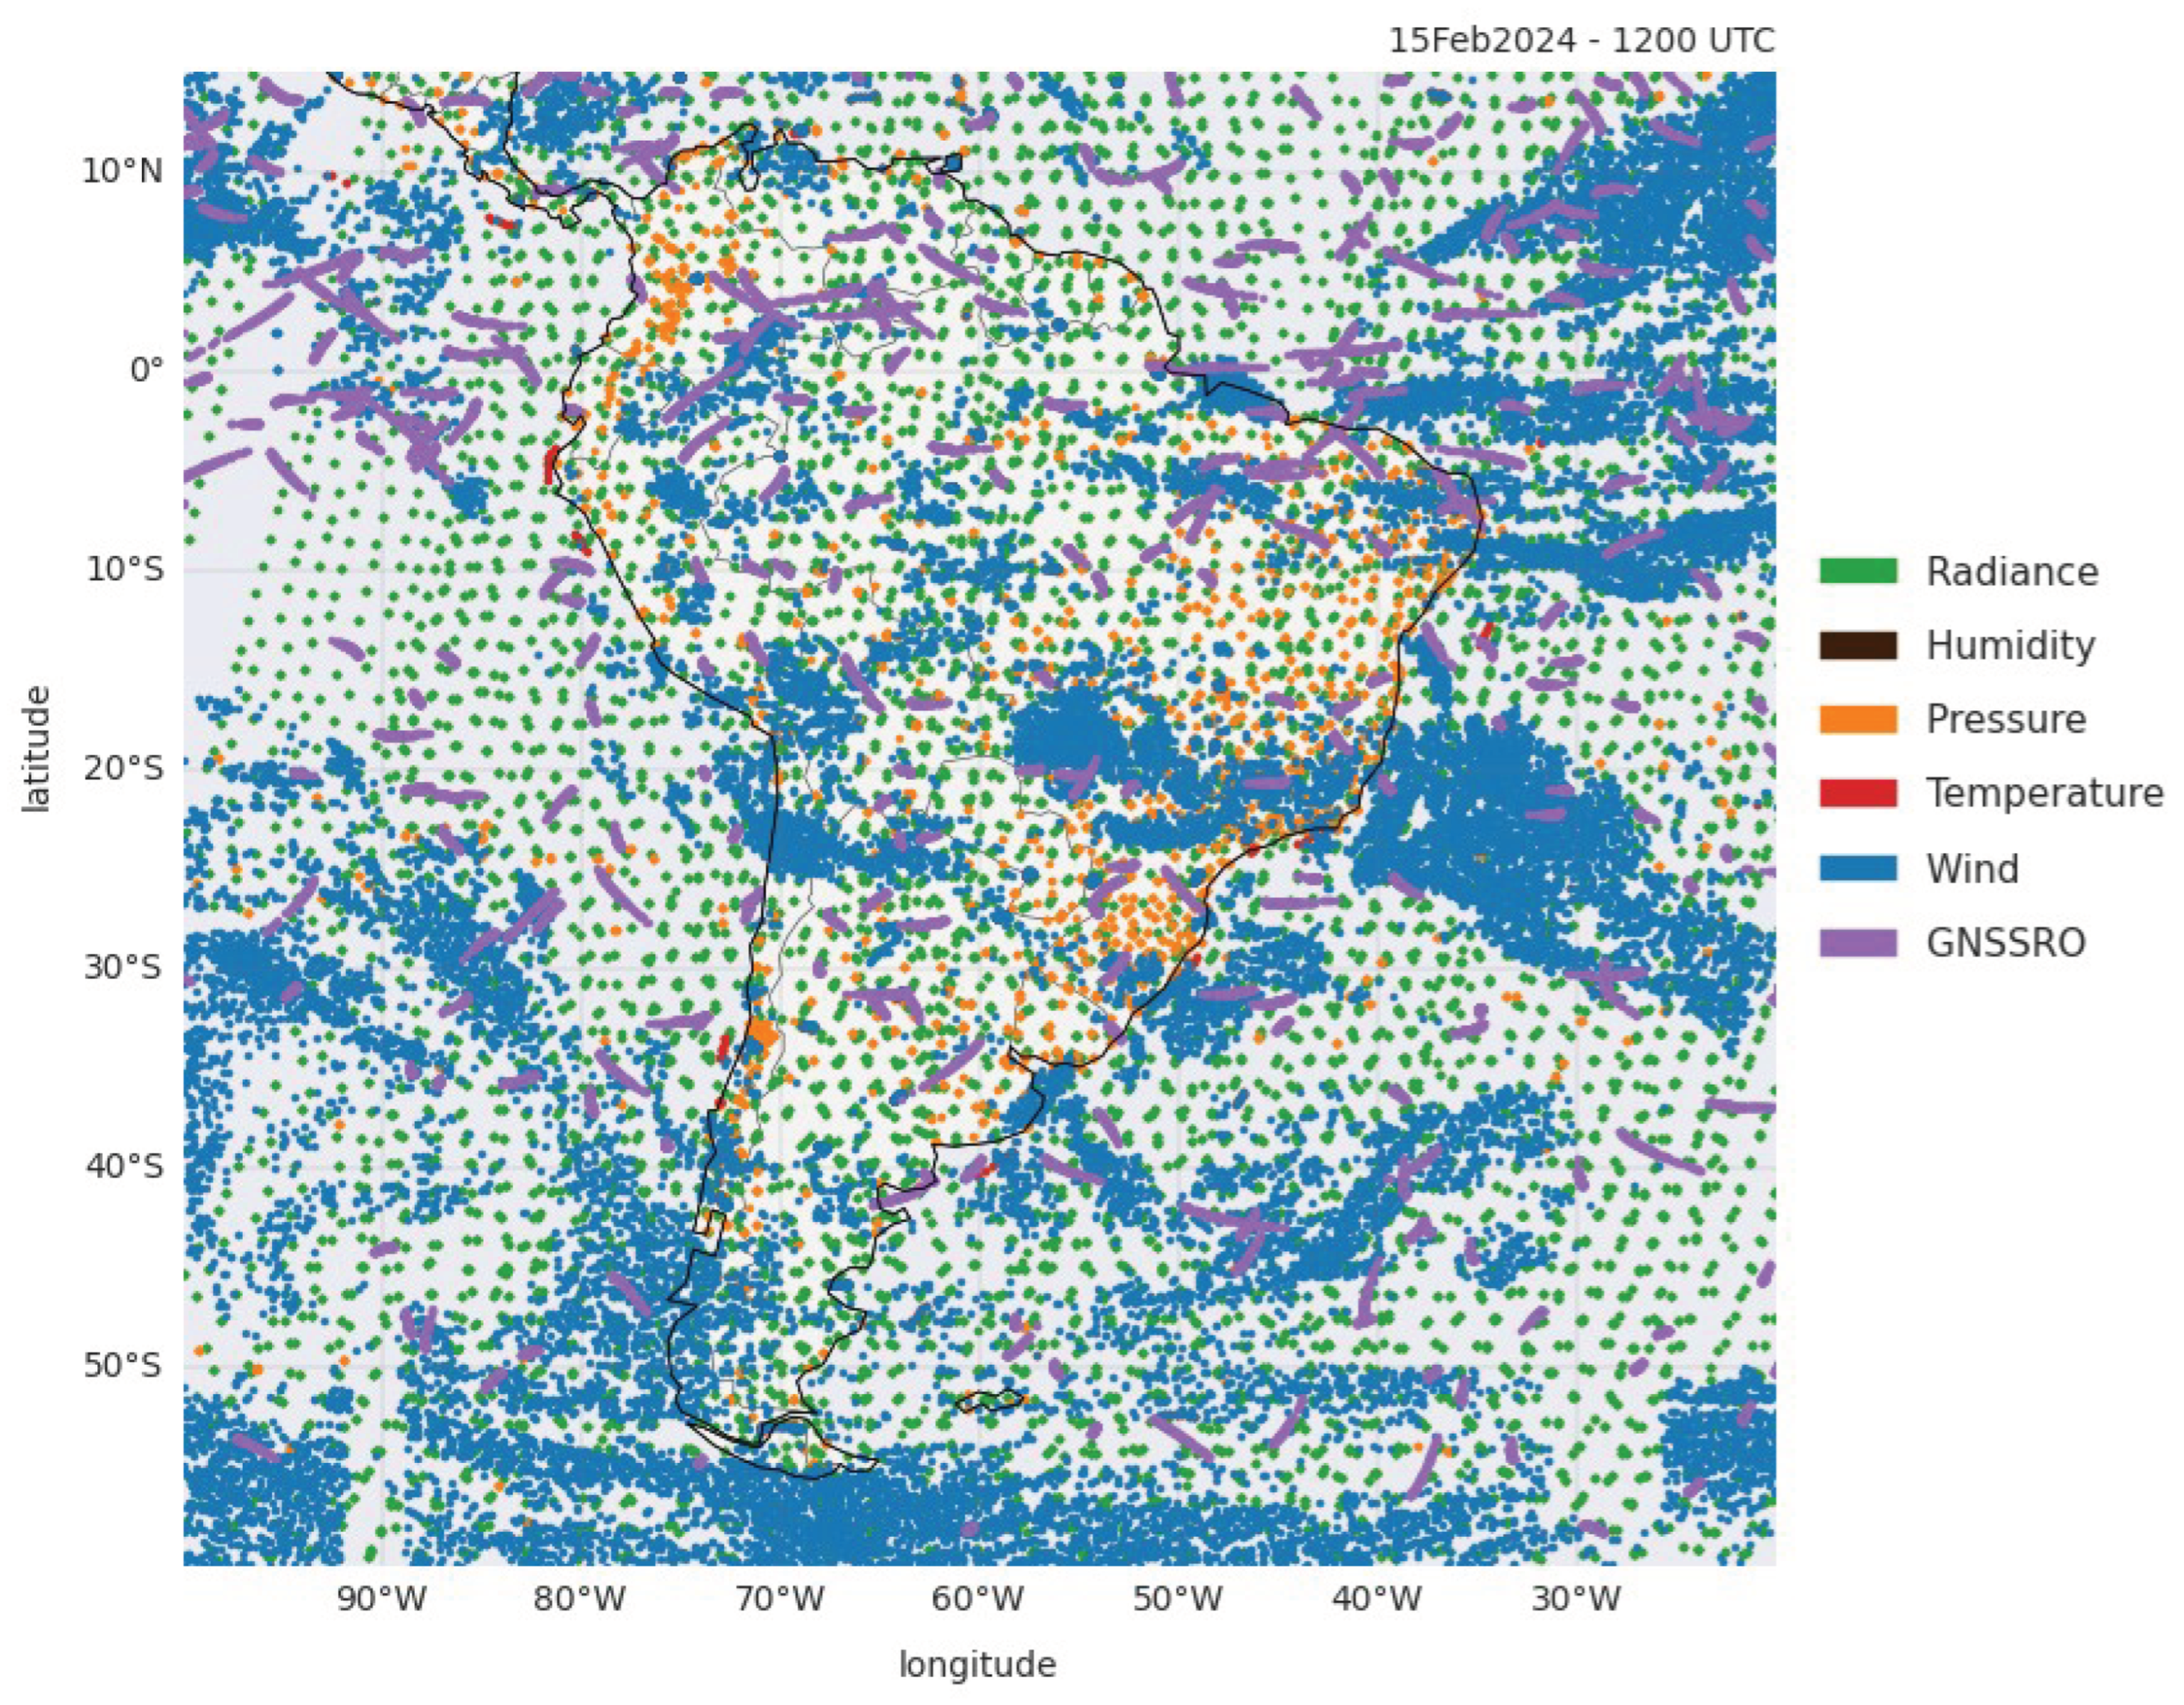
Figure 5 shows the spatial distribution of conventional observations (humidity, pressure, temperature, wind, and GNSSRO) and radiance observations assimilated in a section of South America. Figure 5 clearly illustrates the predominance of wind and radiance observations in the CNT experiment, resulting from the inclusion of data obtained from GOES satellites and the addition of radiance data from the MetOp-B satellite.
Figure 5.
Spatial distribution of assimilated observations over South America in the CNT experiment at 12:00 UTC on 15 February 2024.
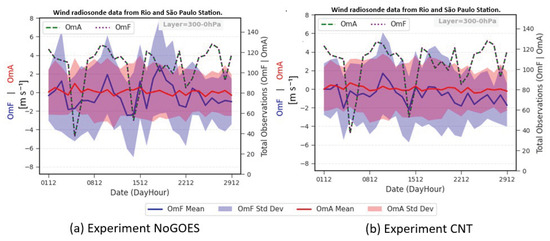
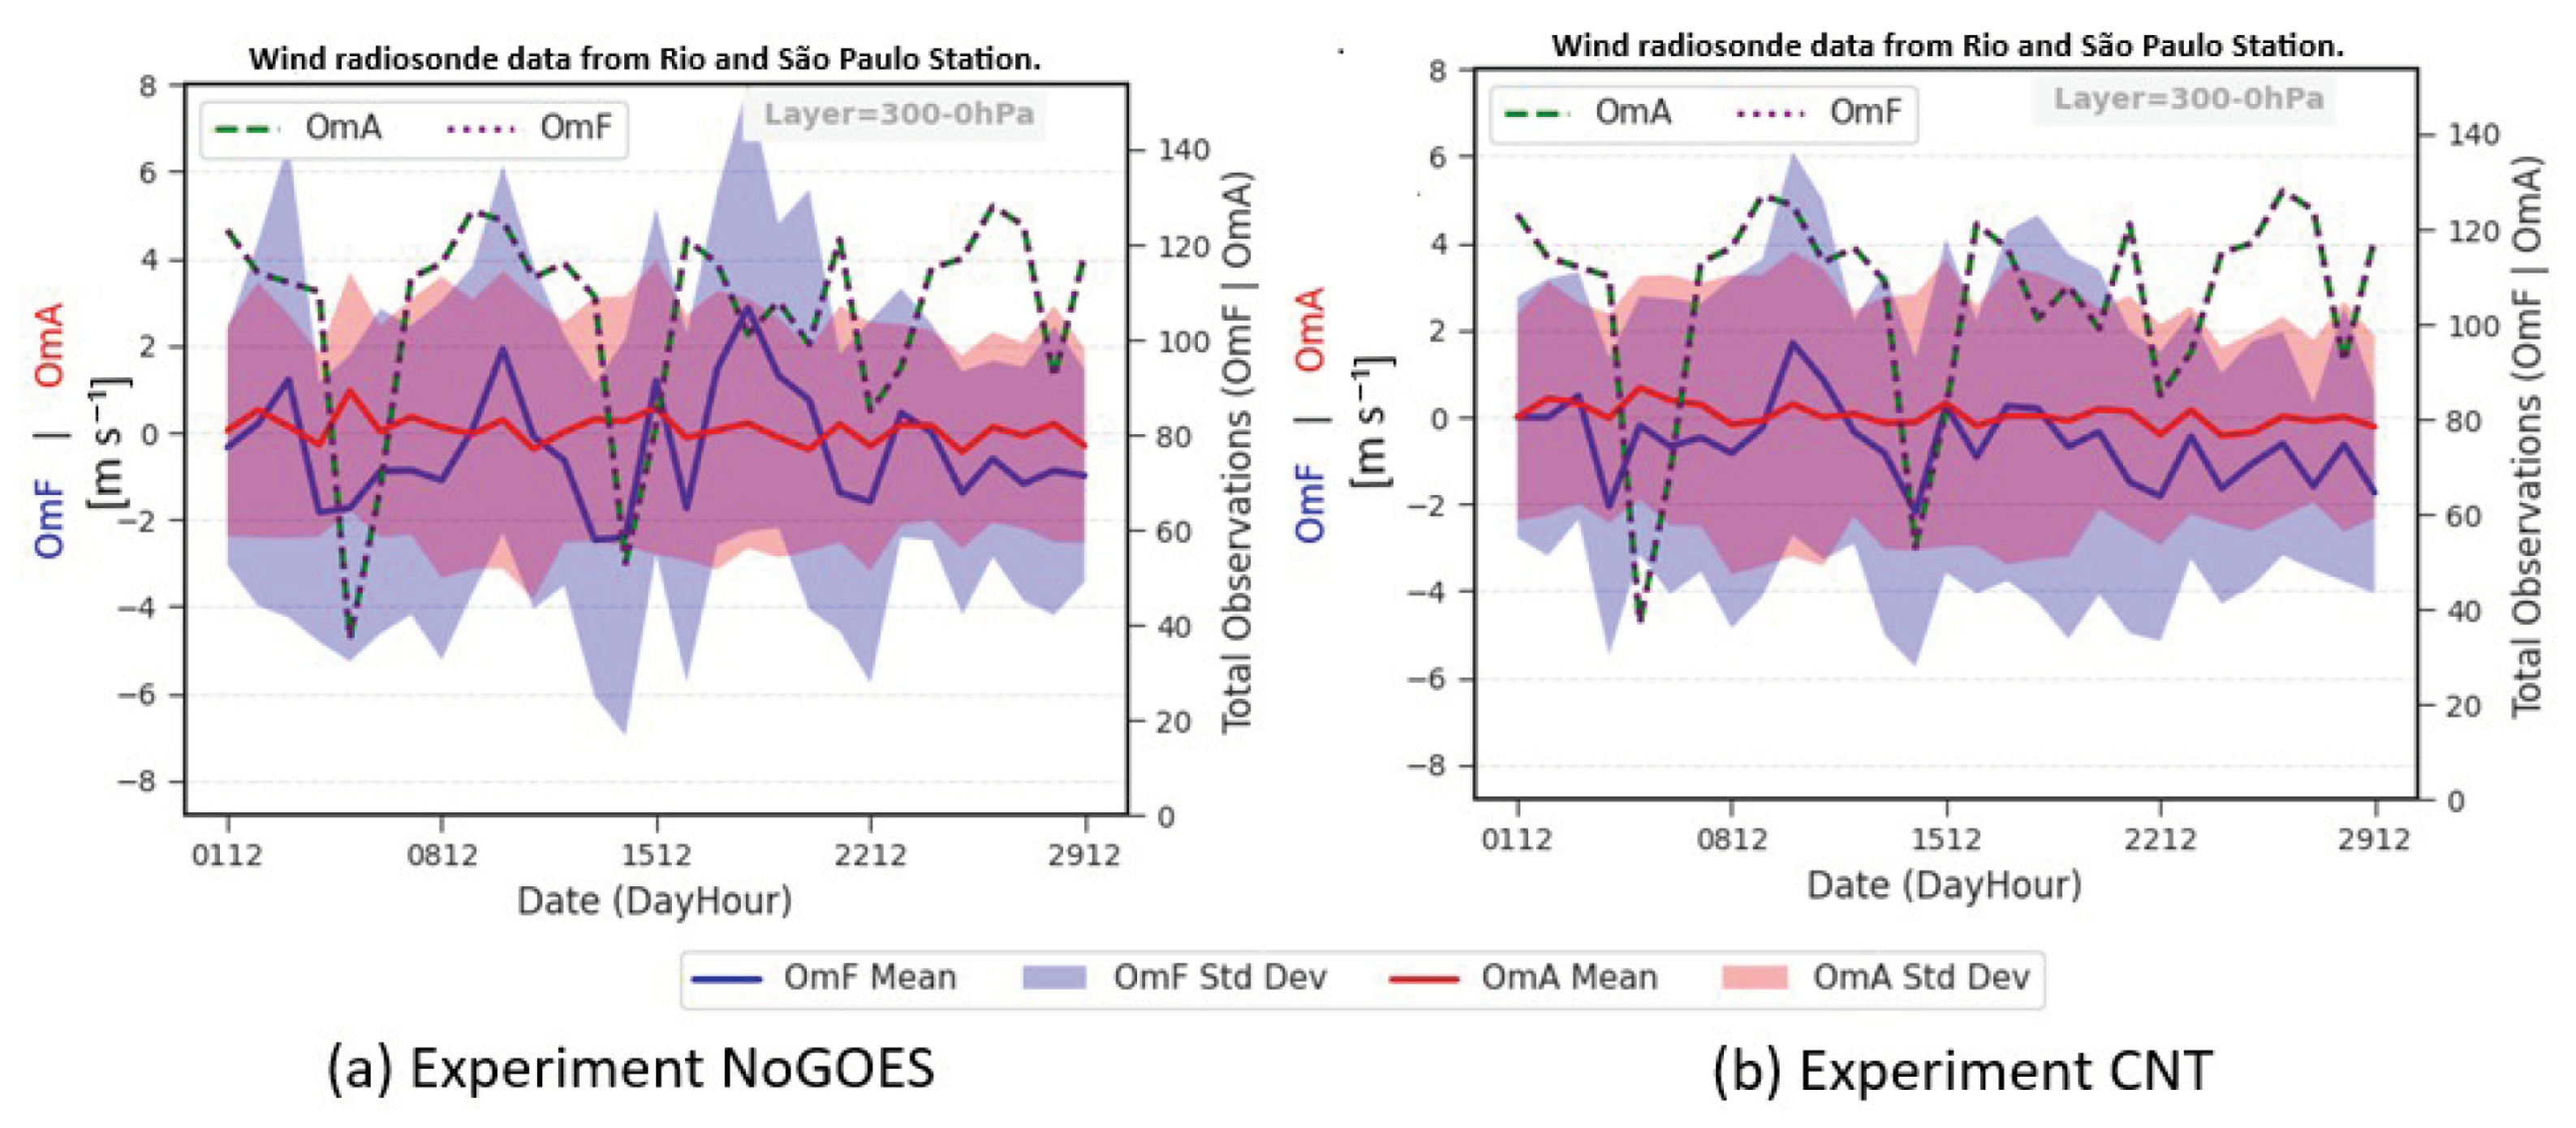
The radiosonde is an observational instrument equipped with sensors capable of measuring variables such as pressure, temperature, and humidity. In addition to these variables, radiosondes can also record wind speed and direction [41]. Attached to a meteorological balloon, they carry out measurements along a vertical atmospheric profile from the surface up to an altitude of approximately 30 km, where the balloon frequently bursts [42]. Radiosonde observations are vital to NWP and to the evaluation of GOES AMVs in data assimilation, providing in situ reference measurements, supporting bias correction of satellite observations, and enabling robust model verification [43]. The analysis of the horizontal wind component differences () (in m/s) between observations and model background (OmF) and between observations and analysis (OmA) from radiosonde observations in the CNT and NoGOES experiments is presented in Figure 6. The radiosondes used in this analysis were launched in the São Paulo and Rio de Janeiro stations, which are the closest ones from the Akará event (see localization os this station in Figure 3) and, consequently, more impacted by it.
Figure 6.
Time series of OmF and OmA horizontal wind components () for the NoGOES (panel (a)) and CNT (panel (b)) experiments in two radiosonde stations (São Paulo and Rio de Janeiro) located closer to the Akará event, for the upper atmosphere (300-0 hPa). The total of obs in OmA and OmF panel is given by the green and purple dots.
Figure 6 shows that, compared to radiosonde data, the atmospheric state predicted by the model (blue line) and its uncertainty (blue shading) are closer to the observations and present lower uncertainty in CNT than in NoGOES. This result clearly demonstrates the contribution of GOES data to a better representation of the atmospheric state within the assimilation cycle, improving the predictions. As expected, OmA and its uncertainty are smaller than OmF and similar between the two experiments, due to the high weight that radiosondes assume in the process. Other atmospheric layers were evaluated, including the middle (700-300 hPa) and lower (1000-700 hPa) layers. The results are similar and smaller in magnitude, so they are not shown here. Since the radiosonde data used in this analysis are located close to the region where the Akará event occurred, these results highlight the contribution of GOES data to this region during the event period.
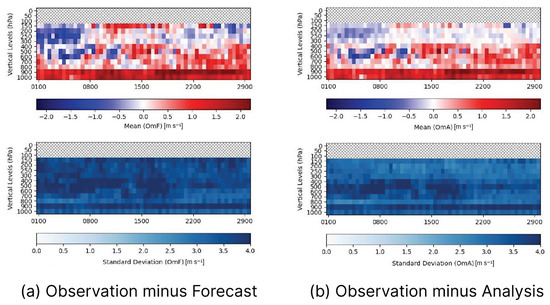
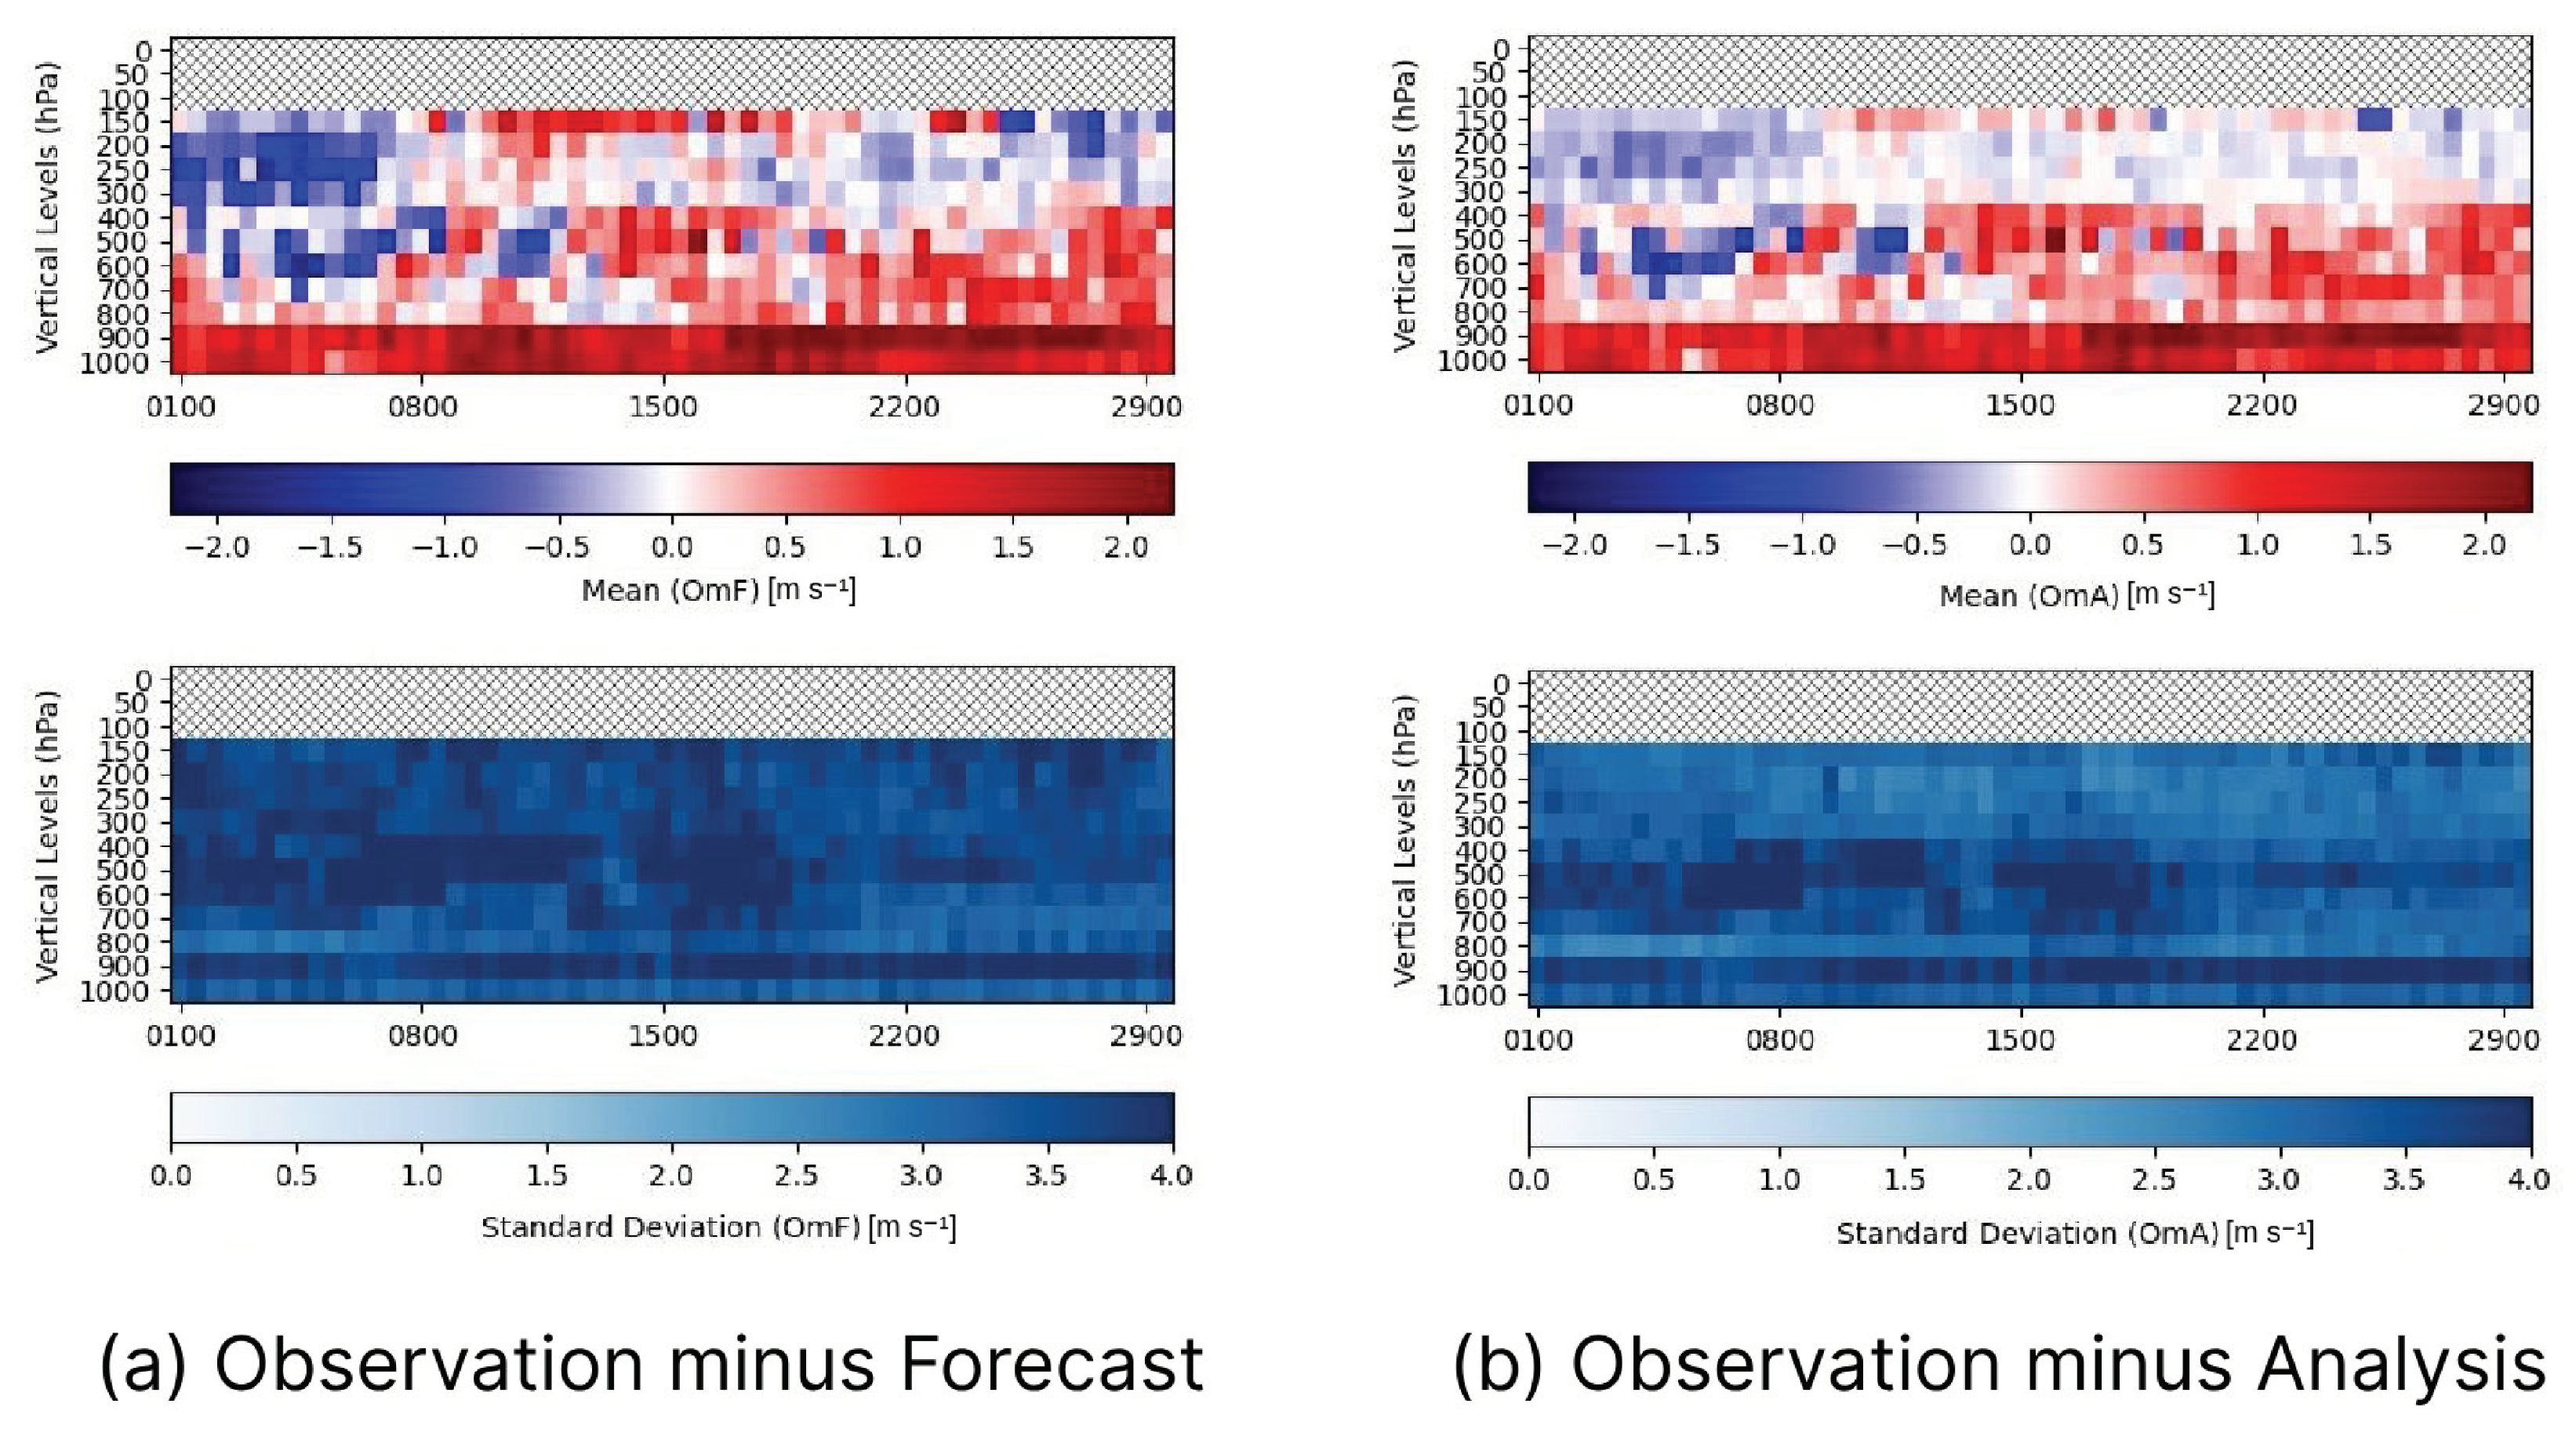
To understand the evolution of the assimilation process over time, Figure 7 presents a Hovmöller diagram of vertical levels as a function of time for the mean (top panels) and standard deviation (bottom panels) of OmF (left panels) and OmA (right panels) for the horizontal wind components (uv) (in m/s) from the IRLW channel. This evaluation covers the entire month of February 2024 in the CNT experiment and includes all assimilated data for each pressure level. In the upper panels of Figure 7, a decrease in both positive and negative biases is observed at levels above 300 hPa of the analysis OmA with respect to OmB, although at levels below this layer, the values do not show significant improvement. This result indicates that the assimilation process reduces model bias in the upper troposphere, demonstrating the ability of the assimilation system to adjust the model state to be more consistent with observational data in this layer, where such observations are abundant, in agreement with the findings of Zheng et al. [2].
Figure 7.
Time series (Hovmöller diagram) of the global mean (upper panels) and standard deviation (lower panels) of the OmF (a) and the OmA (b) of the IRLW horizontal wind component () (in m/s) observations assimilated by the GSI in the CNT experiment during February 2024.
In the analysis of the standard deviation data (lower panels of Figure 7), it is observed that in the upper troposphere, there is a decrease in the uncertainty of the analysis in relation to the predictions of the model, especially between the levels of 400 and 200 hPa, a band associated with the cold cloud tops, where the generation of AMVs by the IRLW channel is common. This reduction in dispersion indicates that GOES AMVs contribute to constraining the analysis, thereby reducing its uncertainty at these levels.
3.2. Evaluation of the Contribution of GOES AMVs to the Forecasts
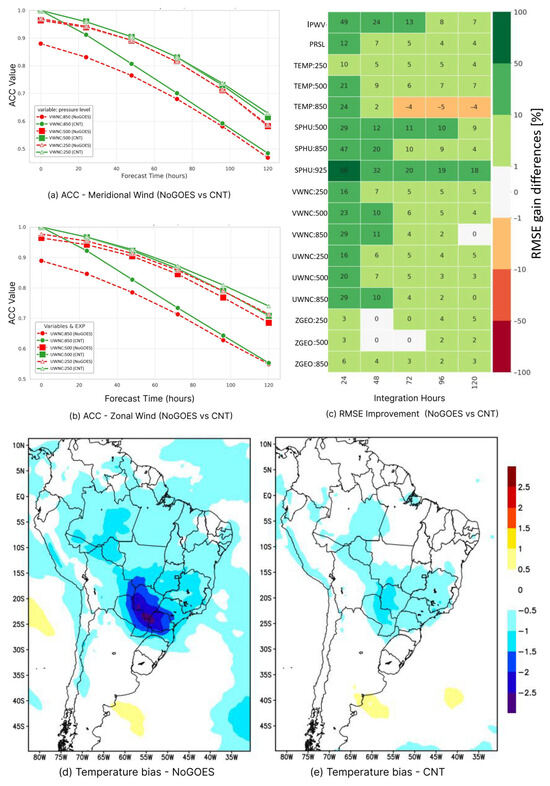
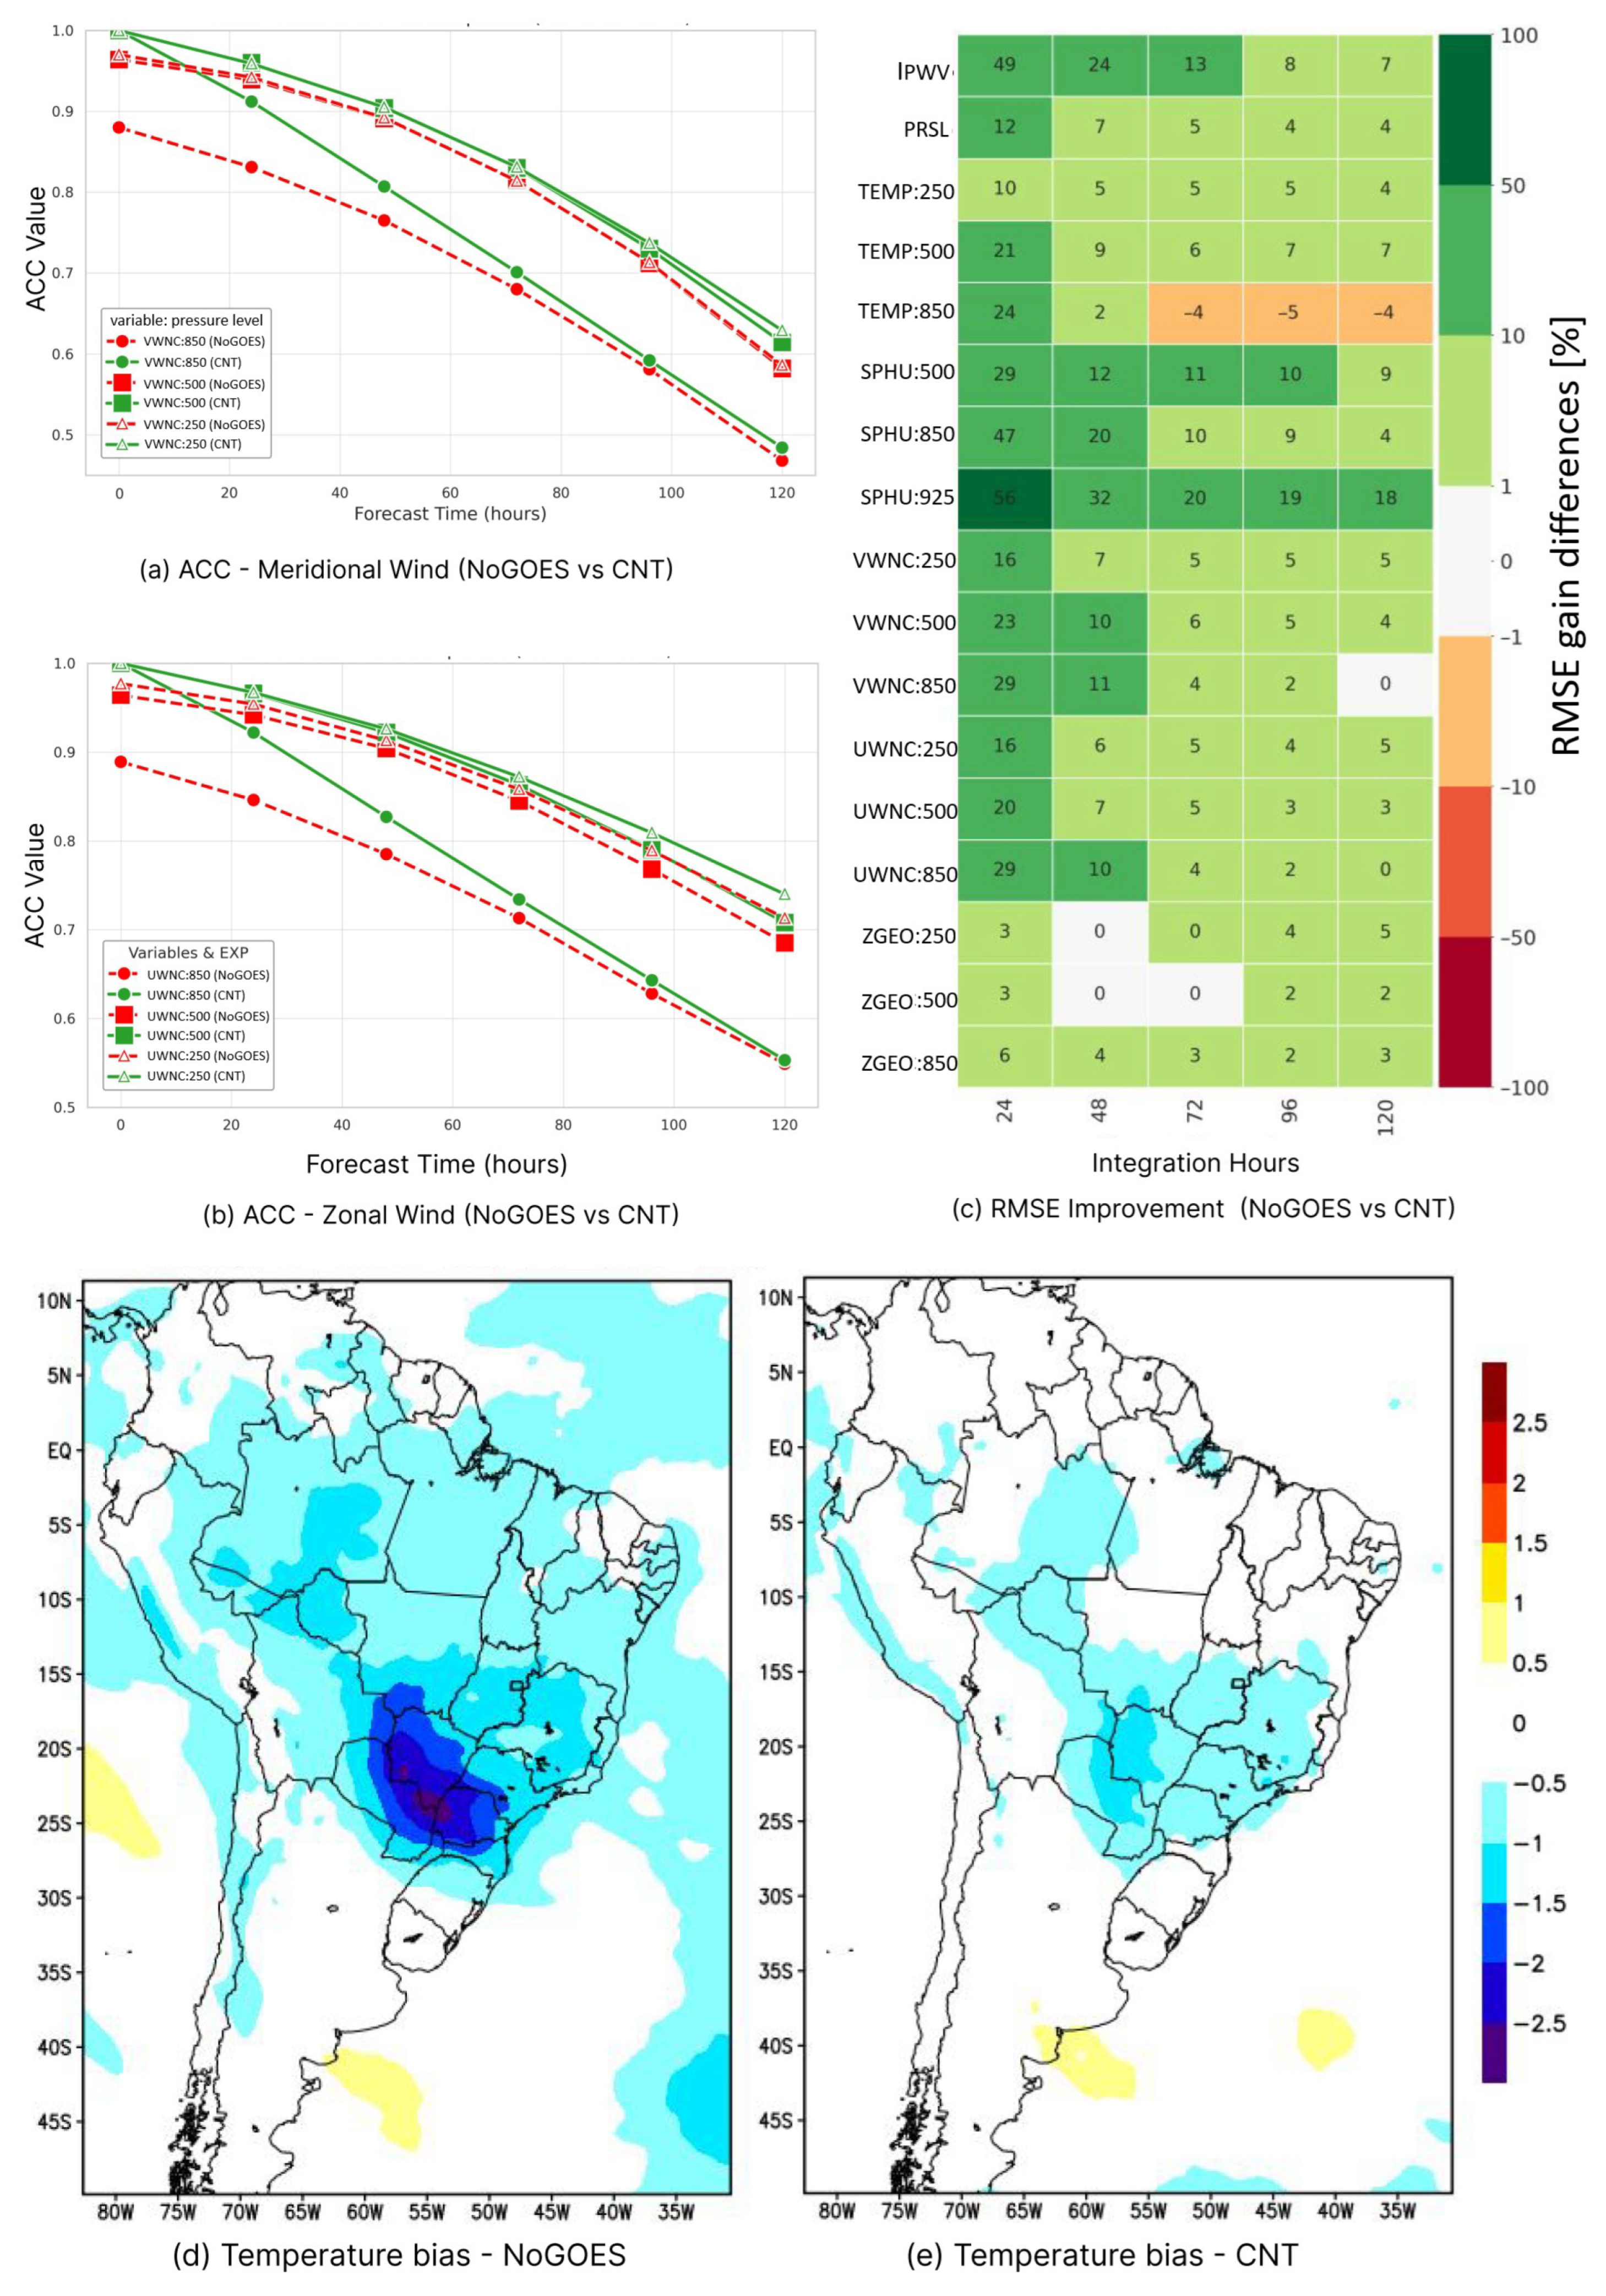
This subsection evaluates the impact of assimilating GOES AMV wind vectors on SMNA forecasts for the NoGOES and CNT experiments using ACC, RMSE, and bias metrics. Figure 8a,b show the ACC of the meridional and zonal wind components, respectively, as a function of model integration time for the NoGOES and CNT experiments at 850, 500, and 250 hPa. Figure 8c presents a scorecard diagram summarizing all RMSE improvements or degradations in the NoGOES experiment relative to CNT for multiple variables across different pressure levels and forecast ranges. The NoGOES experiment serves as the reference in this analysis, so an improvement (green tone in the scorecard) is characterized by lower RMS values in the CNT experiment compared to NoGOES. Figure 8d,e present the spatial distribution of the mean temperature bias at 500 hPa with a forecast of 72 h for the NoGOES and CNT experiments, respectively, to spatially characterize this statistic over South America.
Figure 8.
(a) Anomaly correlation coefficient (ACC) of the meridional wind component at 850, 500, and 250 hPa; (b) same as (a), but for the zonal component; (c) scorecard showing the percentage gain in RMSE for different variables [such as integrated precipitable water vapor (IPWV) and pressure reduced to sea level (PRSL) at surface, temperature (TEMP), specific humidity (SPHU), zonal (VWNC), meridional (UWNC) wind components and geopotential height (ZGEO) in different levels] and forecast times, using the NoGOES experiment as reference; (d) spatial distribution of mean temperature bias at 500 hPa after 72 h of forecast in the NoGOES experiment; (e) same as (d), but for the CNT experiment.
The ACC results in Figure 8a,b show that the CNT experiment maintains higher values (even if only slightly) than NoGOES throughout the forecast period, at all levels considered. The most relevant differences occur at 850 hPa, particularly during the first 48 h, when correlations in CNT remain above 0.85, whereas in NoGOES, they quickly decrease to values near 0.80. At higher levels (500 and 250 hPa), both experiments start with correlations close to 1, but experiment CNT consistently shows better performance over the entire integration. Although correlations decrease with time at all levels, the advantage of CNT persists up to 120 h, especially in the mid and upper troposphere. Figure 8b shows a similar behavior for the zonal wind component, though with slightly higher initial correlations at all levels.
Figure 8c shows the percentage gain in RMSE of the CNT experiment relative to NoGOES. Experiment CNT generally outperforms NoGOES across most variables and levels up to 120 h of model integration. The most significant improvements are observed in the first 24 h in humidity and wind fields. The greatest gains occur in specific humidity, particularly at 925 hPa, with improvements exceeding 50% in the first 24 h and remaining above 18% after 120 h of forecast. Positive results are also found at 850 and 500 hPa, which consistently maintained positive values throughout the forecast period. Integrated precipitable water vapor (IPWV) shows a similar behavior, with gains near 50% in the first 24 h and still positive at the end of the forecast. This improvement in the predicted moisture field, introduced by wind observations, can be explained, firstly, by the forecast error correlation B, which allows satellite wind observations to adjust other model variables to the initial condition generated by the assimilation system. Furthermore, the improvement in the wind field is reflected in the moisture by the better positioning of convergence and divergence areas, both at low and high levels. Once the whole atmospheric state is improved by the AMV data at the initial condition, the model dynamics and physical parameterization are able to transport that improvement through forecast variables. Consequently, the IPWV variable reflects the improvement in specific moisture fields from the low to the mid-troposphere. For temperature, improvements are evident at 250 and 500 hPa (between 5% and 21%), but at 850 hPa, a degradation is observed after 72 h, reaching values of up to –5%. Wind components (UWNC and VWNC) exhibit error reductions at all levels, particularly at 850 hPa and 500 hPa, with gains of 20–29% early in the forecast, and decreasing to nearly zero after 120 h.
Figure 8d,e show that the inclusion of GOES AMVs significantly reduces the bias in 72 h forecasts. Biases are predominantly negative in this region (blue tones in both panels), indicating that the model tends to underestimate temperature throughout much of tropical and subtropical South America. With the assimilation of GOES AMVs, the spatial extent of these biases decreases. In regions where the biases are most intense, such as the broad area of negative bias centered over southern Brazil, Paraguay, and northern Argentina, with magnitudes exceeding −2.5 °C, the negative values are consistently reduced. The impact of assimilated wind data is sufficiently strong to influence mass flux and improve temperature forecasts, thereby reducing bias. This reduction is particularly evident in the Akará region, where the negative bias observed in the NoGOES experiment is eliminated once GOES data are assimilated.
3.3. Case Study: Contribution of GOES AMVs to the Predictability of the Akará Event
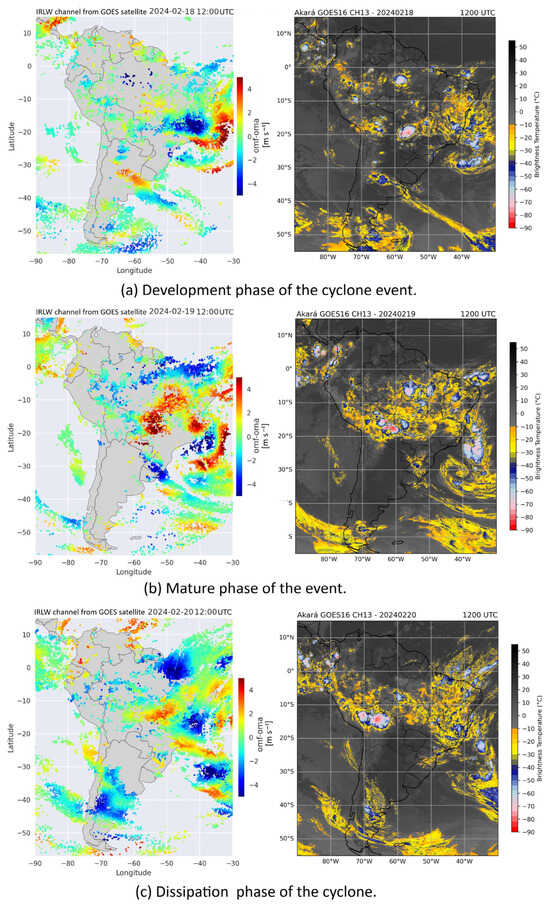
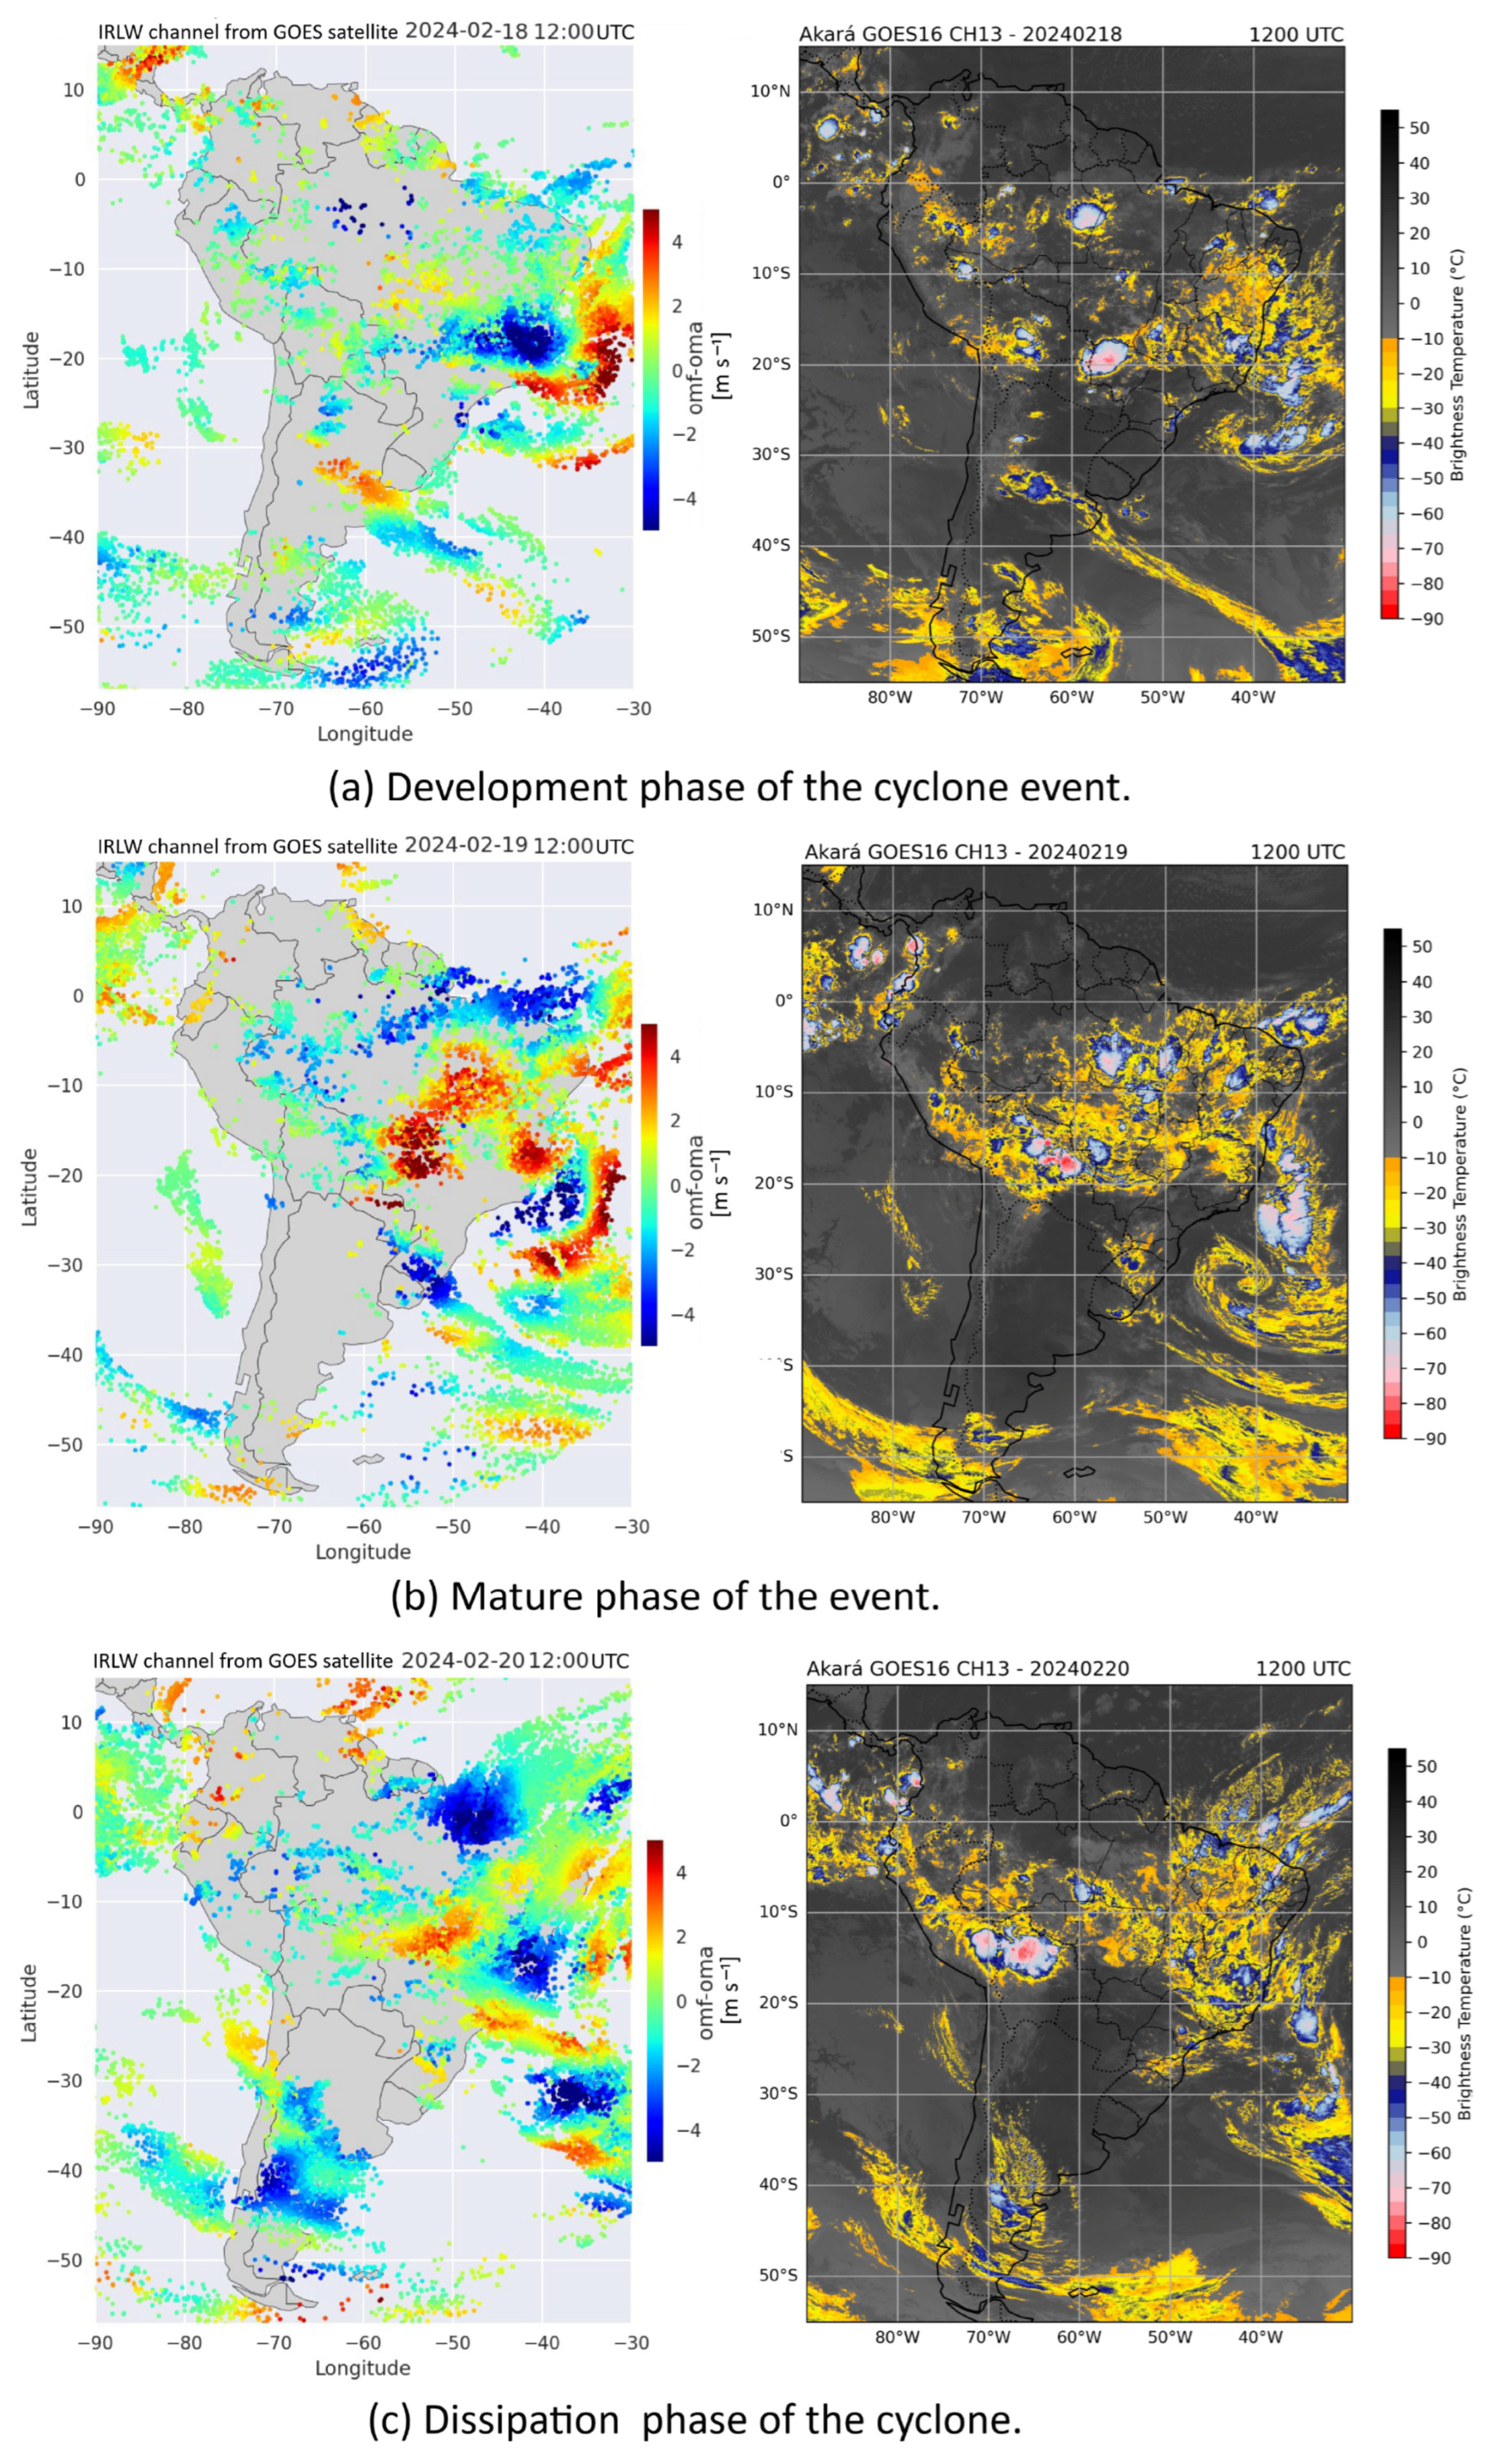
Wind data from the CNT experiment were used to evaluate the atmospheric circulation associated with Akará cyclone during its three main stages: formation, intensification, and dissipation, providing a consistent spatial characterization of the atmosphere during the study period. Evaluating the impact of assimilating these vectors in the analysis and forecasting of extreme events is of particular importance to understand how these data contribute to reducing errors and improving the representation of the system’s evolution during the different stages of this phenomenon. To investigate this influence, a joint analysis was performed between the infrared channel images (10.3 μm) from GOES and the OmF–OmA difference fields corresponding to the horizontal wind components (uv) (in m/s) to the AMVs from the IRLW channel. The evaluation covers 18, 19, and 20 February, 2024, at 12 UTC each day. The OmF–OmA difference, defined by Equation (3), represents the observation-space representation of the analysis increment indicating how much the assimilation of the data has modified the state of the model, with positive values interpreted as an acceleration of the atmospheric circulation in the analysis field relative to the model forecast, and negative values indicating a deceleration of this circulation.
In other words, the OmF–OmA difference, as defined above, represents the analysis increment at the locations of the AMVs. Figure 9 shows the spatial distribution of the OmF–OmA differences of the horizontal wind components (uv) (in m/s) (on the left panel) compared with GOES-16 channel showing 13 images (on the right panel), highlighting areas of higher convective activity. In this evaluation, the date of 18 February 2024 (Figure 9a) was chosen for an analysis of the system’s organization phase, while 19 February 2024 (Figure 9b) was selected as it represents the peak of maximum activity of the event and 20 February 2024 (Figure 9c) for an analysis of the beginning of the dissipation phase of the event.
Figure 9.
Spatial distribution of the OmF–OmA of the horizontal wind components’ (uv) (in m/s) difference (left panels) and images from channel 13 of the GOES satellite (right panels) on the days: (a) 18—during the development of the cyclone; (b) 19—during the mature phase of the event; and (c) 20—during the dissipation phase of the event, for February 2024 at 12 UTC.
In the development of Akará cyclone (12 UTC on 18 February 2024) (Figure 9a), positive and negative cores near the southeast coast of Brazil already reveal significant adjustments, with deceleration in some sectors (positive signals) and acceleration in others (negative signals). In the mature phase (Figure 9b), the patterns become broad and organized around the system, indicating a strong influence of the assimilation on the representation of the cyclonic circulation. During dissipation (12 UTC on 20 February 2024) (Figure 9c), the signals appear more fragmented and of lower magnitude, consistent with the weakening of the system. The adjacent brightness temperature images (GOES-16, infrared channel) show very cold tops and convective organization in the mature phase, in contrast to warmer tops and reduced convection during dissipation, corroborating the consistency between the diagnostic adjustments (OmF–OmA) and the structure observed by the satellite.
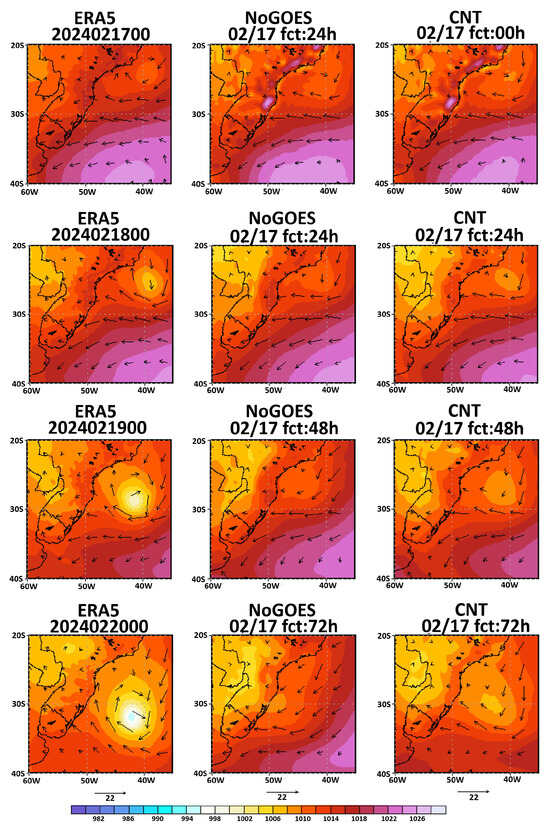
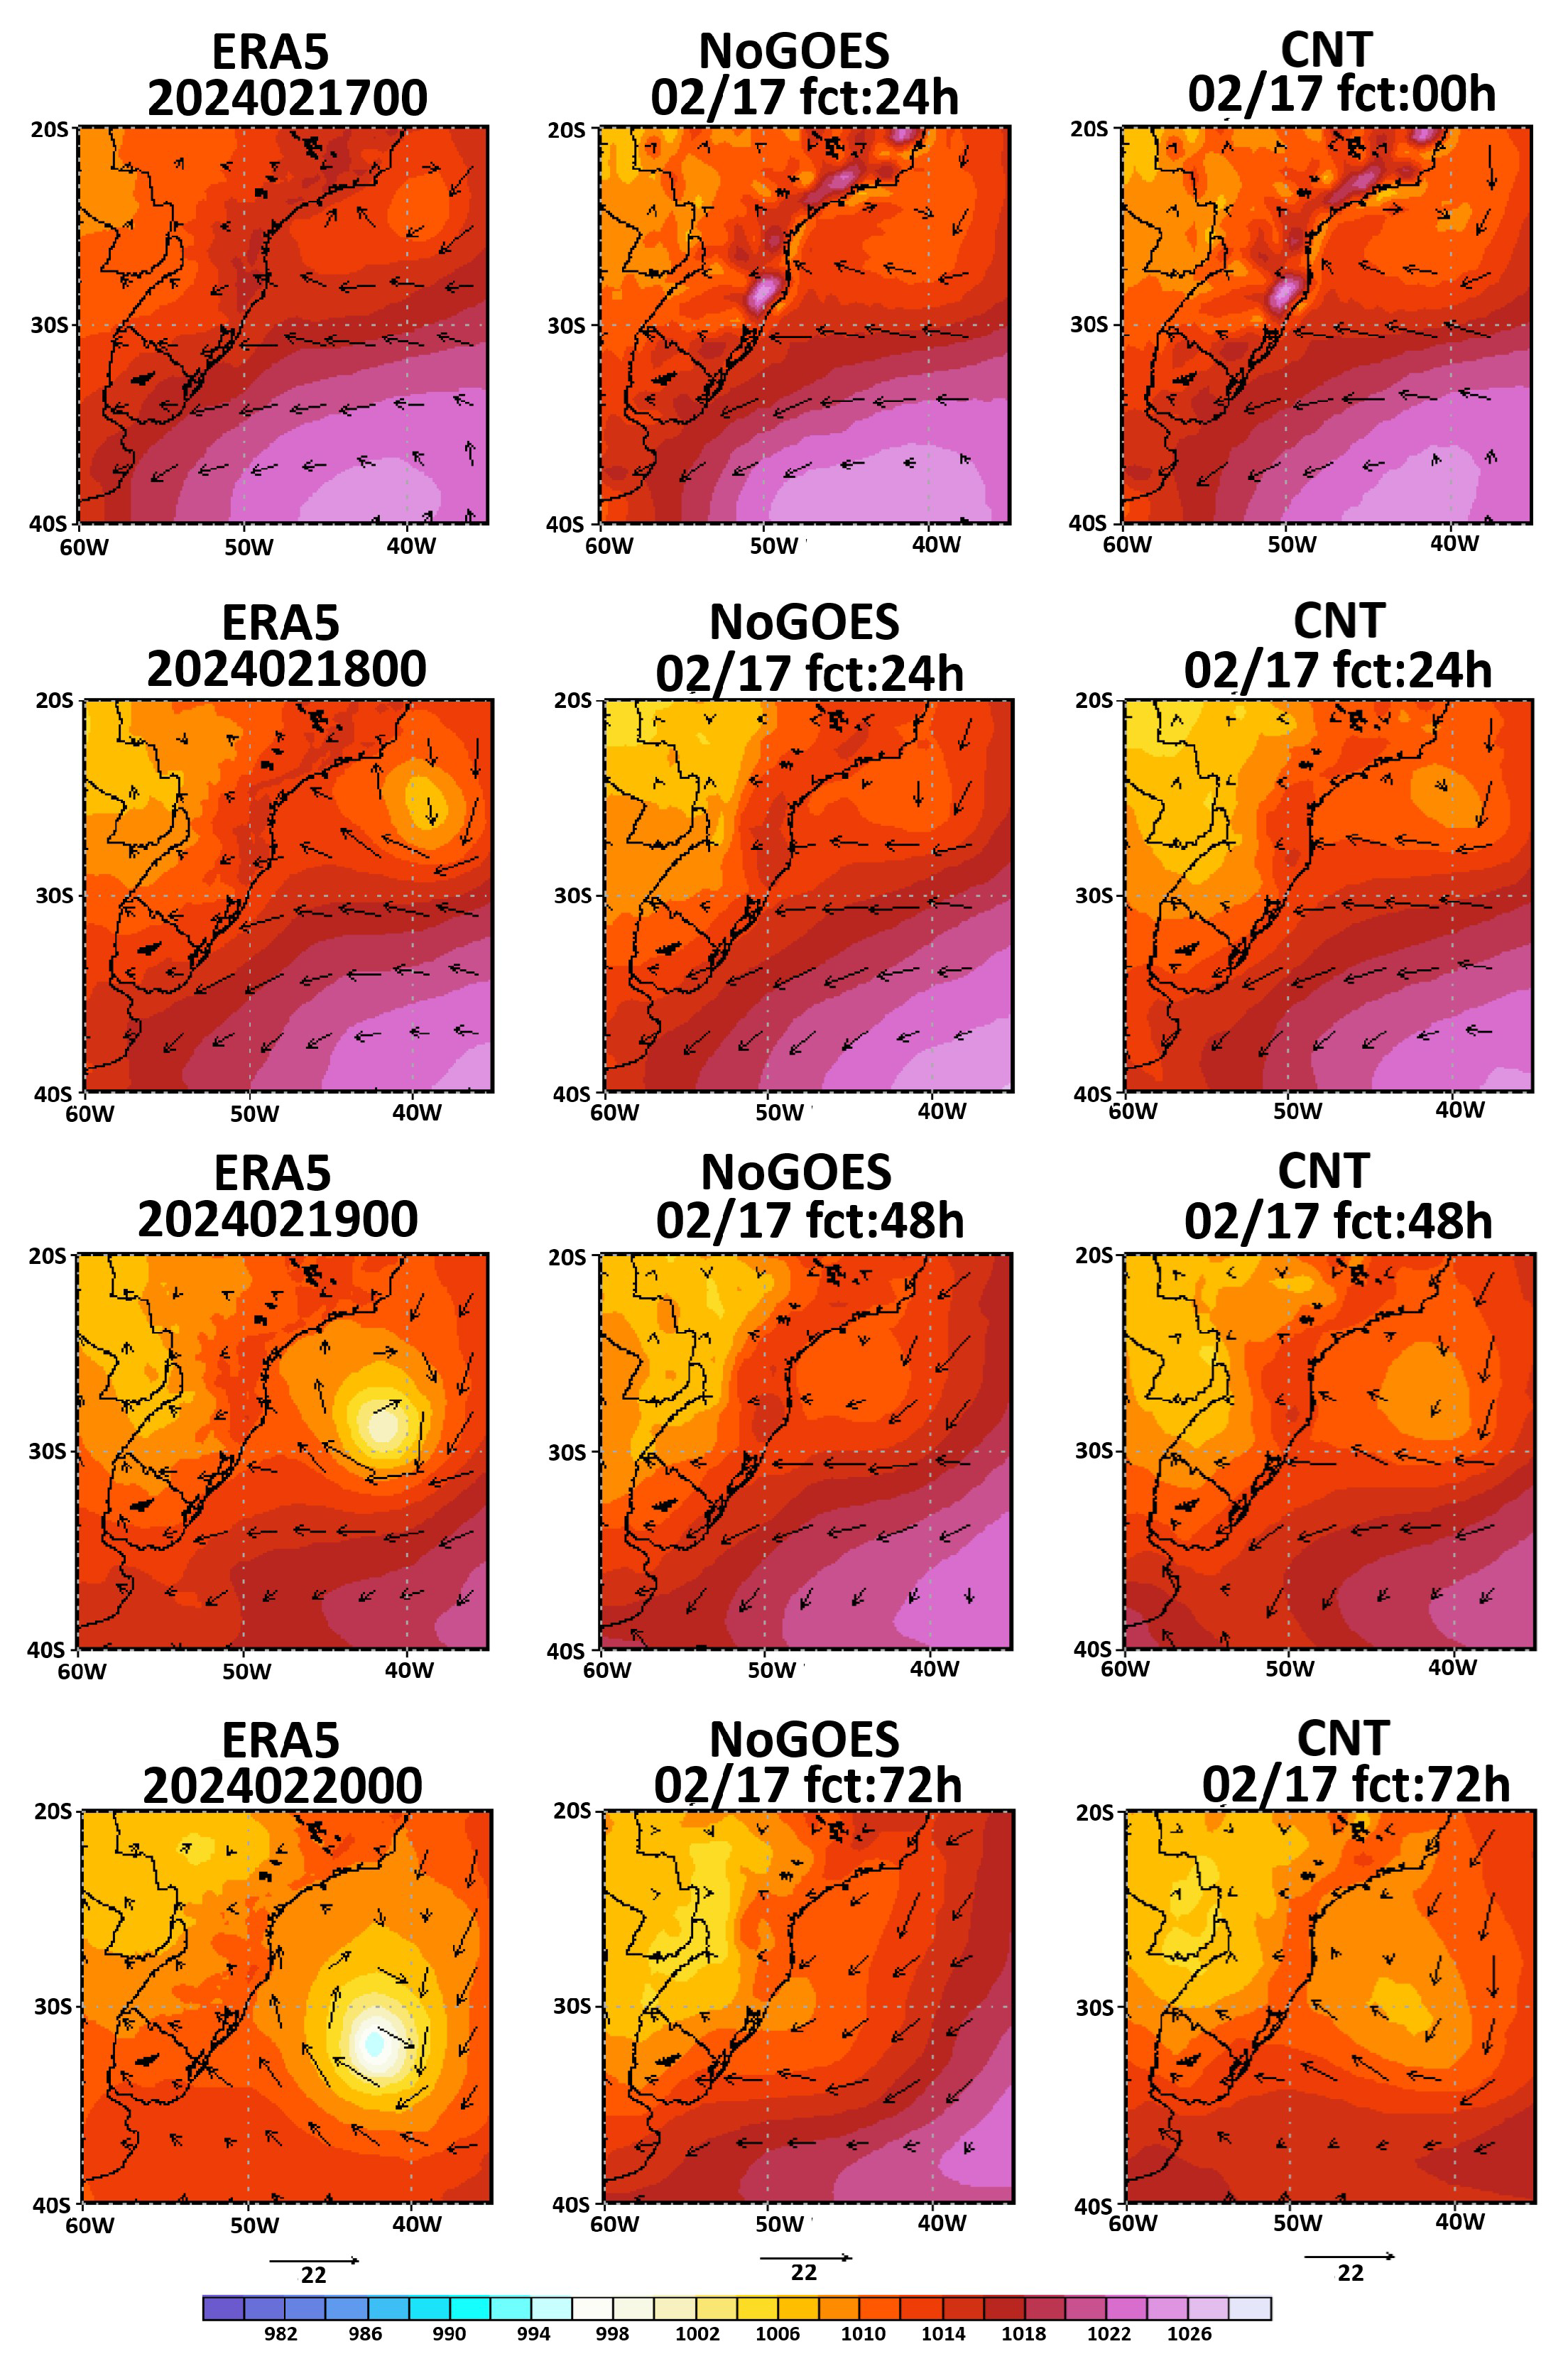
The impact of assimilating GOES AMV wind vectors on the predictability of the Akará cyclone was further assessed by comparing forecasts from the CNT and NoGOES experiments with ERA5 reanalysis.
Figure 10 presents the 0, 24, 48, and 72 h forecasts of the Akará cyclone initialized at 00 UTC on 17 February 2024, comparing its development in the CNT and NoGOES experiments and illustrating the system’s evolution through formation, intensification, maturation, and early dissipation. On 17 February at 12 UTC, when the event had not yet been classified as a tropical storm and was still in its formation phase, the CNT experiment reproduced a low-pressure center with intensity close to that of the reanalysis, although over a more confined area. In contrast, the NoGOES experiment failed to represent this low-pressure center. A similar situation occurs at 12 UTC on 18 February, where the CNT experiment reproduces both the low-pressure center and the associated wind circulation. However, the NoGOES experiment still does not clearly represent the event.
Figure 10.
Simulated wind and sea level pressure fields from CNT experiments (right panels—with GOES AMVs assimilation) and NoGOES (middle panel—without GOES AMVs assimilation), compared to the ERA-5 reanalysis (left panels) at 0, 24, 48, and 72 h starting from the initialization 00 UTC 17 February 2024.
When Akará cyclone is officially classified as a tropical storm by the Brazilian Navy on 19 February [20], the 48 h forecast from the NoGOES experiment still fails to identify the low-pressure center near the coast. In contrast, the CNT experiment can represent it, although with an intensity lower than that observed in the ERA-5 reanalysis. Finally, in the 72 h forecast (20 February), the NoGOES experiment again does not represent the event, whereas the CNT experiment can simulate the cyclonic circulation, though with intensity and position differing from the ERA-5 reference. Overall, the results suggest that assimilating GOES AMV data may have contributed to improvements in forecasts of the Akará cyclone, particularly in its positioning, intensity, and structure across its different evolution phases.
4. General Discussion About Results
The assimilation of AMV data derived from the geostationary GOES satellite series presented positive impacts on the analysis quality and improved the NWP over the South America region, in particular in the representation of the Akará cyclone. The diagnostic analysis of the assimilation process indicated a substantial increase in the relative contribution of wind observations in the minimization of the 3DVar cost function, and a consistent reduction in differences between the short-range forecast and the analysis, especially in the mid and upper troposphere, where AMV data is more plentiful.
The assimilated AMVs are predominantly concentrated between 150 and 300 hPa, associated with cold cloud tops observed in water vapor channels. This concentration was crucial in adjusting the wind field around the Akará cyclone during its intensification, as shown by the OmF–OmA fields. However, positive increment analysis located near the cyclone center suggests possible limitations in cloud height assignment or in the quality of the vectors in this region, which represents a continuous challenge, as reported by [21] for tropical systems in the South Atlantic.
The forecast quality evaluation obtained with GOES AMV data assimilation demonstrated consistent improvements. A reduction in RMSE was observed for several variables, including wind and temperature at different levels. Notably, the reduction in temperature bias at 500 hPa was primarily due to the indirect effect of AMVs assimilation. By adjusting the wind field, the assimilation system induced coherent dynamic changes in the atmospheric state, resulting in a more accurate representation even for variables not directly observed. A similar effect was reported in [44] in Observing System Experiments (OSEs).
For the specific case of the Akará cyclone, simulations with AMVs assimilation reproduced the position, intensity, and circulation structure more accurately throughout its life cycle. The greatest benefit was observed during the intensification phase, when the density and quality of AMVs were highest in the cyclone’s central region. These results support the hypothesis that assimilating wind vectors with high temporal and spatial resolution is particularly effective in forecasting extreme events in the South Atlantic, consistent with the conclusions of [21,33] regarding the sensitivity of such systems to the quality of initial conditions. While this study prioritizes the evaluation of AMV’s impact within a configuration mirroring the CPTEC operational environment, we recognize that height assignment remains a primary source of uncertainty. Future work will leverage CPTEC-derived AMV products to specifically investigate alternative height assignment algorithms and their influence on the representation of the South Atlantic atmospheric circulation.
5. Conclusions
In conclusion, the results presented here demonstrate that assimilating AMVs from GOES-16 and GOES-18 into the SMNA system was effective in improving both analyses and forecasts, providing clear benefits for the representation of the Akará cyclone. The inclusion of AMVs enhanced the initial conditions and made the wind field more coherent, especially in the mid and upper troposphere. Forecast performance also improved, with gains in RMSE and anomaly correlation for wind, temperature, and humidity, particularly with reduced biases in temperature and humidity. In the case study of Akará cyclone, assimilation improved the cyclone’s representation, enabling more accurate reproduction of its position, intensity, and circulation structure compared to ERA-5 reanalysis, with the largest benefits during the intensification phase, when AMVs density and quality were highest near the system’s center. Considering that the Akará cyclone had a very unusual genesis, the results reported in this study on its predictability can serve as a benchmark for future work, demonstrating the positive impact of improvements in data assimilation and modeling in this region.
Improved predictability becomes increasingly important for cyclonic events in the South Atlantic, which, under climate change, have been observed with not only higher frequency [45] but also greater intensity [46]. Given the results presented, expanding the fleet of satellites dedicated to meteorological monitoring over South America, such as the proposed Brazilian Geostationary Meteorological Satellite, represents a strategic and highly promising investment to meet the growing demand for high-quality weather forecasts in the region.
Author Contributions
Conceptualization, formal analysis, results organization and initial draft, L.O.B. and L.F.S.; Evaluation methodology, L.F.S., I.H.B. and C.V.; Evaluation software, C.V., C.F.B., V.A.R., S.S.S.A. and J.G.Z.d.M.; Radiosonde validation, T.G.L. and C.V.; Cyclone analysis, V.A.R.; Data assimilation system, E.P.V. and J.A.A.; Experimental Design, J.A.A. and L.F.S.; Writing review and final editing, I.H.B. and L.F.S.; Funding acquisition, J.A.A. All authors have read and agreed to the published version of the manuscript.
Funding
This research was funded in part by National Council for Scientific and Technological Development (CNPq, Brazil) Grant 304388/2022-0 and by the Coordenação de Aperfeiçoamento de Pessoal de Nível Superior—Brasil (CAPES)—Finance Code 001, and by MONAN/INPE Project through PO 216W.0005, which provided computational infrastructure.
Data Availability Statement
The GSI diagnostic files analyzed during the current study are accessible at this repository: http://ftp.cptec.inpe.br/pesquisa/das/luiz.sapucci/GOESmdpi (accessed on 30 March 2026).
Acknowledgments
The authors recognize that the preeminent contribution provided by the BAM group incorporated into the SMNA system, in the name of Paulo Kubota and Paulo Bonatti, is intended for all members of this group. Special thanks are due to Saulo Rabello Maciel Barros, in memoriam, whose advancement of SMNA was achieved through the hybrid vertical coordination he implemented.
Conflicts of Interest
The authors declare no conflicts of interest.
References
- Kalnay, E. Atmospheric Modeling, Data Assimilation, and Predictability; Cambridge University Press: Cambridge, UK, 2003; 341p. [Google Scholar]
- Zheng, M.; Ralph, F.M.; Wu, X.; Guan, B.; Waliser, D.; Genkova, I.; Monache, L.D.; Tallapragada, V.; Zhang, Z.; Santek, D.; et al. Comparison of GOES-17 Atmospheric Motion Vectors with AR Recon dropsonde data and assessment of wind fields in the Global Forecast System during atmospheric river events. J. Geophys. Res. Atmos. 2025, 130, e2024JD043267. [Google Scholar] [CrossRef] [Scilit]
- ECMWF. 50 Years of ECMWF; ECMWF: Reading, UK, 2025. [Google Scholar] [CrossRef]
- Salonen, K.; Cotton, J.; Bormann, N.; Forsythe, M. Characterizing AMV Height-Assignment Error by Comparing Best-Fit Pressure Statistics from the Met Office and ECMWF Data Assimilation Systems. J. Appl. Meteorol. Climatol. 2015, 54, 225–242. [Google Scholar] [CrossRef] [Scilit]
- Nguyen, H.; Posselt, D.; Yanovsky, I.; Wu, L.; Hristova-Veleva, S. Atmospheric Motion Vector (AMV) error characterization and bias correction by leveraging independent lidar data: A simulation using an observing system simulation experiment (OSSE) and optical flow AMVs. Atmos. Meas. Tech. 2024, 17, 3103–3119. [Google Scholar] [CrossRef] [Scilit]
- Velden, C.S.; Bedka, K.M. Identifying the Uncertainty in Determining Satellite-Derived Atmospheric Motion Vector Height Attribution. J. Appl. Meteorol. Climatol. 2009, 48, 450–463. [Google Scholar] [CrossRef] [Scilit]
- Borde, R.; Doutriaux-Boucher, M.; Dew, G.; Carranza, M. A direct link between feature tracking and height assignment of operational EUMETSAT Atmospheric Motion Vectors. J. Atmos. Ocean. Technol. 2014, 31, 33–46. [Google Scholar] [CrossRef] [Scilit]
- Leese, J.A.; Novak, C.S.; Clark, B.B. An Automated Technique for Obtaining Cloud Motion from Geosynchronous Satellite Data Using Cross Correlation. J. Appl. Meteorol. Climatol. 1971, 10, 118–132. [Google Scholar] [CrossRef] [Scilit]
- Velden, C.; Daniels, J.; Stettner, D.; Santek, D.; Key, J.; Dunion, J.; Holmlund, K.; Dengel, G.; Bresky, W.; Menzel, P. Recent Innovations in Deriving Tropospheric Winds from Meteorological Satellites. Bull. Am. Meteorol. Soc. 2005, 86, 205–224. [Google Scholar] [CrossRef] [Scilit]
- Lazzara, M.A.; Dworak, R.; Santek, D.A.; Hoover, B.T.; Velden, C.S.; Key, J.R. High-latitude Atmospheric Motion Vectors from composite satellite data. J. Appl. Meteorol. Climatol. 2014, 53, 534–547. [Google Scholar] [CrossRef] [Scilit]
- Daniels, J.; Bresky, W.; Bailey, A.; Allegrino, A.; Velden, C.S.; Wanzong, S. Winds from ABI on the GOES-R Series. In The GOES-R Series; Goodman, S.J., Schmit, T.J., Daniels, J., Redmon, R.J., Eds.; Elsevier: Amsterdam, The Netherlands, 2020; pp. 79–94. [Google Scholar] [CrossRef] [Scilit]
- NOAA. GOES-R Series Program Overview and Satellite Status. NOAA GOES-R Program Office. 2025. Available online: https://www.goes-r.gov (accessed on 30 March 2026).
- Santek, D.; Dworak, R.; Nebuda, S.; Wanzong, S.; Borde, R.; Genkova, I.; García-Pereda, J.; Galante Negri, R.; Carranza, M.; Nonaka, K.; et al. 2018 Atmospheric Motion Vector (AMV) intercomparison study. Remote Sens. 2019, 11, 2240. [Google Scholar] [CrossRef] [Scilit]
- Kållberg, P.W.; Uppala, S.; Gustafsson, N.; Pailleux, J. The Impact of Cloud Track Wind Data on Global Analyses and Medium Range Forecasts; Report No. 34; ECMWF: Reading, UK, 1982. [Google Scholar]
- Ciardullo, G.; Primavera, L.; Ferrucci, F.; Lepreti, F.; Carbone, V. New Investigation of a Tropical Cyclone: Observational and Turbulence Analysis for the Faraji Hurricane. Remote Sens. 2023, 15, 1383. [Google Scholar] [CrossRef] [Scilit]
- Liu, H.-Y.; Satoh, M.; Gu, J.-F.; Lei, L.; Tang, J.; Tan, Z.-M.; Wang, Y.; Xu, J. Predictability of the Most Long-Lived Tropical Cyclone Freddy (2023) During Its Westward Journey Through the Southern Tropical Indian Ocean. Geophys. Res. Lett. 2023, 50, e2023GL105729. [Google Scholar] [CrossRef] [Scilit]
- Lim, A.H.N.; Jung, J.A.; Nebuda, S.E.; Daniels, J.M.; Bresky, W.; Tong, M.; Tallapragada, V. Tropical cyclone forecasts impact assessment from the assimilation of hourly visible, shortwave, and clear-air water vapor Atmospheric Motion Vectors in HWRF. Weather Forecast. 2019, 34, 177–198. [Google Scholar] [CrossRef] [Scilit]
- Li, J.; Li, J.; Velden, C.; Wang, P.; Schmit, T.J.; Sippel, J. Impact of rapid-scan-based dynamical information from GOES-16 on HWRF hurricane forecasts. J. Geophys. Res. Atmos. 2020, 125, e2019JD031647. [Google Scholar] [CrossRef] [Scilit]
- Lim, A.H.N.; Jung, J.A.; Nebuda, S.E.; Daniels, J.M.; Bresky, W.; Tong, M.; Mehra, A.; Tallapragada, V. Optimizing the assimilation of the GOES-16/17 Atmospheric Motion Vectors in the HWRF model for tropical cyclone prediction. Remote Sens. 2022, 14, 3068. [Google Scholar] [CrossRef] [Scilit]
- Marinha do Brasil. Tempestade Tropical Akará: Relatório Pós-Evento; Centro de Hidrografia da Marinha, Serviço Meteorológico Marinho: Rio de Janeiro, Brazil, 2024. Available online: https://www.marinha.mil.br/chm/sites/www.marinha.mil.br.chm/files/u1894/relatorio_pos_evento_akara.pdf (accessed on 22 August 2025).
- Reboita, M.S.; Nogueira, N.C.D.O.; Gomes, I.B.D.S.; Palma, L.L.D.C.; Da Rocha, R.P. Assessment of a Tropical Transition over the Southwestern South Atlantic Ocean: The Case of Cyclone Akará. J. Mar. Sci. Eng. 2024, 12, 1934. [Google Scholar] [CrossRef] [Scilit]
- Figueroa, S.N.; Bonatti, J.P.; Kubota, P.Y.; Grell, G.A.; Morrison, H.; Barros, S.R.M.; Fernandez, J.P.R.; Ramirez, E.; Siqueira, L.; Luzia, G.; et al. The Brazilian Global Atmospheric Model (BAM): Performance for Tropical Rainfall Forecasting and Sensitivity to Convective Scheme and Horizontal Resolution. Weather Forecast. 2016, 31, 1547–1551. [Google Scholar] [CrossRef] [Scilit]
- Kleist, D.T.; Parrish, D.F.; Derber, J.C.; Treadon, R.; Wu, W.-S.; Lord, S. Introduction of the GSI into the NCEP Global Data Assimilation System. Weather Forecast. 2009, 24, 1691–1705. [Google Scholar] [CrossRef] [Scilit]
- Bauer, P.; Thorpe, A.; Brunet, G. The quiet revolution of numerical weather prediction. Nature 2015, 525, 47–55. [Google Scholar] [CrossRef] [Scilit]
- Banos, I.H.; Mayfield, W.D.; Ge, G.; Sapucci, L.F.; Carley, J.R.; Nance, L. Assessment of the data assimilation framework for the Rapid Refresh Forecast System v0.1 and impacts on forecasts of a convective storm case study. Geosci. Model Dev. 2022, 15, 6891–6917. [Google Scholar] [CrossRef] [Scilit]
- Velden, C.S.; Hayden, C.M.; Nieman, S.J.W.; Menzel, W.P.; Wanzong, S.; Goerss, J.S. Upper-Tropospheric Winds Derived from Geostationary Satellite Water Vapor Observations. Bull. Am. Meteorol. Soc. 1997, 78, 173–196. [Google Scholar] [CrossRef] [Scilit]
- Machado, L.A.T.; Ceballos, J.C. Satellite-based products for monitoring weather in South America: Winds and trajectories. In Proceedings of the 5th International Winds Workshop, Lorne, Australia, 28 February–3 March 2000. [Google Scholar]
- Negri, R.G.; Machado, L.A.T. Estimativa do Vento para os Baixos Níveis Utilizando Imagens dos Canais Visível e Infravermelho Próximo 3.9 μm. Rev. Bras. Meteorol. 2008, 23, 206–218. [Google Scholar] [CrossRef] [Scilit]
- Negri, R.G.; Aseff, C.R.; Vendrasco, E.P.; Sapucci, L.F. Status of Atmospheric Motion Vectors production and use at CPTEC/INPE. In Proceedings of the 16th International Winds Workshop, Montréal, QC, Canada, 8–12 May 2023. [Google Scholar]
- Daniels, J.M.; Bresky, W.; Wanzong, S.; Bailey, J.; Velden, C. The GOES-R Advanced Baseline Imager (ABI) Atmospheric Motion Vector (AMV) Algorithm. J. Atmos. Ocean. Technol. 2016, 33, 1863–1884. [Google Scholar] [CrossRef] [Scilit]
- Nieman, S.J.; Menzel, W.P.; Hayden, C.M.; Gray, D.; Wanzong, S.T.; Velden, C.S.; Daniels, J. Fully automated cloud-drift winds in NESDIS operations. Bull. Am. Meteorol. Soc. 1997, 78, 1121–1134. [Google Scholar] [CrossRef] [Scilit]
- Bormann, N.; Thépaut, J.-N.; Kelly, G. Atmospheric Motion Vectors from Model Simulations. Part I: Methods and Characterization as Single-Level Estimates of Wind. J. Appl. Meteorol. 2002, 41, 1083–1096. [Google Scholar] [CrossRef] [Scilit]
- Pezza, A.B.; Simmonds, I. The first South Atlantic hurricane: Unprecedented blocking, low shear and climate change. Geophys. Res. Lett. 2005, 32, L15712. [Google Scholar] [CrossRef] [Scilit]
- Reboita, M.S.; Crespo, N.M.; Dutra, L.M.M.; Silva, B.A.; Capucin, B.C.; Da Rocha, R.P. Iba: The First Pure Tropical Cyclogenesis Over the Western South Atlantic Ocean. J. Geophys. Res. Atmos. 2021, 126, e2020JD03343. [Google Scholar] [CrossRef] [Scilit]
- de Souza, D.C.; Ranieri, V.A.; da Silva Dias, P.L.; Flores, A.R.; de Camargo, R. Revisiting the Rare Transition of a South Atlantic Cyclone to Tropical Storm Akará: Energy Cycle and Stratosphere–Troposphere Interaction. Clim. Dyn. 2026, 64, 94. [Google Scholar] [CrossRef] [Scilit]
- Banos, I.H.; Sapucci, L.F.; Cucurull, L.; Bastarz, C.F.; Silveira, B.B. Assimilation of GPSRO bending angle profiles into the Brazilian global atmospheric model. Remote Sens. 2019, 11, 256. [Google Scholar] [CrossRef] [Scilit]
- Derber, J.C.; Rosati, A. A global oceanic data assimilation system. J. Phys. Oceanogr. 1989, 19, 1333–1347. [Google Scholar] [CrossRef] [Scilit]
- Hu, M.; Shao, H.; Stark, D.; Newman, K.; Zhou, C.; Zhang, X. Grid-Point Statistical Interpolation (GSI) User’s Guide Version 3.5; DTC: Boulder, CO, USA, 2016; 141p, Available online: https://dtcenter.org/sites/default/files/GSIUserGuide_v3.5.pdf (accessed on 30 March 2026).
- Hu, M.; Guoqing, G.; Zhou, C.; Stark, D.; Shao, H.; Newman, K.; Beck, J.; Zhang, X. Grid-Point Statistical Interpolation (GSI) User’s Guide Version 3.7; DTC: Boulder, CO, USA, 2018; 149p, Available online: https://dtcenter.org/sites/default/files/GSIUserGuide_v3.7.pdf (accessed on 30 March 2026).
- Hersbach, H.; Bell, B.; Berrisford, P.; Hirahara, S.; Horányi, A.; Muñoz-Sabater, J.; Nicolas, J.; Peubey, C.; Radu, R.; Schepers, D.; et al. The ERA5 global reanalysis. Q. J. R. Meteorol. Soc. 2020, 146, 1999–2049. [Google Scholar] [CrossRef] [Scilit]
- Joseph, J.J.; Meenal, R.; Josh, F.T.; Michael, P.A.; Krishnamoorthy, V.K.; Chandran, G.; Veerabathran, S. Weather observation and forecasting using radiosonde. Telkomnika Telecommun. Comput. Electron. Control 2022, 20, 1376–1386. [Google Scholar] [CrossRef] [Scilit]
- Kinoshita, T.; Ogino, S.-Y.; Suzuki, J.; Shirooka, R.; Sugidachi, T.; Shimizu, K.; Hitchman, M.H. Toward Standard Radiosonde Observations of Waves and the Mean State in the 30–40-km Altitude Range Using 3-kg Balloons. J. Atmos. Ocean. Technol. 2022, 39, 849–860. [Google Scholar] [CrossRef] [Scilit]
- Laroche, S.; Sarrazin, R. Impact of Radiosonde Balloon Drift on Numerical Weather Prediction and Verification. Weather Forecast. 2013, 28, 772–782. [Google Scholar] [CrossRef] [Scilit]
- De Azevedo, H.B.; de Gonçalves, L.G.G.; Bastarz, C.F.; Silveira, B.B. Observing System Experiments in a 3DVar Data Assimilation System at CPTEC/INPE. Weather Forecast. 2017, 32, 873–880. [Google Scholar] [CrossRef] [Scilit]
- Lima, M.M.; Hurduc, A.; Ramos, A.M.; Trigo, R.M. The increasing frequency of tropical cyclones in the Northeastern Atlantic sector. Front. Earth Sci. 2021, 9, 745115. [Google Scholar] [CrossRef] [Scilit]
- Lopez, H.; Lee, S.-K.; West, R.; Kim, D.; Foltz, G.R.; Alaka, G.J.; Murakami, H. Projected increase in the frequency of extremely active Atlantic hurricane seasons. Sci. Adv. 2024, 10, eadq7856. [Google Scholar] [CrossRef] [Scilit]

Disclaimer/Publisher’s Note: The statements, opinions and data contained in all publications are solely those of the individual author(s) and contributor(s) and not of MDPI and/or the editor(s). MDPI and/or the editor(s) disclaim responsibility for any injury to people or property resulting from any ideas, methods, instructions or products referred to in the content. |
© 2026 by the authors. Licensee MDPI, Basel, Switzerland. This article is an open access article distributed under the terms and conditions of the Creative Commons Attribution (CC BY) license.