Article

Surface Ozone Increases over Northwest China Linked to North Pacific SST-Driven Warming

1
Key Laboratory of Textile Chemical Engineering Auxiliaries, School of Environmental and Chemical Engineering, Xi’an Polytechnic University, Xi’an 710048, China
2
Inspur Yunzhou Industrial Internet Co., Ltd., Jinan 250013, China
3
School of Systems Science, Beijing Normal University, Beijing 100875, China
*
Author to whom correspondence should be addressed.
Remote Sens. 2026, 18(11), 1800; https://doi.org/10.3390/rs18111800
Submission received: 27 March 2026 / Revised: 19 May 2026 / Accepted: 21 May 2026 / Published: 2 June 2026
(This article belongs to the Section Atmospheric Remote Sensing)

Highlights

What are the main findings?
  • A pronounced rise in summer surface ozone over Northwest China during 1993–2010 drove the long-term upward trend from 1980 to 2020.
  • Reduced low cloud cover led to warmer surface temperature, which contributed to increased ozone during 1993–2010.
  • Warming North Pacific sea surface temperatures led to reduced low cloud cover, further surface warming, and increased ozone concentrations.
What are the implications of the main findings?
  • This study provides evidence that decadal variability in North Pacific SST may serve as a potential predictor of long-term ozone changes through its modulation of regional atmospheric circulation patterns.

Abstract

Tropospheric ozone (O3) is a critical air pollutant that poses significant risks to human health and ecosystems. While previous studies have primarily focused on O3 changes in Eastern China, limited attention has been given to Northwest China, where fragile but ecologically important systems may be vulnerable to O3 pollution. The temporal evolution and driving mechanisms of surface O3 in this region remain poorly understood. Using the European Centre for Medium-Range Weather Forecasts Reanalysis Version 5 (ERA5) datasets and simulations from the Community Atmosphere Model with Chemistry (CAM-Chem), we identified a significant increase in summer surface O3 concentrations across Northwest China from 1980 to 2020, with the most pronounced rise occurring during 1993–2010. This period accounts for the majority of the long-term upward trend, despite relative declines before and after. The increase in O3 during 1993–2010 is primarily attributed to rising surface temperatures, which reduce hydroperoxyl radical (HO2) concentrations and enhance nitrogen dioxide (NO2) production, leading to elevated nitrogen oxides (NOx) levels and promoting O3 formation. The warming trend is closely associated with a concurrent decrease in low cloud cover, which increases surface shortwave radiation and further contributes to surface warming. Further investigation reveals that warming sea surface temperature (SST) in the North Pacific influence atmospheric circulation through wave train processes, amplifying the regional geopotential height field. These circulation changes reinforce the reduction in low cloud cover and the associated increases in surface temperature and O3 concentrations over Northwest China. The decadal variability of North Pacific SST may therefore serve as an important indicator of long-term surface ozone variability in this region.

1. Introduction

Surface ozone (O3), the third most potent greenhouse gas, is also a significant air pollutant at the Earth’s surface [1,2,3]. Elevated concentrations of O3 pose serious threats to human health, suppress plant growth, and intensify global warming [4,5]. In China, O3 has emerged as a significant air pollutant, ranking second only to fine particulate matter (PM2.5) [6,7]. Since 2000, surface O3 concentrations have increased substantially, with peak-season maximum daily 8-hour average (MDA8) ozone values consistently surpassing 95 µg/m3 from 2013 to 2019 [8,9]. During 2013–2017, the national average of the fourth-highest MDA8 O3 concentration reached 86 ppb, approximately 20–25% higher than that observed in Europe and the United States [10]. In response to deteriorating air quality, China has implemented stringent emission control policies, resulting in significant reductions in PM2.5 levels. However, O3 pollution remains a persistent and intensifying challenge, particularly in densely populated and economically developed regions [11,12].
The drivers of severe O3 pollution in China are multifaceted, reflecting a complex interplay among precursor emissions, meteorology, and atmospheric chemistry. Rapid economic development has driven increased fossil fuel consumption, particularly from industrial sources and automobiles, leading to higher emissions of multiple precursors, including volatile organic compounds (VOCS), carbon monoxide (CO), and nitrogen oxides (NOx), which enhance photochemical O3 production [13,14,15].
Despite substantial declines in anthropogenic emissions since 2013, meteorological conditions, such as surface temperature, have emerged as dominant contributors to persistent O3 pollution [16,17,18,19,20]. On the one hand, temperature directly influences the chemical reaction rates and emission rates (e.g., VOCS), both of which are closely linked to O3 production [21]. Moreover, high temperatures are often associated with sunny, dry, and stagnant atmospheric conditions, which further promote the accumulation of O3 [22]. In the summer of 2022, following record-high air temperatures in China, the MDA8 O3 concentration increased by 6.46 ± 13.0 µg/m3 compared to the average [23]. Gu et al. [22] examined the surface O3–temperature relationship in Shanghai, China, and found that summertime O3 levels rose more rapidly with increasing temperature, with mean rates of 6.65 and 13.68 ppb/°C at urban and remote sites, respectively, above 30 °C. In addition, some studies suggest that stratospheric intrusions can elevate surface O3 by injecting O3-rich air from the stratosphere into the lower troposphere [24]. Meng et al. [25] tracked the impact of stratospheric O3 intrusion on central and eastern China during the spring and summer of 2019, finding that direct intrusion contributed 15.8% and 16.7% to ground-level O3 in North China and East China, respectively, with indirect intrusion contributing even more.
Although previous studies have examined surface O3 changes and their influencing factors in China, most have concentrated on developed cities, particularly those in the eastern and southern regions [22,26]. Northwest China, characterized by ecological vulnerability, intense solar radiation, low humidity, frequent high-pressure systems, limited atmospheric diffusion capacity, and distinct emission profiles, presents environmental conditions that are highly conducive to photochemical O3 formation [27]. Despite ongoing investigations, comprehensive studies on the temporal trends, spatial patterns, and underlying drivers of O3 evolution in this region remain limited. Using the ERA5 reanalysis dataset and CAM-Chem model simulations, we identified a significant increasing trend of surface O3 in Northwest China over recent decades, with trends exceeding the 99% significance level (Figure 1a,b). However, this increase was not continuous; rather, O3 levels exhibited pronounced fluctuations across distinct periods (Figure 1c,d). Specifically, a slight decrease occurred from 1980 to 1993, followed by a substantial increase from 1993 to 2010, and a marked weakening trend from 2010 to 2020 (Figure 1c). These trends were corroborated by CAM-Chem simulations, which mirrored the significant increase from 1993 to 2010, and the subsequent weakening trend thereafter (Figure 1d). We therefore turn our attention to exploring the underlying mechanisms responsible for the increasing trends of O3 in Northwest China.

2. Data, Model and Method

2.1. Reanalysis Data

The fifth-generation ECMWF reanalysis (ERA5), provided by the European Center for Medium-Range Weather Forecasts (ECMWF), is a global dataset widely utilized in meteorological, climatological, and environmental research. It is publicly accessible at https://www.ecmwf.int/en/forecasts/datasets/reanalysis-datasets/era5 (accessed on 5 April 2023). The ERA5 dataset used in this study has a horizontal resolution of 1° longitude by 1° latitude, with vertical resolution covering 37 pressure levels, ranging from 1000 hPa to 1 hPa, spanning the period from 1980 to 2020.
We analyzed variations in sea surface temperature (SST) using data from the Hadley Center HadISST dataset [30], characterized by a horizontal resolution of 1° longitude by 1° latitude.

2.2. Model Simulation

We employed the latest version of the Community Atmosphere Model with Chemistry (CAM-Chem), specifically CAM6, an integral component of the Community Earth System Model (CESM, version 2.2.0), developed by the National Center for Atmospheric Research (NCAR) [31]. The model features 32 vertical levels extending from the Earth’s surface to 3.6 hPa, with a horizontal resolution of 0.95° by 1.25°, spanning the period from 1990 to 2020. Simulations were conducted using the off-line mode of the CAM-Chem model, with meteorological conditions nudged using ERA5 data at three-hour intervals. The CAM-Chem model demonstrates robust capabilities in simulating O3 and O3 precursors [32].
This study employed three separate model simulations. The first used the standard time-evolving emission data from the Coupled Model Intercomparison Project Phase 6 (CMIP6), referred to hereafter as the CMIP6 simulation. The second simulation applied the Multi-resolution Emission Inventory for China (MEIC; http://meicmodel.org/, accessed on 24 April 2022) to represent emissions within China, while emissions outside China remained based on CMIP6 data—this is termed the MEIC simulation. The MEIC inventory, developed by Tsinghua University in 2010, offers detailed anthropogenic emission estimates for China [33]. The third simulation also utilized MEIC data for China but kept emissions fixed at the 2010 levels and is called the MEIC–2010 simulation. To achieve comprehensive coverage of the period from 1990 to 2020 and incorporate the most reliable emission inventories, these three datasets were combined for the modeling experiments.
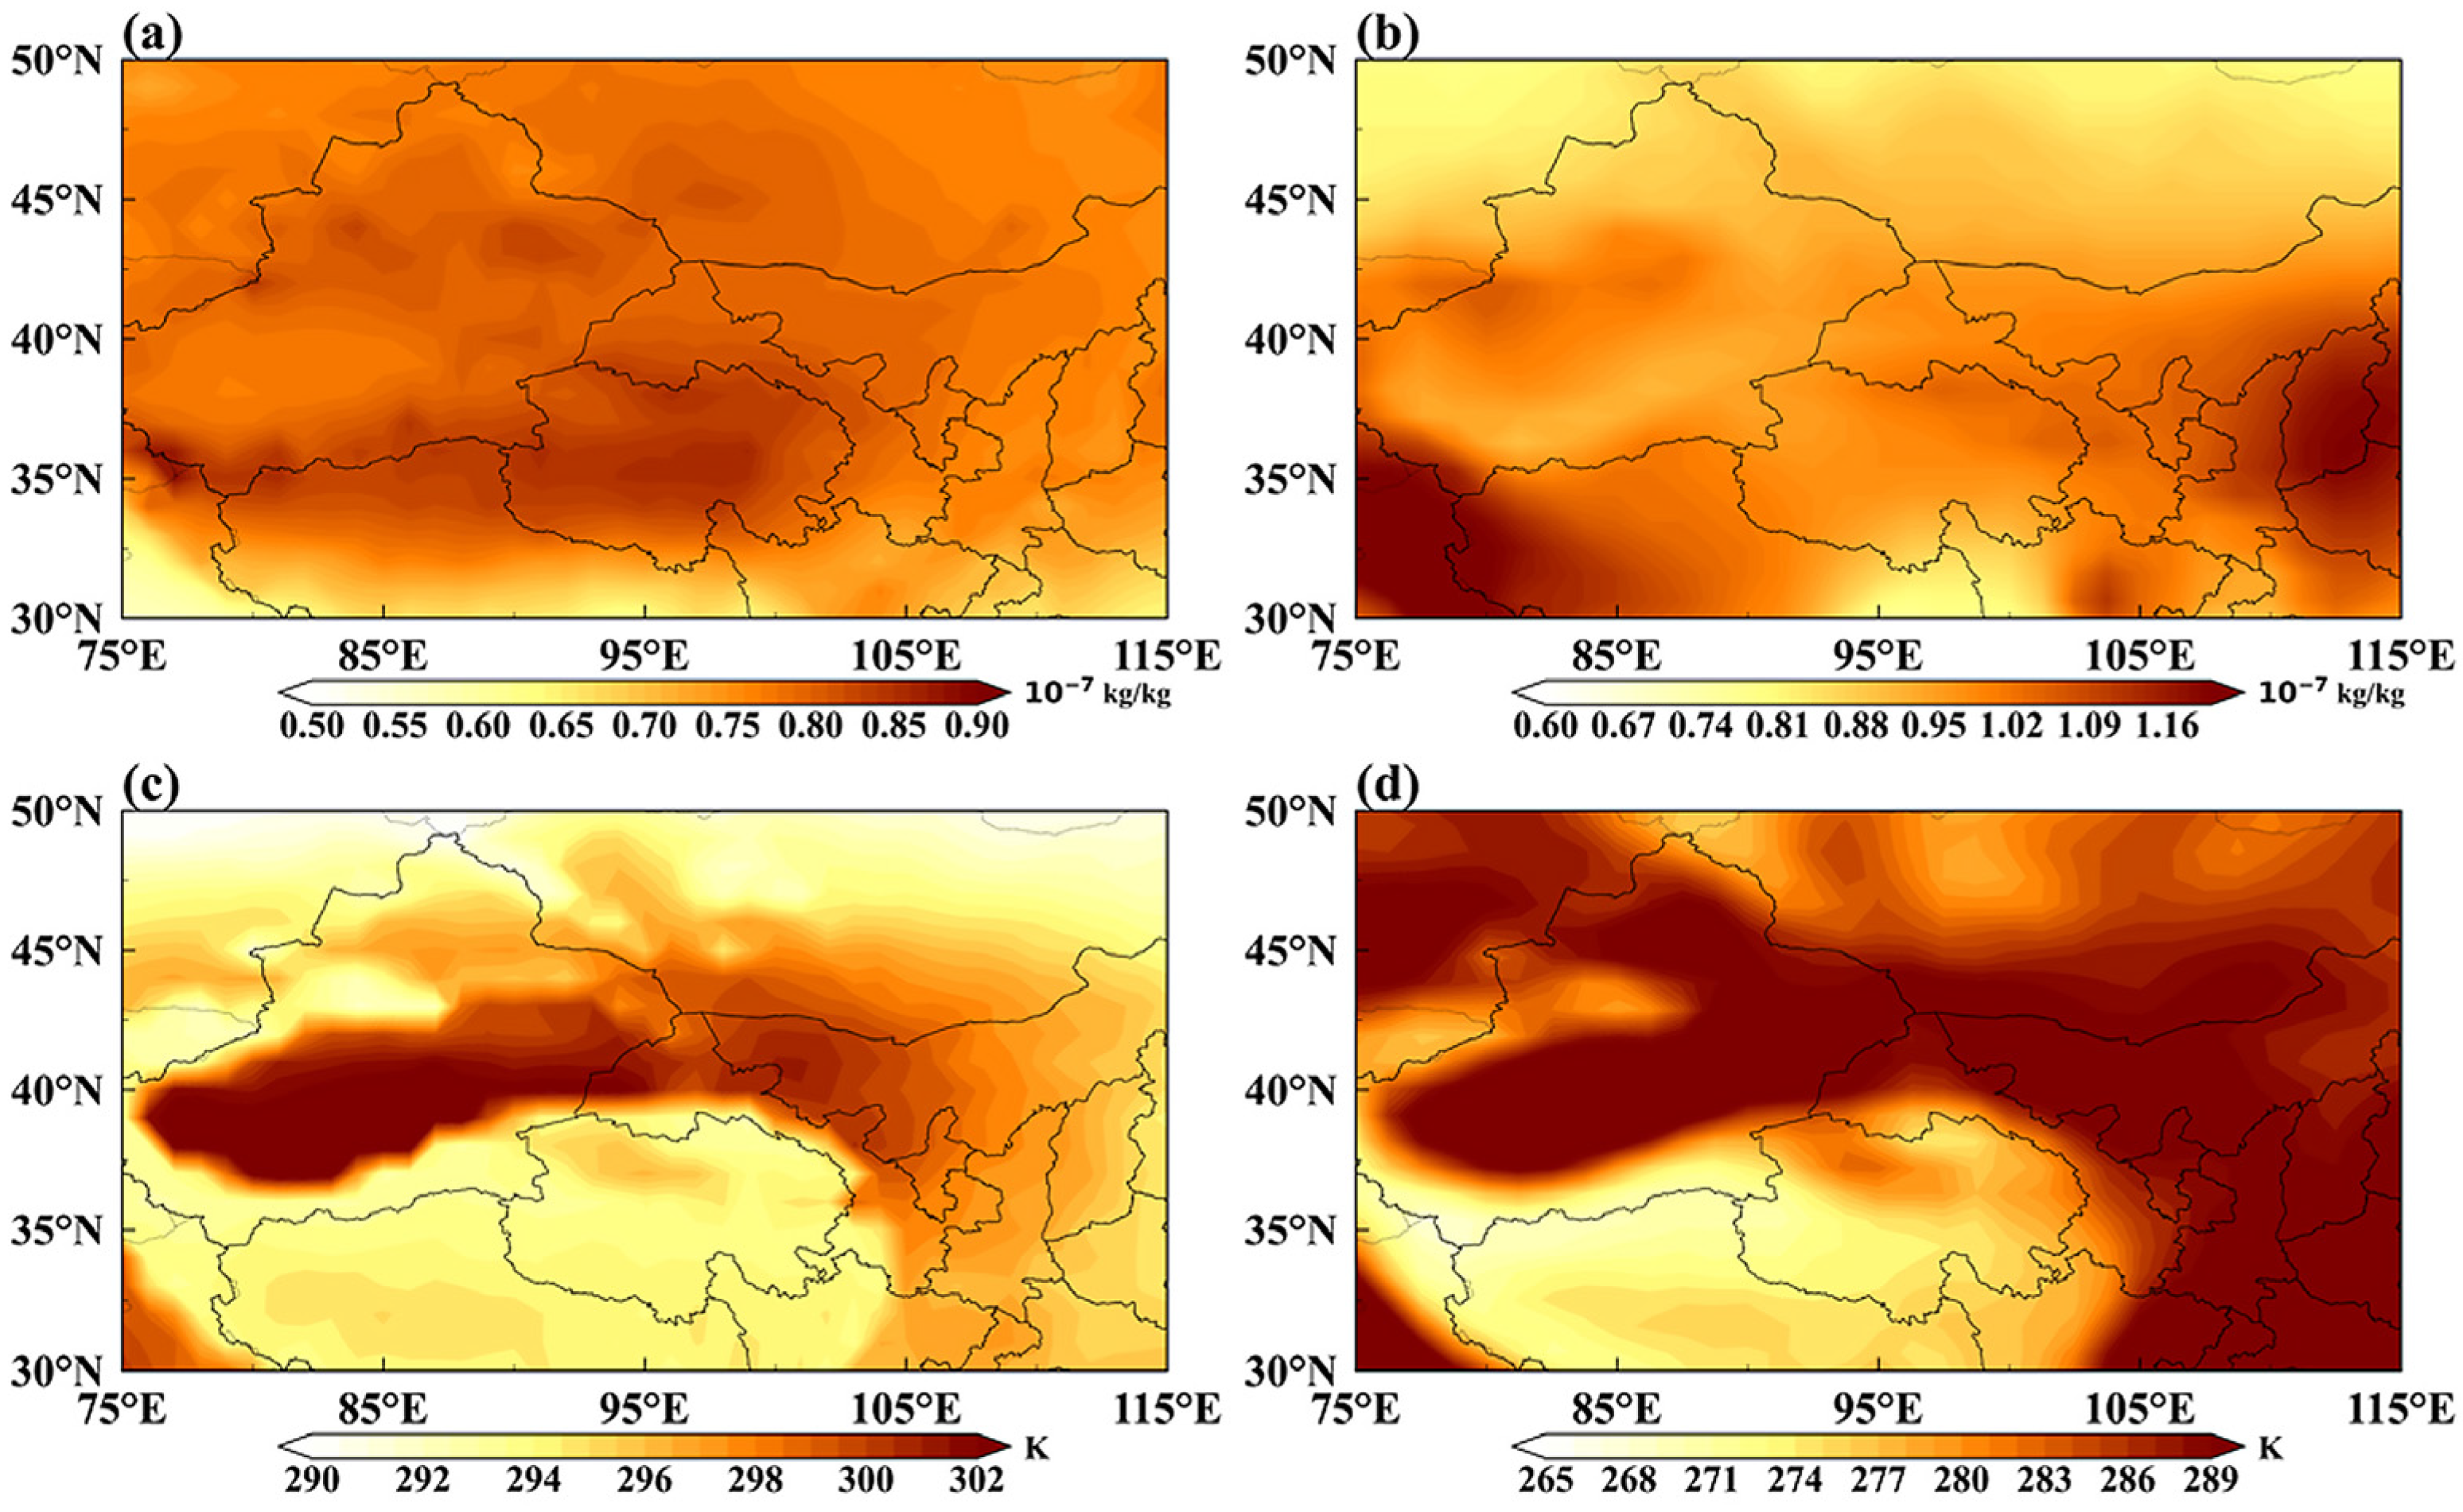
The O3 trends derived from the CAM-Chem model simulation (Figure 1d) closely matched those from ERA5 reanalysis data (Figure 1c), with a high correlation coefficient of 0.85 over the overlapping time periods. To further assess the model’s accuracy, we compared CAM-Chem O3 and temperature outputs with the ERA5 data, as shown in Figure 2. In ERA5, O3 concentrations are generally elevated across the entire northwestern region (Figure 2a), while temperature values are higher in areas such as Xinjiang, Gansu, Shaanxi, and Inner Mongolia, and lower in regions like Tibet and Qinghai (Figure 2c). The CAM-Chem model accurately simulates the climatological distribution of both O3 and temperature (Figure 2b,d), demonstrating a high degree of consistency with the ERA5 data. This alignment reinforces confidence in using the CAM-Chem model simulations.

2.3. Method

Two independent variables may exhibit strong correlation without implying a direct cause-and-effect relationship [34]. To assess causality between variables, the Liang–Kleeman information flow (LKIF) is employed, offering a robust framework for validation [35]. Unlike Granger causality or transfer entropy, LKIF provides quantitative, directionally explicit estimates of causal strength while significantly reducing the computational cost, making it well-suited for analyzing coupled interactions in climate and atmospheric chemistry systems.

3. Meteorological Drivers of Rising Surface O3 in Northwest China

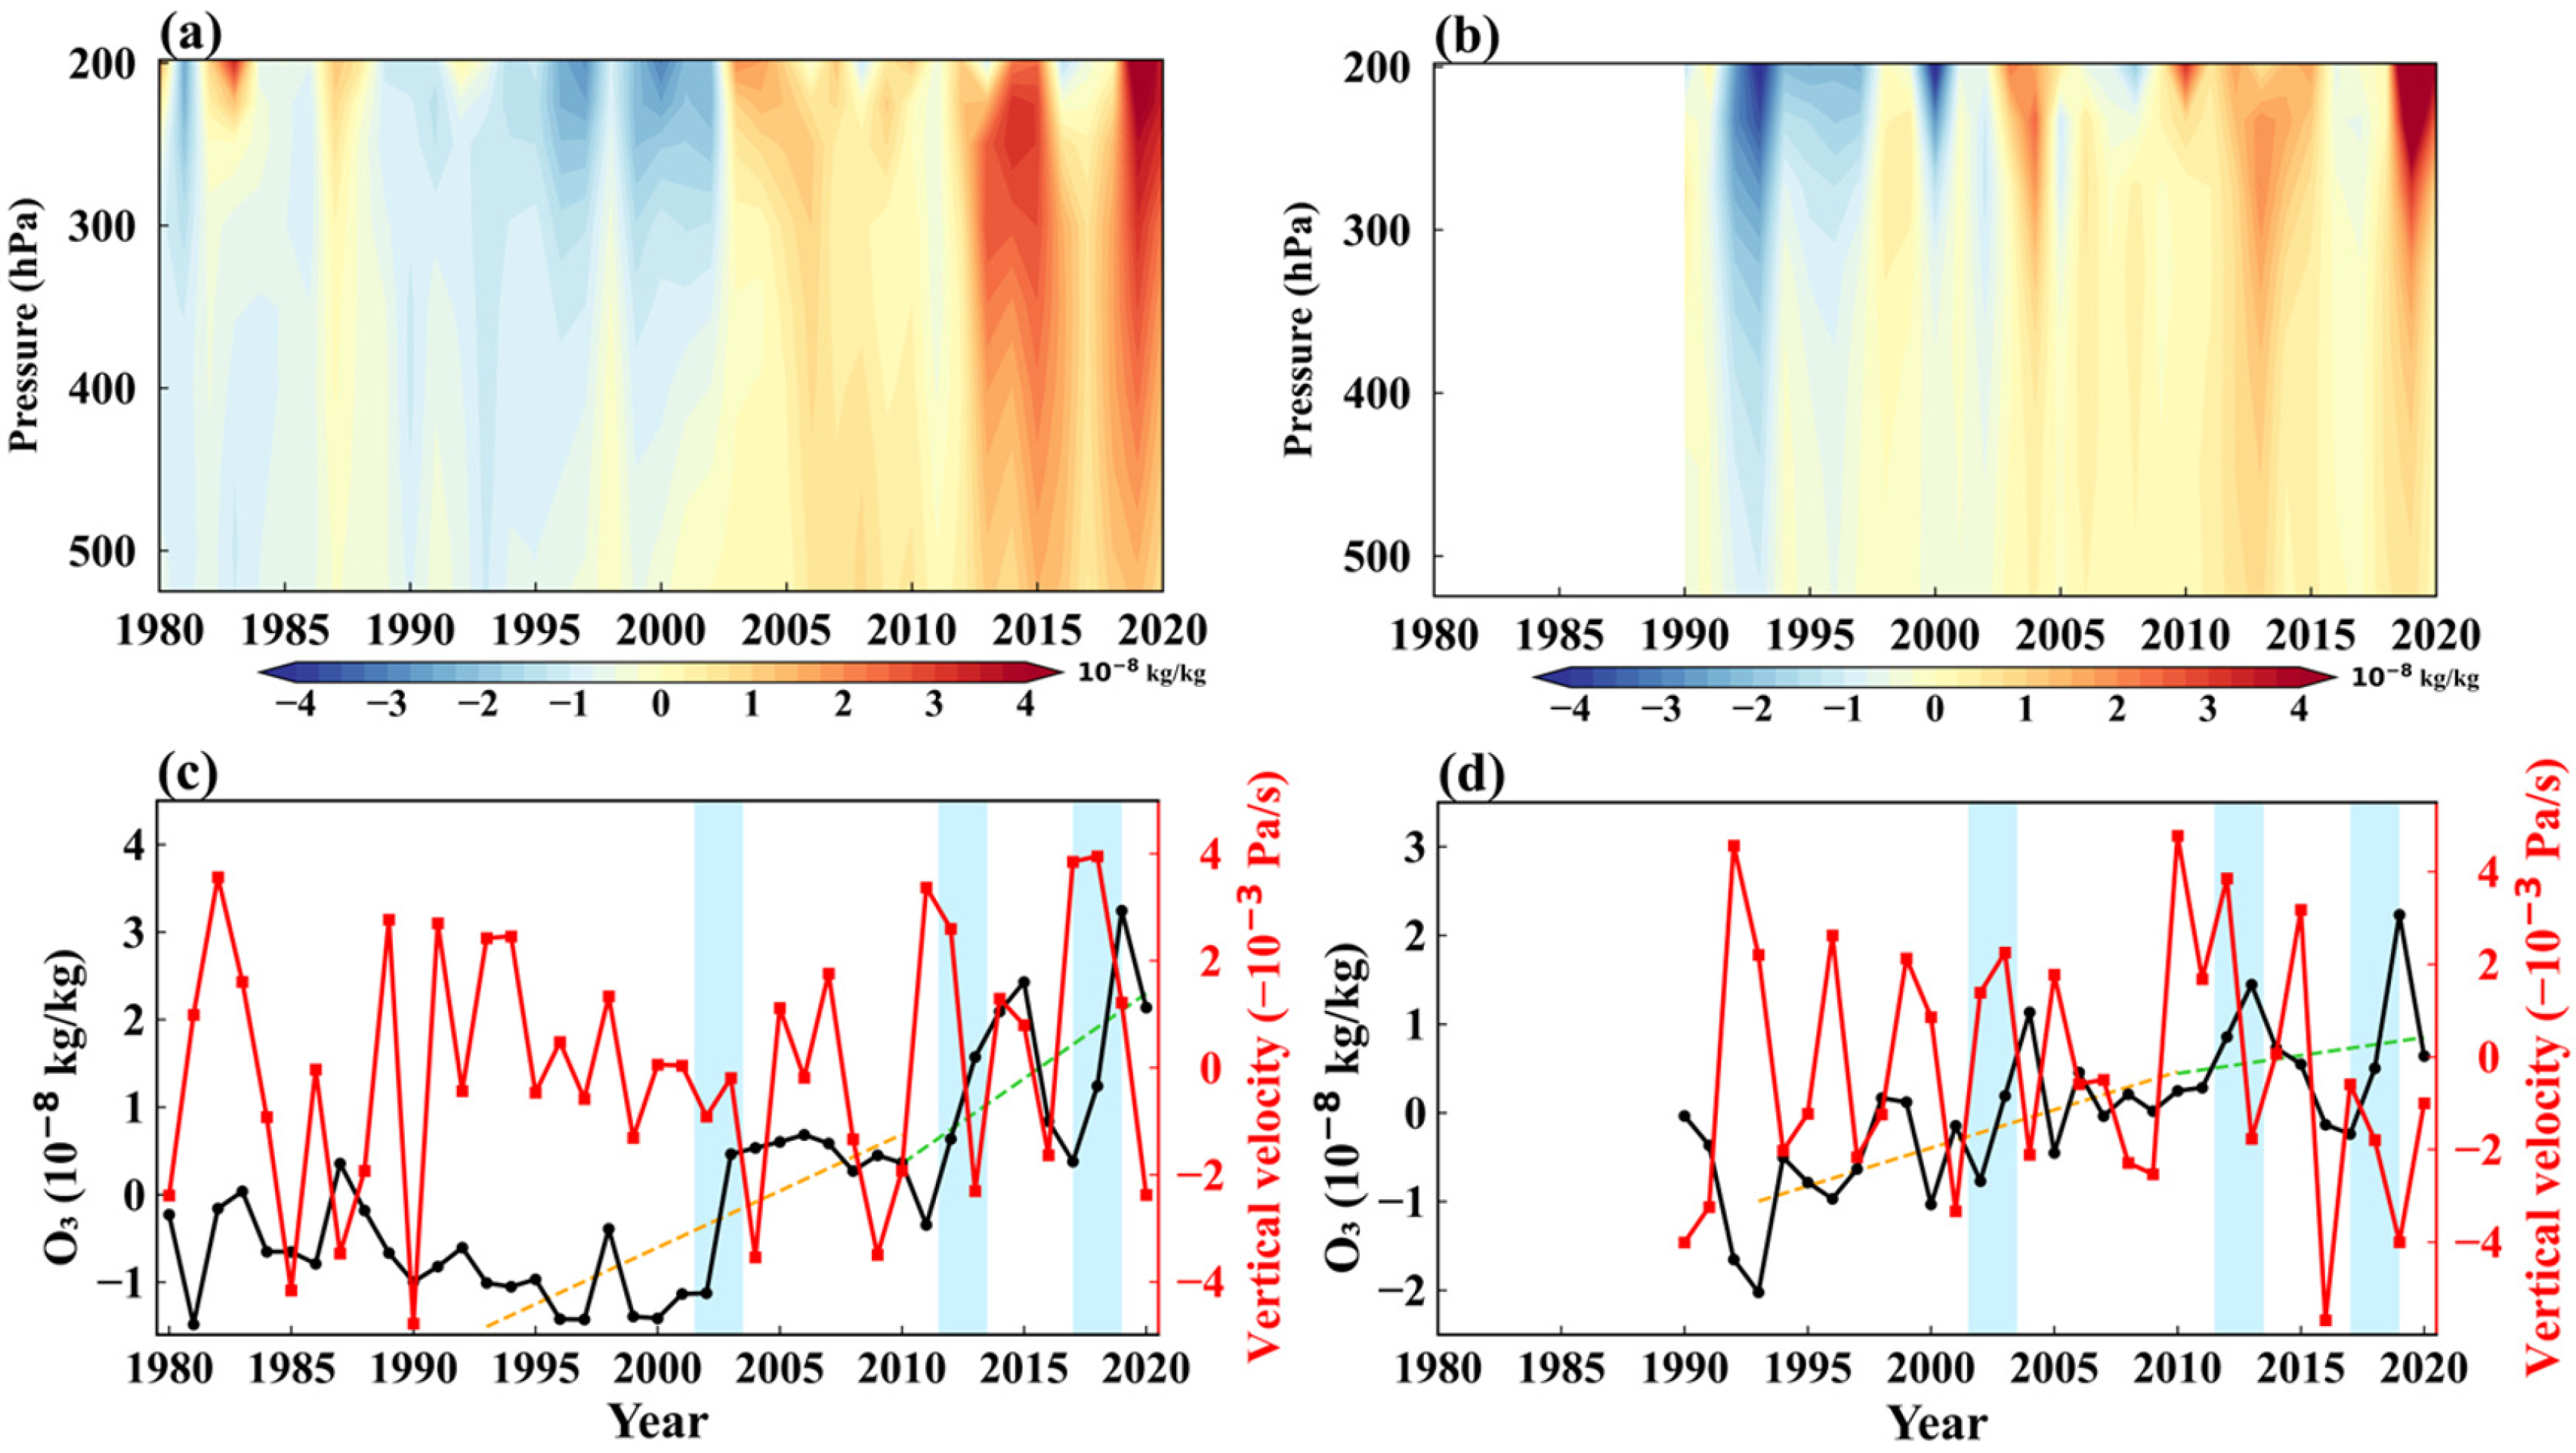
The above-mentioned analysis indicates that the substantial increase in surface O3 observed from 1993 to 2010 significantly contributed to the overall rising trend of O3 from 1980 to 2020. Consequently, identifying the primary processes responsible for this extreme increase during the 1993–2010 period is crucial for understanding the broader trend observed between 1980 and 2020. Stratospheric O3 intrusion is well-documented as a major contributor to elevated surface O3 levels, particularly in regions susceptible to such events. Notably, parts of Northwest China, which lie within the Tibetan Plateau—a recognized hotspot for deep stratospheric intrusion—have exhibited elevated surface O3 concentrations at several ground-based monitoring stations [36,37]. Consequently, we first focus our investigation on the role of stratospheric O3 intrusion in driving the extreme increase in surface O3 concentrations in this region. Figure 3a,b shows the vertical distribution of O3 over Northwest China based on ERA5 reanalysis data and CAM-Chem model simulations, respectively. Between 1993 to 2010, both datasets revealed a weak positive O3 anomaly transfer event in the summer of 2003. In contrast, post–2010, two significant positive O3 anomaly downwelling events occurred in the summers of 2013 and 2019. These events are more clearly manifested in the time series of O3 and vertical velocity, where the large increase in O3 anomalies corresponds to a significant weakening of vertical velocity, indicating enhanced subsidence (blue frames in Figure 3c,d). The increase in O3 in 2003 led to a slight increase in the overall O3 trend from 1993 to 2010 (Figure 3c,d), partially contributing to the sharp increase in surface O3 (Figure 1c,d). The two significant O3-positive anomaly downwelling events post–2010 resulted in an increase in O3 between 2010 and 2020 (Figure 3c,d), partially offsetting the overall decline observed during this period (Figure 1c,d). Changes in upper tropospheric O3 and vertical velocity indicate that stratospheric O3 intrusions may affect surface O3 variability in Northwest China; however, they are unlikely to be the dominant driver.
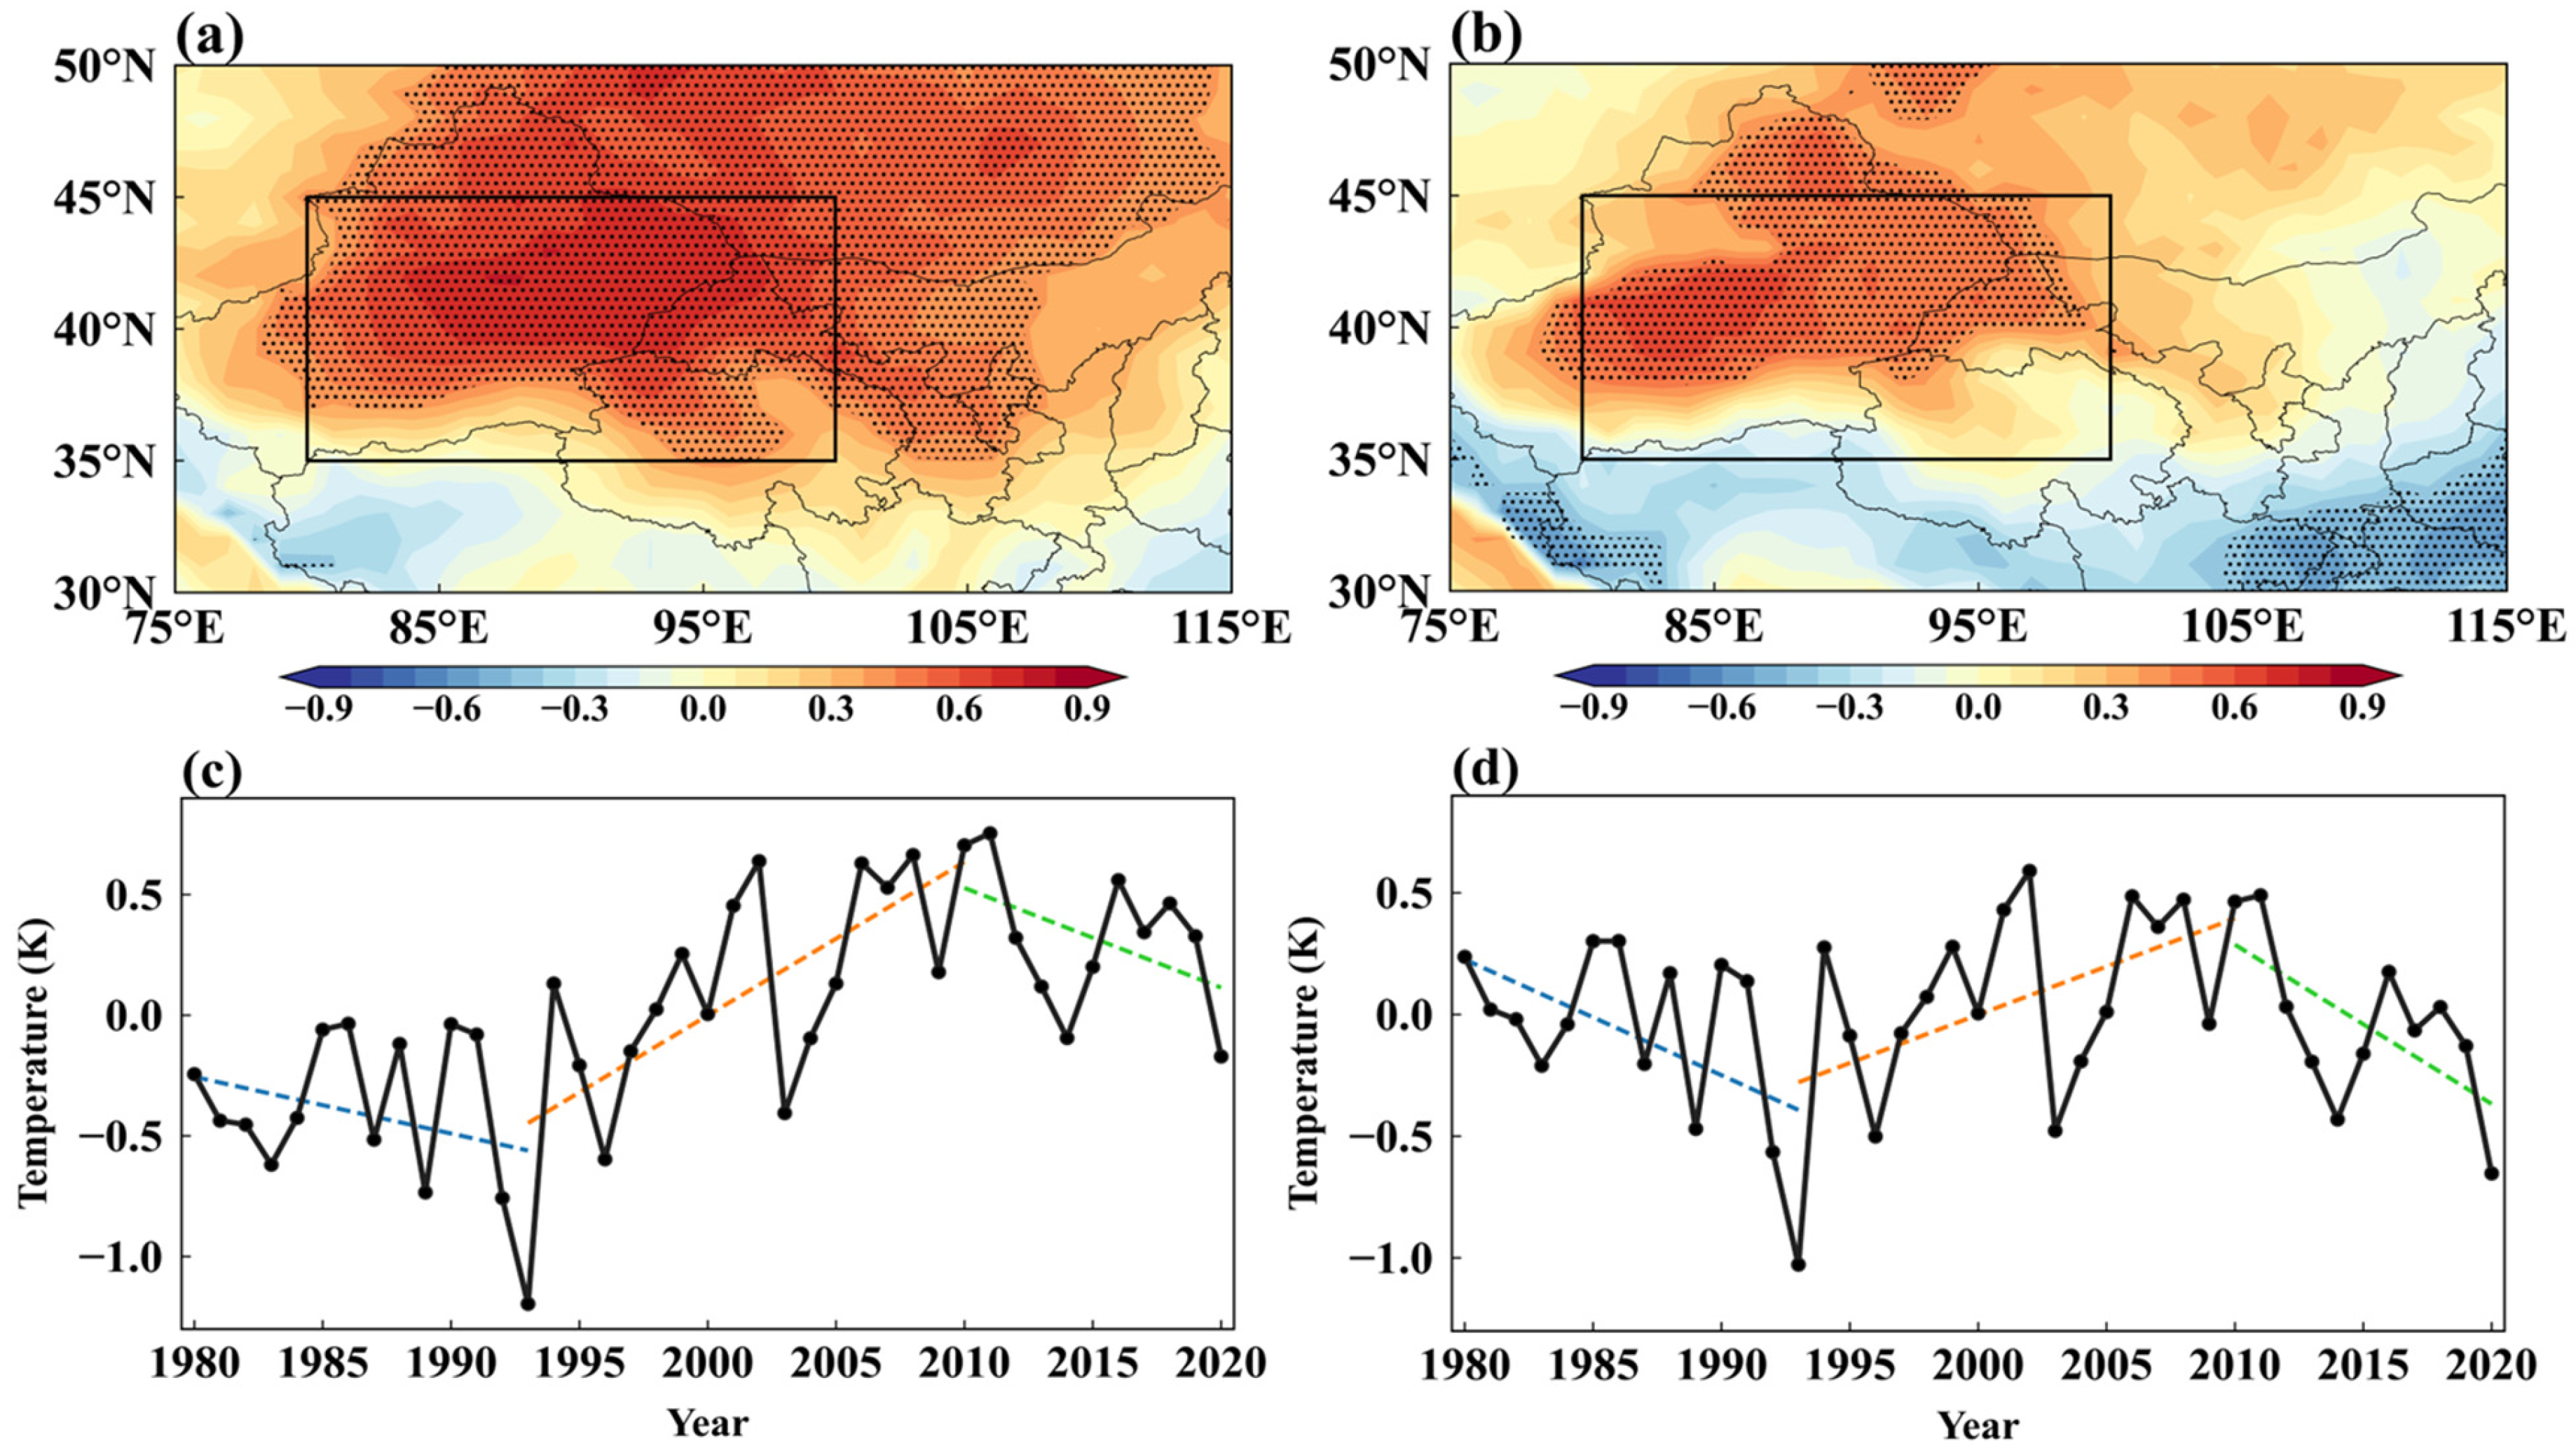
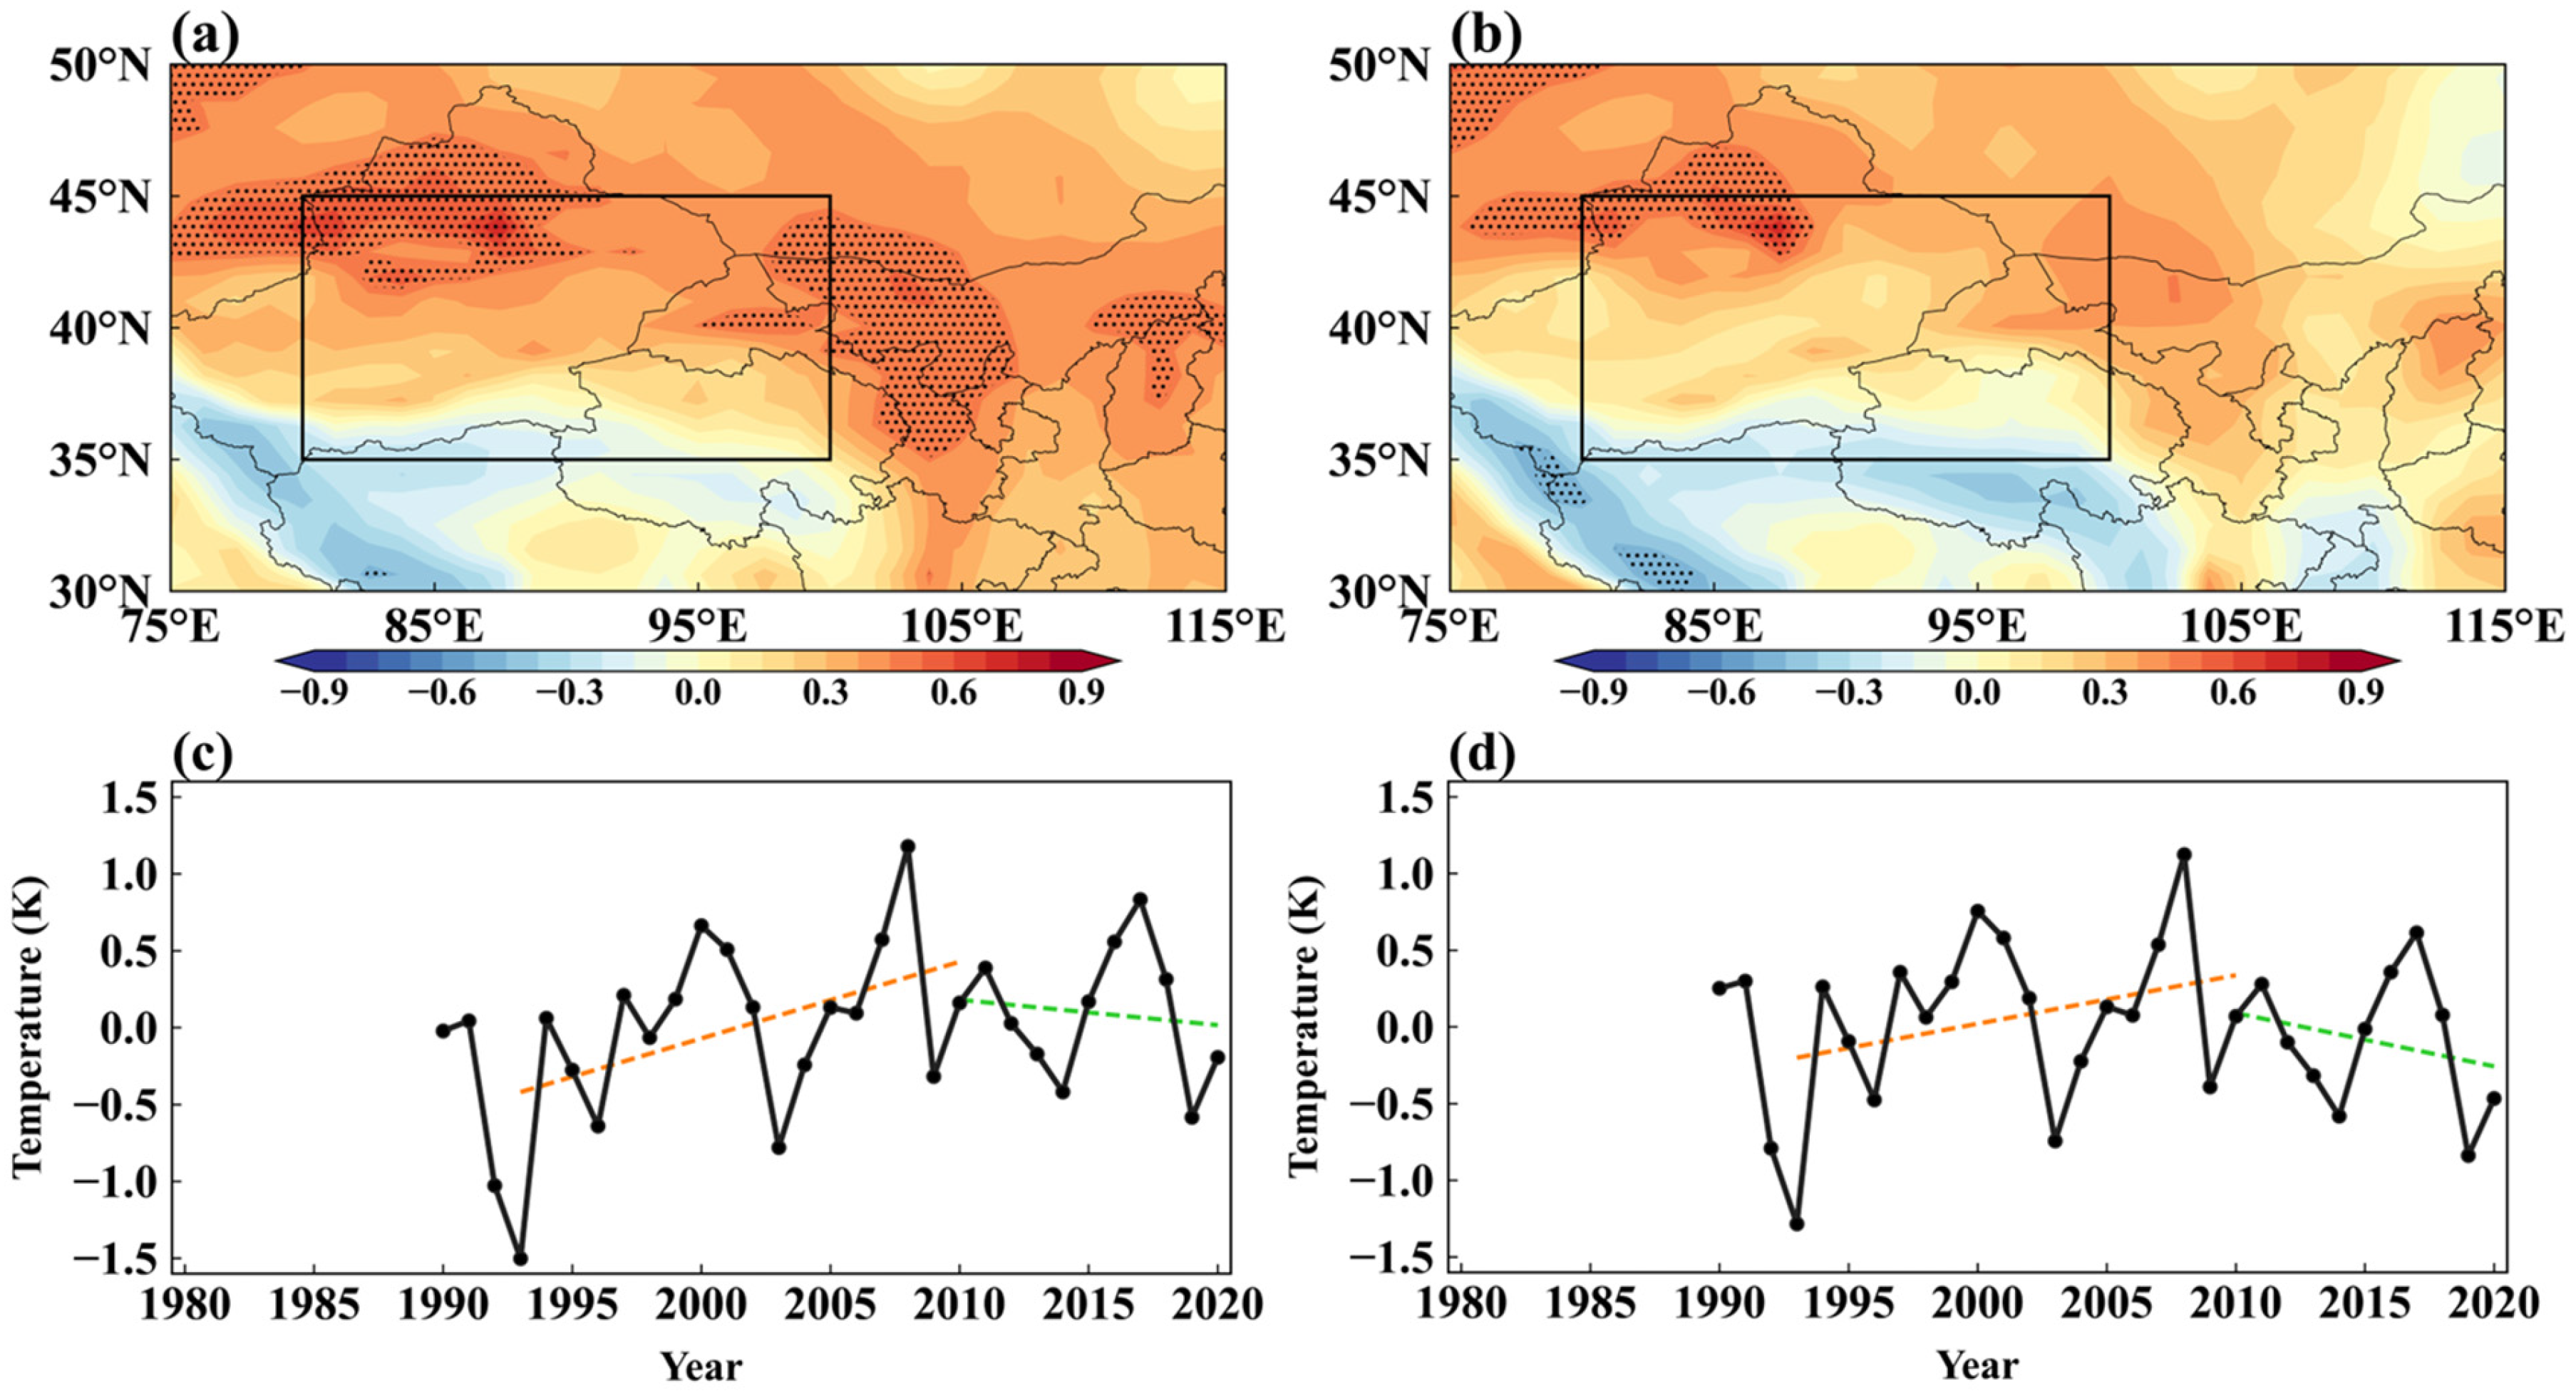
In addition to stratospheric O3 intrusion, photochemical reactions are also a key factor influencing surface O3 variability. Temperature directly affects the chemical reaction rates of O3 precursors, which are closely linked to O3 production [21]. For instance, O3 is primarily formed through the oxidation of precursors in the presence of NOx [38]. The coupling of the ‘NOx cycle’ with the ‘reactive odd-hydrogen radical (ROx) cycle’ is central to atmospheric oxidative processes. Elevated temperatures often accelerate these reaction rates [39]. It is evident that a significant positive linear correlation between surface O3 and temperature is observed across much of Northern China (Figure 4a,b), suggesting that increases (or decreases) in temperature are generally accompanied by corresponding increases (or decreases) in O3 concentrations. Notably, the strongest correlation, reaching up to 0.79, between surface temperature and O3 was observed in Northwest China (black frames in Figure 4a). This positive relationship was also evident after removing long-term trends (Figure 4b), with only Northwest China showing a correlation that exceeded the 99% significance level. Temporal variations in surface temperature in Northwest China (Figure 4c,d) closely mirror the trends observed in surface O3 (Figure 1c,d), exhibiting a slight decline from 1980 to 1993, followed by a marked increase from 1993 to 2010, and a notable weakening trend from 2010 to 2020. These variations are further supported by the CAM-Chem model simulation (Figure 5), which captures a positive linear correlation between surface O3 and temperature (Figure 5a,b), along with a significant increase in surface temperature from 1993 to 2010, followed by a marked decline from 2010 to 2020 (Figure 5c,d). This strong correlation indicates that variations in surface temperature significantly contributed to the observed fluctuations in surface O3 levels.
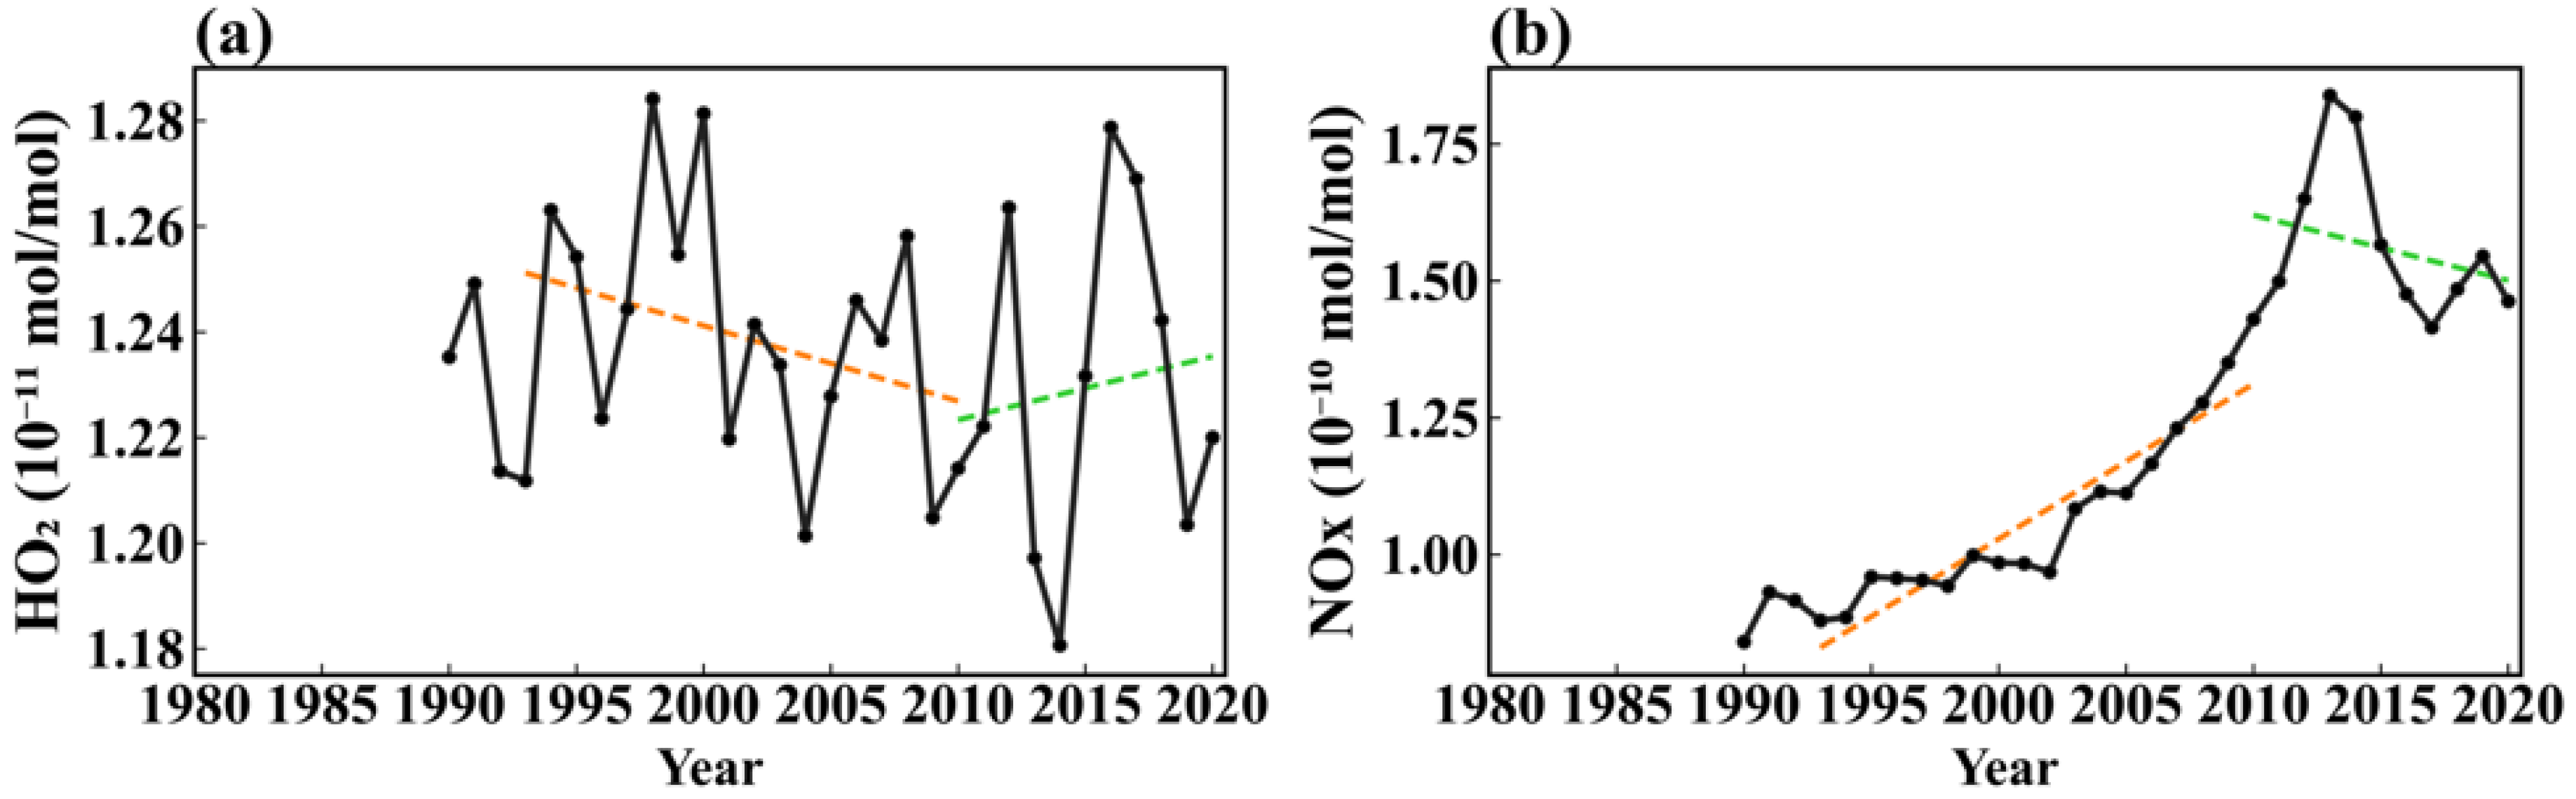
To further confirm the effect of surface temperature on the increase in surface O3, Figure 6 presents the time series of HO2 and NOx in Northwest China. The reaction between HO2 and NOx is known to be strongly influenced by variations in surface temperature [40]. Accordingly, between 1993 and 2010, the rise in temperature (Figure 4c) enhanced the reaction HO2 + NO → NO2 + OH, resulting in increased NO2 production. This corresponds to the observed decline in HO2 concentrations (Figure 6a) and the concurrent increase in NOx levels (Figure 6b). The increase in NOx facilitated greater O3 formation via the photochemical reactions NO2 + hν → NO + O and O + O2 → O3, which is reflected in the increase in surface O3 observed between 1993 and 2010 (Figure 1c,d). In contrast, after 2010, declining temperatures (Figure 4c) weakened the HO2 + NO reaction pathway, leading to higher HO2 levels (Figure 6a), lower NOx concentrations (Figure 6b), and suppressed O3 formation.
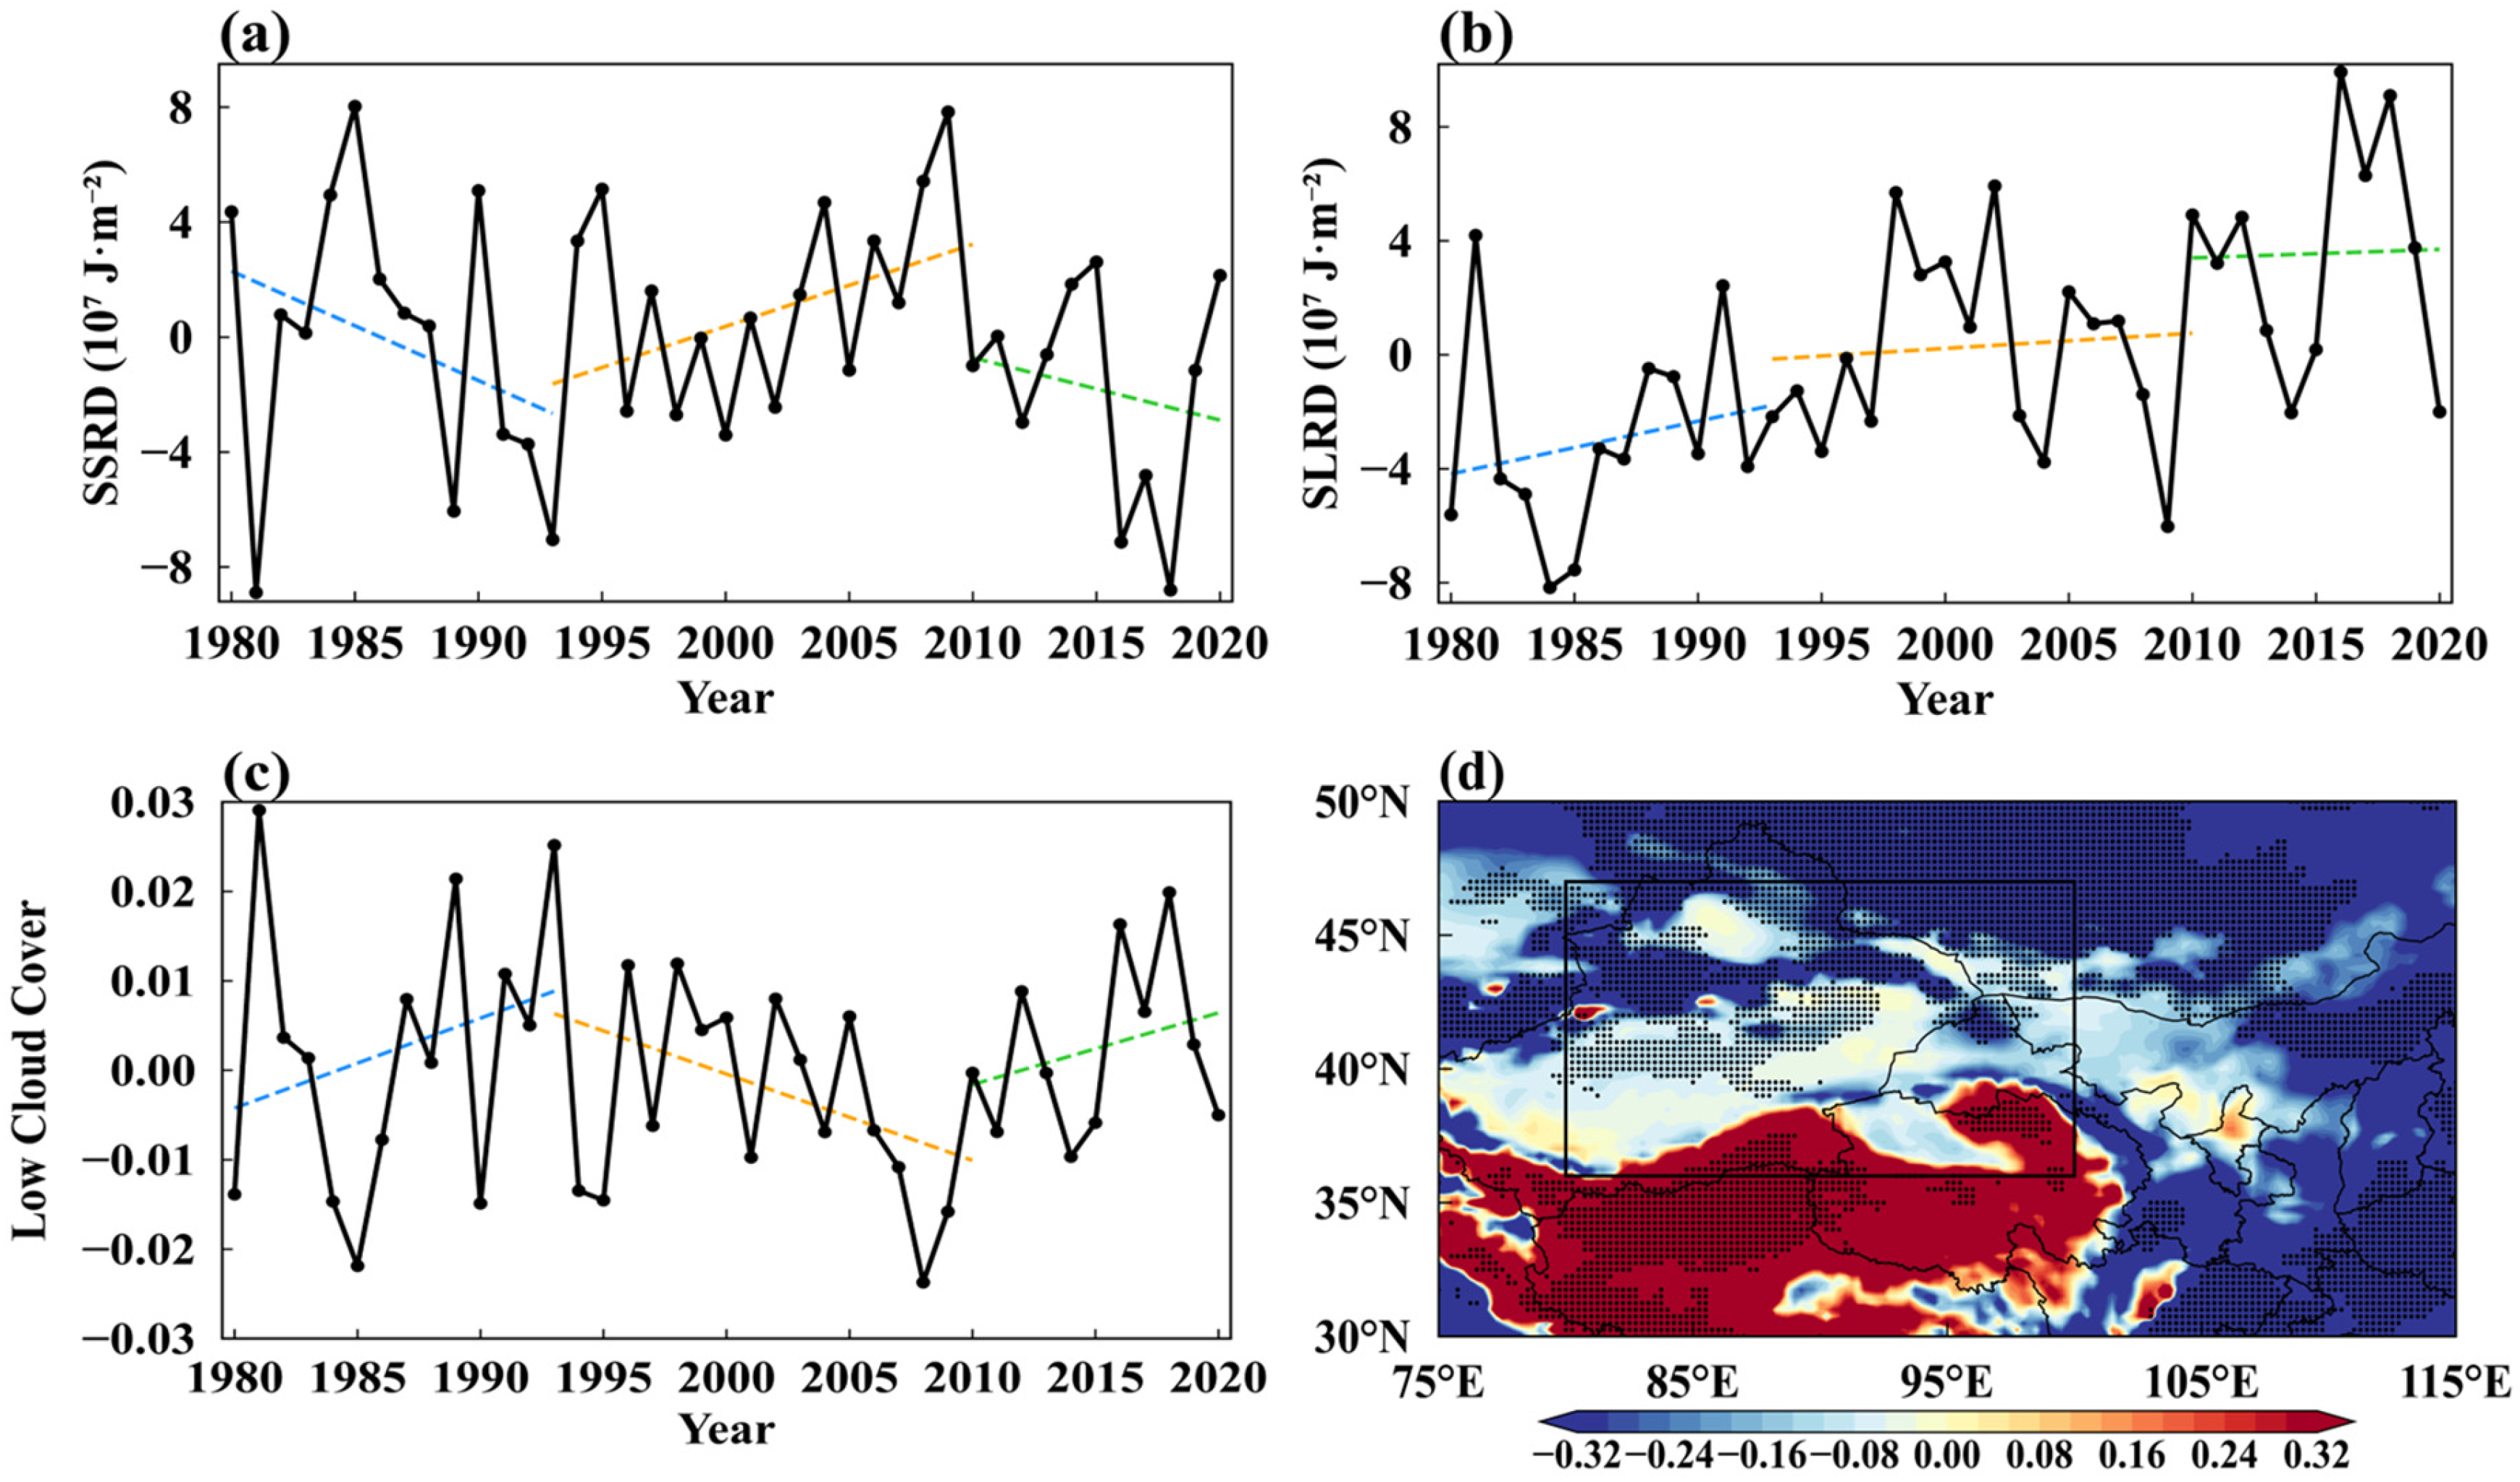
The increase in surface temperature from 1993 to 2010 has been identified as a key driver of the marked increase in surface O3. However, the mechanisms underlying this temperature increase remain unclear. Variations in surface shortwave and longwave radiation from 1980 to 2020 (Figure 7a,b) reveal that trends in shortwave radiation closely track those of surface temperature: a decline from 1980 to 1993, a pronounced increase from 1993 to 2010, and a weakening thereafter (Figure 7a). These patterns possibly suggest that shortwave radiation plays a central role in modulating surface temperature. Notably, low cloud cover exhibited an inverse trend, with a significant decline during 1993–2010 (Figure 7c). This reduction allowed greater solar radiation to reach the surface, increasing downward shortwave radiation (Figure 7c), thereby contributing to surface warming (Figure 4b) and accelerating ozone-forming photochemical reactions (Figure 6). The spatial pattern of cloud cover change (Figure 7d) showed the strongest reductions over Northern China, aligning with regions of pronounced warming (Figure 2c). Areas of reduced low cloud cover corresponded to temperature increases, while regions with increased cloud cover showed relative cooling-further supporting the role of cloud variability in driving regional temperature trends. In contrast, during 1980–1993 and 2010–2020, increases in low cloud cover were associated with reduced shortwave radiation and surface cooling (Figure 4c and Figure 7a,c). Note that we also analyzed the temporal variations of total, high, and middle cloud cover over Northwest China from 1980 to 2010. Their decadal trends showed no clear coherence with the observed surface warming and ozone variations.

4. Drivers of Low Cloud Cover Reduction in Northwest China Between 1993 and 2010

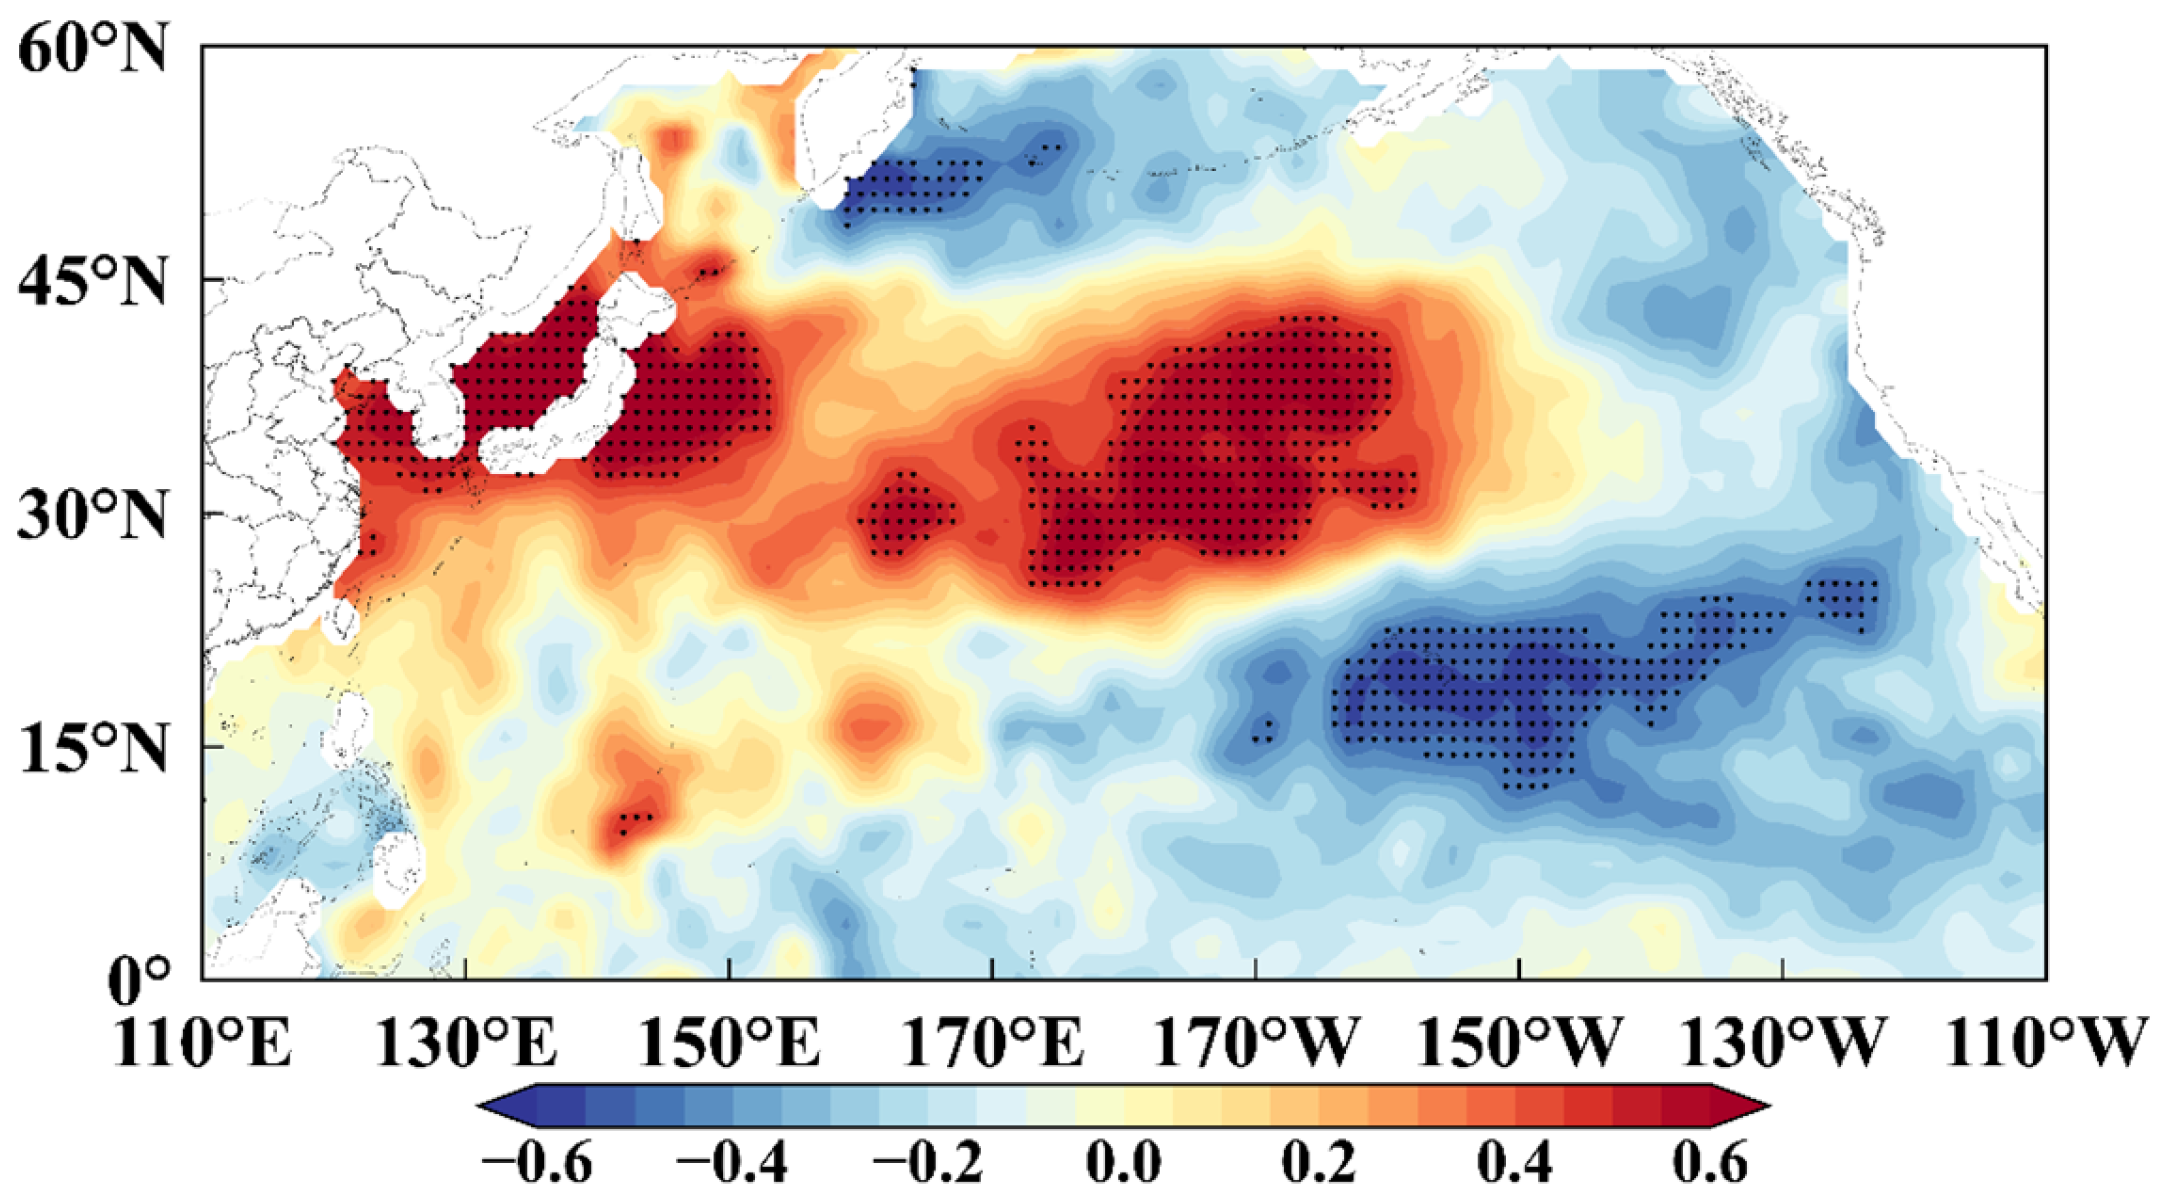
The aforementioned analysis suggests that the reduction in low cloud cover over Northwest China may be a primary driver of regional warming. This raises a critical question: what factors are responsible for the observed decline in low cloud cover? Previous studies have shown that sea surface temperature (SST) anomalies in the North Pacific exert an important influence on climate across China [41,42,43]. Figure 8 presents the correlation coefficients between North Pacific SSTs and surface temperature anomalies in Northwest China. A significant positive correlation is evident over the North Pacific, highlighting a strong link between North Pacific SST variability and surface warming in Northwest China.
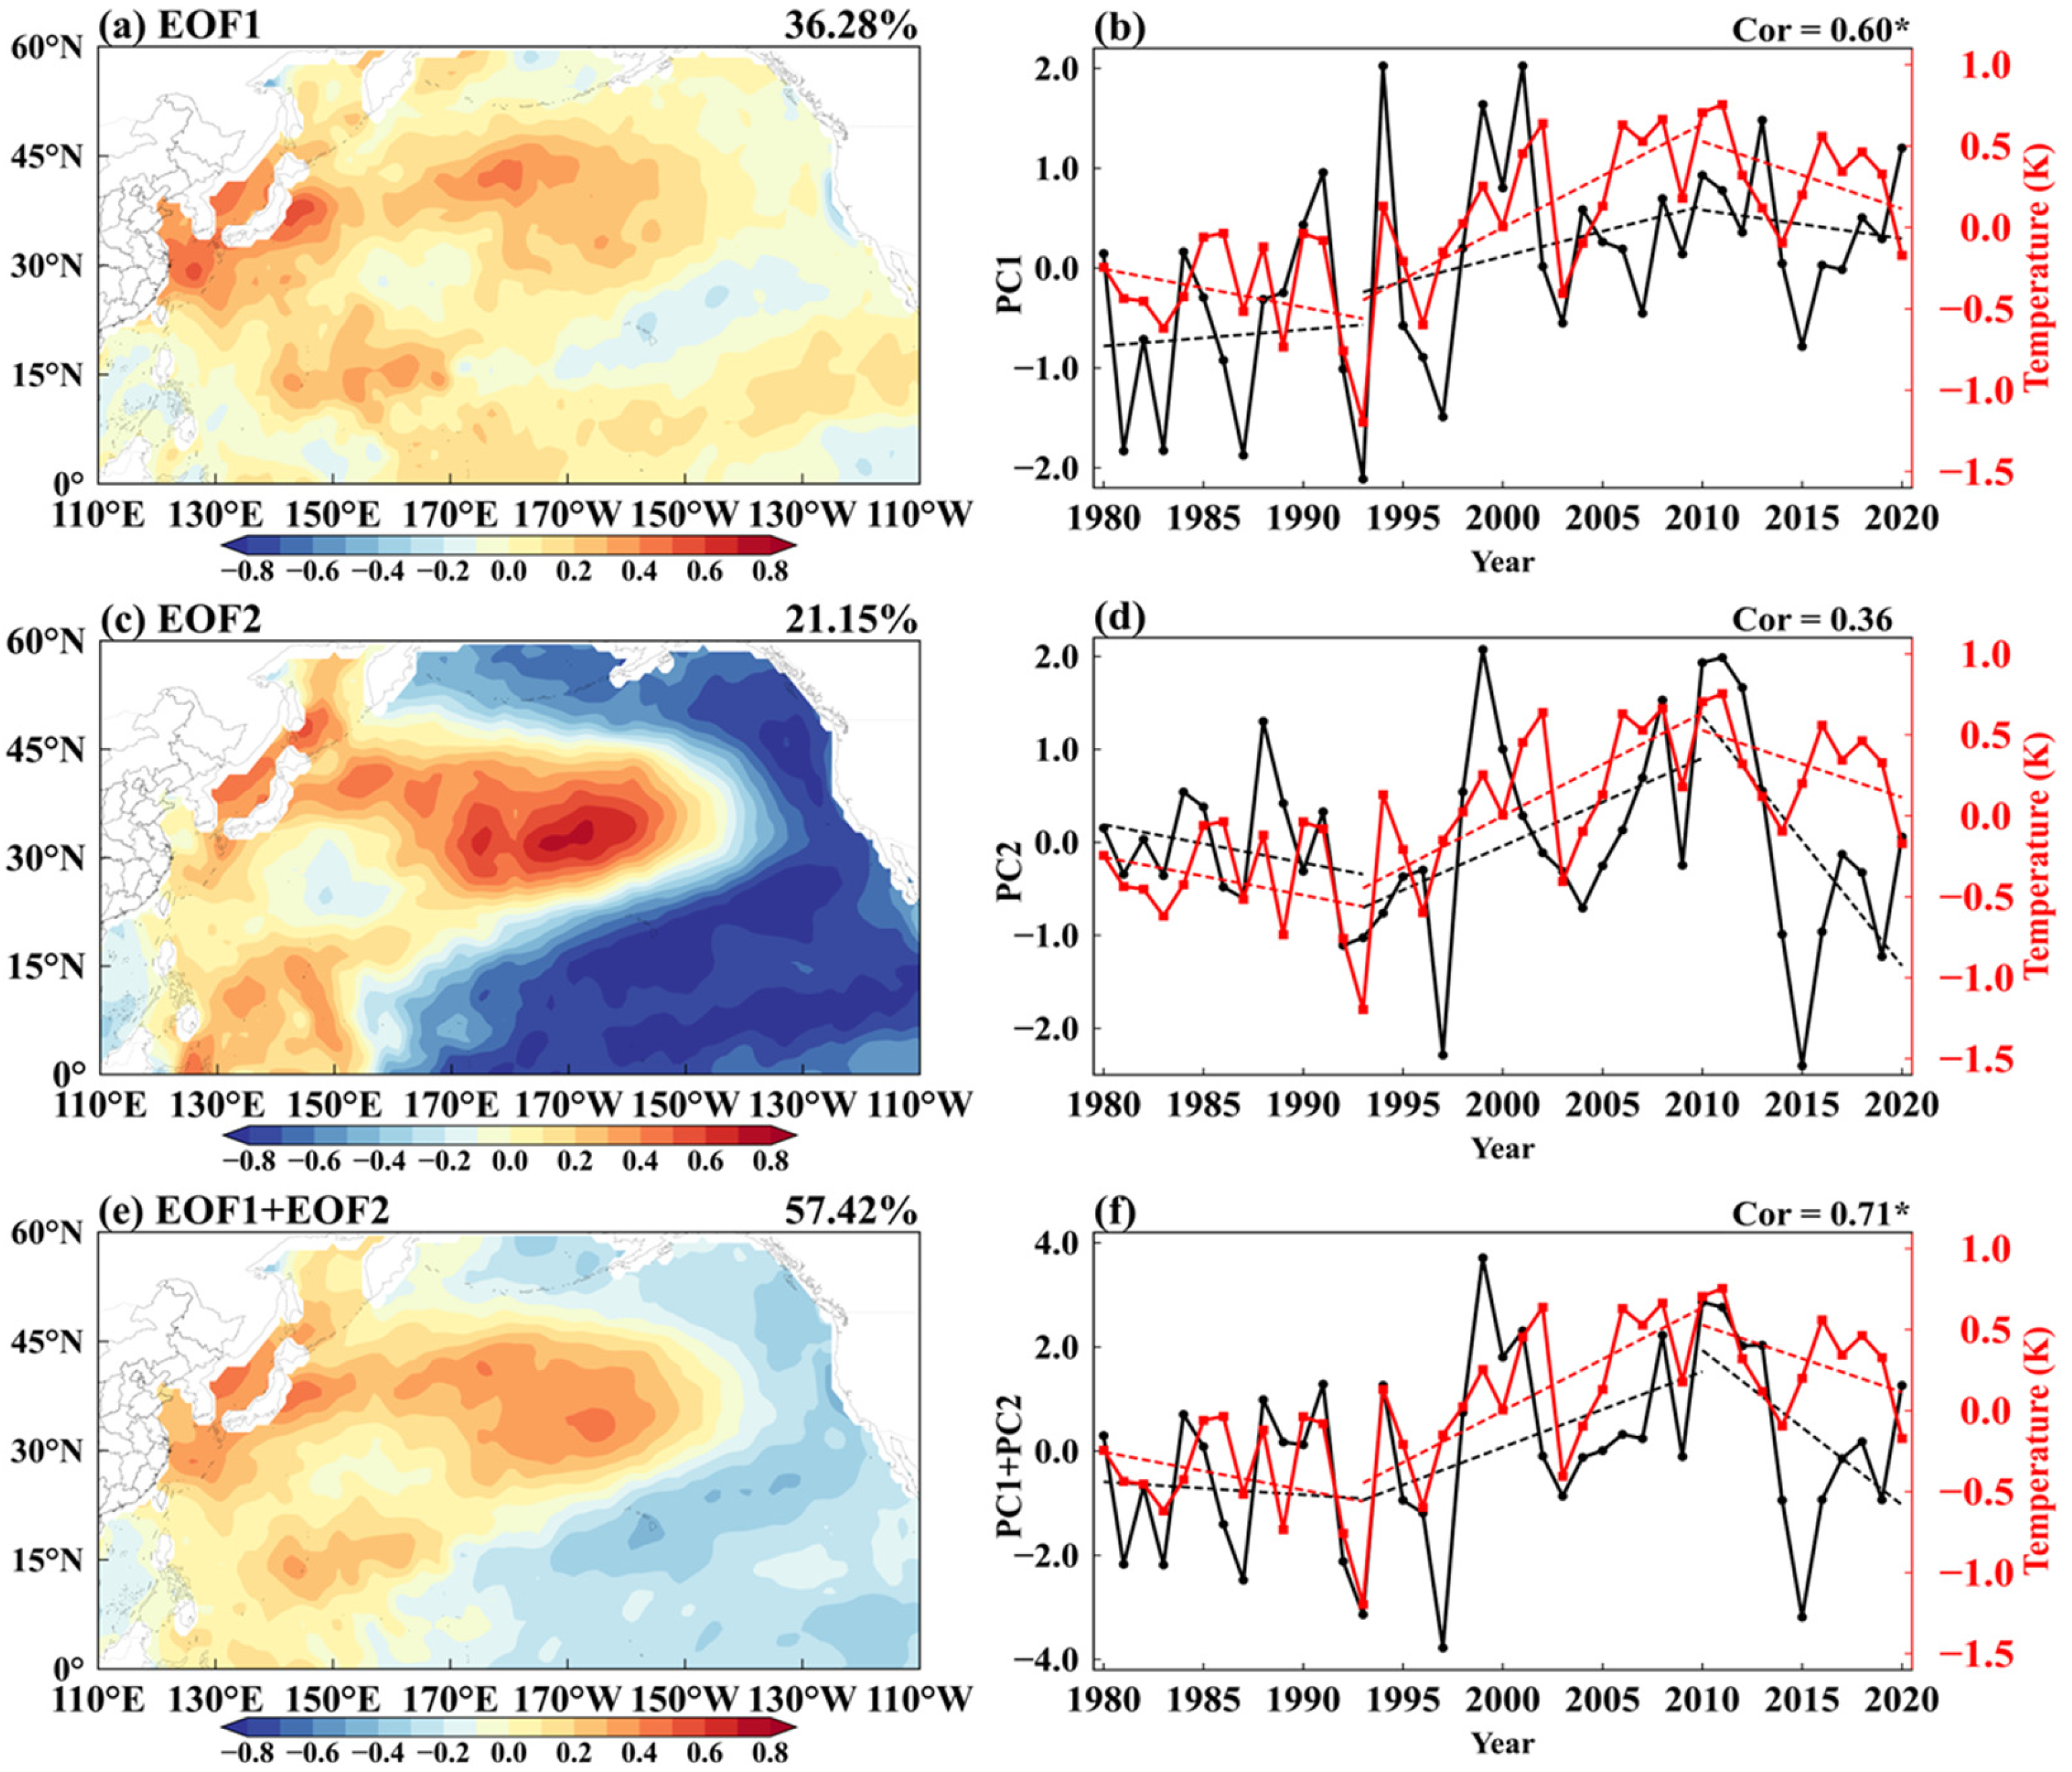
An empirical orthogonal function (EOF) analysis was performed on summer SST anomalies in the North Pacific from 1980 to 2020. The leading mode (EOF1) accounted for 36.28% of the variance in North Pacific SST (Figure 9a), and its associated principal component (PC1; black lines in Figure 9b) exhibited a strong positive correlation with surface temperatures in Northwest China (red lines in Figure 9b), with a correlation coefficient exceeding 0.60—statistically significant at the 99% confidence level. In contrast, the second mode (EOF2) explained 21.15% of the SST variance (Figure 9c), and its principal component (PC2) showed a weaker, statistically insignificant correlation of 0.38 with surface temperatures. Nevertheless, the temporal evolution of PC2 closely reflects the long-term trends in surface temperature across Northwest China, characterized by a slight decline from 1980 to 1993, a marked increase from 1993 to 2010, and a weakening trend from 2010 to 2020. When EOF1 and EOF2 were combined (Figure 9e), the resulting spatial pattern closely resembled the correlation map between North Pacific SSTs and surface temperature anomalies (Figure 8). The combined PC1 and PC2 time series also showed a significant correlation with the regional surface temperature trends (Figure 9f), indicating that both the leading modes of North Pacific SST variability are closely related to surface temperature variations in Northwest China.
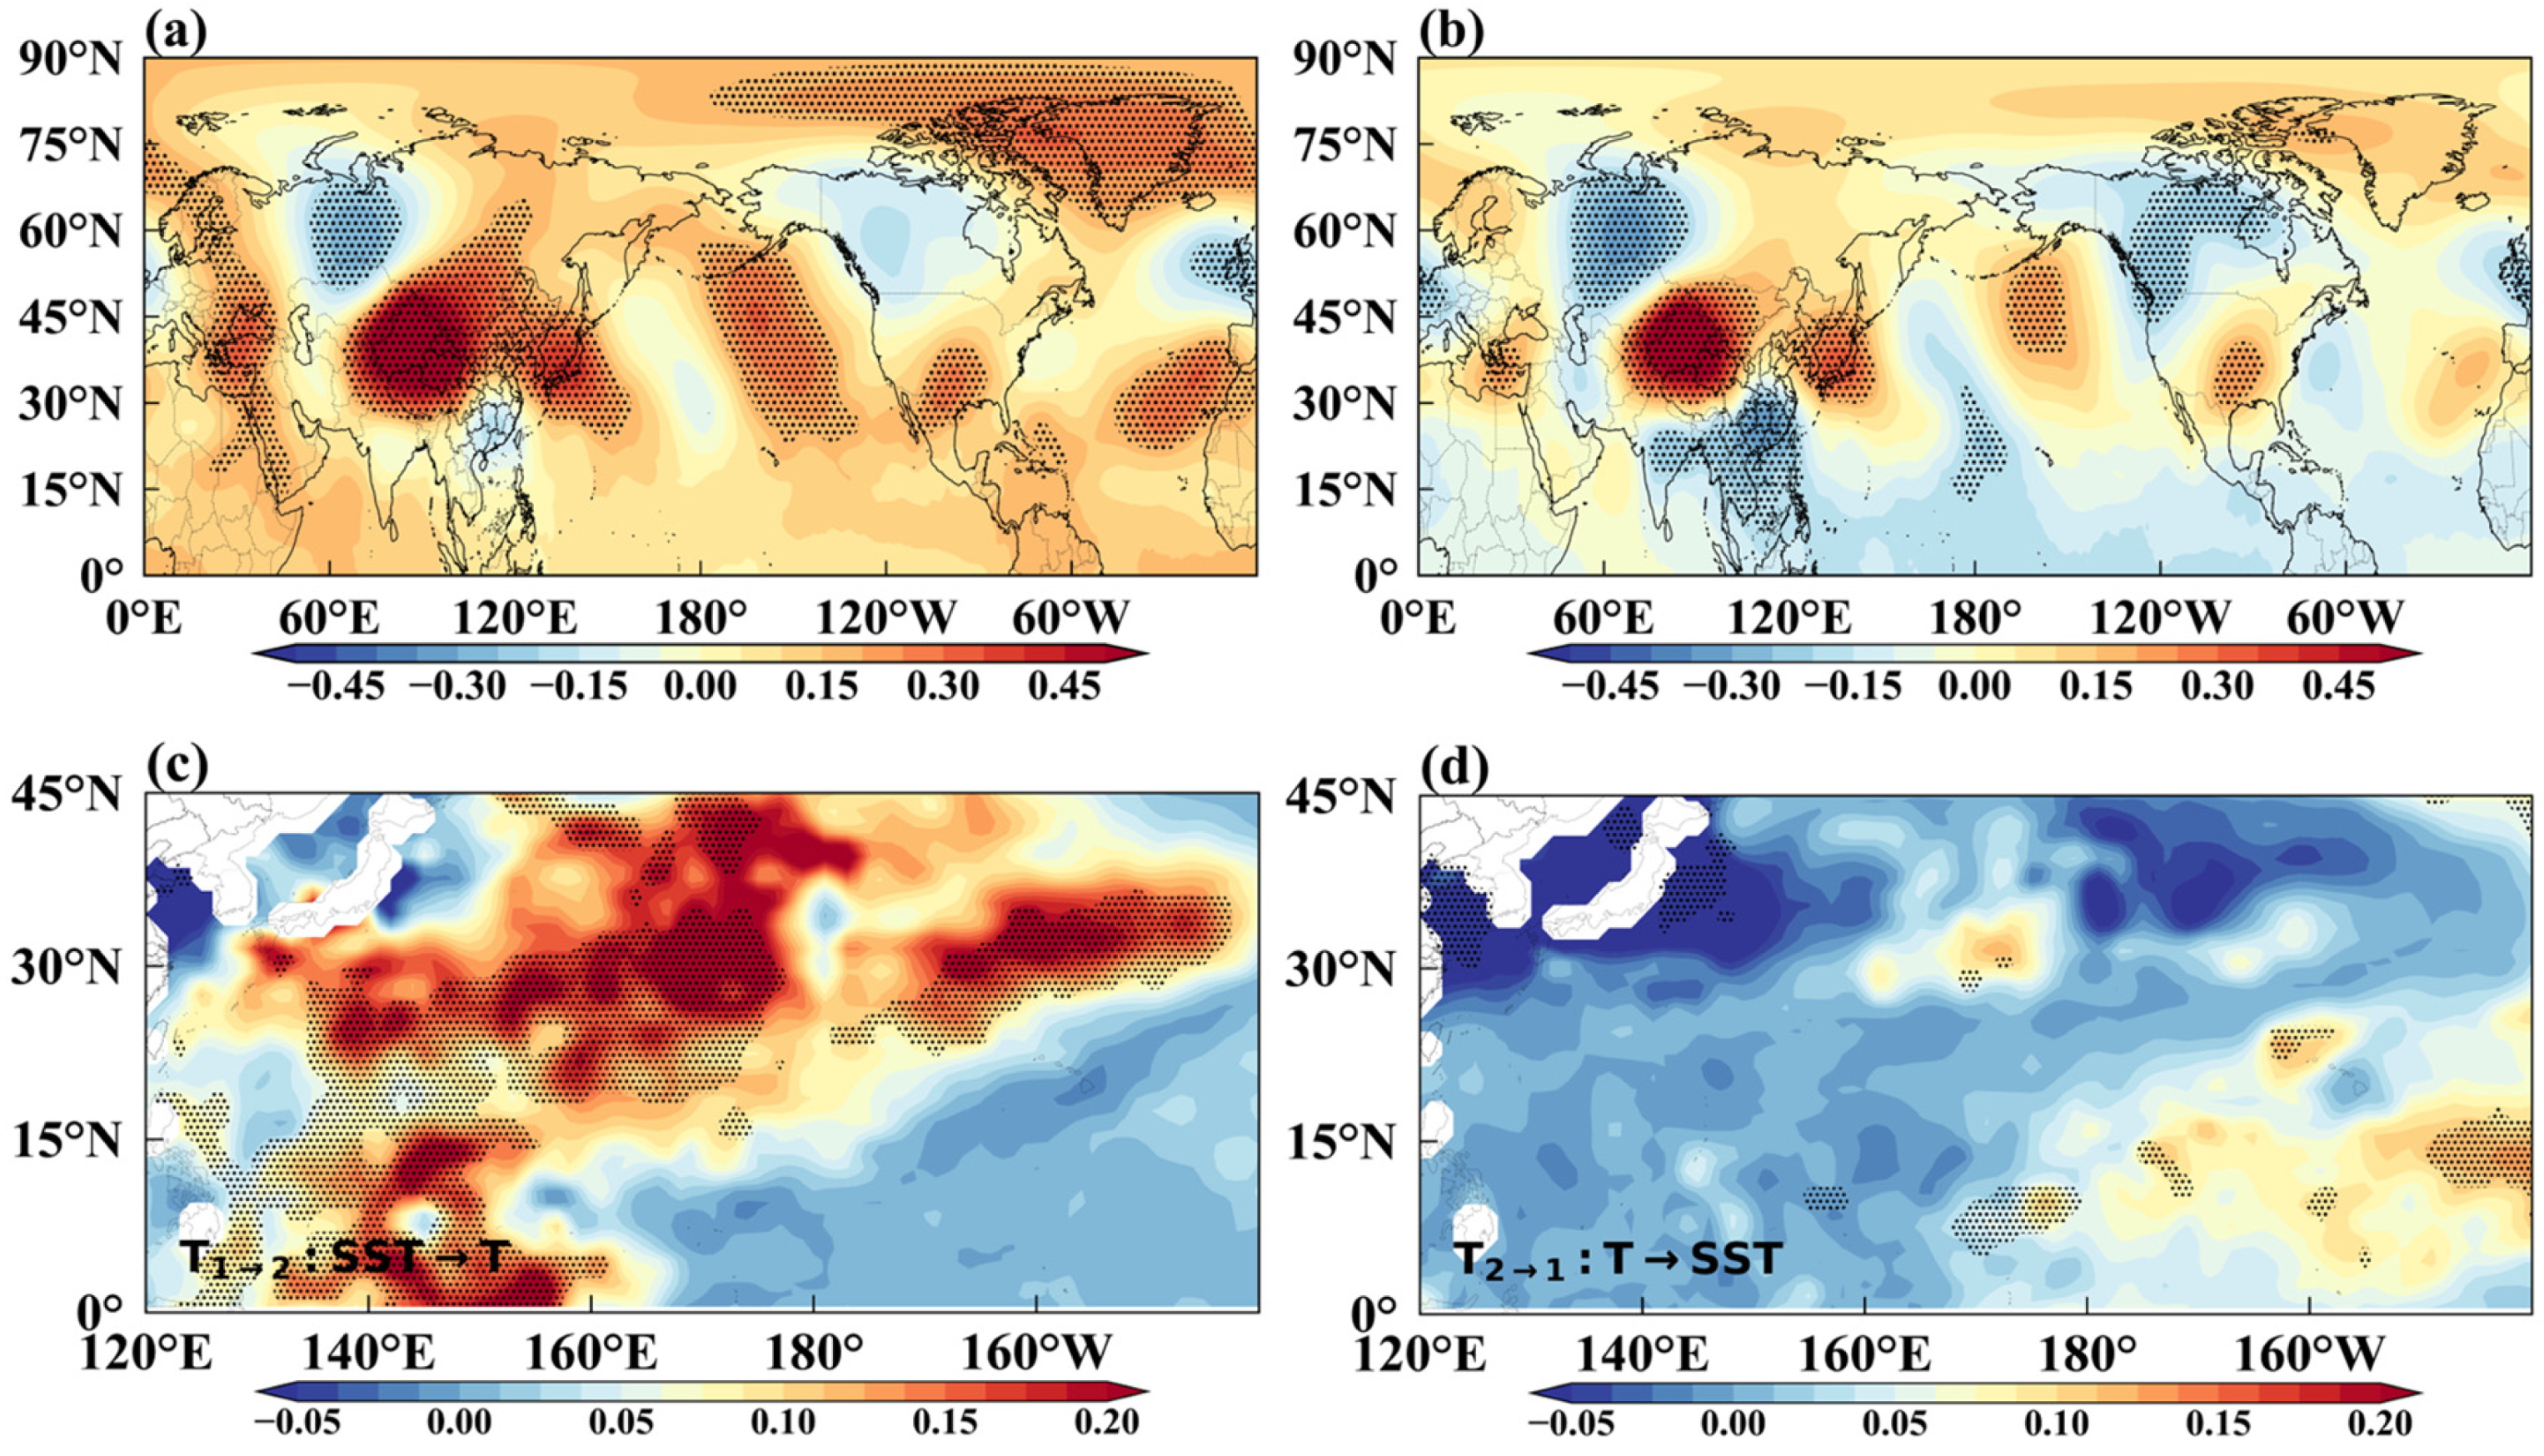
What is the mechanism linking North Pacific SST to temperature variations in Northwest China? The spatial correlation between geopotential height and surface temperature (Figure 10a) revealed a pronounced wave train connecting the North Pacific and Northwest China, which became even clearer after detrending (Figure 10b). Previous studies have demonstrated that North Pacific SST anomalies influence interannual temperature variability in Northern China [44,45], Therefore, this pattern possibly suggests a strong dynamic connection with surface temperature over Northwest China. Information flow analysis further revealed a substantial directional influence from North Pacific SSTs to surface temperature in Northwest China (Figure 10c), whereas the reverse influence—from Northwest China surface temperatures to North Pacific SSTs—was negligible (Figure 10d).
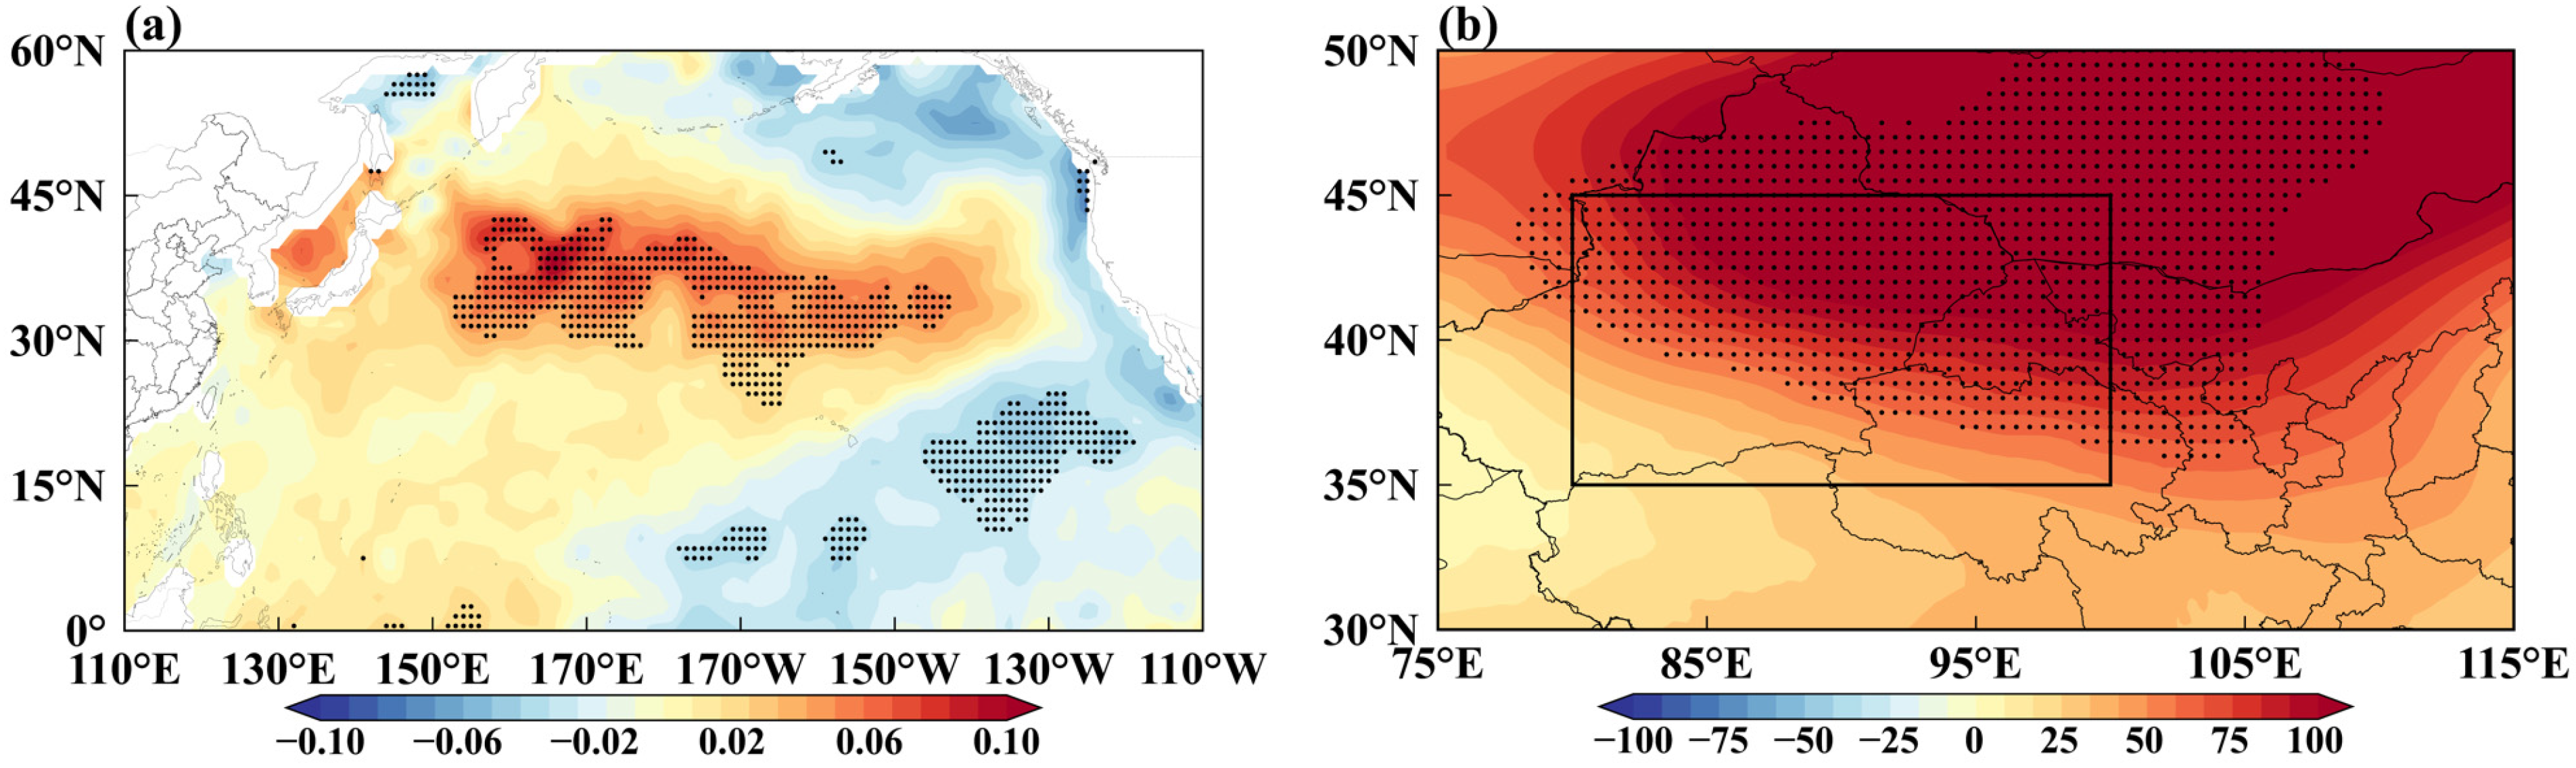
Further examination revealed a significant upward trend in North Pacific SST (Figure 11a), which, through wave train processes (Figure 10a,b), has driven a notable increase in 500 hPa geopotential height anomalies over Northwest China (Figure 11b). Elevated geopotential heights are commonly associated with increased surface pressure and enhanced subsidence, leading to suppressed low cloud formation (Figure 7c) and enhanced surface temperature (Figure 4c).

5. Conclusions and Discussion

Using ERA5 reanalysis data and CAM-Chem model simulations, this study examined the upward trend in summer surface ozone (O3) concentrations in Northwest China from 1980 to 2020 and identified the underlying contributing factors. A significant increasing trend in surface O3 concentrations was observed in Northwest China from 1980 to 2020. Nevertheless, this upward trend was not monotonic; O3 concentrations rose sharply during 1993–2010 but declined noticeably in the other two intervals. The substantial O3 increase observed between 1993 and 2010 dominated the long-term trend and primarily governed the overall evolution of surface O3 concentrations from 1980 to 2020.
A weak positive O3 anomaly transferred from the stratosphere into the lower troposphere during the summer of 2003 contributed minimally to the overall increase in O3 concentrations from 1993 to 2010. In contrast, surface air temperature emerged as a crucial factor influencing surface O3 concentrations. Both ERA5 reanalysis data and CAM-Chem model simulations revealed a strong positive correlation between surface temperature and O3 in Northwest China during the period from 1993 to 2010. Rising temperatures enhanced the reaction HO2 + NO → NO2 + OH, resulting in decreased HO2 concentrations, increased NO2 production, and elevated NOx levels. The increase in NOx further promoted photochemical O3 formation, consistent with the substantial rise in surface O3 observed between 1993 and 2010.
Further analysis revealed that the reduction in low cloud cover facilitated increased solar radiation reaching the surface, thereby enhancing shortwave radiation and contributing to the rise in surface temperature. Concurrently, rising sea surface temperature (SST) in the North Pacific has modulated atmospheric circulation via wave train processes, strengthening the geopotential height field. These circulation changes reinforce the reduction in low cloud cover and the associated increases in surface temperature and O3 concentrations over Northwest China. The decadal variability of North Pacific SSTs may therefore serve as an important indicator of long-term surface ozone variability in this region.

Author Contributions

Y.H.: Writing—original draft, Methodology. G.Z. and K.W.: Formal analysis, Data curation. X.T.: Software, Investigation. W.W. and W.G.: Validation, Resources. F.X.: Writing—review & editing. All authors have read and agreed to the published version of the manuscript.

Funding

This research was funded by the National Natural Science Foundation of China (42275084, 42575066, and 42375070) and the Shaanxi Youth Science and Technology Star Project (2025ZC-KJXX-113).

Data Availability Statement

ERA5 reanalysis data are available at https://www.ecmwf.int/en/forecasts/datasets/reanalysis-datasets/era5 (accessed on 5 April 2023). CAM-Chem model simulated data can be provided to readers by contacting the corresponding author. The data cannot be made publicly available upon publication because they are owned by a third party and the terms of use prevent public distribution. The data that support the findings of this study are available upon reasonable request from the authors.

Acknowledgments

We thank the National Center for Atmospheric Research (NCAR) for providing the CAM-Chem model, and the European Centre for Medium-Range Weather Forecasts (ECMWF) for the ERA5 reanalysis data.

Conflicts of Interest

Author Xinlong Tan is employed by Inspur Yunzhou Industrial Internet Co., Ltd., Jinan, China. The company had no role in the design of the study; in the collection, analyses, or interpretation of data; in the writing of the manuscript; or in the decision to publish the results. The remaining authors declare no conflicts of interest.

References

  1. Gao, M.; Gao, J.; Zhu, B.; Kumar, R.; Lu, X.; Song, S.; Zhang, Y.; Jia, B.; Wang, P.; Beig, G.; et al. Ozone Pollution over China and India: Seasonality and Sources. Atmos. Chem. Phys. 2020, 20, 4399–4414. [Google Scholar] [CrossRef]
  2. Wang, Z.L.; Huang, X.; Wang, N.; Xu, J.W.; Ding, A.J. Aerosol-Radiation Interactions of Dust Storm Deteriorate Particle and Ozone Pollution in East China. J. Geophys. Res. Atmos. 2020, 125, e2020JD033601. [Google Scholar] [CrossRef]
  3. Shang, N.; Gui, K.; Che, H.; Zhang, X. Toward an Operational Machine-Learning-Based Model for Deriving the Real-Time Gapless Diurnal Cycle of Ozone Pollution in China with CLDAS Data. Environ. Sci. Technol. 2024, 58, 2553–2559. [Google Scholar] [CrossRef]
  4. Wang, Z.Y.; Shi, Z.; Wang, F.; Liang, W.; Shi, G.; Wang, W.; Chen, D.; Liang, D.; Feng, Y.; Russell, A.G. Implications for Ozone Control by Understanding the Survivor Bias in Observed Ozone-Volatile Organic Compounds System. npj Clim. Atmos. Sci. 2022, 5, 39. [Google Scholar] [CrossRef]
  5. Wang, J.; Li, J.; Li, X.L.; Wang, D.L.; Fang, C.S. Relationship between Ozone and Air Temperature in Future Conditions: A Case Study in Sichuan Basin, China. Environ. Pollut. 2024, 343, 123276. [Google Scholar] [CrossRef] [PubMed]
  6. Lu, X.; Ye, X.P.; Zhou, M.; Zhao, Y.H.; Weng, H.J.; Kong, H.; Liu, K.; Gao, M.; Zheng, B.; Lin, J.T.; et al. The Underappreciated Role of Agricultural Soil Nitrogen Oxide Emissions in Ozone Pollution Regulation in North China. Nat. Commun. 2021, 12, 25021. [Google Scholar] [CrossRef]
  7. Li, M.Y.; Yang, Y.; Wang, H.L.; Li, H.M.; Wang, P.Y.; Liao, H. Summertime Ozone Pollution in China Affected by Stratospheric Quasi-Biennial Oscillation. Atmos. Chem. Phys. 2023, 23, 1533–1544. [Google Scholar] [CrossRef]
  8. Hang, J.; Liang, J.; Wang, X.M.; Zhang, X.L.; Wu, L.L.; Shao, M. Investigation of O3–NOx–VOCs Chemistry and Pollutant Dispersion in Street Canyons with Various Aspect Ratios by CFD Simulations. Build. Environ. 2022, 226, 109667. [Google Scholar] [CrossRef]
  9. Zhao, H.; Wang, Y.Y.; Zhang, Z. Increased Ground–Level O3 during the COVID–19 Pandemic in China Aggravates Human Health Risks but Has Little Effect on Winter Wheat Yield. Environ. Pollut. 2023, 338, 122713. [Google Scholar] [CrossRef]
  10. Lu, X.; Hong, J.; Zhang, L.; Cooper, O.R.; Schultz, M.G.; Xu, X.; Wang, T.; Gao, M.; Zhao, Y.; Zhang, Y. Severe Surface Ozone Pollution in China: A Global Perspective. Environ. Sci. Technol. Lett. 2018, 5, 487–494. [Google Scholar] [CrossRef]
  11. Liu, L.W.; Duan, Y.H.; Li, L.L.; Xu, L.S.; Yang, Y.S.; Cu, X. Spatiotemporal Trends of PM2.5 Concentrations and Typical Regional Pollutant Transport during 2015–2018 in China. Urban Clim. 2020, 34, 100710. [Google Scholar] [CrossRef]
  12. Li, M.M.; Huang, X.; Yan, D.; Lai, S.Y.; Zhang, Z.H.; Zhu, L.; Lu, Y.T.; Jiang, X.Y.; Wang, N.; Wang, T.J.; et al. Coping with the Concurrent Heatwaves and Ozone Extremes in China under a Warming Climate. Sci. Bull. 2024, 69, 2938–2947. [Google Scholar] [CrossRef]
  13. Wu, N.; Geng, G.; Xu, R.; Liu, S.; Liu, X.; Shi, Q.; Zhou, Y.; Zhao, Y.; Liu, H.; Song, Y.; et al. Development of a High-Resolution Integrated Emission Inventory of Air Pollutants for China. Earth Syst. Sci. Data. 2024, 16, 2893–2915. [Google Scholar] [CrossRef]
  14. Zhang, Y.; Brasseur, G.; Kanakidou, M.; Granier, C.; Daskalakis, N.; Poulidis, A.P.; Qu, K.; Vrekoussis, M. Towards an Integrated Inventory of Anthropogenic Emissions for China. EGUsphere 2025, 6, 1–26. [Google Scholar] [CrossRef]
  15. Zhang, X.R.; Xiao, X.; Wang, F.; Brasseur, G.; Chen, S.Y.; Wang, J.; Gao, M. Observed Sensitivities of PM2.5 and O3 Extremes to Meteorological Conditions in China and Implications for the Future. Environ. Int. 2022, 168, 107428. [Google Scholar] [CrossRef] [PubMed]
  16. Wang, X.; Zhu, J.; Jiao, G.; Chen, X.; Yang, Z.; Chen, L.; Jin, X.; Liao, H. Meteorological Influence on Surface Ozone Trends in China: Assessing Uncertainties Caused by Multi-Dataset and Multi-Method. Atmos. Chem. Phys. 2025, 25, 13863–13878. [Google Scholar] [CrossRef]
  17. Li, H.; Yang, Y.; Su, H.; Wang, H.; Wang, P.; Liao, H. Ozone Pollution in China Affected by Climate Change in a Carbon Neutral Future as Predicted by a Process-Based Interpretable Machine Learning Method. Geophys. Res. Lett. 2024, 51, e2024GL109520. [Google Scholar] [CrossRef]
  18. Wang, Y.Y.; Guo, Z.Y.; Han, J. The Relationship between Urban Heat Island and Air Pollutants and Them with Influencing Factors in the Yangtze River Delta, China. Ecol. Indic. 2021, 129, 107976. [Google Scholar] [CrossRef]
  19. Xia, Y.; Hu, Y.Y.; Huang, Y.; Bian, J.C.; Zhao, C.F.; Wei, J.; Yan, Y.Y.; Xie, F.; Lin, J. Concurrent Hot Extremes and High Ultraviolet Radiation in Summer over the Yangtze Plain and Their Possible Impact on Surface Ozone. Environ. Res. Lett. 2022, 17, 064001. [Google Scholar] [CrossRef]
  20. Zhou, X.; Li, M.; Huang, X.; Liu, T.; Zhang, H.; Qi, X.; Ding, A. Urban Meteorology–Chemistry Coupling in Compound Heat–Ozone Extremes. Nat. Cities 2025, 2, 847–856. [Google Scholar] [CrossRef]
  21. Li, N.; Liang, J.P.; Liu, W.W.; Gu, C.K.; Li, J.D.; Xu, Y.; Tang, K.Q.; Liao, H.; Hu, J.L. Mechanisms of High-Temperature Ozone Suppression in Eastern China: A Meteorological Perspective. Environ. Res. Lett. 2025, 20, 094001. [Google Scholar] [CrossRef]
  22. Gu, Y.X.; Li, K.; Xu, J.M.; Liao, H.; Zhou, G.Q. Observed Dependence of Surface Ozone on Increasing Temperature in Shanghai, China. Atmos. Environ. 2020, 221, 117108. [Google Scholar] [CrossRef]
  23. Zheng, H.; Kong, S.F.; He, Y.; Song, C.B.; Cheng, Y.; Yao, L.Q.; Chen, N.; Zhu, B. Enhanced Ozone Pollution in the Summer of 2022 in China: The Roles of Meteorology and Emission Variations. Atmos. Environ. 2023, 301, 119701. [Google Scholar] [CrossRef]
  24. Luo, Y.; Zhao, T.; Meng, K.; Hu, J.; Yang, Q.; Bai, Y.; Yang, K.; Fu, W.; Tan, C.; Zhang, Y.; et al. A Mechanism of Stratospheric O3 Intrusion into the Atmospheric Environment: A Case Study of the North China Plain. Atmos. Chem. Phys. 2024, 24, 7013–7026. [Google Scholar] [CrossRef]
  25. Meng, K.; Zhao, T.; Bai, Y.; Wu, M.; Cao, L.; Hou, X.; Luo, Y.; Jiang, Y. Tracing the Origins of Stratospheric Ozone Intrusions: Direct vs. Indirect Pathways and Their Impacts on Central and Eastern China in Spring-Summer 2019. Atmos. Chem. Phys. 2024, 24, 12623–12642. [Google Scholar] [CrossRef]
  26. Sun, L.; Xue, L.; Wang, T.; Gao, J.; Ding, A.; Cooper, O.R.; Lin, M.; Xu, P.; Wang, Z.; Wang, X.; et al. Significant Increase of Summertime Ozone at Mount Tai in Central Eastern China. Atmos. Chem. Phys. 2016, 16, 10637–10650. [Google Scholar] [CrossRef]
  27. Ravi, S. Environmental and Non-Conventional Security Threat in South Asia: A Study. South India J. Soc. Sci. 2022, 20, 164–182. [Google Scholar]
  28. Liu, X.; Zhai, S.; Li, K.; Zhu, L.; Liu, S.; Shah, V.; Tai, A.P.K.; Geng, G.; Hou, X.; Mamtimin, A.; et al. Particulate matter (PM) and ozone air quality in Urumqi of Northwest China: Seasonality, trends, and sources. Atmos. Environ. 2025, 350, 121150. [Google Scholar] [CrossRef]
  29. Tong, Y.; Yan, Y.; Lin, J.; Kong, S.; Tong, Z.; Zhu, Y.; Yan, Y.; Sun, Z. Machine-learning-based corrections of CMIP6 historical surface ozone in China during 1950–2014. Environ. Pollut. 2024, 357, 124397. [Google Scholar] [CrossRef]
  30. Rayner, N.A.; Brohan, P.; Parker, D.; Folland, C.K.; Kennedy, J.J.; Vanicek, M.; Ansell, T.; Tett, S. Improved Analyses of Changes and Uncertainties in Sea Surface Temperature Measured In Situ since the Mid-Nineteenth Century: The HadSST2 Dataset. J. Clim. 2006, 19, 446–469. [Google Scholar] [CrossRef]
  31. Emmons, L.K.; Schwantes, R.H.; Orlando, J.J.; Tyndall, G.; Kinnison, D.; Lamarque, J.; Marsh, D.; Mills, M.J.; Tilmes, S.; Bardeen, C.; et al. The Chemistry Mechanism in the Community Earth System Model Version 2 (CESM2). J. Adv. Model. Earth Syst. 2020, 12, e2019MS001882. [Google Scholar] [CrossRef]
  32. Hong, J.; Wang, H.Y.; Wang, W.K.; Zhu, J.T.; Deng, H.Y.; Wang, H. Impacts of Stratosphere–to–Troposphere Transport on Tropospheric Ozone in Southeastern China: Insights from Ozonesonde Observations. Environ. Res. Lett. 2024, 19, 064001. [Google Scholar] [CrossRef]
  33. Li, M.; Liu, H.; Geng, G.; Hong, C.; Liu, F.; Song, Y.; Tong, D.; Zheng, B.; Cui, H.; Man, H.; et al. Anthropogenic Emission Inventories in China: A Review. Natl. Sci. Rev. 2017, 4, 834–866. [Google Scholar] [CrossRef]
  34. Hagan, D.F.; Wang, G.; Liang, X.; Dolman, H.A. A Time-Varying Causality Formalism Based on the Liang-Kleeman Information Flow for Analyzing Directed Interactions in Nonstationary Climate Systems. J. Clim. 2019, 32, 7521–7537. [Google Scholar] [CrossRef]
  35. Liang, X.S. Information Flow and Causality as Rigorous Notions Ab Initio. Phys. Rev. E 2016, 94, 052201. [Google Scholar] [CrossRef]
  36. Yin, X.; Rupakheti, D.; Zhang, G.; Luo, J.; Kang, S.; de Foy, B.; Yang, J.; Ji, Z.; Cong, Z.; Rupakheti, M.; et al. Surface Ozone over the Tibetan Plateau Controlled by Stratospheric Intrusion. Atmos. Chem. Phys. 2023, 23, 10137–10143. [Google Scholar] [CrossRef]
  37. Chen, Z.; Liu, J.; Qie, X.; Cheng, X.; Yang, M.; Shu, L.; Zang, Z. Stratospheric Influence on Surface Ozone Pollution in China. Nat. Commun. 2024, 15, 4064. [Google Scholar] [CrossRef]
  38. Yang, J.; Wang, Y.; Zhang, L.; Zhao, Y. Investigating the Response of China’s Surface Ozone Concentration to the Future Changes of Multiple Factors. Atmos. Chem. Phys. 2025, 25, 2649–2666. [Google Scholar] [CrossRef]
  39. Bloomer, B.J.; Stehr, J.W.; Piety, C.A.; Salawitch, R.J.; Dickerson, R.R. Observed Relationships of Ozone Air Pollution with Temperature and Emissions. Geophys. Res. Lett. 2009, 36, L09803. [Google Scholar] [CrossRef]
  40. Atkinson, R. Atmospheric Chemistry of VOCs and NOx. Atmos. Environ. 2000, 34, 2063–2101. [Google Scholar] [CrossRef]
  41. Liu, W.; Song, W.L. Impact of the Sea Surface Temperature Anomaly in the Eastern North Pacific on Interannual Variations of Winter Temperature in Northern China. Clim. Environ. Res. 2018, 23, 275–286. [Google Scholar]
  42. Li, L.P.; Ni, W.J.; Li, Y.G.; Guo, D.; Gao, H. Impacts of Sea Surface Temperature and Atmospheric Teleconnection Patterns in the Northern Mid-Latitudes on Winter Extremely Cold Events in North China. Adv. Meteorol. 2021, 2021, 8853457. [Google Scholar] [CrossRef]
  43. Du, Z.; Zhou, L.T.; Liu, K.; Yin, X. Enhanced Rainfall in North China in July 2021: Role of the North Pacific SST Gradient. Atmos. Ocean. Sci. Lett. 2024, 17, 100444. [Google Scholar] [CrossRef]
  44. Hofzumahaus, A.; Rohrer, F.; Lu, K.; Bohn, B.; Brauers, T.; Chang, C.C.; Fuchs, C.; Hassler, H.; Holland, R.; Kita, W.; et al. Amplified Trace Gas Removal in the Troposphere. Science 2009, 324, 1702–1704. [Google Scholar] [CrossRef]
  45. Li, K.; Jacob, D.J.; Liao, H.; Shen, L.; Zhang, Q.; Bates, K.H. Anthropogenic Drivers of 2013–2017 Trends in Summer Surface Ozone in China. Proc. Natl. Acad. Sci. USA 2019, 116, 422–427. [Google Scholar] [CrossRef]
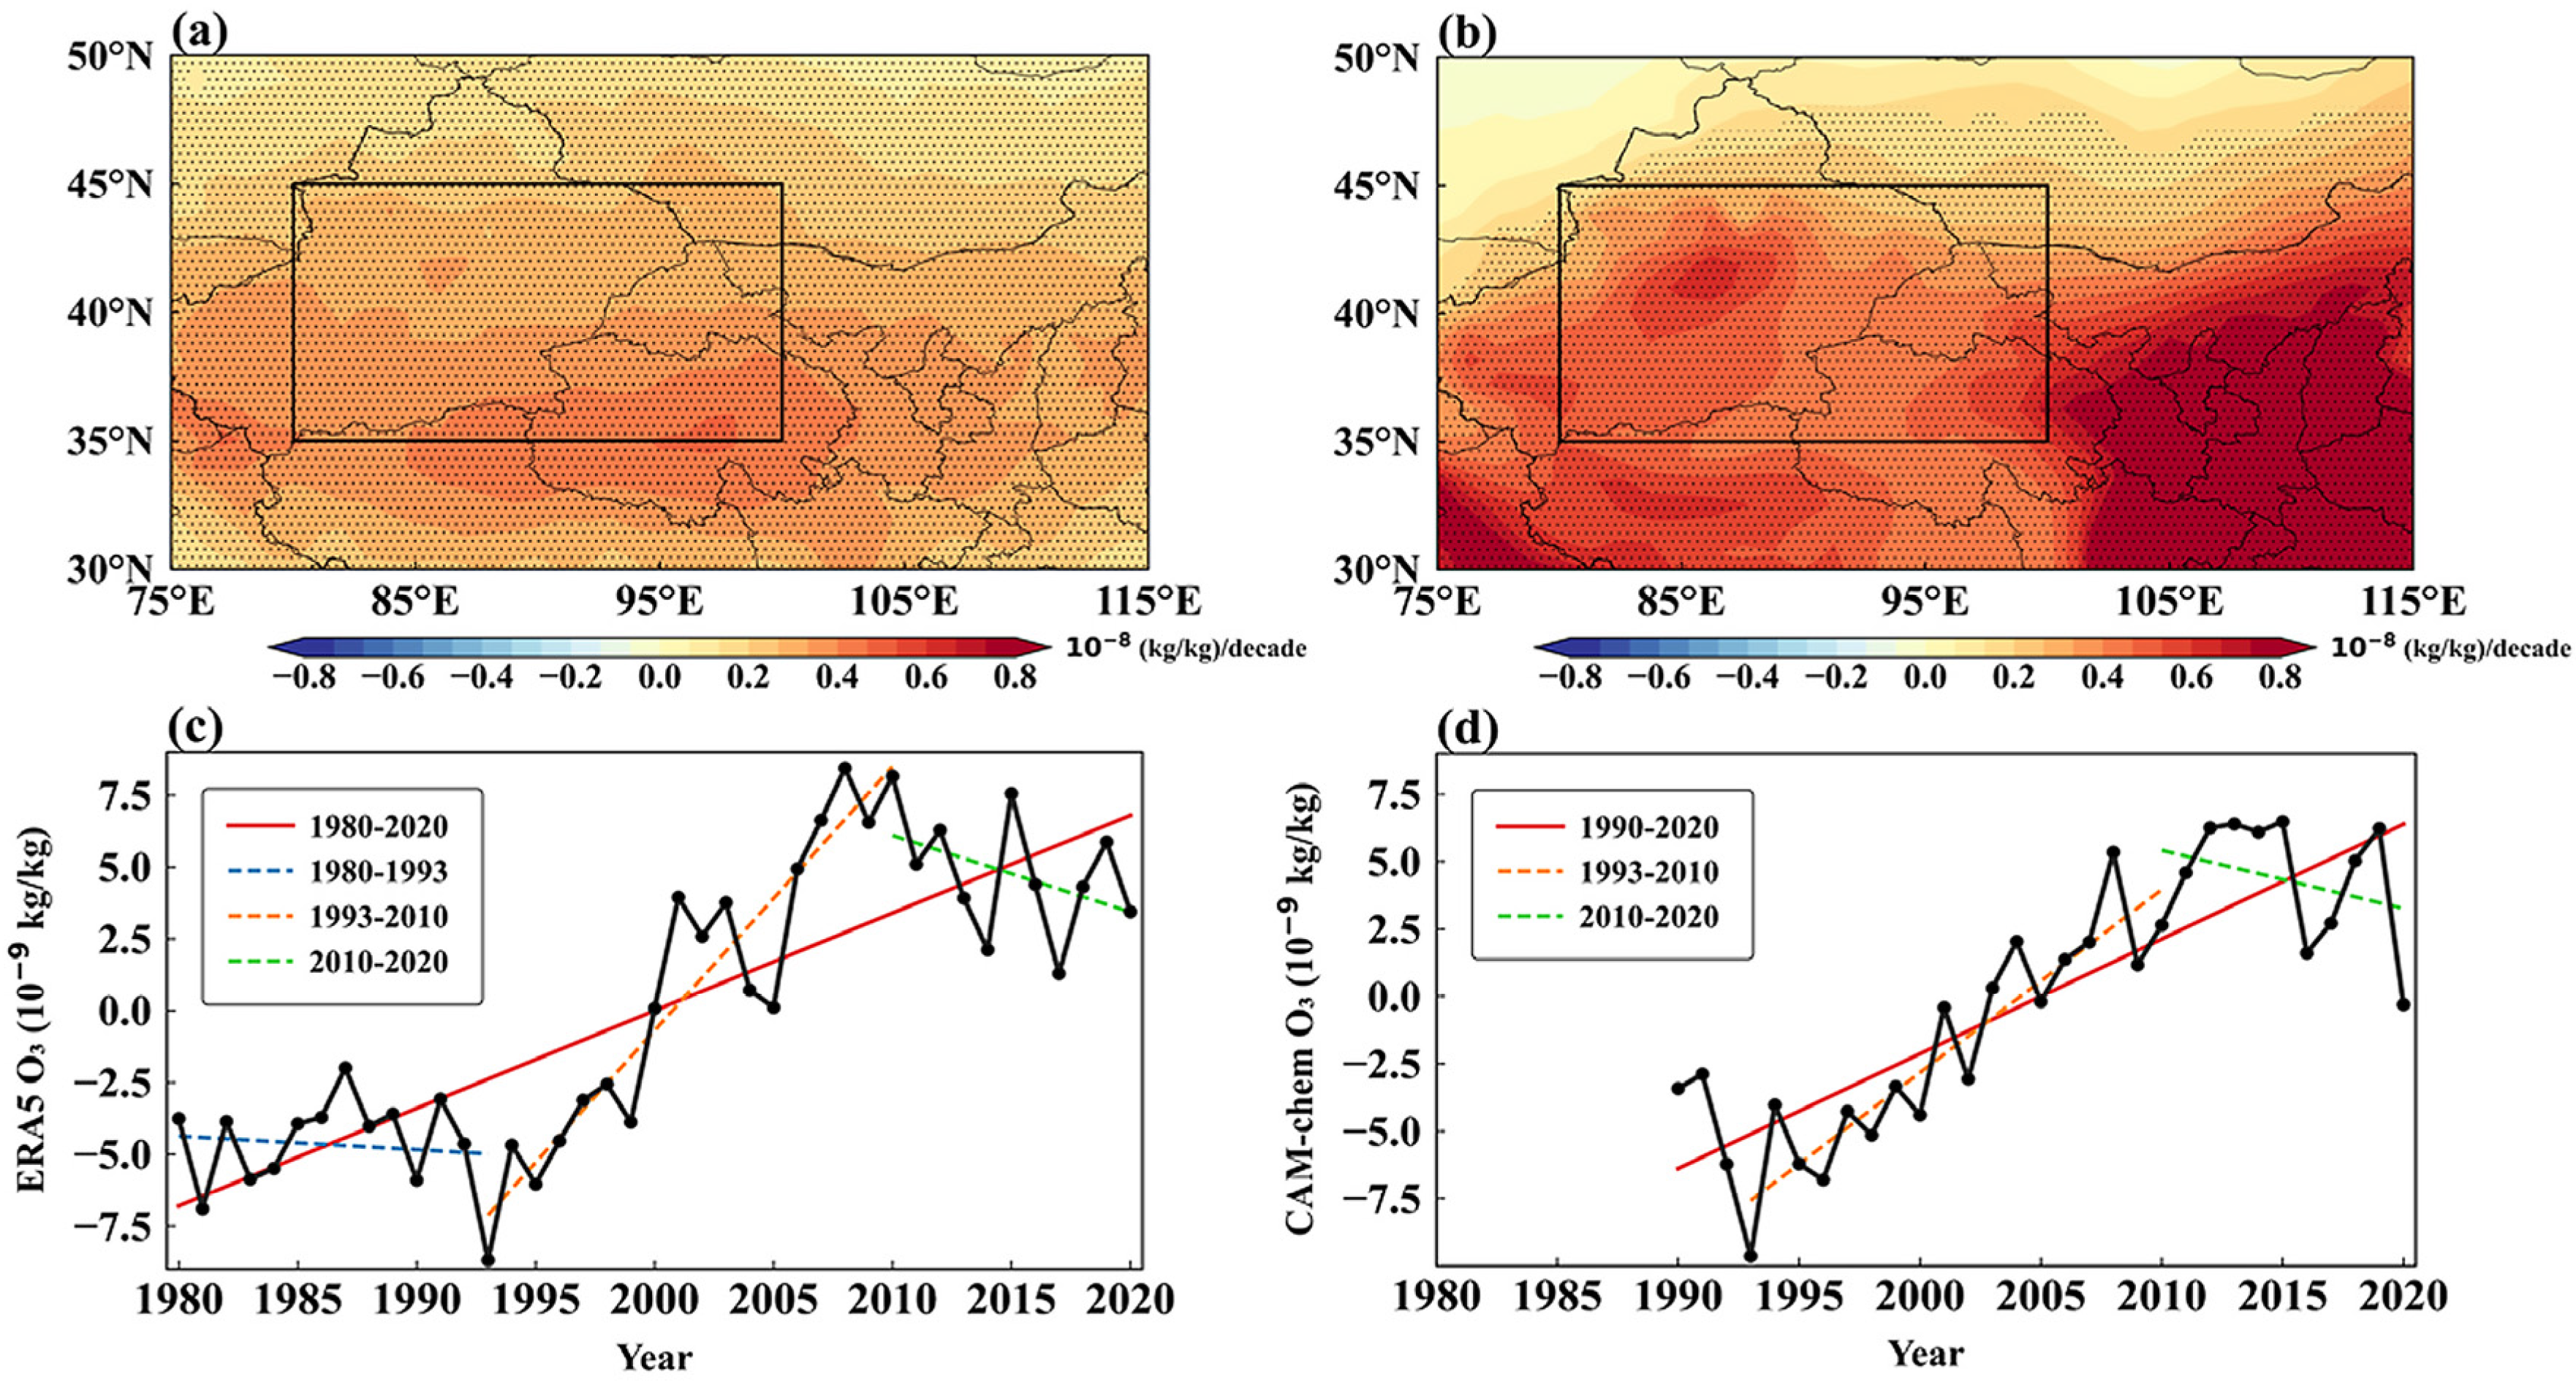
Figure 1. (a,b) Linear trends of summer (June–August, JJA) O3 anomalies at 900 hPa and (c,d) time series of O3 anomalies in Northwest China (as indicated by the black frames in panels (a,b)). Panels (a,c) cover the period from 1980 to 2020 based on ERA5 reanalysis data, while panels (b,d) span from 1990 to 2020 based on CAM-Chem model simulations. The black frame in panels (a,b) delineates Northwest China: 35–45°N, 80–100°E. Stippling indicates regions where trends are statistically significant at the 99% confidence level (two-tailed test). The straight lines in panels (c,d) represent the linear trends, with shorter lines corresponding to the periods 1980–1993, 1993–2010, and 2010–2020 in panel (c), and 1993–2010 and 2010–2020 in panel (d). The colored dashed lines carry the same meaning in all subsequent figures as defined here. Note that since ERA5 reanalysis and CAM-Chem model simulations do not provide surface atmospheric composition data, this study used 900 hPa data as a proxy for surface conditions, consistent with previous studies [28,29] that have also analyzed surface conditions at this level.
Remotesensing 18 01800 g001
Figure 2. Climatology distribution of summer surface (a,b) O3 and (c,d) temperature (a,c) from 1980 to 2020 based on ERA5 reanalysis data, and (b,d) from 1990 to 2020 based on CAM-Chem model simulations.
Remotesensing 18 01800 g002
Figure 3. (a,b) Time-height anomalies of summer O3 and (c,d) time series of O3 (black lines) and vertical velocity (red lines) averaged between 200 and 500 hPa in Northwest China. Panels (a,c) are based on ERA5 reanalysis data, while panels (b,d) are based on CAM-Chem model simulations.
Remotesensing 18 01800 g003
Figure 4. (a) Horizontal distribution of the correlation coefficients between summer surface temperature and O3 anomalies from 1980 to 2020 based on ERA5 reanalysis data. Stippling indicates regions where correlation coefficients are significant at the 99% confidence level (two-tailed test). (c) Time series of temperature anomalies in Northwest China (black frames in panel (a)). Trend lines represent the periods 1980−1993, 1993−2010, and 2010−2020. Panels (b,d) show distributions after removing liner trend variations from panels (a,c).
Remotesensing 18 01800 g004
Figure 5. (a) Horizontal distribution of correlation coefficients between summer surface temperature and O3 anomalies from 1990 to 2020 based on CAM-Chem model simulations. Stippling indicates regions with correlations significant at the 99% confidence level (two-tailed test). (b) Same as (a) but after removing linear trends. (c) Time series of temperature anomalies in Northwest China (black box in (a)). (d) Same as (c) but after removing linear trends. Panels (c,d) are also based on CAM-Chem simulations.
Remotesensing 18 01800 g005
Figure 6. Time series of summer (a) HO2 and (b) NOx in Northwest China from 1990 to 2020 based on CAM-Chem model simulations.
Remotesensing 18 01800 g006
Figure 7. Anomalies of summer (a) surface shortwave radiation (SSRD), (b) surface longwave radiation (SLRD) and (c) low cloud cover anomalies from 1980 to 2020 in Northwest China. (d) Linear trends of summer low cloud cover anomalies from 1993 to 2010. Stippling indicates regions where trends are statistically significant at the 95% confidence level (two-tailed test).
Remotesensing 18 01800 g007
Figure 8. The correlation coefficients between the summer North Pacific sea surface temperature (SST) and surface temperature anomalies from 1993 to 2010. Stippling indicates regions where correlation coefficients are statistically significant at the 95% confidence level (two-tailed test).
Remotesensing 18 01800 g008
Figure 9. (a,c,e) The first two empirical orthogonal function (EOF) modes and their combined pattern of summer North Pacific SST anomalies from 1980 to 2020. (b,d,f) The corresponding principal component (PC) time series (black lines), along with summer temperature anomalies in Northwest China (red lines). The three short dashed lines correspond to the linear trends for the periods 1980–1993, 1993–2010, and 2010–2020, respectively. ‘Cor’ denotes the correlation coefficient between the PC and temperature. Asterisks indicate correlation coefficients that are significant at the 99% confidence level.
Remotesensing 18 01800 g009
Figure 10. (a) Horizontal distribution of the correlation coefficients between 500 hPa geopotential height and surface temperature anomalies in the Northern Hemisphere. (b) Distribution of correlation coefficients after the removal of linear trend variations from panel (a). (c,d) Information flow between the summer North Pacific SST (symbolized by subscripts 2) and surface temperature in Northwest China (symbolized by subscripts 2). (c) T 1 2 ; (d) T 2 1 . Stippling indicates regions where correlation coefficients or information flow are statistically significant at the 95% confidence level (two-tailed test).
Remotesensing 18 01800 g010
Figure 11. Linear trends of summer: (a) North Pacific SST anomalies and (b) geopotential height anomalies at 500 hPa from 1993 to 2010. Stippling indicates regions where trends are statistically significant at the 95% confidence level (two-tailed test).
Remotesensing 18 01800 g011
Disclaimer/Publisher’s Note: The statements, opinions and data contained in all publications are solely those of the individual author(s) and contributor(s) and not of MDPI and/or the editor(s). MDPI and/or the editor(s) disclaim responsibility for any injury to people or property resulting from any ideas, methods, instructions or products referred to in the content.