


Highlights
What are the main findings?
- Multi-perspective contribution analysis reveals that while the R-factor dominates the largest area (46.85%) in relative terms, the C-factor contributes most significantly to actual erosion reduction, with negative contributions across 98.68% of the basin.
- PLS-SEM reveals distinct dominant controls across scales: the R-factor exerts the strongest direct effect on soil erosion at the temporal scale, while the LS-factor dominates at the spatial scale.
What are the implications of the main findings?
- The four management zones (Successfully treated, Potential rebound risk, Emergency treatment, and Monitoring priority areas) provide spatially explicit guidance for optimizing soil and water conservation investments in ecologically fragile regions.
- The combined use of relative and absolute contribution analysis offers a more comprehensive framework for disentangling complex driver–effect relationships in long-term soil erosion studies.
Abstract
Soil erosion is a serious problem threatening regional ecological security, particularly in the Loess Plateau of China. This study focuses on the Wuding River Basin on the Loess Plateau. Based on multi-source data from 2001 to 2024, the RUSLE model was used to estimate the soil erosion modulus. We used comprehensive methods, such as trend analysis, multiple regression, scenario simulation, partial least squares structural equation modeling (PLS-SEM), hot spot analysis, and Hurst exponent, to systematically analyze the spatiotemporal evolution characteristics of soil erosion, the contributions of driving factors, and the sustainability of trends. The results showed that over the 24-year period, the soil erosion modulus in the basin generally showed a decreasing trend, suggesting an improvement in soil erosion conditions. The area of mild and above erosion grades continued to shrink. Among the RUSLE factors, the vegetation cover factor (C) showed a significant downward trend (R2 = 0.7721), with the decreasing area accounting for 95.8%; the rainfall erosivity factor (R) showed a slight upward trend, with the increasing area accounting for 92.7%; and the erosion control practice factor (P) remained stable in most areas (96.8%). Relative contribution analysis indicated that the R-factor dominated the largest area (46.85%), while absolute contribution analysis showed that the C-factor contributed most significantly to erosion reduction. PLS-SEM demonstrated that the influence pathways of natural factors and human activities on soil erosion differed significantly across spatial and temporal scales. On the temporal scale, the R-factor had the strongest direct positive effect on erosion; on the spatial scale, the topography factor (LS) had the strongest positive effect on erosion. Furthermore, we found that the disturbance of vegetation by human activities is being weakened with the continuous implementation of soil and water conservation projects. The cold and hot spots of erosion trends were concentrated in the southeastern part of the basin. Based on trend sustainability, the basin was divided into successfully treated areas (57.6%), potential rebound risk areas (29.4%), emergency treatment areas (11.2%), and monitoring priority areas (1.8%). Overall, this study advances the understanding of soil erosion evolution under long-term ecological restoration and provides a scientific basis for optimizing sustainable soil and water conservation management in the Wuding River Basin.
1. Introduction
Soil erosion is one of the most serious ecological and environmental problems globally, threatening agricultural production, water quality and safety, ecosystem health, and regional sustainable development [1]. According to data published by the Food and Agriculture Organization of the United Nations, approximately 20–37 billion tons of soil are lost globally each year due to water erosion, resulting in farmland degradation, crop yield reduction, and biodiversity loss. Under the combined pressures of climate change and human activities, understanding the spatiotemporal evolution patterns of soil erosion, identifying its dominant driving factors, and assessing the effectiveness of ecological restoration measures have become research hotspots in the fields of soil and water conservation and environmental science [2,3,4,5].
The Loess Plateau is recognized as one of the most severely eroded regions in both China and the world. The loess soils in this region are characterized by loose structure, well-developed vertical joints, and a high susceptibility to disintegration upon contact with water [6]. Combined with highly seasonal precipitation that is concentrated in summer and frequently occurs as intense rainstorms, these conditions result in extremely serious soil and water loss [7]. Over a long period, severe erosion has caused substantial losses of farmland resources and ecosystem degradation. To reverse this trend, the Chinese government has implemented a series of large-scale soil and water conservation programs on the Loess Plateau since the 1950s, including terracing sloping farmland, building check dams, and afforestation [8,9]. In particular, the Grain for Green Project initiated in 1999 has significantly increased regional vegetation cover and reshaped land-use patterns [10]. Monitoring records indicate that the annual sediment discharge of the Yellow River has sharply declined from approximately 1.6 billion tons in the 1970s to 0.3 billion tons in recent years, highlighting the remarkable soil and water conservation programs achievements [11,12]. The Wuding River Basin is located in the northern Loess Plateau, on the southern edge of the Mu Us Sandy Land. It is a first-level tributary of the middle reaches of the Yellow River, with a mainstream length of approximately 491 km and a total basin area of about 30,261 km2 [13,14]. As a typical ecotonal region, the basin comprises diverse geomorphic landscapes, including loess hilly-gully regions, river source ridge-valley areas, and sandy wind regions. Owing to its complex topography and multiple erosion processes, it is one of the main source areas of coarse sediment in the Yellow River [15,16]. The Wuding River Basin is not only a key area for implementing soil and water conservation measures on the Loess Plateau but also a region highly sensitive to climate change and anthropogenic disturbance. Therefore, understanding the spatiotemporal patterns of soil erosion and the interactions among climatic, topographic, vegetation, and anthropogenic drivers in this Basin is of great significance for advancing future soil and water conservation management on the Loess Plateau and even the Yellow River Basin.
Scientific assessment of soil erosion relies on robust and reliable quantitative models [17]. Among the available approaches, the Revised Universal Soil Loss Equation (RUSLE) has become the most widely used soil erosion assessment tool globally due to its simple structure, easily accessible parameters, and strong compatibility with GIS and remote sensing technologies [18,19,20,21]. This model integrates five factors: rainfall erosivity (R), soil erodibility (K), topography (LS), vegetation cover (C), and erosion control practice (P). As such, it provides an effective framework for simulating the spatiotemporal patterns of soil erosion on a large scale. However, against the backdrop of dramatic changes in both anthropogenic activities and environmental conditions in the Wuding River Basin in recent decades, several important challenges remain. In particular, accurately disentangling the relative contributions of multiple driving factors, identifying factor-dominated areas, and subsequently proposing targeted erosion control recommendations remain a challenge.
In recent years, substantial progress has been achieved in studies of soil erosion in the Wuding River Basin. Existing studies, based on long-term observation data from hydrological stations, have revealed a significant decreasing trend in runoff and sediment discharge since 1960, identifying 1971 and 1979 as mutation points for runoff and sediment, respectively [9]. Current evidence consistently indicates that the contribution of human activities (especially soil and water conservation measures) to the reduction in runoff and sediment is much higher than that of climate change, with contribution rates reaching over 75% [9,22]. Among these anthropogenic drivers, check dam construction and vegetation restoration are the two core driving factors: check dams provide short-term flood regulation and sediment interception, while land-use change (especially the Grain for Green Project) exerts long-term effects on soil erosion control. Their synergistic coordination can yield enhanced benefits in regulating runoff and sediment [22]. Spatially, the soil erosion area in the basin has decreased by 53.87% compared to 1985, wind erosion has shifted from concentrated and continuous to sporadic distribution, and the intensity of water erosion has decreased on the left bank of the mainstream [23]. In summary, these studies have laid a solid foundation for understanding the effectiveness of soil and water conservation in the basin, yet several key knowledge gaps persist.
However, several critical scientific questions remain unaddressed in existing research. First, most studies have concentrated on the hydrological response of runoff and sediment discharge, paying insufficient attention to the spatiotemporal evolution patterns of the soil erosion modulus itself. Second, factor attribution analyses have predominantly relied on cumulative curve methods or regression analysis, which are limited in their ability to simultaneously quantify the relative dominance range and actual contribution direction of each contributing factor. Third, the interactions among vegetation (C-factor), precipitation (R-factor), and conservation practices (P-factor), as well as their direct and indirect influence pathways on soil erosion, lack systematic elucidation. Fourth, the sustainability characteristics of erosion evolution trends and their implications for management strategies require further exploration. More importantly, compared with previous studies that mainly focused on runoff–sediment responses or single-factor attribution, the present study provides several original contributions. First, it shifts the analytical focus from hydrological outputs to the spatiotemporal dynamics of the soil erosion modulus itself, thereby offering a more direct understanding of erosion processes. Second, by integrating relative contribution analysis and absolute contribution analysis, this study simultaneously identifies the dominant spatial control ranges of factors and their actual positive or negative effects on erosion intensity. Third, the combination of RUSLE with PLS-SEM enables explicit quantification of both direct and indirect pathways through which climate variability, vegetation restoration, and engineering measures jointly regulate soil erosion. Fourth, by coupling hotspot analysis with the Hurst exponent, the study moves beyond retrospective assessment to evaluate future trend persistence and management risk. These advances improve the mechanistic understanding of the complex soil erosion dynamics of the Loess Plateau under long-term ecological restoration.
To address these gaps, we selected the Wuding River Basin and integrated multi-source remote sensing data, meteorological data, and soil and water conservation measure data spanning 2001–2024. The soil erosion modulus was estimated using the RUSLE model. By comprehensively applying methods such as Sen’s slope estimation, Mann–Kendall trend test, multiple regression analysis, scenario simulation, partial least squares structural equation modeling (PLS-SEM), Getis–Ord Gi* hot spot analysis, and Hurst exponent, this study systematically addresses the following four research objectives: (i) reveal the spatiotemporal evolution characteristics of soil erosion and the three dynamic factors (R, C, P) in the Wuding River Basin from 2001 to 2024; (ii) quantitatively assess the direction and intensity of each factor’s effect on soil erosion from the two dimensions of relative contribution and absolute contribution; (iii) based on the PLS-SEM model, explore the direct and indirect influence pathways of natural factors and human activities on soil erosion and their temporal evolution; and (iv) identify the cold and hot spots of erosion trends, assess the sustainability of evolution trends combined with the Hurst exponent, and propose targeted management zoning recommendations. The findings of this study can provide scientific support for multiple decision-making bodies and stakeholders, including watershed management authorities, soil and water conservation agencies, ecological restoration planners, local governments, agricultural and rural development departments, and Yellow River Basin policy makers. In particular, the proposed management zoning framework can assist these stakeholders in prioritizing investment, optimizing restoration measures, mitigating rebound risks, and promoting sustainable land management in ecologically fragile regions.
2. Study Region and Data
2.1. Study Region
The Wuding River Basin (37°02′31″–38°55′52″N, 108°02′39″–110°34′22″E) is located in northern Shaanxi Province and the Inner Mongolia Autonomous Region of China (Figure 1). It is a primary tributary of the middle reaches of the Yellow River, with a mainstream length of approximately 491 km [13]. The total basin area is about 30,261 km2, with elevations ranging from 568 to 1922 m [14]. The overall terrain is characterized by higher elevations in the northwest and lower elevations in the southeast. Situated in the transitional zone between the southern edge of the Mu Us Sandy Land and the northern Loess Plateau, its landform types mainly include loess hilly-gully regions, river source ridge-valley areas, and sandy wind regions, rendering the basin a typical ecotone and highly fragile area. The regional climate is classified as warm temperate, semi-arid continental monsoon, with an annual temperature of 7.9–11.2 °C and an annual precipitation of 300–500 mm [13]. Precipitation is mainly concentrated from July to September, accounting for about 65% of the annual total. The dominant soil types include cultivated loessial soil, sandy soil, and entisols [24]. Land-use is primarily grassland, farmland, and forestland [25], reflecting the coexistence of agricultural production, grazing systems, and ecological restoration initiatives. This combination of fragile natural conditions, diverse land-use patterns, and intensive ecological engineering activities makes the Wuding River Basin an ideal region for investigating the interactions among climate variability, human activities, and soil erosion dynamics.
Figure 1.
Study region. (a) Study region location; (b) Elevation; (c) Land cover types.
2.2. Data Sources
Land-use information was derived from the annual China Land Cover Dataset (CLCD) developed by Yang and Huang [26]. This 30 m resolution product was later resampled to 500 m to align with other spatial layers. The dataset achieves an overall accuracy of 80%, providing reliable classification across nine land cover types: farmland, forest, shrub, grassland, water bodies, snow/ice, barren land, urban areas, and wetlands.
Rainfall data were obtained from meteorological stations. For the period 2001–2020, precipitation records were acquired from China’s National Climate Centre (https://ncc-cma.net/cn/, accessed from 28 March 2026), comprising 8-hourly rainfall data from 385 stations across the Loess Plateau and its adjacent regions. For 2021–2024, daily rainfall data were obtained from the National Oceanic and Atmospheric Administration (NOAA) website (https://www.climate.gov/maps-data, accessed on 20 December 2025), covering 48 stations within the same broader area. All precipitation records were converted to daily totals and subsequently interpolated across the entire Loess Plateau using ordinary kriging, generating continuous daily rainfall surfaces at a 500 m spatial resolution.
The soil erodibility (K) factor represents the susceptibility of soil to erosion, which is a property determined by inherent soil characteristics. The topographic (LS) factor represents the topographic control, encapsulating the combined effects of slope steepness and length on erosion dynamics. The K and LS factors were sourced from the Loess Plateau SubCenter of the National Earth System Science Data Center, National Science & Technology Infrastructure of China (http://loess.geodata.cn, accessed from 28 March 2026). The K factor dataset, originally at 30 m resolution, and the LS factor dataset, originally at 90 m resolution, were both resampled to 500 m to maintain consistency with other spatial datasets employed in subsequent analyses.
Vegetation cover metrics were generated on the Google Earth Engine (GEE) platform using MODIS MCD43A4 products, which are distributed by the Land Processes Distributed Active Archive Center (LP DAAC), NASA Agency, USA. From these data, we derived the Normalized Difference Vegetation Index (NDVI) and the SWIR32 index. Fractional vegetation cover—comprising both photosynthetic (fPV) and non-photosynthetic (fNPV) components—was obtained via a pixel unmixing model [27,28]. Total vegetation cover (TVC) was then calculated as TVC = fPV + fNPV. This approach provides a more complete depiction of surface cover conditions compared to traditional methods focusing only on green vegetation [29,30].
Gridded population data at 1 km resolution were obtained from the LandScan platform (https://landscan.ornl.gov/).
3. Methods
This study develops a multi-step, progressive analytical framework to systematically investigate the spatiotemporal evolution, contribution attribution, causal pathways, and future management strategies of soil erosion in the Wuding River Basin. First, Sen’s slope estimation and the Mann–Kendall trend test are employed to identify the spatiotemporal trends of soil erosion and its driving factors. Second, the contributions of individual factors are quantified from two complementary perspectives: (i) relative contribution based on multiple regression analysis, which identifies the dominant factors and their spatial areas of influence; and (ii) absolute contribution based on scenario simulations, which quantifies the actual increasing or decreasing effects of each factor on erosion change. Third, Partial Least Squares Structural Equation Modeling (PLS-SEM) is applied to distinguish the direct and indirect pathways of natural and anthropogenic factors on soil erosion across spatial and temporal scales. Finally, the Getis–Ord Gi* hotspot analysis and the Hurst exponent are integrated to assess the sustainability of erosion trends and to propose differentiated management zoning recommendations. All spatial analyses were conducted at 500 m grid resolution, and all temporal analyses were performed at an annual scale over the 2001–2024 period.
3.1. Revised Universal Soil Loss Equation (RUSLE) Model
To estimate soil erosion in the Wuding River Basin, the RUSLE model was used, and the research area’s features and data were used to develop the methodology for each factor. The RUSLE model’s equations are as follows [20]:
where A is the annual quantity of soil loss (t/ha per year), C is the vegetation cover factor, R is the rainfall erosivity factor, K is the soil erodibility factor, L is the slope length factor, S is the slope steepness factor, and P represents the conservation practice factor.
To evaluate the reliability of the RUSLE model simulations in the Wuding River Basin, we validated the estimated soil erosion modulus against measured sediment transport data from 11 hydrological stations within the basin. These stations included Chabagou River–Caoping Station, Dali River–Qingyangcha Station, Dali River–Suide Station, Hailiutu River–Hanjiamao Station, Heimutouchuan River–Dianshi Station, Lu River–Hengshan Station, Mahuyu River–Mahuyu Station, Wuding River–Baijiachuan Station, Wuding River–Dingjiagou Station, Wuding River–Zhaoshiyao Station, and Xiaoli River–Lijiahe Station. Total annual sediment transport data for the period 2006–2012 were collected from these stations. The actual erosion modulus (t·ha−1·a−1) at each station was calculated by dividing the annual total sediment transport by the corresponding watershed area. These measured values were then regressed against the RUSLE-simulated erosion modulus at the same locations and time periods.
- (1)
- Rainfall erosivity (R) factor
The R-factor serves to quantify the impact of rainfall events on soil erosion. Its conventional calculation, as outlined by [31], relies on sub-daily precipitation intensity and rainfall kinetic energy to assess erosive power. However, the limited availability of high-temporal-resolution precipitation data often restricts the applicability of this approach. To address this, the present study employs an alternative method widely adopted across the Loess Plateau, which estimates rainfall erosivity from daily precipitation records [32,33]. The daily rainfall erosivity is computed using the following equations:
where Rday is the daily rainfall erosive force value (MJ mm ha−1h−1 yr−1); Pd is the daily rainfall (>12 mm, 12 mm is the threshold of erosive rainfall); α, β are the model parameters; and Py12 is the average annual rainfall for daily rainfall ≥ 12 mm. The daily rainfall erosivity values were then accumulated to calculate annual rainfall erosivity.
- (2)
- Vegetation cover (C) factor
The C factor represents the suppressive effect of surface cover and land management on soil erosion processes. For water bodies and artificial surfaces, C factor values were assigned as 0.0001 and 0.0039, respectively. For other land-use categories, the C factor was derived using the following set of equations [34,35]:
where fPV represents the coverage of photosynthetic vegetation; fNPV stands for non-photosynthetic vegetation coverage; and TVC is the total vegetation coverage, with a value range of 0–100. SLRi is the soil loss ratio for month i. When TVC is less than 5, take 1, and when it is greater than 5, calculate according to Formula (6); Eli is the monthly rainfall erosivity of that month, and Elt is the total rainfall erosivity of that year. The sum of Ci per month is the annual coverage and management coefficient (C).
- (3)
- Erosion control practice (P) factor
The P factor quantifies the effectiveness of soil and water conservation practices, defined as the erosion rate with specific measures relative to that without any intervention. Its value ranges from 0 to 1, where 0 indicates areas completely protected from erosion by effective measures, and 1 signifies areas receiving no conservation treatment [20]. In this study, P factor assignments were derived from established research conducted across the Loess Plateau [36,37], taking into account prevailing land-use categories and slope gradients. A value of 1 was applied to forest, shrubland, grassland, ice/snow, and barren land. Conversely, values of 0, 0.01, and 0.15 were assigned to water bodies, built-up areas, and wetlands, respectively. Cultivated land was stratified into six slope classes, with corresponding p values detailed in Table 1.
Table 1.
The P factor values of different land-use types and slopes.
3.2. Trend Analysis
Using the statistical methodologies of the Mann–Kendall test and Sen’s slope estimator, the spatiotemporal trend analysis across 2001–2024 was carried out. The Sen’s slope estimator was calculated using Equation (9):
in the formula, Median () calculates the median value; the slope denotes the median estimated slope when m ≠ n; and signify the values of variable in the n-th and m-th years, with n and m serving as year indicators.
The Mann–Kendall method is used to assess the overall trend of time series data, which can manifest no clear trend, upward trend, or downward trend. In the absence of obvious trends, it is assumed that the time-varying data points are independent and homogeneously distributed, with no continuous correlation. The Mann–Kendall test is useful because it does not require a normal distribution of the dataset or assume a linear pattern in trend variations. The test’s validity is based on the assumption that the sampling intervals are long enough to guarantee the independence of measurements taken at different time points, preventing any correlation between them.
and values serve distinct purposes in assessing trend magnitude and performing significance tests within the frameworks of Sen’s slope and the MK trend test. A positive value indicates an upward trend, whereas a negative value indicates a downward trend. |Z| ≥ 1.96 demonstrates that the results have surpassed the 95% significance threshold.
3.3. Relative Contribution Analysis (Multiple Regression)
Multiple regression analysis is used to determine the relative contributions of diverse driving factors to the annual quantity of soil erosion (A) (t/ha per year) in the Wuding River Basin (WRB). This multiple regression-based approach quantifies the relative contribution of each driving factor. It is designed to address the question: In each grid cell, which factor (C, R, or P) dominates the spatial variability of soil erosion? The factor with the largest absolute standardized regression coefficient is identified as the dominant factor. However, this method does not indicate the direction or magnitude of actual erosion change caused by each factor. Prior to analysis, all data were standardized using the Z-score method. This calculation is done using Equations (11) and (12):
where denotes normalized A; and are constant error and standard regression coefficient; refers to system error; and denotes the relative contribution of factor i to A.
3.4. Absolute Contribution Analysis (Scenario Simulation)
To quantify the absolute contribution of individual factors to soil erosion in the Wuding River Basin, four scenarios were simulated using the RUSLE model. These included: (1) a baseline scenario in which all dynamic factors (R, C, and P) varied annually from 2001 to 2024, (2) a climate-controlled scenario, where the rainfall erosivity factor (R) was held constant at its initial state (2001) while C and P were allowed to change naturally, (3) a vegetation-cover-controlled scenario, with the vegetation cover factor (C) fixed at the 2001 level while R and P varied over time, and (4) a conservation-practice-controlled scenario, in which the erosion control practice factor (P) was kept at its initial value (2001) with R and C changing dynamically. In all scenarios, the topographic factor (LS) and soil erodibility factor (K) remained unchanged. By comparing the simulated soil erosion values between the baseline scenario and each controlled scenario, the respective contributions of climate change (R factor), vegetation dynamics (C factor), and soil conservation measures (P factor) were quantitatively isolated for the period 2001–2024. This scenario simulation-based approach quantifies the absolute contribution of each dynamic factor. It is designed to address the question: What is the actual magnitude and direction (positive or negative) of change in soil erosion attributable to each factor (C, R, or P) over the study period? By comparing the baseline scenario (all factors vary) with controlled scenarios (one factor fixed), the actual erosion change (in t·ha−1·a−1) caused by each factor is isolated.
3.5. Hotspot and Coldspot Retrieval (Getis–Ord Gi*)
We adopted the Getis–Ord Gi* statistics, a spatial statistical method used to identify spatial clusters of high or low values [38]. This approach was applied to the trend values ( at significant points) derived from Mann–Kendall analysis to detect areas where soil erosion trends exhibit significant spatial clustering, thereby revealing trend hotspots (clusters of significant increasing trends) and trend coldspots (clusters of significant decreasing trends) of soil erosion across the basin. The Getis–Ord Gi* statistic is calculated using Equations (13)–(15).
where n is the total number of features, wij is defined by the spatial weight between features i and j, and xj is defined by the feature attribute value of j.
3.6. Hurst Exponent
In this study, the Hurst exponent was employed to quantitatively analyze the long-range dependence and persistence characteristics of soil erosion changes in the Wuding River Basin. The Hurst exponent is calculated using the rescaled range analysis method, originally proposed by Hurst [39], which effectively distinguishes between random processes and trend processes with long-term memory. The Hurst exponent statistic is calculated using Equations (16)–(18).
For a time series of length n, it is divided into multiple sub-intervals of length L. The rescaled range is calculated for each sub-interval as follows:
where is the standard deviation of the sub-interval, and is the mean value of the sub-interval.
The average corresponding to different sub-interval lengths L satisfies the empirical relationship:
Taking logarithms on both sides of the equation yields:
The slope of the linear regression between and provides the estimate of the Hurst exponent H.
The interpretation of H follows these criteria: H > 0.5 indicates persistence (long-term memory) in erosion changes, meaning future trends will likely follow the past pattern; H = 0.5 suggests a random walk with no long-term trend; H < 0.5 indicates anti-persistence, implying that future trends may reverse the past direction. This approach provides a quantitative basis for identifying the inherent inertia or reversal characteristics of erosion evolution, thereby assessing the sustainability of conservation effectiveness.
3.7. Path Analysis
Partial least squares structural equation modeling (PLS-SEM) is a method employed to explore and test hypotheses regarding relationships within complex systems. It facilitates comprehensive and precise analysis of mediating effects in highly intricate models. In this study, PLS-SEM analysis was performed at both temporal and spatial scales using SmartPLS 4 software. For the temporal analysis, we constructed the PLS-SEM using the spatially averaged values of each factor over the 24-year study period. For the spatial analysis, we employed a stratified random sampling method across the study area, selecting sample points from different land-use types. A minimum sampling threshold of 5 was set for each land-use category, resulting in a total of 100 sample points (61 from grassland, 14 from farmland, 5 from forest, 5 from shrubland, 5 from water bodies, 5 from barren land, and 5 from impervious areas). Wetlands were excluded from sampling due to their extremely limited area.
All PLS-SEM models in this study contain only observed variables (R, C, P, LS, K, population, etc.) and no latent constructs. Prior to analysis, the data were standardized using the Z-score method. Therefore, internal consistency metrics (Cronbach’s α, rho_A, AVE) are not applicable. Model fit was assessed using SRMR and NFI. The reciprocal transformation of C and P was applied to ensure that higher values correspond to better vegetation cover or more effective conservation practices, facilitating intuitive interpretation of path coefficients. Sample size (n = 100 for spatial models) follows the 10-times rule (10 × the maximum number of structural paths directed at a single construct = 5 × 10 = 50) [40]. Collinearity was assessed using VIF (all < 5). Bootstrap resampling (5000 iterations) was used to obtain bias-corrected confidence intervals.
4. Results
4.1. Spatiotemporal Variations in Soil Erosion and Driving Factors
As shown in the validation scatter plot (Figure 2), the RUSLE-simulated erosion modulus agreed well with the measured values. The regression equation was y = 0.8934x + 0.83, with a coefficient of determination (R2) of 0.812 and a root mean square error (RMSE) of 2.683 t·ha−1·a−1. These statistical indicators demonstrate that the RUSLE model provides reliable soil erosion estimates in the Wuding River Basin, confirming the robustness of the subsequent analyses presented in this study.
Figure 2.
Validation of RUSLE-simulated soil erosion modulus against measured data from 11 hydrological stations in the Wuding River Basin (2006–2012). The regression equation is y = 0.8934x + 0.83, R2 = 0.812, and RMSE = 2.683 t·ha−1·a−1. The black line represents the fitted regression line, the red dashed line represents the line y = x, and the light blue area represents the confidence interval of the fitted line.
Over the 24-year study period (2001–2024), all factors exhibited gradient variations from the northwest to the southeast across the basin. Specifically, the C-factor and P-factor both displayed spatial patterns with higher values in the northwest and lower values in the southeast (Figure 3b,d). In contrast, the R-factor, K-factor, and LS-factor showed the opposite distribution, with higher values in the southeast and lower values in the northwest (Figure 3c,e,f). Similarly, the 24-year mean soil loss (A) also exhibited a pattern of higher values in the southeast and lower values in the northwest (Figure 3a).
Figure 3.
Spatial distribution of mean RUSLE factors and soil erosion modulus in the Wuding River Basin (2001–2024). (a) Annual soil loss (t/ha per year) (A); (b) Mean annual vegetation cover factor (C); (c) Mean annual rainfall erosivity factor (MJ mm ha−1h−1 yr−1) (R); (d) Mean annual erosion control practice factor (P); (e) Soil erodibility factor (K); (f) Topographic factor (LS).
Temporally, the annual soil loss (A) showed an overall decreasing trend over the 24-year period (R2 = 0.1074) (Figure 4a). Among the three dynamically changing model factors, both the C-factor and P-factor exhibited declining trends (R2 = 0.7721; R2 = 0.2945) (Figure 4b,d), while the R-factor showed a slight increasing trend (R2 = 0.0115) (Figure 4c).
Figure 4.
Temporal trends of soil erosion modulus and dynamic factors (C, R, P) in the Wuding River Basin (2001–2024). (a) Annual soil loss (t·ha−1·a−1) (A); (b) Vegetation cover factor (C); (c) Rainfall erosivity factor (MJ mm ha−1 h−1 yr−1) (R); (d) Erosion control practice factor (P). The dashed lines in the figure represent the fitted trend lines of the scatter points, and the shaded areas corresponding to the colors of the scatter points and dashed lines represent the confidence intervals of the fit.
Regarding erosion intensity, micro and mild erosion together accounted for over 90% of the total eroded area in the Wuding River Basin (Figure 5). Against the backdrop of an overall declining erosion modulus (Figure 4a), the area affected by micro erosion showed an increasing trend over the 24 years (R2 = 0.0824). In contrast, the areas affected by mild, moderate, intensive, extreme, and severe erosion all exhibited decreasing trends (R2 = 0.0723; R2 = 0.0839; R2 = 0.1227; R2 = 0.1490; R2 = 0.0191), according to the classification standards of the Ministry of Water Resources of the People’s Republic of China (SL 190–2007, Beijing, China, 2008) (Table 2).
Figure 5.
Changes in area proportions of different soil erosion grades in the Wuding River Basin (2001–2024). The linear fitting equations for the interannual changes in different erosion grades are shown in the figure: Slight erosion (y = 0.263x + 73.707 R2 = 0.0824); Mild erosion (y = −0.1964x + 23.025 R2 = 0.0723); Moderate erosion (y = −0.0525x + 2.8198 R2 = 0.0839); Intensive erosion (y = −0.0121x + 0.3953 R2 = 0.1227); Extreme erosion (y = −0.002x + 0.0518 R2 = 0.1490); Severe erosion (y = −0.00002x + 0.0011 R2 = 0.0191).
Table 2.
Classification standards for soil erosion grades.
Trends analysis over the 24-year period revealed that 57.3% of the basin area showed decreasing trends in annual soil loss (A) (with 14.3% of the total area exhibiting significant decreases), 29.4% remained stable, and only 13.3% in the central part of the study area showed increasing trends (with 1.2% of the total area exhibiting significant increases) (Figure 6a,b). The C-factor showed decreasing trends across 95.8% of the area (with 79.1% of the total area showing significant decreases), remained stable in 1.1%, and only 3.0% showed increasing trends (with 0.4% of the total area exhibiting significant increases) (Figure 6c,d). In contrast to the two factors described above, the R-factor showed increasing trends across 92.7% of the area, decreasing trends in only 7.0%, and remained stable in only 0.3%, while neither the increasing nor decreasing trends were statistically significant (Figure 6e,f). For the P-factor, decreasing and increasing trends were observed in only 1.5% and 1.7% of the total area, respectively (both significant), whereas the vast majority of the region (96.8%) remained stable (Figure 6g,h).
Figure 6.
Spatial distribution of trends and significance for soil erosion modulus and dynamic factors in the Wuding River Basin (2001–2024). (a) Sen’s slope of annual soil loss (A); (b) Significance of the trend in annual soil loss (A) tested using the Mann–Kendall method; (c) Sen’s slope of the vegetation cover factor (C); (d) Significance of the trend in the vegetation cover factor (C); (e) Sen’s slope of the rainfall erosivity factor (R); (f) Significance of the trend in the rainfall erosivity factor (R); (g) Sen’s slope of the erosion control practice factor (P); (h) Significance of the trend in the erosion control practice factor (P).
4.2. Spatiotemporal Contribution Analysis of Driving Factors to Soil Erosion in the Wuding River Basin
Relative contribution analysis based on multiple linear regression and dominant factor identification revealed that areas dominated by the C-factor were primarily distributed along the eastern basin boundary and scattered in the northwestern region (Figure 7a). Areas dominated by the R-factor were mainly concentrated in the central and most southeastern parts of the study area (Figure 7b), while the P-factor exhibited a more fragmented distribution, scattered sporadically throughout the region (Figure 7c). In terms of dominant area, the R-factor covered the largest proportion, accounting for 46.85% of the total basin area, followed by the P-factor, which occupied 36.61% of the total area, and finally the C-factor, which dominated only 16.54% of the study area (Figure 7d).
Figure 7.
Spatial distribution of dominant factors controlling soil erosion in the Wuding River Basin based on relative contribution analysis. (a) The relative contribution of C-factor, (b) The relative contribution of R-factor, (c) The relative contribution of P-factor, (d) The spatial distribution of dominant factors.
Absolute contribution analysis based on scenario simulations revealed that soil erosion changes exhibited an increasing trend under the C-factor—controlled scenario, which was contrary to the observed trend in the actual scenario (Figure 8a). The contribution of the C-factor showed a significant decreasing trend over the 24-year period (R2 = 0.3619) (Figure 8b). Under the R-factor−controlled scenario, erosion changes were consistent with the actual scenario, both showing decreasing trends, but with a steeper slope. The contribution of the R-factor exhibited a slight increasing trend over the 24-year period (R2 = 0.0677) (Figure 8c,d). Under the P-factor−controlled scenario, erosion changes were similar to those of the R-factor, also showing a decreasing trend consistent with the actual scenario but with a steeper slope. The contribution of the P-factor to soil erosion also showed an increasing trend over the study period (R2 = 0.4015) (Figure 8e,f).
Figure 8.
Scenario simulation results and absolute contributions of dynamic factors to soil erosion in the Wuding River Basin (2001–2024). Uncontrolled scenario, a baseline scenario in which all dynamic factors (R, C, and P) varied annually from 2001 to 2024; C-controlled scenario, with the vegetation cover factor (C) fixed at the 2001 level while R and P varied over time; R-controlled scenario, where the rainfall erosivity factor (R) was held constant at its initial state (2001) while C and P were allowed to change naturally; P-controlled scenario, in which the erosion control practice factor (P) was kept at its initial value (2001) with R and C changing dynamically; Uncontrolled−C-controlled, the respective contributions of C-factor from 2001 to 2024; Uncontrolled−R-controlled, the respective contributions of R-factor from 2001 to 2024; Uncontrolled−P-controlled, the respective contributions of P-factor from 2001 to 2024. (a) Comparison of linear fitting of scatter points between the Uncontrolled scenario and the C-controlled scenario, (b) Linear fitting of the difference between the Uncontrolled scenario and the C-controlled scenario, (c) Comparison of linear fitting of scatter points between the Uncontrolled scenario and the R-controlled scenario, (d) Linear fitting of the difference between the Uncontrolled scenario and the R-controlled scenario, (e) Comparison of linear fitting of scatter points between the Uncontrolled scenario and the P-controlled scenario, (f) Linear fitting of the difference between the Uncontrolled scenario and the P-controlled scenario. The dashed lines in the figure represent the fitted trend lines of the scatter points, and the shaded areas corresponding to the colors of the scatter points and dashed lines represent the confidence intervals of the fit.
Spatially, the contribution of the C-factor to soil erosion gradually decreased from the northwest to the southeast of the study area, with negative contributions in the vast majority of the region. Areas with positive contributions accounted for only 1.32% of the total basin area. The contribution of the R-factor to soil erosion showed an irregular distribution pattern, with the largest contributions in the southeastern margin of the study area and the smallest in the central and southwestern parts. Areas with positive contributions constituted only 6.15% of the total basin area. In contrast to the C-factor, the contribution of the P-factor exhibited a pattern of low values in the northwest and high values in the southeast. Most areas also showed negative contributions, with positive values accounting for only 11.30% of the total basin area (Figure 9).
Figure 9.
Spatial distribution of absolute contributions of dynamic factors to soil erosion in the Wuding River Basin. (a) Uncontrolled scenario, a baseline scenario in which all dynamic factors (R, C, and P) varied annually from 2001 to 2024, (b) C-controlled scenario, with the vegetation cover factor (C) fixed at the 2001 level while R and P varied over time, (c) Uncontrolled−C-controlled, the respective contributions of C factor from 2001 to 2024, (d) Uncontrolled scenario, a baseline scenario in which all dynamic factors (R, C, and P) varied annually from 2001 to 2024, (e) R-controlled scenario, with the rainfall erosivity factor (R) fixed at the 2001 level while C and P varied over time, (f) Uncontrolled−R-controlled, the respective contributions of R factor from 2001 to 2024, (g) Uncontrolled scenario, a baseline scenario in which all dynamic factors (R, C, and P) varied annually from 2001 to 2024, (h) P-controlled scenario, with the erosion control practice factor (P) fixed at the 2001 level while R and C varied over time, (i) Uncontrolled—P-controlled, the respective contributions of P factor from 2001 to 2024.
4.3. Direct and Indirect Effects of Human Activities and Various Factors on Soil Erosion
Model fit assessment showed that all temporal-scale PLS-SEM models exhibited good fit. For the 2001–2012 period, SRMR = 0.040 and NFI = 0.974; for the 2013–2024 period, SRMR = 0.073 and NFI = 0.968; and for the full 2001–2024 period, SRMR = 0.053 and NFI = 0.979. All SRMR values were below the recommended threshold of 0.08, and all NFI values exceeded 0.90, indicating acceptable model fit. The path coefficients, 95% BCa confidence intervals, and p-values for the PLS-SEM models are presented in Table S1.
The structural equation model (SEM) based on the temporal scale indicated that, over the entire study period, the R-factor was the most influential factor affecting soil erosion, exhibiting a highly significant positive effect (path coefficient = 1.016; p < 0.001) (Figure 10a). The reciprocal of the C-factor showed a highly significant negative effect on soil erosion (path coefficient = −0.604; p < 0.001). However, the reciprocal of the P-factor had a non-significant weak positive effect on soil erosion (path coefficient = 0.045; p > 0.05). Interactions among factors revealed that the R-factor exerted a significant positive effect on the reciprocal of the C-factor (path coefficient = 0.202; p < 0.05), while the reciprocal of the P-factor showed only a non-significant weak negative effect on the reciprocal of the C-factor (path coefficient = −0.091; p > 0.05), inconsistent with the spatial pattern. The effect of population on the reciprocal of the P-factor was consistent with the spatial pattern, showing a highly significant positive effect (path coefficient = 0.564; p < 0.001). However, its effect on the reciprocal of the C-factor differed from the spatial pattern, exhibiting a highly significant positive effect (path coefficient = 0.894; p < 0.001; Figure 10a).
Figure 10.
Temporal-scale PLS-SEM results of natural and human factors on soil erosion in the Wuding River Basin. (a) Temporal-scale PLS-SEM results of natural and human factors on soil erosion in the Wuding River Basin from 2001 to 2024, (b) Temporal-scale PLS-SEM results of natural and human factors on soil erosion in the Wuding River Basin from 2001 to 2012, (c) Temporal-scale PLS-SEM results of natural and human factors on soil erosion in the Wuding River Basin from 2013 to 2024. C-Factor (inverse), the reciprocal of C-factor; P-Factor (inverse), the reciprocal of P-factor; The red path represents the positive path, the blue path represents the negative path, and the path width represents the magnitude of the path coefficient. * p < 0.05; ** p < 0.01; *** p < 0.001.
Furthermore, we found that the positive effect of population on the reciprocal of the C-factor was significantly weaker in the latter 12 years compared to the first 12 years (decreasing from 0.877 to 0.250) (Figure 9b,c). The positive effects of the R-factor on both the reciprocal of the C-factor and soil erosion intensified (increasing from 0.018 to 0.595 and from 0.967 to 1.177; Figure 10b,c).
Model fit assessment showed that all spatial-scale PLS-SEM models also exhibited good fit. For the 2001–2012 period, SRMR = 0.065 and NFI = 0.982; for the 2013–2024 period, SRMR = 0.059 and NFI = 0.928; and for the full 2001–2024 period, SRMR = 0.021 and NFI = 0.969. All SRMR values were below 0.08 and all NFI values were above 0.90, confirming the reliability of the spatial models. The path coefficients, 95% BCa confidence intervals, and p-values for the PLS-SEM models are presented in Table S1.
Spatially based SEM revealed that the LS-factor was the most influential factor affecting soil erosion among multiple variables, exhibiting a significant positive effect (path coefficient = 0.802; p < 0.001) (Figure 11a). Both the reciprocal of the C-factor and the K-factor showed positive effects on soil erosion, but with relatively low path coefficients and non-significant effects. The R-factor and the reciprocal of the P-factor both exhibited negative effects on soil erosion, but their path coefficients remained low and non-significant. Regarding potential interactions among factors, we found that the reciprocal of the P-factor had a significant positive effect on the reciprocal of the C-factor (path coefficient = 1.709; p < 0.05), while the effects of other factors on the reciprocal of the C-factor were non-significant and negative. Population exhibited a strong negative effect on the reciprocal of the C-factor, but this effect did not reach statistical significance (path coefficient = −1.598; p > 0.05; Figure 11a).
Figure 11.
Spatial-scale PLS-SEM results of natural and human factors on soil erosion in the Wuding River Basin. (a) Spatial-scale PLS-SEM results of natural and human factors on soil erosion in the Wuding River Basin from 2001 to 2024, (b) Spatial-scale PLS-SEM results of natural and human factors on soil erosion in the Wuding River Basin from 2001 to 2012, (c) Spatial-scale PLS-SEM results of natural and human factors on soil erosion in the Wuding River Basin from 2013 to 2024. C-Factor (inverse), the reciprocal of C-factor; P-Factor (inverse), the reciprocal of P-factor; Population, density of population; The red path represents the positive path, the blue path represents the negative path, and the gray path represents a path coefficient of 0. The path width represents the magnitude of the path coefficient. * p < 0.05; ** p < 0.01; *** p < 0.001.
Additionally, we observed notable differences in the relationships among population, the reciprocal of the P-factor and C-factor between the first and latter 12 years. In the first 12 years (2001–2012), population had a highly significant positive effect on the reciprocal of the P-factor (path coefficient = 0.967; p < 0.001); the reciprocal of the P-factor showed a non-significant but positive effect on the reciprocal of the C-factor (path coefficient = 1.586; p > 0.05), and population exhibited a non-significant but negative effect on the reciprocal of the C-factor (path coefficient = −1.539; p > 0.05) (Figure 11b). In the latter 12 years (2013–2024), the relationships among these three variables weakened considerably, although the positive effect of the reciprocal of the P-factor on the reciprocal of the C-factor became more significant (path coefficient = 0.967; p < 0.01; Figure 11c).
4.4. Comprehensive Assessment of Soil Erosion in the Wuding River Basin
Trend hot spot analysis indicated that cold and hot spots of erosion trends were predominantly concentrated in the southeastern part of the Wuding River Basin (Figure 12a). Trend cold spots were extensively distributed in the valley areas of the southeastern corner and along the southern boundary of the study area, with scattered occurrences in the central region. Trend hot spots were mainly scattered sporadically throughout the central part of the study area (Figure 12a). The Hurst exponent revealed that 85.4% of the basin area exhibited persistence in erosion trends, while the remaining 14.6% (located in the southeastern corner) displayed anti-persistence characteristics (Figure 12b). Based on the combination of trend hot spot analysis and Hurst exponent, we classified the trend cold and hot spots into four categories: successfully treated areas, potential rebound risk areas, monitoring priority areas, and emergency treatment areas. Among these, successfully treated areas represent trend cold spots with persistence, potential rebound risk areas represent trend cold spots with anti-persistence, monitoring priority areas represent trend hot spots with anti-persistence, and emergency treatment areas represent trend hot spots with persistence (Figure 12c). The results showed that successfully treated areas accounted for the highest proportion (57.6%) of the trend cold and hot spot regions. These were followed by potential rebound risk areas, which accounted for 29.4%. Emergency treatment areas ranked third, accounting for 11.2%. Monitoring priority areas constituted the smallest proportion, accounting for only 1.8% of the trend cold and hot spot regions.
Figure 12.
Spatial distribution of (a) trend cold/hot spots, (b) Hurst exponent, and (c) management zoning for soil erosion in the Wuding River Basin.
5. Discussion
Compared with previous methodological approaches in the Wuding River Basin—which have largely relied on hydrological station data [9,22], sediment load analysis [22], or single-factor assessments [41]—the present study introduces a multi-method framework that integrates RUSLE, trend analysis, scenario simulation, PLS-SEM, hotspot analysis, and the Hurst exponent. This framework allows for a more comprehensive decomposition of factor contributions from both relative and absolute perspectives, as well as from both temporal and spatial scales.
It is also worth noting that harmonizing multi-source datasets with varying original resolutions to a uniform 500 m resolution may introduce uncertainties, particularly in the representation of topographic details and the spatial delineation of land-cover boundaries and conservation measures. However, given that the primary focus of this study is on basin-scale macro-level patterns and trends, these uncertainties are unlikely to affect the main conclusions regarding the relative and absolute contributions of different factors. We will pay attention to this issue and further refine the findings using higher-resolution data in our future research.
5.1. Spatiotemporal Evolution Characteristics of Soil Erosion and Its Driving Mechanisms
This study shows that from 2001 to 2024, the soil erosion modulus in the Wuding River Basin generally exhibited a decreasing trend (Figure 4a), which is consistent with previous findings in the Wuding River Basin and the Loess Plateau. For instance, Yao et al. reported a significant reduction in runoff and sediment discharge in the Wuding River Basin over the past few decades based on hydrological station data [9]. The area affected by mild and higher erosion grades continued to shrink, while the area of micro erosion expanded, indicating significant effectiveness of regional soil and water conservation measures and vegetation restoration (Figure 5). Liu et al.’s study on soil erosion across the entire Loess Plateau also presents similar results [42]. Spatially, the erosion modulus exhibited a pattern of high values in the southeast and low values in the northwest, highly similar to the spatial distribution of the R-factor, LS-factor, and K-factor. Numerous studies have also shown that precipitation, topography, and soil erodibility are fundamental factors controlling soil erosion in the Wuding River Basin and the Loess Plateau region [42,43,44].
Trend analysis indicated that over 57% of the basin area showed decreasing erosion trends, with significant decreasing areas mainly distributed in the southeastern part of the basin. Among the factors, the C-factor exhibited the most significant decreasing trend (R2 = 0.7721) (Figure 4b), and Mann–Kendall trend analysis showed that this significant decrease occurred across nearly the entire basin (Figure 6d). This finding indicates that vegetation restoration played a crucial role in erosion control in the Wuding River Basin, confirming previous studies that regarded vegetation restoration as a core contributor to erosion reduction on the Loess Plateau [41,42,45]. Although the R-factor showed an increasing trend in most areas, it did not reach statistical significance, suggesting that while rainfall erosivity has increased, it has not been sufficient to offset the positive effects derived from vegetation restoration [46].
5.2. Contribution of Vegetation, Precipitation, and Soil Conservation Factors to Soil Erosion
Previous studies have identified precipitation and vegetation restoration as the primary factors influencing changes in soil erosion on the Loess Plateau [36,47]. This study presents similar conclusions but reveals a more complex picture through multi-perspective contribution analysis.
From the perspective of relative contribution and dominant factor analysis, the area dominated by the R-factor in the Wuding River Basin was the largest (accounting for 46.85%), mainly distributed in the central and southeastern parts (Figure 7b). This indicates that, from the perspective of the dominant range, rainfall erosivity is the primary factor determining the spatial pattern of erosion in most of the basin. In contrast, C-factor-dominated areas were concentrated along the eastern boundary and scattered in the northwestern region (Figure 7a), while the P-factor was sporadically distributed throughout the area, still playing a non-negligible role locally (Figure 7c). However, from the perspective of absolute contribution, the C-factor contributed most significantly to erosion, with contributions being negative in the vast majority of areas and showing a continuous decreasing trend over time (Figure 8b and Figure 9c). This means that vegetation restoration not only has wide spatial coverage but also achieves a considerable actual reduction in erosion, which is consistent with the findings of Bai et al. [48]. Although the contribution of the R-factor to erosion showed an increasing trend, its contribution remained negative in most years and areas (Figure 8c and Figure 9f). The P-factor’s interannual contribution to soil erosion was positive and showed an increasing trend, albeit with a modest slope (Figure 8d and Figure 9i). However, the spatial distribution of positive contributions was significantly wider compared to the other two factors, indicating that soil conservation measures in the Wuding River Basin require further attention.
It is worth noting that the R-factor dominates a larger area in the context of relative contribution, while the C-factor contributes most significantly to erosion reduction in the context of absolute contribution. These findings are inherently complementary rather than contradictory. Relative contribution quantifies the factor’s explanatory power for erosion variation, reflecting the extent of its dominant range. Absolute contribution has directionality, specifically reflecting the actual increase or decrease in erosion caused by each factor in local areas. This difference reminds us that when evaluating regional soil and water conservation benefits, we cannot rely on a single method alone. Rather, we need to combine multi-perspective analyses to fully understand the roles of multiple drivers across both time and space.
5.3. Interactive Effects of Human Activities and Natural Factors on Soil Erosion Contribution
PLS-SEM analysis revealed the direct and indirect influence pathways of various factors on soil erosion, providing a new perspective for understanding the complex interactions among factors [49]. On the temporal scale, the R-factor had the strongest effect on erosion (Figure 10), further confirming our statement in Section 5.2 that precipitation plays a dominant role in the relative contribution to soil erosion. The reciprocal of the C-factor followed, showing a significant negative effect on soil erosion over the 24-year period. However, the effect of the reciprocal of the P-factor on the reciprocal of the C-factor and soil erosion over time was not significant. This may be due to the limited area where soil conservation work was implemented. Averaging over the entire basin area likely diluted the impact of conservation work on vegetation and soil erosion. Interestingly, besides its positive effect on soil erosion, the R-factor also had a significant positive effect on the reciprocal of the C-factor. This indicates that increased precipitation has a dual effect on soil erosion. Some studies have also found nonlinear coupling effects of precipitation and vegetation on soil erosion [50,51]. On one hand, rainfall erosivity intensifies erosion; on the other hand, it promotes vegetation growth, indirectly controlling the intensification of erosion.
On the spatial scale, we found that the LS-factor exerted a significantly stronger effect on erosion than other factors, indicating that topography remains the fundamental controlling factor for erosion occurrence. The R-factor and the reciprocal of the C-factor, which had strong effects temporally, did not show significant effects on erosion spatially (Figure 11). This could be because, despite being a primary driver of erosion, the impact of precipitation may be smoothed out in a temporal mean model based on spatial sampling, thereby diminishing the effect size of extreme rainstorms in specific years. Additionally, areas with higher precipitation are often accompanied by increased vegetation, and these two factors have opposite effects on erosion; the spatial superposition of their effects may weaken their respective individual impacts on erosion. In contrast, the reciprocal of the P-factor exhibited its expected effect at the spatial scale, showing a significant positive effect on the reciprocal of the C-factor, indicating that soil conservation projects in local areas have achieved remarkable results.
Furthermore, the relationships among the reciprocal of the C-factor, the reciprocal of the P-factor, and population density showed significant differences both spatially and temporally across the two sub-periods (Figure 10 and Figure 11). Population density showed a significant positive effect on the reciprocal of the P-factor both temporally and spatially, indicating that conservation projects have been continuously implemented in recent years alongside population density increases. However, its effect on the reciprocal of the C-factor was positive temporally but negative spatially. Comparing the two sub-periods (2001–2012 vs. 2013–2024), the relationships among population density, the reciprocal of the P-factor, and the reciprocal of the C-factor were very close both temporally and spatially during the 2001–2012 interval. However, during the 2013–2024 interval, the relationship between population density and the reciprocal of the C-factor weakened both temporally and spatially, while the positive effect of the reciprocal of the P-factor on the reciprocal of the C-factor remained significant. These findings indicate that human activities do disturb vegetation, but this impact is being weakened or even reversed over time due to the continuous implementation of soil and water conservation projects.
It should be noted that, to avoid the potential endogeneity concern of “explaining a composite outcome using its own constituent components,” the relative contribution and SEM analyses in this study focus on horizontal comparisons among factors within the modeling framework, rather than on strict causal inference between individual factors and soil erosion modulus A.
5.4. Sustainability of Erosion Evolution Trends and Management Zoning
Compared with previous management zoning studies in the Loess Plateau, which have typically classified areas based on current erosion intensity or single-factor dominance [36,45], we argue that such static classification is no longer sufficient to guide future soil and water conservation efforts in the Wuding River Basin and beyond. Given that mild erosion has become the dominant grade across most of the basin, the conventional erosion-grading system alone cannot adequately identify areas with potential risks or those requiring urgent intervention. Therefore, our approach integrates both trend analysis (identifying cold/hot spots) and future sustainability (Hurst exponent) to propose four dynamic management zones. This framework moves beyond static classification by considering the persistence of erosion trends, thereby providing a more informative basis for adaptive management strategies.
Trend hot spot analysis revealed that both cold and hot spots of erosion trends were concentrated in the southeastern part of the study area (Figure 12). This spatial pattern may be attributed to the rugged topography in the southeastern region, which creates conditions conducive to soil erosion, whereas the flatter terrain in the northwestern region results in lighter and more scattered erosion. It is also confirmed by the spatial distribution of the LS-factor (Figure 3f). Further Hurst analysis explored the sustainability of these trend cold and hot spots. Erosion trends showed persistence in 85.4% of the study area, with most areas exhibiting anti-persistence concentrated along the southeastern boundary of the study area. This may be related to the complex interactions of highly unstable factors locally. This zone is characterized by rugged terrain, erodible soil conditions, the high intense rainfall, and relatively better vegetation conditions. The complex interactions of various factors mean that although this area is a trend cold spot, it faces a rebound risk at any time. We term these ‘Potential rebound risk areas,’ which warn of sudden risks from extreme precipitation. In these areas, the underlying vulnerability of the topography and soil remains a hidden threat that can be reactivated by extreme weather, despite the apparent protection offered by favorable vegetation cover [52,53]. As rainfall decreases from southeast to northwest (Figure 3c), and the contribution direction of precipitation shifts from positive to negative (Figure 9f), vegetation cover also decreases (Figure 3b), and the negative contribution of vegetation to erosion gradually slows (Figure 9c). However, the superposition of these two contributions during the spatial transition may lead to two distinctly different erosion patterns: First, the negative contributions of vegetation and precipitation may be sufficient to offset the positive effects brought by other factors. In such areas, erosion trends exhibit a continuous decreasing trend. We term these “Successfully treated areas”. These areas account for the largest proportion (57.6%) of the total trend cold and hot spot area, indicating that the erosion control effect in the Wuding River Basin over the 24 years has been significant and sustainable. Second, in “window” areas where both the negative contributions of vegetation and precipitation are minimal, their negative contributions cannot offset the positive effects of other factors, resulting in a continuously increasing erosion trend. These areas are termed “Emergency treatment areas” in our zoning framework. Such “window” areas require priority intervention in subsequent management. They are often located in ecotones and are particularly sensitive to both climate change and anthropogenic disturbances. Additionally, a very small proportion of areas are classified as “Monitoring priority areas”. Similar to “Emergency treatment areas”, these are mainly scattered in the “window” areas of precipitation and vegetation. Although the increasing erosion trend in these areas exhibits anti-persistence, long-term monitoring mechanisms still need to be established to ensure timely detection of potential deterioration.
For Emergency treatment areas (11.2% of the cold/hot spot regions) and Potential rebound risk areas (29.4%), the majority of areas with moderate and above erosion grades are also located within these two zones. We recommend a combination of targeted prevention and control measures. These include: (i) engineering measures, such as terracing and check dam construction on steep slopes [52,53]; (ii) biological measures, such as vegetation restoration using native grass and shrub species [40,44]; and (iii) conservation tillage practices, such as contour plowing and no-till on agricultural land [17,42]. It is important to note that under the current climatic, social, and environmental crises (e.g., increased frequency of extreme rainfall events, intensified human disturbances, and growing pressure on land resources), without these measures—particularly on agricultural land—erosion could expand rapidly [2,3,52]. Therefore, despite their limited spatial extent, these areas should be given high priority in future conservation planning. For Successfully treated areas (57.6%), where erosion trends show persistent decreases, we recommend shifting the management strategy from active intervention to long-term monitoring, using low-frequency remote sensing checks (every 3–5 years). For Monitoring priority areas (1.8%), despite being current hot spots with anti-persistence, we recommend establishing an early warning system with high-frequency monitoring (annual remote sensing checks).
6. Conclusions
Based on multi-source data from 2001 to 2024, this study employed the RUSLE model to estimate soil erosion modulus in the Wuding River Basin. By integrating trend analysis, multiple regression, scenario simulation, PLS-SEM, hot spot analysis, and the Hurst exponent, we systematically revealed the spatiotemporal evolution characteristics of soil erosion, disentangled the direction and intensity of contributions from various driving factors, explored the interactions between natural factors and human activities, assessed the sustainability of evolution trends, and proposed management zoning recommendations. The main conclusions are as follows:
- (1)
- Soil erosion in the Wuding River Basin decreased significantly from 2001 to 2024, indicating remarkable achievements in soil and water conservation. The erosion modulus showed an overall declining trend, with the area affected by mild and above erosion grades continuously shrinking, while the area of micro erosion expanded. The C-factor exhibited a significant decreasing trend, the R-factor showed a slight increasing trend, and the P-factor remained stable in most areas.
- (2)
- The contributions of various factors to soil erosion exhibited complex multi-perspective differences. In terms of relative contribution, the R-factor dominated the largest area, accounting for 46.85% of the total basin area. However, in terms of absolute contribution, the C-factor contributed most significantly to erosion reduction, with negative contributions in the vast majority of areas and a continuously declining trend over time.
- (3)
- The influence pathways of natural factors and human activities on soil erosion differed significantly across spatial and temporal scales. On the temporal scale, the R-factor exerted the strongest direct positive effect on erosion. On the spatial scale, the LS-factor showed the strongest positive effect. The disturbance of vegetation by human activities appears to be weakening or even reversing based on the model-based inference from PLS-SEM analysis. This may be attributed to the continuous implementation of soil and water conservation measures.
- (4)
- The evolution trends of soil erosion in the Wuding River Basin exhibited strong sustainability but with significant spatial heterogeneity. Persistence in erosion trends was observed in 85.4% of the basin area, while anti-persistence areas were concentrated along the southeastern boundary. Based on a two-dimensional classification integrating trend characteristics and persistence attributes, the basin was divided into four management zones: successfully treated areas (57.6%), potential rebound risk areas (29.4%), emergency treatment areas (11.2%), and monitoring priority areas (1.8%).
In summary, soil erosion in the Wuding River Basin decreased significantly over the 24-year study period. Vegetation restoration was the core contributor to erosion reduction, while precipitation exhibited complex dual roles in both dominant range and actual contribution. The pattern of human activity impacts is shifting from direct disturbance to indirect facilitation. Over the coming decade, continued ecological restoration and adaptive watershed management will be critical to consolidating current achievements and preventing erosion rebound in vulnerable subregions. This study deepens the scientific understanding of soil erosion evolution mechanisms in terms of ecological restoration and provides a theoretical basis and decision support for optimized soil and water conservation management and sustainable development in the Wuding River Basin and similar ecologically fragile regions.
Supplementary Materials
The following supporting information can be downloaded at: https://www.mdpi.com/article/10.3390/rs18111707/s1, Table S1: Bootstrap 95% confidence intervals for path coefficients of all PLS-SEM models.
Author Contributions
Conceptualization and methodology: D.W. and Q.S.; Data curation: Y.W. and G.Z.; Funding acquisition: Z.W., Y.L. and D.W.; Project administration: Q.S.; Software: D.W. and H.L.; Supervision: Y.L.; Validation and visualization: Q.S. and X.L.; Writing–review and editing: Q.S., Z.X., X.Z. and D.W.; Formal analysis and Writing–original draft: Q.S., X.G. and D.W. All authors have read and agreed to the published version of the manuscript.
Funding
This work was financially supported by the Young Scientists Fund (C) of the National Natural Science Foundation of China (Nos. 42507471), National Natural Science Foundation of China (Nos. 42377355; 42477522), a Scientific Startup Foundation for Doctors of Northwest A&F University (2452025051) and Chinese Universities Scientific Fund (XYTD2026-05).
Data Availability Statement
Data will be made available on request.
Acknowledgments
We also thank Haijing Shi for her support in the design and data collection of this study.
Conflicts of Interest
The authors declare that they have no known competing financial interests or personal relationships that could have appeared to influence the work reported in this paper.
References
- Pimentel, D.; Harvey, C.; Resosudarmo, P.; Sinclair, K.; Kurz, D.; Mcnair, M.; Crist, S.; Shpritz, L.; Fitton, L.; Saffouri, R.; et al. Environmental and economic costs of soil erosion and conservation benefits. Science 1995, 267, 1117–1123. [Google Scholar] [CrossRef] [Scilit] [PubMed]
- Borrelli, P.; Robinson, D.A.; Panagos, P.; Lugato, E.; Yang, J.E.; Alewell, C.; Wuepper, D.; Montanarella, L.; Ballabio, C. Land use and climate change impacts on global soil erosion by water (2015–2070). Proc. Natl. Acad. Sci. USA 2020, 117, 21994–22001. [Google Scholar] [CrossRef] [Scilit]
- Nearing, M.A.; Pruski, F.F.; O’Neal, M.R. Expected climate change impacts on soil erosion rates: A review. J. Soil Water Conserv. 2004, 59, 43–50. [Google Scholar] [CrossRef] [Scilit]
- Yang, D.W.; Kanae, S.; Oki, T.; Koike, T.; Musiake, K. Global potential soil erosion with reference to land use and climate changes. Hydrol. Process. 2003, 17, 2913–2928. [Google Scholar] [CrossRef] [Scilit]
- Zhao, G.J.; Mu, X.M.; Wen, Z.M.; Wang, F.; Gao, P. Soil erosion, conservation, and eco-environment changes in the Loess Plateau of China. Land Degrad. Dev. 2013, 24, 499–510. [Google Scholar] [CrossRef] [Scilit]
- Guo, X.; Shao, Q. Spatial Pattern of Soil Erosion Drivers and the Contribution Rate of Human Activities on the Loess Plateau from 2000 to 2015: A Boundary Line from Northeast to Southwest. Remote Sens. 2019, 11, 2429. [Google Scholar] [CrossRef] [Scilit]
- Zhou, P.; Wen, A.B.; Zhang, X.B.; He, X.B. Soil conservation and sustainable eco-environment in the Loess Plateau of China. Environ. Earth Sci. 2013, 68, 633–639. [Google Scholar]
- Liang, W.; Bai, D.; Wang, F.Y.; Fu, B.J.; Yan, J.P.; Wang, S.; Yang, Y.T.; Long, D.; Feng, M.Q. Quantifying the impacts of climate change and ecological restoration on streamflow changes based on a Budyko hydrological model in China’s Loess Plateau. Water Resour. Res. 2015, 51, 6500–6519. [Google Scholar] [CrossRef] [Scilit]
- Yao, J.W.; Li, Z.B.; Zhu, B.; Zhang, P.; Wang, J.S.; Sun, W.Y.; Mei, S.S.; Zhang, Y.Q.; Xiao, P.Q. Transformative trends in runoff and sediment dynamics and their influential drivers in the Wuding River Basin of the Yellow River: A comprehensive analysis from 1960 to 2020. Water 2024, 16, 26. [Google Scholar] [CrossRef] [Scilit]
- Lan, X.; Liu, Z.; Yang, T.; Cheng, L.; Wang, X.; Wei, W.; Ge, Y.; Chen, X.; Lin, K.; Zhao, T.; et al. Land-Use Intensity Reversed the Role of Cropland in Ecological Restoration Over the World’s Most Severe Soil Erosion Region. Earth’s Future 2023, 11, e2022EF003388. [Google Scholar] [CrossRef] [Scilit]
- Hu, C.H.; Zhang, X.M.; Zhao, Y. Analysis of centennial sediment characteristics and recent fluctuations in the Yellow River. Adv. Water Sci. 2020, 31, 725–733. (In Chinese) [Google Scholar]
- Wang, S.A.; Fu, B.J.; Piao, S.L.; Lu, Y.H.; Ciais, P.; Feng, X.M.; Wang, Y.F. Reduced sediment transport in the Yellow River due to anthropogenic changes. Nat. Geosci. 2016, 9, 38–41. [Google Scholar] [CrossRef] [Scilit]
- Zhang, H.; He, Z.L.; Xu, J.K.; Mu, W.C.; Chen, Y.L.; Wang, G.X. Analysis of spatial and temporal changes in vegetation cover and driving forces in the Wuding River Basin, Loess Plateau. Forests 2024, 15, 82. [Google Scholar] [CrossRef] [Scilit]
- Wei, X.; Zhang, H.; Gong, X.; Wei, X.; Dang, C.; Zhi, T. Intrinsic Cross-Correlation Analysis of Hydro-Meteorological Data in the Loess Plateau, China. Int. J. Environ. Res. Public Health 2020, 17, 2410. [Google Scholar] [CrossRef] [Scilit]
- Fan, L.W.; Wang, N.; Wang, T.T.; Liu, Z.; Wan, Y.; Li, Z.W. Trade-off and synergy effects, driving factors, and spatial optimization of ecosystem services in the Wuding River Basin of China: A study based on the Bayesian Belief Network approach. J. Arid Land 2025, 17, 1669–1693. [Google Scholar] [CrossRef] [Scilit]
- Xiong, X.C.; Zhou, Z.X.; Wang, X.F.; Li, J. Dynamic simulation of the supply and demand of ecosystem windbreak and sand fixation service in the Wuding River Basin. Land 2025, 14, 20. [Google Scholar] [CrossRef] [Scilit]
- Borrelli, P.; Alewell, C.; Alvarez, P.; Anache, J.A.A.; Baartman, J.E.M.; Ballabio, C.; Bezak, N.; Biddoccu, M.; Cerdà, A.; Chalise, D.; et al. Soil erosion modelling: A global review and statistical analysis. Sci. Total Environ. 2020, 780, 146494. [Google Scholar] [CrossRef] [Scilit] [PubMed]
- Fenta, A.A.; Tsunekawa, A.; Haregeweyn, N.; Tsubo, M.; Yasuda, H.; Kawai, T.; Ebabu, K.; Berihun, M.L.; Belay, A.S.; Sultan, D. Agroecology-based soil erosion assessment for better conservation planning in Ethiopian river basins. Environ. Res. 2021, 195, 110786. [Google Scholar] [CrossRef] [Scilit]
- Fatima, B.; Rachid, H.; Abdeldjalil, B.; Abdessalam, O.; Mohamed, B.; Alfagham, A.T.; Tariq, A. Monitoring and forecasting water erosion in response to climate change effects using the integration of the global RUSLE/SDR model and predictive models. Appl. Soil Ecol. 2025, 206, 105910. [Google Scholar] [CrossRef] [Scilit]
- Fernández, G.; Merchán, L.; Sánchez, J.A. Spatial representation of soil erosion and vegetation affected by a forest fire in the Sierra de Francia (Spain) Using RUSLE and NDVI. Land 2025, 14, 793. [Google Scholar] [CrossRef] [Scilit]
- Renard, K.G.; Foster, G.R.; Weesies, G.A.; McCool, D.K.; Yoder, D.C. Predicting Soil Erosion by Water: A Guide to Conservation Planning with the Revised Universal Soil Loss Equation (RUSLE); US Department of Agriculture: Washington, DC, USA, 1997.
- Shi, P.; Zhang, Y.; Ren, Z.; Yu, Y.; Li, P.; Gong, J. Land-use changes and check dams reducing runoff and sediment yield on the Loess Plateau of China. Sci. Total Environ. 2019, 664, 984–994. [Google Scholar] [CrossRef] [Scilit] [PubMed]
- Zhang, D.; Zhao, Y.; Zhao, H. Dynamic monitoring of soil and water loss in the Wuding River Basin, a typical tributary of the middle Yellow River. Bull. Soil Water Conserv. 2022, 42, 89–94+147. (In Chinese) [Google Scholar]
- Ma, Y.X.; Huang, H.Q.; Xu, J.X.; Brierley, G.J.; Yao, Z.J. Variability of effective discharge for suspended sediment transport in a large semi-arid river basin. J. Hydrol. 2010, 388, 357–369. [Google Scholar] [CrossRef] [Scilit]
- Zeng, Y.F.; Yu, Q.; Wang, X.C.; Ma, J.; Xu, C.L.; Qiu, S.; Liu, W.; Wang, F. Research on the relationship between the structure of forest and grass ecological spaces and ecological service capacity: A case study of the Wuding River Basin. Remote Sens. 2023, 15, 2456. [Google Scholar] [CrossRef] [Scilit]
- Yang, J.; Huang, X. The 30 m annual land cover dataset and its dynamics in China from 1990 to 2019. Earth Syst. Sci. Data 2021, 13, 3907–3925. [Google Scholar] [CrossRef] [Scilit]
- Guerschman, J.P.; Hill, M.J.; Renzullo, L.J.; Barrett, D.J.; Marks, A.S.; Botha, E.J. Estimating fractional cover of photosynthetic vegetation, non-photosynthetic vegetation and bare soil in the Australian tropical savanna region upscaling the EO-1 Hyperion and MODIS sensors. Remote Sens. Environ. 2009, 113, 928–945. [Google Scholar] [CrossRef] [Scilit]
- Lv, D.; Liu, B.Y.; He, L.; Zhang, X.P.; Cheng, Z.; He, J. Estimation of photosynthetic and non-photosynthetic vegetation cover on the Loess Plateau based on Sentinel-2A imagery. China Environ. Sci. 2022, 42, 4323–4332. (In Chinese) [Google Scholar]
- He, L. Retrieval of Non-Photosynthetic Vegetation Cover and Its Application in Soil Erosion Models on the Loess Plateau. Doctor’s Thesis, Northwest A&F University, Yangling, China, 2024. (In Chinese) [Google Scholar]
- Lv, D.; Zhang, X.P.; Liu, B.Y.; He, L.; He, J. Differences in stratified vegetation cover under different land use types on the Loess Plateau. Bull. Soil Water Conserv. 2022, 42, 165–173. (In Chinese) [Google Scholar]
- Wischmeier, W.H.; Smith, D.D. Rainfall energy and its relationship to soil loss. Eos Trans. Am. Geophys. Union 1958, 39, 285–291. [Google Scholar]
- Zhang, W.B.; Fu, J.S. Rainfall erosivity estimation under different rainfall amount. Resour. Sci. 2003, 25, 34–41. [Google Scholar]
- Zhang, W.B.; Xie, Y.; Liu, B.Y. Rainfall erosivity estimation using daily rainfall amounts. Sci. Geogr. Sin. 2002, 22, 705–711. [Google Scholar]
- Li, P.F.; Chen, J.N.; Zhao, G.J.; Holden, J.; Liu, B.T.; Chan, F.; Hu, J.F.; Wu, P.L.; Mu, X.M. Determining the drivers and rates of soil erosion on the Loess Plateau since. Sci. Total Environ. 2022, 823, 153674. [Google Scholar] [CrossRef] [Scilit]
- Yang, X.H. State and trends of hillslope erosion across New South Wales, Australia. CATENA 2020, 186, 104361. [Google Scholar] [CrossRef] [Scilit]
- Jin, F.M.; Yang, W.C.; Fu, J.X.; Li, Z. Effects of vegetation and climate on the changes of soil erosion in the Loess Plateau of China. Sci. Total Environ. 2021, 773, 145514. [Google Scholar] [CrossRef] [Scilit]
- Xie, Y.F.; Yao, S.B.; Ding, Z.M.; Hou, M.Y.; Deng, Y.J.; Liu, G.Q. The Grain for Green project, geographical features and soil erosion: Taking 107 counties in Shaanxi Province as examples. Acta Ecol. Sin. 2022, 42, 301–312. [Google Scholar] [CrossRef] [Scilit]
- Getis, A.; Ord, J.K. The Analysis of Spatial Association by Use of Distance Statistics. In Perspectives on Spatial Data Analysis; Anselin, L., Rey, S.J., Eds.; Springer: Heidelberg, Germany, 2010; pp. 127–145. [Google Scholar]
- Hurst, H. Long-term storage capacity of reservoirs. Trans. Am. Soc. Civ. Eng. 1951, 116, 770–799. [Google Scholar] [CrossRef] [Scilit]
- Chin, W.W. The partial least squares approach for structural equation modeling. In Modern Methods for Business Research; Marcoulides, G.A., Ed.; Lawrence Erlbaum Associates: Mahwah, NJ, USA, 1998; pp. 295–336. [Google Scholar]
- Wang, T. Impacts of the grain for green project on soil erosion: A case study in the Wuding River and Luohe River Basins in the Shaanxi province of China. Appl. Ecol. Environ. Res. 2018, 16, 4165–4181. [Google Scholar] [CrossRef] [Scilit]
- Liu, P.P.; Guo, B.; Zhang, R.; Wang, L.H. Spatial-temporal evolution pattern of soil erosion and its dominant factors on the Loess Plateau from 2000 to 2020. Land 2024, 13, 1944. [Google Scholar] [CrossRef] [Scilit]
- Zhao, J.; Zhao, J.Y.; Huang, Q. ENSO forcing of rainfall erosivity in the Wuding River Basin. Atmosphere 2023, 14, 1030. [Google Scholar] [CrossRef] [Scilit]
- Zeng, R.C.; Zhang, G.H.; Su, X.F.; Wang, C.S. Soil erodibility characteristics of gullies with typical plant communities on the Loess Plateau of China. Land Degrad. Dev. 2025, 37, 1548–1560. [Google Scholar] [CrossRef] [Scilit]
- Tian, P.; Tian, X.J.; Geng, R.; Zhao, G.J.; Yang, L.; Mu, X.M.; Gao, P.; Sun, W.Y.; Liu, Y.L. Response of soil erosion to vegetation restoration and terracing on the Loess Plateau. CATENA 2023, 227, 107103. [Google Scholar] [CrossRef] [Scilit]
- Sun, W.Y.; Shao, Q.Q.; Liu, J.Y. Soil erosion and its response to the changes of precipitation and vegetation cover on the Loess Plateau. J. Geogr. Sci. 2013, 23, 1091–1106. [Google Scholar] [CrossRef] [Scilit]
- Chamizo, S.; Rodríguez-Caballero, E.; Román, J.R.; Cantón, Y. Effects of biocrust on soil erosion and organic carbon losses under natural rainfall. CATENA 2017, 148, 117–125. [Google Scholar] [CrossRef] [Scilit]
- Bai, R.H.; Wang, X.Z.; Li, J.W.; Yang, F.; Shangguan, Z.P.; Deng, L. The impact of vegetation reconstruction on soil erosion in the Loess plateau. J. Environ. Manag. 2024, 363, 121382. [Google Scholar] [CrossRef] [Scilit]
- Zhao, G.J.; Kondolf, G.M.; Mu, X.M.; Han, M.W.; He, Z.; Rubin, Z.; Wang, F.; Gao, P.; Sun, W.Y. Sediment yield reduction associated with land use changes and check dams in a catchment of the Loess Plateau, China. CATENA 2017, 148, 126–137. [Google Scholar] [CrossRef] [Scilit]
- Yang, J.; Zhang, H.L.; Yang, W.Q. Coupling effects of precipitation and vegetation on sediment yield from the perspective of spatiotemporal heterogeneity across the Qingshui River Basin of the Upper Yellow River, China. Forests 2022, 13, 396. [Google Scholar] [CrossRef] [Scilit]
- Zhuang, H.C.; Wang, Y.X.; Liu, H.; Wang, S.J.; Zhang, W.Q.; Zhang, S.L.; Dai, Q. Large-scale soil erosion estimation considering vegetation growth cycle. Land 2021, 10, 473. [Google Scholar] [CrossRef] [Scilit]
- Zhao, Y.; Yin, X.; Zhang, X.; Liu, B.; Wang, Z. Effect of soil and water conservation measures on the reduction of runoff and sediment load in a loess hilly-gully region. J. Soil Water Conserv. 2021, 76, 52–64. [Google Scholar] [CrossRef] [Scilit]
- Wang, Z.J.; Jiao, J.Y.; Rayburg, S.; Wang, Q.L.; Su, Y. Soil erosion resistance of “Grain for Green” vegetation types under extreme rainfall conditions on the Loess Plateau, China. CATENA 2016, 141, 109–116. [Google Scholar] [CrossRef] [Scilit]
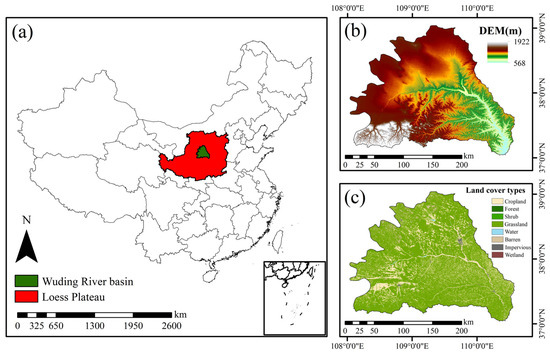
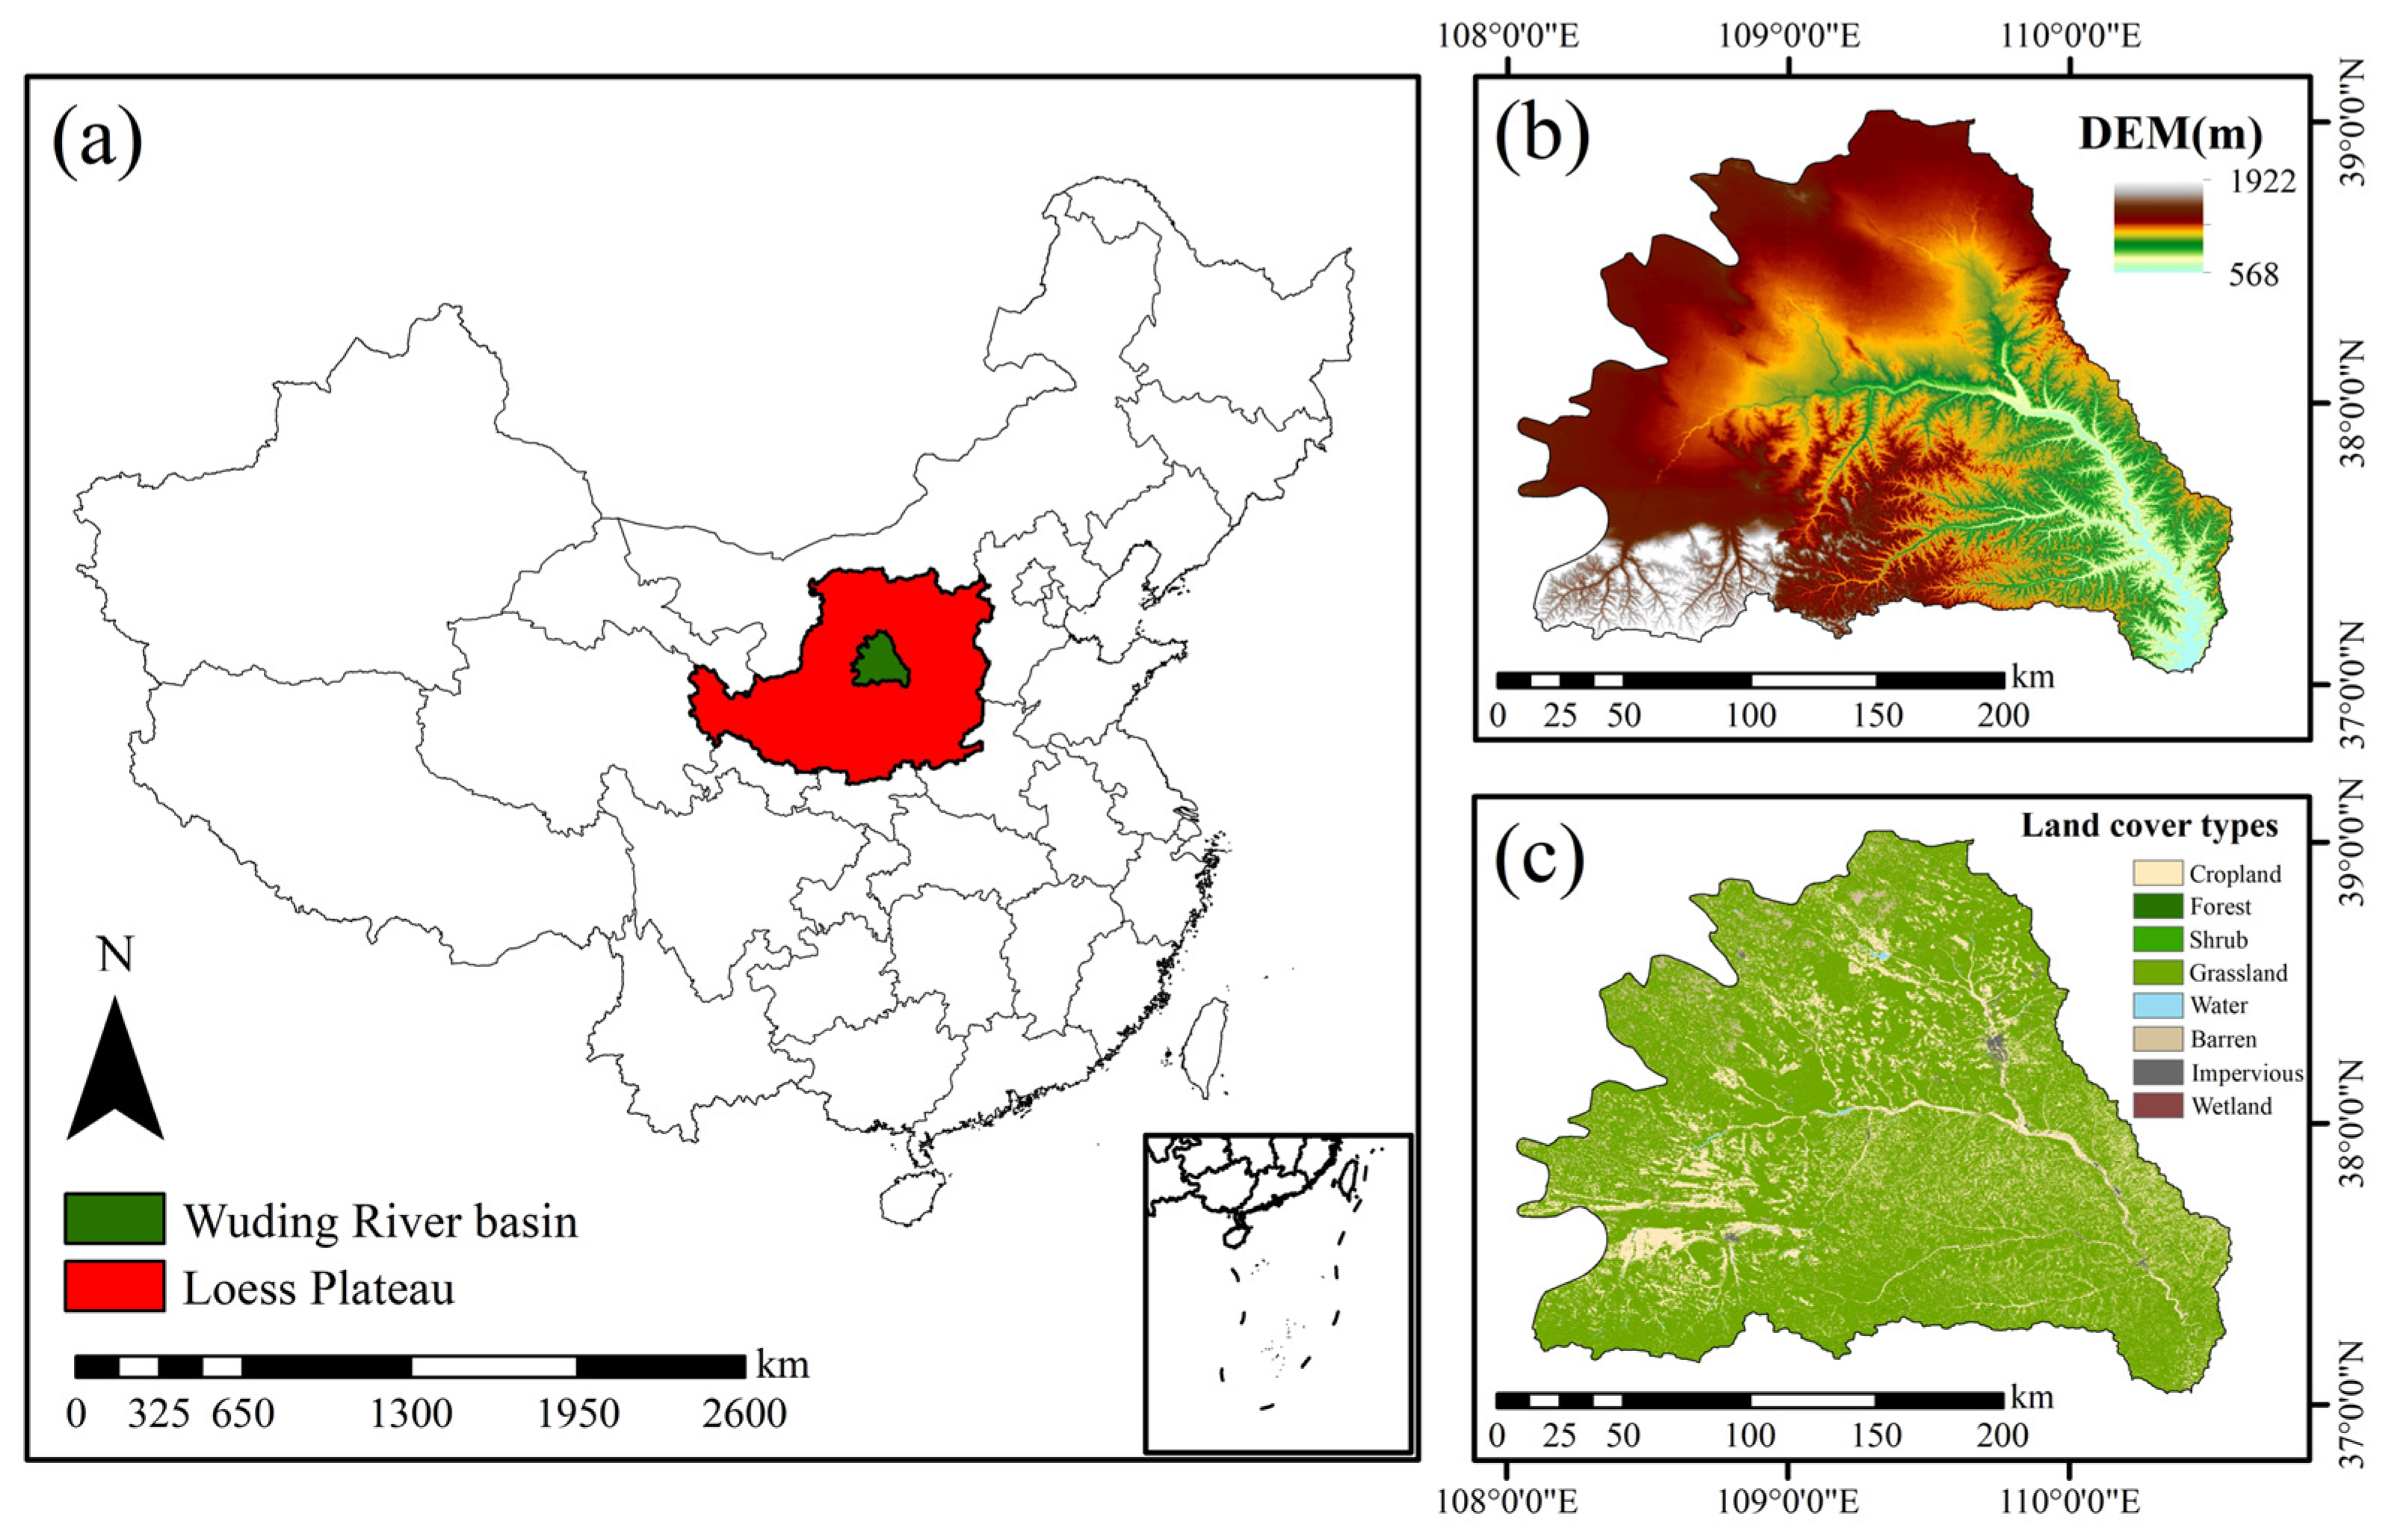
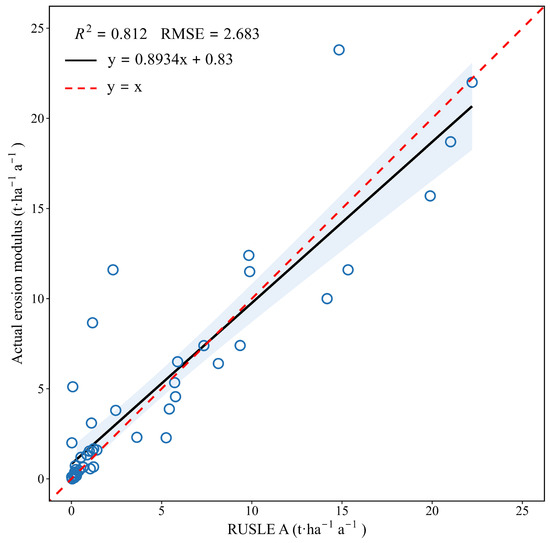
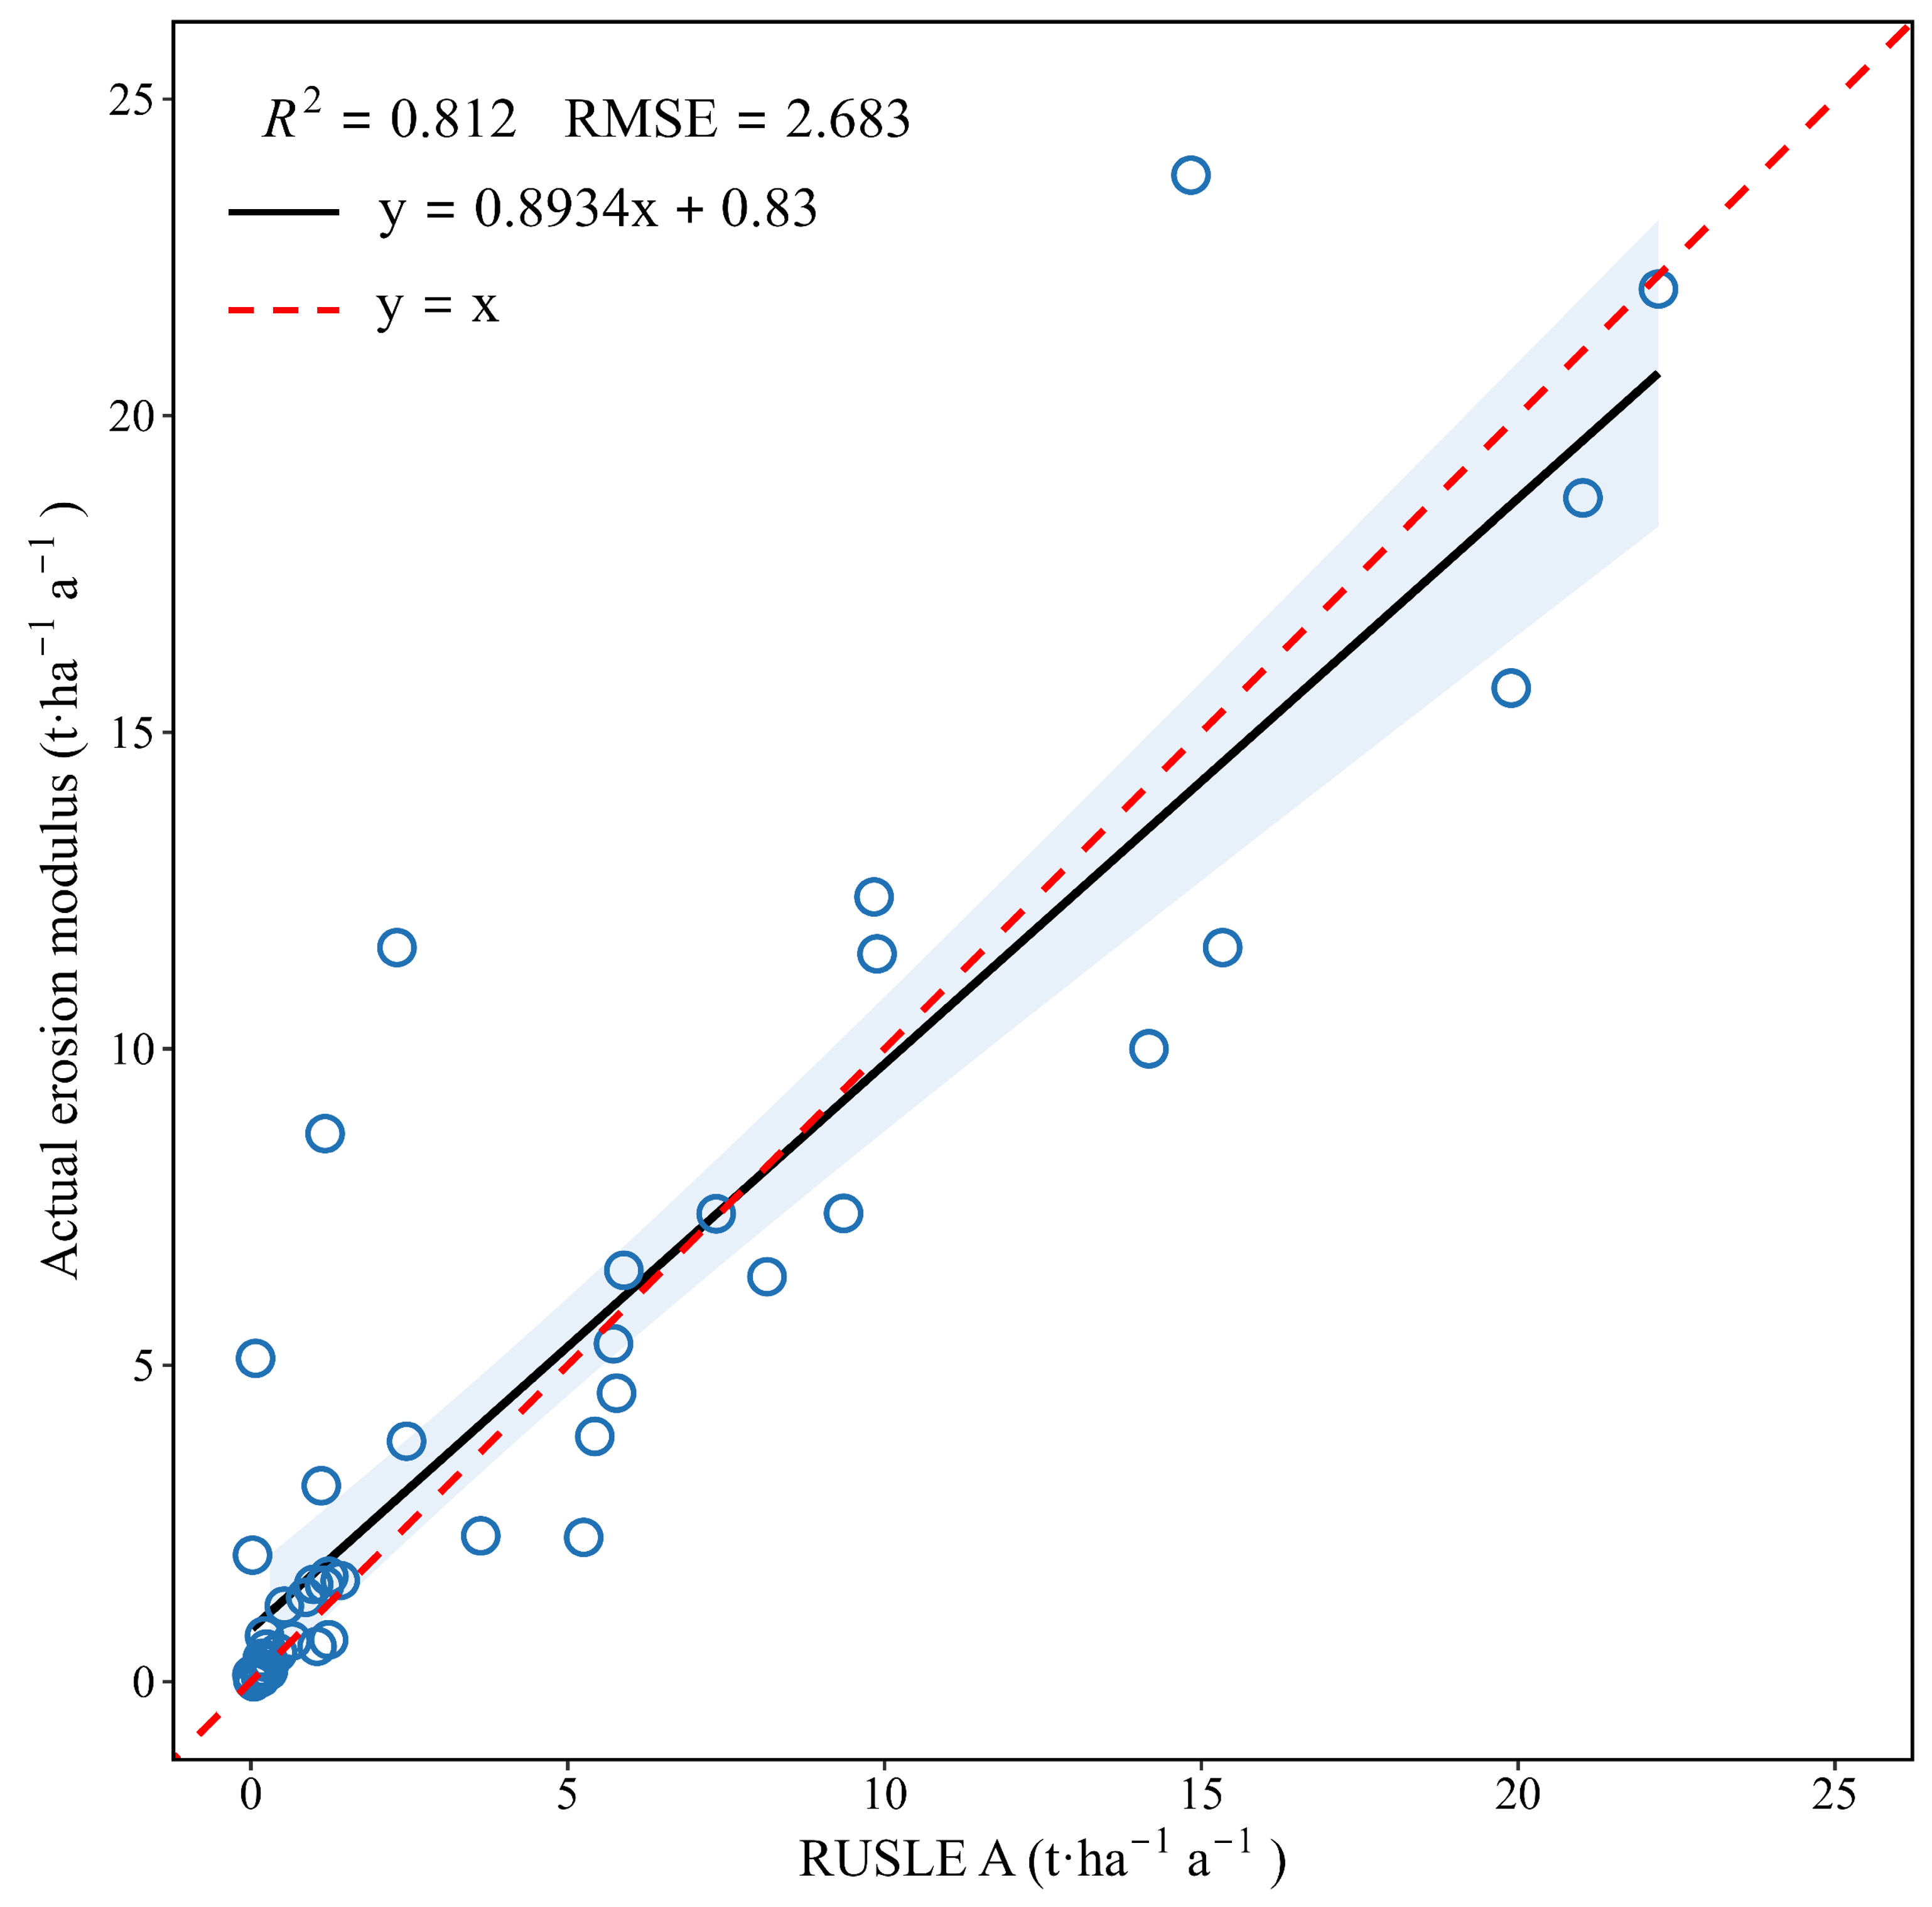
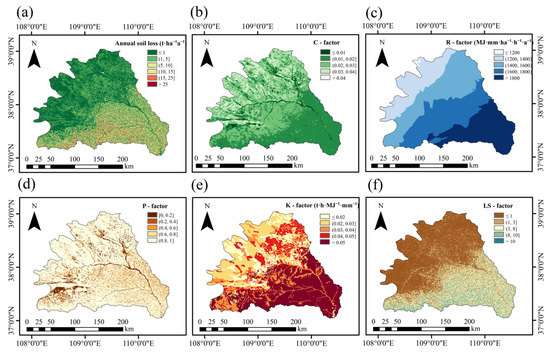
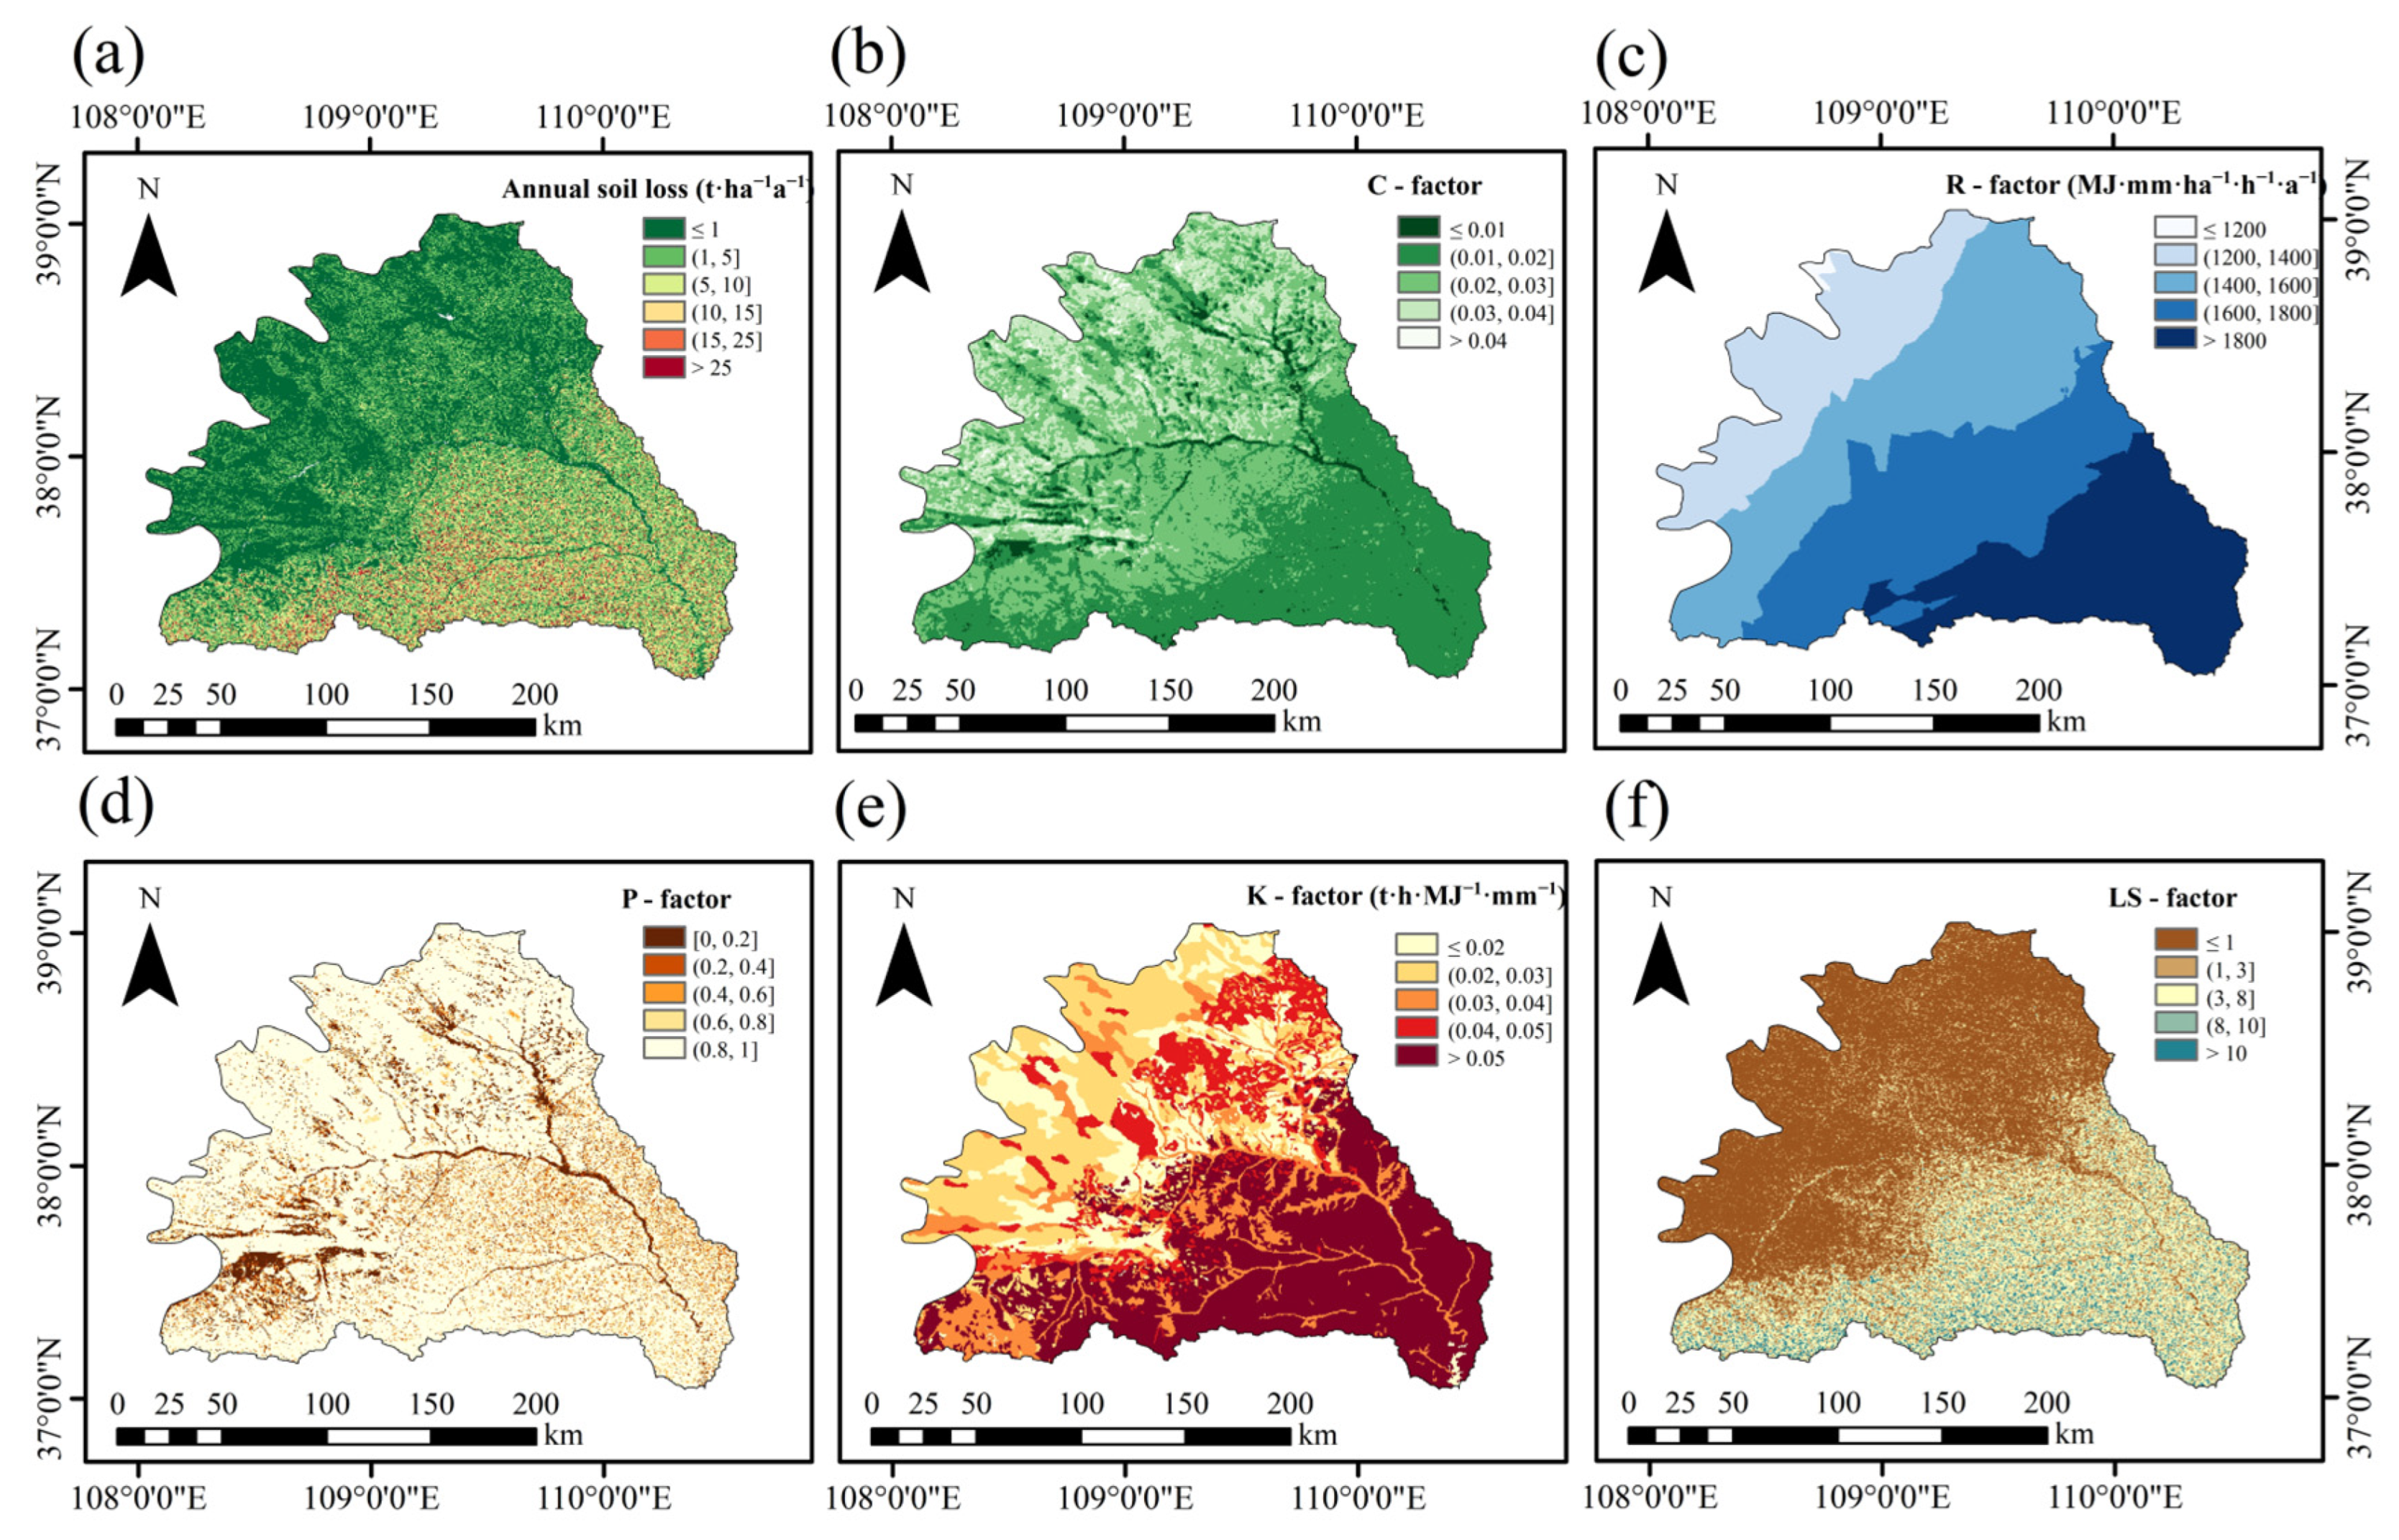
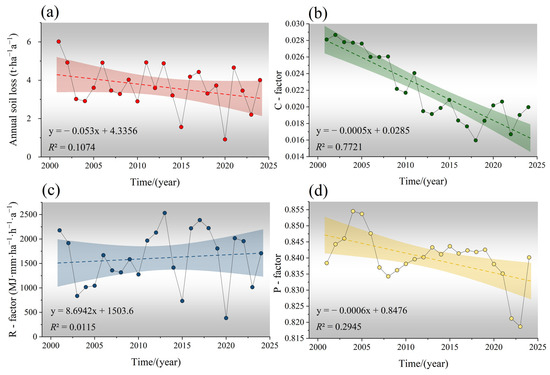
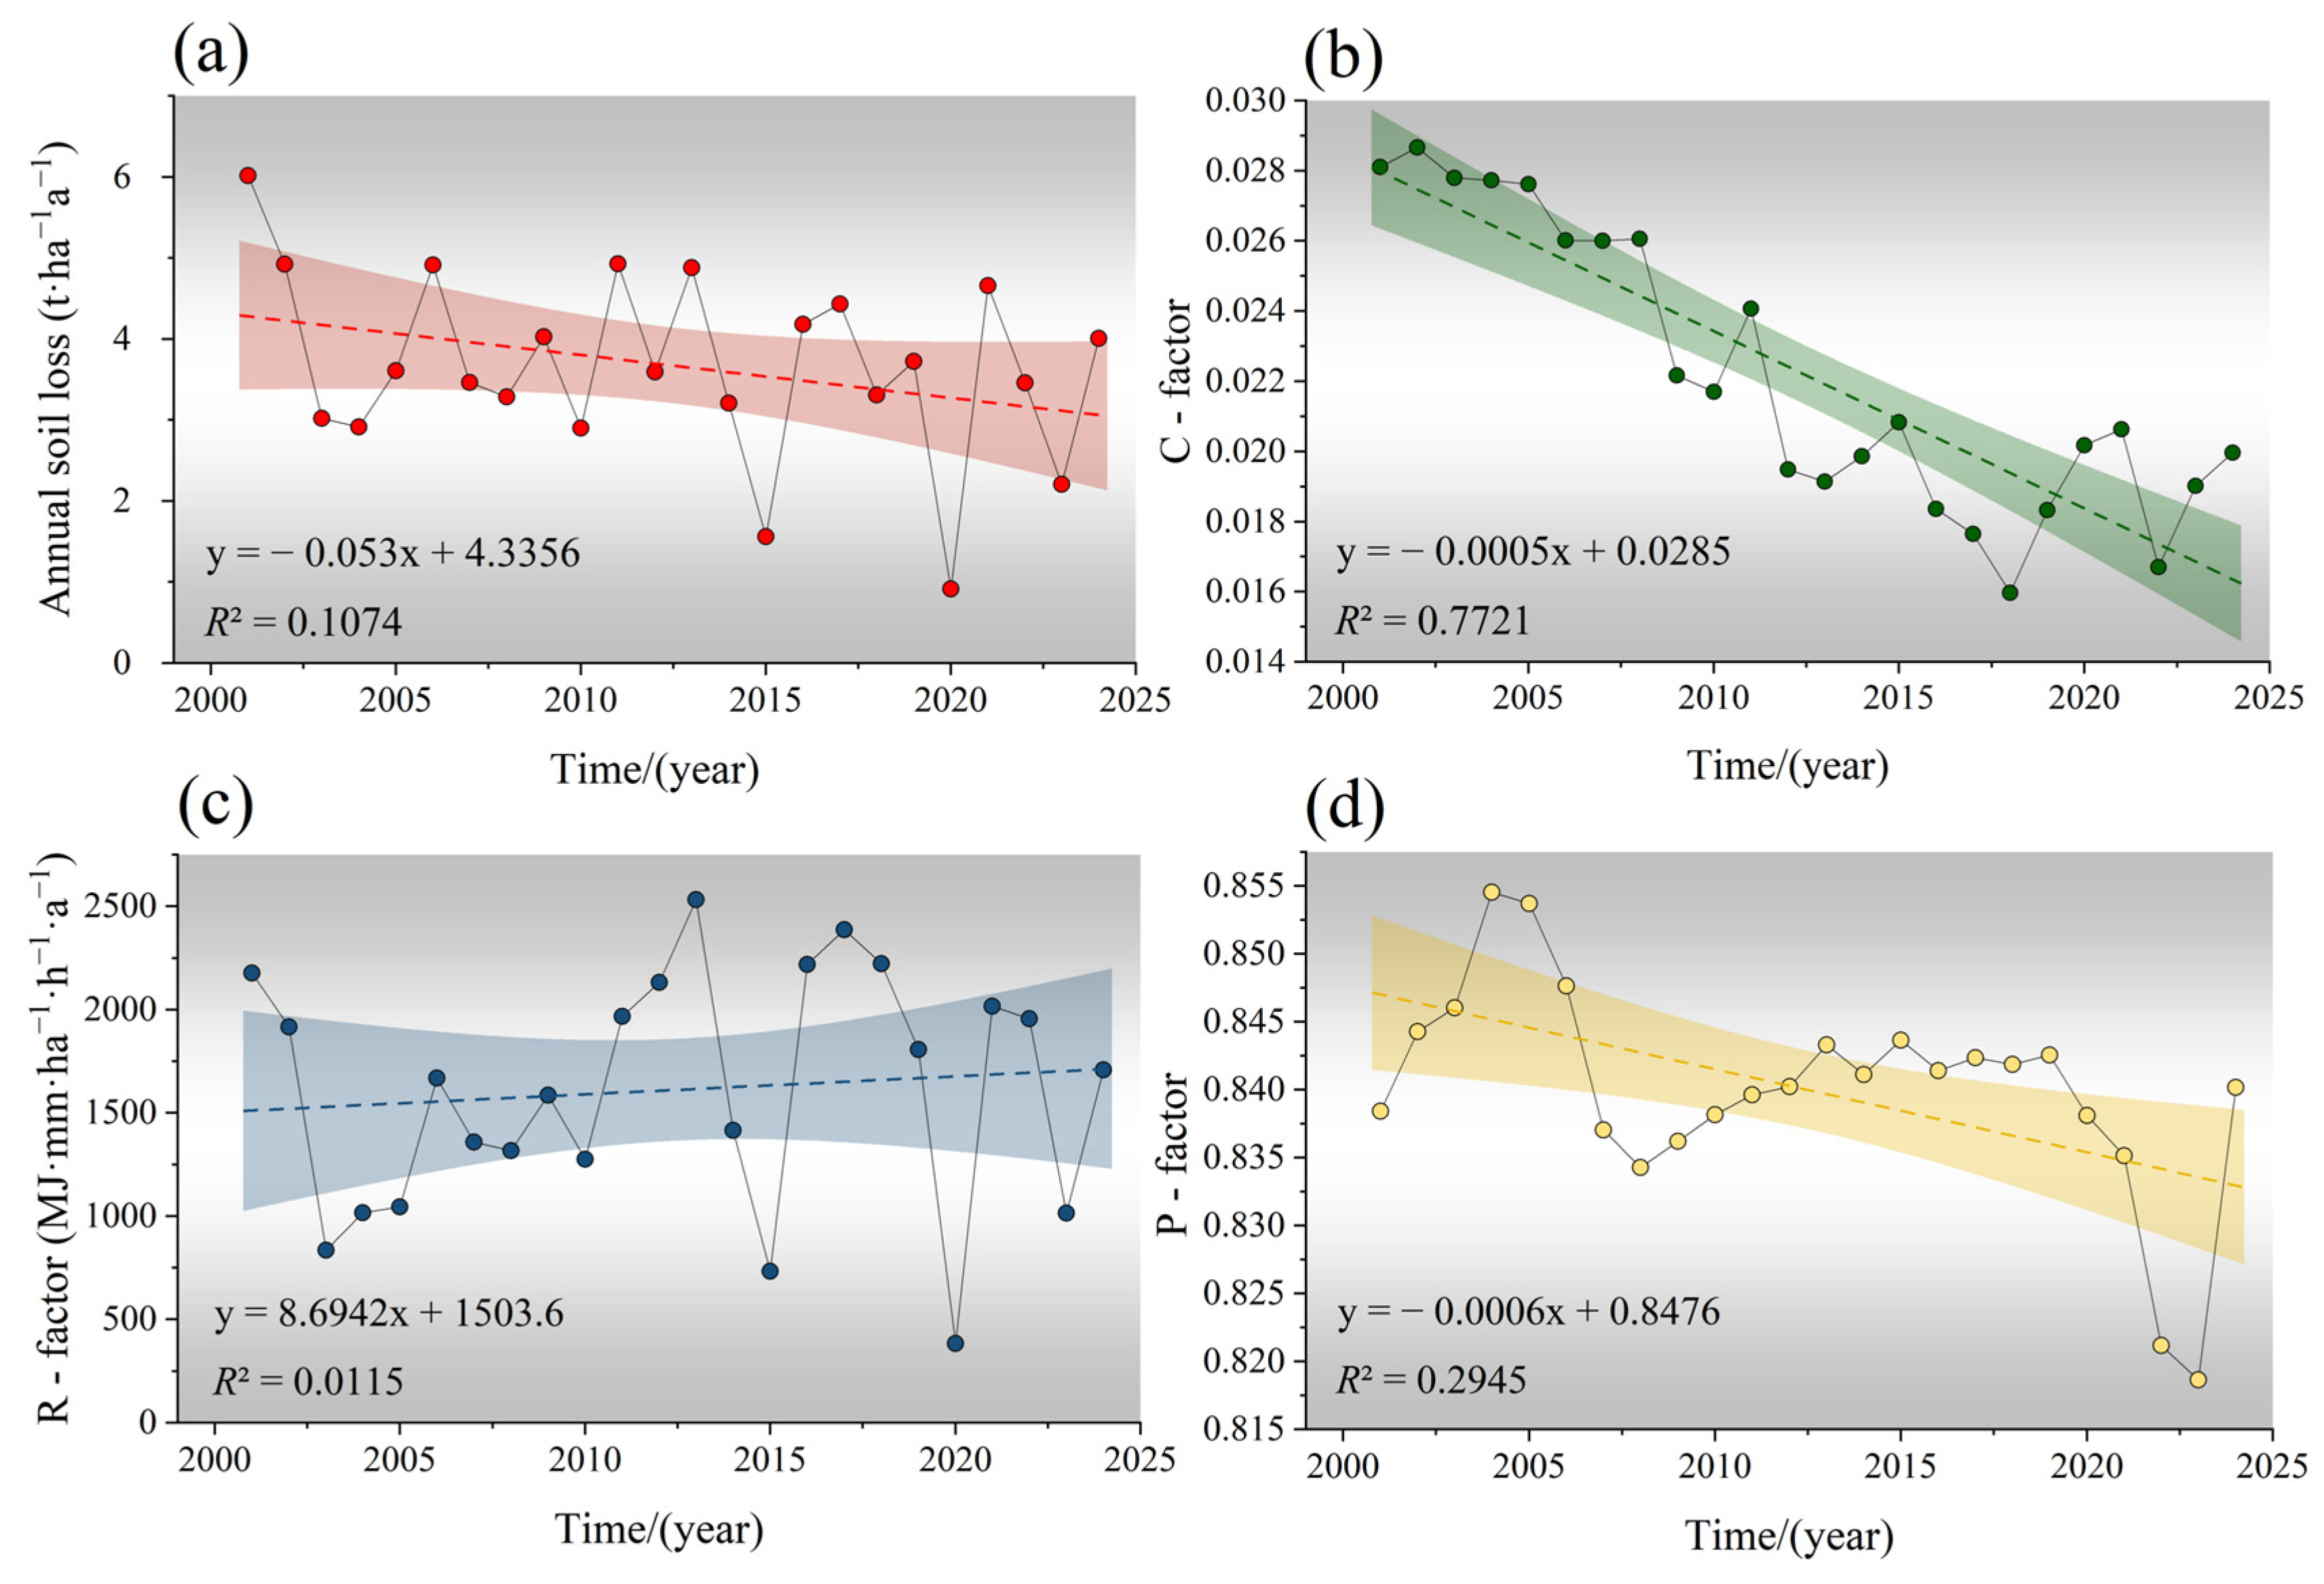
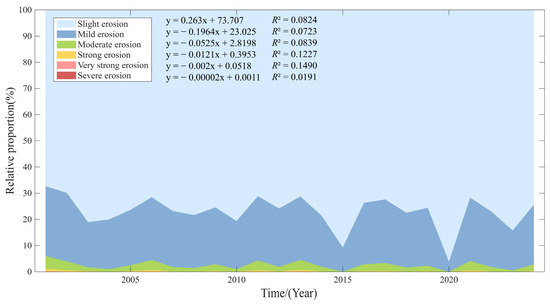
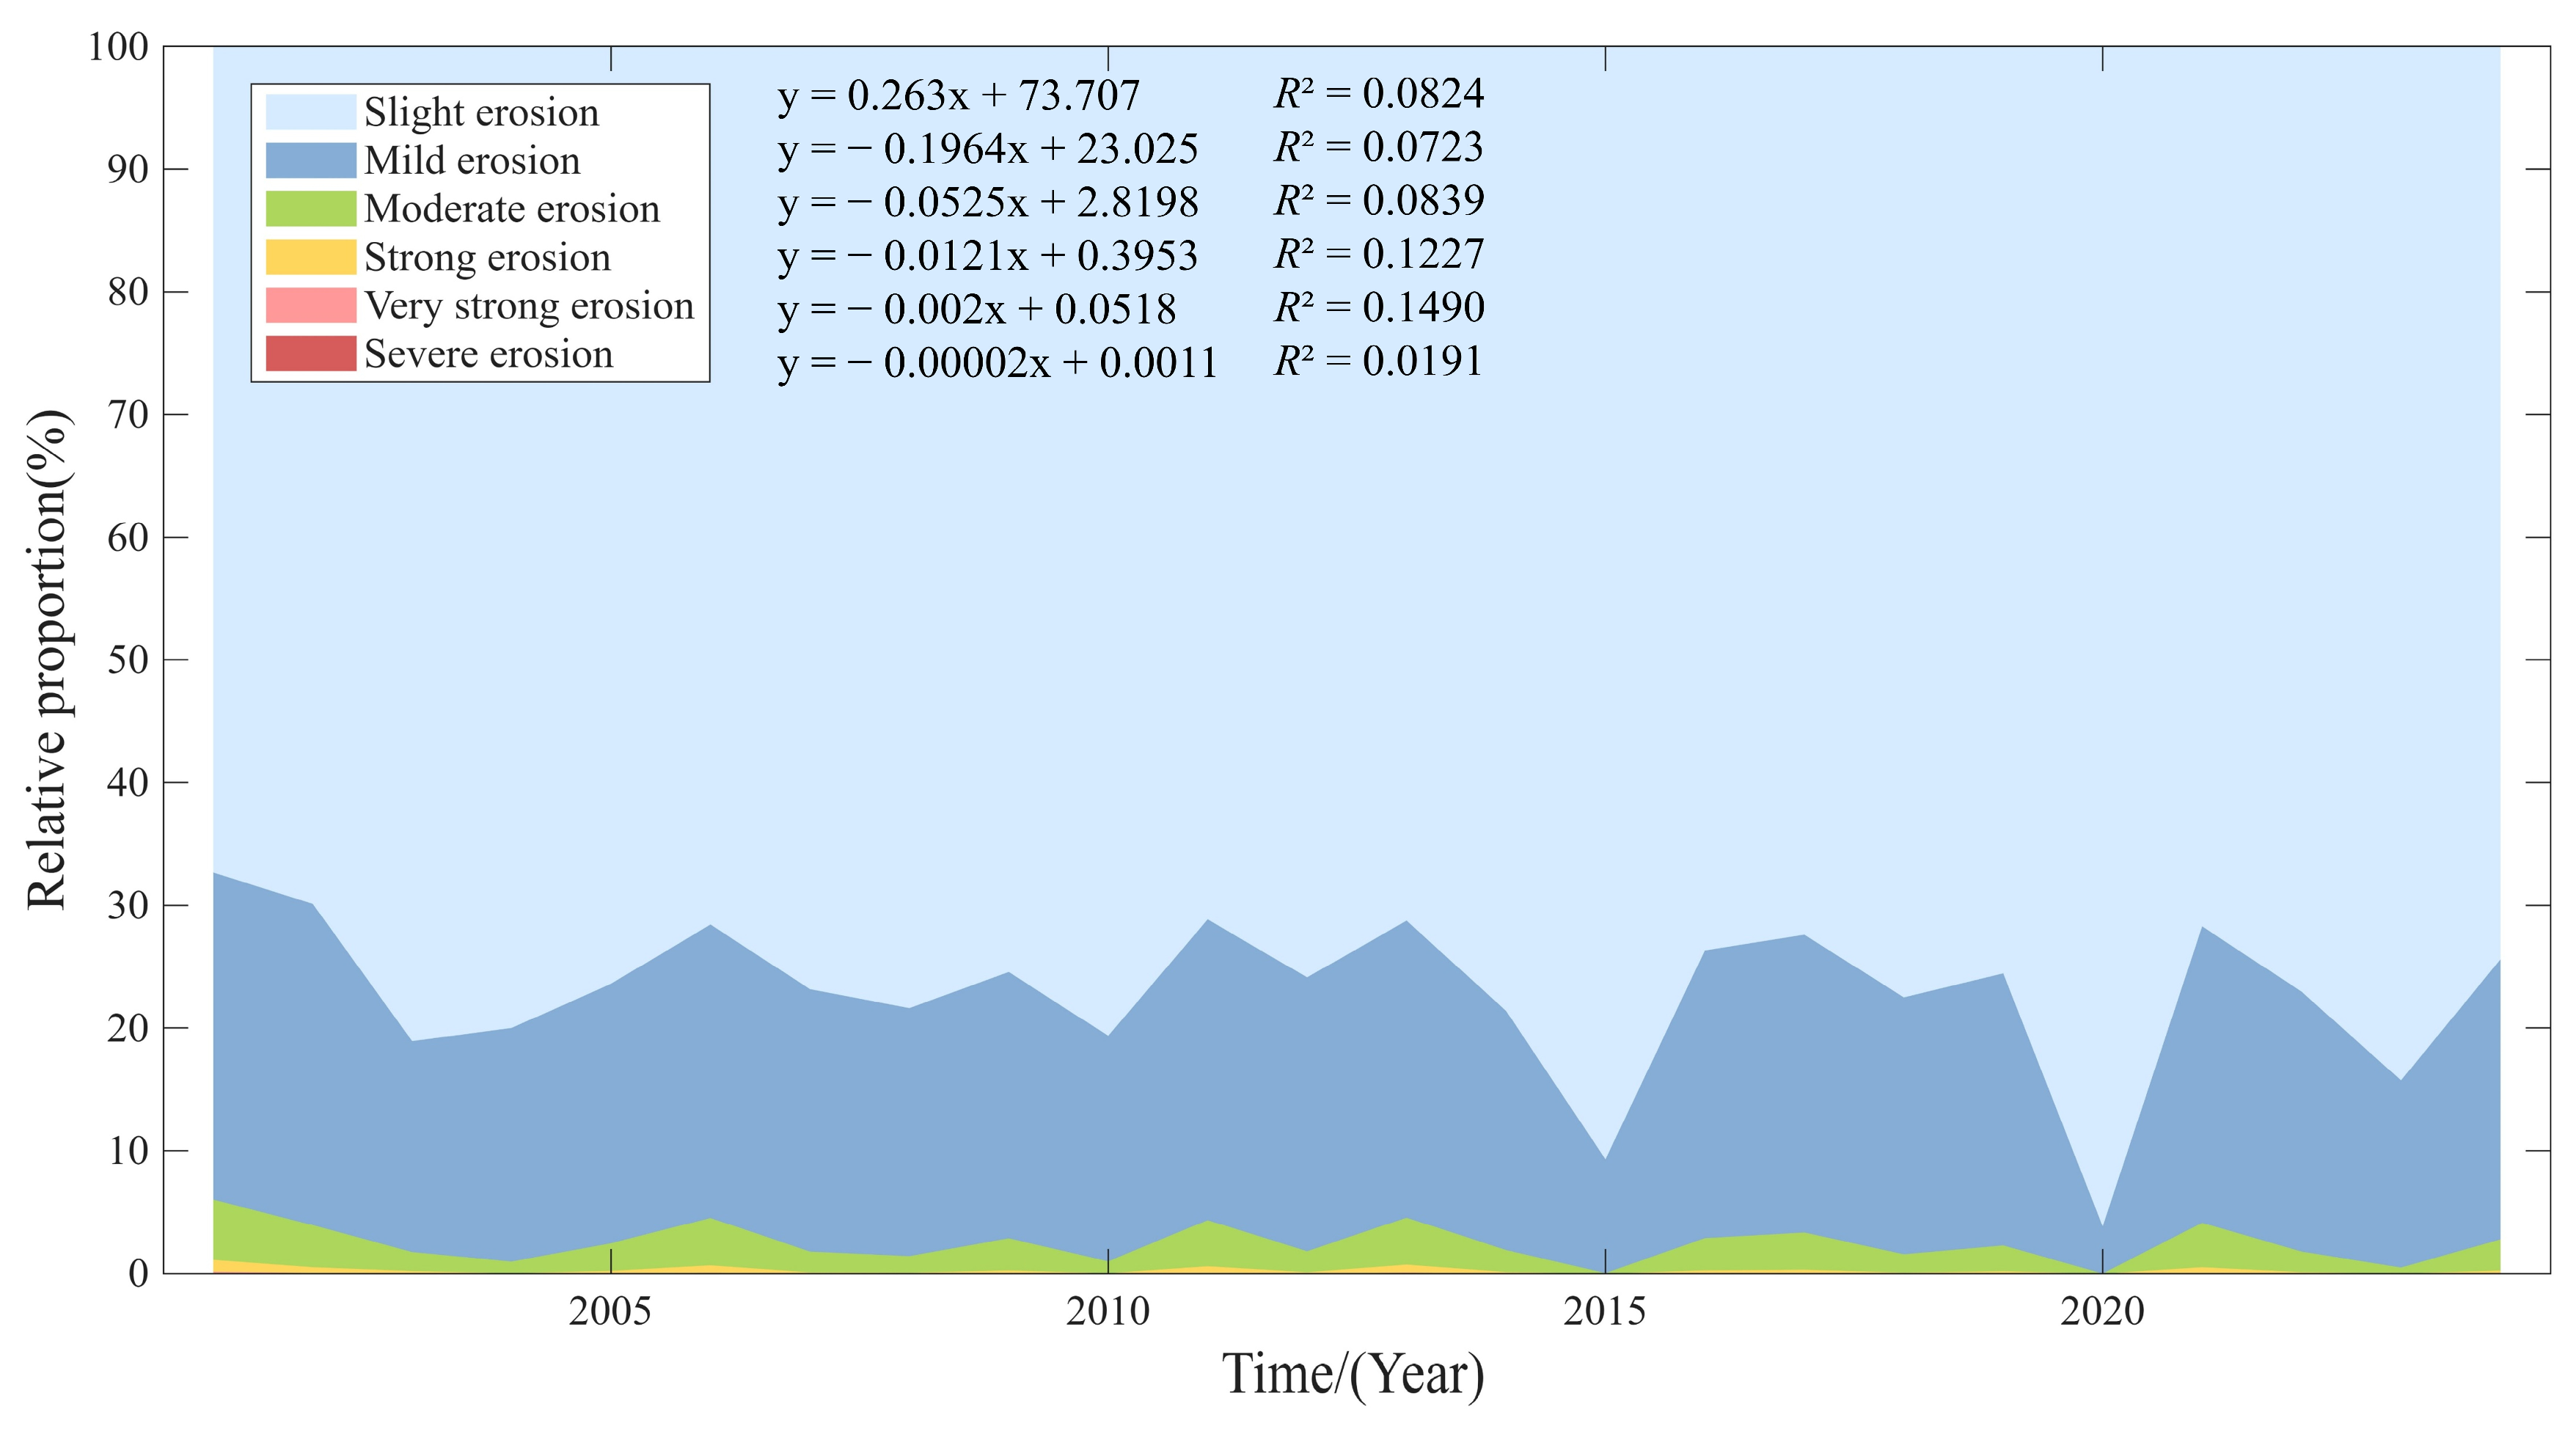
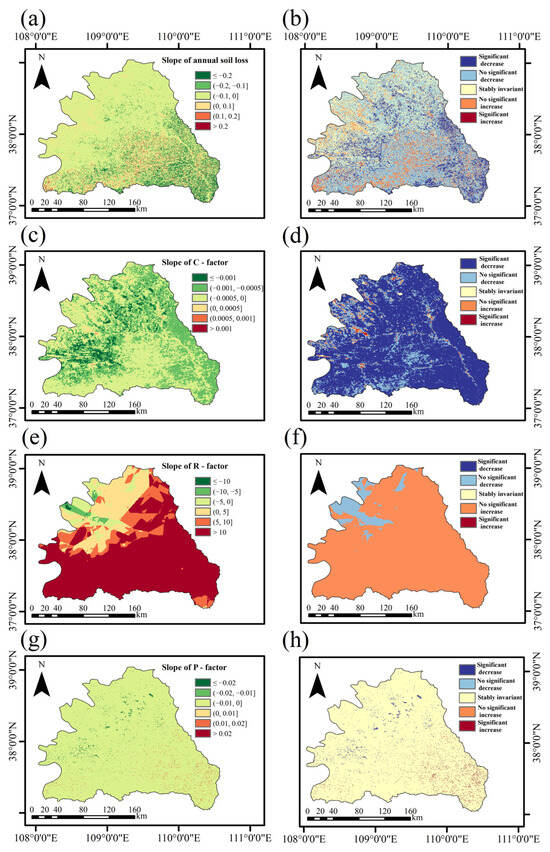
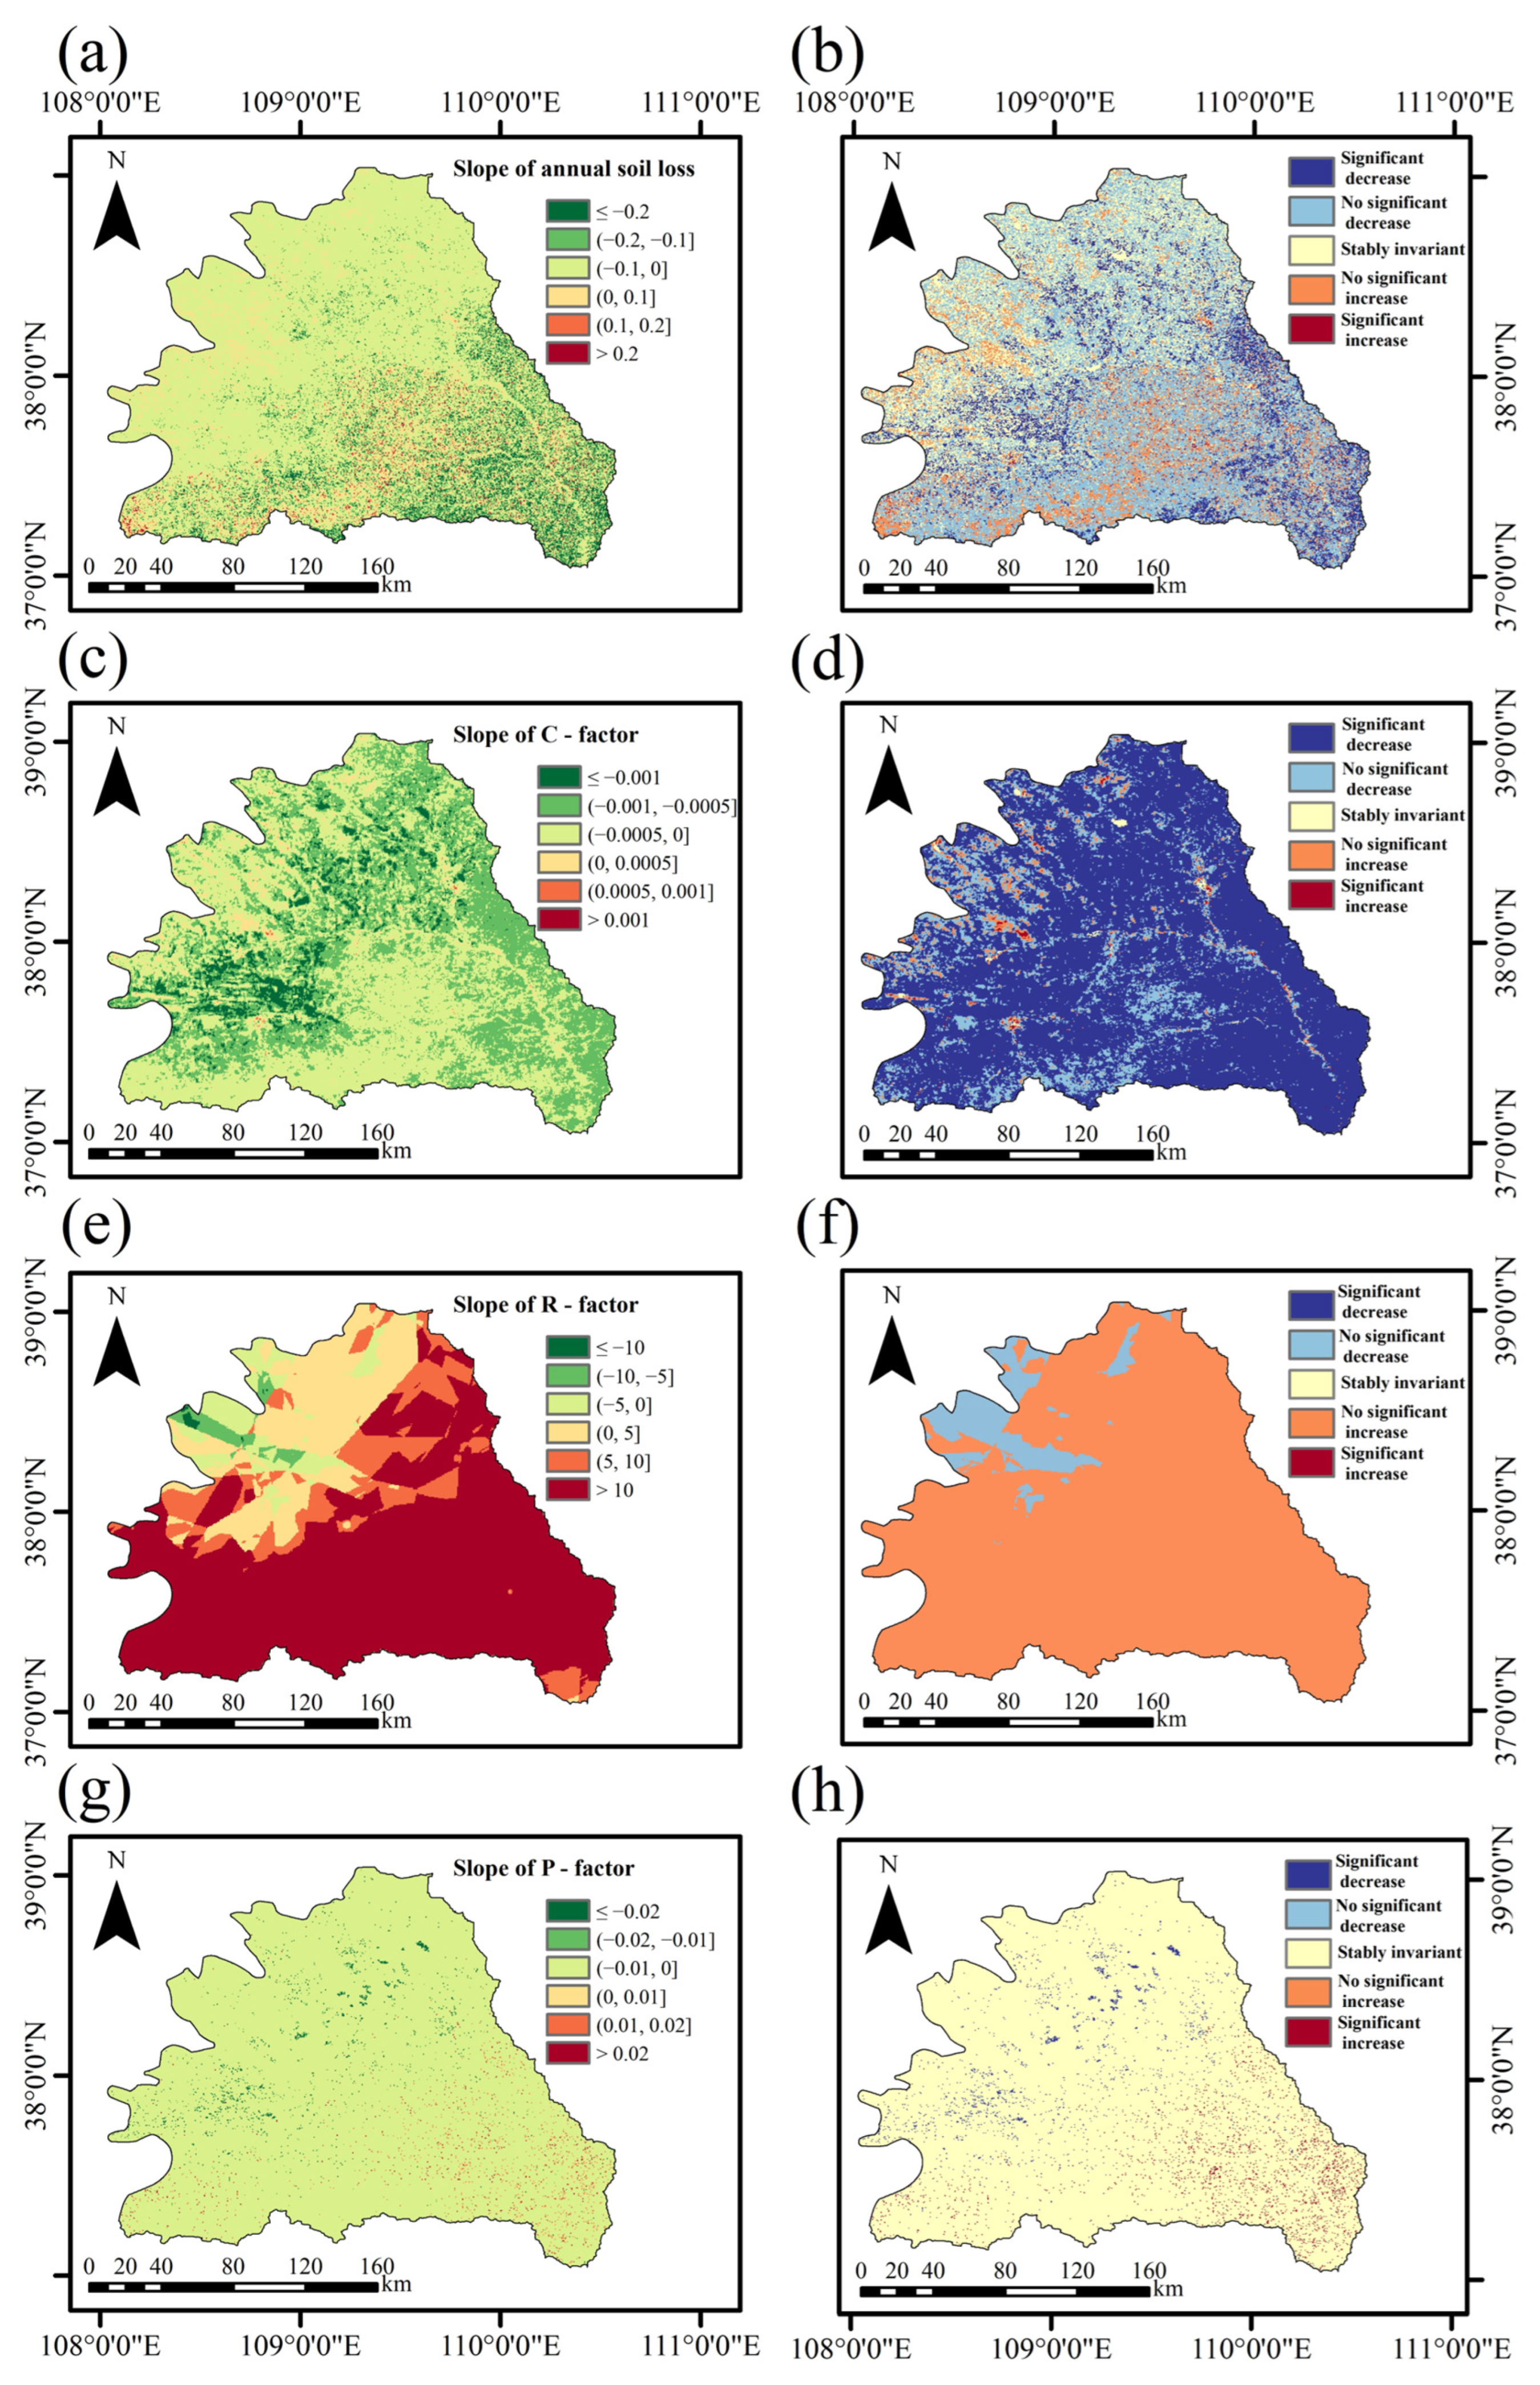
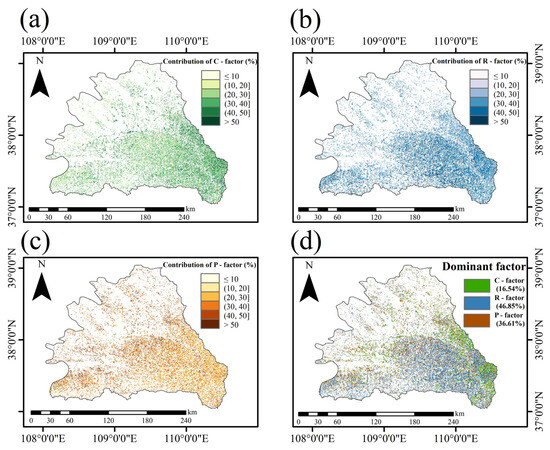
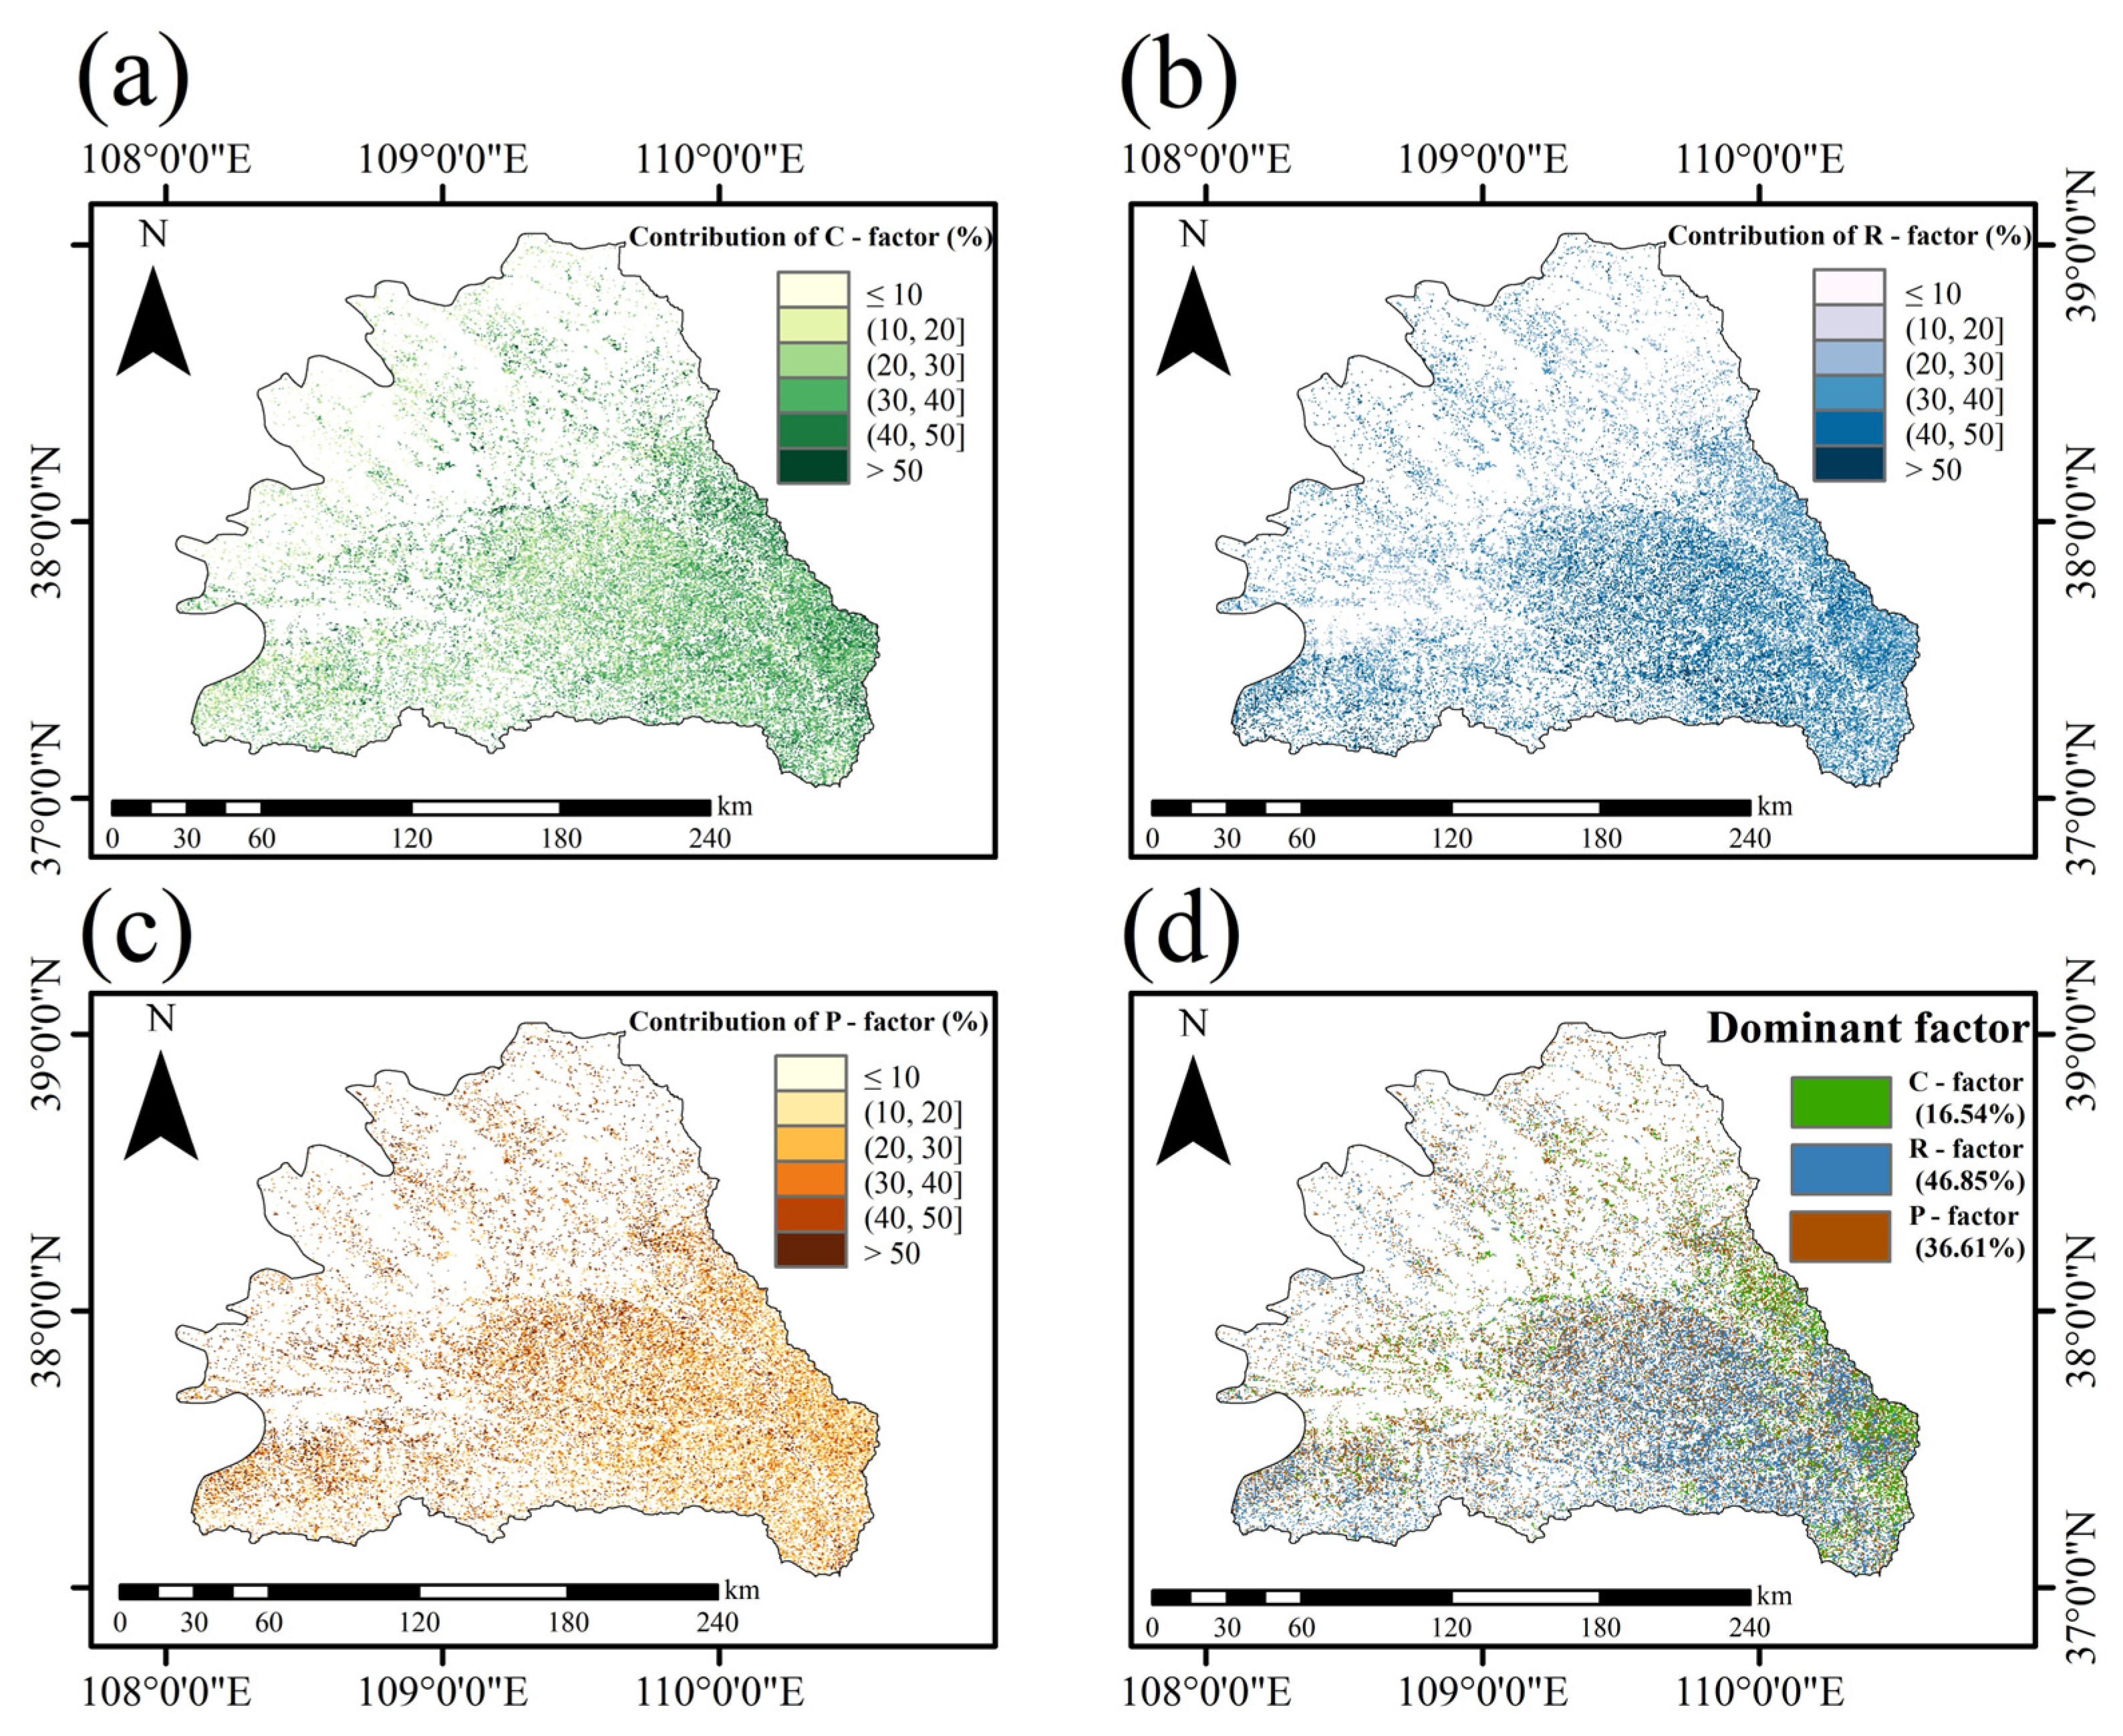
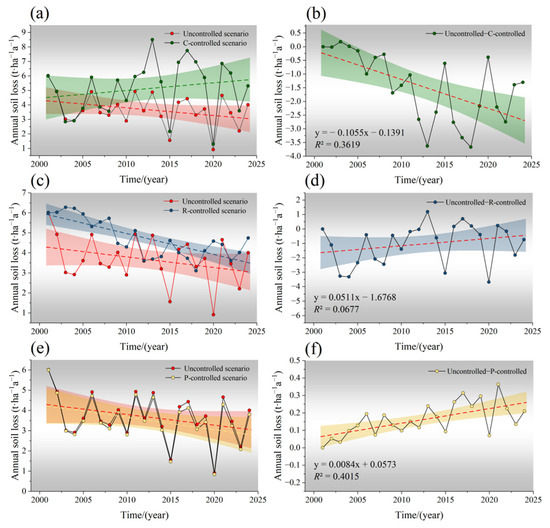
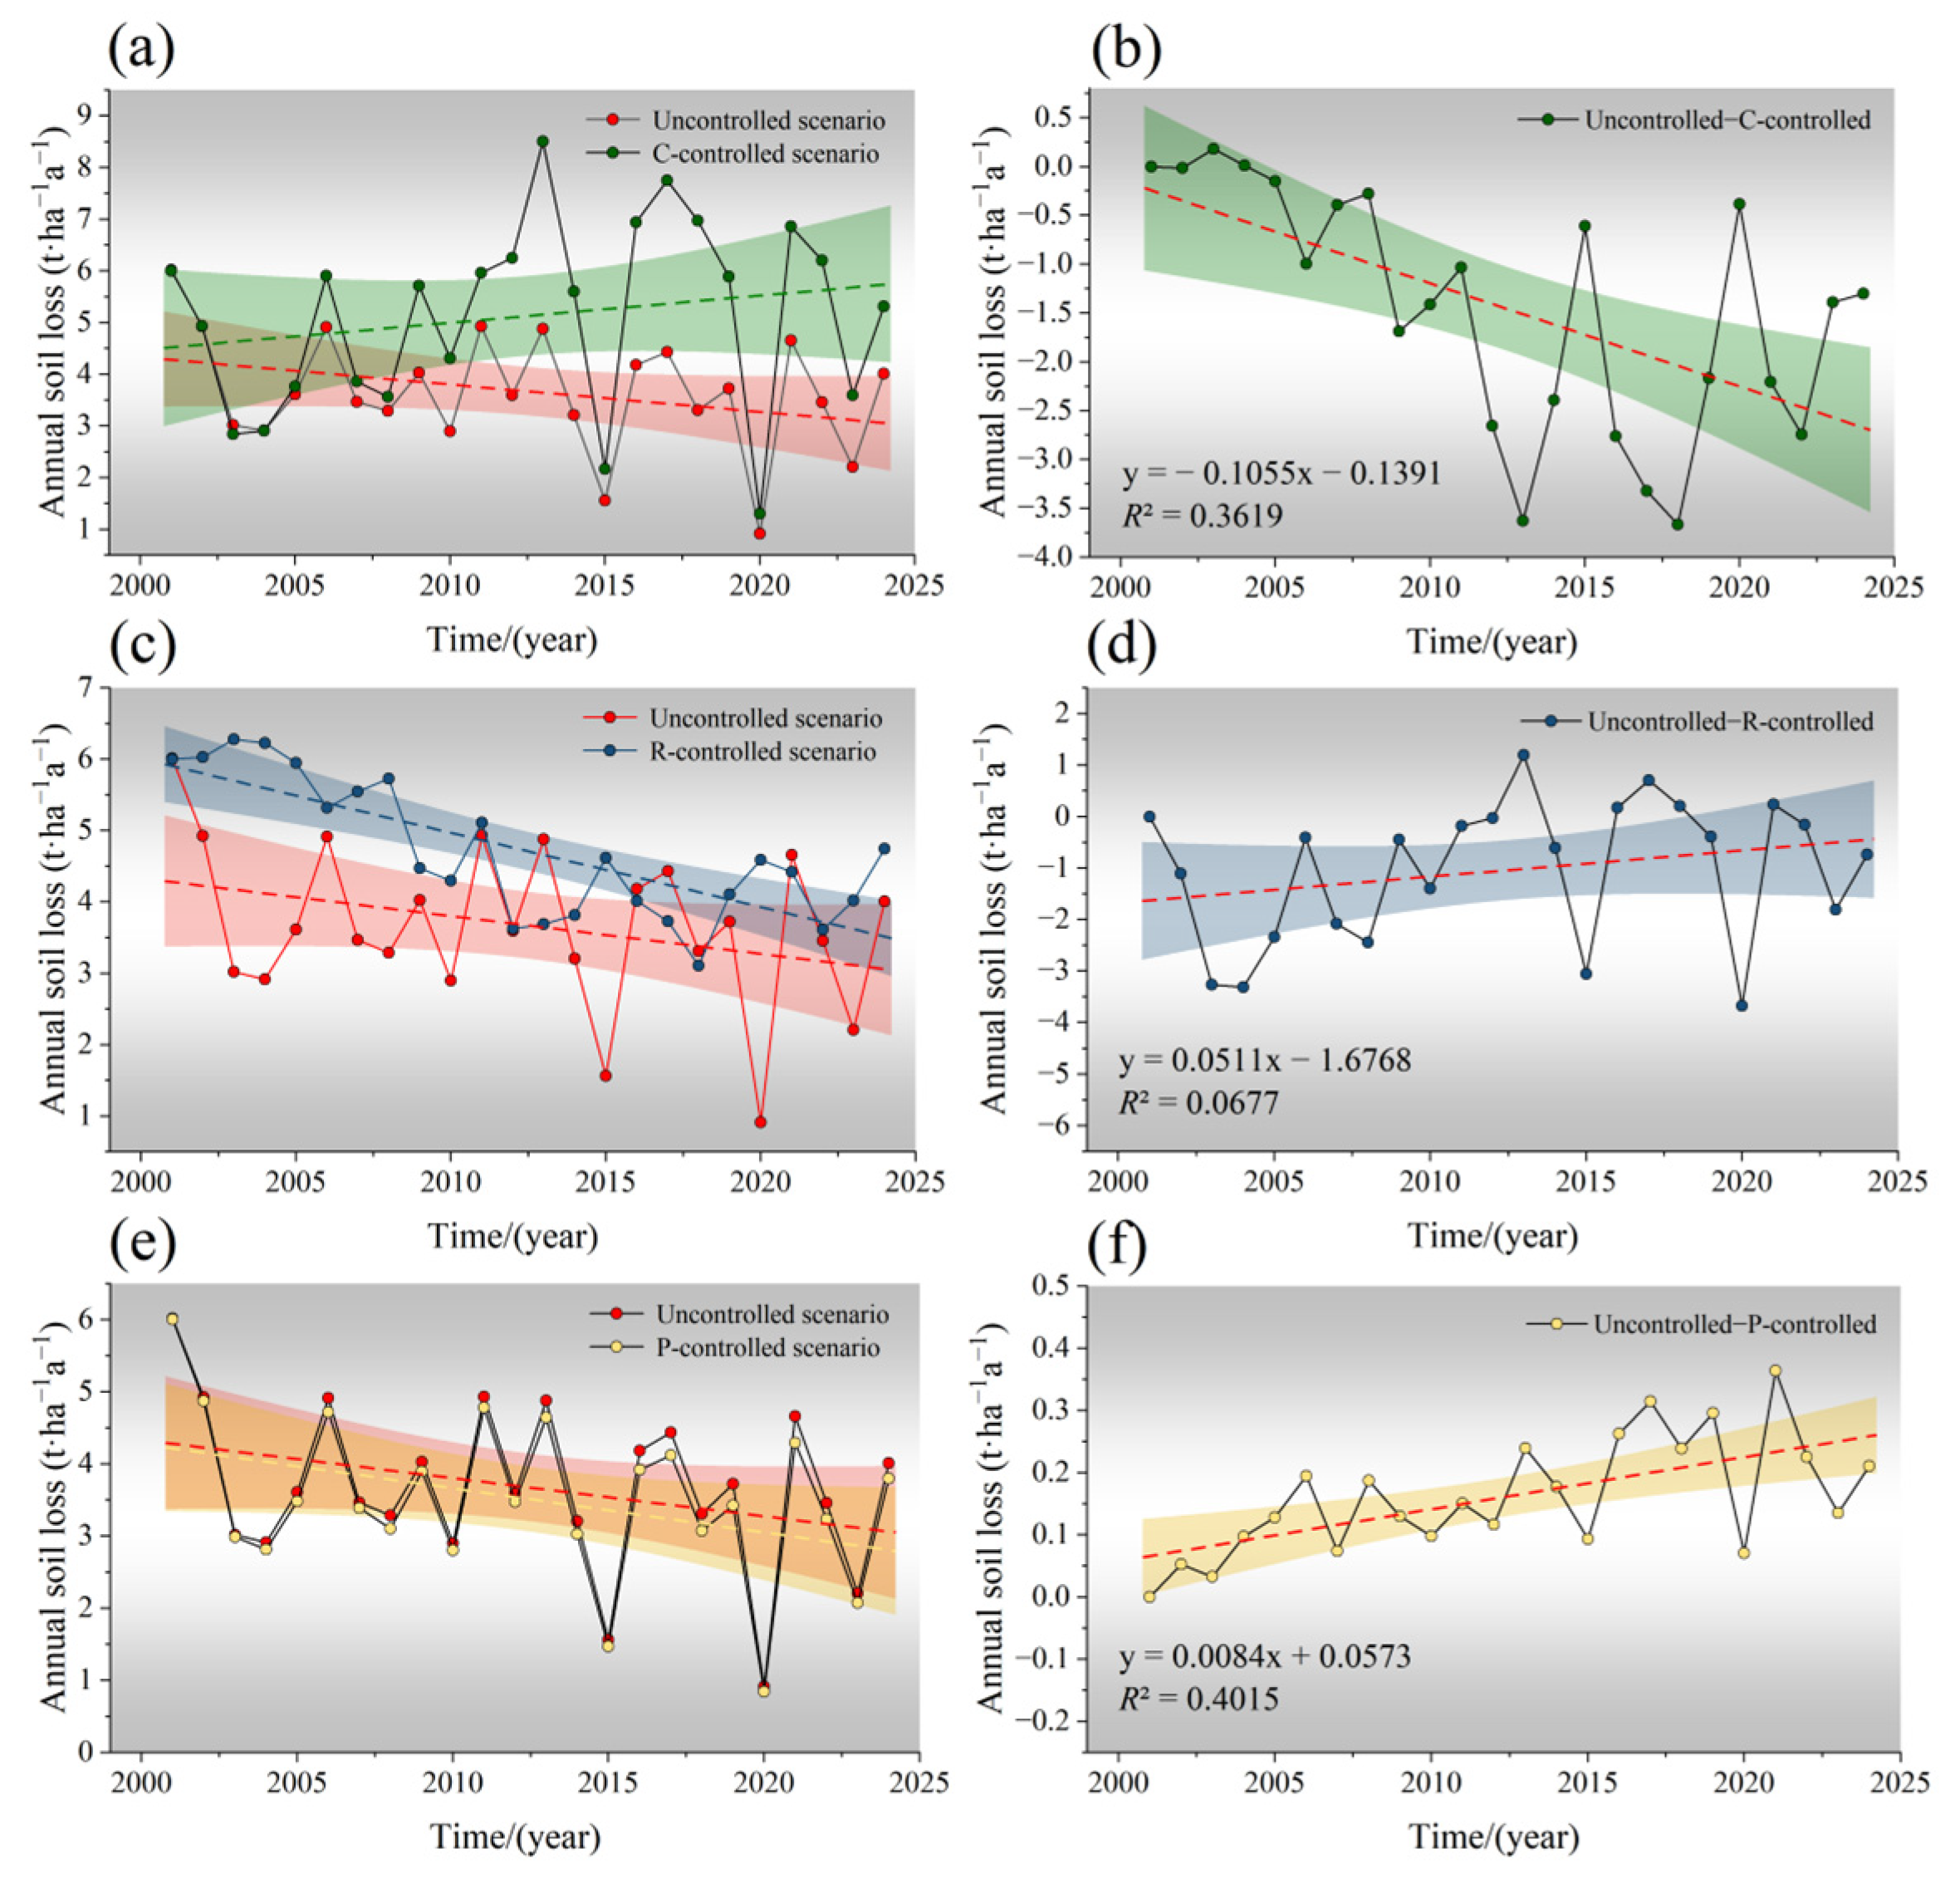
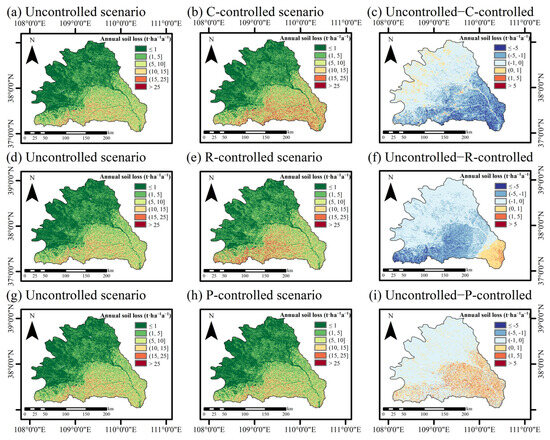
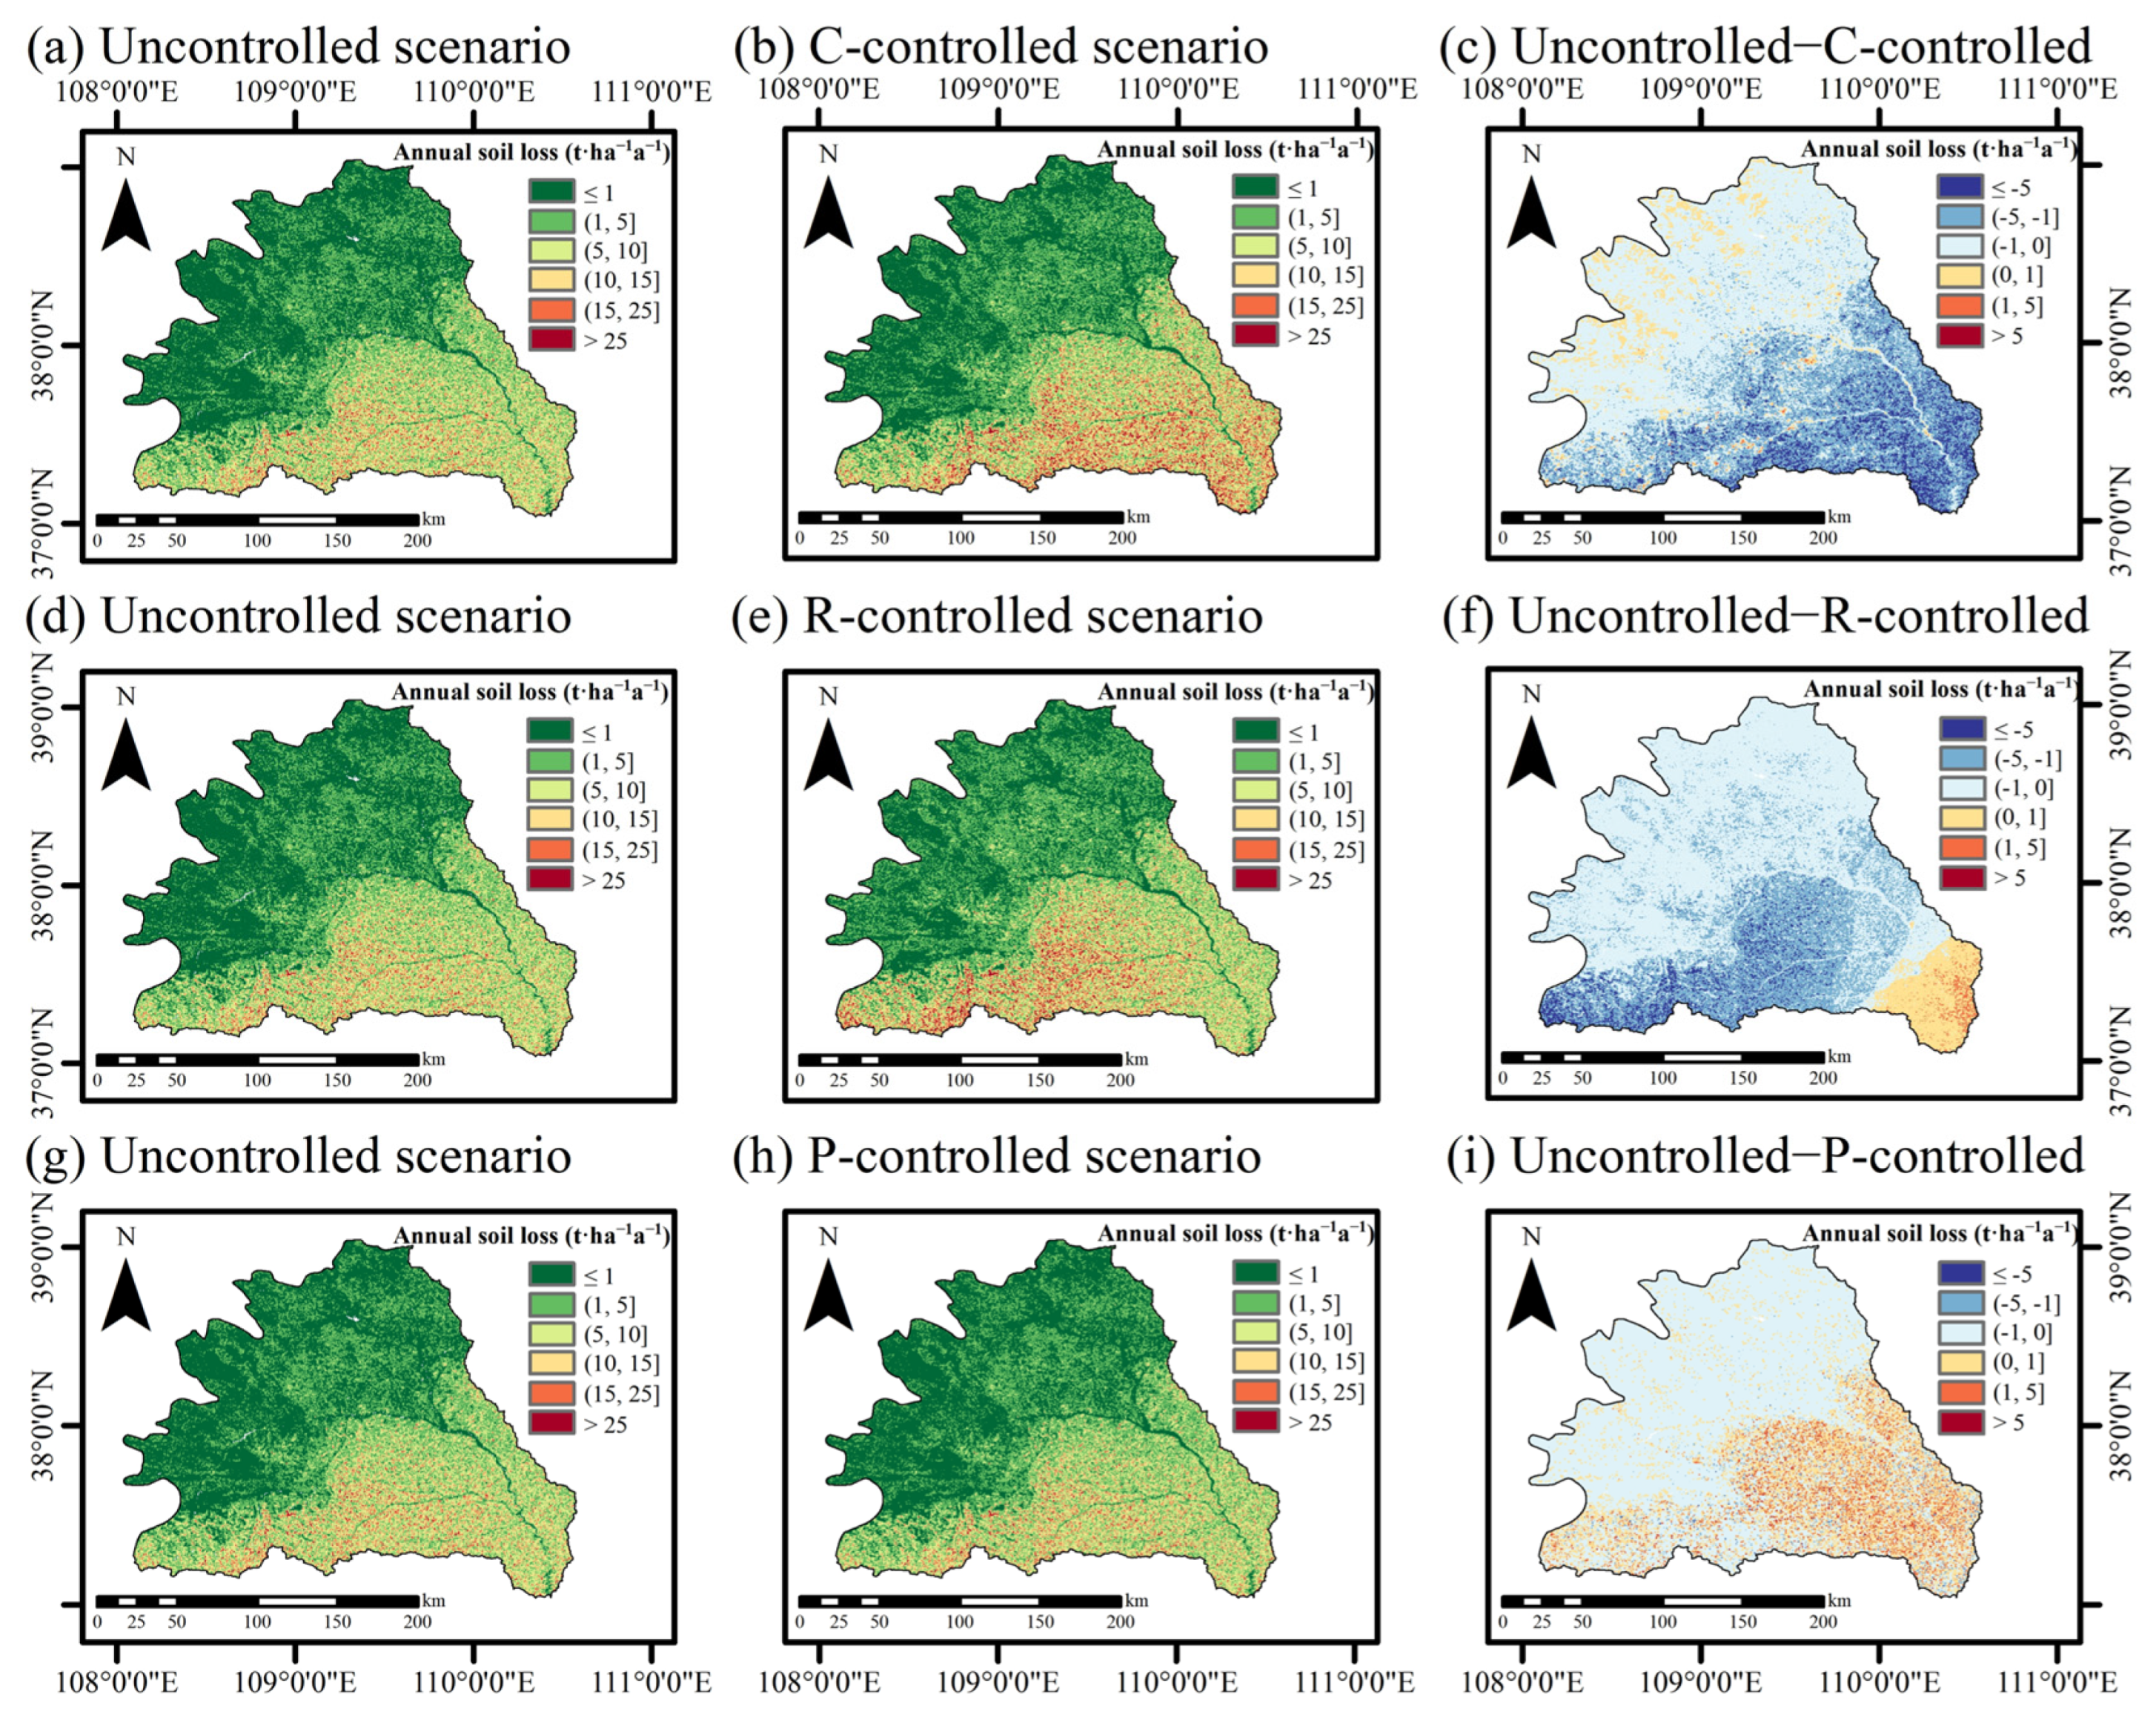
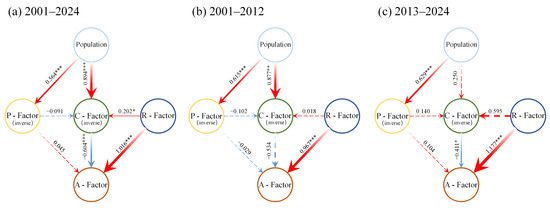
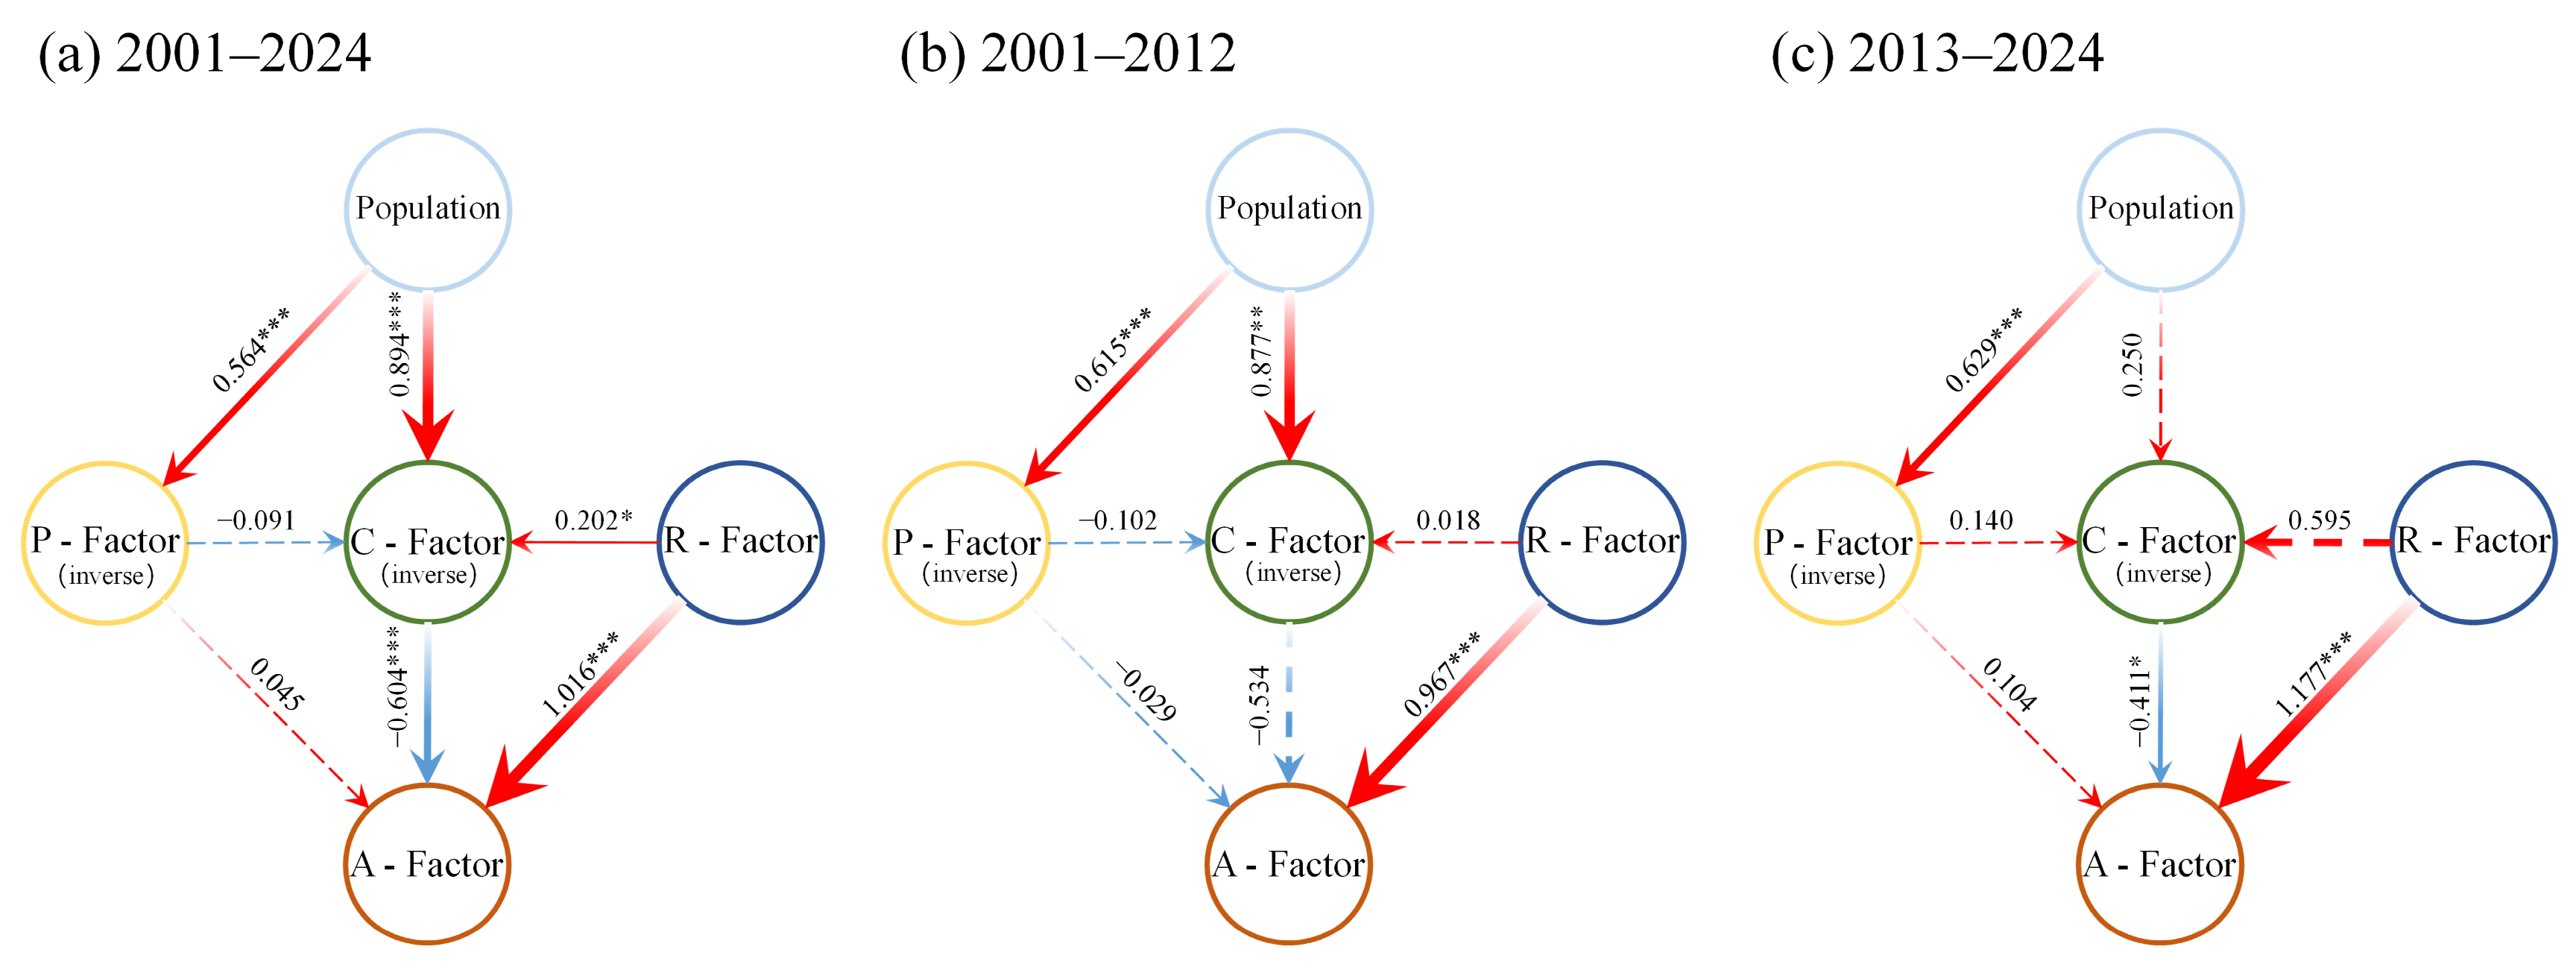
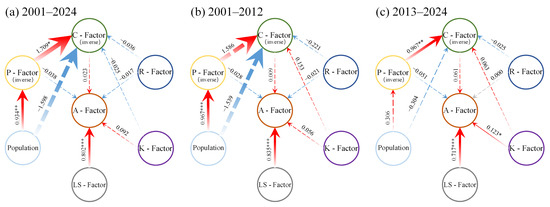
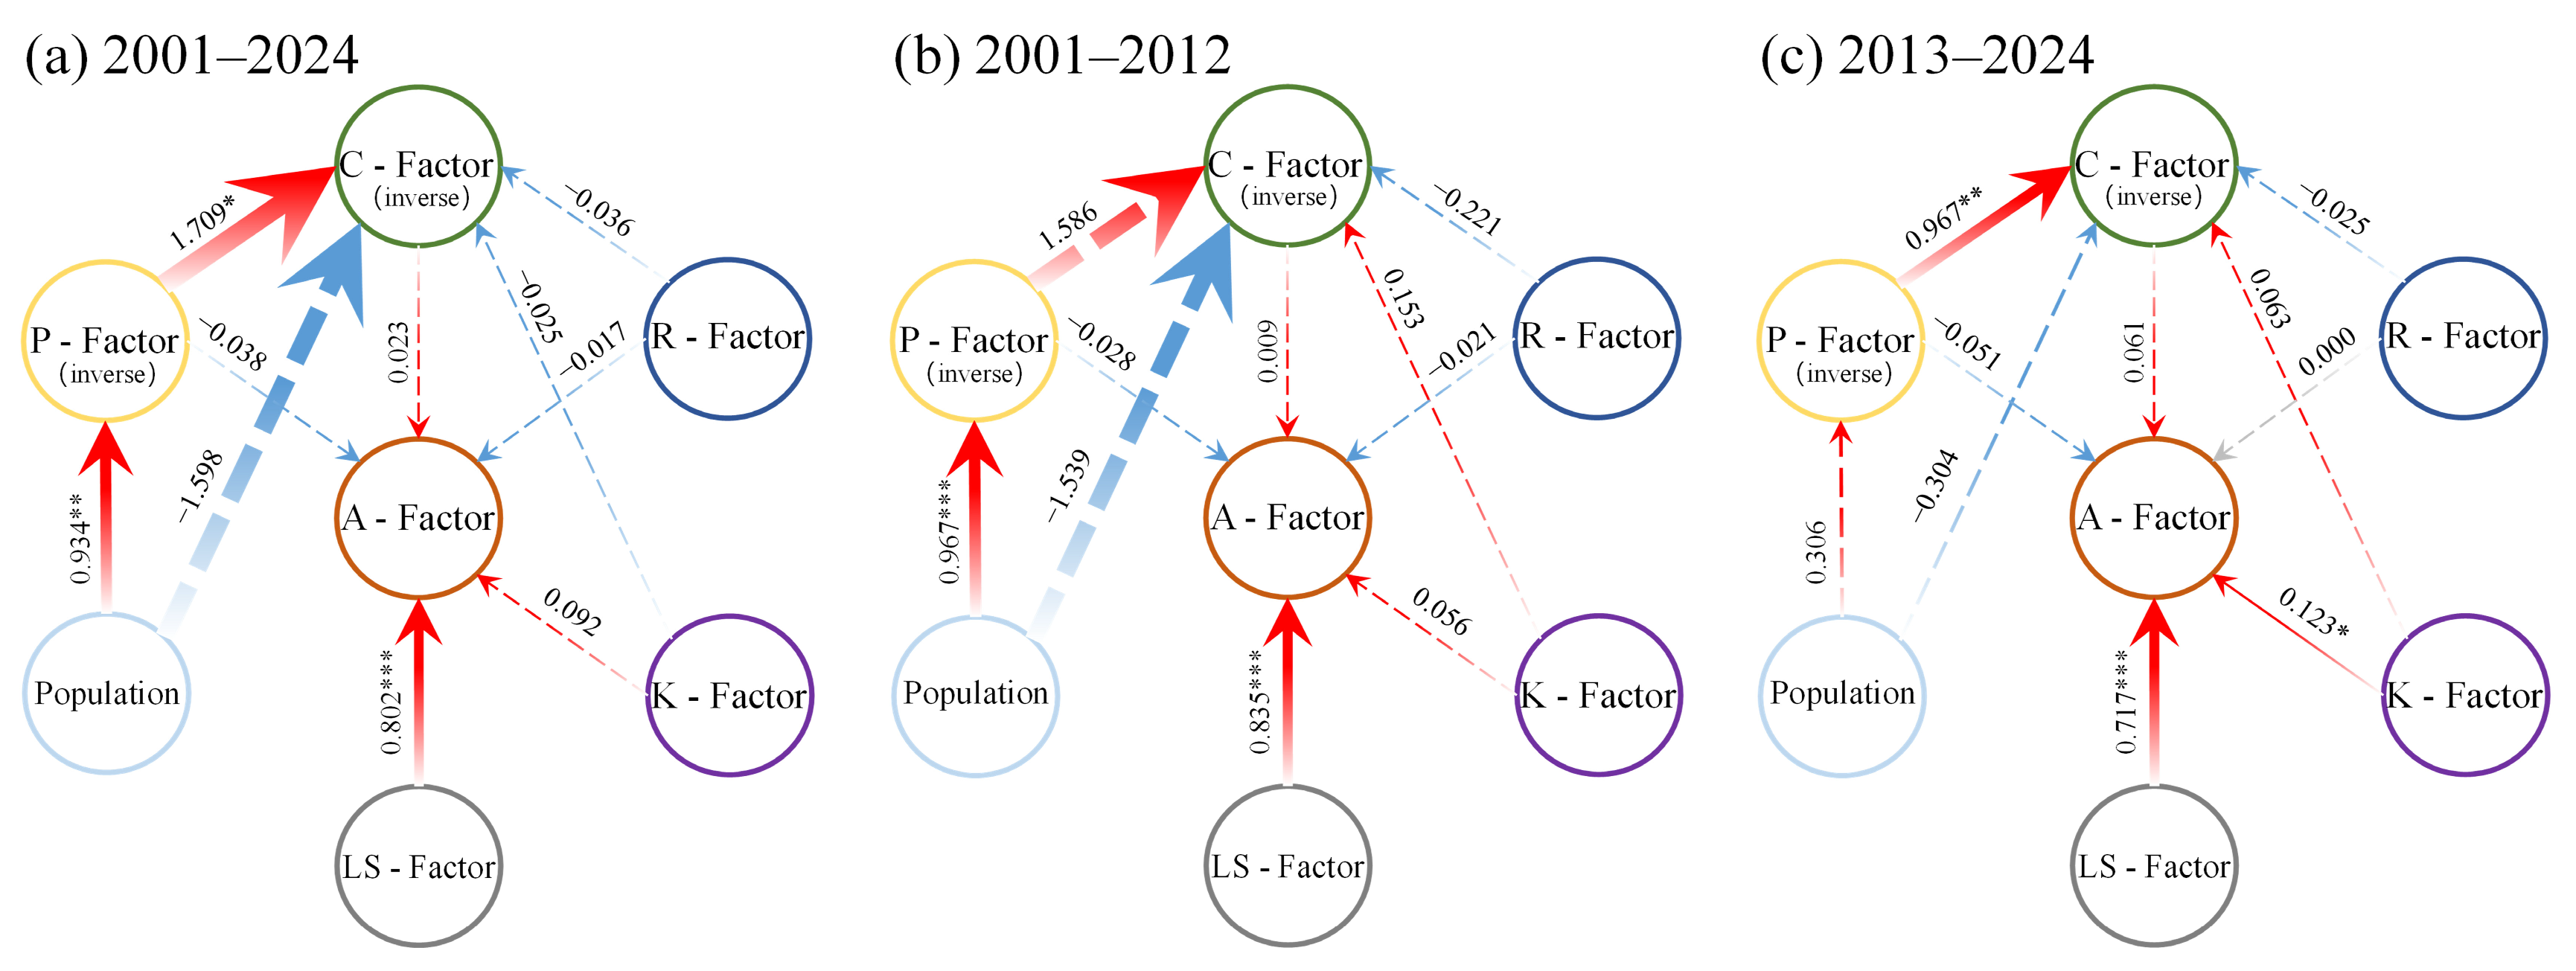
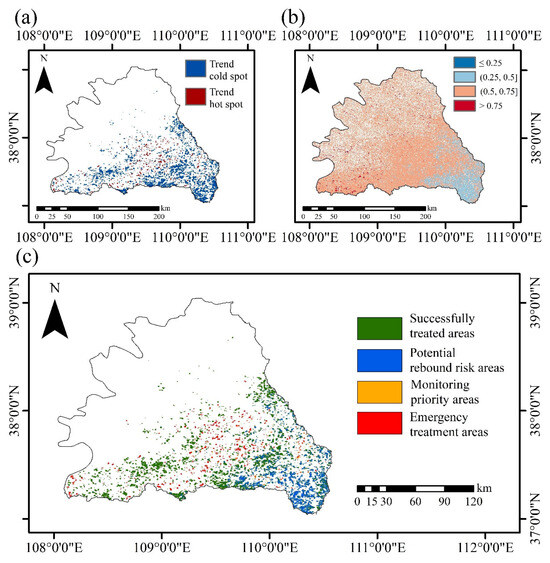
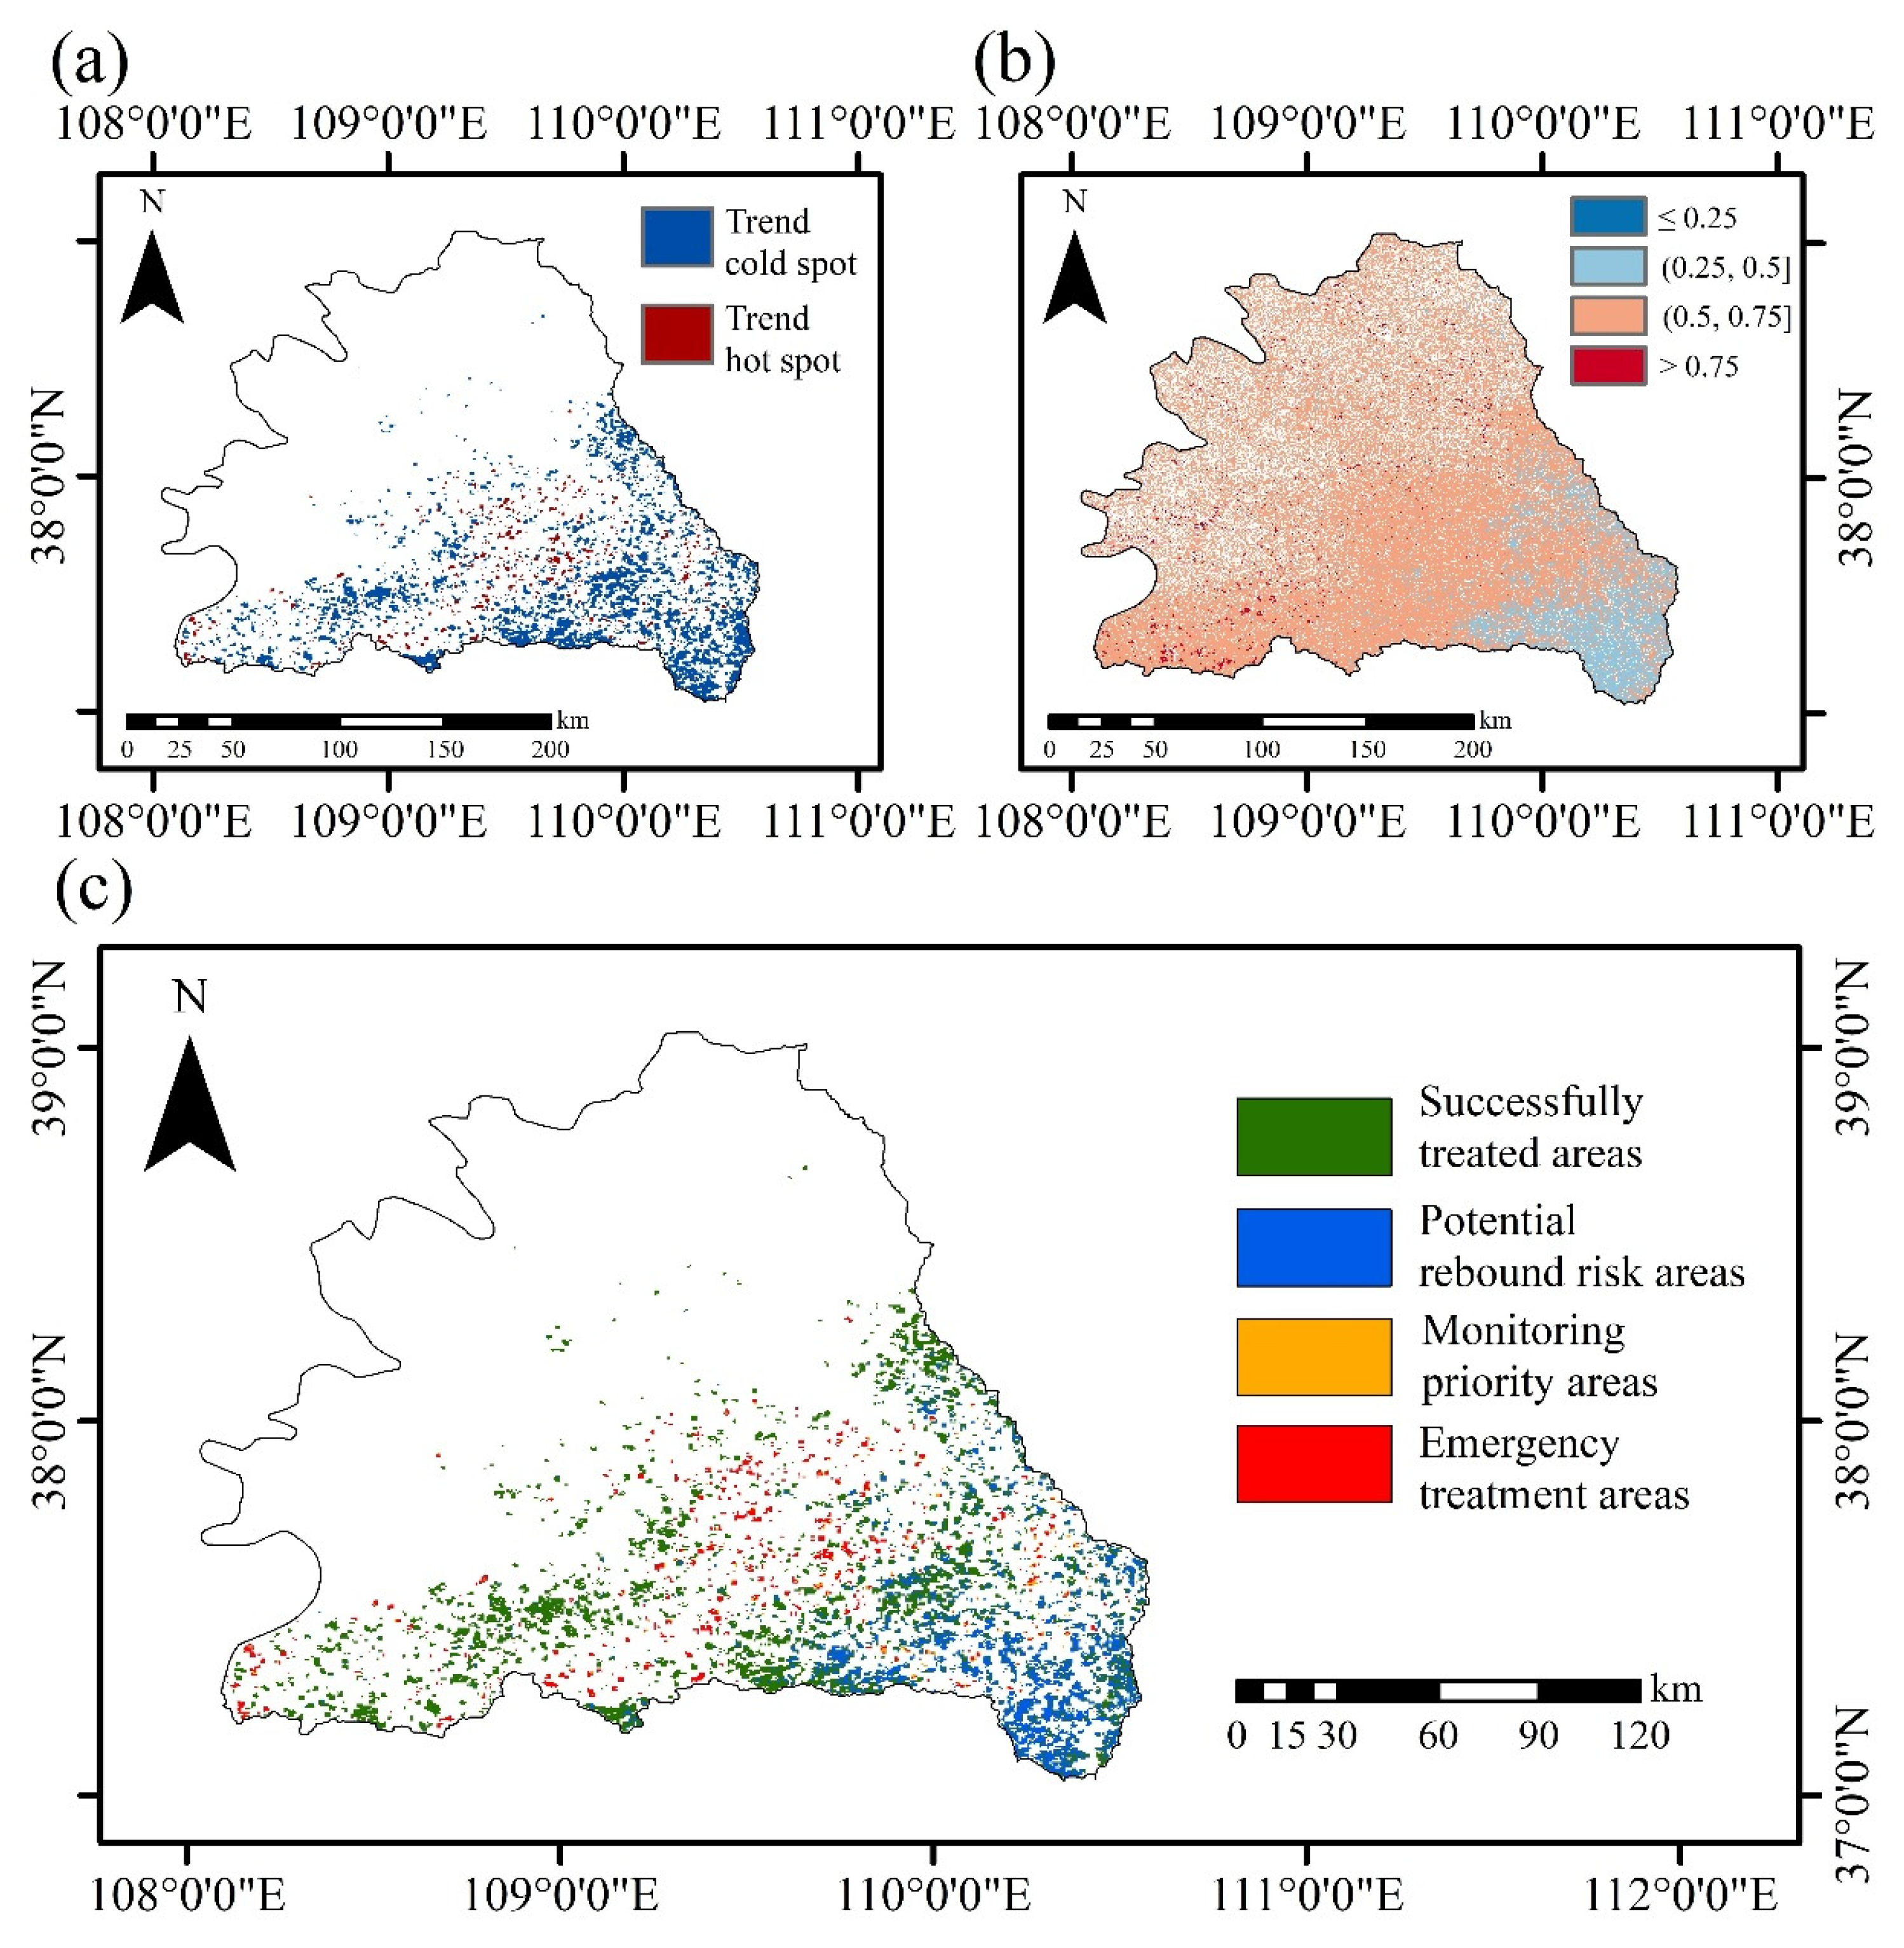

Disclaimer/Publisher’s Note: The statements, opinions and data contained in all publications are solely those of the individual author(s) and contributor(s) and not of MDPI and/or the editor(s). MDPI and/or the editor(s) disclaim responsibility for any injury to people or property resulting from any ideas, methods, instructions or products referred to in the content. |
© 2026 by the authors. Licensee MDPI, Basel, Switzerland. This article is an open access article distributed under the terms and conditions of the Creative Commons Attribution (CC BY) license.