


Highlights
What are the main findings?
- A time–frequency dual-branch feature fusion strategy based on the attention mechanism, integrating time-domain amplitude-phase features and frequency-domain physical constraint features, effectively improves the detection performance of weak radar targets.
- The phase difference feature in the time domain between targets and noise/interference exhibits stronger discriminability than the original phase feature, which facilitates weak target detection in the network.
What are the implications of the main findings?
- The proposed method significantly enhances weak target detection performance for early-warning radars in complex environments, which is equivalent to extending the effective detection range.
- The dual-branch time–frequency feature fusion framework has broad engineering application potential and provides a valuable reference for further research in radar target detection.
Abstract
Early-Warning Radar (EWR) is an advanced detection system capable of monitoring aerial targets over long distances with high precision, providing critical information support for defense security. However, EWR faces challenges such as a limited number of pulses, low coherent integration gain, small target Radar Cross Section (RCS), and complex clutter and electromagnetic interference environments. Conventional Constant False Alarm Rate (CFAR) detection algorithms struggle to effectively detect weak targets while maintaining an acceptable false alarm rate. To address these issues, this paper introduces a deep learning approach. A high target-clutter/interference/noise discriminative feature spectrum is obtained through phase difference transformation, upon which a dual-branch collaborative architecture network is constructed. In this architecture, the main network focuses on extracting spatiotemporal amplitude–phase characteristics, while the auxiliary branch implicitly mines the target’s physical boundary features from frequency-domain echoes. Through a self-attention mechanism, the features from both branches are semantically aligned and fused. This method significantly enhances the weak target detection capability of EWR under the constraint of a controlled false alarm rate. Test results show that under the false alarm rate ranging from to , the SNR gain of the proposed algorithm is about 2∼5 dB, which is equivalent to increasing the radar detection range by 10∼30%.
1. Introduction
Early-warning radar possesses ultra-long detection ranges and the capability for continuous, all-weather, all-time, and all-domain surveillance. Its superior search and tracking performance makes it an indispensable component of modern defense systems [1]. Typically operating in the VHF, UHF, and L-bands, early-warning radars are highly susceptible to interference from complex electromagnetic environments [2]. For cost considerations, the physical aperture of radar arrays is generally limited to several meters to a few tens of meters, resulting in relatively wide beamwidths. Consequently, the received ground and sea clutter energy is substantial, and when the target radar cross section (RCS) is small, the distinction between target echoes and the noise floor becomes marginal [3]. Furthermore, early-warning radar must achieve detection ranges of several hundred to even over a thousand kilometers, with full-domain coverage requirements. Corresponding transmitted waveforms therefore exhibit long pulse widths, short dwell times, and limited pulse repetition cycles [4], which restrict the ability to enhance the signal-to-noise ratio (SNR) of targets through long-duration coherent integration. In recent years, the question of how to improve the weak target detection capability of early-warning radars without altering their fundamental architecture or hardware configuration has attracted significant attention within the radar research community [5]. Based on the radar equation, every 3 dB increase in SNR enabled by the algorithm can boost radar detection range by 18.8% [3], and reduce the cost of the front-end hardware by approximately 20% to 40%, thus demonstrating enormous research significance.
Target detection in radar systems is fundamentally a statistical decision problem, in which the presence or absence of a target is inferred based on the prior statistical properties of received echoes. A representative solution is the Constant False Alarm Rate (CFAR) detection algorithm [6], which dynamically adjusts the detection threshold according to variations in background noise under different environmental conditions. This allows CFAR to maximize detection probability while maintaining a constant false alarm rate. To accommodate diverse background environments, numerous refinements of CFAR have been proposed. Depending on the method used to estimate noise power, CFAR can be classified into three principal categories: Cell Averaging CFAR (CA-CFAR) [7], Order Statistics CFAR (OS-CFAR) [8], and Greatest-of/Smallest-of CFAR (GO/SO-CFAR) [9]. Nevertheless, due to their intrinsic properties, CFAR algorithms struggle to simultaneously achieve high detection probability and low false alarm rates in scenarios involving weak targets and complex backgrounds. To address these limitations, researchers have sought to combine CFAR with complementary methods to improve detection accuracy and robustness. For example, Yang et al. [10] integrated CFAR with time–frequency analysis, extracting target ridges in the time–frequency domain to mitigate CFAR’s poor performance in detecting weak and non-stationary targets. Lu et al. [11] introduced principal component analysis (PCA) into radar target detection, employing PCA to emphasize weak targets in the echo spectrum, while wavelet transforms were used to suppress clutter interference, and CFAR was subsequently applied to the reconstructed range–Doppler (RD) spectrum. However, these approaches often improve detection probability at the cost of increased false alarms. In early-warning radar applications, where stringent false alarm constraints are critical, such methods face significant limitations in generalization.
In addition, Track-Before-Detect (TBD) techniques [12,13,14] have been widely applied to target detection. The core idea is to accumulate energy across multiple consecutive frames on the basis of single-frame coherent integration, thereby enhancing the target SNR and improving the detection capability for weak targets. Representative algorithms include the Bayesian approach [15,16], dynamic programming [17,18], and particle filtering [19,20]. However, the performance of TBD algorithms benefits proportionally from the number of frames accumulated. In early-warning radar systems, which demand high real-time performance, TBD algorithms impose stringent requirements on both computational power and memory capacity.
In recent years, with the rapid development of deep learning, data-driven approaches to target detection have become a major research focus [21]. Radar echo data contain abundant feature information, which can be represented in multiple forms through signal processing techniques such as the Fourier transform and time–frequency transform. Examples include the range–time spectrum [22], RD spectrum [23,24], and time–frequency spectrum [25]. In these spectrograms, targets exhibit clear distinctions from noise, providing strong support for the application of deep learning to radar target detection.
According to the differences in input features, deep learning–based target detection methods can be broadly categorized into two types:
- Target detection based on one-dimensional sequential signals. Liu et al. [26] employed both time-domain and frequency-domain spectral amplitudes as input data and designed a classification model using the LeNet convolutional neural network to distinguish between noise and clutter. In addition, Ball et al. [27], inspired by the CFAR processing framework, concatenated the cell under test with reference cells into a vector, which was then fed into an SVM classifier for target detection. This method demonstrated superior performance compared with conventional CFAR algorithms under low SNR conditions. Jiang et al. [28] constructed a radar echo cube by combining one-dimensional discrete echo sequences in the time and frequency domains as feature inputs to the network, and utilized Convolutional Neural Networks (CNNs) for both target detection and parameter estimation (including range, radial velocity, azimuth, and elevation). Comparative experiments confirmed that the proposed algorithm outperformed conventional detection and parameter estimation methods. Nevertheless, the features available in one-dimensional sequential signals remain limited. Most approaches rely primarily on amplitude for target detection, and when the target echo is weak, its amplitude features resemble noise, leaving detection performance in need of further improvement.
- Target detection based on two-dimensional radar images. Xie et al. [29] employed a CNN to perform target detection on RD spectra. Experimental results demonstrated that under clutter conditions, the network maintained a false alarm rate comparable to that of CFAR while detecting more true targets. Jia et al. [30] extracted the temporal characteristics of RD spectra using a convolutional LSTM network and integrated these features with the YOLOv8 framework to accomplish target detection. In addition, a channel attention mechanism was introduced to enhance the network’s ability to detect weak targets. Huang et al. [25] combined serpentine convolution with the YOLOv5s algorithm to detect time–frequency ridges obtained after time–frequency transformation, with both simulation and measured data demonstrating improved detection rates for weak targets. Zhang et al. [31] introduced a Peak Convolution (PeakConv) method, enabling the network to adaptively learn background clutter characteristics and thereby enhance the distinction between targets and the noise floor for weak target detection. This method has already been validated on publicly available radar datasets. However, most of the aforementioned approaches primarily focus on amplitude features of targets and noise in two-dimensional radar echo spectra, while neglecting the distinctive phase differences between targets and noise.
In addition, joint representation of multi-domain features [32,33] has become a research hotspot in the field of radar applications. Numerous studies have demonstrated that multi-dimensional feature fusion [34], spatial alignment and constraint learning can effectively improve the accuracy of radar target detection [35] and classification [36], and possess great potential for widespread engineering applications.
In early-warning radar target detection scenarios, the limited number of radar echo pulses and insufficient amplitude stability between pulses make it difficult to effectively improve weak target detection performance by relying solely on time-domain features. At the same time, restricted velocity resolution of target echoes and strong clutter interference prevent frequency-domain features alone from sustaining a low false alarm rate. In summary, the development of weak target detection methods that can integrate multidimensional features and remain compatible with the operating characteristics of early-warning radar requires further investigation. To address these challenges, this paper proposes a dual-branch collaborative network tailored to pulse-based early-warning radar echo data.
The main contributions of this paper are summarized as follows:
- A weak target feature enhancement method based on phase difference is proposed. The phase difference operation improves the separability between weak targets and clutter. Both theoretical analysis and experimental results validate this conclusion.
- An attention mechanism is adopted to fuse temporal features and frequency-domain physical constraint features, so as to improve the weak target detection rate of EWR under complex backgrounds.
2. Target Detection Method
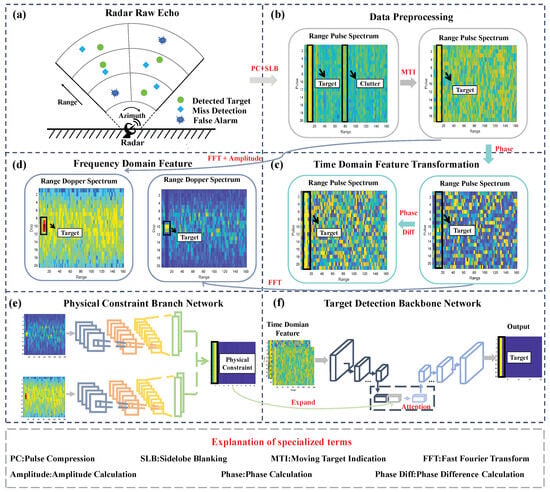
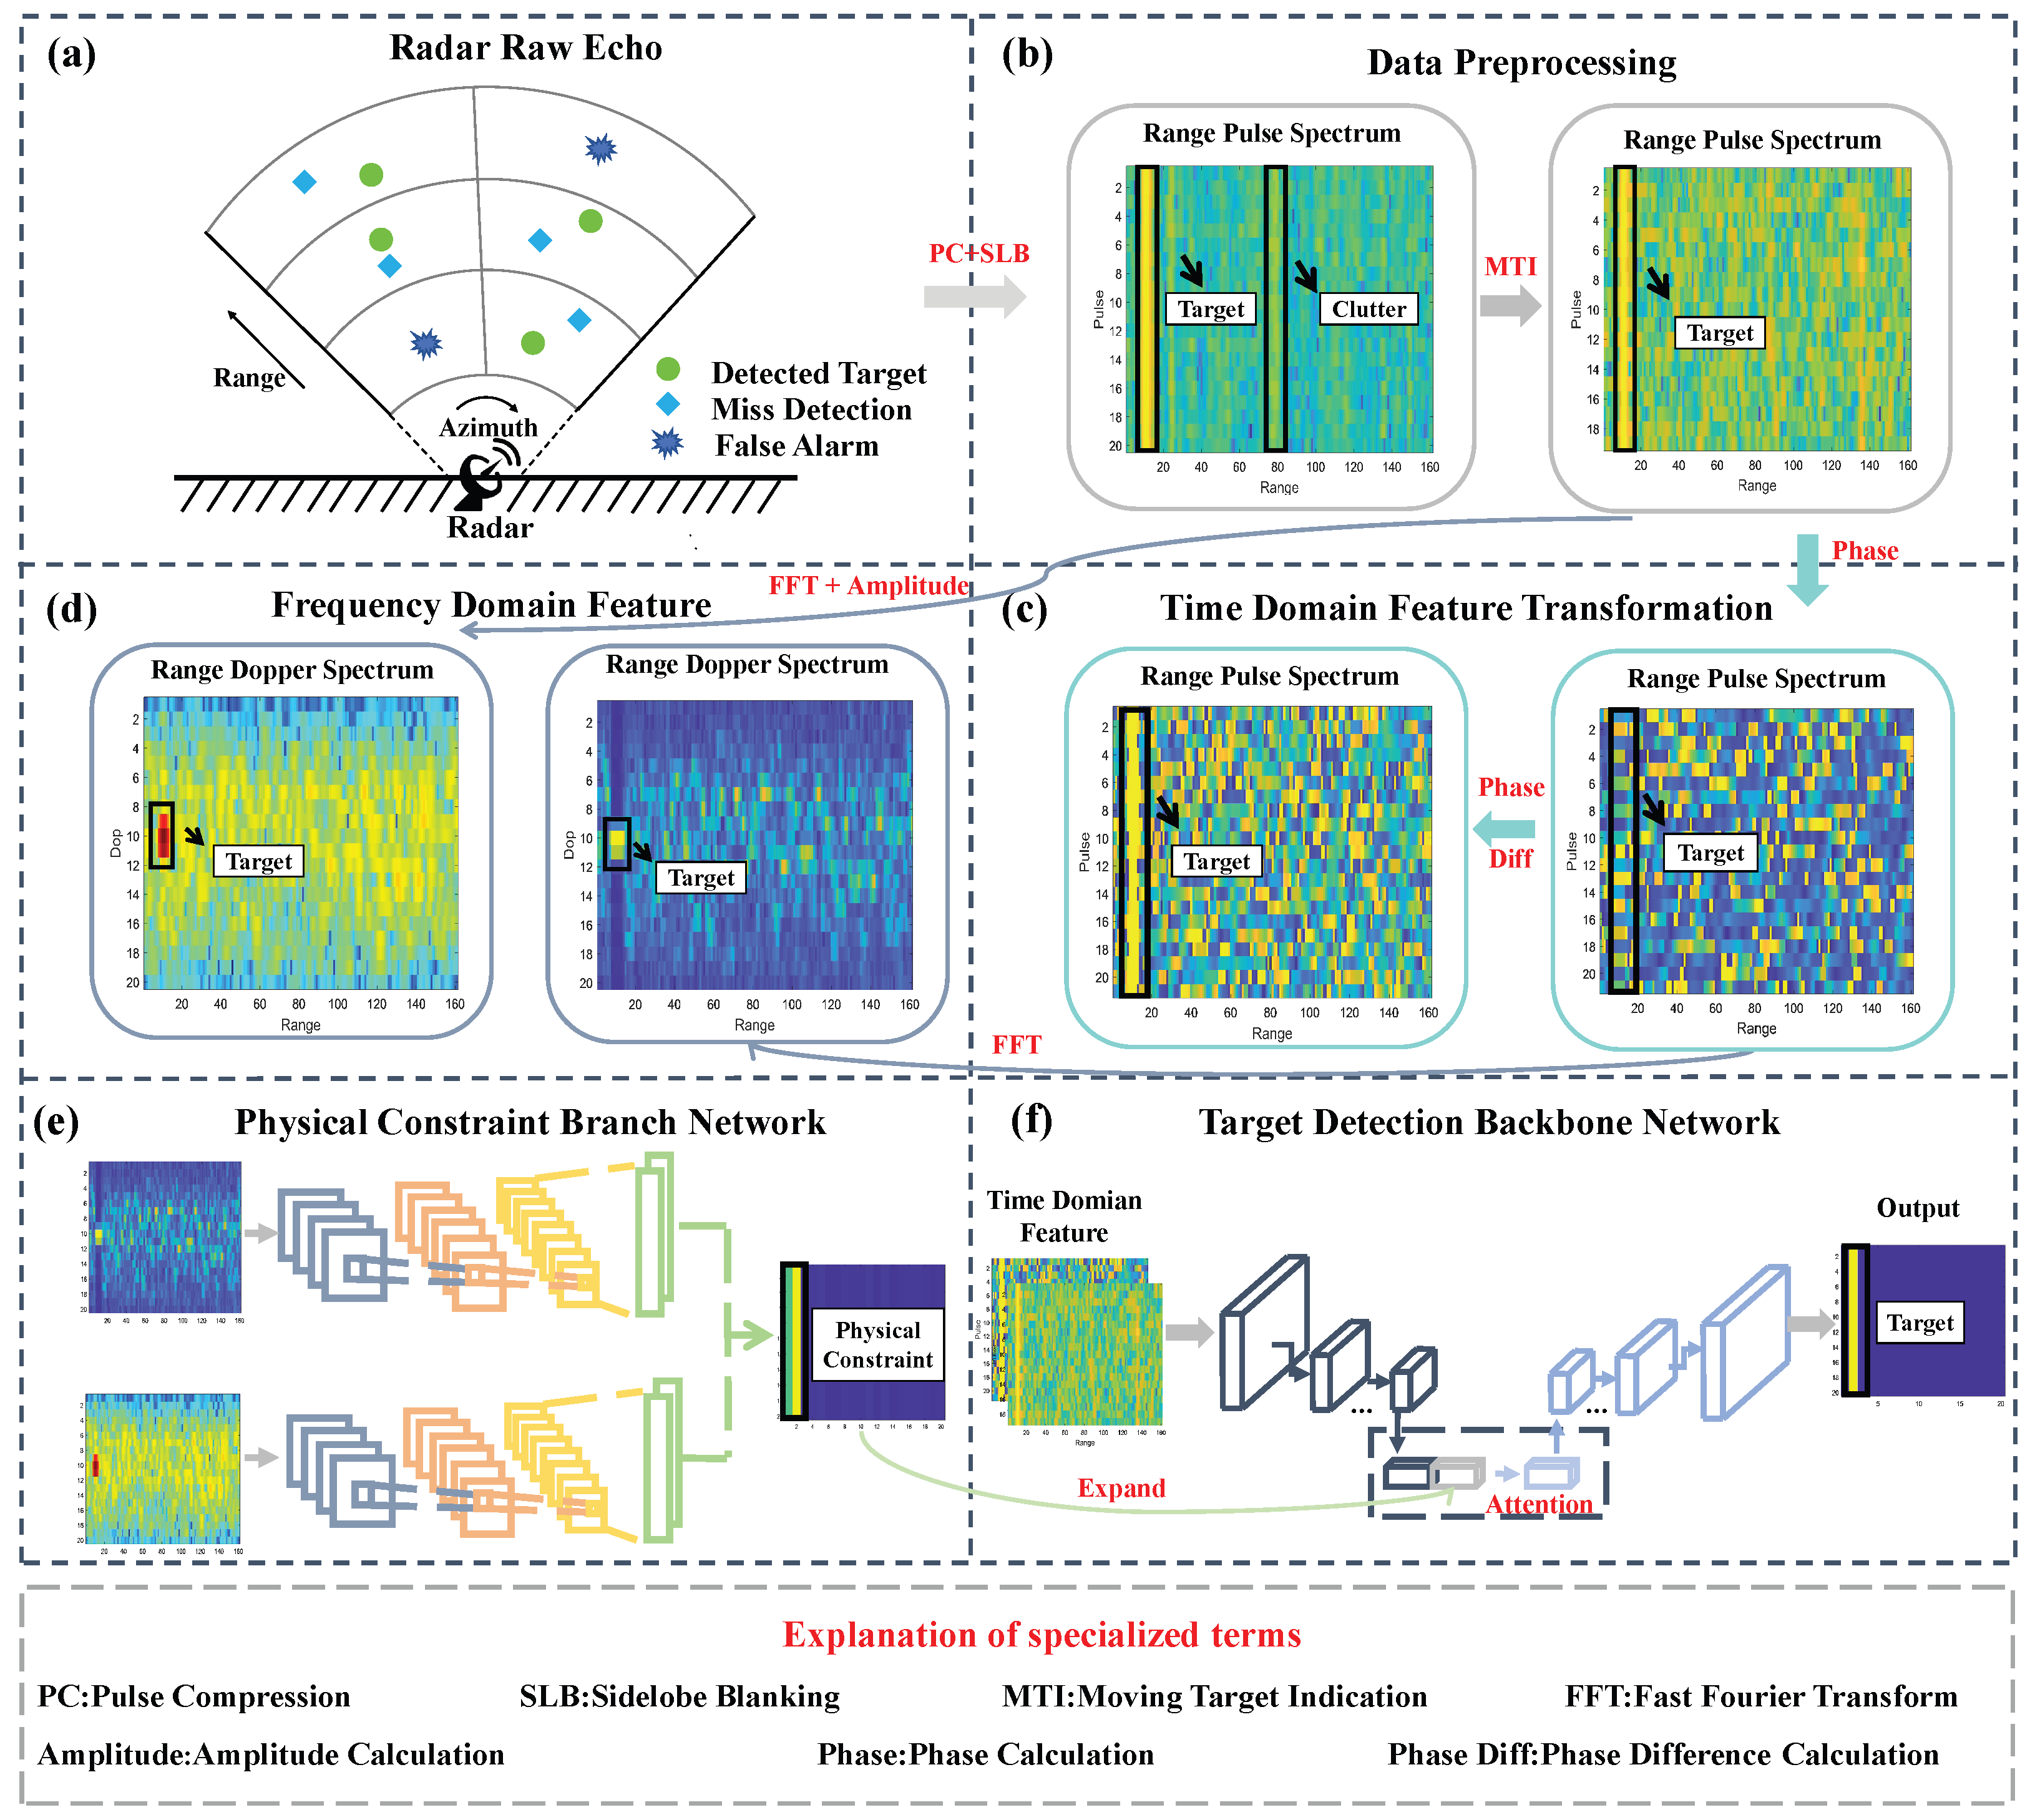
This paper systematically presents the overall implementation framework and core process logic of the research through a technical roadmap (Figure 1), clarifying the full-link design from the initiation of the research to the output of results. Building upon an understanding of radar target detection scenarios, this paper proposes a weak target detection method that integrates frequency-domain physical boundary constraints with time-domain features. First, the raw radar echoes are preprocessed to obtain range–pulse complex spectra after beamforming, pulse compression, and clutter/interference suppression. In the subsequent feature transformation stage, the complex spectra are converted into their equivalent amplitude and phase spectra, and the phase spectrum is further processed through phase-difference operations to enhance the contrast between targets and clutter/interference/noise. Next, a target detection main network is constructed based on the Res_UNet framework to deeply exploit the high-dimensional statistical characteristics of targets contained in the amplitude and phase-difference spectra in the time domain. In parallel, a frequency-domain physical feature extraction network (auxiliary branch) is designed to learn the frequency-domain representations of the original echoes after Fourier transformation and to extract the physical boundary information distinguishing targets from clutter, interference, and noise. It is noteworthy that at the bottleneck layer of Res_UNet, the high-dimensional features extracted by the main detection network are fused with the target boundary features learned by the branch network through an attention mechanism. This design injects physical interpretability into the data-driven model and systematically enhances the network’s ability to represent weak target features.
Figure 1.
Target detection technology roadmap based on the proposed algorithm.
It should be noted that the method proposed in this paper is based on time-domain feature fitting and frequency-domain physical constraint extraction, which is not only applicable to the EWR system but also can be directly transferred and generalized to radars in other scenarios with the same characteristics. Furthermore, the basic idea of combining physical features with time–frequency analysis can be adapted to other modalities (e.g., SAR, infrared).
2.1. Data Preprocessing
The raw echoes received by early-warning radar often contain interference and clutter, while the target energy is extremely weak and cannot be directly used for target detection. Therefore, signal preprocessing is required, which primarily includes the following steps: beamforming, pulse compression, interference suppression, and clutter suppression.
Digital Beamforming (DBF) is primarily employed to spatially combine the energy of individual array elements, thereby enhancing the SNR of target echoes. Pulse Compression (PC) is used to resolve the contradiction between detection range and range resolution while accumulating target energy along the temporal dimension. Interference suppression mainly includes algorithms such as narrow-pulse excision, Sidelobe Blanking (SLB), and Sidelobe Cancellation (SLC), which serve to remove or mitigate various types of interference in the echoes and highlight the target. All input data used by the network have undergone processing steps including DBF, PC, SLB and SLC.
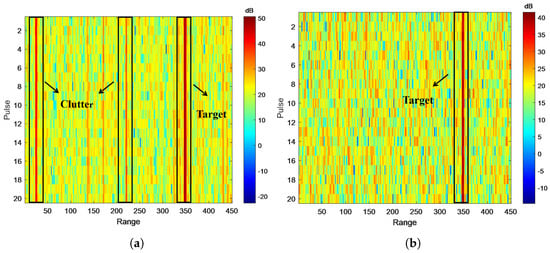
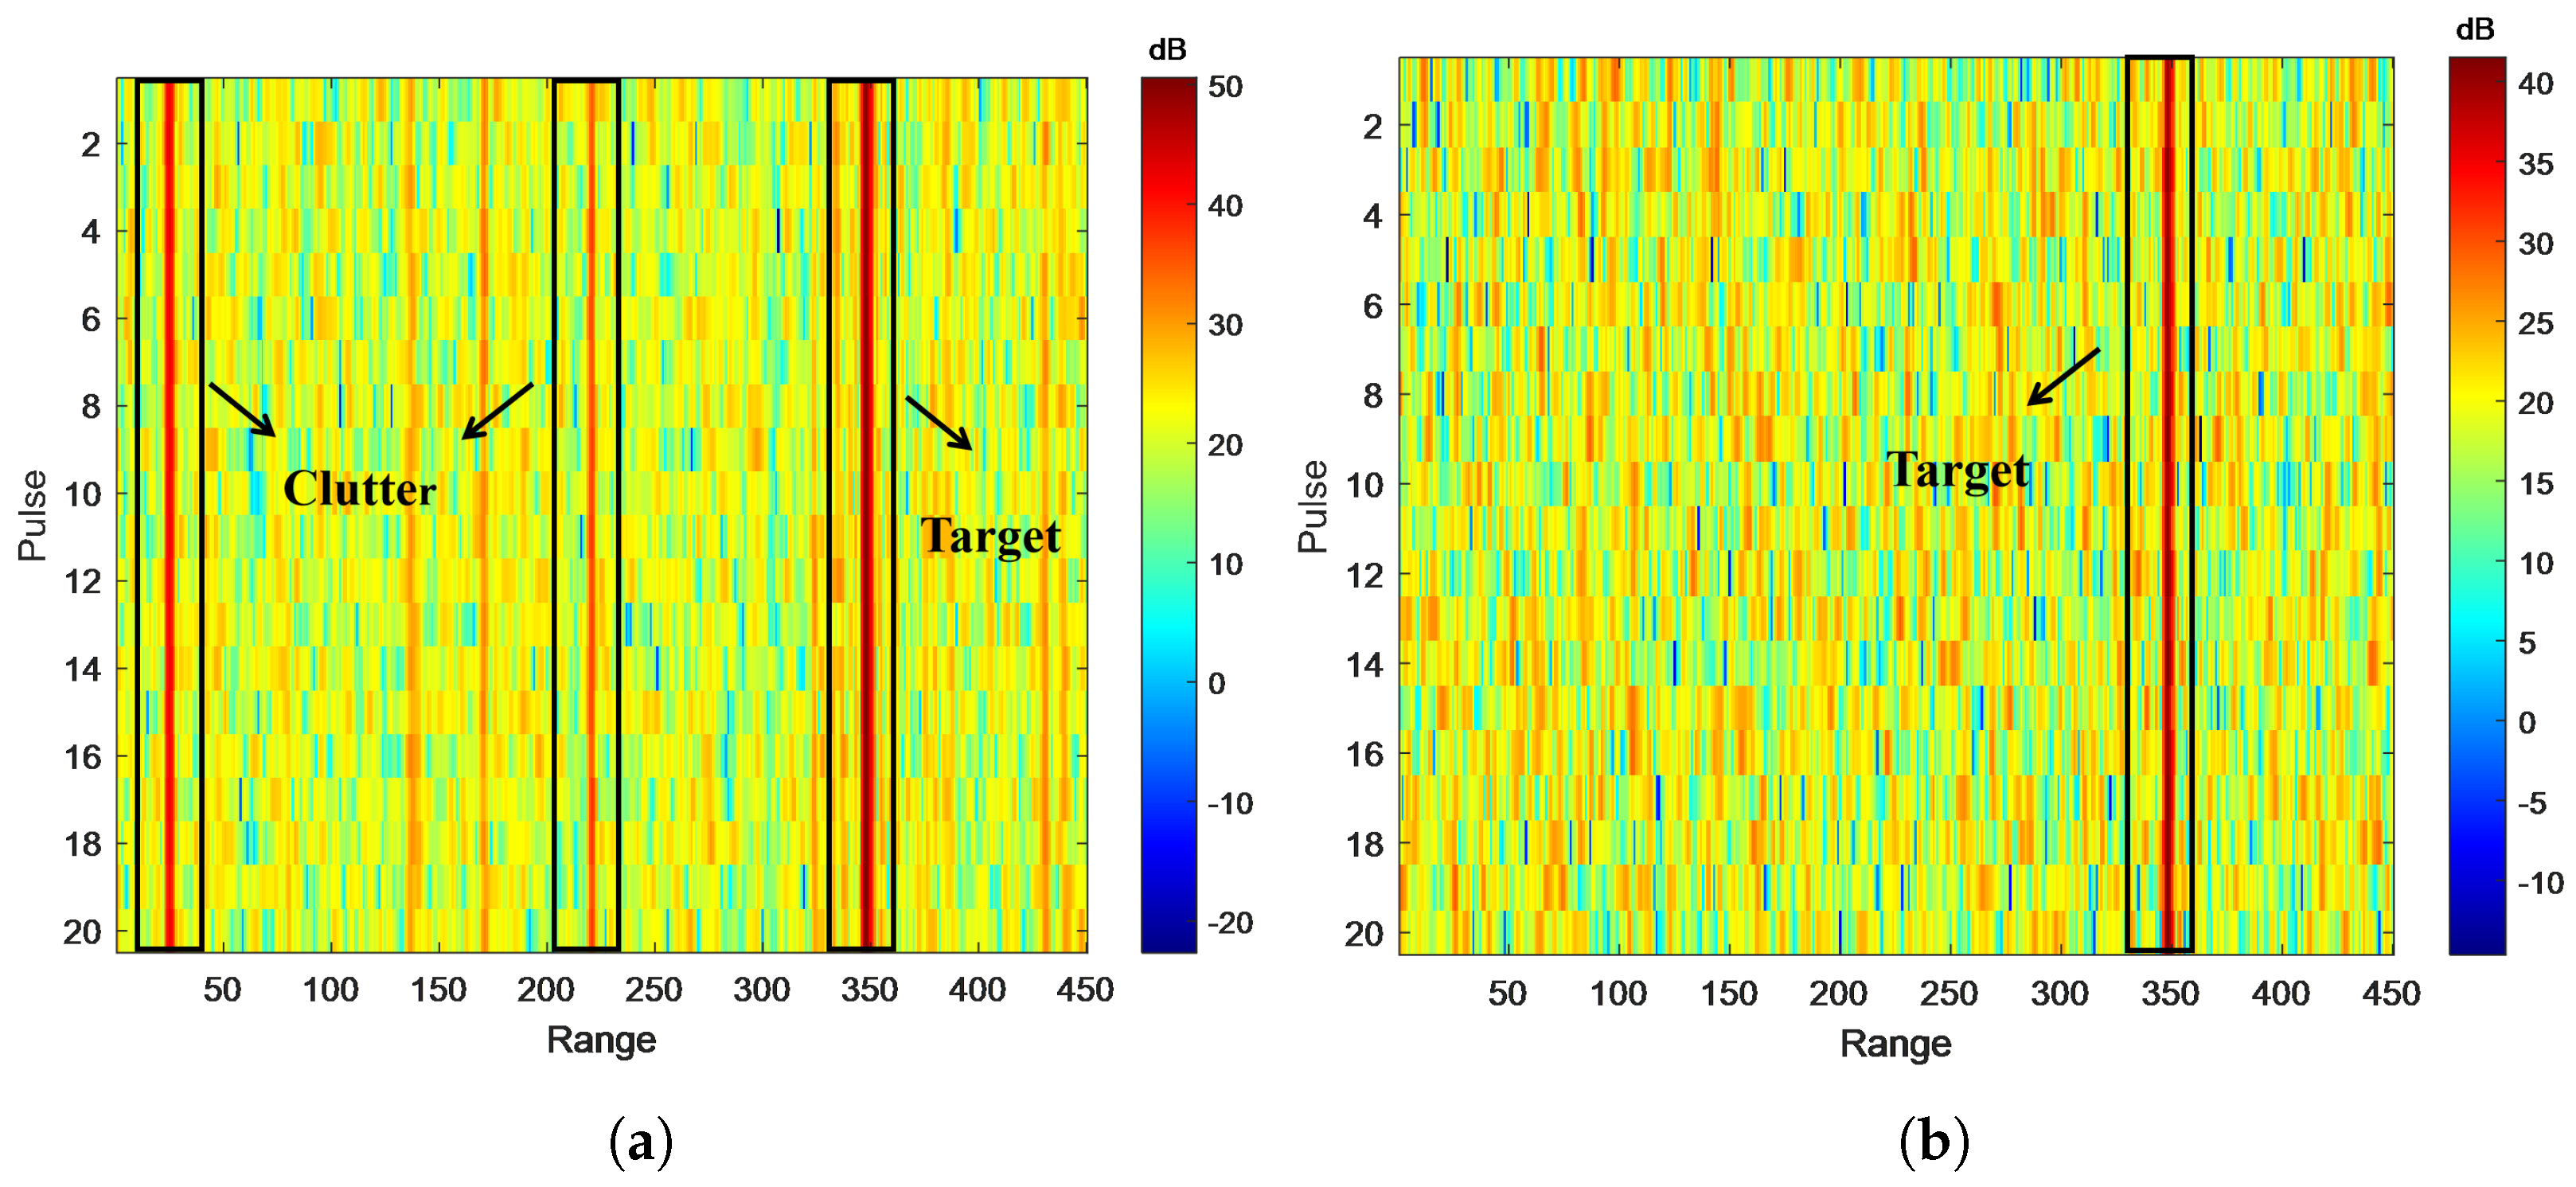
This study focuses on an early-warning radar system based on the coherent pulse radar system, and selects the range pulse spectrum as the feature input of the model. Target echoes exhibit nearly fixed ranges across pulses, relatively stable amplitudes, and strictly coherent phases, whereas the amplitudes and phases of interference and noise vary randomly, showing clear differences from the target. However, ground and sea clutter display characteristics in the range–pulse spectrum that closely resemble those of targets, and thus effective suppression typically requires Doppler filtering along the velocity dimension. In the preprocessing stage, this paper applies a Moving Target Indication (MTI) algorithm to remove stationary clutter from the range–pulse spectrum; the processing effect is shown in Figure 2. By comparing Figure 2a with Figure 2b, it can be seen that the target echo is well preserved and the static clutter is significantly suppressed.
Figure 2.
MTI comparison. (a) Echo before MTI, (b) echo after MTI.
2.2. Feature Transformation
For early-warning radars operating under a coherent pulse regime, the phases across different pulses are strictly coherent and exhibit strong linear characteristics. It is important to highlight that the degree of linearity in the target’s original phase is highly dependent on the SNR of the echoes. When the target SNR decreases and the number of pulses is limited, noise can disrupt the linear phase structure, thereby reducing the separability between the target phase and pure noise. This feature degradation directly affects the quality of the inputs provided to deep learning networks, hindering their ability to extract high-dimensional features of weak targets and ultimately constraining their detection performance.
Therefore, this paper introduces a phase-difference method for feature transformation, with the aim of mitigating the degradation of weak target phase features and improving the generalization capability of the network. Suppose the transmitted signal of a radar operating under a linear frequency-modulated continuous-wave (LFMCW) scheme is given by
Here, denotes the starting frequency, k is the slope of the frequency-modulated continuous wave, and T represents the pulse repetition interval. The received echo signal exhibits a time delay relative to the transmitted signal, which can be expressed as
Pulse-based radar primarily removes the carrier frequency and retains the intermediate frequency component by mixing the received signal with the transmitted signal, followed by low-pass filtering [37]. The intermediate frequency signal of the n-th pulse can be expressed as
Here, denotes the initial range of the target, represents the corresponding time, and is the radial component of the target’s velocity. From the above expression, the phase of the target corresponding to the n-th pulse can be written as
Since the target’s range and radial velocity remain essentially stable across different pulses within a single dwell, the phase between pulses depends only on the pulse index n. As the number of pulses increases, the phase should exhibit a linear structure and vary periodically within the interval .
The phase difference between adjacent pulses can be expressed as
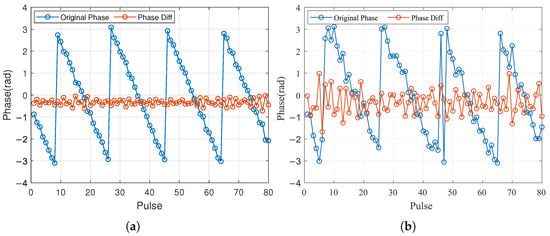
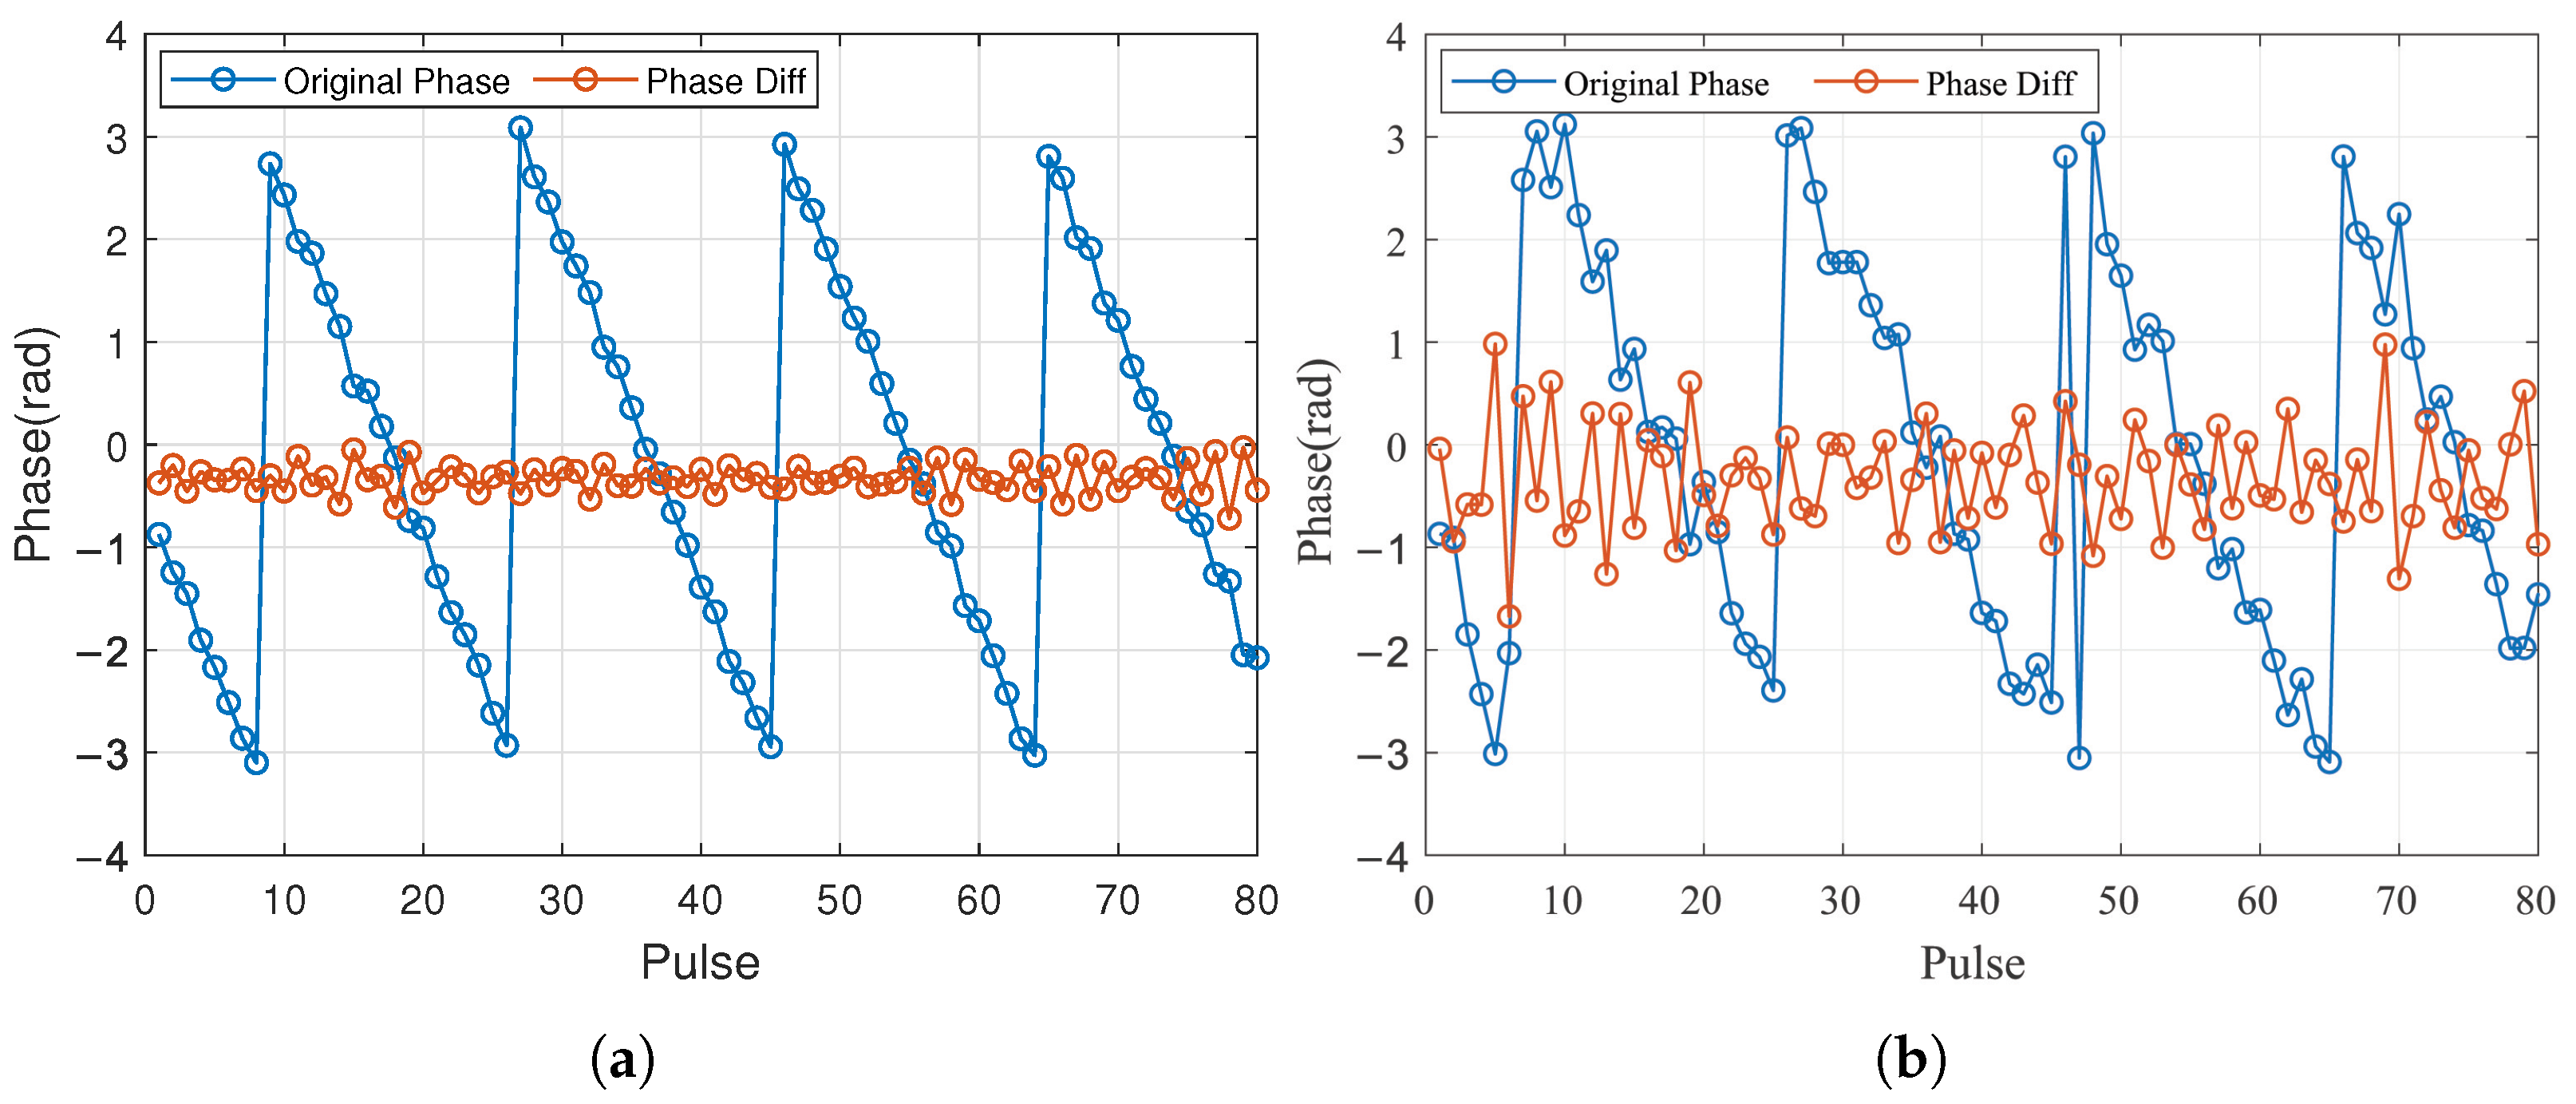
When the target SNR is high, can be regarded as a constant value. As the target SNR decreases, fluctuates around this constant. Figure 3 presents a comparison between the raw phase and the phase difference under different SNR conditions. As shown, when the target SNR is high, the raw phase exhibits strong linearity, and the phase difference remains nearly constant near a fixed value, with both features being clearly distinguishable. When the target SNR is low, the linearity of the raw phase is disrupted, phase perturbations increase, and regularity across pulses weakens. In contrast, the phase difference remains stable near a fixed value and continues to demonstrate strong separability.
Figure 3.
Compare original phase and phase diff. (a) High SNR, (b) low SNR.
Moreover, as illustrated in Figure 3, early-warning radar typically receives only 5∼10 pulses. Such a small number of pulses is insufficient to cover the periodicity of the raw phase. In noisy conditions, periodic phase jumps further obscure the phase characteristics of target echoes. The phase-difference feature, however, effectively mitigates this issue.
In summary, compared with the raw phase spectrum, the phase spectrum obtained after phase-difference processing exhibits stronger feature contrast between targets and clutter/interference/noise, greater stability, and improved suitability for enabling the network to extract high-dimensional target features. Therefore, in this work, all input raw phase features are subjected to phase-difference processing.
2.3. Target Detection (Physical Constraint Branch Network)
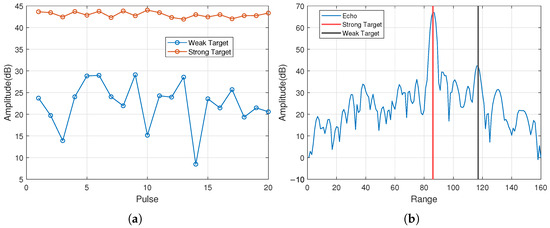
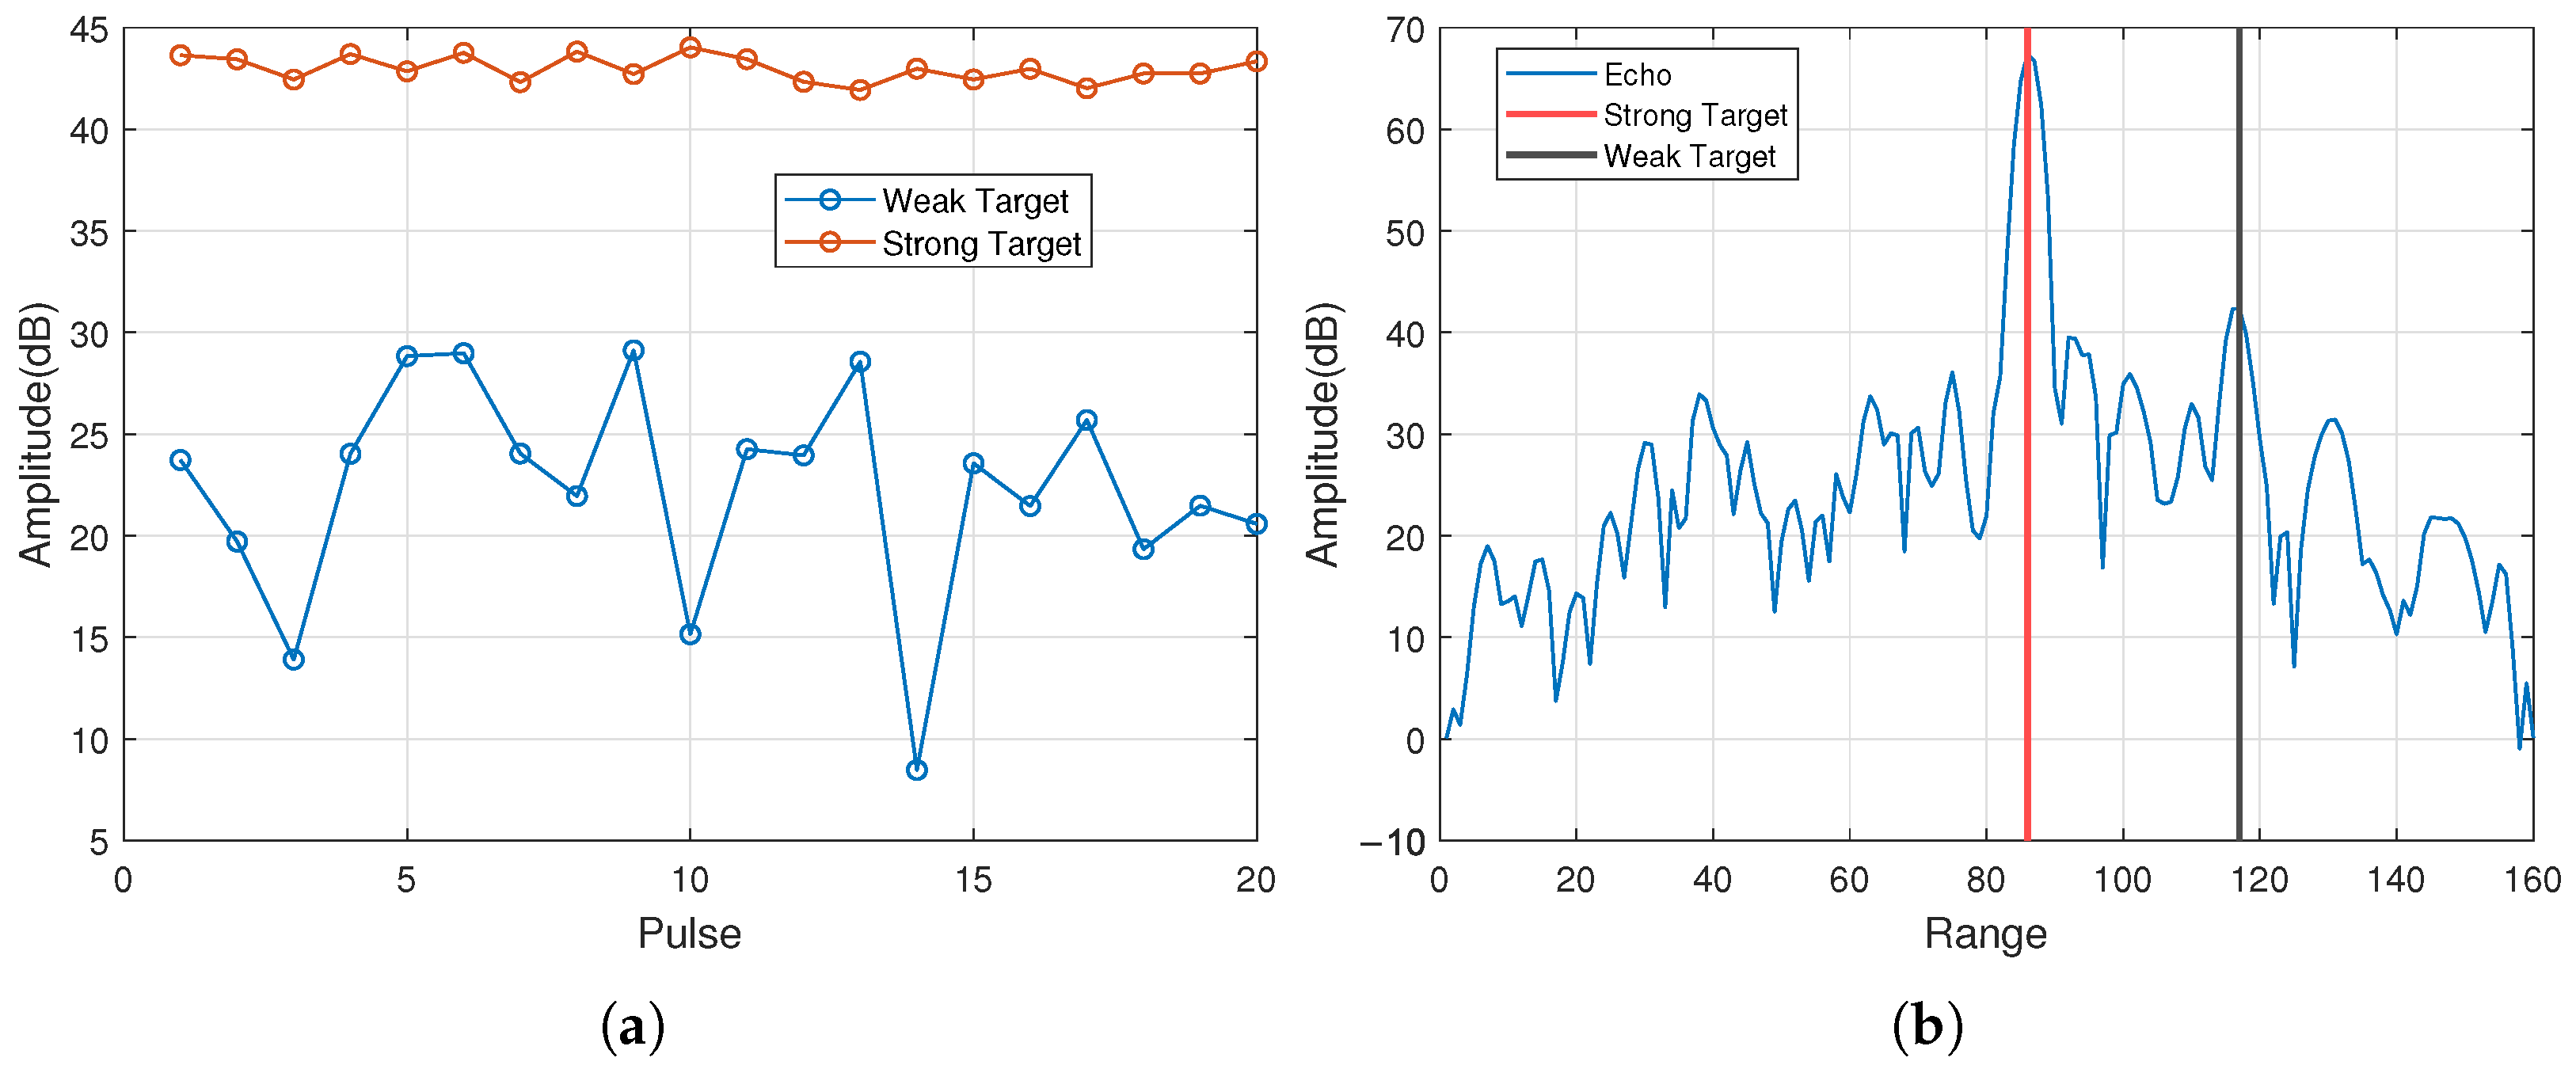
As mentioned above, the amplitude and phase difference information in the range–pulse spectrum dimension are adopted as the input features of the network. Nevertheless, an analysis of the echo spectrum of typical weak targets reveals that, as shown in Figure 4a, weak targets suffer from inter-pulse amplitude fluctuation with a dynamic range up to 20 dB. In this case, the target signal is completely submerged by noise in several pulses, which reduces the correlation among pulses and further leads to severe missed detection in the network. To tackle this issue, conventional methods perform FFT along the pulse dimension to realize multi-pulse energy accumulation. The accumulated result is presented in Figure 4b, where the energy of weak targets is significantly enhanced above the noise floor. This method effectively mitigates the problem of inter-pulse echo amplitude fluctuation. Inspired by the above mechanism, this paper designs an independent branch network to extract frequency-domain features after FFT coherent integration. Such features are integrated into the target detection network as physically constrained guidance information, so as to substantially improve the detection performance for weak targets.
Figure 4.
Contrast analysis on time-domain and frequency-domain characteristics of strong and weak targets. (a) Time-domain, (b) frequency-domain.
Specifically, this paper performs an FFT on the echo signals after pulse compression along the pulse dimension to obtain the range–Doppler amplitude spectrum and phase spectrum and serve as inputs to the branch network, respectively.
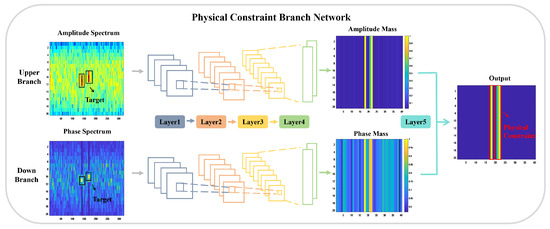
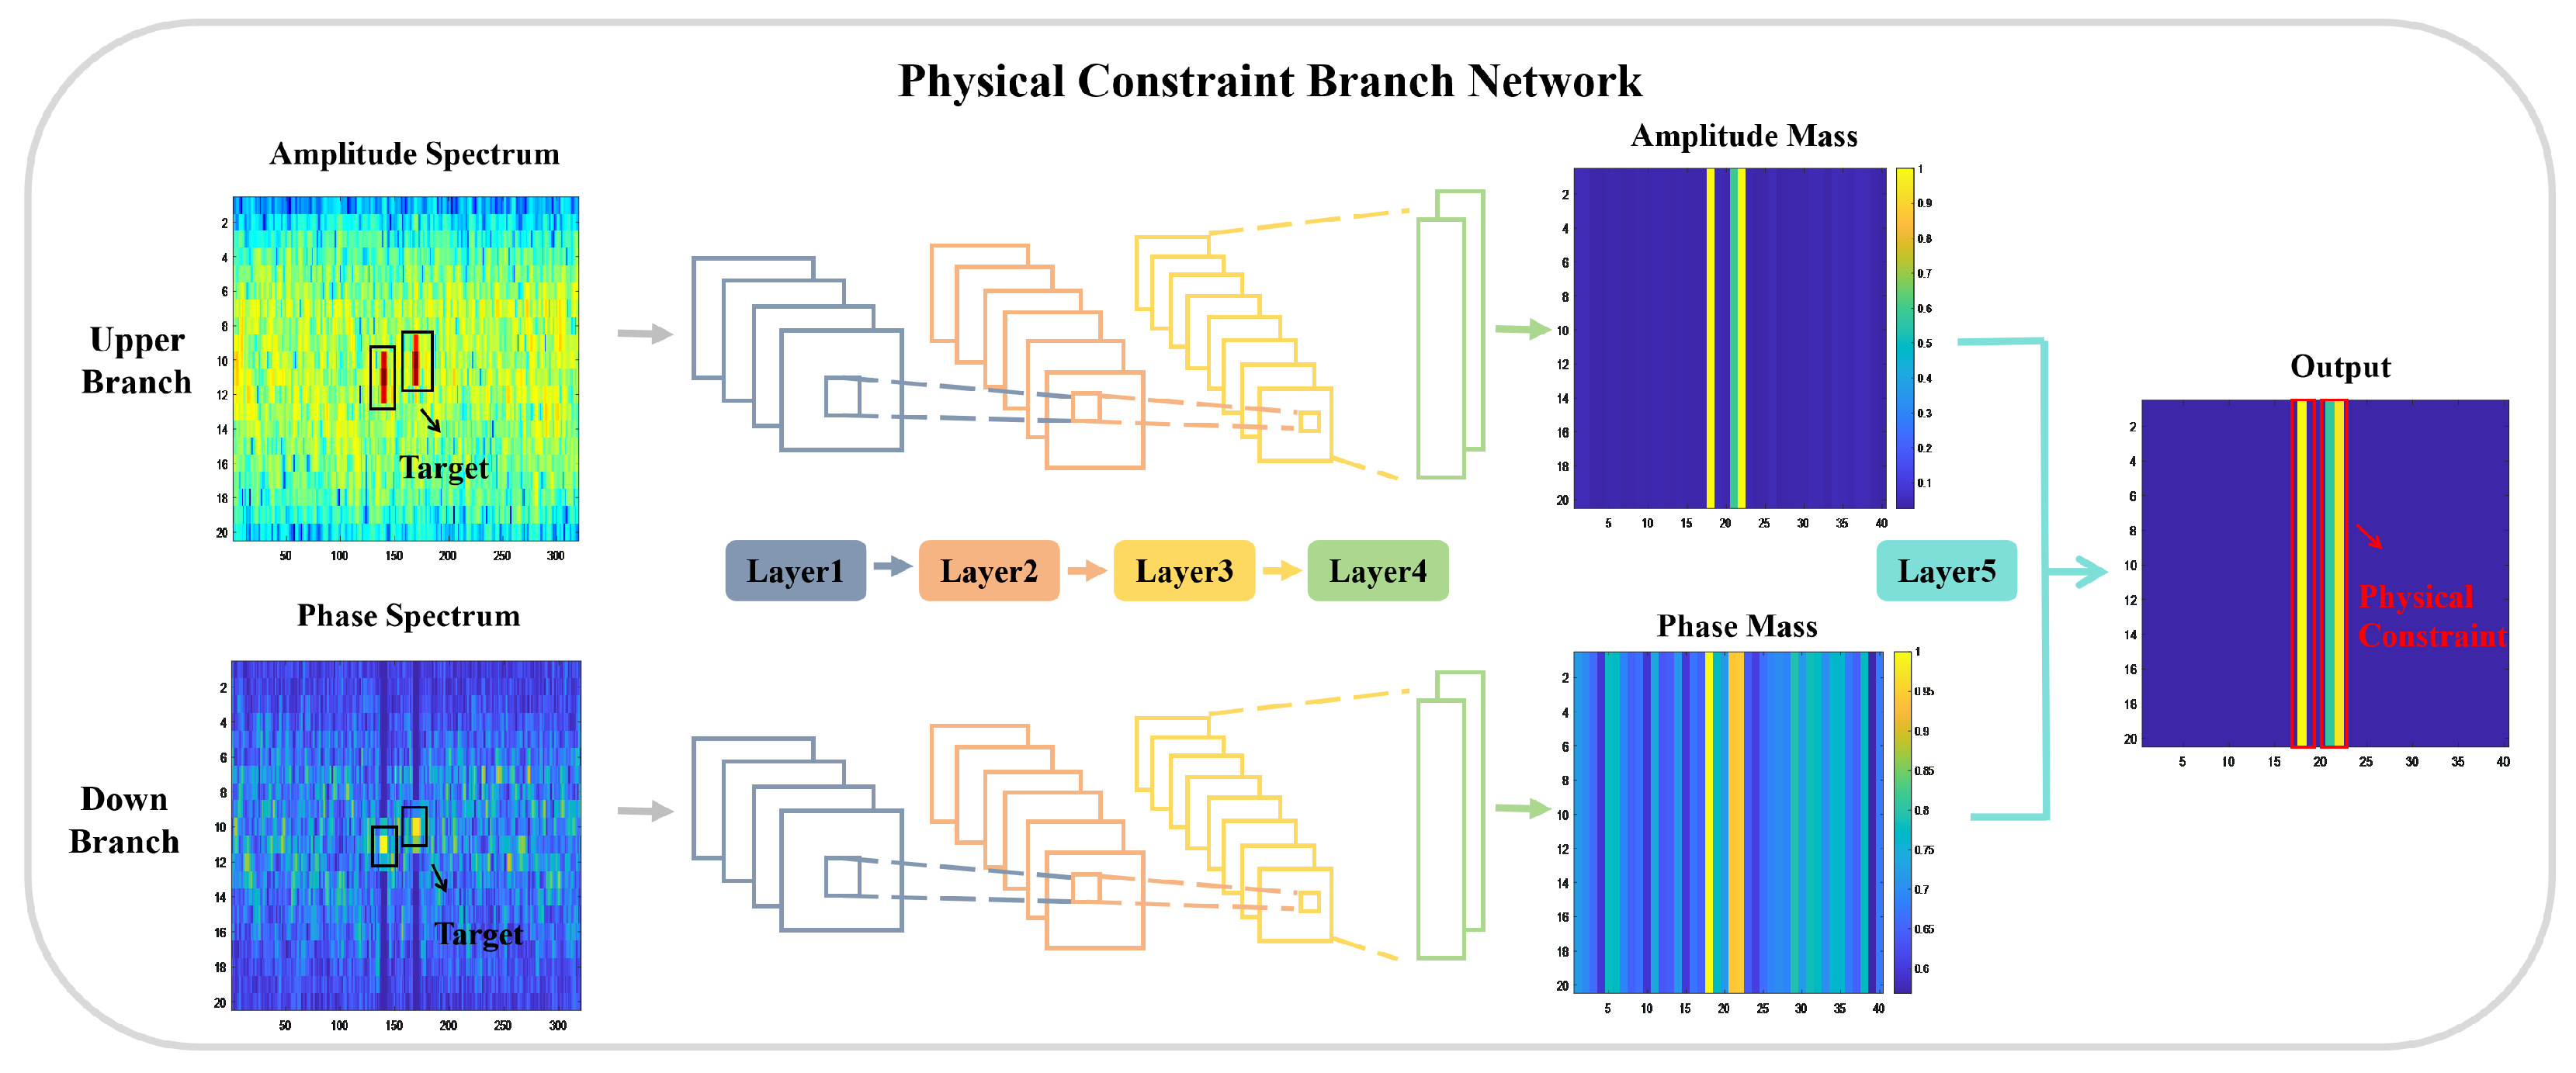
The schematic structure of the branch network is shown in Figure 5. The network consists of two sub-branches, each receiving input data with dimensions , where h denotes the number of range cells and w the number of pulses. The output of the network is the extracted physical features, and the data dimensions are required to match those of the encoding layer in the main network. In this work, the corresponding data dimensions are .
Figure 5.
Schematic structure of the physical constraint branch network.
The upper and lower branches of the feature extraction network are composed of convolutional layers, activation function layers, pooling layers, and other components. The detailed network structure parameters are provided in Table 1.
Table 1.
Network structure of the physical constraint branch network.
The operation of the convolutional layer can be expressed as
Here, X denotes the input data, K the convolution kernel (with height and width ), s the convolution stride, and b the bias term (used to adjust the convolution output). The indices correspond to the positions in the input data.
The activation function layer (ReLU) primarily serves to preserve the network’s ability to fit and learn from complex scenarios (such as noise, clutter, and interference present in the RD spectrum). It can be expressed as
As shown in Figure 5, the output of the physical feature extraction network is a feature data volume in which the boundary information between target echoes and background clutter/interference/noise is enhanced. This feature data volume is not used for direct target detection but rather serves as input to the bottleneck layer of the Res_Unet in the main detection network. By leveraging a Transformer-based attention mechanism, an intelligent target detection method is realized in which boundary features guide the detection process. The overall feature fusion strategy and target detection architecture are detailed in Section 2.4.
2.4. Target Detection (Target Detection Backbone Network)
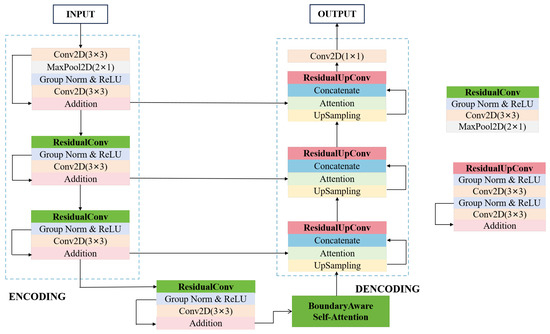
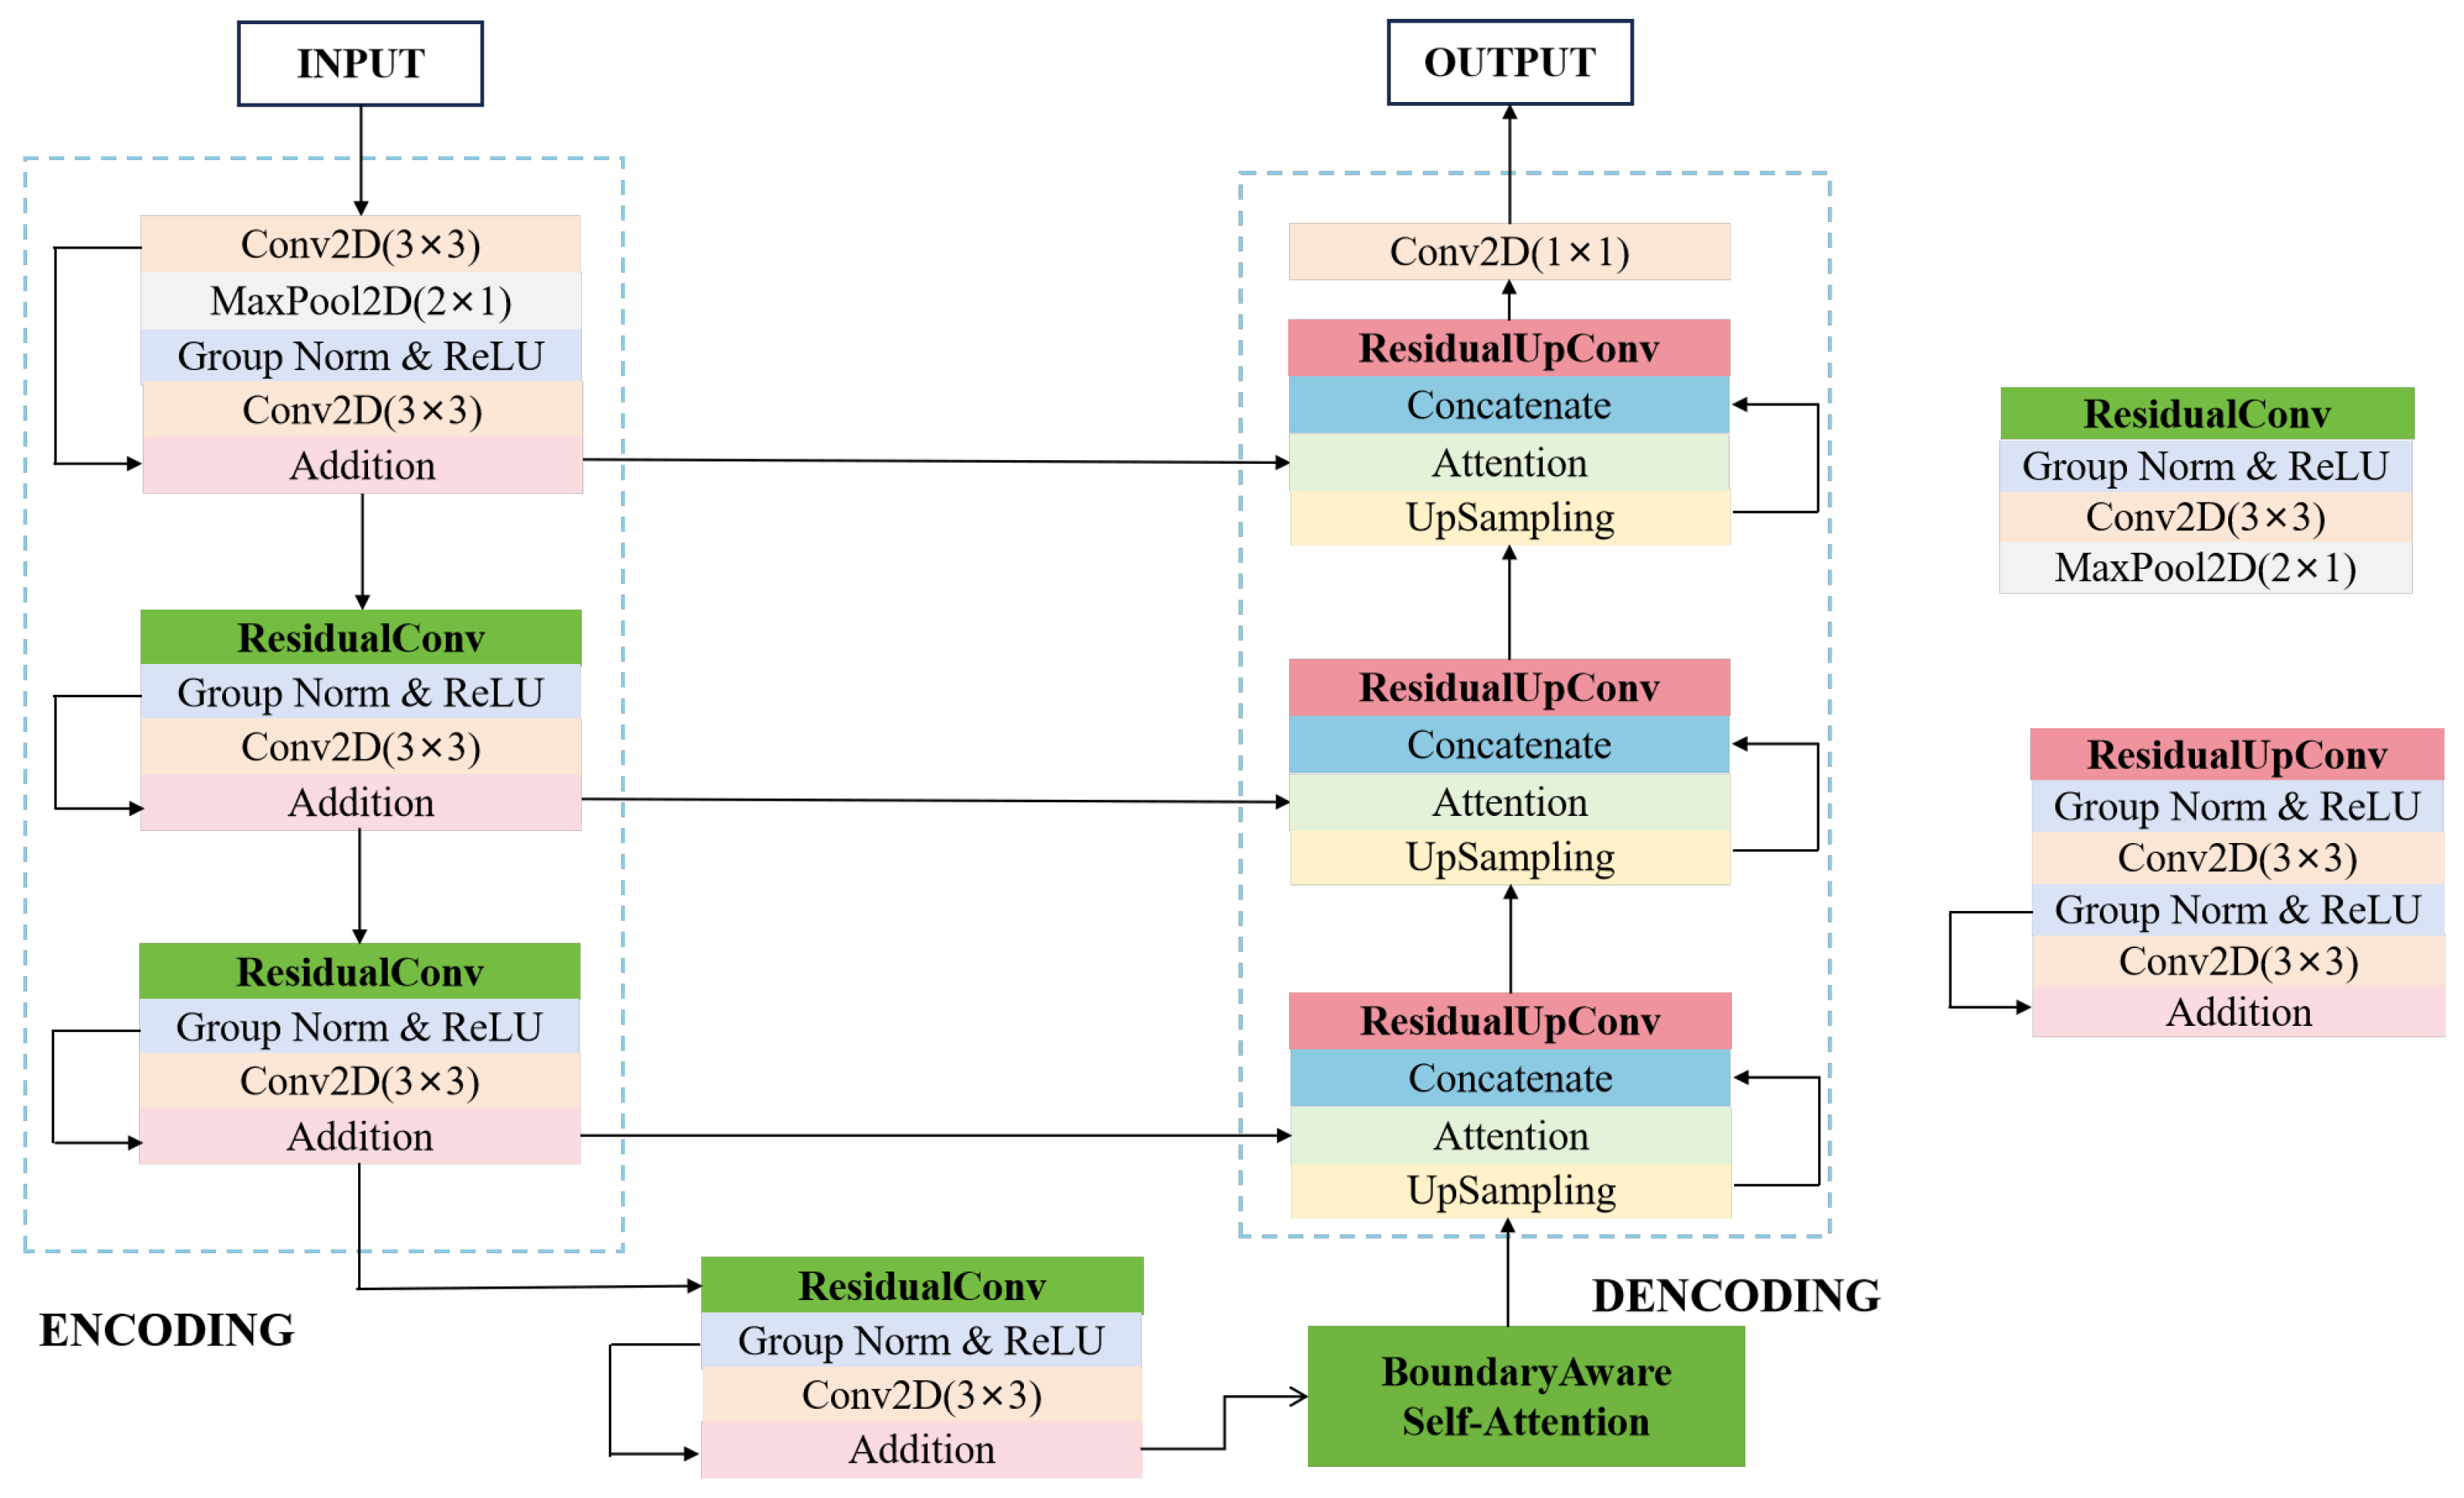
In this work, Res_UNet is adopted as the baseline network for target detection. Res_UNet [38] is a neural network model that integrates the UNet architecture with the residual blocks of ResNet. ResNet [39] introduces residual blocks with cross-layer connections, which enable deep feature extraction while avoiding gradient vanishing and network degradation. The UNet architecture has been widely applied in radar target detection [40,41]. It consists of an encoder and a decoder forming a U-shaped structure, where skip connections fuse shallow and deep features extracted by the network, providing strong scalability and generalization capability. By combining the strengths of both, Res_UNet not only fully extracts and exploits the multidimensional features of radar echoes but also mitigates gradient vanishing, delivering improved performance in handling complex boundary problems and fine-grained feature representation. The detailed network structure and the feature transformations at each layer are illustrated in Figure 6.
Figure 6.
Schematic structure of the target detection backbone network.
The range–pulse amplitude spectrum and the range–pulse phase-difference spectrum, with dimensions , are used as the two input channels of the target detection network. The number of feature channels in the encoder is set to 8, 16, 32, and 64. The network primarily employs convolution operations, ReLU activation functions, and max pooling to reduce spatial dimensions while increasing channel depth, thereby extracting high-dimensional features. In this study, the convolution kernel size is set to with a stride of 1, and the pooling layer size is set to , ensuring that no downsampling is performed along the pulse dimension. The bottleneck layer serves as a transition between the encoder and decoder, transmitting global contextual semantic information. The decoder mainly consists of deconvolution, skip connections, and activation functions, which restore fine-grained details from the high-dimensional features extracted by the network.
The target detection network primarily relies on amplitude–phase modulation characteristics to extract time-domain features, but it lacks frequency-domain physical characteristics. When radar target echoes are weak and exhibit low separability from noise, effective detection becomes difficult. To address this issue, this paper introduces an attention mechanism that injects the frequency-domain physical constraint features explicitly extracted by the branch network into the main network. This design enhances the generalization capability of the main network and alleviates the limitation of relying solely on data-driven feature learning.
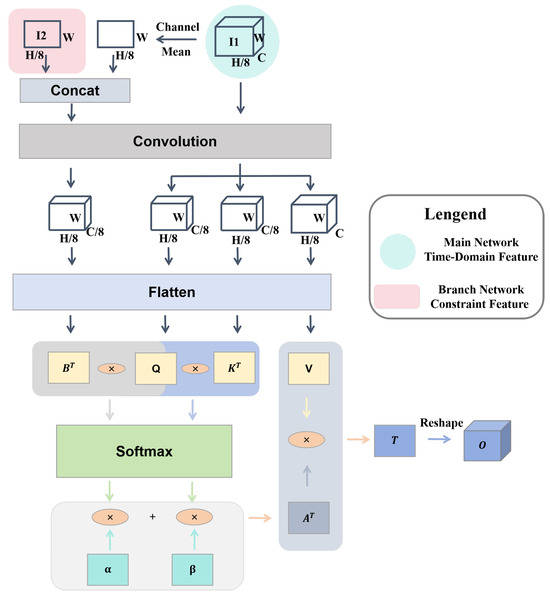
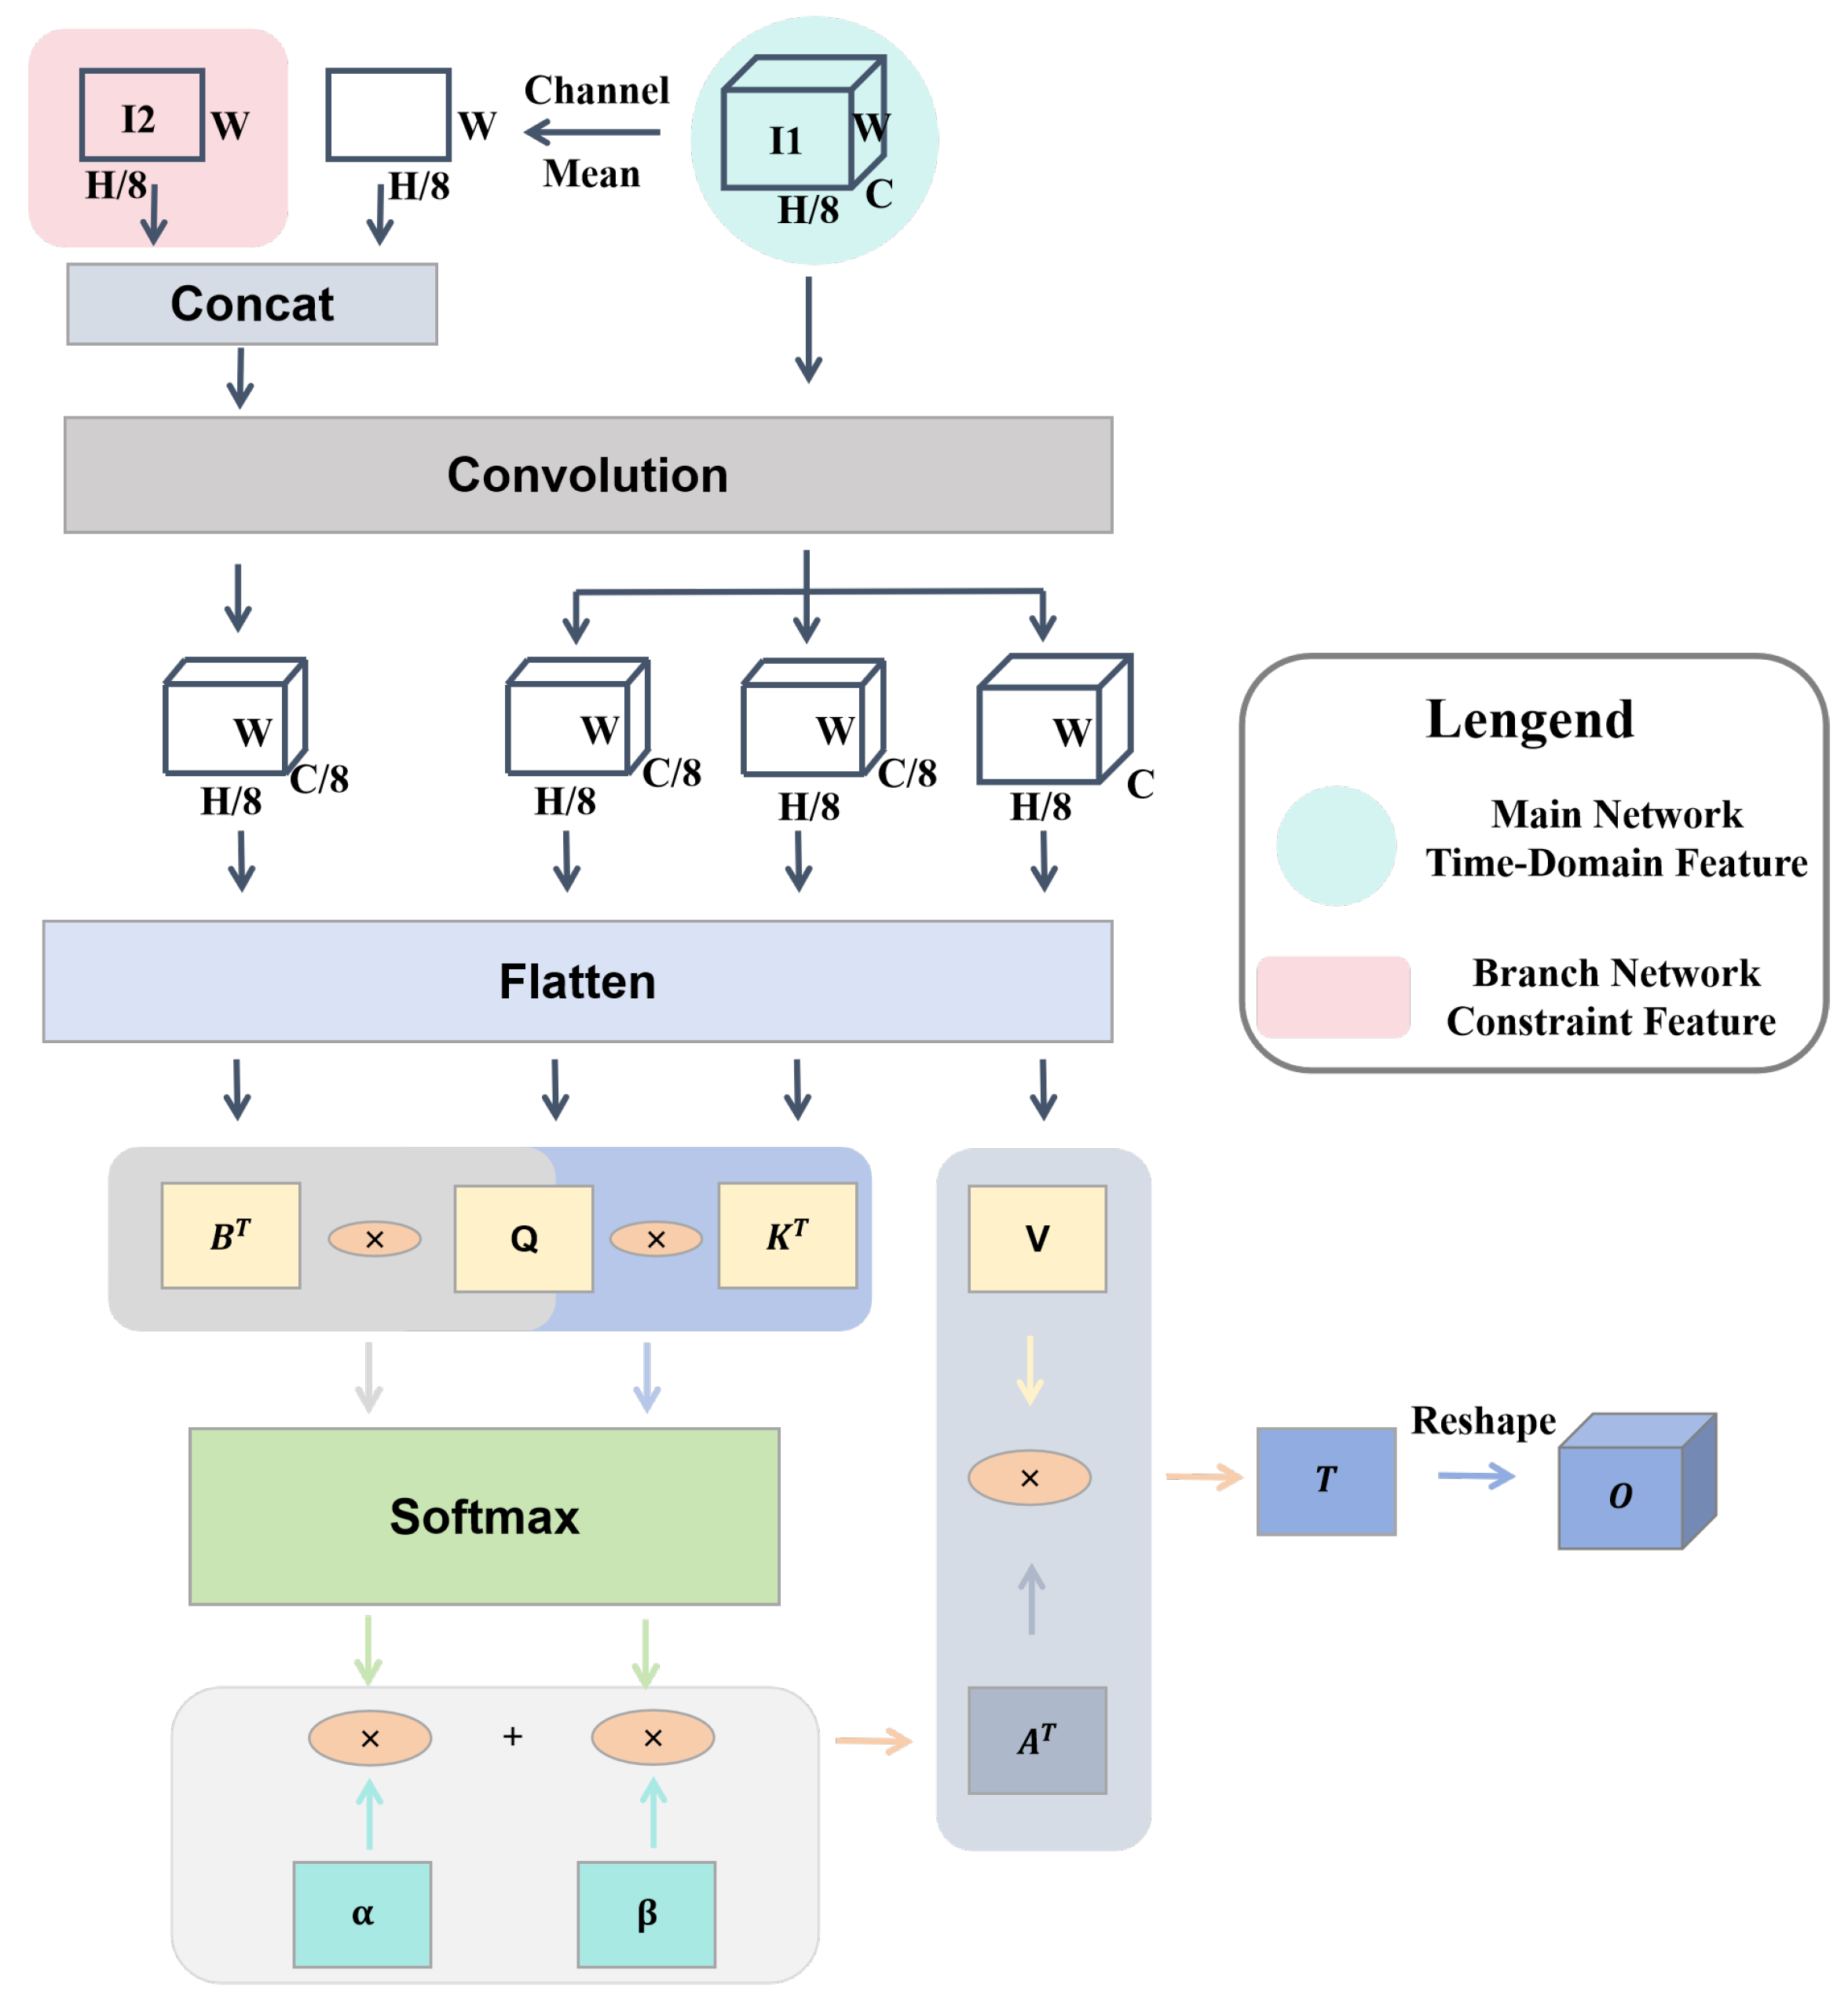
Figure 7 illustrates the detailed implementation of the attention mechanism between the main target detection network and the branch physical feature extraction network. Here, denotes the high-dimensional time-domain features extracted by the main target detection network, with data dimensions of , where h represents the number of range cells, w the number of pulses, and c the number of channels. denotes the high-dimensional frequency-domain physical features extracted by the branch network, with data dimensions of .
Figure 7.
Diagram of the attention mechanism.
The implementation of the attention mechanism is divided into the following steps:
- The time-domain features are mapped across different dimensions through convolution and flattening operations, resulting in three matrices V, K, and Q. Their corresponding data dimensions are , respectively.
- The feature dimensions of are averaged, and the resulting output is concatenated with along the feature dimension. Convolution and flattening operations are then applied to obtain the physically constrained feature B, with data dimensions of .
- The following operation is performed on Q and B to obtain
- The following operation is performed on Q and K to obtain
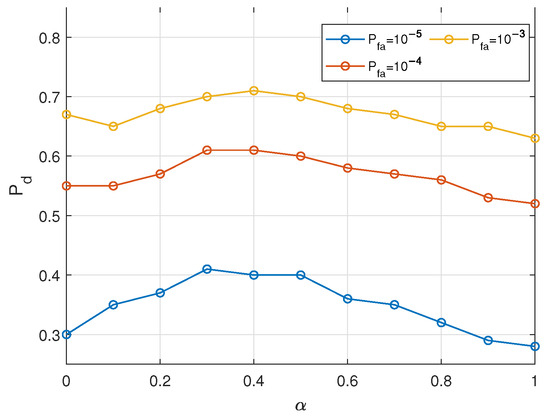
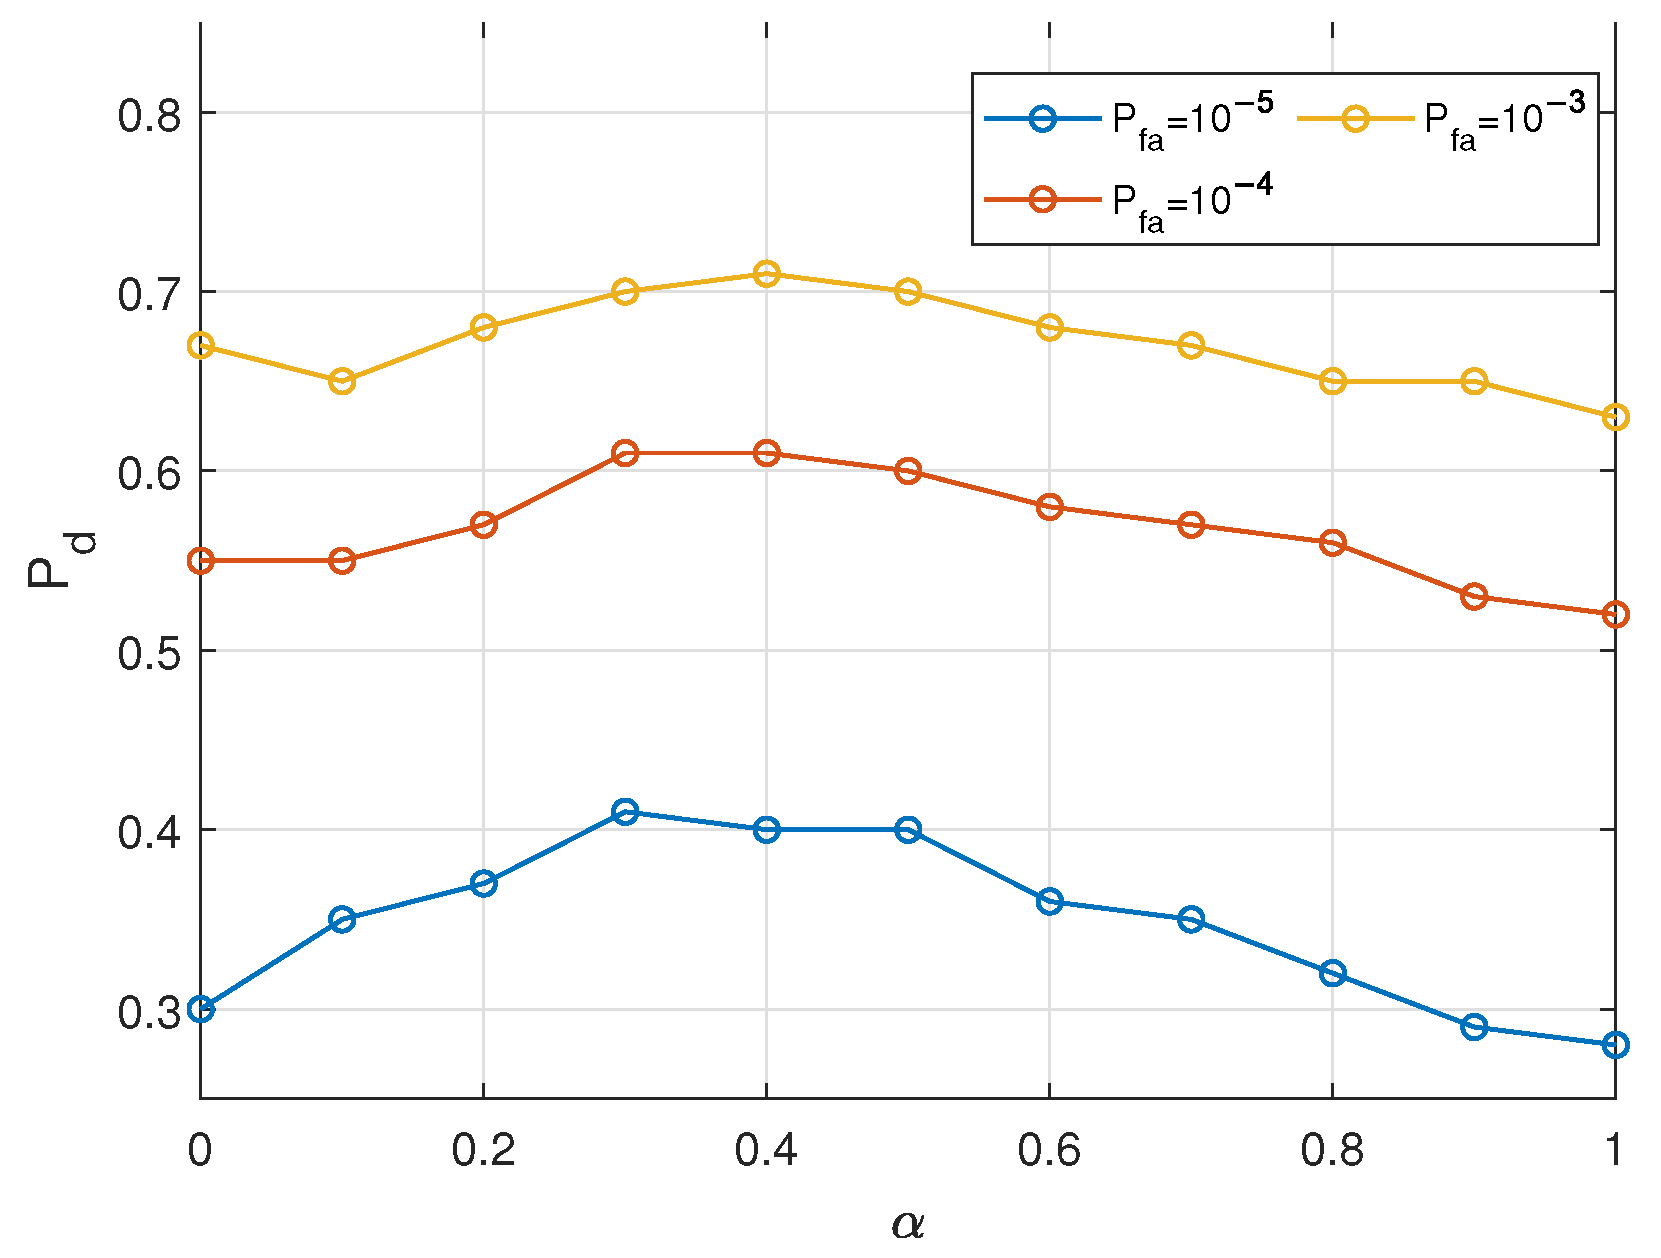
- and are each processed with a Softmax operation and then weighted to obtain the attention matrix AHere, and correspond to the weights of time-domain attention and frequency-domain attention, respectively. Considering that the network structure designed in this paper focuses more on extracting the energy distribution of targets in the temporal domain, while the frequency domain features serve as auxiliary information to extract fine-grained physical constraints, we initially set and . Preliminary comparative experiments verify that this ratio achieves the best performance. In future work, we will replace this fixed weight with adaptive parameter optimization.
- Subsequently, the attention matrix A is multiplied by the transpose of the time-domain feature mapping matrix V to obtain matrix T, which can be expressed as
- Finally, matrix T is decomposed along its dimensions to form matrix O, with data dimensions of . This matrix is then fed into the Res_UNet decoder for detail restoration and target detection.
The network labels are defined such that range cells containing targets are assigned a value of 1, while those containing noise are assigned a value of 0, with labels kept consistent across different pulses. It is worth noting that in the input echo spectrum, the target appears in only a few range cells, while all remaining range cells correspond to noise (including clutter and interference). Consequently, the expected network output is a sparse solution, providing effective discrimination only at target locations. Given these data characteristics, this paper adopts balanced cross-entropy as the loss function, which is specifically expressed as
Here, denotes the proportion of target cells along the range dimension, L represents the network labels, and P is the network output after applying the Sigmoid function.
3. Target Detection Results
3.1. Radar Data Description and Coherence Analysis
The training and fitting of the network rely on large volumes of effective, high-quality radar data. In this study, measured data collected from a VHF early-warning radar of a certain model are employed. The fundamental radar parameters are listed in Table 2.
Table 2.
Radar parameters.
A total of 81,742 valid samples were processed in this study, which were divided into training, validation, and test sets at a ratio of 6:1:3. It is noteworthy that some of the collected raw echoes contained significant interference, primarily manifesting as electromagnetic interference and sea clutter.
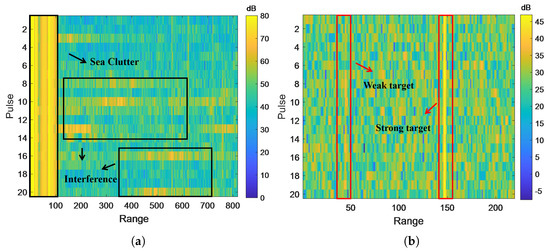
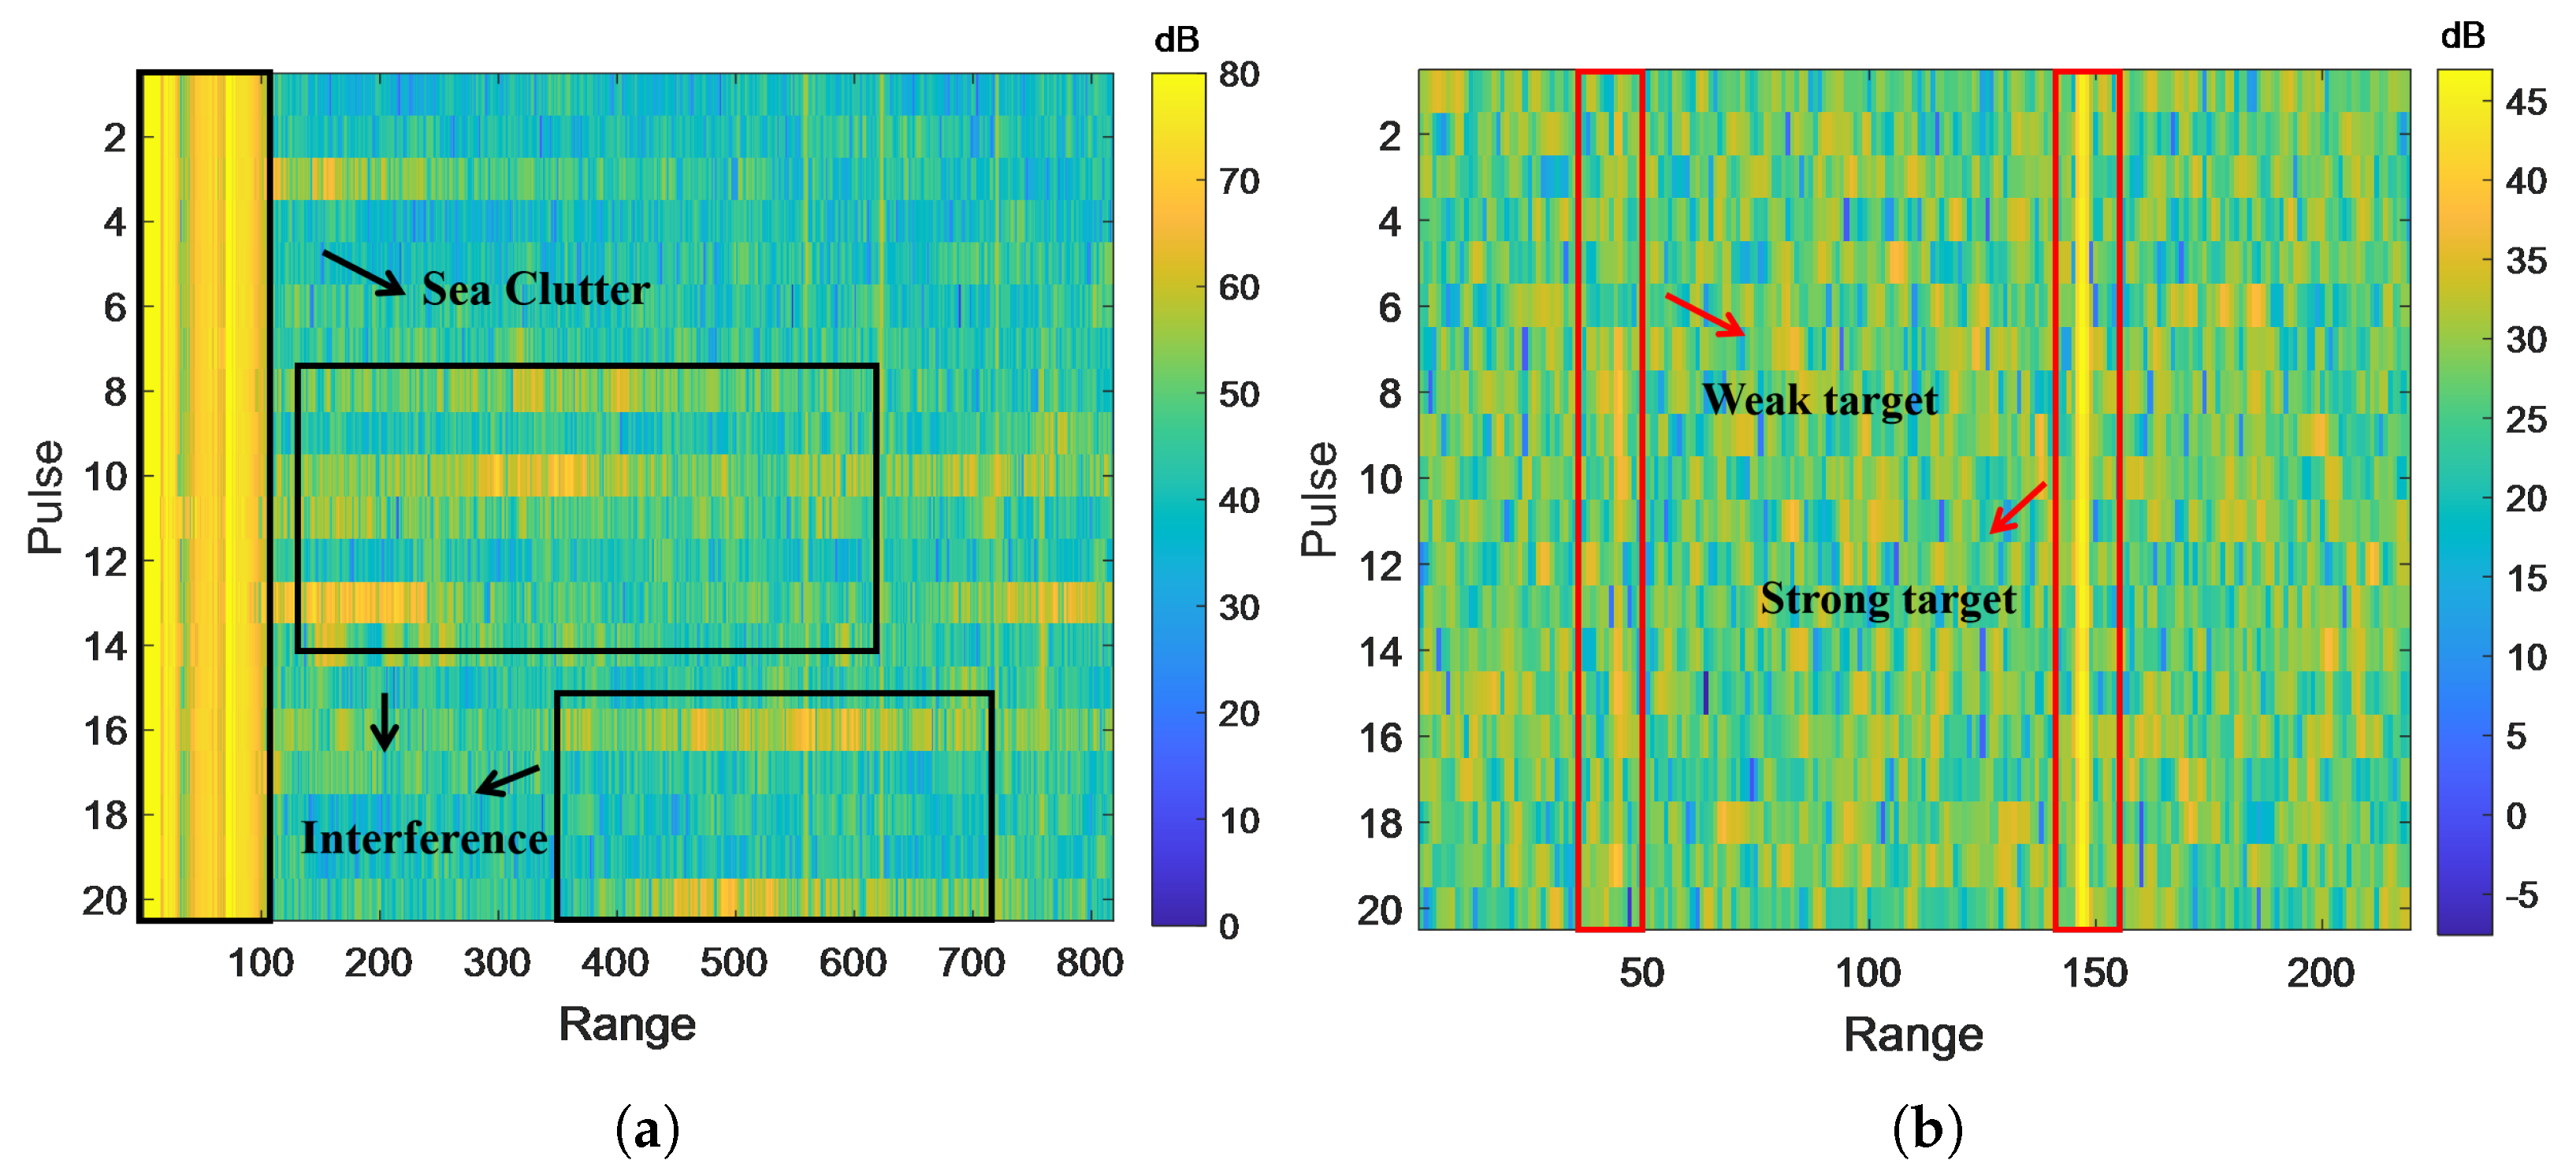
To enhance the robustness of the network, samples with interference and clutter were not discarded but instead used together with clean samples during training and iteration. Examples of data containing sea clutter interference are shown in Figure 8. In Figure 8a, the interference exhibits pronounced amplitude characteristics and is highly continuous along the pulse dimension; in addition, strip-like interference spanning multiple range cells is present. In contrast, Figure 8b shows a clean noise floor, with strong targets exhibiting clear contrast against the background, while weak targets display a flickering pattern along the pulse dimension.
Figure 8.
Comparison of radar measurement data samples. (a) With clutter and interference, (b) pure sample.
All the samples used in this study are accompanied by ground-truth information (including secondary radar tracks and ADS-B tracks). Notably, to acquire authentic, valid and labeled weak target data during data collection, only partial transmitting array elements are excited when sampling civil aviation targets with available ADS-B information. This operation is equivalent to artificially reducing the transmit power and lowering the SNR of targets. The specific target label generation process includes the following steps:
- Low-threshold CFAR detection (typically set to 8–10 dB) to obtain as many original points as possible.
- All original points are subjected to plot fusion, track initiation, and plot-track association to form target tracks.
- The target tracks are time-aligned with the ground-truth tracks, and track matching is performed using range–azimuth-velocity information.
- The original points corresponding to the matched tracks are regarded as true targets and labeled accordingly.
In addition, the number of targets contained in each sample is random, with a minimum of 0 and a maximum of 10. Since target positions remain relatively stable across adjacent dwells and exhibit strong regularity, the data preprocessing stage introduces random range-domain shifts and reversals of all targets across different dwells to enhance data variability.
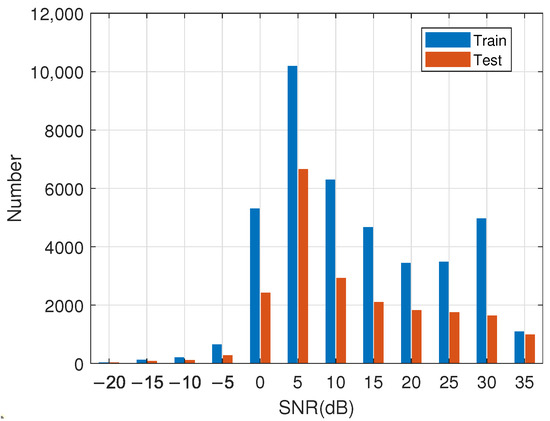
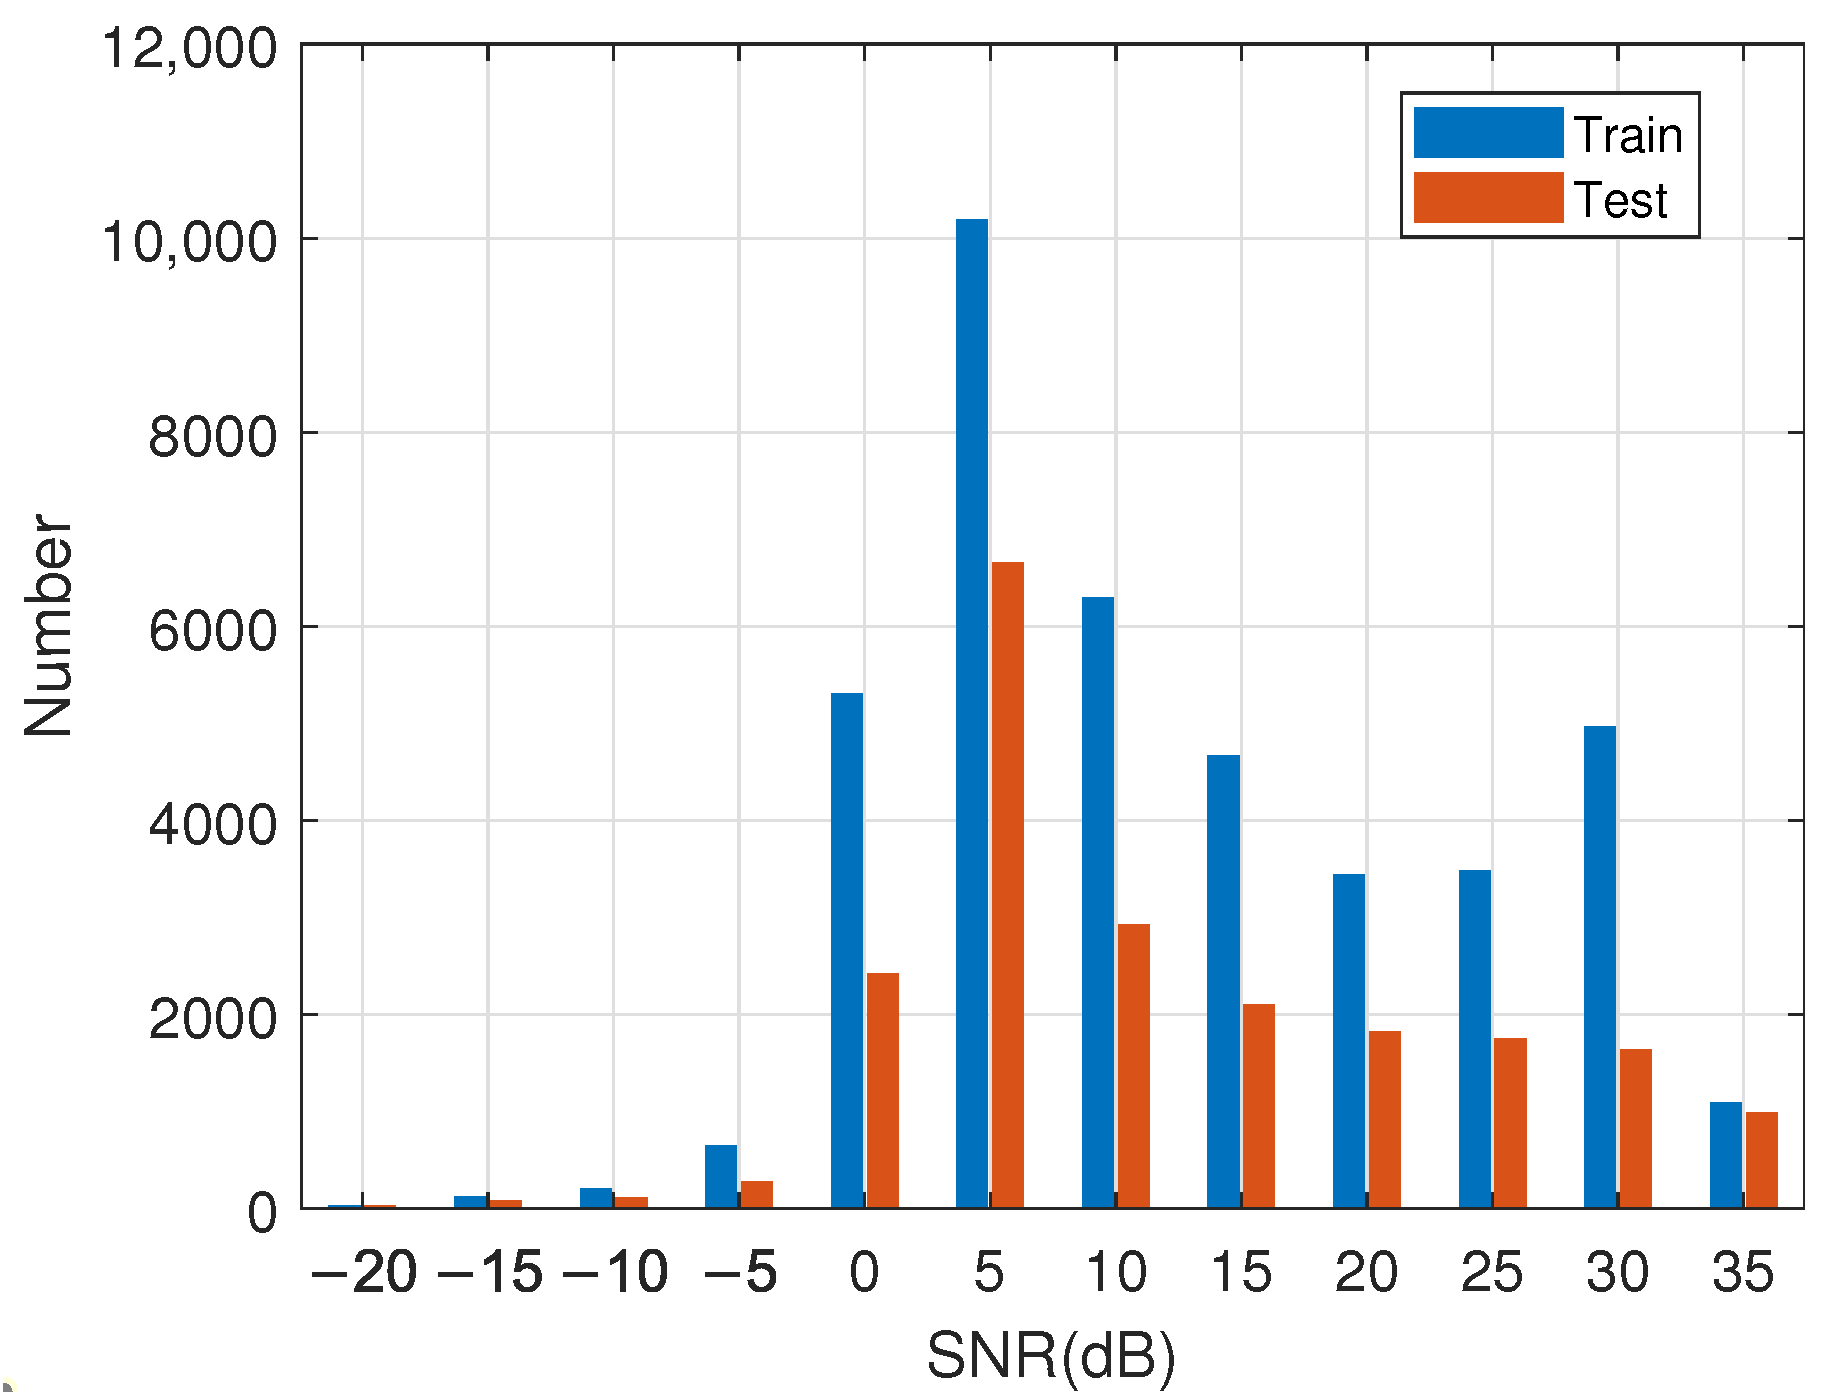
After preprocessing, the SNR statistics of targets in the training and test sets are shown in Figure 9. The SNR of the target in the measured data is calculated by taking the logarithm of the ratio between the target amplitude and the noise floor amplitude. Specifically, the noise floor amplitude is obtained by averaging the amplitudes of 32 target-free range cells before and after the Doppler channel where the target is located. In the field of EWR with stringent false alarm rate requirements, the commonly used CFAR detection threshold is 12.8 dB [3], and thus, targets with an SNR below 12.8 dB can be regarded as low-SNR targets. Statistically, the proportion of low SNR is approximately 55%. Furthermore, to better compare the algorithm performance under different SNR conditions, the targets in this paper are divided into three SNR intervals:
Figure 9.
SNR distribution of network samples. Blue: train, red: test.
- SNR above 12.8 dB (strong targets);
- SNR between 8.8 dB and 12.8 dB (weak targets);
- SNR below 8.8 dB (very weak targets).
Among them, the weak target interval is difficult to detect using conventional CFAR detectors and is the main focus of this work.
3.2. Experiment Results
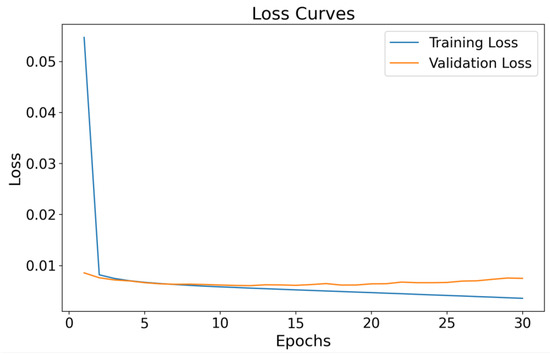
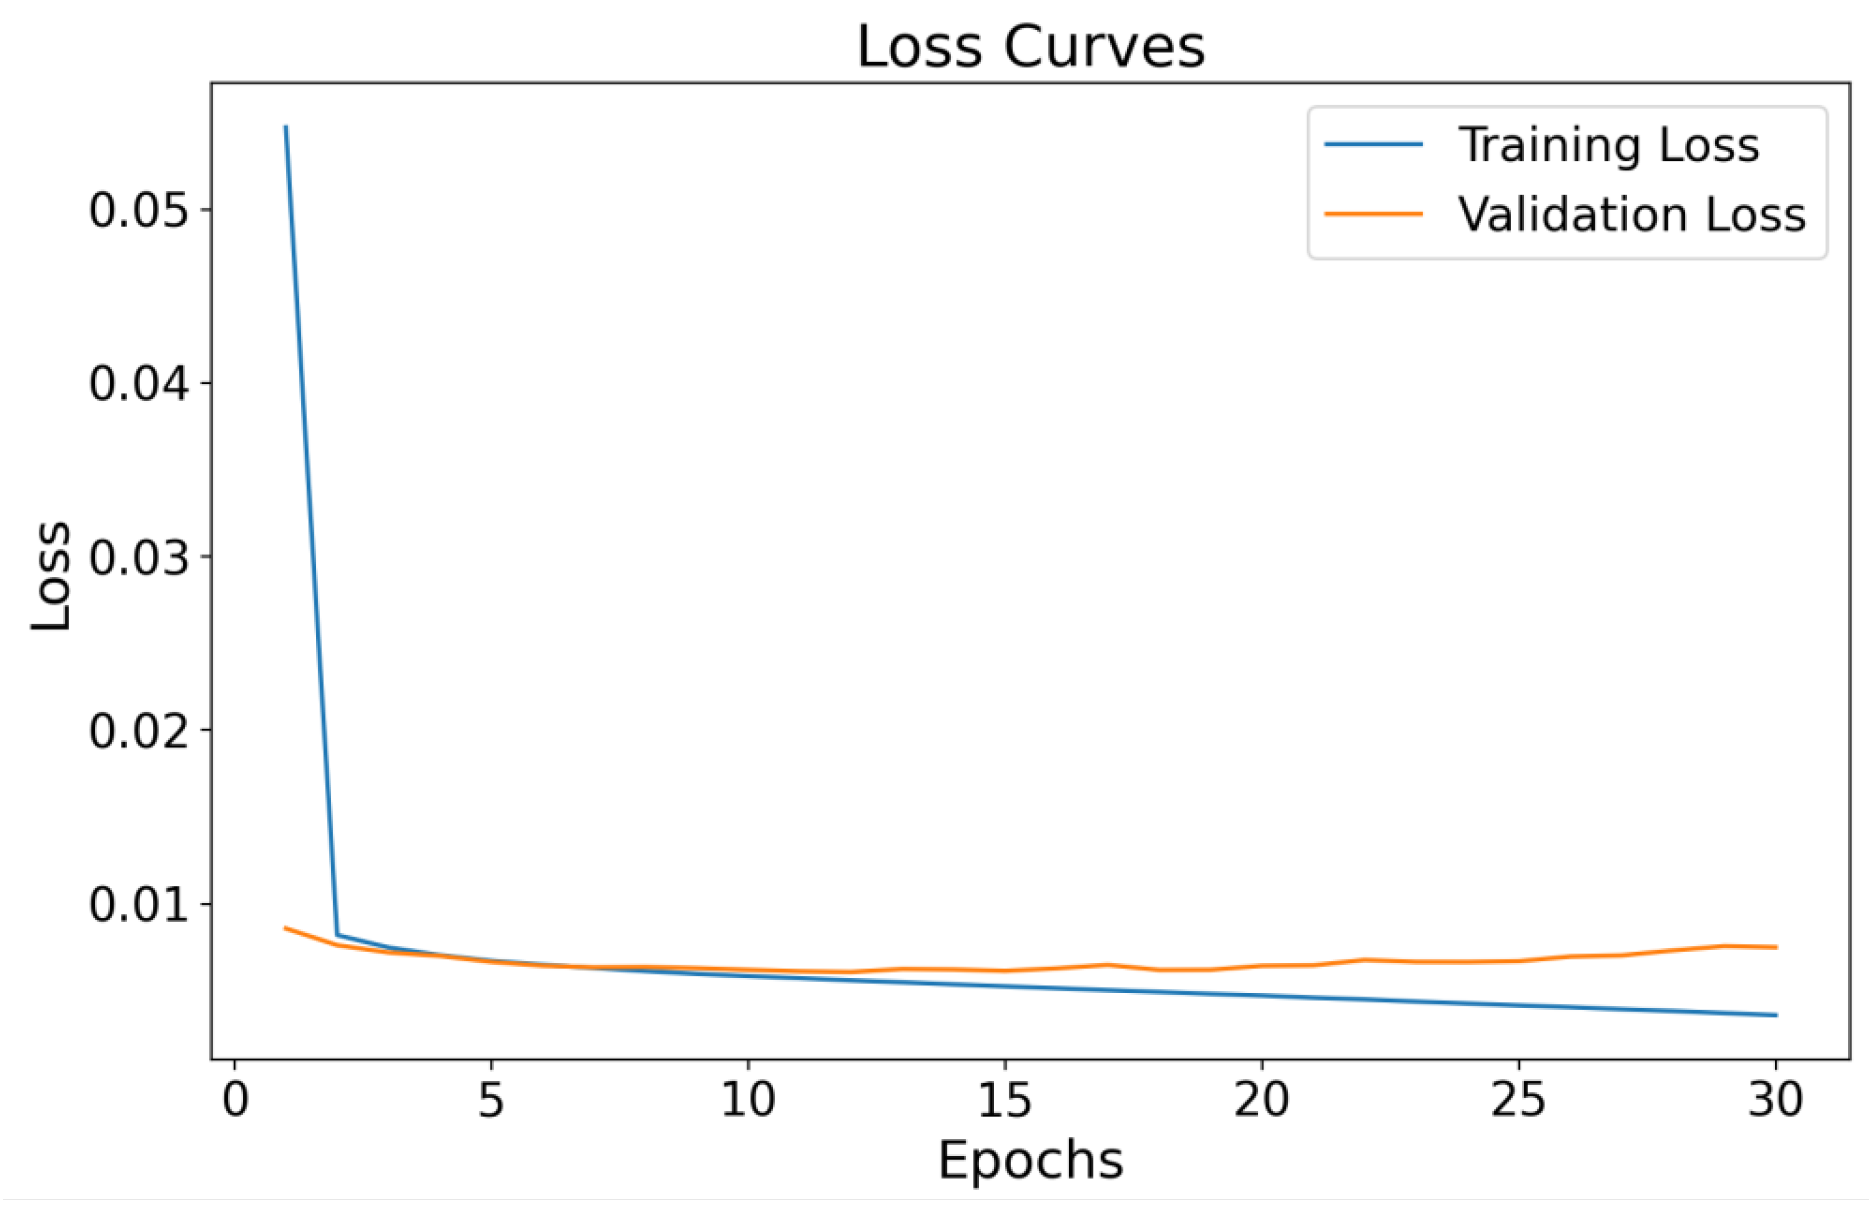
The model training was implemented with 30 training epochs, a batch size of 8, and an initial learning rate of 0.0001. The Adam optimizer was adopted for parameter optimization, and no early stopping strategy was employed during the training process. All experimental training and testing procedures were conducted on an NVIDIA GeForce RTX 4090 GPU. Furthermore, the loss curve is shown in Figure 10. The proposed method achieves an inference latency of approximately 2 ms per sample, which satisfies the real-time processing requirements of EWR systems and verifies its favorable practical application potential.
Figure 10.
Loss curve during the training process.
As described above, the network output is a two-dimensional matrix. Therefore, a sigmoid function is applied to convert the output into a probability map, which is then summed along the pulse dimension to obtain the target probability curve. To determine the presence of a target, a probability threshold () is defined: values exceeding the threshold are considered targets, whereas values below the threshold are regarded as clutter, interference, or noise. If the is set too high, the detection rate decreases; if it is set too low, the false alarm rate increases. In other words, mainly serves to reconcile the contradictory relationship between the false alarm rate and detection rate, and its value can be flexibly selected according to diverse application scenarios. In practical engineering applications, is determined inversely from the preset false alarm rate, and there is no explicit analytical formula for its calculation. Taking the experimental dataset adopted in the following sections as an example, the correspondence between the false alarm rate () and the threshold is illustrated as follows:
- ;
- ;
- .
3.2.1. Ablation Experiments of the Proposed Algorithm
To validate the rationality and effectiveness of the feature transformation and dual-branch network design, four ablation experiments were conducted on the same test set. These include:
- A main target detection network with input features consisting solely of time-domain echoes (amplitude and original phase);
- A branch network with input features consisting solely of frequency-domain echoes;
- A dual-branch network with input features of amplitude and raw phase.
- A dual-branch network with input features of amplitude and phase difference (Ours).
The ablation experiment results are shown in Table 3, where the false alarm rate of the algorithm is . First, by observing the first three rows of the table and comparing the performance between the backbone/branch network and the dual-branch network, it is clear that the dual-branch network can improve the detection rate by 6% for weak targets and 5% for very weak targets, respectively. showing a significant performance gain. Second, by comparing the last two rows in Table 3, we observe that using phase difference as the input feature yields a 5% improvement in detection rate compared with using the original phase. This result verifies the advantage of phase-difference transformation in enhancing the feature contrast between targets and clutter/interference/noise.
Table 3.
Ablation experiments.
Table 4 presents the test results of the model using different loss functions on the same dataset, with a false alarm fixed at . According to the statistical results, the model with balanced cross-entropy achieves the best convergence and the highest detection probability for targets under different SNR.
Table 4.
Comparison of loss functions.
Figure 11 illustrates the variation of target detection rate with the attention parameter under different false alarm conditions. Here, the sum of attention weights and is equal to 1. It can be observed that the overall detection rate under various false alarm constraints reaches the maximum when the attention weight is set to 0.3, which represents the optimal parameter configuration for the current dataset. In future work, we will introduce an adaptive mechanism to dynamically adjust the attention weights according to the fitting results.
Figure 11.
Variation of detection rate with attention coefficient .
3.2.2. Detection Performance for Strong and Weak Targets
The following section provides a detailed analysis of the network’s performance on strong and weak targets. Figure 12 illustrates the network’s multi-target detection capability. Figure 12a,b represent the inputs to the main target detection network, Figure 12c shows the input to the branch physical constraint network, Figure 12d is the output of the branch network, Figure 12e represents the output of the main target detection network, and Figure 12f displays the final detection result obtained by summing Figure 12e along the pulse dimension and performing coherent decision-making. In this dataset, five targets are present, of which four exhibit strong echo energy, and one exhibits weaker echo energy. After processing by the network, the detection probabilities for all five targets exceed 0.9, enabling their successful detection. This demonstrates that the network is capable of simultaneously detecting multiple targets without introducing additional false alarms as the number of potential targets increases.
Figure 12.
Network output of multi-target. (a) Range–Pulse amplitude spectrum, (b) range–pulse phase spectrum, (c) range–Doppler amplitude spectrum, (d) Physical constraint spectrum, (e) network output probability spectrum, (f) detection result comparison.
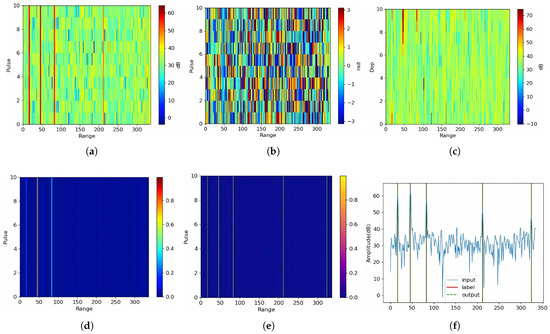
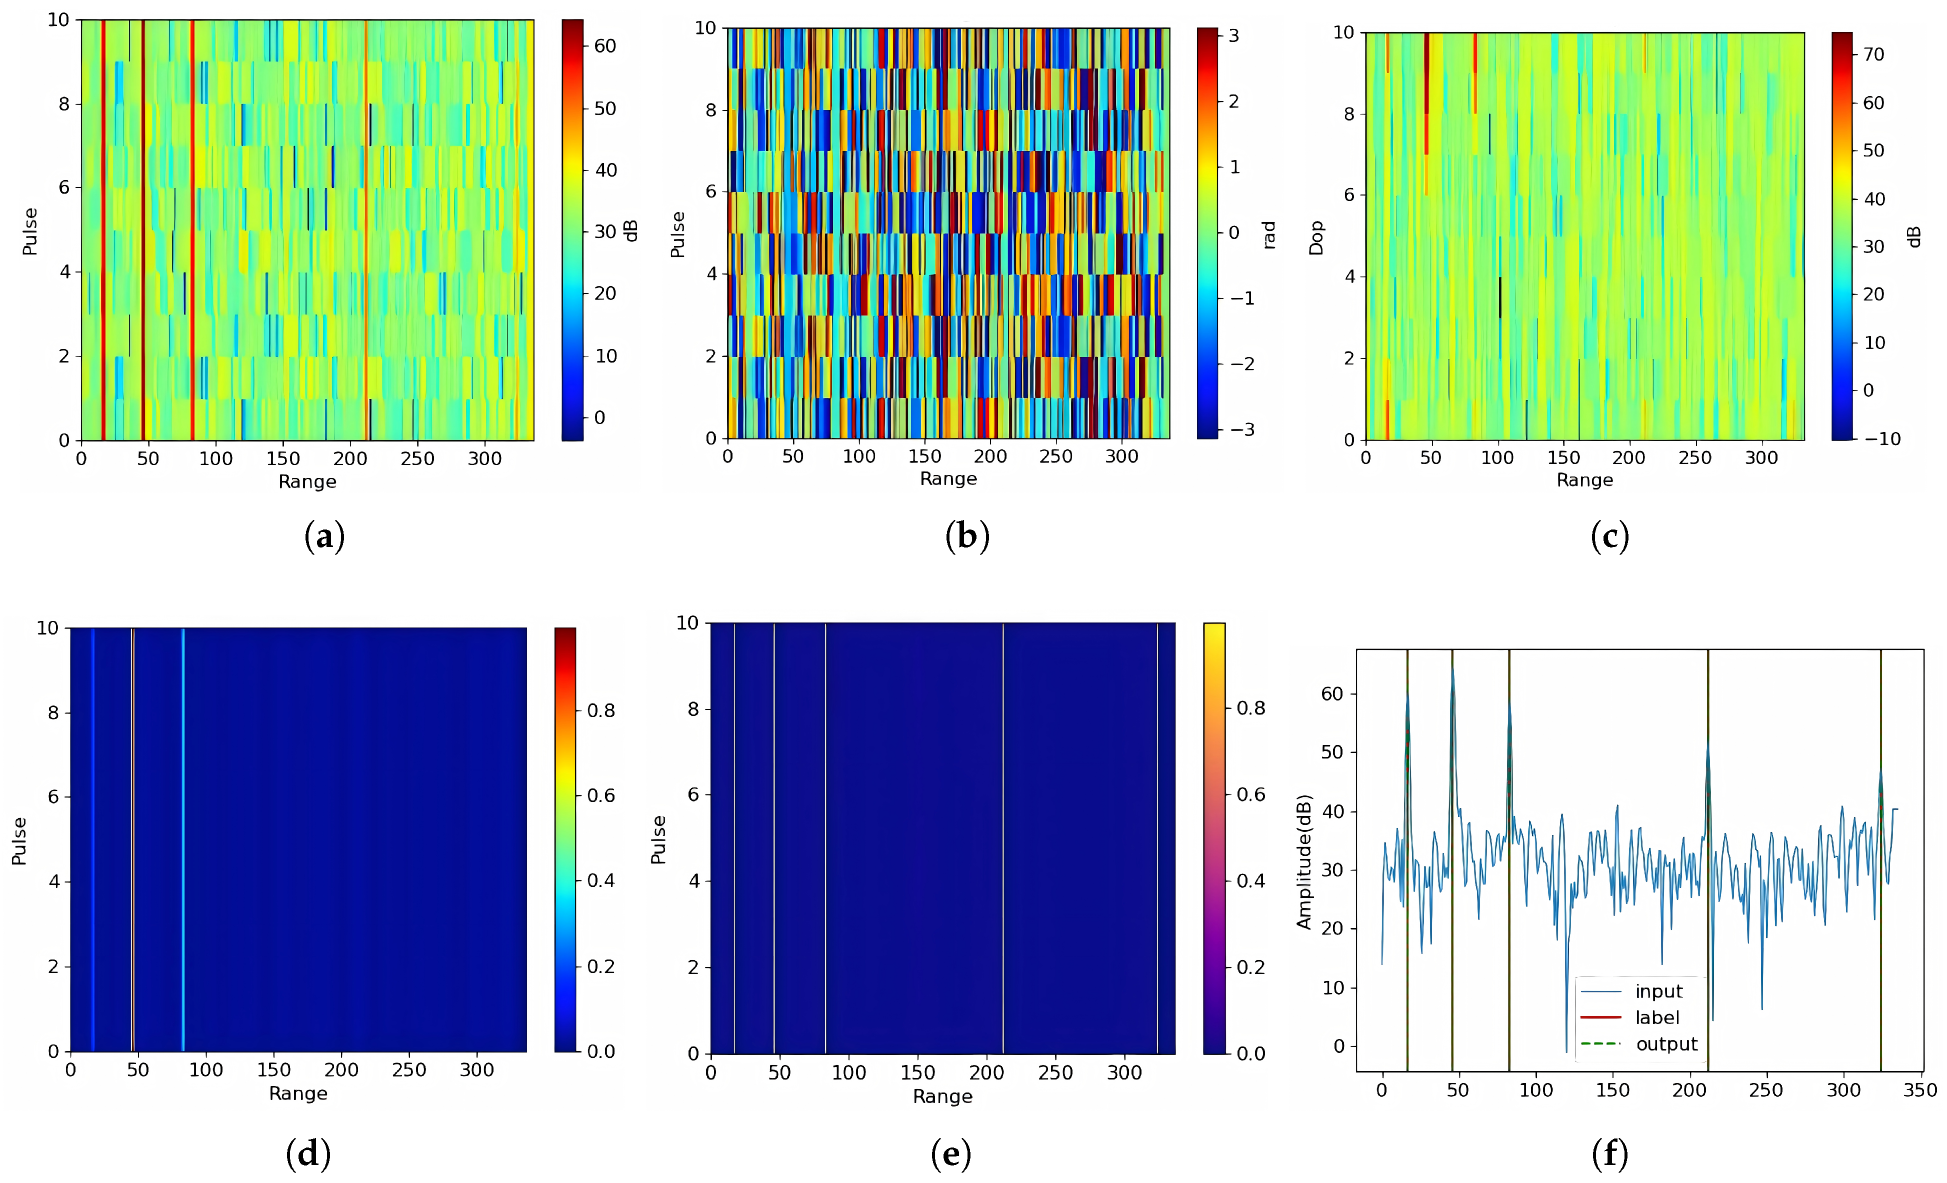
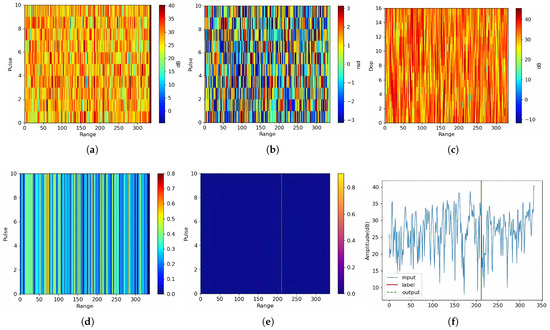
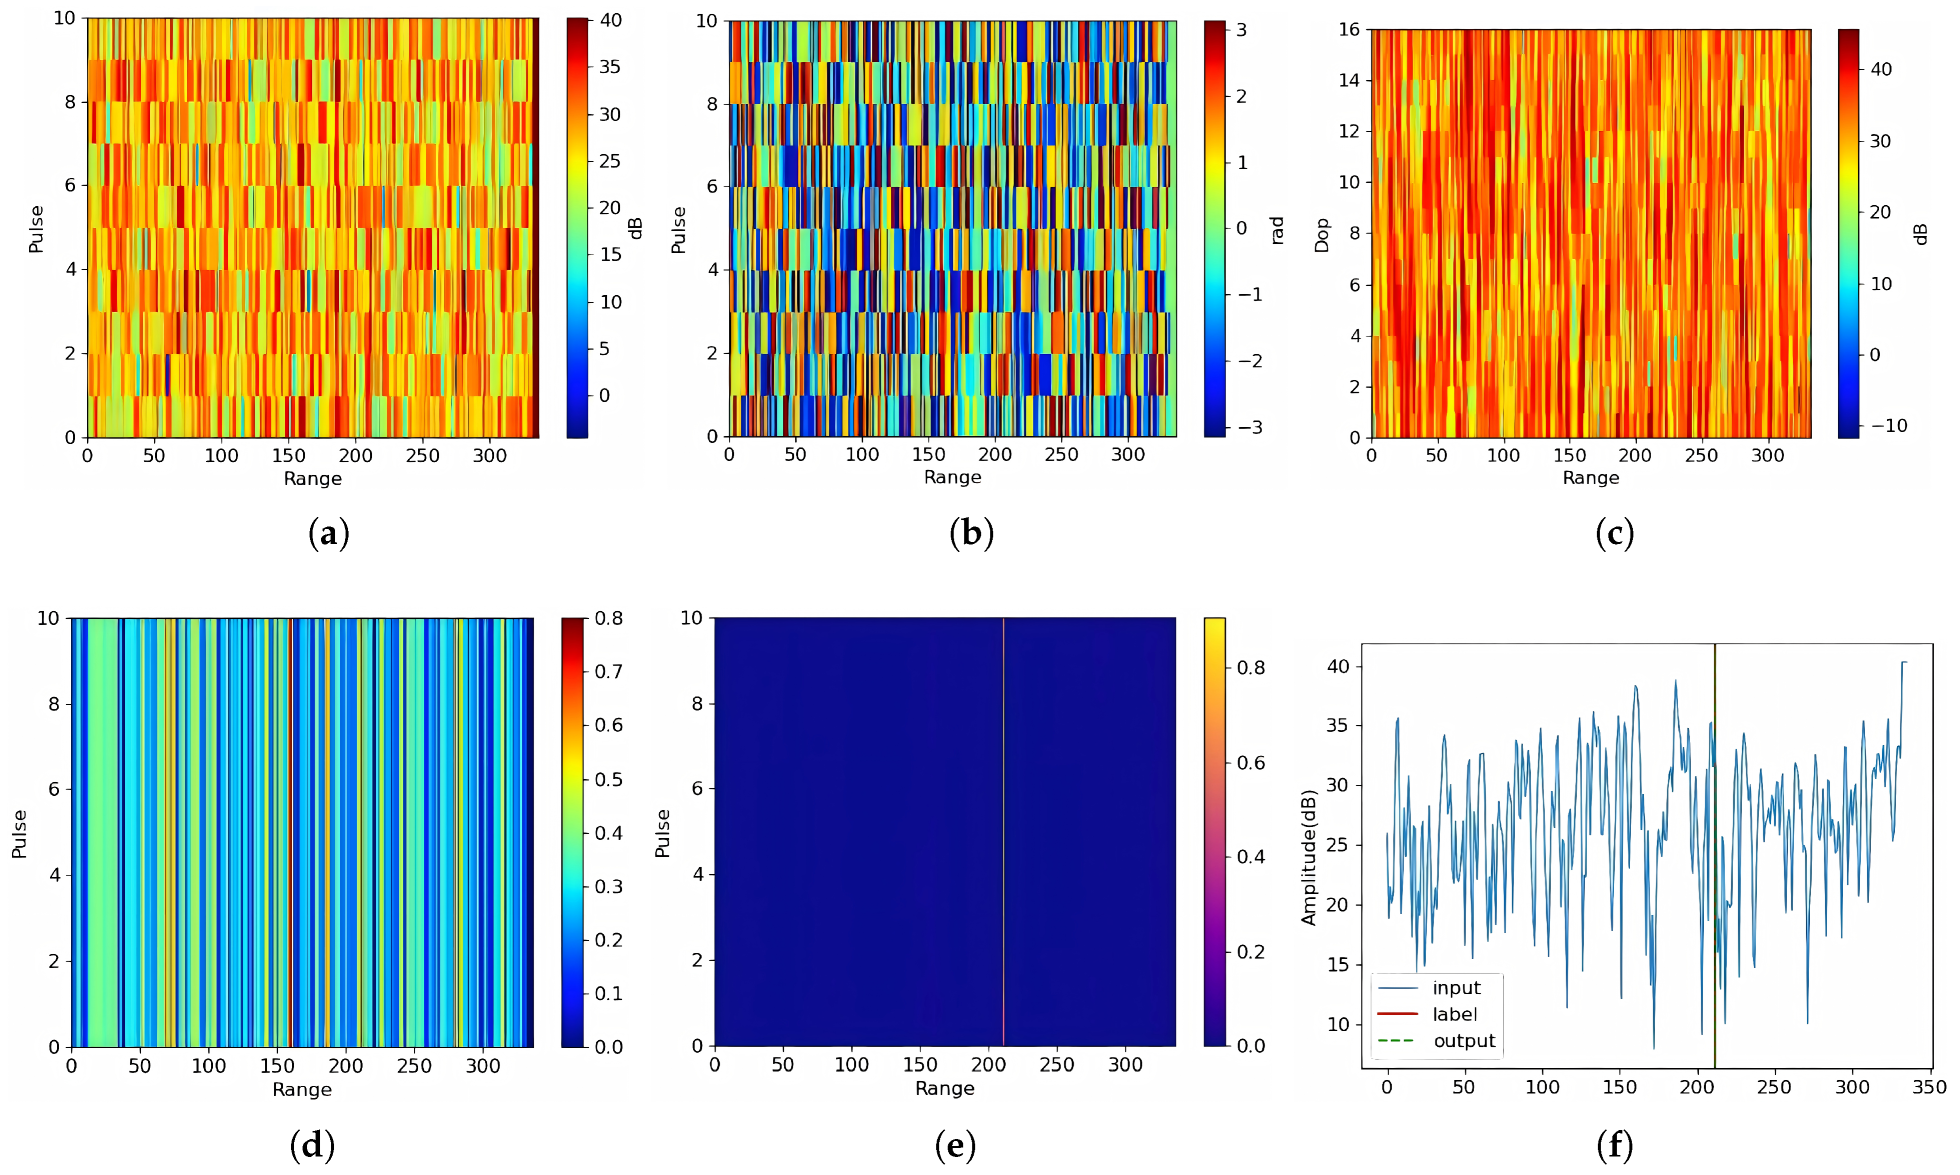
Figure 13 illustrates the network’s target detection capability in the case of weak targets. According to the ground-truth labels, the target is located at the 210th range cell. Analysis of Figure 13a–c reveals that the target exhibits minimal amplitude–phase contrast relative to the noise floor, and the echoes across pulses are unstable, preventing effective energy accumulation. Under such conditions, conventional CFAR algorithms based on the RD spectrum fail completely. However, after being trained on measured data containing a large number of weak targets, the network has learned and fitted to the high-dimensional statistical or physical features of weak targets and has acquired a degree of generalization capability. Consequently, in the probability spectrum output by the network, clear target features can be observed without the occurrence of false alarms. In other words, under controlled false alarm rates, the network demonstrates the ability to accurately detect certain weak targets.
Figure 13.
Network output of weak target. (a) Range–pulse amplitude spectrum, (b) range–pulse phase spectrum, (c) range–Doppler amplitude spectrum, (d) Physical constraint spectrum, (e) Network output probability spectrum, (f) detection result comparison.
3.2.3. Quantitative Comparison of Different Algorithm Performance
After analyzing and validating the basic performance of the network, this paper proceeds to quantitatively evaluate its weak target detection capability. Specifically, the false alarm rate and detection rate are selected as quantitative performance metrics for the network, expressed as follows:
Here, denotes the detection rate, N represents the number of samples, is the number of correctly detected targets in a sample, and is the number of targets in the ground-truth labels of that sample. denotes the false alarm rate, where represents the number of false alarms in a sample, and is the number of range cells in that sample.
To fully verify the effectiveness of the proposed algorithm, several mainstream target detection algorithms are introduced for comparison, including CA-CFAR ([7]), OS-CFAR ([8]), and CNN ([28]).
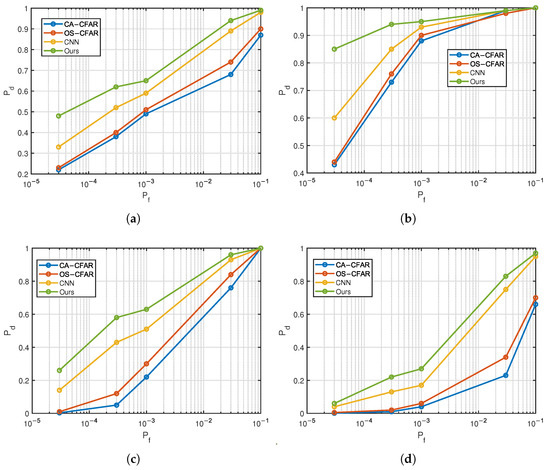
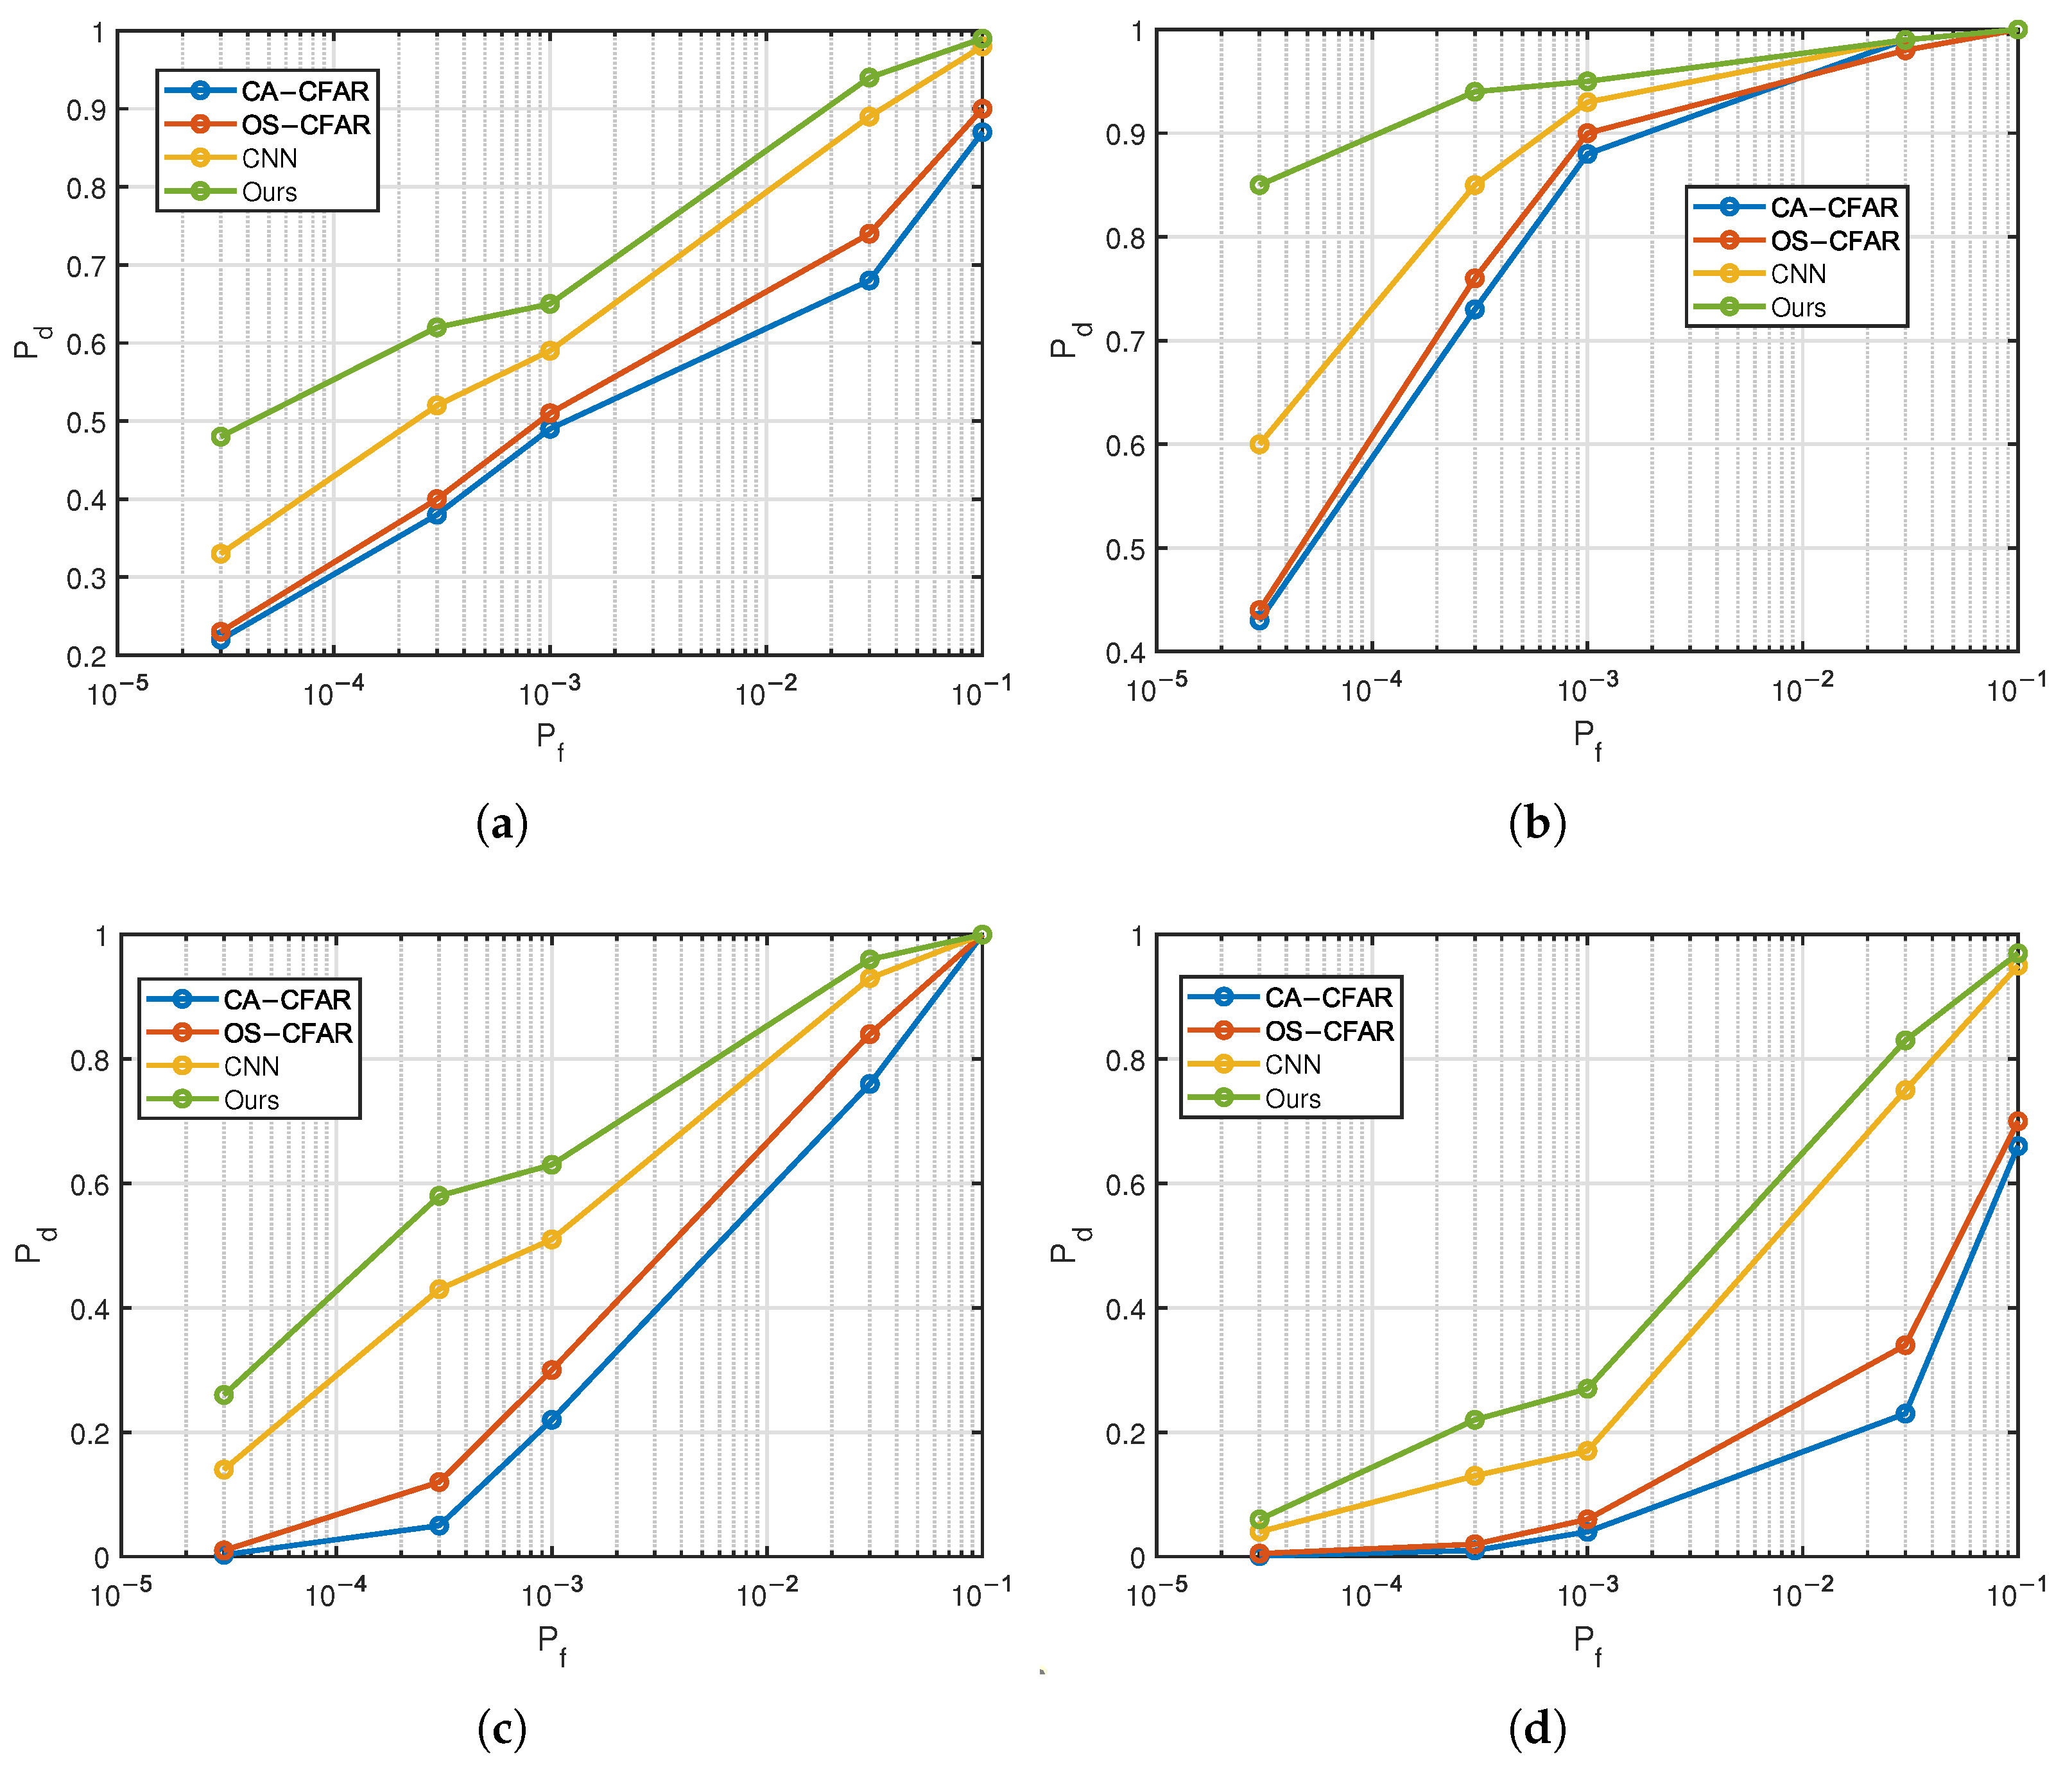
Multiple ROC curves were plotted based on 24,523 test samples containing a total of 22,230 targets, as shown in Figure 14. As shown in Figure 14a, compared with the conventional CFAR algorithms and the CNN method, the proposed method improves the by approximately 20% and 10% under different , respectively. Figure 14b illustrates that for strong targets with SNR above 12.8 dB, the proposed algorithm achieves the most stable and the best robustness under different compared with other methods. The detection results for weak and extremely weak targets are illustrated in Figure 14c,d. Under the condition, the proposed method achieves a detection rate of 62% for weak targets, and 28% for extremely weak targets, both representing significant improvements compared with traditional methods. In summary, the proposed method effectively enhances the detection rate of targets across different SNR levels under low false alarm conditions (less than ).
Figure 14.
ROC curves of measured data. (a) All samples, (b) samples with an SNR greater than 12.8 dB, (c) samples with an SNR between 8.8 dB and 12.8 dB, (d) samples with an SNR less than 8.8 dB.
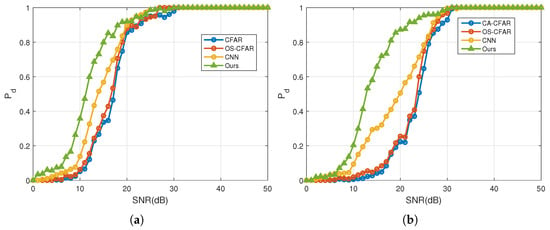
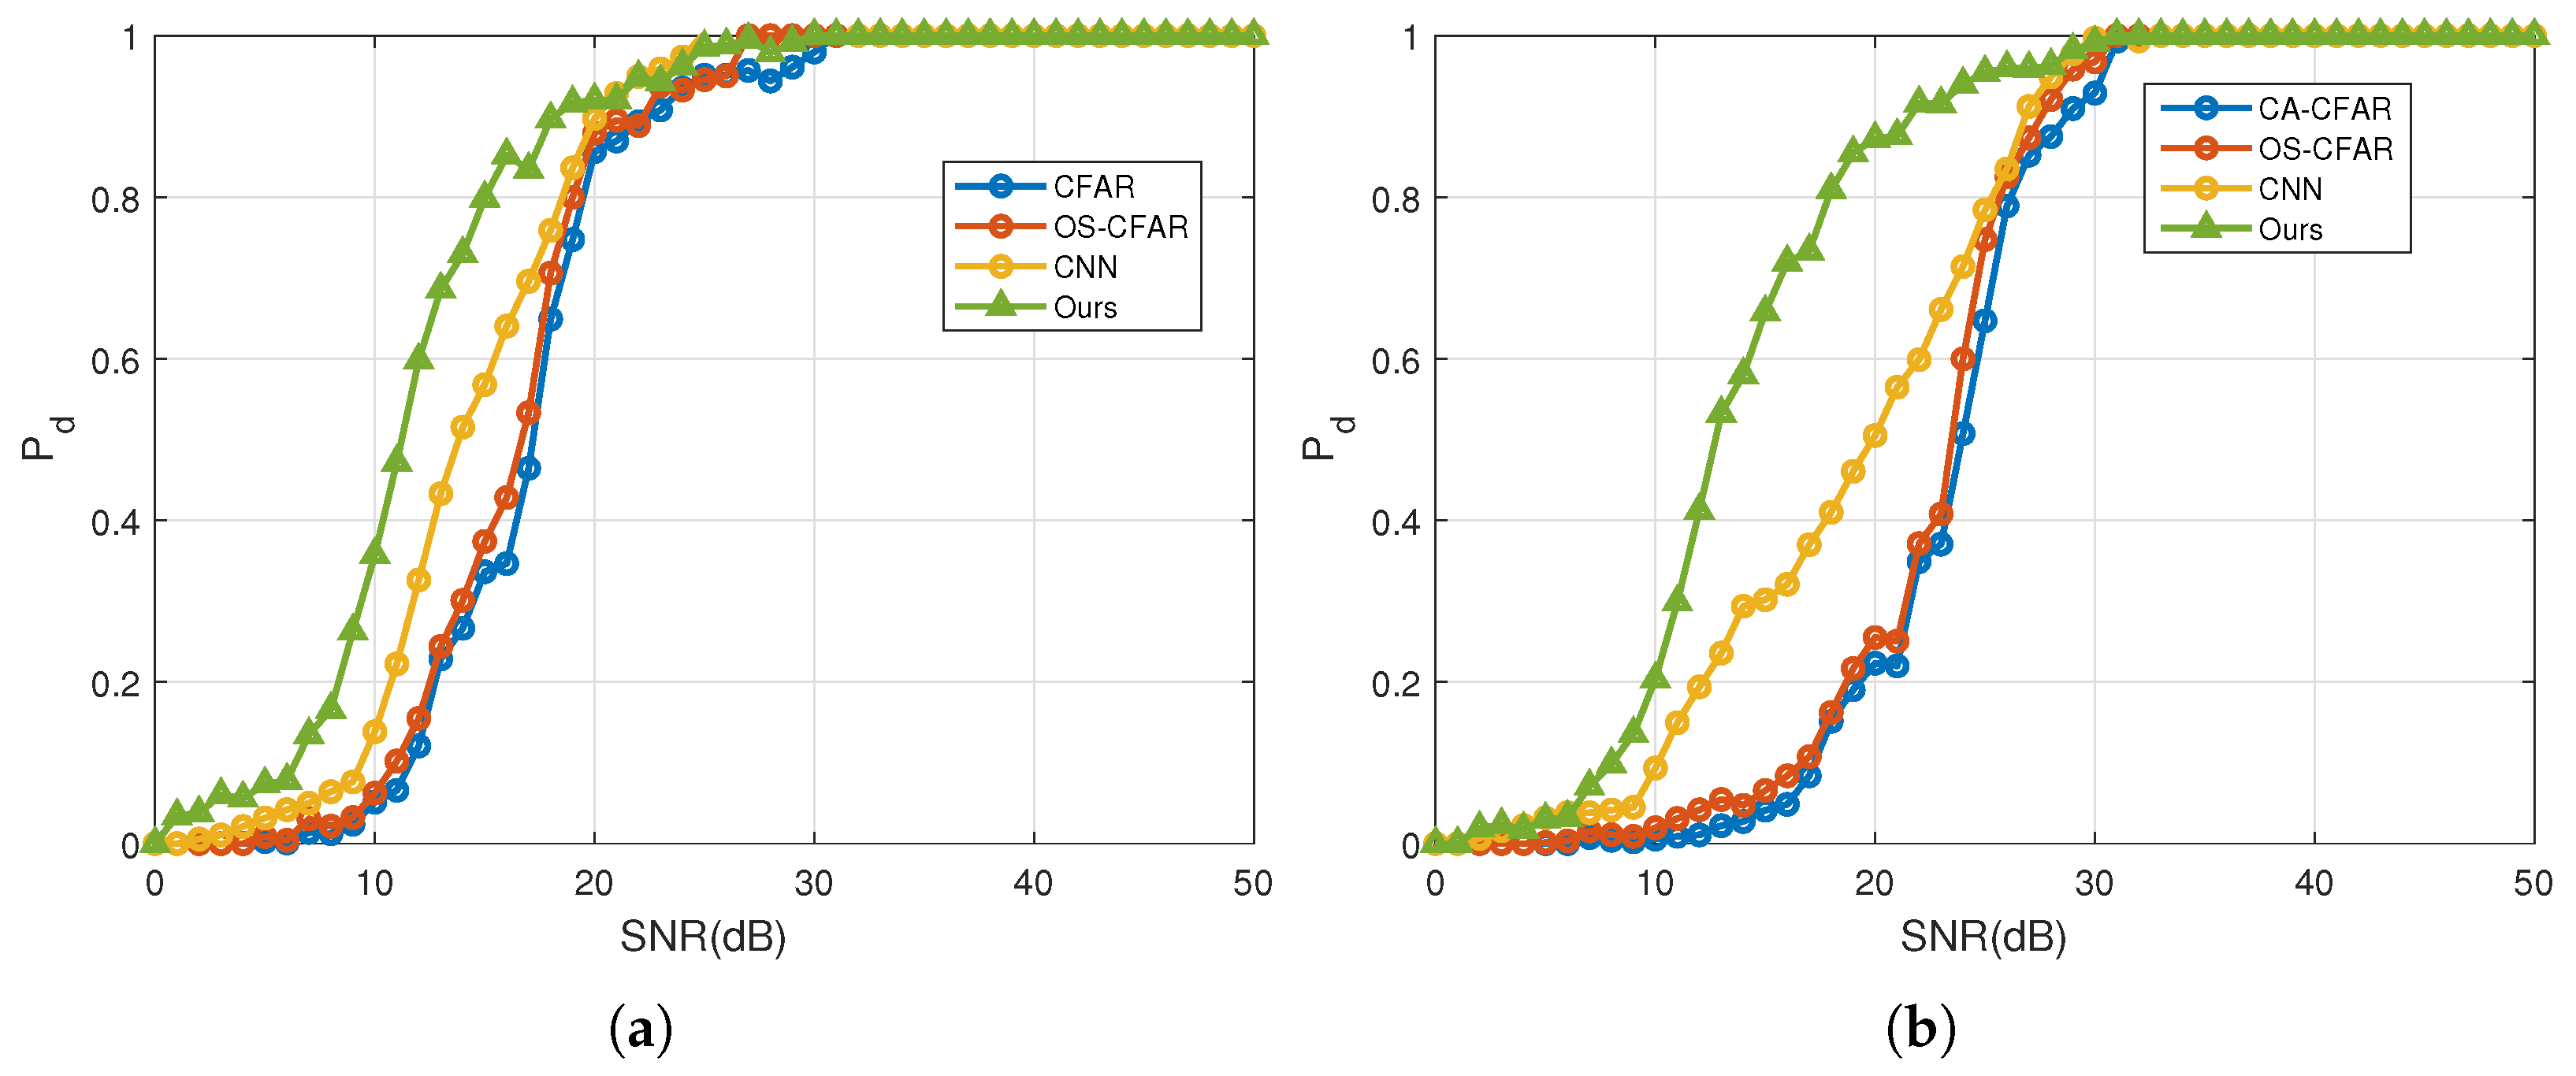
Figure 15 shows the corresponding evaluated relationship between SNR and under different in the test set. It is seen that the effectiveness of the proposed algorithm from three dimensions: Firstly, when the curves are partitioned along the horizontal axes, the proposed algorithm achieves a higher than the comparison methods under the condition of the same SNR for targets. Secondly, when the curves are partitioned along the vertical axis, the proposed algorithm is capable of detecting targets with lower SNR than the other algorithms at the same detection rate. In this case, the absolute value of the SNR difference between the two algorithms can be regarded as the SNR gain of the proposed algorithm. Thirdly, the proposed algorithm outperforms the traditional algorithm under different conditions, and the lower the false alarm rate, the more significant the advantages of the proposed algorithm become. Specifically, under the commonly used in practical applications, the SNR gain of the proposed algorithm reaches nearly 5 dB, which is equivalent to increasing the radar detection range by .
Figure 15.
Measured data comparison of under different SNR. (a) , (b) .
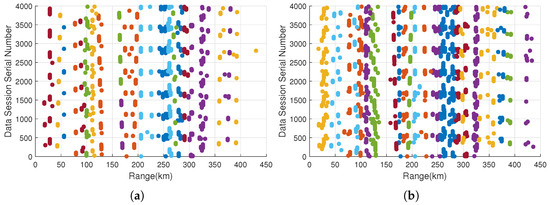
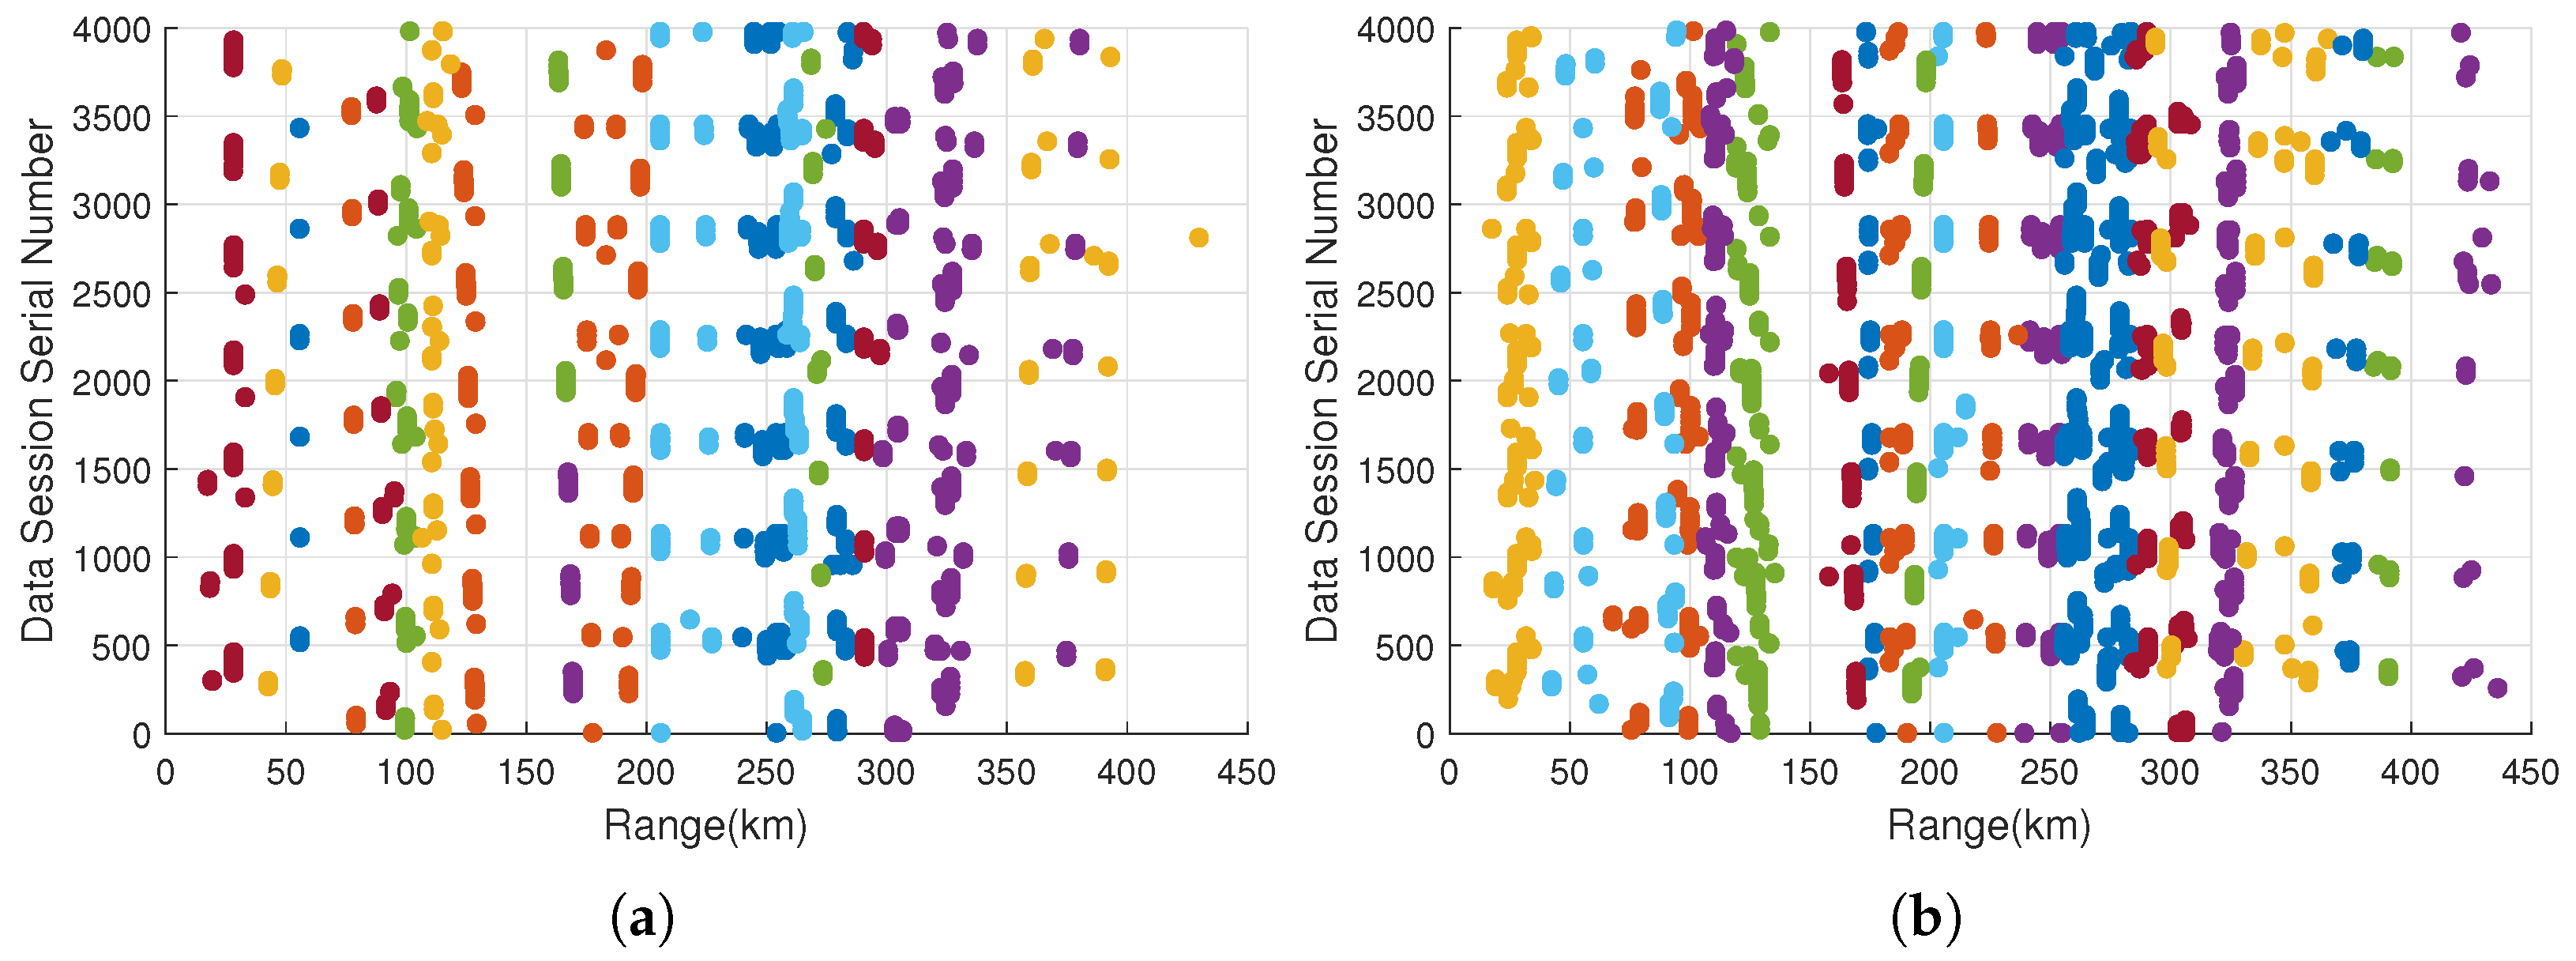
Figure 16 presents a comparison of pepper plots for detection results obtained by different methods, with the false alarm rate controlled at . In the figure, the horizontal axis represents the actual range of the detected targets, the vertical axis indicates the sample index, and different colors correspond to different trajectories. The true trajectories exhibit relative continuity across samples and change gradually over time, while spurious points appear more randomly. A comparison of Figure 16a,b shows that the proposed method produces longer and more numerous trajectories than conventional OS-CFAR detection. In particular, at dwell and beam edges, the proposed algorithm enhances the detection capability for weak targets and reduces missed detections, thereby facilitating long-term, stable, and continuous tracking of targets. Based on the track statistics in Figure 16, the proposed method effectively improves the continuity of existing tracks compared with the classic conventional OS-CFAR algorithm. Specifically, the track length of our method is approximately 10% longer than that of the traditional method. In addition, our approach generates about 4% new emerging tracks, which further reduces the target missing detection rate.
Figure 16.
Comparison of pepper plots using different methods. (a) OS-CFAR, (b) the proposed algorithm.
3.2.4. Generalization Verification of the Proposed Algorithm
To further evaluate the generalization capability of the proposed method across different datasets, data from another UHF-band radar were processed. This radar is primarily used for medium and high-altitude detection, with echoes characterized by a clean noise floor and without significant interference or clutter. However, the number of weak targets in this dataset is limited, with most targets exhibiting relatively high SNR (as shown in Table 5). A total of 7009 samples are used to construct the test set. To fully verify the model’s generalization capability across different datasets, no partial UHF samples are incorporated into the VHF samples for fine-tuning and training.
Table 5.
Statistics on the number of targets in different SNR intervals of the UHF band test set.
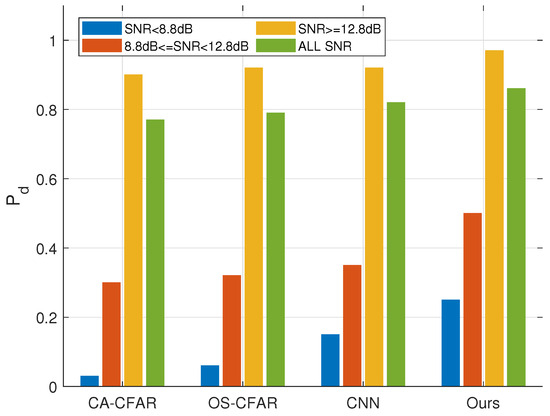
Figure 17 presents the quantitative detection performance of the network on the UHF-band radar dataset, with the false alarm rate set to . As shown in the Figure 17, compared with the CA-CFAR approach, the proposed method achieves significant improvements in detection rates for targets within the 8.8–12.8 dB interval and below 8.8 dB, with gains of 18% and 25%, respectively. These results are consistent with the performance observed on the VHF-band radar test set discussed earlier. Therefore, the network demonstrates a degree of generalization across different datasets and holds strong potential for broader applications across radars with varying waveforms and operating regimes.
Figure 17.
Performance of the algorithm on the UHF band radar dataset.
4. Discussion and Ongoing Works
4.1. Discussion
The preceding analysis has demonstrated from multiple perspectives that, under the same false alarm conditions, the proposed method achieves higher detection rates than the conventional CFAR approach, particularly in terms of weak target detection capability. Nevertheless, the proposed method also has certain limitations, primarily reflected in its insufficient performance when dealing with extremely complex backgrounds, where false alarms and missed detections may still occur.
4.1.1. False Alarms Arise Against a Cluttered Background
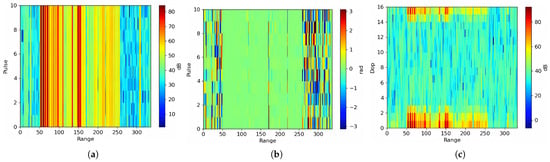
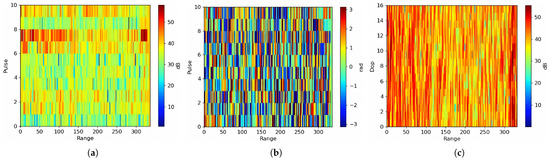
Since the VHF-band radar used for data collection in the above experiments was deployed near the coast, some dwells and beams in the echoes inevitably contained sea clutter. In such cases, the MTI preprocessing step is unable to filter out sea clutter with spectral broadening. When scenarios arise in which targets overlap with clutter, as shown in Figure 18, the network is prone to misclassifying clutter as targets, leading to false detections.
Figure 18.
Target echo in a cluttered environment. (a) Range–pulse amplitude spectrum, (b) range–pulse phase spectrum, (c) range–Doppler amplitude spectrum.
4.1.2. Missed Detection in Jamming Background
In addition, strong interference in the raw echoes can distort the amplitude and phase characteristics of the target, leading to missed detections, as illustrated in Figure 19. Analysis of the figure shows that when extremely strong interference appears across multiple pulses, the pulse continuity and amplitude–phase characteristics of the target are severely disrupted, reducing its separability from the noise floor. As a result, the main network struggles to extract meaningful target features. At the same time, under such conditions, the target energy cannot be effectively accumulated through FFT, rendering the physical constraints extracted by the branch network ineffective. Consequently, target miss detections occur.
Figure 19.
Target echo in a jamming environment. (a) Range–pulse amplitude spectrum, (b) Range–pulse phase spectrum, (c) Range–Doppler amplitude spectrum.
4.1.3. Lack of Comparative Experiments with Other Target Detection Scenarios
Due to the relative difficulty in data acquisition and the limited research efforts of the authors, the work presented in this paper takes the EWR scenario as the primary validation setting and focuses on verifying the algorithm performance within this specific scenario. Consequently, the proposed algorithm in this paper lacks comparative experiments to validate its generalization capability across other target detection scenarios.
4.1.4. Unlabelable Weak Targets Below the Detection Threshold
All weak targets in the dataset of this paper are acquired after CFAR detection with a low threshold. Nevertheless, a small number of weak targets still cannot pass the CFAR detection threshold and thus lack corresponding label information. Such unlabeled samples may degrade the network performance to a certain extent. The specific quantitative results remain to be further investigated and analyzed in future work.
4.1.5. Latency Analysis of Algorithm Implementation in the Complete Radar System
Since the proposed algorithm has not been implemented and validated on the full radar system, only offline inference verification is completed with an inference latency of 2 ms. Its real-time computational performance on the system CPU board remains to be further analyzed. For comparison, the TBD algorithm with four-frame echo non-coherent integration has been deployed on our complete radar system, yielding a computational latency of around 27 ms. This indicates that the TBD algorithm is difficult to be effectively applied in radar systems with short dwell time. In theory, the proposed algorithm achieves much lower computational latency and outperforms the TBD method, possessing better generalization performance and broader applicability.
4.2. Ongoing Works
Ongoing work is necessary to optimize the method and facilitate its application, including the following aspects:
4.2.1. Optimizing Algorithm Effectiveness in Jamming and Clutter Scenarios
To address the aforementioned issues, future research will focus on clutter and interference suppression, with the aim of designing specialized network architectures capable of eliminating interference and clutter from radar echoes. Once clutter and interference are effectively mitigated, the proposed method can then be applied in a cascaded manner to achieve robust target detection under more complex and challenging electromagnetic environments.
4.2.2. Adapt and Extend the Proposed Method to Research on Other Modalities
The method proposed in this paper is not only applicable to EWR, but also to all pulse Doppler radars based on the LFMCW system. Its generalization performance on radars for other applications and in other modalities is one of the research directions for future work.
4.2.3. Integrated Research on Target Detection and Parameter Estimation
In addition, target detection and parameter estimation are two critical components of stable target tracking. Merely improving weak target detection capability without optimizing angle estimation for weak targets cannot yield a qualitative leap in radar performance. Therefore, future research will focus on the challenges posed by low SNR in weak targets and the poor angle estimation accuracy of conventional algorithms, aiming to enhance weak target angle estimation through deep learning approaches.
5. Conclusions
Conventional early-warning radars rely on CFAR algorithms for target detection. However, when detecting low-SNR targets with long ranges and small RCS (such as high-speed missiles and stealth aircraft), CFAR struggles to maintain a controlled false alarm rate while achieving effective detection in complex environments with interference and clutter. To address this challenge, this paper introduces a deep learning-based approach and proposes a weak target detection method that integrates frequency-domain physical constraints with time-domain amplitude–phase features. The method is developed using multi-pulse radar echo data and employs a dual-branch collaborative network. The main network is designed to exploit the time-domain amplitude–phase characteristics of weak targets, while the auxiliary branch extracts explicit frequency-domain physical constraint features. The two branches are fused through an attention mechanism to enhance the network’s representational capability for weak targets.
A series of comparative experiments was conducted from multiple perspectives. The results demonstrate that, under the same false alarm rate, the proposed method achieves significantly higher detection performance for weak targets than the traditional CFAR algorithm. Specifically, in cluttered and interference environments with the false alarm rate controlled at , the network achieves detection rates of 93% for targets with SNR above 12.8 dB, 56% for targets within the 8.8–12.8 dB range, and 25% for targets below 8.8 dB. Compared with conventional CFAR, these correspond to improvements of 6%, 38%, and 21%, respectively. Statistical results of measured data show that when the false alarm rate ranges from to , the SNR gain of the proposed method in this paper reaches 2–5 dB, with a remarkable performance improvement.
Author Contributions
Methodology, Y.N., S.M., K.J. and B.W.; validation, S.M., K.J. and B.W.; writing—original draft, Y.N.; writing—review and editing, S.M., K.J., B.W. and D.Y. All authors have read and agreed to the published version of the manuscript.
Funding
This work was supported by the Research and Application Demonstration Project of Key Technologies for Safeguarding of Container Vessels in Ningbo Zhoushan Port Based on Intelligent Navigation (ZJHG-FW-2024-27).
Institutional Review Board Statement
Not applicable.
Informed Consent Statement
Not applicable.
Data Availability Statement
The raw data supporting the conclusions of this article will be made available by the authors on request.
Acknowledgments
We thank the editor and the anonymous reviewers for their constructive suggestions.
Conflicts of Interest
Authors Mr. Shengbo Ma and Dr. Kai Jing are employed by the company Aerospace Nanhu Electronic Information Technology Co., Ltd., Jingzhou, China. Additionally, author Mr. Dongxiao Yang is employed by the company Ningbo Dagang Pilot Co., Ltd., Ningbo, China. The remaining authors declare that the research was conducted in the absence of any commercial or financial relationships that could be construed as a potential conflict of interest.
References
- Lacomme, P.; Hardange, J.P.; Marchais, J.C.; Normant, E. Air and Spaceborne Radar Systems: An Introduction; CRC Press/William Andrew: Boca Raton, FL, USA, 2001. [Google Scholar]
- Hou, D.; Qi, Z.F.; Jiang, T.; Zhu, M.P. Effectiveness evaluation method for warning radar in jamming environment. In Proceedings of the 2018 Chinese Control And Decision Conference, Shenyang, China, 9–11 June 2018; pp. 1755–1760. [Google Scholar]
- Wu, J.Q. Advanced Metric Wave Radar; Springer: Hefei, China, 2020. [Google Scholar]
- Richards, M.A.; Scheer, J.A.; Holm, W.A. Principles of Modern Radar: Basic Principles; SciTech Publishing: Ralegin, NC, USA, 2010. [Google Scholar]
- Luo, Q.; Wang, Y.F. Early warning radar clutter suppression and dim moving target detection algorithm. J. Beijing Univ. Technol. 2012, 38, 369–373. [Google Scholar]
- Hm, F. Adaptive detection mode with threshold control as a function of spatially sampled clutter-level estimates. Rca Rev. 1968, 29, 414–465. [Google Scholar]
- Kronauge, M.; Rohling, H. Fast two-dimensional cfar procedure. IEEE Trans. Aerosp. Electron. Syst. 2013, 49, 1817–1823. [Google Scholar] [CrossRef] [Scilit]
- Blake, S. Os-cfar theory for multiple targets and nonuniform clutter. IEEE Trans. Aerosp. Electron. Syst. 1988, 24, 785–790. [Google Scholar] [CrossRef] [Scilit]
- Qin, T.C.; Wang, Z.X.; Huang, Y.; Xie, Z. Adaptive cfar detector based on ca/go/os three-dimensional fusion. In Proceedings of the 15th International Conference on Singal Processing Systems, Xi’an, China, 17–19 November 2023; pp. 302–310. [Google Scholar]
- Yang, Z.Q.; Zhou, H.; Tian, Y.W.; Zhao, J.R. Improved cfar detection and direction finding on time–frequency plane with high-frequency radar. IEEE Geosci. Remote Sens. Lett. 2021, 19, 3505005. [Google Scholar] [CrossRef] [Scilit]
- Lu, B.; Wen, B.Y.; Tian, Y.W.; Wang, R.K. A vessel detection method using compact-array HF radar. IEEE Geosci. Remote Sens. Lett. 2017, 14, 2017–2021. [Google Scholar] [CrossRef] [Scilit]
- Yi, W.; Jiang, H.C.; Kirubarajan, T.; Kong, L.J.; Yang, X.B. Track-before-detect strategies for radar detection in G0-distributed clutter. IEEE Trans. Aerosp. Electron. Syst. 2017, 53, 2516–2533. [Google Scholar] [CrossRef] [Scilit]
- Yan, B.; Paolini, E.; Xu, L.P.; Lu, H.M. A target detection and tracking method for multiple radar systems. IEEE Trans. Geosci. Remote Sens. 2022, 60, 5114721. [Google Scholar] [CrossRef] [Scilit]
- Qin, S.Q.; Ding, J.S.; Wen, L.W.; Jiang, M. Joint track-before-detect algorithm for high-maneuvering target indication in video SAR. IEEE J. Sel. Top. Appl. Earth Obs. Remote Sens. 2021, 14, 8236–8248. [Google Scholar] [CrossRef] [Scilit]
- Morelande, M.R.; Kreucher, C.M.; Kastella, K. A Bayesian approach to multiple target detection and tracking. IEEE Trans. Signal Process. 2007, 55, 1589–1604. [Google Scholar] [CrossRef] [Scilit]
- Lehmann, F. Recursive Bayesian filtering for multitarget track-before-detect in passive radars. IEEE Trans. Aerosp. Electron. Syst. 2012, 48, 2458–2480. [Google Scholar] [CrossRef] [Scilit]
- Grossi, E.; Lops, M.; Venturino, L. A novel dynamic programming algorithm for track-before-detect in radar systems. IEEE Trans. Signal Process. 2013, 61, 2608–2619. [Google Scholar] [CrossRef] [Scilit]
- Zhang, C.; Shi, S.Z.; Gong, J.Y.; Li, R. A coherent TBD algorithm for remote sensing of weak targets using GNSS reflected signals. IEEE J. Sel. Top. Appl. Earth Obs. Remote Sens. 2024, 17, 11485–11502. [Google Scholar] [CrossRef] [Scilit]
- Tian, M.C.; Chen, Z.M.; Wang, H.F.; Liu, L.Y. An intelligent particle filter for infrared dim small target detection and tracking. IEEE Trans. Aerosp. Electron. Syst. 2022, 58, 5318–5333. [Google Scholar] [CrossRef] [Scilit]
- Kwon, J.; Kwak, N.; Yang, E.; Kim, K. Particle filter based track-before-detect method in the range-doppler domain. In Proceedings of the 2019 IEEE Radar Conference, Boston, MA, USA, 22–26 April 2019; pp. 1–5. [Google Scholar]
- Jiang, W.; Ren, Y.; Liu, Y.; Leng, J. Artificial neural networks and deep learning techniques applied to radar target detection: A review. Electronics 2022, 11, 156. [Google Scholar] [CrossRef] [Scilit]
- Wang, Y.M.; Zhao, W.J.; Wang, X.; Chen, J.H.; Li, H.Q.; Cui, G.L. Nonhomogeneous sea clutter suppression using complex-valued U-Net model. IEEE Geosci. Remote Sens. Lett. 2022, 19, 4027705. [Google Scholar] [CrossRef] [Scilit]
- Jing, H.; Cheng, Y.Q.; Wu, H.; Wang, H.Q. Radar target detection with multi-task learning in heterogeneous environment. IEEE Geosci. Remote Sens. Lett. 2022, 19, 4021405. [Google Scholar] [CrossRef] [Scilit]
- Wu, M.K.; Zhang, L.; Niu, J.; Wu, Q.J. Target detection in clutter/interference regions based on deep feature fusion for HFSWR. IEEE J. Sel. Top. Appl. Earth Obs. Remote Sens. 2021, 14, 5581–5595. [Google Scholar] [CrossRef] [Scilit]
- Huang, D.; Zhou, H.; Tian, Y.W.; Yang, Z.Q.; Huang, W.M. A Deep-Learning-Based Time-Frequency Scheme for Ship Detection Using HFSWR. IEEE J. Sel. Top. Appl. Earth Obs. Remote Sens. 2024, 18, 2718–2736. [Google Scholar] [CrossRef] [Scilit]
- Liu, N.B.; Xu, Y.N.; Tian, Y.H.; Ma, H.W.; Wen, S.L. Background classification method based on deep learning for intelligent automotive radar target detection. Future Gener. Comput. Syst. 2019, 94, 524–535. [Google Scholar] [CrossRef] [Scilit]
- Ball, J.E. Low signal-to-noise ratio radar target detection using Linear Support Vector Machines (L-SVM). In Proceedings of the 2014 IEEE Radar Conference, Cincinnati, OH, USA, 19–23 May 2014; pp. 1291–1294. [Google Scholar]
- Jiang, W.; Ren, Y.H.; Liu, Y.; Leng, J.X. A method of radar target detection based on convolutional neural network. Neural Comput. Appl. 2021, 33, 9835–9847. [Google Scholar] [CrossRef] [Scilit]
- Xie, Y.; Tang, J.; Wang, L. Radar target detection using convolutional neutral network in clutter. In Proceedings of the 2019 IEEE International Conference on Signal, Information and Data Processing, Chongqing, China, 11–13 December 2019; pp. 1–6. [Google Scholar]
- Jia, F.D.; Tan, J.H.; Lu, X.C.; Qian, J.H. Radar timing range–doppler spectral target detection based on attention ConvLSTM in traffic scenes. Remote Sens. 2023, 15, 4150. [Google Scholar] [CrossRef] [Scilit]
- Zhang, L.W.; Zhang, X.Y.; Zhang, Y.C.; Guo, Y.F.; Chen, Y.P.; Huang, X.H.; Ma, Z. Peakconv: Learning peak receptive field for radar semantic segmentation. In Proceedings of the 2023 IEEE/CVF Conference on Computer Vision and Pattern Recognition, Vancouver, BC, Canada, 18–22 June 2023; pp. 17577–17586. [Google Scholar]
- Li, H.L.; Chen, S.W. General polarimetric correlation pattern: A visualization and characterization tool for target joint-domain scattering mechanisms investigation. IEEE Trans. Geosci. Remote Sens. 2025, 64, 5200417. [Google Scholar] [CrossRef] [Scilit]
- Li, H.L.; Chen, S.W. Polyhedral corner reflectors multi-domain joint characterization with fully polarimetric radar. IEEE Trans. Antennas Propag. 2025, 73, 10679–10693. [Google Scholar] [CrossRef] [Scilit]
- Xue, W.B.; Ai, J.Q.; Zhu, Y.N.; Sun, X.Y.; Zhang, Y.; Gao, G. LMCNet: Lightweight Modality Compensation Network via Knowledge Distillation for Salient Ship Detection under Missing Modality Conditions. IEEE Trans. Aerosp. Electron. Syst. 2026, 62, 6547–6560. [Google Scholar] [CrossRef] [Scilit]
- Ai, J.Q.; Tian, R.T.; Luo, Q.W.; Jin, J.; Tang, B. Multi-scale rotation-invariant Haar-like feature integrated CNN-based ship detection algorithm of multiple-target environment in SAR imagery. IEEE Trans. Geosci. Remote Sens. 2019, 57, 10070–10087. [Google Scholar] [CrossRef] [Scilit]
- Ai, J.Q.; Mao, Y.X.; Luo, Q.W.; Jin, L.; Xing, M.D. SAR target classification using the multikernel-size feature fusion-based convolutional neural network. IEEE Trans. Geosci. Remote Sens. 2021, 60, 5214313. [Google Scholar] [CrossRef] [Scilit]
- Barrick, D.E. FM/CW Radar Signals and Digital Processing; Environmental Research Laboratories, Wave Propagation Laboratory: Boulder, CO, USA, 1973. [Google Scholar]
- Stephan, M.; Santra, A. Radar-based human target detection using deep residual u-net for smart home applications. In Proceedings of the 2019 18th IEEE International Conference on Machine Learning and Applications, Boca Raton, FL, USA, 16–19 December 2019; pp. 175–182. [Google Scholar]
- Targ, S.; Almeida, D.; Lyman, K. Resnet in resnet: Generalizing residual architectures. arXiv 2016, arXiv:1603.08029. [Google Scholar] [CrossRef] [Scilit]
- Luo, D.Q.; Zhu, J.H. Radar Target Detection in Strong Clutter Using Spatial-Temporal U-NET. In Proceedings of the 2022 32nd IEEE International Workshop on Machine Learning for Signal Processing, Xi’an, China, 22–25 August 2022; pp. 1–6. [Google Scholar]
- Wang, Y.F.; Zhang, L.X.; Song, Z.X. Complex-valued UNet for radar image segmentation. Neural Comput. Appl. 2023, 55, 8151–8162. [Google Scholar]

Disclaimer/Publisher’s Note: The statements, opinions and data contained in all publications are solely those of the individual author(s) and contributor(s) and not of MDPI and/or the editor(s). MDPI and/or the editor(s) disclaim responsibility for any injury to people or property resulting from any ideas, methods, instructions or products referred to in the content. |
© 2026 by the authors. Licensee MDPI, Basel, Switzerland. This article is an open access article distributed under the terms and conditions of the Creative Commons Attribution (CC BY) license.