


Highlights
What are the main findings?
- PG-Net, a dual-branch architecture integrating point-based and graph-based methods, achieves competitive semantic segmentation on large-scale point clouds, with an OA of 97.69% on Toronto3D and 89.87% on S3DIS, and mIoU of 83.51% and 73.22%, respectively.
- The proposed Dynamic Graph Feature Aggregation (DGFA) module explicitly models neighbor–neighbor relationships and adaptively balances self-information with contextual information, resulting in more discriminative local features, as validated by ablation studies.
What are the implications of the main findings?
- The complementary fusion of discrete point distribution features and local graph structural information provides a robust and effective paradigm for capturing fine-grained local geometry in large-scale, unevenly distributed point cloud scenes.
- The demonstrated performance gains on both outdoor (Toronto3D) and indoor (S3DIS) benchmarks, along with reduced convergence epochs, suggest strong potential for deployment in computationally constrained applications such as autonomous driving and smart city 3D reconstruction.
Abstract
LiDAR point clouds provide accurate and direct representations of spatial locations and geometric structures of objects in 3D space, making them essential for applications such as target recognition in autonomous driving and 3D reconstruction in smart cities. However, large-scale point clouds pose challenges, including massive data volume, uneven density distribution, and complex object structures. Existing point-based and graph-based semantic segmentation networks often suffer from limitations such as loss of local contextual information, over-reliance on local graph construction, and insufficient modeling of relationships between neighboring points. To address these issues, we propose PG-Net, a novel network that integrates discrete point distribution features with local graph structural information. The framework includes: (1) a point branch equipped with a Local Adaptive Feature Augmentation (LAFA) module to extract efficient local features; (2) a graph branch featuring a Dynamic Graph Feature Aggregation (DGFA) module, which explicitly models relationships among points in local graphs and adaptively balances a point’s intrinsic features with its neighborhood context; and (3) fuses local features from both branches, allowing their complementary strengths to enhance feature representation, a process further promoted by a New Aggregation Loss Function. Experiments on the Toronto3D and S3DIS datasets show that PG-Net achieves overall accuracy (OA) of 97.69% and 89.87%, and mean Intersection-over-Union (mIoU) of 83.51% and 73.22%, respectively. Comparative and ablation studies against advanced methods such as RandLA-Net, BAAF-Net, and LACV-Net demonstrate the effectiveness and robustness of our approach. By jointly exploiting discrete point distribution and local graph structural relationships, PG-Net effectively leverages the complementary strengths of its dual-branch design, offering a reliable solution for efficient and accurate large-scale point cloud semantic segmentation.
1. Introduction
Point clouds, serving as a direct and precise medium for capturing the geometric properties and spatial relationships of objects, have emerged as a predominant form of 3D data acquisition, driven by rapid advancements in 3D sensing technologies. Consequently, 3D point cloud semantic segmentation has gained significant prominence as a research field, with extensive deployments across diverse domains such as autonomous driving, smart city planning, and indoor scene reconstruction [1,2,3]. However, large-scale point clouds, particularly those from outdoor environments, are characterized by immense data volume, uneven point density, complex geometric structures, and substantial variations in object scales. These inherent characteristics pose considerable challenges for achieving both efficient and precise semantic segmentation [4]. Therefore, the development of semantic segmentation methods capable of effectively processing large-scale point clouds is of paramount importance.
In point cloud semantic segmentation tasks, the effective extraction of geometric structures and contextual information within local neighborhoods is pivotal for enhancing model performance. Point clouds are intrinsically unstructured and unordered sets of 3D coordinates. Their rich semantic information is embedded not only within the coordinates of individual points but, more profoundly, within the local geometric relationships constituted between points. Thus, a robust semantic segmentation model must possess the capability to accurately capture and encode these local features from raw point clouds, thereby distinguishing between geometrically similar yet semantically distinct objects and maintaining robustness against noise and occlusion. Current mainstream deep learning approaches for point cloud semantic segmentation can be broadly categorized into two paradigms: point-based methods and graph-based methods, which employ different strategies for modeling local features.
Point-based methods conduct feature learning directly on raw point clouds, thereby circumventing information loss associated with projection or voxelization. They demonstrate a strong capacity for accurately modeling local geometric structures, offering significant flexibility and representational power. PointNet [5] pioneered this approach by utilizing symmetric functions to handle the inherent disorder of point clouds, enabling direct processing without prior voxelization. PointNet++ [6] extended this foundation by introducing a hierarchical aggregation mechanism to model multi-scale local regions, allowing the network to capture contextual information more effectively. As seminal works, PointNet and PointNet++ have inspired numerous subsequent architectures, such as PointCNN, PointMLP, and PointNeXt. PointCNN introduced the X-Conv operator to explicitly aggregate features from local neighborhoods, addressing PointNet’s limitations in local feature extraction [7]. PointMLP simplified the architecture by eschewing the complex geometric transformations and convolutions of PointNet++, constructing an efficient network based purely on residual MLPs [8]. PointNeXt enhanced PointNet++’s performance through refined training and scaling strategies, alongside architectural improvements like inverted residual bottlenecks and separable MLPs [9]. RandLA-Net significantly reduced computational cost via random sampling and incorporated a local feature aggregation module to compensate for the resultant information loss, making it highly suitable for large-scale segmentation [10]. More recent works like NeiEA-Net and FA-ResNet further enhanced the perception of fine-grained features through sophisticated local feature aggregation or enhancement strategies [11,12]. DG-Net integrates dual neighborhood features (geometric and semantic) with a global spatial-aware module to explicitly capture long-range contextual dependencies, thereby enriching local feature representations in large-scale scenes [13]. Recently, transformer-based architectures have been introduced to point cloud processing, such as Point Transformer and its enhanced version Point Transformer V3, which achieve strong performance with efficient designs [14,15]. Despite their effectiveness in extracting local features, these point-based methods often fail to explicitly leverage the topological relationships between points, which can lead to the loss of subtle local structures and contextual information.
Graph-based methods fundamentally model unstructured point clouds as graph structures, where nodes represent points and edges represent relationships between them. This formulation enables Graph Neural Networks (GNNs) to perform feature propagation and aggregation, thereby explicitly exploiting topological relationships and geometric structures. Early work like DGCNN enhanced the model’s capacity to learn local geometry by constructing dynamic graphs and applying EdgeConv operations to extract edge features within local neighborhoods [16]. SPG improved semantic consistency and computational efficiency in large-scale scenes by partitioning point clouds into superpoints and performing inference on the resultant graph structure [17]. Point-GNN utilized a fixed-radius nearest-neighbor graph for efficient encoding, incorporating an auto-registration mechanism to reduce translation variance and employing box merging and scoring for object detection [18]. Inspired by attention mechanisms, recent graph-based approaches have incorporated related strategies. For instance, PointGCR employed channel self-attention to learn cross-channel feature similarities, constructed an initial channel graph, and updated it by learning node dependencies and propagating relational information [19]. PU-GACNet dynamically combined spatial and feature attributes by assigning different attention weights [20]. AGConv generated deformable, adaptive kernels based on dynamically learned features to enhance local convolution flexibility [21]. Recently, ASGFormer incorporates adaptive graph structures into Transformers to better model structural relationships in complex scenes [22]. These graph-based methods explicitly capture the intrinsic geometric structure of point clouds through local graph construction and graph convolution, strengthening local feature representation. However, their performance is highly dependent on the quality of the constructed local graphs. In point clouds with uneven density or significant noise, local graphs may form unreasonable connections, introducing ambiguity during feature aggregation. Furthermore, these methods typically focus on feature extraction centered on the central point of the local graph, often overlooking the relationships between the neighboring points themselves.
Several recent works have explored dual-branch or multi-branch fusion strategies to combine complementary representations. For instance, MVPNet fuses multi-scale voxel features with point features via a geometric self-attention module, achieving strong performance on urban scenes [23]. VPA-Net employs a dual-branch structure that integrates visual appearance from RGB images with LiDAR point clouds through a feature fusion attention module [24]. In the semi-supervised setting, a heterogeneous dual-branch consistency learning framework has been proposed, where a deep student network and a shallow-but-wide teacher network enforce prediction-level and feature-level consistency [25]. Recently, ASGFormer incorporates graph structural priors into a Transformer architecture to segment adherent objects [22]; however, it remains a single-stream network rather than a dual-branch design. These methods have demonstrated the benefits of multi-branch or graph-enhanced fusion in various contexts. To the best of our knowledge, however, no existing work has combined a point-based branch and a graph-based branch into a dual-branch architecture specifically for point cloud semantic segmentation.
To address the limitations outlined above and synergistically combine the strengths of both point-based and graph-based paradigms, we propose PG-Net (Point-Graph Network), a novel architecture for large-scale LiDAR point cloud semantic segmentation that integrates discrete point distribution features with local graph structural information. Our contributions are threefold:
(1) We propose a dual-branch network, PG-Net, which integrates point-based and graph-based methods. This design aims to leverage their complementary strengths, resulting in more powerful local feature representations and enabling efficient semantic segmentation of large-scale point clouds.
(2) We design a novel Dynamic Graph Feature Aggregation (DGFA) module. This module explicitly models the relationships between neighboring points within local graphs and adaptively adjusts the balance between a point’s intrinsic features and the aggregated contextual information from its neighborhood, yielding more discriminative local features.
(3) We introduce a New Aggregation Loss Function specifically tailored for PG-Net’s dual-branch structure. This loss constrains the feature extraction processes in both branches, encouraging the network to learn more complementary feature representations and ultimately improving the final segmentation performance.
2. Materials and Methods
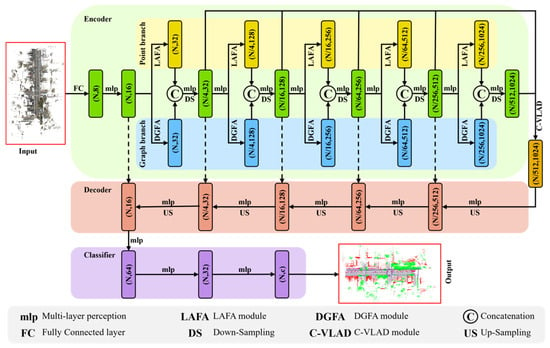
We propose PG-Net (Point-Graph Network), a dual-branch architecture that integrates point-based and graph-based methods, specifically designed for large-scale point cloud semantic segmentation. As illustrated in Figure 1, PG-Net extends the LACV-Net framework [26] by introducing a parallel graph branch alongside the original point branch. The point branch employs the LAFA module, which mitigates “local perception ambiguity”. The LAFA module consists of two units: a Local Information Encoding (LIE) unit, which encodes spatial, color, and semantic differences between the centroid and its neighbors; and an Adaptive Augmentation (AA) unit, which computes a similarity matrix from these differences, generates adaptive weights via softmax, and aggregates features using sum-pooling and max-pooling. This allows the centroid to focus on similar neighbors, producing more discriminative representations. The graph branch is built upon our DGFA module, which explicitly models higher-order “neighbor–neighbor” relationships and adaptively balances self-features with contextual information via dynamic feature fusion. Their fusion enables the network to simultaneously exploit point-wise distribution features and graph-level structural features. We retain the Comprehensive Vector of Locally Aggregated Descriptors (C-VLAD) module from LACV-Net to capture global contextual information. Furthermore, to accommodate the dual-branch structure, we have designed a New Aggregation Loss Function. The following subsections detail the dual-branch architecture, the proposed DGFA module, and the New Aggregation Loss Function.
Figure 1.
The proposed network architecture.
2.1. PG-Net’s Dual-Branch Structure
The proposed network follows a dual encoder–decoder architecture, depicted in Figure 1. An input point cloud of dimension (excluding the batch dimension) into PG-Net, where is the number of points and is the initial feature dimension, which is first passed through a fully connected layer to produce features of dimension . This feature set is then fed into the first encoding layer, where a multi-layer perceptron (mlp) operation transforms it into features of dimension . These features are subsequently processed in parallel by the point branch (via the LAFA module) and the graph branch (via the DGFA module), each producing enhanced local features of dimension . The outputs from both branches are then concatenated. The concatenated features undergo a further mlp operation followed by down-sampling, resulting in local feature data of dimension , which serves as the output of the first encoding layer and the input to the next. The encoder comprises five such encoding layers. A C-VLAD module, positioned between the encoder and decoder, aggregates local features from all preceding encoding layers to form a comprehensive global representation [26]. The decoder consists of five corresponding decoding layers, each involving up-sampling and mlp operations. Skip connections concatenate the features from each decoding layer with the features from the corresponding encoding layer at the same resolution. Finally, the classifier, composed of three fully connected layers, performs semantic segmentation, with the category for each point determined by the highest score.
2.2. Dynamic Graph Feature Aggregation Module
As previously discussed, the accuracy of point cloud semantic segmentation relies heavily on the network’s ability to model local geometric structures. In large-scale complex scenes, boundaries between semantic categories are often defined by subtle geometric differences. Therefore, fully exploiting structural information within local neighborhoods is crucial. To leverage the respective strengths of point-based and graph-based methods while enabling higher-order interactions between neighbors, we propose the Dynamic Graph Feature Aggregation (DGFA) module. This module constitutes the graph branch, working in parallel with the point branch (based on LAFA). By extracting local features from these two different perspectives and then combining them, our approach achieves a more comprehensive understanding of local geometry, thereby enhancing segmentation accuracy.
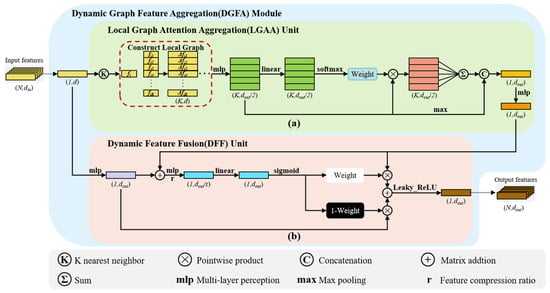
The DGFA module consists of two core components: (1) the Local Graph Attention Aggregation (LGAA) unit, responsible for aggregating neighbor features on the local graph structure, and (2) the Dynamic Feature Fusion (DFF) unit, which adaptively fuses the aggregated neighborhood features with the central point’s own features. The workflow of the DGFA module is illustrated in Figure 2. First, the central point features are fed into the LGAA unit to extract local graph features. These local graph features, along with the original central point features, are then input into the DFF unit for dynamic fusion, ultimately producing the output local features.
Figure 2.
Dynamic Graph Feature Aggregation Module architecture. (a) Local Graph Attention Aggregation (LGAA) Unit; (b) Dynamic Feature Fusion (DFF) Unit.
Compared with mainstream graph convolution operators EdgeConv and AGConv, the proposed DGFA module has two fundamental differences: (1) Neighborhood modeling: EdgeConv and AGConv only consider first-order centroid–neighbor relations, while DGFA explicitly constructs a neighbor–neighbor correlation matrix via matrix multiplication to capture higher-order topological information; (2) Feature fusion: EdgeConv and AGConv use residual connections or static concatenation, whereas DGFA generates channel-wise dynamic weights from feature information to adaptively balance self-features and contextual information. Table 1 summarizes the differences.
Table 1.
Comparison between the DGFA module and mainstream graph convolution operators.
2.2.1. Local Graph Attention Aggregation Unit
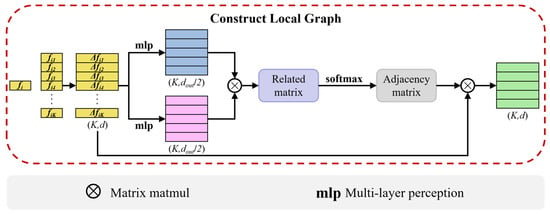
The Local Graph Attention Aggregation (LGAA) unit, depicted in Figure 2a, is responsible for constructing the local graph and aggregating features through an attention mechanism. Since the point branch of PG-Net already utilizes spatial coordinates and color information, the graph branch relies solely on the point feature information to avoid processing redundant information and high computational cost. We utilize KNN to obtain the feature of neighboring points. It should be noted that KNN is computed in feature space using the Euclidean distance as the distance metric. At each encoding layer, the KNN is dynamically recomputed based on the current point features of that layer. Then, a local graph is constructed from the feature set , where is the feature of the central point, is the feature of the k-th neighbor point, is the number of central points, is the number of neighbors, and is the number of feature channels. Here, and represent the vertex set and edge set, respectively.
As shown in Figure 3, the feature differences between each neighbor point and the central point are computed to obtain the local feature difference set . The calculation formula is as follows:
Figure 3.
Constructing a local graph.
To explicitly encode relationships between neighboring points and achieve higher-order “neighbor–neighbor” interactions, two distinct mlp operations are applied to . The resulting high-dimensional features are then multiplied via matrix multiplication to produce the correlation matrix , which represents the high-dimensional spatial relationships between neighbors. The calculation formula is as follows:
where mlp denotes a multi-layer perceptron, and denotes matrix multiplication.
The correlation matrix is then normalized along the neighbor dimension using the softmax function to generate the adjacency matrix , which further refines the relationships between points in the local graph and satisfies permutation invariance. The calculation formula is as follows:
Finally, the adjacency matrix is multiplied by the feature difference via matrix multiplication to construct the local graph features . The calculation formula is as follows:
Subsequently, learnable attention weights are used to adaptively aggregate . First, an mlp non-linearly maps to a higher-dimensional feature space, yielding intermediate features . A linear transformation then converts into a self-correlation weight matrix , which is normalized via softmax to produce the adaptive attention weights . The calculation formulas are as follows:
where L denotes the linear transformation function.
Subsequently, we obtain the weighted intermediate features by multiplying the adaptive attention weight W with the intermediate features . The calculation formula is as follows:
In order to aggregate and obtain even richer local graph features, we perform a sum-pooling operation on the weighted intermediate features to derive local graph features that reflect the overall contextual information of the local region. Simultaneously, we perform a max-pooling operation on the intermediate features to obtain local graph features that reflect the most salient information within the local region. Finally, these two types of local graph features are concatenated, and an mlp operation is applied to produce the local graph features output by the LGAA unit. The calculation formula is as follows:
where denotes the concatenation operation along the feature channels.
2.2.2. Dynamic Feature Fusion Unit
To prevent the loss or corruption of existing important information during the feature extraction process, mainstream deep learning networks, after obtaining locally aggregated features, typically employ residual connections to fuse the central point’s own features with the locally aggregated features by adding them together [10,26,27]. This static fusion strategy cannot adaptively adjust the proportion of “self-information” to “contextual information” based on local geometric differences or semantic requirements. This may lead to over-reliance on unreliable neighbors in sparse or noisy regions, amplifying artifacts; whereas, at strongly discriminative corners or edges, the intrinsic features may be averaged out, resulting in loss of detail. In order to dynamically fuse the local aggregation features obtained by the LGAA unit with the central point’s own features, enabling the local features output by the DGFA module to possess stronger discriminative power, we have designed a targeted Dynamic Feature Fusion (DFF) unit. This unit generates a set of dynamic weights ranging from 0 to 1 for each feature channel, performing a dynamic fusion of the locally aggregated features and the self-features, thereby achieving an adaptive adjustment of the proportion of “self-information” and “contextual information”.
As shown in Figure 2b, first, we perform an mlp operation on the initially input central point feature to obtain the self-feature , which has the same dimension as the output of the LGAA unit. Then, the local graph feature and the self-feature are added together for fusion along the feature channel dimension. An mlp is used to perform a feature channel compression operation on the fused features, followed by the use of a linear transformation function for feature channel excitation to restore the number of channels, resulting in the dynamic weight prior matrix . The calculation formulas are as follows:
where denotes a two-layer fully connected network, where r is the feature channel compression ratio, defined such that the output channel count is 1/r of the input channel count, and indicates the addition operation along the feature channels.
The sigmoid function is used to normalize each feature channel of the dynamic weight prior matrix , obtaining the dynamic weight . The calculation formula is as follows:
We utilize the dynamic weight and its complementary weight to multiply the local graph feature and the self-feature respectively, obtaining the two dynamically weighted features. Then, these two features are added together for fusion along the feature channel dimension. Finally, the fused features are processed using the Leaky_ReLU activation function to obtain the final output local feature , the negative slope of the Leaky_ReLU activation is set to 0.1. The calculation formula is as follows:
2.3. New Aggregation Loss Function
The loss function in point cloud semantic segmentation tasks is used to measure the discrepancy between the predicted label of each point by the model and its ground truth label, thereby assessing the accuracy of the model. For example, the weighted cross-entropy loss adjusts the loss calculation by assigning different weights to different categories. It is commonly used to address class imbalance problems, ensuring that minority classes receive sufficient attention during training and preventing the model from being biased towards the majority classes. Its calculation formulas are as follows:
where is the total number of points in the point cloud, is the number of categories in the segmentation task, is the number of points belonging to category , and the vectors and represent the ground truth label and the predicted label for category , respectively.
LACV-Net regards the adaptively weighted local features as a form of feature offset and introduces a constraint loss to more accurately characterize the influence of local neighborhood points on the central point. Through regularization, this loss prompts the shifted neighborhood features to converge towards the central point [26]. Then, the constraint loss was combined with the weighted cross-entropy loss to form an Aggregation Loss Function.
However, the PG-Net we propose is a dual-encoder network, whereas the original Aggregation Loss Function only acts on the point branch, resulting in the weights of the graph branch remaining unconstrained. Therefore, based on the network architecture of PG-Net, we have proposed a new constraint function . This new constraint function is then combined with the weighted cross-entropy loss to obtain a New Aggregation Loss Function . This function constrains the feature extraction processes of the two branches in PG-Net, prompting the network to learn more complementary feature representations, thereby enhancing the final segmentation performance. Their calculation formulas are as shown below:
where is the central point feature, is the feature of the neighboring points. and are the adaptive weight and the local information encoding of the point branch, respectively. is the weighted intermediate feature output from the graph branch. is the number of encoder layers. denotes the multiplication of corresponding elements in two matrices. denotes the concatenation operation along the feature channels. mlp denotes a multi-layer perceptron.
The constraint term in Equation (16) encourages the two branches to learn residual information between the centroid and its neighbors from different perspectives. Specifically, the point branch contribution focuses on locally adaptive weighting, while the graph branch contribution emphasizes the aggregation of higher-order neighbor relationships. The two contributions are concatenated along the channel dimension, so the loss requires each branch to converge toward the centroid feature independently, but allows them to learn different residual representations. The cross-entropy term provides semantic supervision, and the constraint term supplies a structural prior to facilitate complementary learning between the two branches, thereby improving semantic segmentation accuracy.
3. Results
In this chapter, we present the experimental results of the proposed method PG-Net in large-scale point cloud semantic segmentation tasks, demonstrating the effectiveness of the proposed method. The datasets used in our experiments include the Toronto3D [28] large-scale outdoor dataset and the S3DIS [29] large-scale indoor dataset. Subsequently, ablation studies are conducted on the two branches within PG-Net and on the components within the graph branch.
3.1. Experimental Details
To quantitatively analyze the performance of PG-Net, we adopt Intersection over Union (IoU), mean Intersection over Union (mIoU), and Overall Accuracy (OA) as the evaluation metrics. It should be noted that in the multi-class semantic segmentation task, IoU is computed on a per-category basis: for each semantic category, we first count the true positives (TP), false positives (FP), and false negatives (FN) for that category, and then compute the IoU for that category. The mIoU is then the arithmetic mean of IoU over all categories. The OA is the sum of correctly classified points across all categories divided by the total number of points. The corresponding formulas are as follows:
where denotes the number of true positives (instances where the ground truth is true and the prediction is also true); denotes the number of false positives (instances where the ground truth is false and the prediction is true); denotes the number of false negatives (instances where the ground truth is true and the prediction is false); is the number of categories in the segmentation task; is the total number of sample points in the point cloud.
During data preprocessing, each raw point cloud scene is first grid-subsampled with a voxel size of 0.06 m (Toronto3D) or 0.04 m (S3DIS) to obtain a manageable point set. A KD-tree is then constructed on the subsampled points for efficient spatial queries. RGB values are normalized to [0, 1] during this preprocessing step. During training, to ensure balanced coverage of the entire scene, we adopt a spatially regular sampling strategy: each point is assigned a probability that increases when the point is selected, and the center of each training block is chosen at the location with the current minimum probability. This prevents overfitting to dense regions and ensures adequate coverage of sparse areas. During the training process, PG-Net uses a fixed number of points per batch: 10 × 4096 = 40,960 points (40,960 points are randomly sampled from the raw point cloud for each iteration). The batch size is set to 4, and the number of training epochs is 100. We use the Adam optimizer with hyperparameters β1 = 0.9, β2 = 0.999, ε = 1 × 10⁻⁸, and weight decay = 0. The learning rate is initially set to 0.01 and decays by a factor of 0.98 per epoch. Data augmentation is applied sequentially during training: random rotation around the Z-axis (angle range from −180° to 180°), random scaling (scale factor range from 0.8 to 1.2), and random point dropout (dropout rate 0.05) to simulate occlusions and noise in real-world data. No augmentation is applied during testing. When color information is used, the network transforms both the coordinate information and the color information into features via a Fully Connected layer and an mlp, and then feeds these features into the point branch and the graph branch, respectively. Furthermore, all experiments were conducted on a computing cloud platform with a CPU of 15 vCPU Intel® Xeon® Platinum 8358P CPU @ 2.60 GHz and a GPU of NVIDIA RTX3090 24 GB.
3.2. Experimental Dataset
3.2.1. Toronto3D Dataset
The Toronto3D dataset [28] was collected along roads in Toronto, Canada, spanning approximately 1 km. It is divided into 4 distinct areas, with each area covering about 250 m, totaling over 78.3 million 3D points and containing 8 semantic labels. To maintain consistency, we followed the partitioning of training and test sets recommended by the authors: Area 2 is used for testing, while the remaining three areas are used for training.
3.2.2. S3DIS Dataset
The Stanford Large-Scale 3D Indoor Spaces (S3DIS) dataset [29] was collected using a Matterport scanner (Matterport Corporation, Sunnyvale, CA, USA, https://matterport.com/) and includes 272 rooms across six large areas. Each point in the dataset contains coordinate (XYZ) and color (RGB) information, encompassing a total of 13 semantic labels. We employed the widely accepted 6-fold cross-validation to thoroughly evaluate the segmentation performance. Specifically, one area is used for testing, while the remaining five areas are used for training, and this process is repeated until all areas within S3DIS have been used for testing.
3.3. Experimental Results
3.3.1. Results of Toronto3D Dataset
Table 2 shows the quantitative evaluation results of PG-Net compared with other advanced methods on the Toronto3D dataset. To maintain a fair comparison, we conducted two sets of experiments. In the first set, we removed the color information and compared our results with methods that also did not use color information; the best result for each evaluation metric is marked in blue font. In the second set, we used color information and compared our results with methods that utilized color information; the best result for each evaluation metric is marked in red font. Our experimental results indicate that when using color information, PG-Net achieves an OA of 97.69% and an mIoU of 83.51%, surpassing other methods. Compared to the classical RandLA-Net, the OA and mIoU are higher by 3.32% and 1.74%, respectively. Compared to the baseline network LACV-Net, the OA and mIoU are also improved by 0.29% and 0.81%, respectively. Moreover, under the same experimental conditions, PG-Net achieves a larger improvement margin. Among the eight object categories, the IoU for four categories exceeded that of other methods. Specifically, PG-Net achieves the highest IoU in Road, Road marking, Car, and Fence. These four classes share a common characteristic: their accurate segmentation heavily depends on precise local geometric boundaries and fine-scale structural continuity. This is precisely what the dual-branch architecture of PG-Net is designed to strengthen—the point branch captures detailed point-distribution features, while the graph branch explicitly models neighbor–neighbor relationships, thereby preserving thin structures and coherent boundaries. In contrast, PG-Net does not lead in Vegetation, Building, Utility line, and Pole. These categories often exhibit highly irregular, textureless surfaces (Natural, Building) or extreme sparsity with vertical discontinuity (Utility line, Pole), and the current fixed KNN graph and simple concatenation-based fusion strategy still have room for improvement in handling such challenging distributions. Nevertheless, particularly in the segmentation of cars and fences, PG-Net performed exceptionally well, achieving IoUs of 94.88% and 51.49%, respectively, which are 1.48% and 8.18% higher than the second-best network. Furthermore, even without using color information, our PG-Net still delivered excellent performance, achieving an OA and mIoU of 96.01% and 79.39%, respectively, outperforming other advanced methods. Compared to the baseline network, the OA and mIoU improved by 0.21% and 0.89%, respectively.
Table 2.
Quantitative comparison on the Toronto3D dataset (Best results without color information are marked in blue; best results with color information are marked in red. * indicates experimental results obtained under the same environment, same input, and same parameter settings).
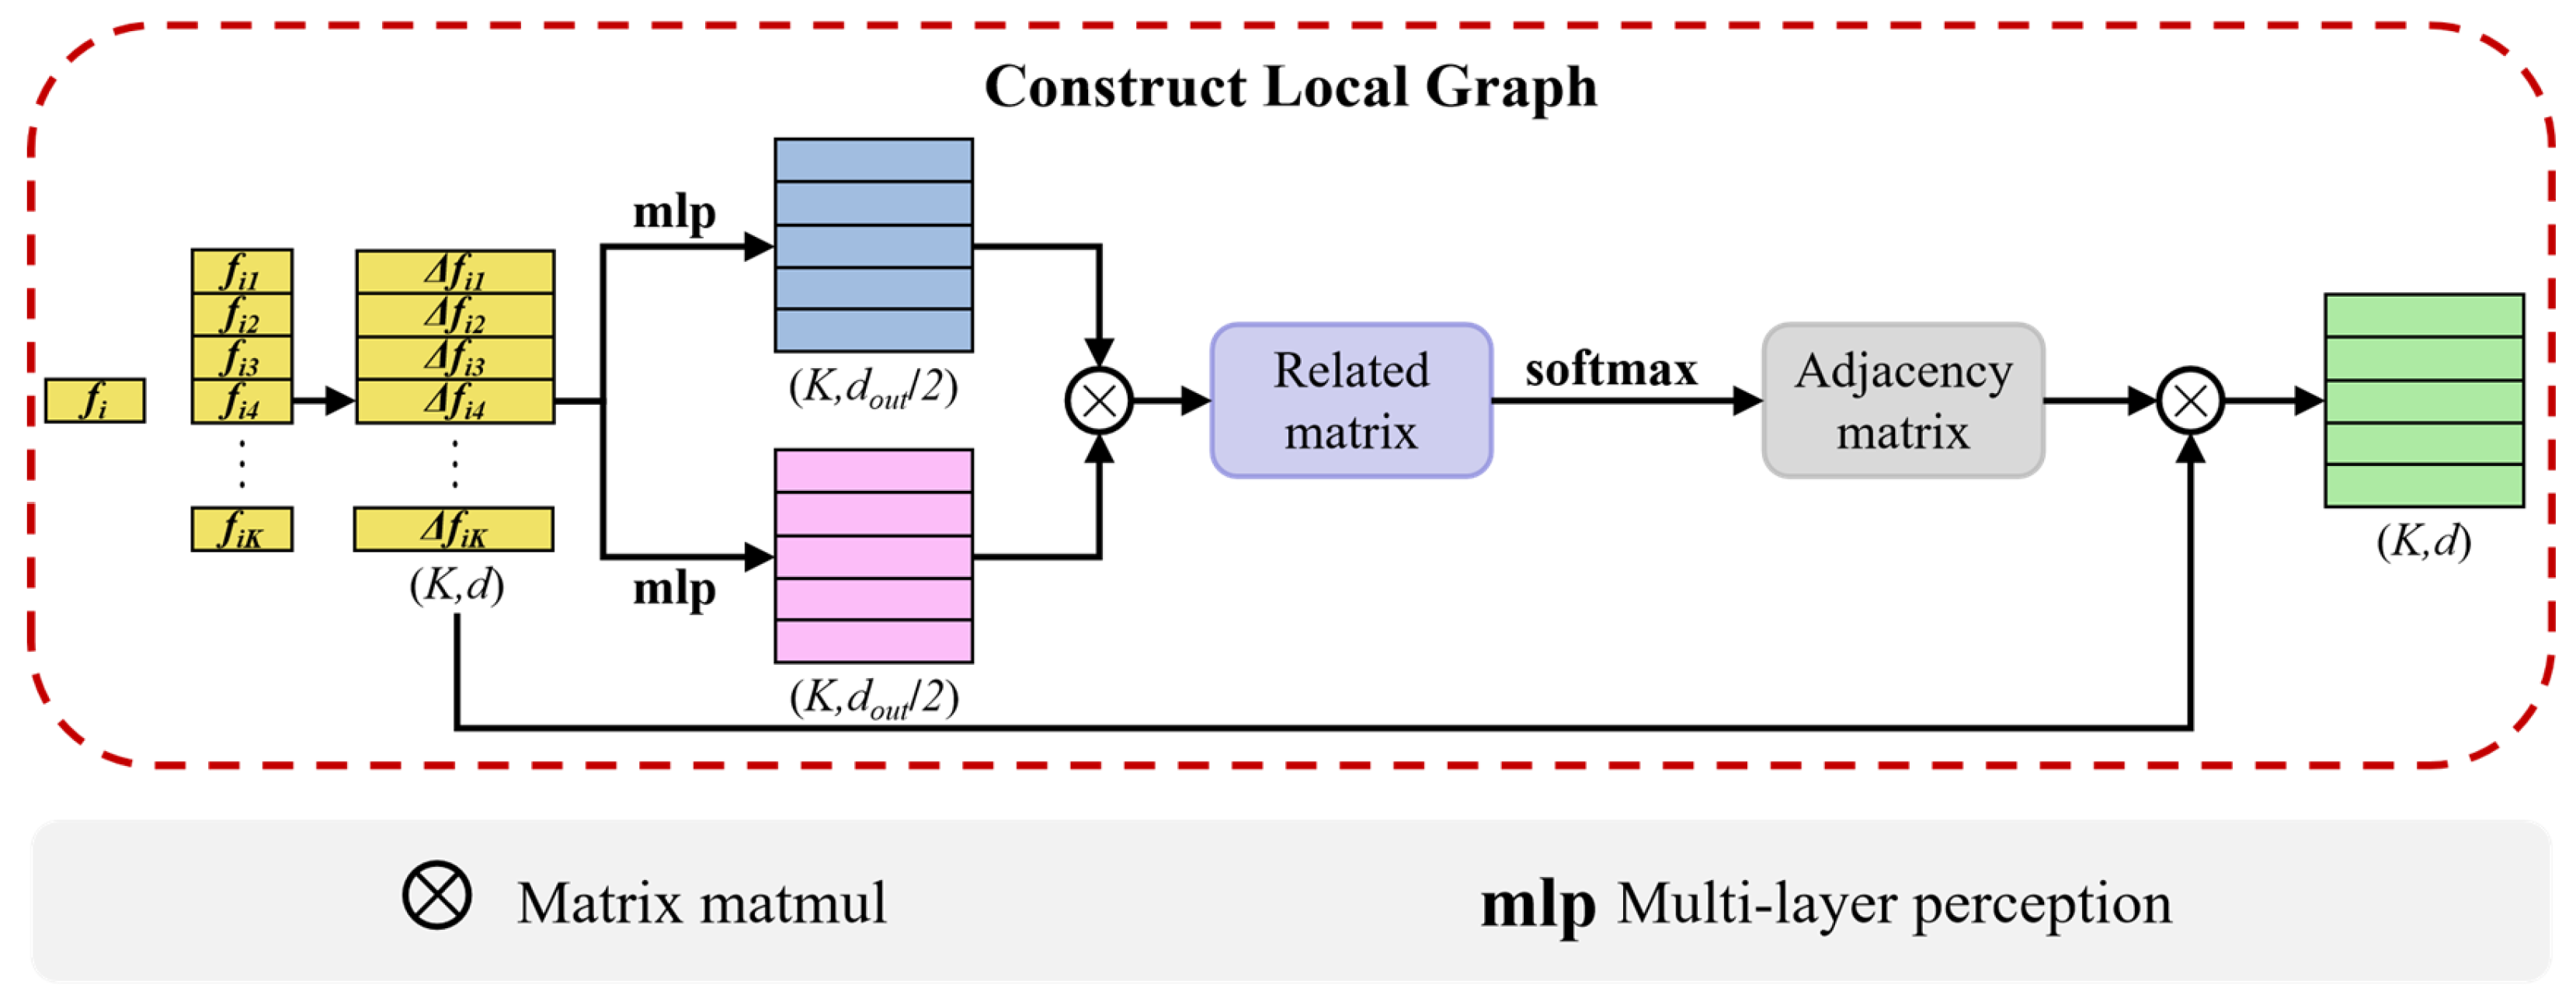
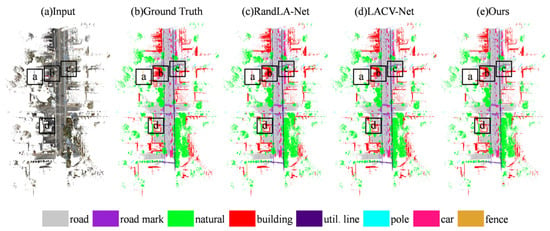
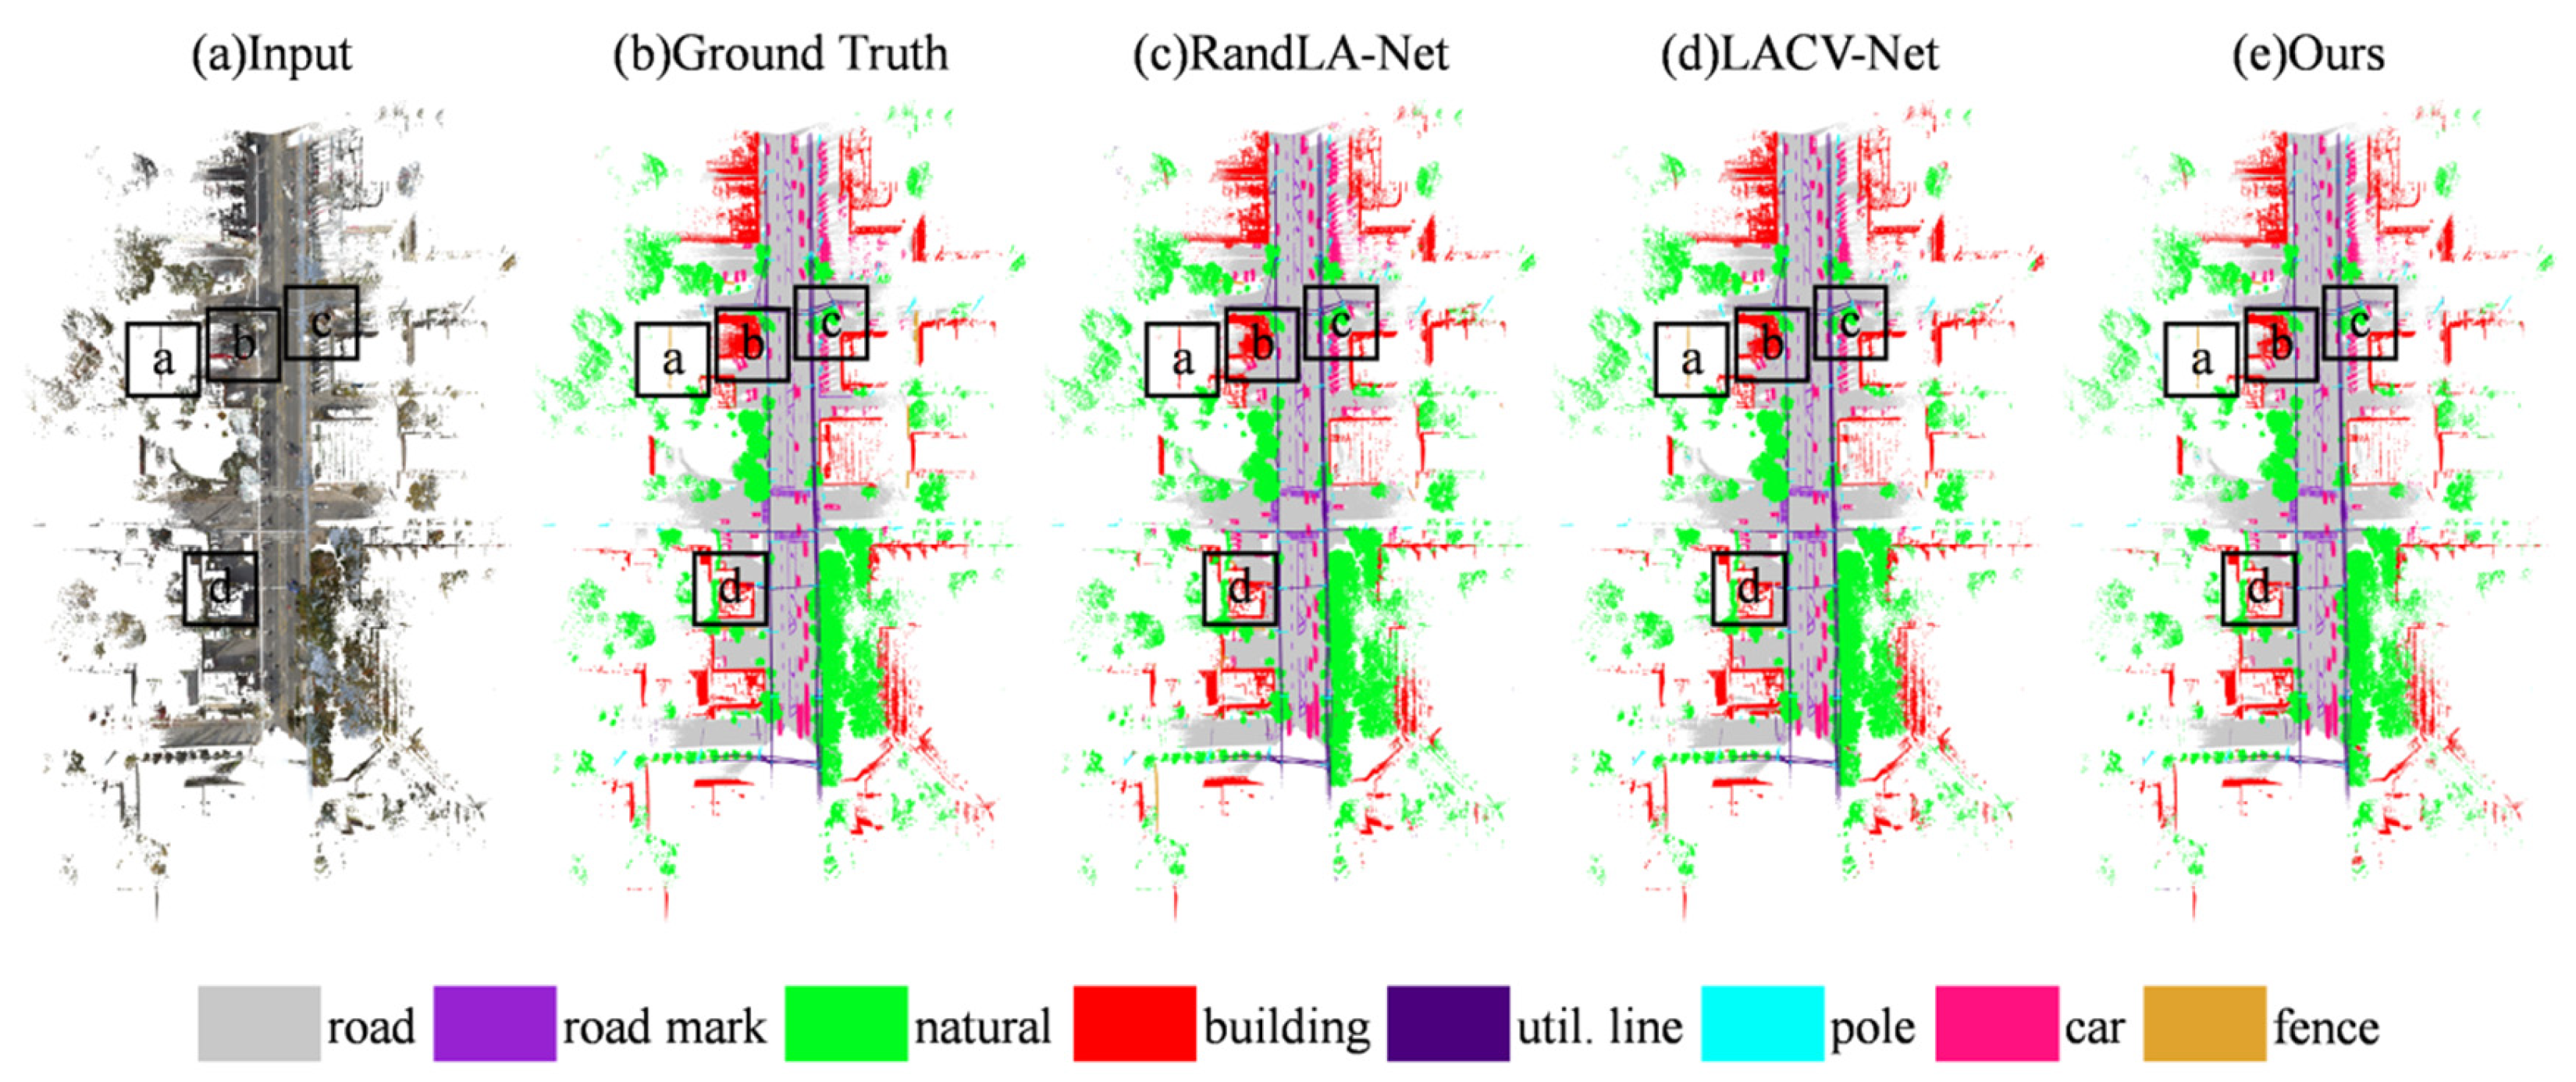
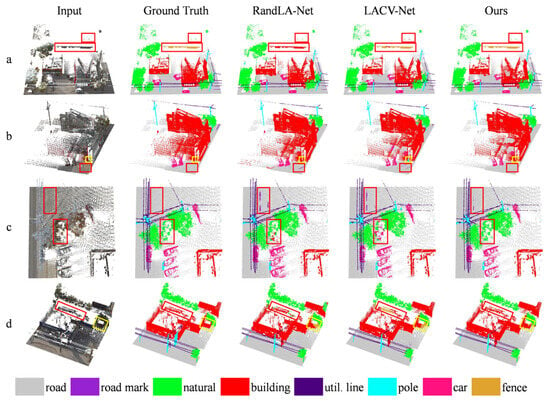
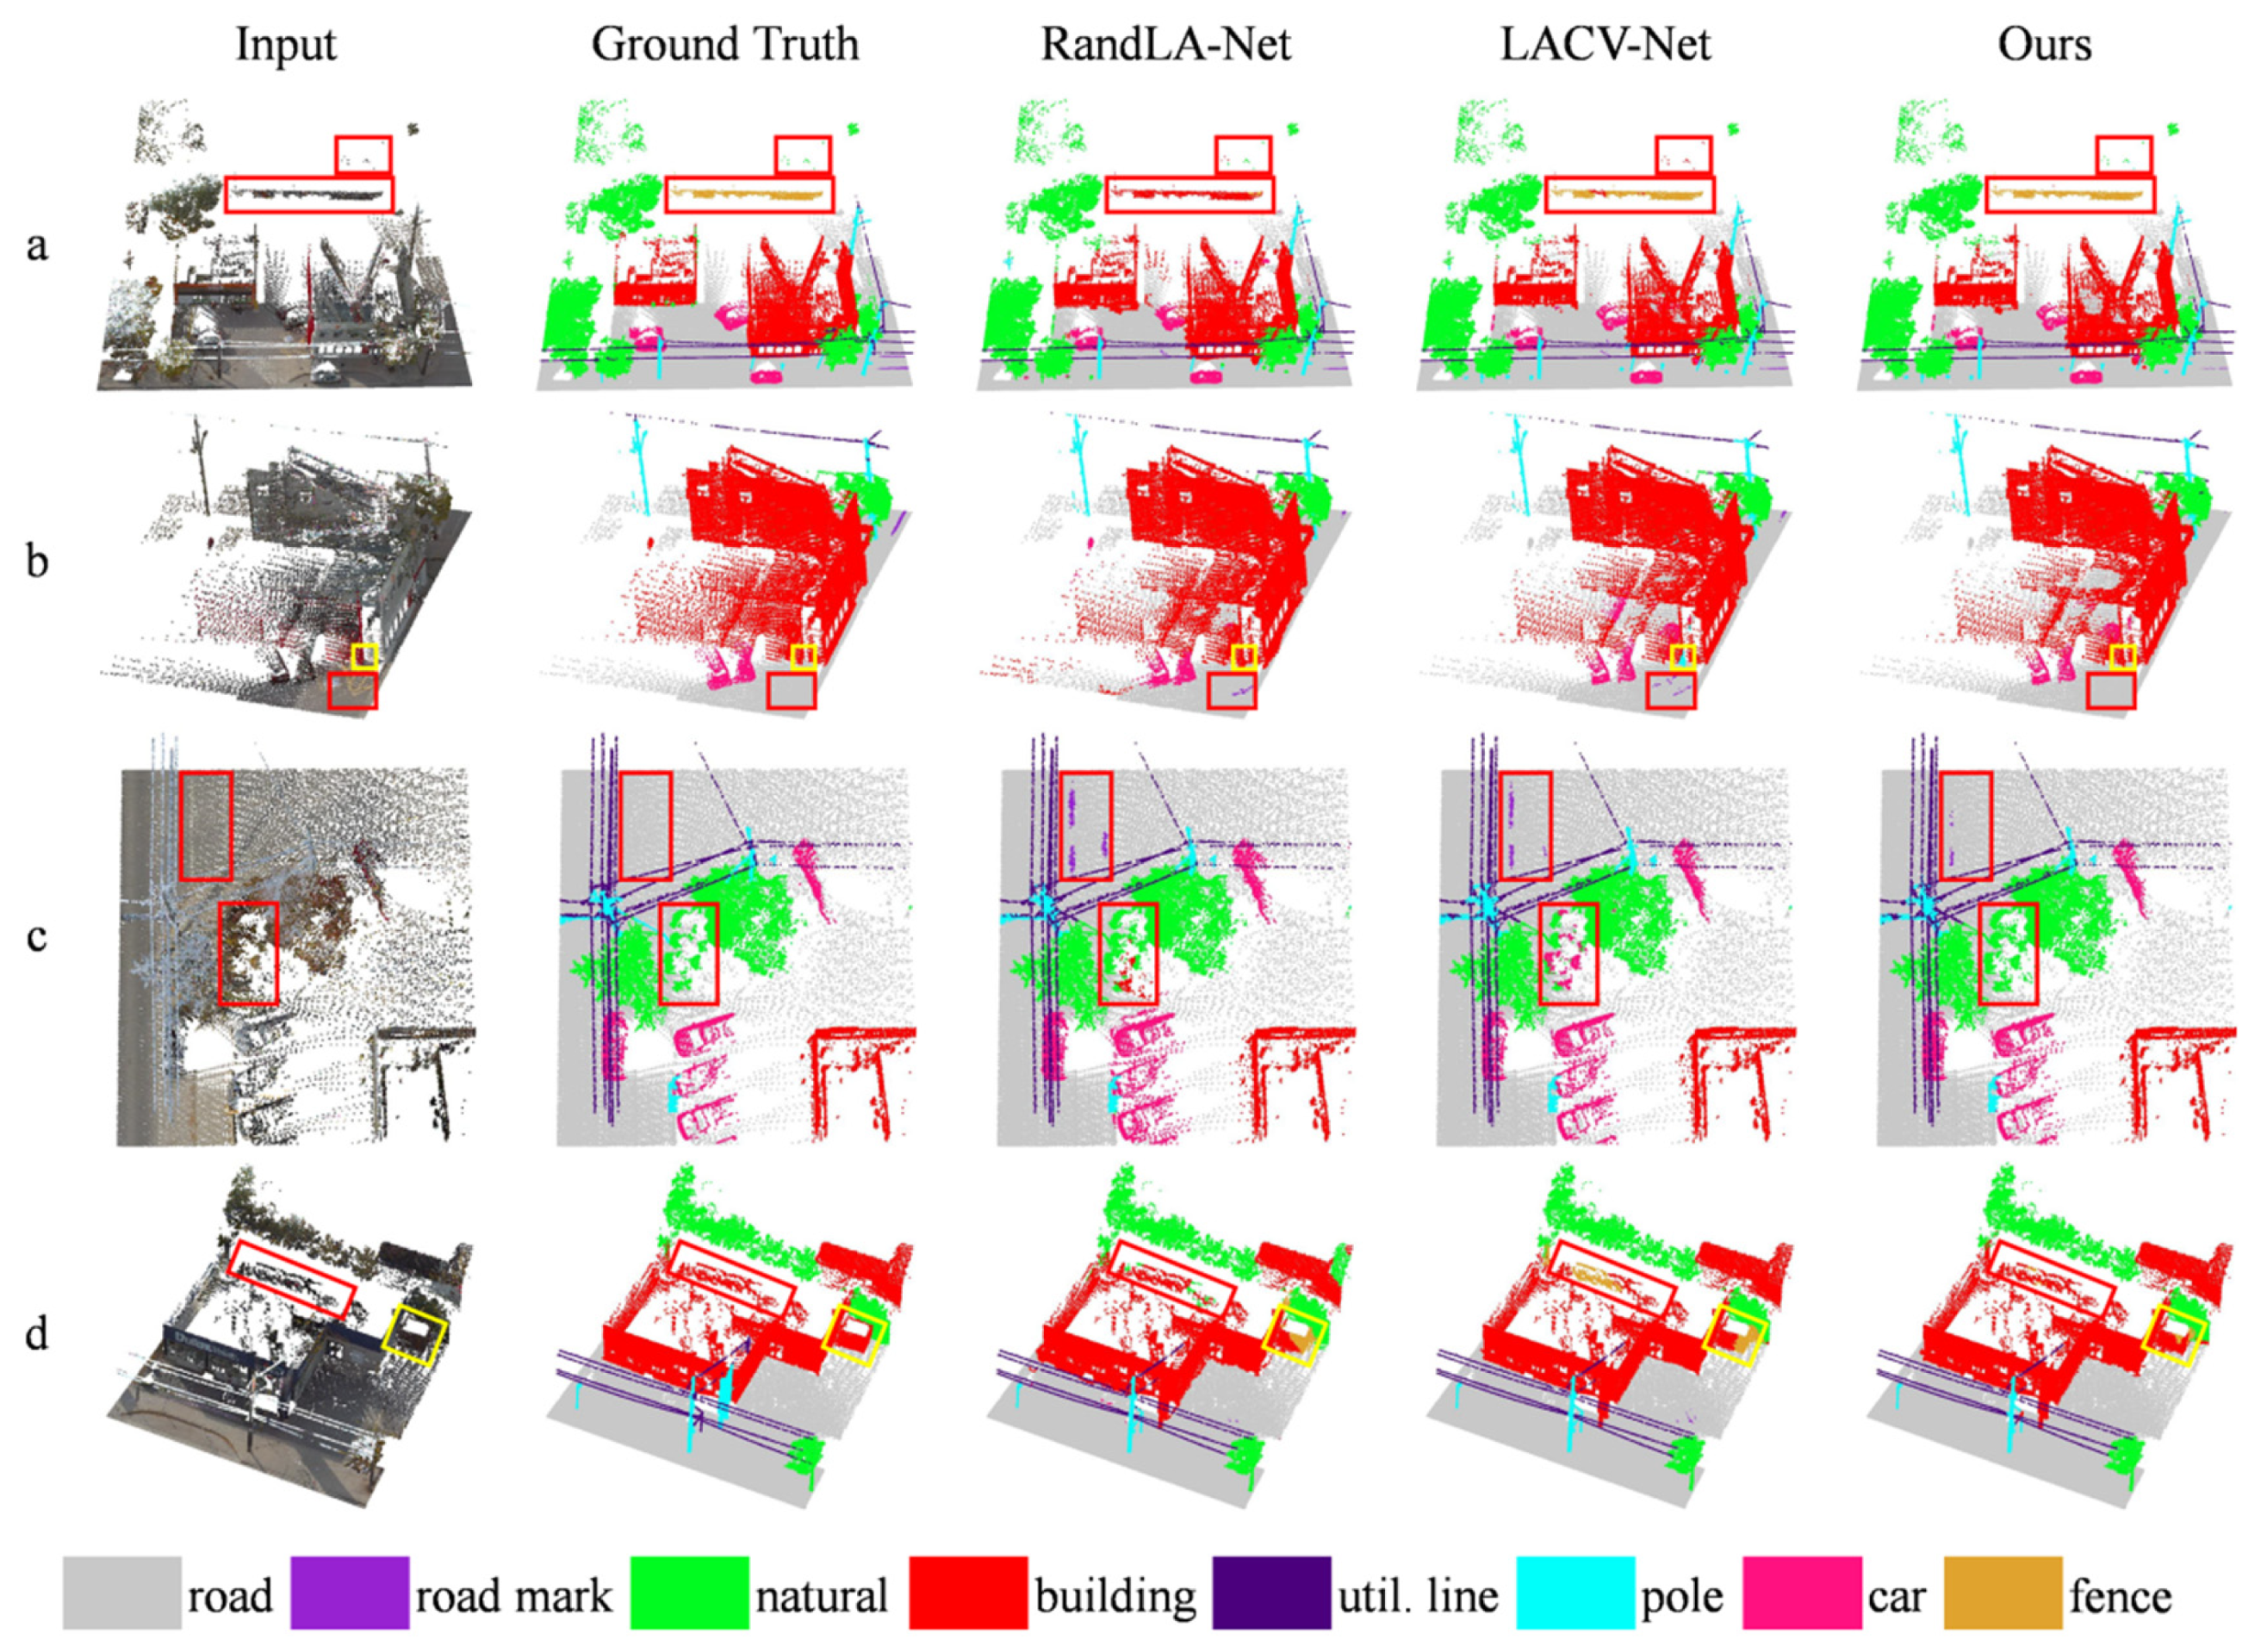
To qualitatively evaluate PG-Net against other advanced methods and provide a more intuitive comparison of the segmentation quality, we present the visualization results obtained by PG-Net, RandLA-Net, and LACV-Net using color information as the network input features, as shown in Figure 4. Additionally, we display four close-up areas, as shown in Figure 5, where red and yellow boxes highlight regions with inaccurate segmentation or unclear boundary delineation. Our experimental results demonstrate that PG-Net achieves better segmentation results. Visual evidence illustrates substantial improvements in the segmentation results, especially for objects such as cars and fences. The enhancement in the segmentation results of these objects benefits from PG-Net’s ability to acquire more powerful local feature representations through its point and graph branches, resulting in stronger segmentation capability for small objects. As shown in Figure 5d, the red box shows a sparse and irregularly distributed point cloud semantically labeled as building, mainly caused by occlusion from the building in front. RandLA-Net segmented part of the point cloud in the red box as vegetation, possibly because a large volume of point clouds semantically labeled as vegetation behind it influenced the network’s judgment. LACV-Net segmented most of the point cloud in the red box as fence, which might be due to its spatial structure being similar to a fence, leading to misclassification by the network. In contrast, our PG-Net successfully and correctly segmented all points within the red box, which is attributed to our proposed DGFA module, enhancing PG-Net’s discriminative ability for local details.
Figure 4.
Comparison of visualization results on the Toronto3D dataset: (a) represents the original RGB point cloud, (b) represents the ground truth labels, (c) represents the semantic segmentation results obtained by RandLA-Net, (d) represents the semantic segmentation results obtained by LACV-Net, (e) represents the semantic segmentation results obtained by our method, the letters (a–d) with a squre represent different experimental comparison areas, mainly for the purpose of explicitly comparing the results of various methods.
Figure 5.
Comparison of visualization results on the Toronto3D dataset, with (a–d) representing detailed views of the four semantic segmentation areas.
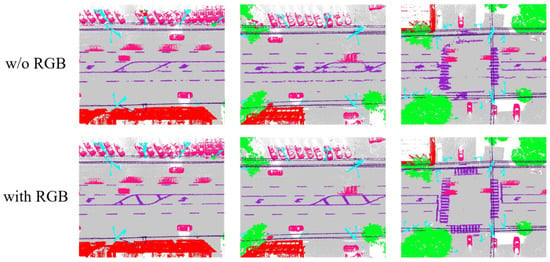
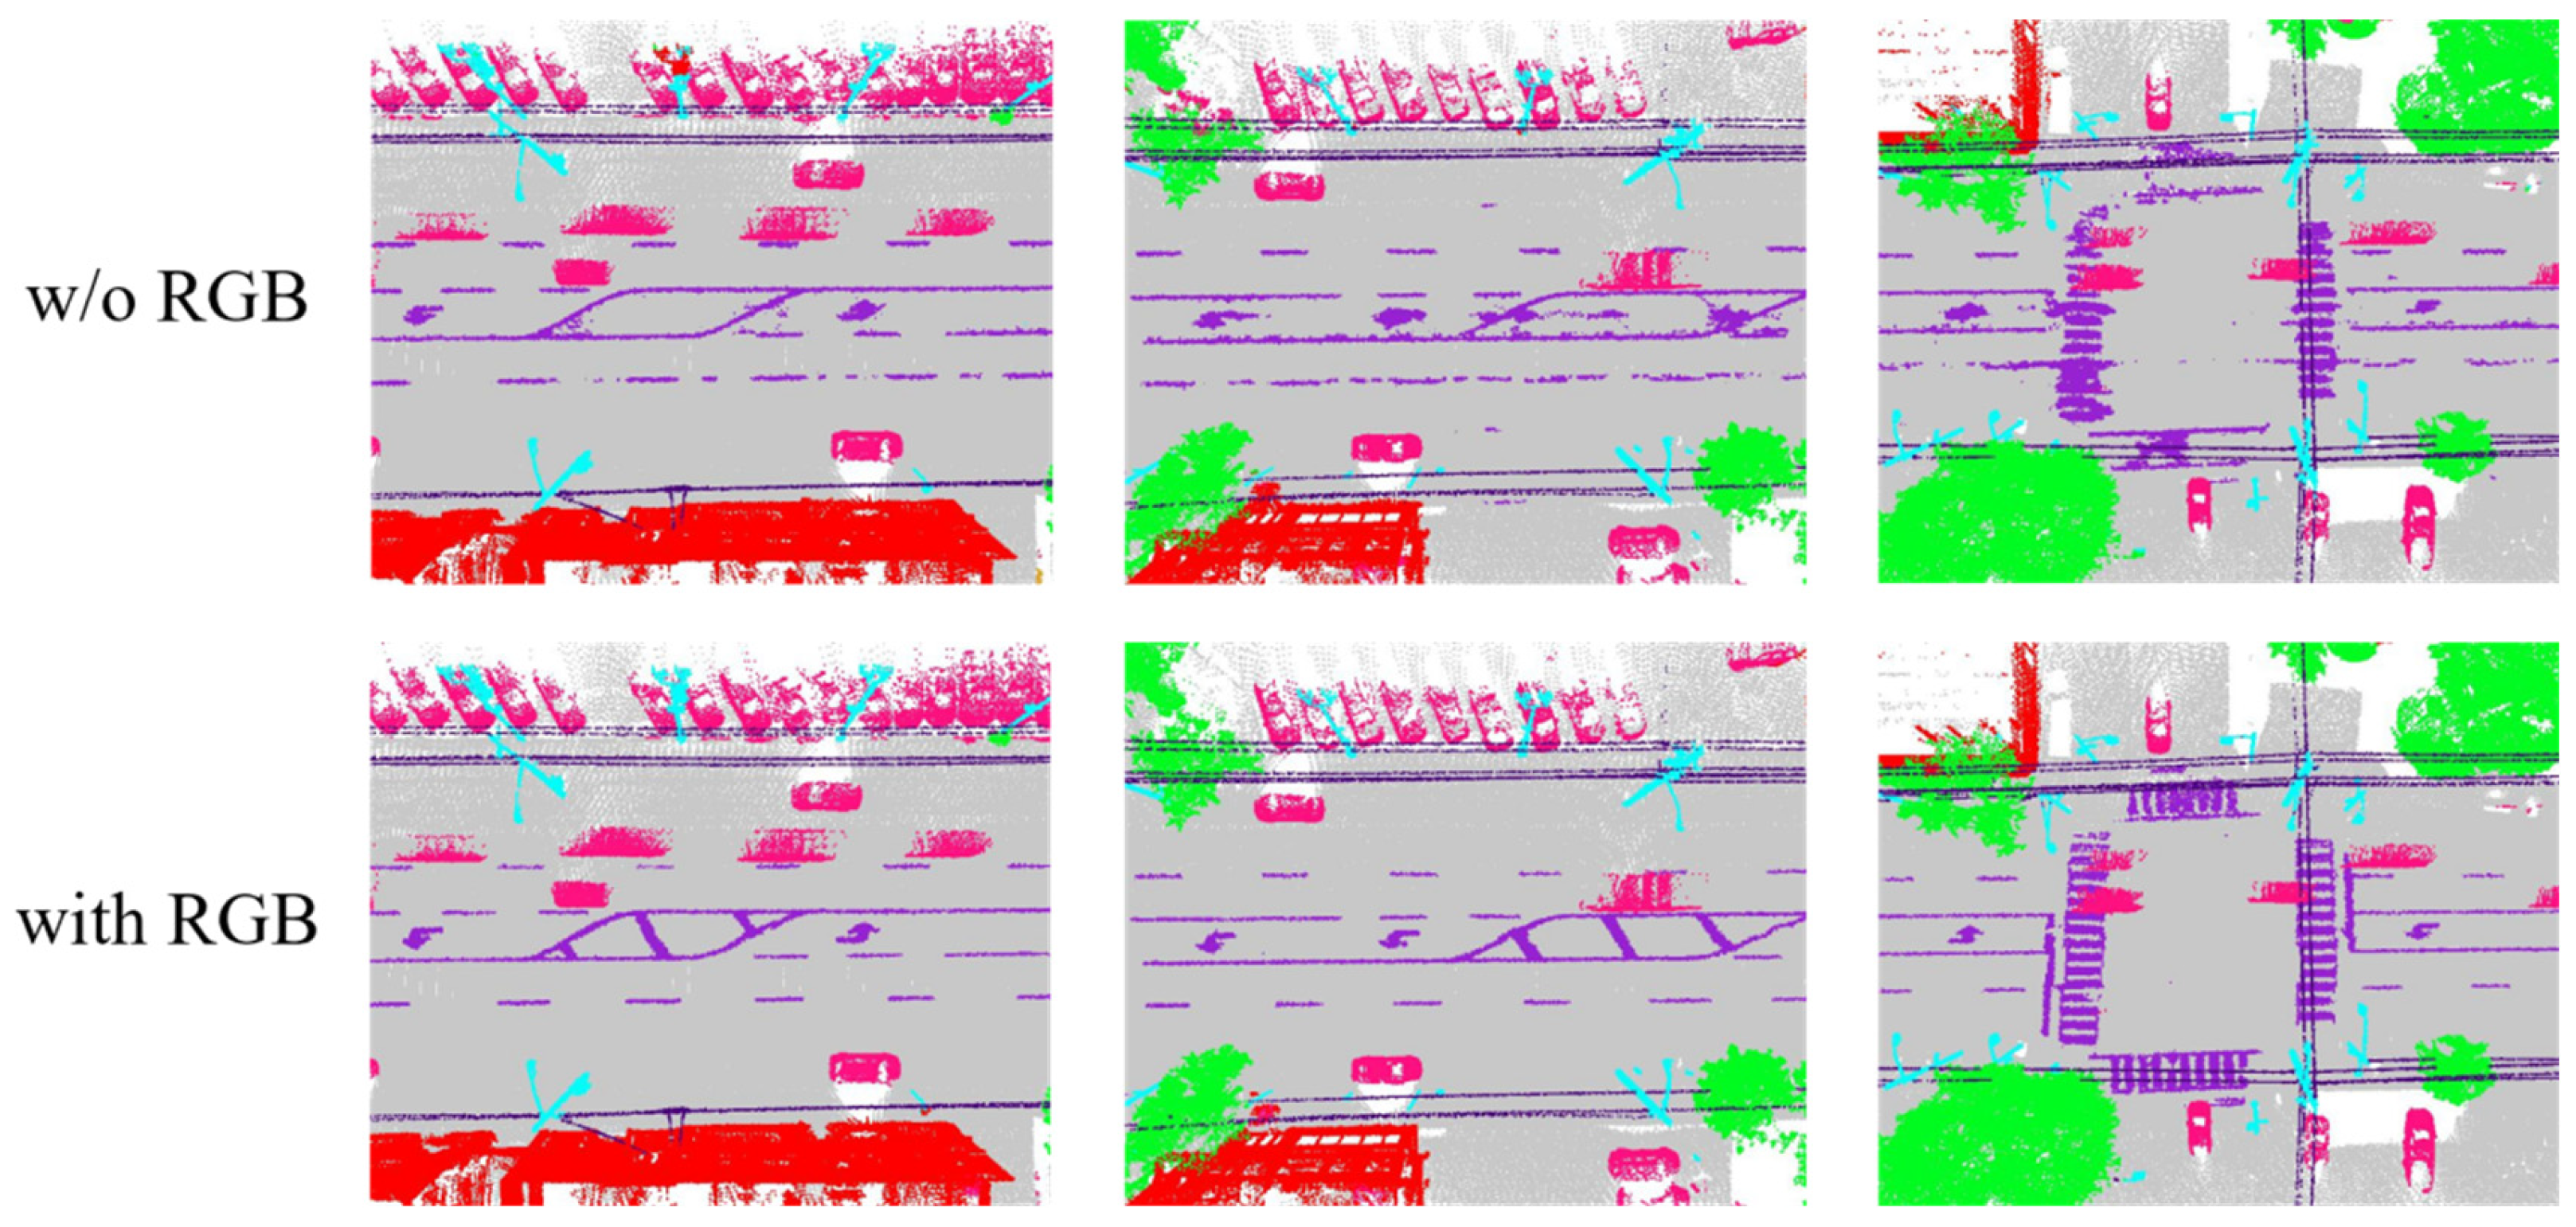
Furthermore, we conducted a comparative analysis of the segmentation results with and without using color information, as shown in Figure 6. The presence or absence of color information has a significant impact on the segmentation results, particularly for road markings. Road marking structures without color information appear fragmented, with blurred segmentation boundaries, making them indistinguishable from the road. Using color information can enhance local spectral differences, thereby facilitating the model to effectively distinguish between roads and road markings.
Figure 6.
Comparison of visualization results using or not using RGB information as initial input on the Toronto3D dataset. The geographical object types represented by various colors are the same as those in Figure 5.
3.3.2. Results of S3DIS Dataset
To validate the generalization capability of PG-Net, we conducted experiments on the large-scale indoor dataset S3DIS. Table 3 shows the quantitative evaluation results of PG-Net compared with other advanced methods on the S3DIS dataset. In terms of OA and mIoU, our PG-Net reached 89.87% and 73.22%, respectively, surpassing other methods. Compared to RandLA-Net, these represent improvements of 1.87% and 3.22%, respectively. Compared to the baseline network LACV-Net, improvements of 0.17% and 0.52% were also achieved, respectively. Moreover, under the same experimental conditions, PG-Net achieves a larger improvement margin. Furthermore, among the 13 categories, our method achieved a higher IoU than other methods in 4 categories, namely: wall, beam, table, and clutter. To validate the effectiveness of our proposed method, we conducted an in-depth comparative study across all areas of S3DIS. As shown in Table 4, we present the experimental results of the proposed PG-Net and selected methods across all areas of S3DIS. In Areas 1, 4, 5, 6, and in the 6-fold cross-validation, the proposed PG-Net consistently achieved the best performance.
Table 3.
Quantitative comparison on the S3DIS dataset (Best results are marked in red. * indicates experimental results obtained under the same environment, same input, and same parameter settings).
Table 4.
Quantitative comparison across different areas of the S3DIS dataset (Best results are marked in red).
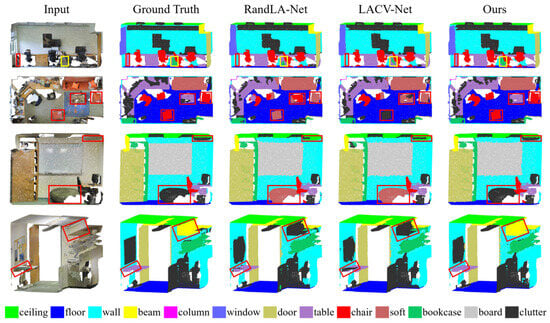
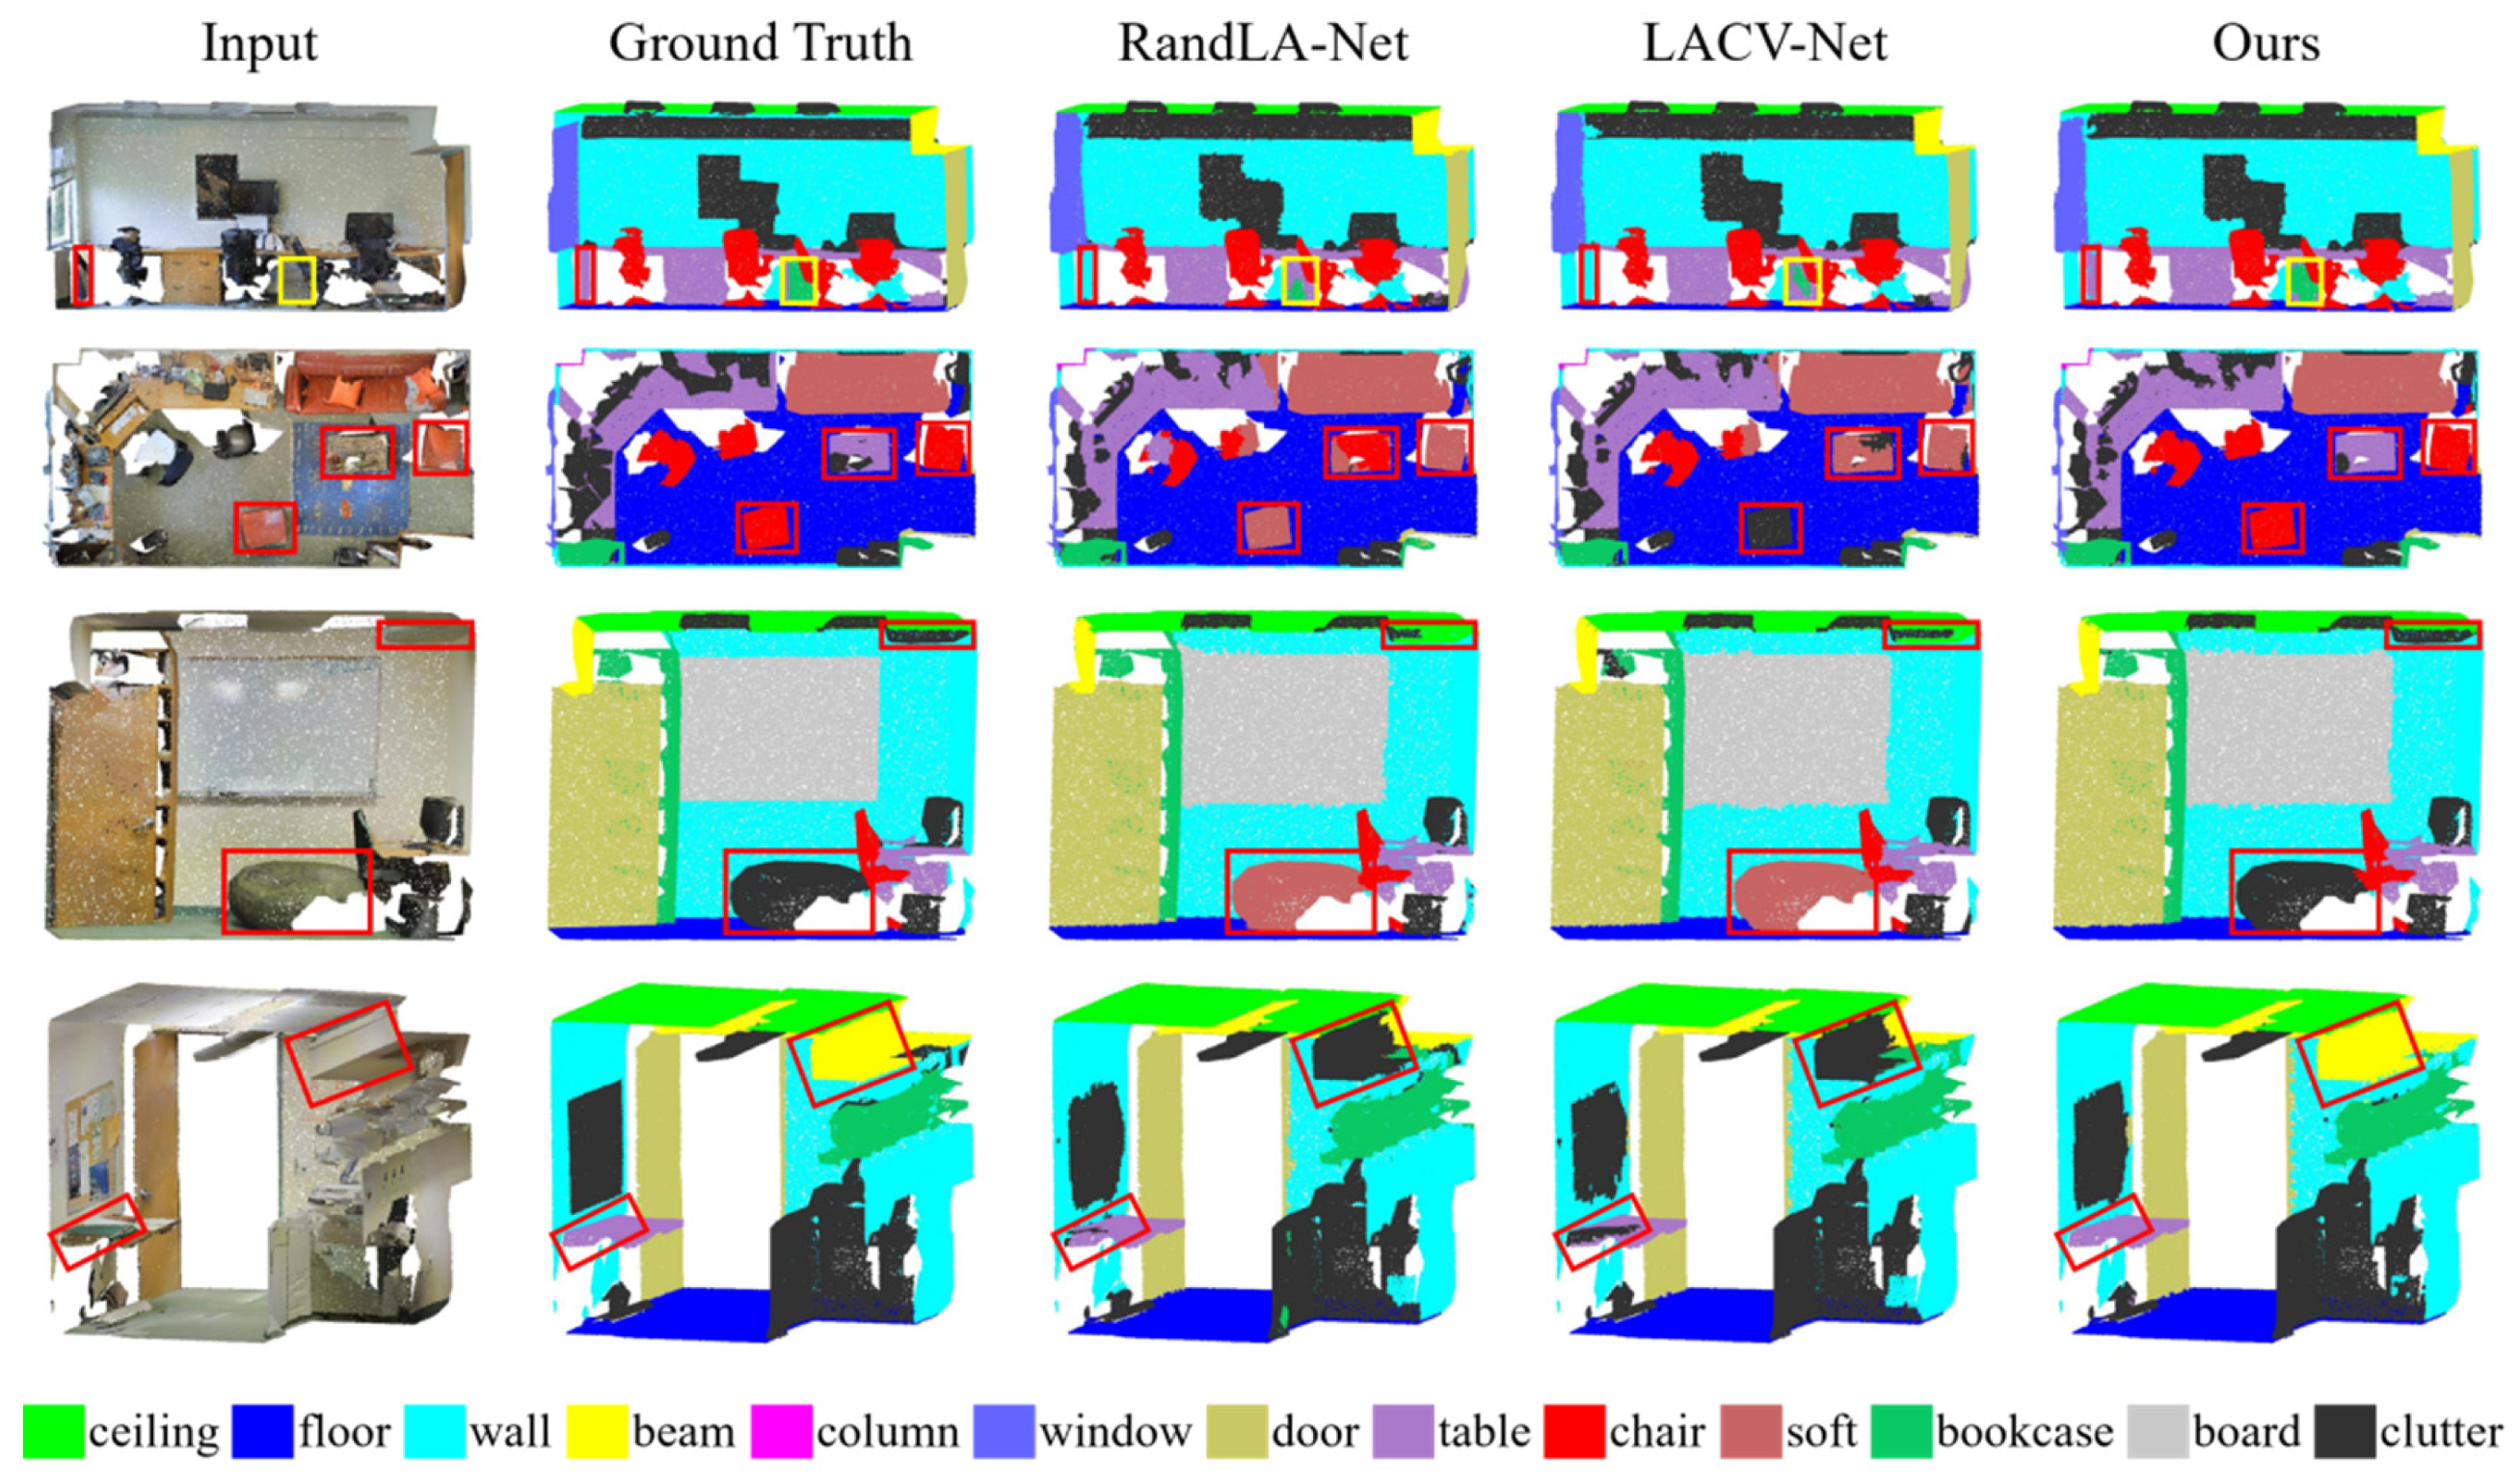
To enable a more distinct comparison among the various methods, we qualitatively evaluated the segmentation results of PG-Net, RandLA-Net, and LACV-Net on S3DIS, as shown in Figure 7. Red and yellow boxes enclose areas highlighting regions with inaccurate segmentation or unclear boundary delineation. According to the results, the segmentation of tables, bookcases, chairs, and beams by our PG-Net is evidently superior to the selected methods. These improvements again demonstrate PG-Net’s ability to learn more discriminative local features, allowing it to distinguish between objects that are geometrically similar but semantically different.
Figure 7.
Comparison of visualization results on the S3DIS dataset.
4. Discussion
4.1. Ablation Experiment
To validate the necessity and effectiveness of the modules we designed, we conducted ablation experiments on the Toronto3D dataset.
4.1.1. Ablation of Point Branch and Graph Branch
To validate the effectiveness of the dual-branch structure in PG-Net, we systematically compared the performance of the point branch and the graph branch across different combinations. We designed three architectures for comparison: one using only the point branch (A1), one using only the graph branch (A2), and PG-Net (A3), which utilizes both branches simultaneously. To ensure fairness in comparison, when the graph branch runs independently, we added the spatial coordinates and color information of the point cloud as input. This is because in the dual-branch architecture of PG-Net, the point branch takes coordinates and color information as input, while the graph branch originally uses only feature information. To keep the input information comparable when evaluating the graph branch alone, we supplemented it with coordinates and color information. And adjustments were made to the new constraint function .
The experimental results are shown in Table 5. When using only the point branch, the mIoU is 82.70%. When using only the graph branch, the mIoU is slightly lower, at 82.16%. When the point branch and the graph branch are combined to form the dual-branch architecture, the mIoU increases to 83.51%. This fully demonstrates that the point branch and the graph branch have complementary advantages in feature representation; the dual-branch architecture formed by integrating the two effectively enhances the network’s ability to discriminate semantics in complex scenes.
Table 5.
Ablation results for the point branch and graph branch (Best results are marked in red).
4.1.2. Ablation of the PG-Net Architecture
To further analyze the contribution of each module in PG-Net, we progressively introduced the core components proposed in this paper onto the baseline network. These include the Local Graph Attention Aggregation (LGAA) unit, the Dynamic Feature Fusion (DFF) unit, and the New Aggregation Loss Function.
The experimental results are shown in Table 6. The baseline network (B1) achieves an mIoU of 82.70%. After incorporating the LGAA unit (B2), the performance slightly decreases, with the mIoU becoming 82.57%. When the DFF unit is further introduced (B3), the mIoU increases to 82.93%. To this end, we conducted a feature redundancy analysis. On the Toronto3D validation set, we extracted the local feature vectors output by models B2 and B3, and computed the average cosine similarity between feature pairs within each local neighborhood. The results show that B2 has an average similarity of 0.87, while after introducing DFF, B3 reduces the average similarity to 0.76, indicating a significant improvement in feature diversity. We argue that although the LGAA unit captures higher-order neighbor–neighbor relationships, it lacks an adaptive balance between the central point’s own features and the neighborhood context, leading to over-expression of similar features within the neighborhood. In contrast, the DFF unit, through its dynamic fusion mechanism, effectively balances the weight allocation between the point’s own features and the neighborhood contextual information, thereby enhancing feature discriminability. Finally, when the New Aggregation Loss Function is introduced (B4), the network’s mIoU reaches 83.51%. Moreover, we computed the average cosine similarity of the output features of the two branches in B3 and B4. The results show that the average similarity is 0.70 for B3 and 0.65 for B4, indicating increased feature diversity after adding the new loss, demonstrating the crucial role of this loss function in promoting feature complementarity between the two branches. Overall, each module in PG-Net contributes positively to the final performance, and their combination achieves performance gains, validating the rationality and effectiveness of our proposed architectural design.
Table 6.
Ablation results for the PG-Net architecture (Best results are marked in red. For B1, B2, and B3, we adopt the Aggregation Loss Function proposed by LACV-Net).
4.1.3. Comparison with Mainstream Graph Convolution Modules
To further verify the superiority of the proposed DGFA module, we replaced it in the graph branch with EdgeConv and AGConv, respectively, while keeping all other settings identical on the Toronto3D dataset. As shown in Table 7, DGFA achieves the highest OA and mIoU (97.69%/83.51%), outperforming EdgeConv (92.91%/77.64%) by 4.78% and 5.87%, and AGConv (94.53%/81.23%) by 3.16% and 2.28%, respectively. This demonstrates that DGFA, by explicitly modeling neighbor–neighbor relationships and dynamically fusing self-features with contextual information, learns more discriminative local features than existing mainstream graph convolution modules.
Table 7.
Performance comparison of different graph convolution modules on the Toronto3D dataset (Best results are marked in red).
4.1.4. Ablation of Hyperparameter
We also investigated the impact of the feature channel compression ratio r in the Dynamic Feature Fusion (DFF) Unit on the performance of PG-Net. We conducted experiments with r set to 1, 2, 4, and 8, respectively. The experimental results are shown in Table 8. When r = 2, PG-Net achieves optimal performance with a mIoU of 83.51%. When r = 1, performance slightly decreases with a mIoU of 83.00%, indicating that moderate channel compression helps eliminate redundant information and enhance feature representation. As r further increases to 4 and 8, mIoU decreases to 82.15% and 81.93%, respectively. This indicates that excessive compression leads to the loss of critical information, thereby weakening PG-Net’s expressive capability. Overall, an appropriate compression ratio strikes the optimal balance between preserving meaningful information and controlling complexity, thereby enhancing the overall semantic segmentation performance.
Table 8.
Ablation results for the hyperparameter (Best results are marked in red).
4.1.5. Ablation of the K Value
We evaluated the performance of PG-Net on the Toronto3D dataset with K values of 8, 16, 24, and 32. The experimental results are shown in Table 9. The highest mIoU (83.51%) is achieved at K = 16. When K = 8, the neighborhood range is too small to capture sufficient local geometric information, and the mIoU drops to 81.53%. When K = 24 or 32, excessive noise points and redundant connections are introduced into the neighborhood, causing performance to decrease to 82.24% and 81.22%, respectively. Therefore, we fix K = 16 in all experiments. It is worth noting that in scenes with drastic point density variations, adopting an adaptive K strategy may further improve model robustness; we leave this as a direction for future work.
Table 9.
Ablation results for the K value (Best results are marked in red).
4.2. Efficiency Analysis
In this section, we conduct a systematic evaluation of the computational efficiency of the proposed PG-Net model, benchmarking it against state-of-the-art methods on the Toronto3D dataset. To assess computational efficiency, we adopt per-batch training time, total inference time, number of parameters, and floating point operations (FLOPs) as efficiency metrics, while mIoU and OA are used as performance metrics. All experiments are performed with a batch size of 4. As shown in Table 10, RandLA-Net exhibits the fastest per-batch training time among the compared methods, but it achieves the lowest accuracy. Our PG-Net has a slightly longer total inference time than the baseline LACV-Net, yet its per-batch training time is shorter. In terms of parameter count and FLOPs, PG-Net introduces only about 0.26 M additional parameters and 0.5 G FLOPs compared to LACV-Net, corresponding to relative increases of 4.6% and 4.2%, respectively. Meanwhile, PG-Net improves mIoU by 0.81% and OA by 0.29%, demonstrating a favorable cost-performance trade-off. Notably, compared to LACV-Net, PG-Net converges in fewer training epochs. On the Toronto3D dataset, PG-Net reached its optimal mIoU within 67 epochs, a 27.96% reduction in training epochs compared with LACV-Net (93 epochs). Similarly, on the S3DIS dataset, PG-Net converged in 63 epochs, a 26.74% reduction relative to LACV-Net (86 epochs). Overall, PG-Net not only surpasses the compared networks in terms of accuracy but also maintains competitive computational efficiency.
Table 10.
Comparison of computational efficiency on Toronto3D dataset.
4.3. Confidence Interval Analysis
We evaluated the computational stability of PG-Net on the Toronto3D and S3DIS (Area 5) datasets. Under identical experimental settings, five independent runs were performed on each dataset, and the mean mIoU and standard deviation (std) were computed. As shown in Table 11, PG-Net achieves a mean mIoU of 83.23% ± 0.28% on Toronto3D and 67.76% ± 0.42% on S3DIS (Area 5). The standard deviations are below 0.5%, indicating that PG-Net exhibits high reproducibility and stability, further demonstrating its adaptability and reliability for large-scale point cloud semantic segmentation tasks.
Table 11.
Quantitative results of computation confidence.
4.4. Interpretation of Main Findings and Limitations
The experimental results on the Toronto3D and S3DIS datasets convincingly demonstrate that PG-Net achieves advanced performance in large-scale point cloud semantic segmentation. A key factor behind this success is the dual-branch architecture, which integrates the point-based LAFA module and the graph-based DGFA module. This design allows the network to simultaneously exploit discrete point distribution features and local graph structural relationships, and the consistent improvements in OA and mIoU over single-branch variants confirm the complementary nature of these two information sources. The synergy is particularly evident for classes that rely on fine-grained geometric boundaries, such as road marking, car, and fence, where per-category IoU gains are substantial.
Central to the graph branch, the proposed DGFA module distinguishes itself from conventional graph convolution operators like EdgeConv and AGConv by explicitly modeling higher-order neighbor–neighbor interactions and by introducing a dynamic feature fusion mechanism. The DFF unit learns to adaptively balance the original point features with the aggregated contextual features, which reduces feature redundancy and yields more discriminative local representations. The feature diversity analysis corroborates this finding, showing a marked decrease in inter-feature similarity after the DFF unit is employed. Interestingly, the isolated use of the LGAA unit led to a slight performance drop, suggesting that explicit neighbor–neighbor modeling, while powerful, can introduce noise if not properly regulated by an adaptive fusion strategy. Thus, it is the combination of LGAA and DFF within the DGFA module that proves critical.
The introduction of the New Aggregation Loss Function provides an additional performance gain by imposing a structural prior on the dual-branch feature learning process. This loss encourages the point and graph branches to extract complementary rather than redundant representations, as evidenced by the reduced feature similarity between branches. Moreover, the constraint term helps stabilize and accelerate training, with PG-Net requiring approximately 27% fewer epochs to converge compared to the baseline LACV-Net, which is a meaningful advantage for large-scale training scenarios.
Despite these advances, several limitations deserve attention. The current implementation relies on a fixed KNN-based graph construction, which assumes a uniform neighborhood size and may be suboptimal in regions with drastically varying point densities. An adaptive neighborhood selection mechanism could further improve robustness in such challenging areas. Additionally, the fusion of the two branches is currently realized through a simple concatenation followed by an MLP, a strategy that may not fully exploit the deep complementarity between the branches. More sophisticated fusion modules, such as those based on attention or gating mechanisms, could be explored in future work. Lastly, while the increase in parameters and FLOPs is moderate, the dual-branch design inevitably adds computational overhead; lightweight variants of PG-Net would be desirable for deployment on resource-constrained platforms like autonomous vehicles.
5. Conclusions
The effective extraction of local features is key to determining the performance of semantic segmentation. Therefore, in this study, we have focused on extracting more powerful local features. For this purpose, we have proposed PG-Net, a deep learning neural network specifically designed for large-scale point cloud semantic segmentation. The main innovations of PG-Net are as follows: (1) The proposed PG-Net is a dual-branch network that integrates point-based and graph-based methods. It aims to leverage the complementary advantages of both methods to obtain local features with more powerful representational capacity, enabling efficient semantic segmentation of large-scale point clouds. (2) We have proposed a Dynamic Graph Feature Aggregation (DGFA) module. This module explicitly models the relationships between neighboring points within local graphs and can adaptively adjust the proportion of self-information versus contextual information within the local neighborhood, thereby obtaining more discriminative local features. (3) We have designed a New Aggregation Loss Function for PG-Net. This function constrains the feature extraction processes of the two branches, prompting the network to learn more complementary feature representations, thereby enhancing the final segmentation performance. Through large-scale experiments on the S3DIS and Toronto3D benchmark datasets and comparisons with advanced methods such as RandLA-Net, BAAF-Net, and LACV-Net, the competitive performance and effectiveness of our proposed PG-Net have been validated. While the performance gains over the baseline are modest, the consistent improvements across datasets suggest that the dual-branch point-graph strategy is a promising direction for large-scale point cloud semantic segmentation. We acknowledge that the proposed architecture represents incremental refinement within an already mature line of research, and we hope that the ideas presented can inform future work in this active field.
Although the dual-branch structure of PG-Net can effectively combine the advantages of point-based and graph-based methods, enhancing the semantic segmentation performance for large-scale LiDAR point clouds, this dual-branch structure also consumes more computational resources. Furthermore, the feature fusion of the two branches in PG-Net currently adopts only a simple concatenation-plus-mlp strategy. In the future, we will focus on designing more effective feature fusion modules to better exploit the complementarity of the dual-branch features. Meanwhile, we will continue to pursue the lightweighting of PG-Net, with the goal that it can be further developed for potential applications in fields such as autonomous driving, smart cities, and indoor scene reconstruction.
Author Contributions
Y.W. (Yichang Wang) and Y.W. (Yanjun Wang) conceived the work. Y.W. (Yichang Wang) conducted the modeling, data gathering, and analysis; analyzed the results; and wrote the first draft of the manuscript. Y.W. (Yanjun Wang) and C.W. contributed to data gathering. C.W., A.M. and X.T. contributed to the modeling and data analysis and analyzed the results. All authors reviewed the manuscript. All authors have read and agreed to the published version of the manuscript.
Funding
This research was funded by the National Natural Science Foundation of China, grant number 41971423.
Data Availability Statement
All relevant data are available within the paper. The Toronto3D dataset could be publicly available at https://github.com/WeikaiTan/Toronto-3D (accessed on 15 October 2025). The S3DIS dataset could be publicly available at https://opendatalab.org.cn/OpenDataLab/S3DIS (accessed on 15 October 2025).
Conflicts of Interest
The authors declare no conflicts of interest. The funders had no role in the design of the study; in the collection, analyses, or interpretation of data; in the writing of the manuscript; or in the decision to publish the results.
Abbreviations
The following abbreviations are used in this manuscript:
| DGFA | Dynamic Graph Feature Aggregation module |
| LAFA | Local Adaptive Feature Augmentation module |
| C-VLAD | Comprehensive Vector of Locally Aggregated Descriptors module |
| LGAA | Local Graph Attention Aggregation unit |
| DFF | Dynamic Feature Fusion unit |
References
- Li, Y.; Ma, L.; Zhong, Z.; Liu, F.; Chapman, M.A.; Cao, D.; Li, J. Deep learning for lidar point clouds in autonomous driving: A review. IEEE Trans. Neural Netw. Learn. Syst. 2020, 32, 3412–3432. [Google Scholar] [CrossRef] [Scilit]
- Chen, Y.; Zhang, S.; Han, T.; Du, Y.; Zhang, W.; Li, J. Chat3D: Interactive understanding 3D scene-level point clouds by chatting with foundation model for urban ecological construction. ISPRS J. Photogramm. Remote Sens. 2024, 212, 181–192. [Google Scholar] [CrossRef] [Scilit]
- Gao, X.; Yang, R.; Chen, X.; Tan, J.; Liu, Y.; Liu, S. Indoor scene reconstruction from LiDAR point cloud based on roof extraction. J. Build. Eng. 2024, 97, 110874. [Google Scholar] [CrossRef] [Scilit]
- Liu, Z.; Tang, H.; Lin, Y.; Han, S. Point-voxel cnn for efficient 3d deep learning. arXiv 2019. [Google Scholar] [CrossRef] [Scilit]
- Qi, C.R.; Su, H.; Mo, K.; Guibas, L.J. Pointnet: Deep learning on point sets for 3d classification and segmentation. In Proceedings of the IEEE Conference on Computer Vision and Pattern Recognition; IEEE: New York, NY, USA, 2017; pp. 652–660. [Google Scholar]
- Qi, C.R.; Yi, L.; Su, H.; Guibas, L.J. Pointnet++: Deep hierarchical feature learning on point sets in a metric space. Adv. Neural Inf. Process. Syst. 2017, 30, 5105–5114. [Google Scholar]
- Li, Y.; Bu, R.; Sun, M.; Wu, W.; Di, X.; Chen, B. Pointcnn: Convolution on x-transformed points. Adv. Neural Inf. Process. Syst. 2018, 31, 828–838. [Google Scholar]
- Ma, X.; Qin, C.; You, H.; Ran, H.; Fu, Y. Rethinking network design and local geometry in point cloud: A simple residual MLP framework. arXiv 2022, arXiv:2202.07123. [Google Scholar] [CrossRef] [Scilit]
- Qian, G.; Li, Y.; Peng, H.; Mai, J.; Hammoud, H.; Elhoseiny, M.; Ghanem, B. Pointnext: Revisiting pointnet++ with improved training and scaling strategies. Adv. Neural Inf. Process. Syst. 2022, 35, 23192–23204. [Google Scholar]
- Hu, Q.; Yang, B.; Xie, L.; Rosa, S.; Guo, Y.; Wang, Z.; Trigoni, N.; Markham, A. Randla-net: Efficient semantic segmentation of large-scale point clouds. In Proceedings of the IEEE/CVF Conference on Computer Vision and Pattern Recognition; IEEE: New York, NY, USA, 2020; pp. 11108–11117. [Google Scholar]
- Zhan, L.; Li, W.; Min, W. FA-ResNet: Feature affine residual network for large-scale point cloud segmentation. Int. J. Appl. Earth Obs. Geoinf. 2023, 118, 103259. [Google Scholar] [CrossRef] [Scilit]
- Xu, Y.; Tang, W.; Zeng, Z.; Wu, W.; Wan, J.; Guo, H.; Xie, Z. NeiEA-NET: Semantic segmentation of large-scale point cloud scene via neighbor enhancement and aggregation. Int. J. Appl. Earth Obs. Geoinf. 2023, 119, 103285. [Google Scholar] [CrossRef] [Scilit]
- Liu, T.; Ma, T.; Du, P.; Li, D. Semantic segmentation of large-scale point cloud scenes via dual neighborhood feature and global spatial-aware. Int. J. Appl. Earth Obs. Geoinf. 2024, 129, 103862. [Google Scholar] [CrossRef] [Scilit]
- Zhao, H.; Jiang, L.; Jia, J.; Torr, P.H.; Koltun, V. Point transformer. In Proceedings of the IEEE/CVF International Conference on Computer Vision; IEEE: New York, NY, USA, 2021; pp. 16259–16268. [Google Scholar]
- Wu, X.; Jiang, L.; Wang, P.-S.; Liu, Z.; Liu, X.; Qiao, Y.; Ouyang, W.; He, T.; Zhao, H. Point transformer v3: Simpler faster stronger. In Proceedings of the IEEE/CVF Conference on Computer Vision and Pattern Recognition; IEEE: New York, NY, USA, 2024; pp. 4840–4851. [Google Scholar]
- Wang, Y.; Sun, Y.; Liu, Z.; Sarma, S.E.; Bronstein, M.M.; Solomon, J.M. Dynamic graph cnn for learning on point clouds. ACM Trans. Graph. (Tog) 2019, 38, 1–12. [Google Scholar] [CrossRef] [Scilit]
- Landrieu, L.; Simonovsky, M. Large-scale point cloud semantic segmentation with superpoint graphs. In Proceedings of the IEEE Conference on Computer Vision and Pattern Recognition; IEEE: New York, NY, USA, 2018; pp. 4558–4567. [Google Scholar]
- Shi, W.; Rajkumar, R. Point-gnn: Graph neural network for 3d object detection in a point cloud. In Proceedings of the IEEE/CVF Conference on Computer Vision and Pattern Recognition; IEEE: New York, NY, USA, 2020; pp. 1711–1719. [Google Scholar]
- Ma, Y.; Guo, Y.; Liu, H.; Lei, Y.; Wen, G. Global context reasoning for semantic segmentation of 3D point clouds. In Proceedings of the IEEE/CVF Winter Conference on Applications of Computer Vision; IEEE: New York, NY, USA, 2020; pp. 2931–2940. [Google Scholar]
- Han, B.; Zhang, X.; Ren, S. PU-GACNet: Graph attention convolution network for point cloud upsampling. Image Vis. Comput. 2022, 118, 104371. [Google Scholar] [CrossRef] [Scilit]
- Wei, M.; Wei, Z.; Zhou, H.; Hu, F.; Si, H.; Chen, Z.; Zhu, Z.; Qiu, J.; Yan, X.; Guo, Y. AGConv: Adaptive graph convolution on 3D point clouds. IEEE Trans. Pattern Anal. Mach. Intell. 2023, 45, 9374–9392. [Google Scholar] [CrossRef] [Scilit]
- Han, T.; Chen, Y.; Ma, J.; Liu, X.; Zhang, W.; Zhang, X.; Wang, H. Point cloud semantic segmentation with adaptive spatial structure graph transformer. Int. J. Appl. Earth Obs. Geoinf. 2024, 133, 104105. [Google Scholar] [CrossRef] [Scilit]
- Li, H.; Guan, H.; Ma, L.; Lei, X.; Yu, Y.; Wang, H.; Delavar, M.R.; Li, J. MVPNet: A multi-scale voxel-point adaptive fusion network for point cloud semantic segmentation in urban scenes. Int. J. Appl. Earth Obs. Geoinf. 2023, 122, 103391. [Google Scholar] [CrossRef] [Scilit]
- Lin, F.; Lin, T.; Yao, Y.; Ren, H.; Wu, J.; Cai, Q. VPA-Net: A visual perception assistance network for 3d lidar semantic segmentation. Pattern Recognit. 2025, 158, 111014. [Google Scholar] [CrossRef] [Scilit]
- Zhang, X.; Hu, Y.; Li, Y.; Nan, Z.; Yu, Q. Dual-Branch Point Cloud Semantic Segmentation: An EMA-Based Teacher–Student Collaborative Learning Framework. Sensors 2026, 26, 450. [Google Scholar] [CrossRef] [Scilit] [PubMed]
- Zeng, Z.; Xu, Y.; Xie, Z.; Tang, W.; Wan, J.; Wu, W. Large-scale point cloud semantic segmentation via local perception and global descriptor vector. Expert Syst. Appl. 2024, 246, 123269. [Google Scholar] [CrossRef] [Scilit]
- Zhan, W.; Chen, J. SADNet: Space-aware DeepLab network for Urban-Scale point clouds semantic segmentation. Int. J. Appl. Earth Obs. Geoinf. 2024, 129, 103827. [Google Scholar] [CrossRef] [Scilit]
- Tan, W.; Qin, N.; Ma, L.; Li, Y.; Du, J.; Cai, G.; Yang, K.; Li, J. Toronto-3D: A large-scale mobile LiDAR dataset for semantic segmentation of urban roadways. In Proceedings of the IEEE/CVF Conference on Computer Vision and Pattern Recognition Workshops; IEEE: New York, NY, USA, 2020; pp. 202–203. [Google Scholar]
- Armeni, I.; Sener, O.; Zamir, A.R.; Jiang, H.; Brilakis, I.; Fischer, M.; Savarese, S. 3d semantic parsing of large-scale indoor spaces. In Proceedings of the IEEE Conference on Computer Vision and Pattern Recognition; IEEE: New York, NY, USA, 2016; pp. 1534–1543. [Google Scholar]
- Ma, L.; Li, Y.; Li, J.; Tan, W.; Yu, Y.; Chapman, M.A. Multi-scale point-wise convolutional neural networks for 3D object segmentation from LiDAR point clouds in large-scale environments. IEEE Trans. Intell. Transp. Syst. 2019, 22, 821–836. [Google Scholar] [CrossRef] [Scilit]
- Thomas, H.; Qi, C.R.; Deschaud, J.-E.; Marcotegui, B.; Goulette, F.; Guibas, L.J. Kpconv: Flexible and deformable convolution for point clouds. In Proceedings of the IEEE/CVF International Conference on Computer Vision; IEEE: New York, NY, USA, 2019; pp. 6411–6420. [Google Scholar]
- Li, Y.; Ma, L.; Zhong, Z.; Cao, D.; Li, J. TGNet: Geometric graph CNN on 3-D point cloud segmentation. IEEE Trans. Geosci. Remote Sens. 2019, 58, 3588–3600. [Google Scholar] [CrossRef] [Scilit]
- Du, J.; Cai, G.; Wang, Z.; Huang, S.; Su, J.; Junior, J.M.; Smit, J.; Li, J. ResDLPS-Net: Joint residual-dense optimization for large-scale point cloud semantic segmentation. ISPRS J. Photogramm. Remote Sens. 2021, 182, 37–51. [Google Scholar] [CrossRef] [Scilit]
- Shuai, H.; Xu, X.; Liu, Q. Backward attentive fusing network with local aggregation classifier for 3D point cloud semantic segmentation. IEEE Trans. Image Process. 2021, 30, 4973–4984. [Google Scholar] [CrossRef] [Scilit]
- Qiu, S.; Anwar, S.; Barnes, N. Semantic segmentation for real point cloud scenes via bilateral augmentation and adaptive fusion. In Proceedings of the IEEE/CVF Conference on Computer Vision and Pattern Recognition; IEEE: New York, NY, USA, 2021; pp. 1757–1767. [Google Scholar]
- Wen, C.; Zhang, L.; Ren, J.; Hong, R.; Li, C.; Yang, C.; Lv, Y.; Chen, H.; Yang, N. HFA-Net: Hybrid feature-aware network for large-scale point cloud semantic segmentation. Artif. Intell. Rev. 2025, 58, 102. [Google Scholar] [CrossRef] [Scilit]
- Wong, C.-C.; Vong, C.-M. Efficient outdoor 3d point cloud semantic segmentation for critical road objects and distributed contexts. In Proceedings of the European Conference on Computer Vision; Springer: Berlin/Heidelberg, Germany, 2020; pp. 499–514. [Google Scholar]
- Zhao, H.; Jiang, L.; Fu, C.-W.; Jia, J. Pointweb: Enhancing local neighborhood features for point cloud processing. In Proceedings of the IEEE/CVF Conference on Computer Vision and Pattern Recognition; IEEE: New York, NY, USA, 2019; pp. 5565–5573. [Google Scholar]
- Zhang, Z.; Hua, B.-S.; Yeung, S.-K. Shellnet: Efficient point cloud convolutional neural networks using concentric shells statistics. In Proceedings of the IEEE/CVF International Conference on Computer Vision; IEEE: New York, NY, USA, 2019; pp. 1607–1616. [Google Scholar]
- Guo, M.-H.; Cai, J.-X.; Liu, Z.-N.; Mu, T.-J.; Martin, R.R.; Hu, S.-M. Pct: Point cloud transformer. Comput. Vis. Media 2021, 7, 187–199. [Google Scholar] [CrossRef] [Scilit]
- Fan, S.; Dong, Q.; Zhu, F.; Lv, Y.; Ye, P.; Wang, F.-Y. SCF-Net: Learning spatial contextual features for large-scale point cloud segmentation. In Proceedings of the IEEE/CVF Conference on Computer Vision and Pattern Recognition; IEEE: New York, NY, USA, 2021; pp. 14504–14513. [Google Scholar]
- Chen, J.; Kakillioglu, B.; Velipasalar, S. Background-aware 3-D point cloud segmentation with dynamic point feature aggregation. IEEE Trans. Geosci. Remote Sens. 2022, 60, 5703112. [Google Scholar] [CrossRef] [Scilit]
- Zhang, C.; Wan, H.; Shen, X.; Wu, Z. PVT: Point-voxel transformer for point cloud learning. Int. J. Intell. Syst. 2022, 37, 11985–12008. [Google Scholar] [CrossRef] [Scilit]
- Song, Y.; He, F.; Duan, Y.; Si, T.; Bai, J. LSLPCT: An enhanced local semantic learning transformer for 3-D point cloud analysis. IEEE Trans. Geosci. Remote Sens. 2022, 60, 4708813. [Google Scholar] [CrossRef] [Scilit]
- Wang, C.; Ning, X.; Sun, L.; Zhang, L.; Li, W.; Bai, X. Learning discriminative features by covering local geometric space for point cloud analysis. IEEE Trans. Geosci. Remote Sens. 2022, 60, 5703215. [Google Scholar] [CrossRef] [Scilit]
- Li, Y.; Li, X.; Zhang, Z.; Shuang, F.; Lin, Q.; Jiang, J. DenseKPNET: Dense kernel point convolutional neural networks for point cloud semantic segmentation. IEEE Trans. Geosci. Remote Sens. 2022, 60, 5702913. [Google Scholar] [CrossRef] [Scilit]
- Zeng, Z.; Xu, Y.; Xie, Z.; Tang, W.; Wan, J.; Wu, W. LEARD-Net: Semantic segmentation for large-scale point cloud scene. Int. J. Appl. Earth Obs. Geoinf. 2022, 112, 102953. [Google Scholar] [CrossRef] [Scilit]
- Huang, Z.; Zhao, Z.; Li, B.; Han, J. Lcpformer: Towards effective 3d point cloud analysis via local context propagation in transformers. IEEE Trans. Circuits Syst. Video Technol. 2023, 33, 4985–4996. [Google Scholar] [CrossRef] [Scilit]

Disclaimer/Publisher’s Note: The statements, opinions and data contained in all publications are solely those of the individual author(s) and contributor(s) and not of MDPI and/or the editor(s). MDPI and/or the editor(s) disclaim responsibility for any injury to people or property resulting from any ideas, methods, instructions or products referred to in the content. |
© 2026 by the authors. Licensee MDPI, Basel, Switzerland. This article is an open access article distributed under the terms and conditions of the Creative Commons Attribution (CC BY) license.