


Highlights
What are the main findings?
- The EurTm model markedly enhances the accuracy of Tm estimation across the European region, demonstrating superior performance compared to the Bevis, ETmPoly, and HGPT2 models at both modeling and non-modeling stations.
- For PWV retrieval, the EurTm model achieves optimal Tm estimation accuracy, demonstrating reduced theoretical and relative errors compared to the Bevis, ETmPoly, and HGPT2 models.
What are the implications of the main findings?
- This study proposes a regionally enhanced modeling framework for global Tm models (e.g., HGPT2), and the method greatly improves the precision of PWV obtained from GNSS, independent of sophisticated infrastructure.
- The methodology offers a scalable solution for atmospheric water vapor monitoring in areas with limited data availability and can be extended to other geographically complex areas.
Abstract
The retrieval of precipitable water vapor (PWV) through Global Navigation Satellite System (GNSS) meteorology critically depends on the precise determination of atmospheric weighted mean temperature (Tm). Existing empirical models for Tm retrieval over Europe offer speed but suffer accuracy limitations due to complex local environmental and climatic factors. Aiming to improve Tm model accuracy in Europe, this study constructed the European Tm Enhanced Model (EurTm). The model was constructed based on 2014–2023 radiosonde data from 40 stations across Europe, with its parameters optimized through least squares estimation. The EurTm model integrates multiple factors, including Tm from Hourly Global Pressure and Temperature 2 (HGPT2), the difference between Ts obtained by HGPT2 and Ts measured by radiosonde stations, and diurnal variation. The EurTm model’s accuracy was validated by comparing its outputs with reference values derived from 2024 radiosonde data. The EurTm model underwent comparative analysis against the widely used Bevis, ETmPoly, and HGPT2 models. The EurTm model’s accuracy was 13.2%, 4.1%, and 32.7% higher than the Bevis, ETmPoly, and HGPT2 models at 40 modeling stations. At 13 non-modeling stations, the EurTm model outperformed the Bevis, ETmPoly, and HGPT2 models with accuracy enhancements of 16.1%, 4.7%, and 30.0%, respectively. Theoretical evaluation showed that the EurTm model achieved an RMSE of 0.20 mm and a relative error of 1.11% for GNSS-derived PWV, outperforming all comparative models. In conclusion, the EurTm model not only holds significant application value for GNSS PWV retrieval in Europe but also provides a novel approach for region-specific enhancements of global empirical Tm models by addressing characteristic regional features such as diurnal variations.
1. Introduction
Researchers recognize water vapor as vital to global energy transport, climate change, and weather system dynamics [1,2]. In studying these interactions, they frequently employ Precipitable Water Vapor (PWV), a measure that represents the total vertically integrated water vapor per unit area, making it indispensable for analysis in the field [3]. Existing techniques for measuring atmospheric water vapor, such as radiometers, satellite sensing, and radiosondes, are increasingly unable to address modern meteorological needs, primarily due to constraints in spatiotemporal resolution or elevated expenses [4]. The field saw significant progress in the 1990s with the advent of GNSS meteorology, which enables efficient PWV retrieval. Recognized for its cost efficiency and precision, this approach is now established as a key method for water vapor monitoring. The fundamental principle of GNSS PWV retrieval involves two main steps: (1) estimating the Zenith Total Delay (ZTD) from GNSS signal processing and subsequently extracting the Zenith Wet Delay (ZWD) component, and (2) the transformation of ZWD into GNSS-derived PWV utilizing a conversion factor, Π. The sole determinant of Π is the atmospheric weighted mean temperature (Tm). Because the accuracy of PWV retrieval is critically dependent on Tm, a major research thrust in GNSS meteorology involves constructing Tm models that are optimized for both low computational burden and high fidelity [5,6,7].
Presently, the strategies for building Tm models are divided into two main types according to the input data they need: models that rely on meteorological parameter inputs and those that do not. The first category is exemplified by the Bevis model [8]. Developed from 8718 atmospheric profiles collected at 13 U.S. radiosonde stations (27°N–65°N) between 1990 and 1991, it established a linear regression equation between Tm and surface temperature (Ts) for mid-latitude regions. While this model features a simple structure and demonstrates good accuracy in mid-latitude regions, it tends to exhibit significant systematic biases when applied to other areas [9]. To refine the Bevis model, numerous empirical models have consequently been proposed by researchers, utilizing long-term Tm datasets at either local or global scales [10,11,12,13,14,15,16,17,18,19]. Given the availability of surface meteorological parameters, such models generally offer satisfactory prediction accuracy. In contrast, the second category encompasses Tm models that are independent of meteorological parameters. These models are fitted using long-term local or global Tm data and are user-friendly, though their accuracy is generally lower than that of models utilizing measured meteorological parameters. Representative models include the Global Pressure and Temperature 2 Wet (GPT2w) model [20], the Global Pressure and Temperature 3 (GPT3) model [21], the Global Weighted Mean Temperature (GWMT) model [15] and its successors (GTm-II and GTm-III) [22,23], the Global Tropospheric (GTrop) model [24], and the Global Grid empirical weighted mean Temperature (GGTm) model [25,26]. Among these, the GPT3 model, derived from ECMWF reanalysis data, offers a maximum spatial resolution of 1° × 1° and a temporal resolution of 6 h, and is widely used for global pressure and temperature modeling. However, at such resolutions, significant simulation biases may occur for parameters like temperature, pressure, and water vapor. To address this, the Hourly Global Pressure and Temperature (HGPT) model was developed [27]. As the latest release in the HGPT series, the HGPT2 model [28] utilizes 20 years of ECMWF ERA5 reanalysis data. It applies a linear regression approach that integrates periodic functions and a linear trend to derive Tm from Ts, offering both spatial (0.25° × 0.25°) and hourly temporal resolutions. As an open-access, easy-to-use, and highly timely model, HGPT2 serves as a strong alternative to GPT3.
Furthermore, advancements in artificial intelligence technology demonstrate transformative potential across multiple geoscience domains, including the introduction of innovative methods for data utilization and parameter modeling [29]. Within the field of meteorology, the potential of machine learning has been concretely realized. For instance, Benevides et al. [30] employed a Nonlinear Autoregressive Exogenous (NARX) neural network to integrate GNSS-derived PWV with multi-source meteorological data, significantly enhancing the accuracy of heavy rainfall prediction. Similarly, Zhang et al. [31] demonstrated strong consistency in PWV retrieval from diverse sources through collaborative validation. These studies underscore the powerful capability of machine learning to extract value from complex datasets, while also providing new methodological insights for the advanced modeling of key parameters such as Tm.
Nevertheless, despite significant advancements in machine learning technologies, region-specific enhancements to state-of-the-art global Tm empirical models like HGPT2 remain critically important. It should be noted that although the HGPT2 model offers advantages in high spatiotemporal resolution, its inherent characteristics as a global empirical model still impede accurate capture of regional spatiotemporal features of Tm, thereby limiting its practical effectiveness. While radiosonde data demonstrate high accuracy, their sparse station distribution restricts complete spatial coverage. With continuous developments in atmospheric detection technologies, the requirements for PWV prediction accuracy are becoming increasingly stringent [32,33]. However, existing Tm models still cannot fully satisfy the accuracy demands for GNSS PWV prediction in the European region [34]. Therefore, to enhance the accuracy of Tm estimation, this study integrates the high-resolution capabilities of the HGPT2 model with the precision of radiosonde observations. To this end, a systematic analysis of the model’s local residual characteristics over Europe is conducted, from which a refined, region-specific atmospheric weighted mean temperature model is derived.
A region-specific enhanced weighted average temperature model, named EurTm, is developed in this study to improve the accuracy of empirical Tm modeling in Europe. Based on radiosonde observations from 40 stations (2014–2023) and optimized via least squares estimation, EurTm incorporates HGPT2-derived Tm, Ts difference between HGPT2 and radiosonde, and diurnal variation. The 2024 radiosonde data were used for validation via the integration method, and the model’s performance was compared with the Bevis, ETmPoly, and HGPT2 models. The structure of the paper includes: data and methodology (Section 2), performance evaluation using MAE and RMSE (Section 3), discussion (Section 4), and conclusion (Section 5).
2. Data and Methods
2.1. Study Area
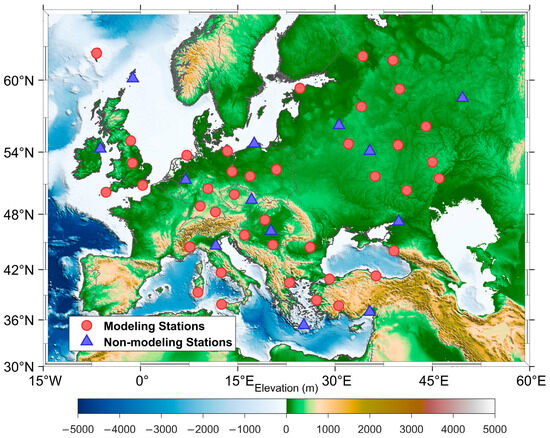
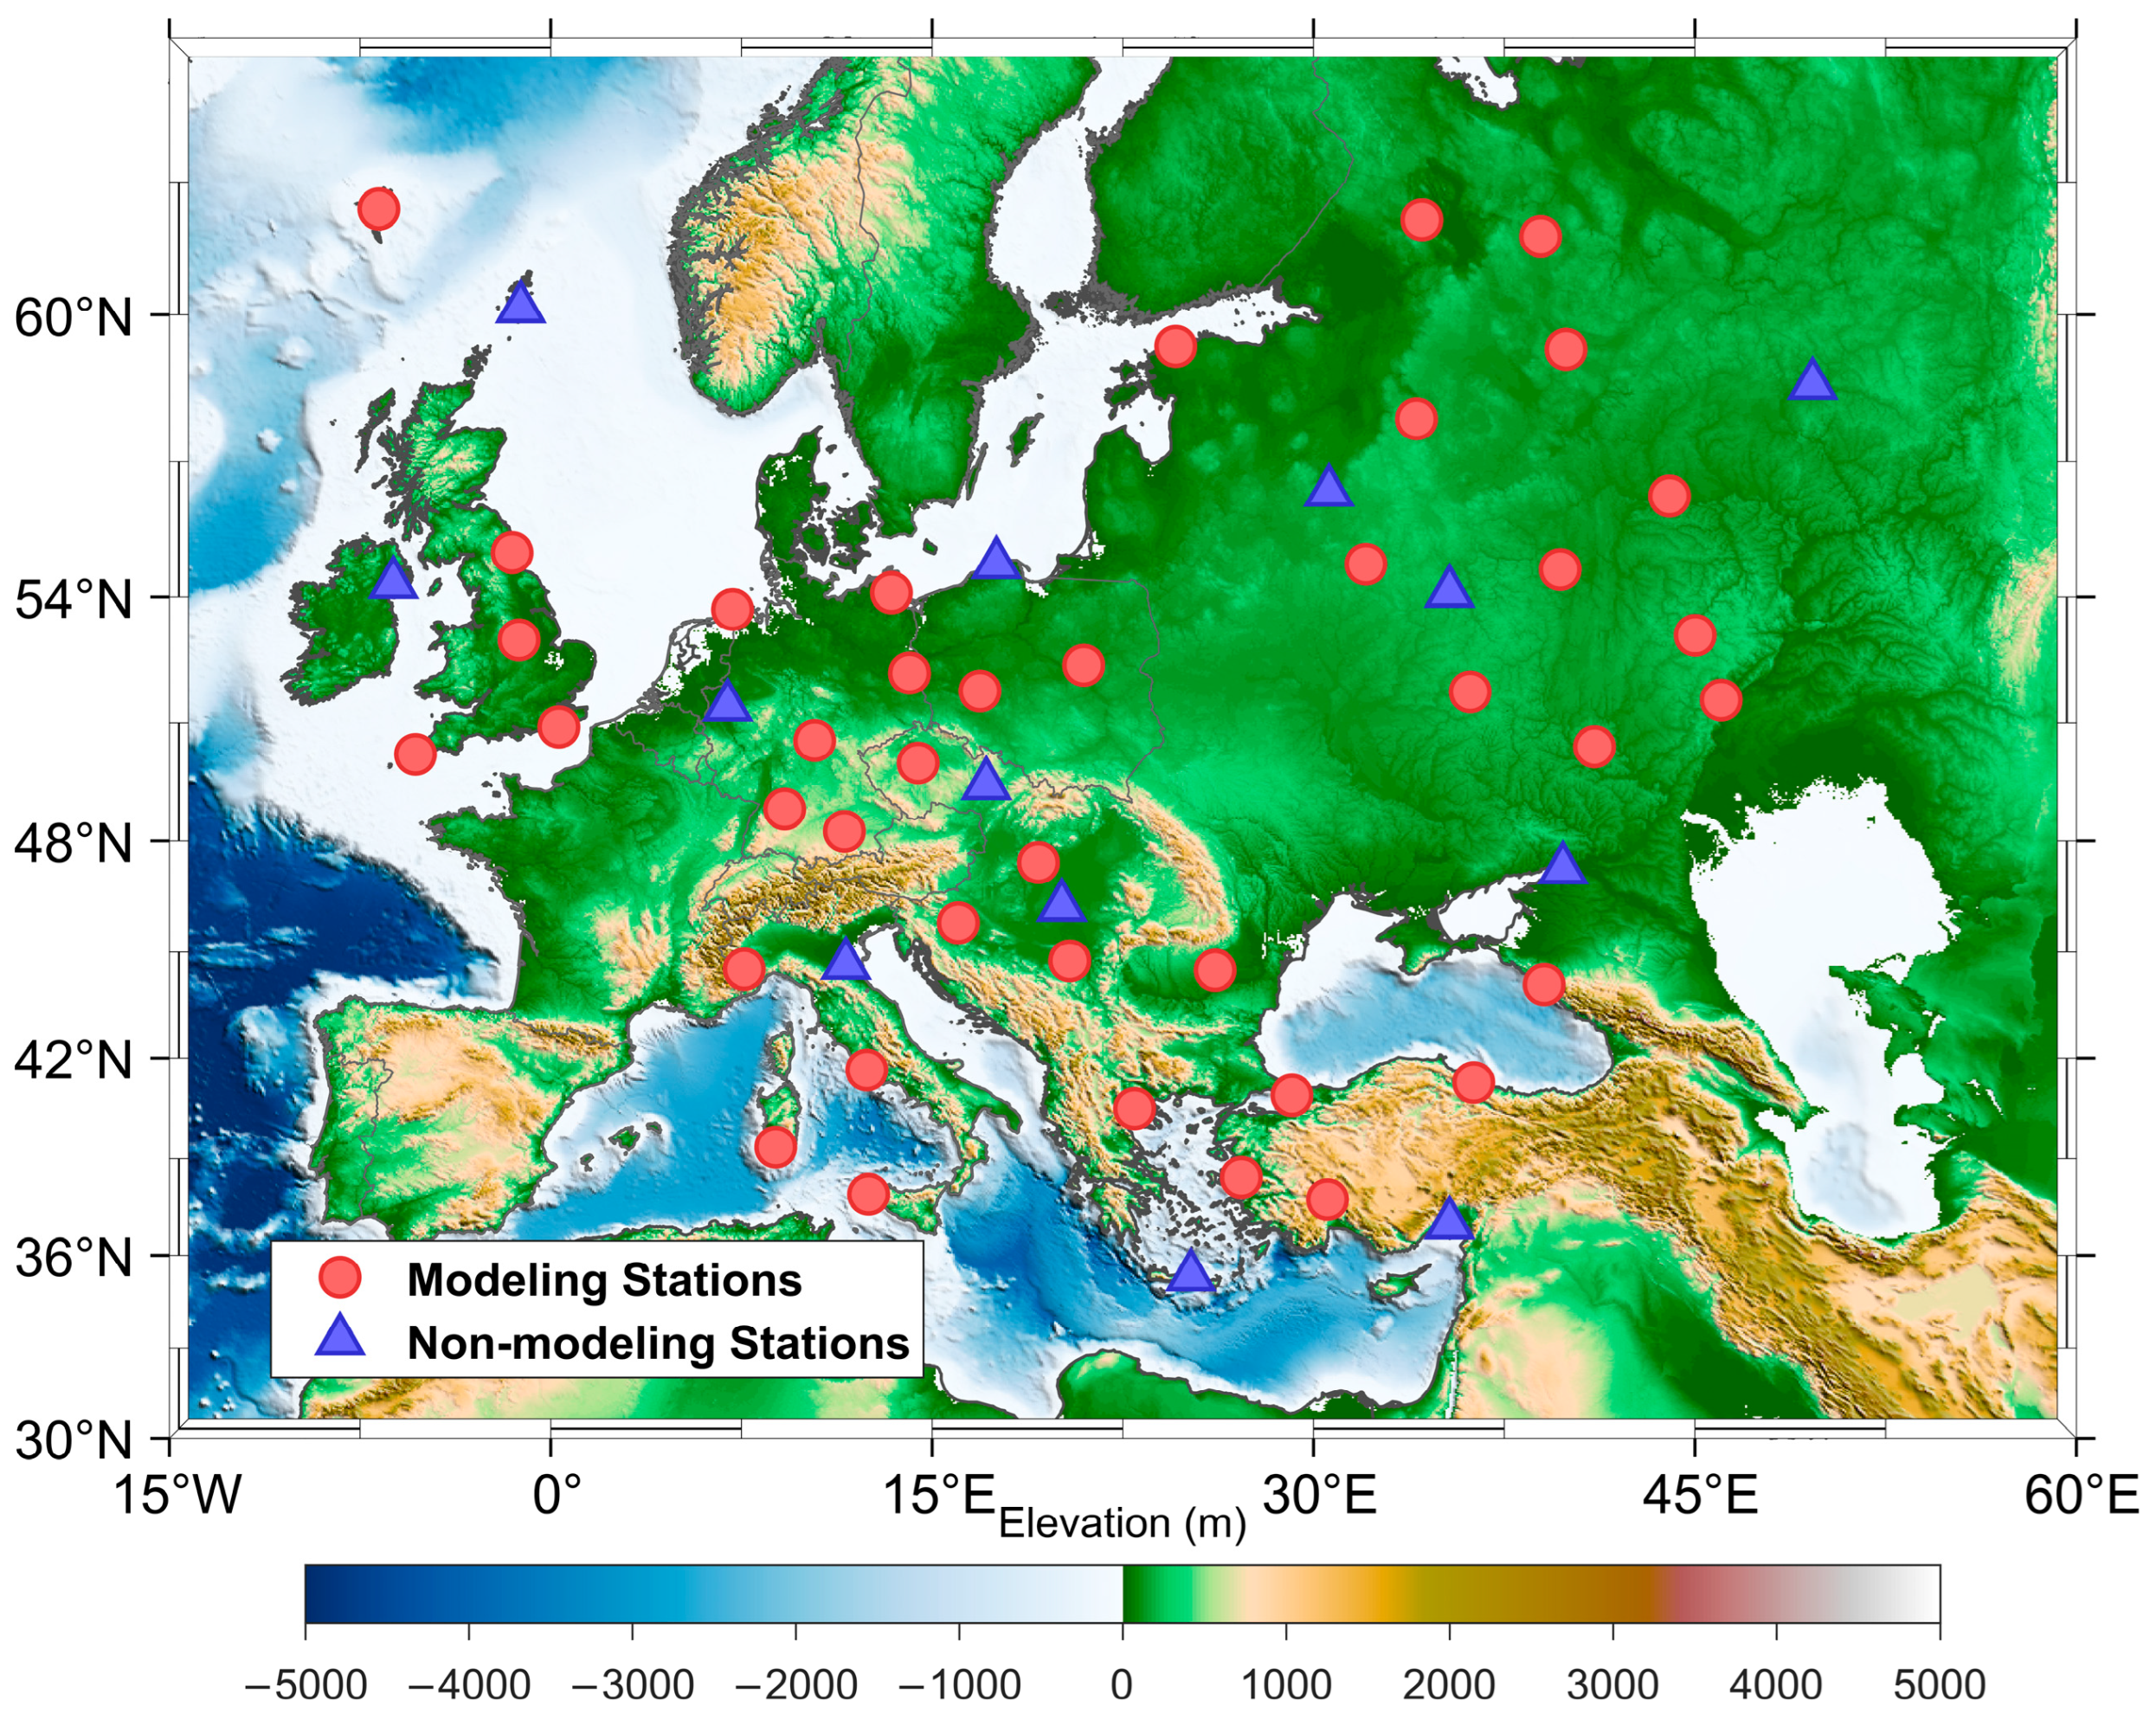
The study draws on observations from 53 European radiosonde stations spanning 2014 to 2024. Of these, 40 stations were used in constructing the model, and 13 were set aside for independent validation. Data were predominantly sampled every 12 h, with a limited number of stations reporting at 6 h intervals. The model was developed using data from 2014 to 2023, and its accuracy was evaluated with 2024 data. All observational data originate from the University of Wyoming’s Upper-Air Atmospheric Sounding Database “http://weather.uwyo.edu/upperair/seasia.html (accessed on 10 August 2025)”. Figure 1 displays the geographical arrangement of the stations.
Figure 1.
Geographical distribution of radiosonde stations in the European region.
2.2. Calculation of Tm Using Numerical Integration Method
The radiosonde dataset comprises two main types: pressure-level data and surface data. Pressure-level data provide variables such as pressure, temperature, dew point temperature, and relative humidity, whereas surface data include station position and PWV. The calculation of Tm employs a numerical integration approach, performing layer-by-layer integration of geopotential height, absolute temperature, and relative humidity along the zenith direction across all pressure levels. This method is widely recognized as the most accurate and commonly used technique. The specific numerical integration formula for Tm is given by Equation (1) [35]:
where and represent the mean temperature and water vapor pressure of the -th atmospheric layer, respectively; denotes the thickness (unit: m) of the -th layer; and is the number of layers. Since cannot be directly obtained from the sounding profile, it can be calculated using the following formula [1]:
where is the relative humidity, and and represent the saturated water vapor pressure and atmospheric temperature in degrees Celsius (), respectively.
2.3. Selection of Tm Comparative Models and Their Theoretical Basis
This paper comparatively analyzed three representative Tm models: Bevis, ETmPoly, and HGPT2. The Bevis model estimates Tm based solely on Ts. In contrast, the ETmPoly model necessitates hourly temporal data in addition to Ts, whereas the HGPT2 model requires only time and location information for Tm estimation. These divergent input requirements inherently lead to distinct implementation approaches, which are outlined in the following section:
- (1)
- The Tm estimated by the Bevis model
Bevis et al. [8] established a significant linear relationship between Tm and Ts through an analysis of 13 radiosonde stations in the United States, proposing a linear function to simplify retrieval. Building upon this finding, the Bevis regression model was developed using 8717 radiosonde profiles to achieve greater accuracy, as detailed in Equation (4).
- (2)
- The Tm estimated by the ETmPloy model
Using 24 years (1994–2018) of radiosonde data from 49 European stations, Baldysz and Nykiel [18] defined robust coefficients for the Tm-Ts relationship, thereby establishing the ETmPoly model. The calculation of Tm in this model follows Equation (5).
where and are the model coefficients, = UTC/24, and UTC denotes Coordinated Universal Time.
- (3)
- The Tm estimated by the HGPT2 model
Developed by Mateus et al. [28] using two decades of ERA5 reanalysis data, the HGPT2 model produces essential variables such as Ts, surface pressure, ZHD, and Tm. This is accomplished through a time-segmentation method that extracts results hour by hour from a continuous series, forming 24 independent daily time series per grid point to achieve full diurnal coverage. The model determines multiple global coefficients for each hour and grid point via Fourier analysis, considering both spatial location and time of day. A linear trend is incorporated to reflect long-term local temperature shifts. Three periodic functions are applied to Ts to represent annual, semi-annual, and quarterly variations. The integration of these components enables HGPT2 to accurately represent the dynamic behavior of Ts. Finally, Tm is calculated at each grid point using a linear equation that leverages the established correlation with Ts, with specifics given in Equation (6).
where and are regression coefficients. To account for the inherent seasonal and geographical variations in Tm, these coefficients were estimated using time series data of Ts and air temperature (in Kelvin) from ERA5.
2.4. Development of an Empirically Enhanced Tm Model for the European Region
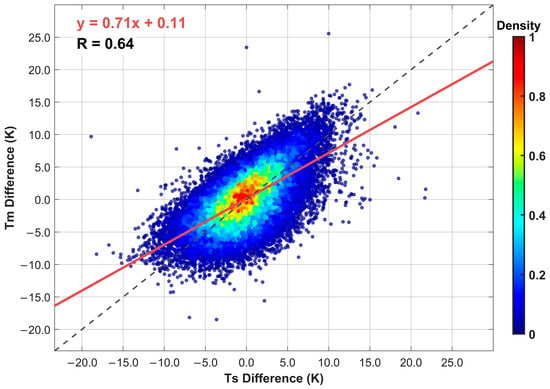
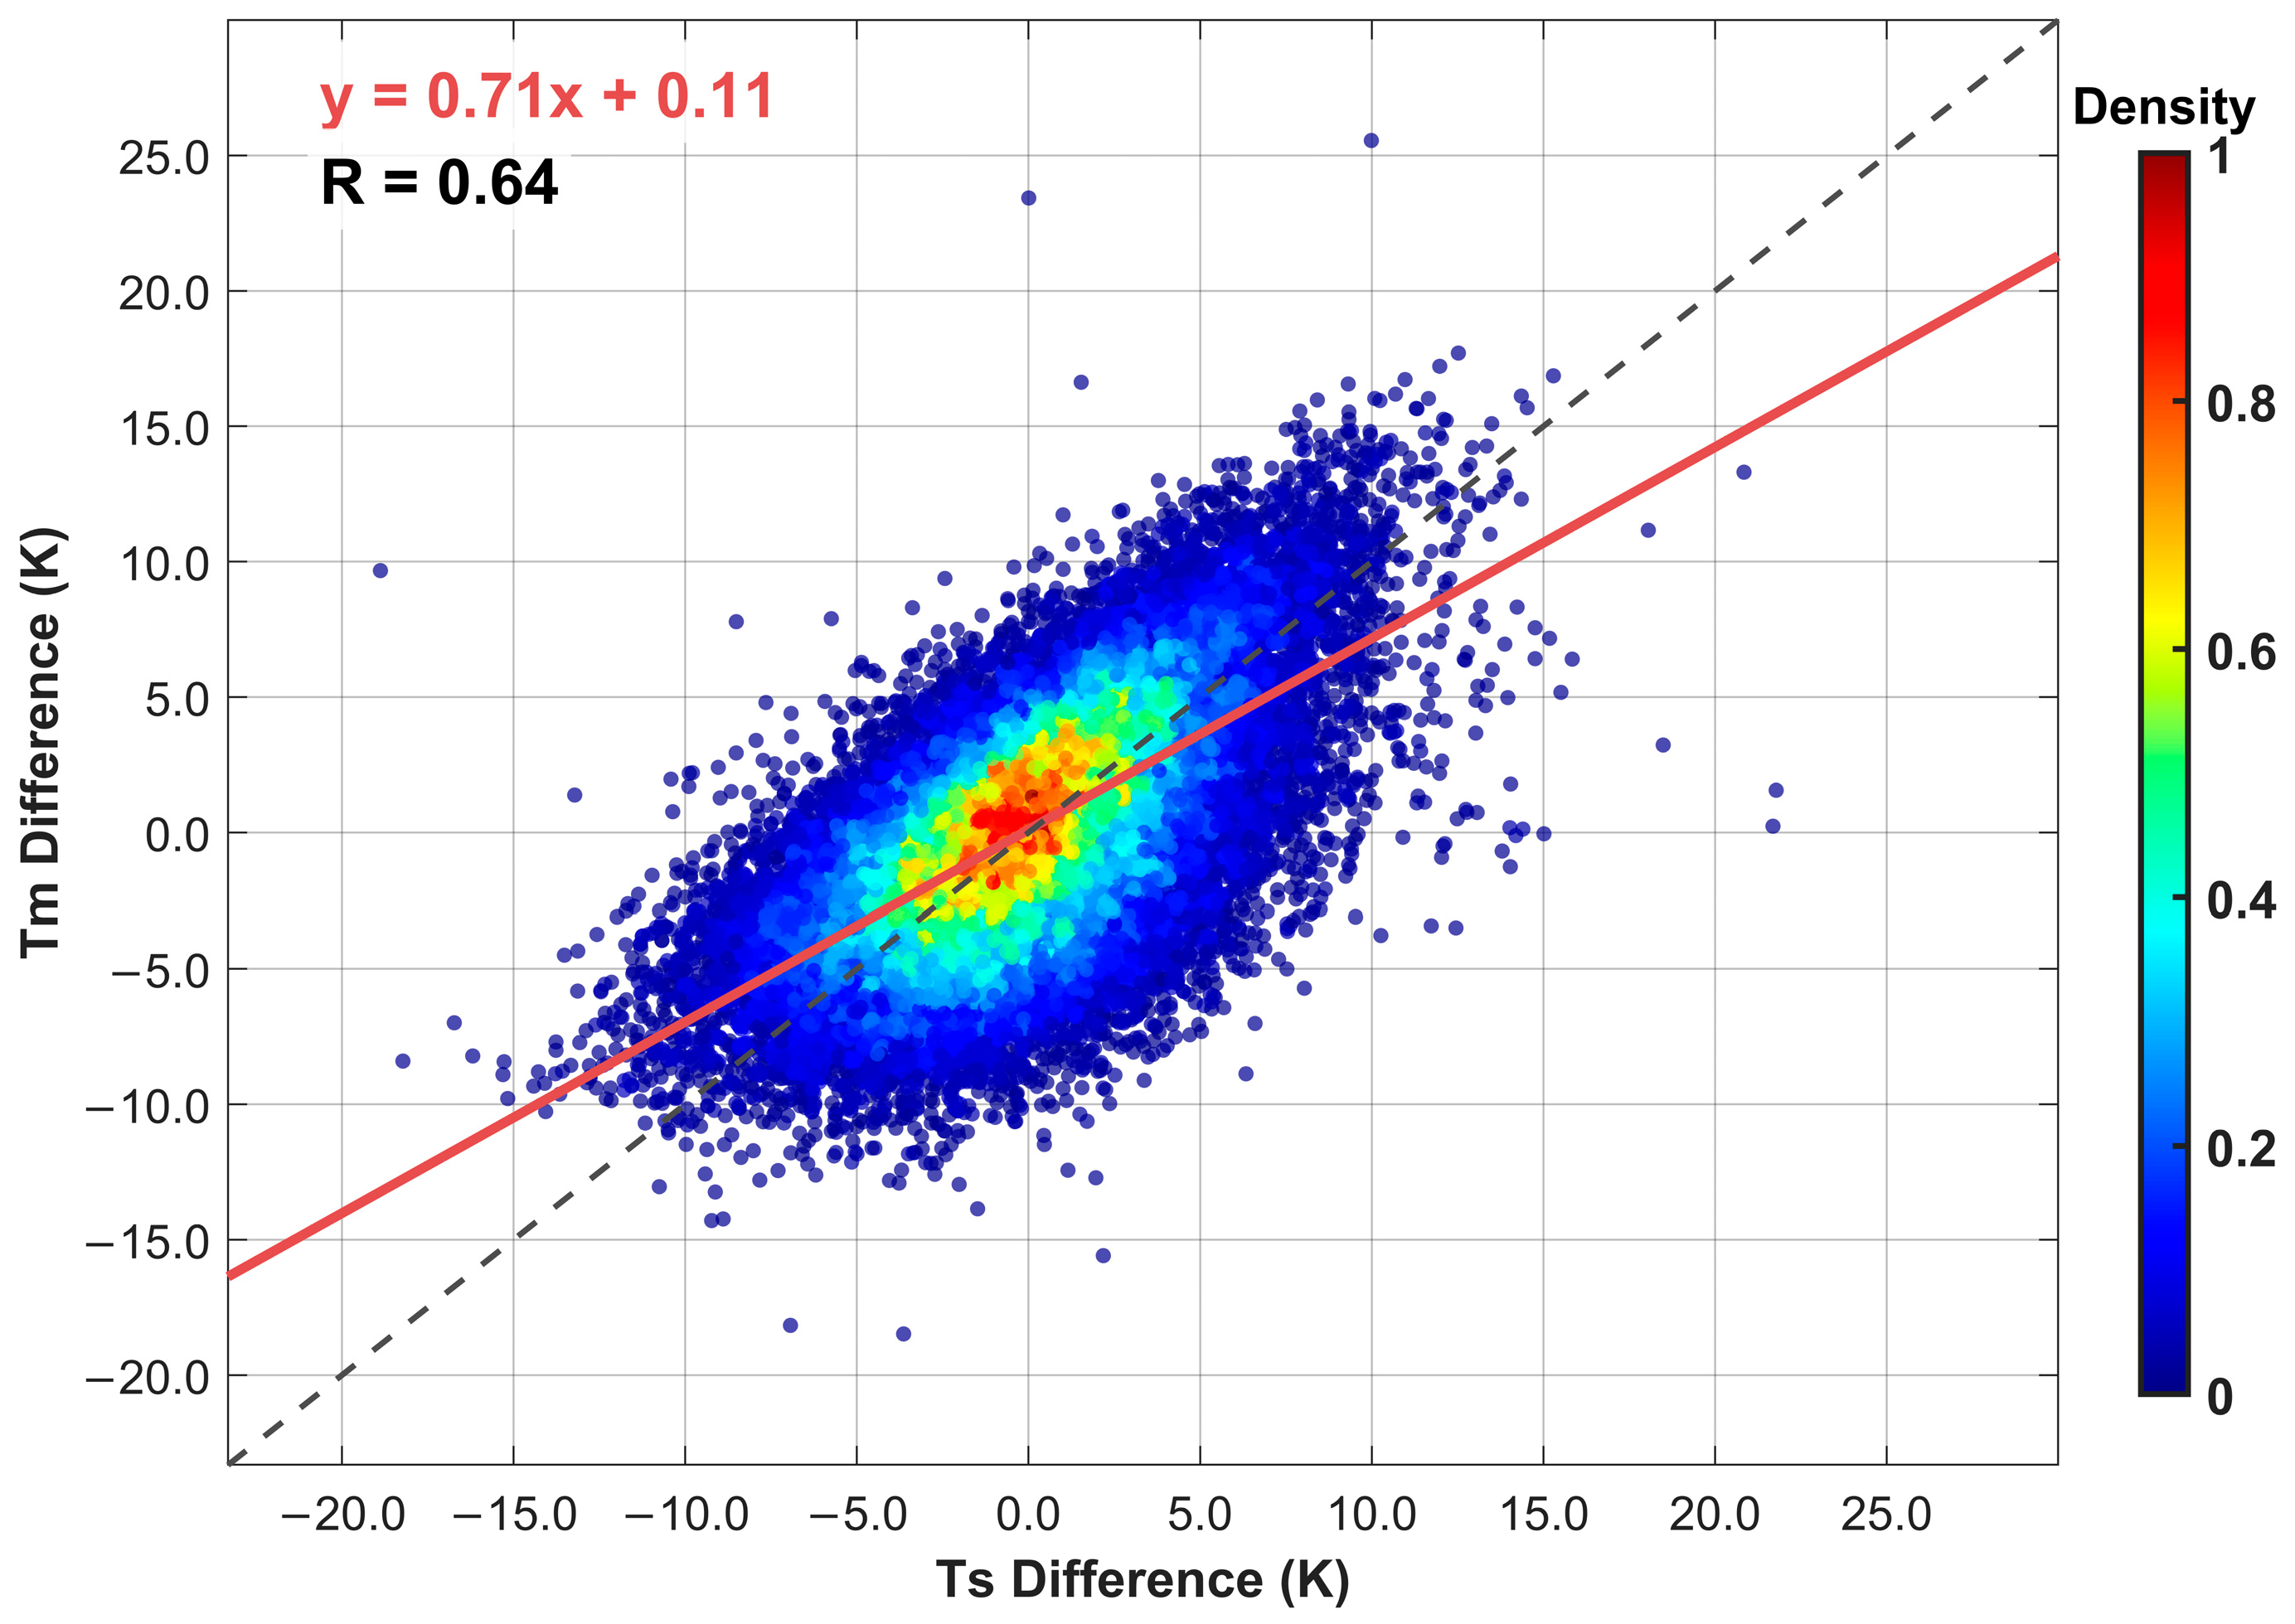
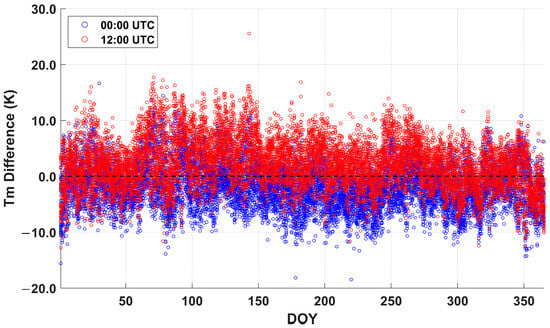
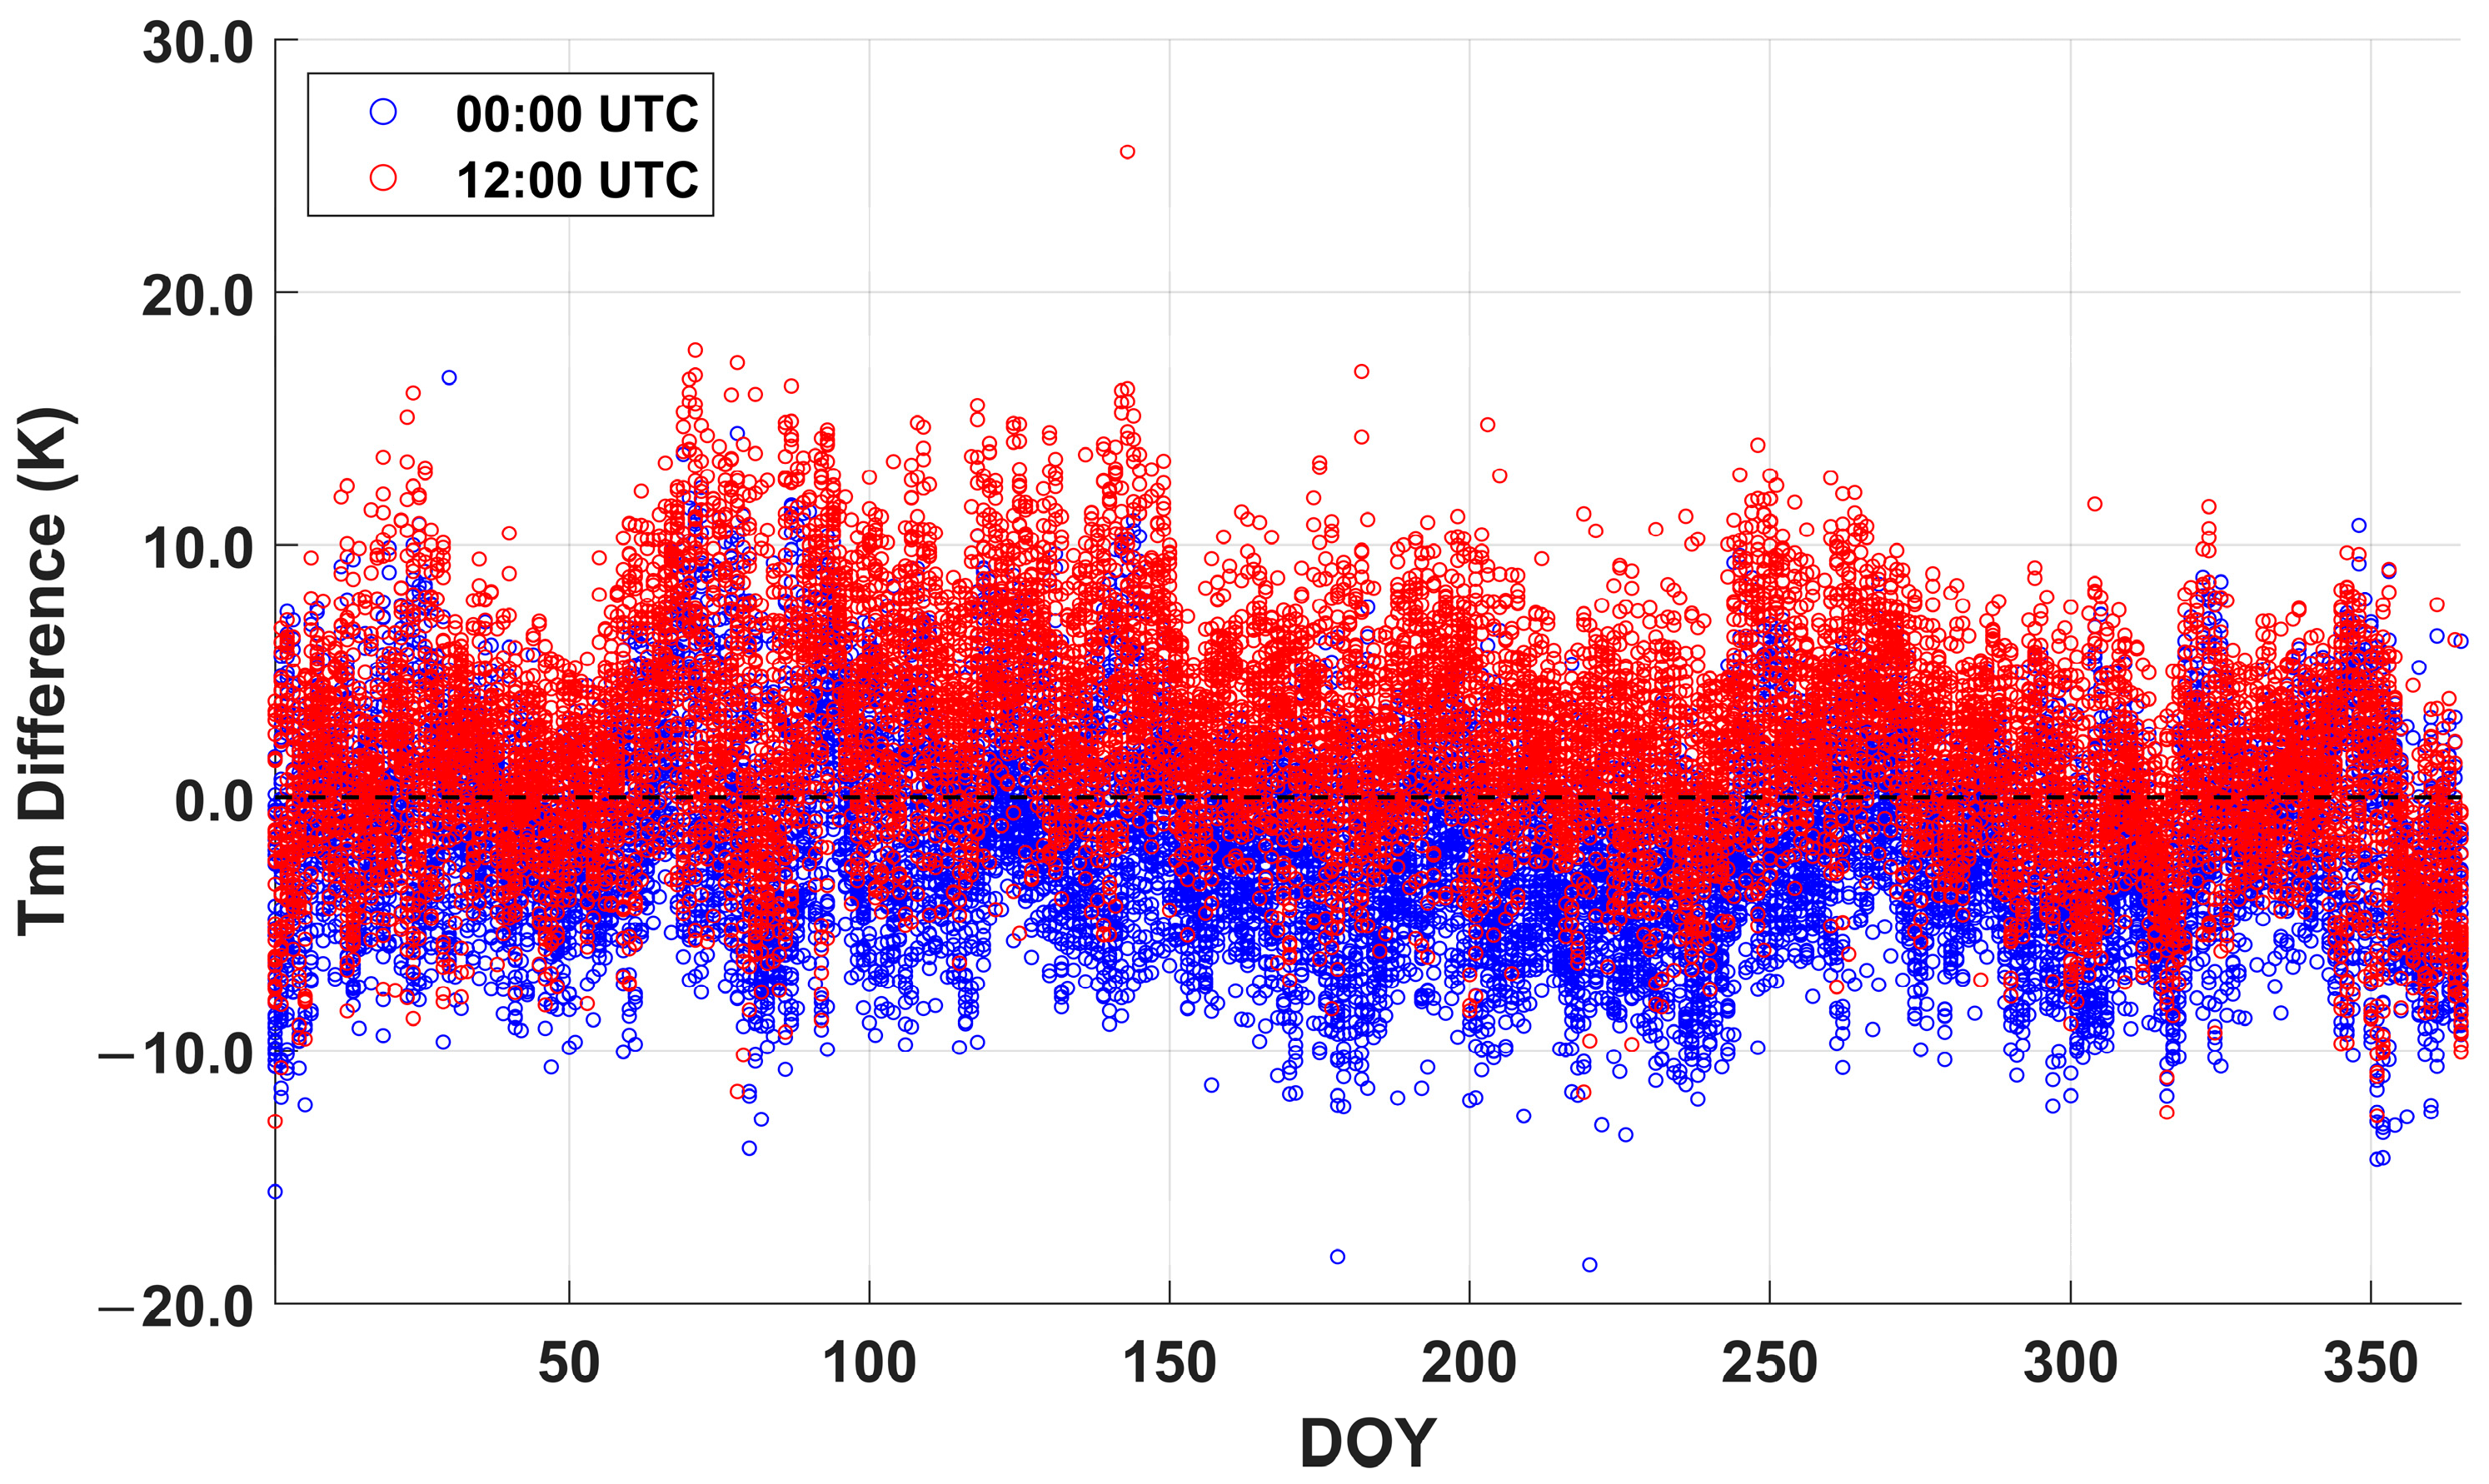
Using radiosonde data from 40 European modeling stations in 2022, this study analyzed the correlation between the HGPT2 model’s estimated Tm residuals and Ts residuals. As shown in Figure 2, the linear correlation coefficient between them is 0.64. Furthermore, Figure 3 indicates that the Tm residuals from the HGPT2 model exhibit a prominent diurnal variation. These observations, particularly the correlation and periodicity, suggest systematic biases in the HGPT2 model’s estimation of Tm. To address these limitations, a European Tm correction model (EurTm) was developed based on the HGPT2 model. This involved introducing the Ts residual as an explanatory variable and incorporating diurnal periodic features, utilizing the least squares method. The specific form of this model is presented in Equation (7).
where and are model coefficients, with the following physical interpretations: coefficient A represents the correction strength of the residual between the Ts estimated by the HGPT2 model and the measured Ts on the Tm estimation error, reflecting the indirect influence of Ts estimation bias on the Tm result; coefficients B and C together describe the diurnal variation characteristics of Tm, corresponding to the amplitudes of the sine and cosine components of UTC, respectively, and are used to capture the fluctuation pattern of Tm with the diurnal cycle; and coefficient D is a constant term, primarily used to correct for systematic bias present in the model. and represent the Tm and Ts values estimated from the HGPT2 model, respectively; and UTC is consistent with Equation (5). The coefficients for the EurTm model were determined through the application of the least squares method [36,37] to a dataset comprising HGPT2 model outputs and meteorological radiosonde observations from 40 stations across Europe spanning 2014 to 2023. The complete formulation of the model is given in Equation (8).
Figure 2.
Scatter plot of differences between Tm and Ts.
Figure 3.
Diurnal variation in Tm differences in 2022.
2.5. Statistical Metrics
Root Mean Square Error (RMSE) and Mean Absolute Error (MAE) are widely used evaluation metrics in regression analysis, effectively quantifying the deviation between predicted values and true values. They hold significant value for comparing the predictive capabilities of different models. Based on the above considerations, this study employs both MAE and RMSE to systematically evaluate the accuracy performance of various weighted mean temperature models in the European region. Specifically, MAE, by calculating the average of absolute errors, intuitively reflects the average prediction bias of the model. It is less sensitive to outliers and is suitable for assessing the overall accuracy of the model. In contrast, RMSE, through averaging the squared errors and taking the square root, amplifies the weight of larger errors, making it more effective at revealing the model’s stability under extreme conditions. The complementary combination of these two metrics allows for a comprehensive analysis of model performance across different error distributions, providing multidimensional reference for optimizing the Tm model in the European region. The calculation methods for MAE and RMSE are provided in Equations (9) and (10) of this paper, respectively, and the analysis results will be discussed in detail in subsequent sections.
where represents the total number of samples, denotes the Tm value estimated by the Tm model, and represents the Tm calculated by the radiosonde station as a reference value.
3. Accuracy Assessment of Tm Models
This study conducted a comparative validation of four Tm models, including Bevis, ETmPoly, HGPT2, and EurTm, using measured data from 40 spatially distributed modeling stations and 13 non-modeling stations in 2024. Validation with data from the modeling stations was used to evaluate the temporal extrapolation capability of the EurTm model under known conditions, and the results are detailed in Section 3.1. Validation using non-modeling station data assessed the model’s generalization performance in unknown scenarios, and the corresponding results are presented in Section 3.2.
3.1. Accuracy Analysis of Tm Models at Modeling Stations in 2024
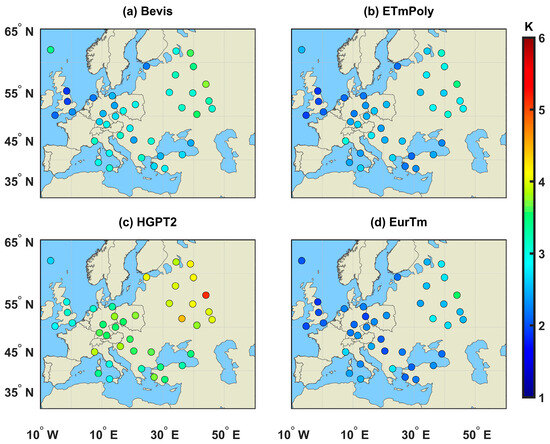
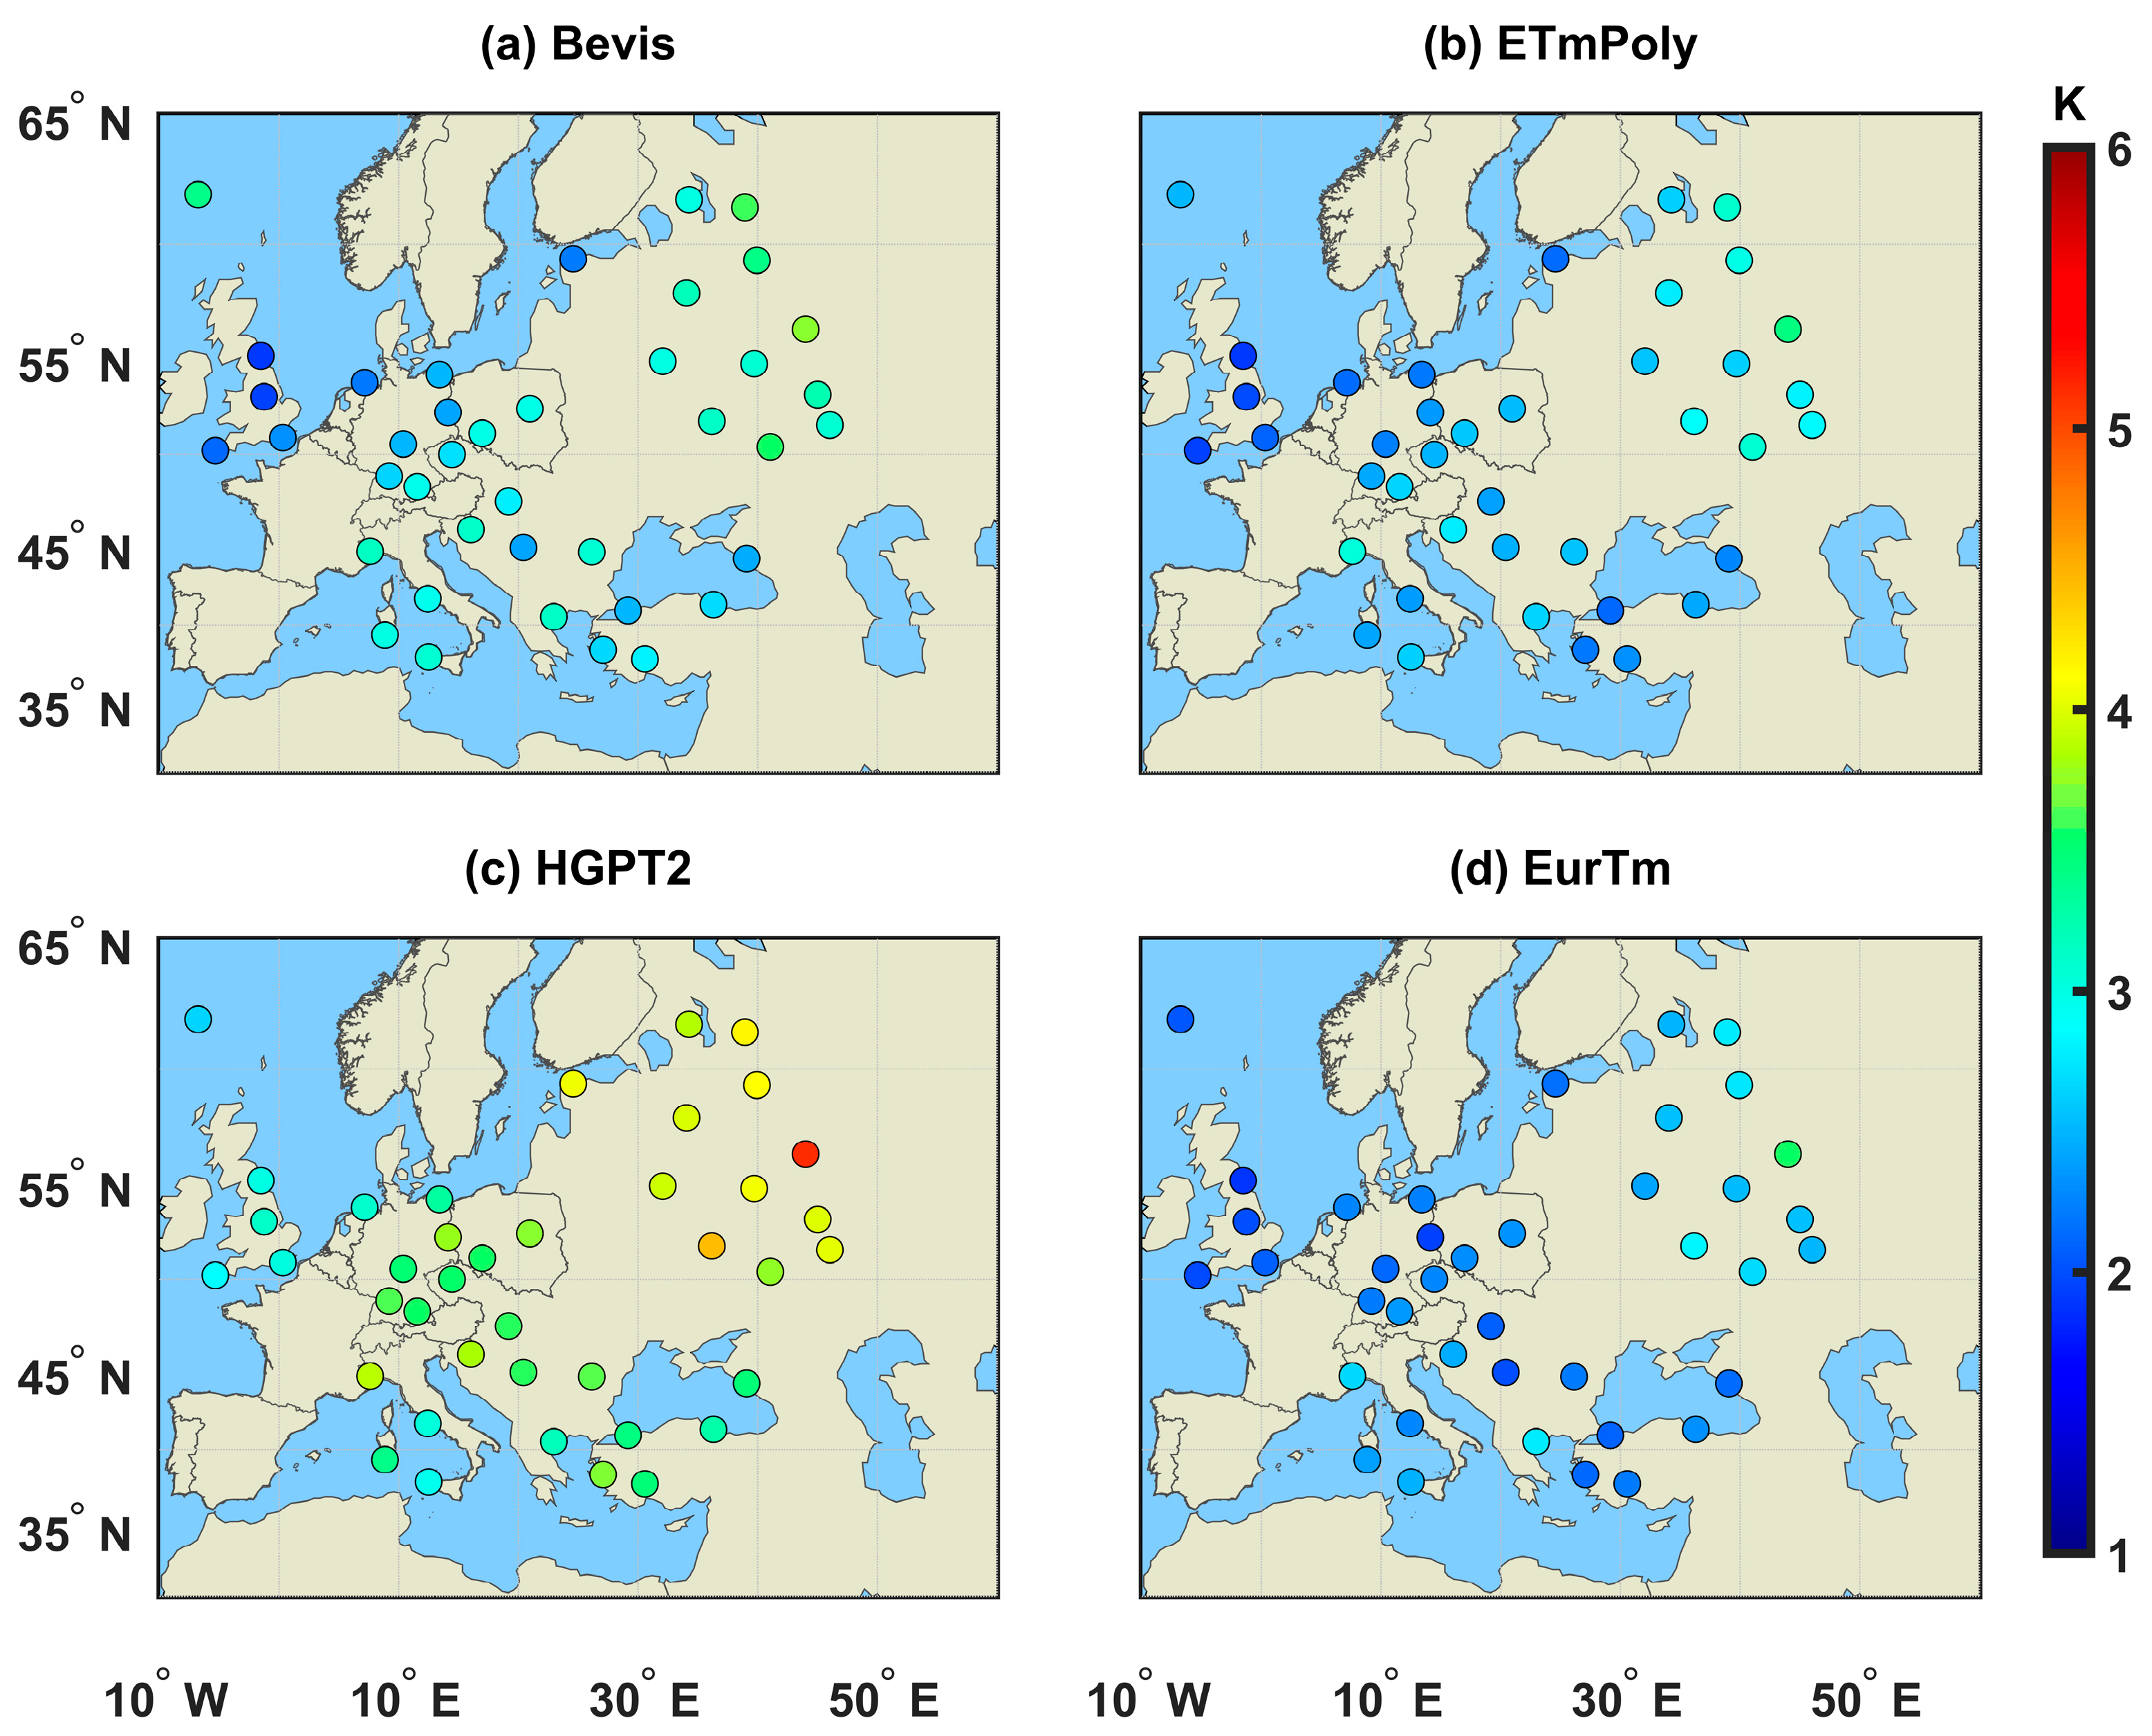
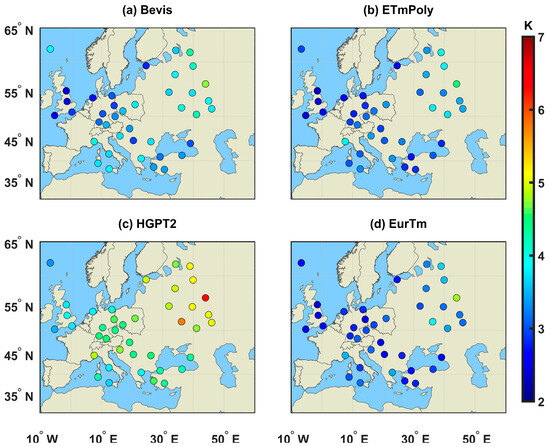
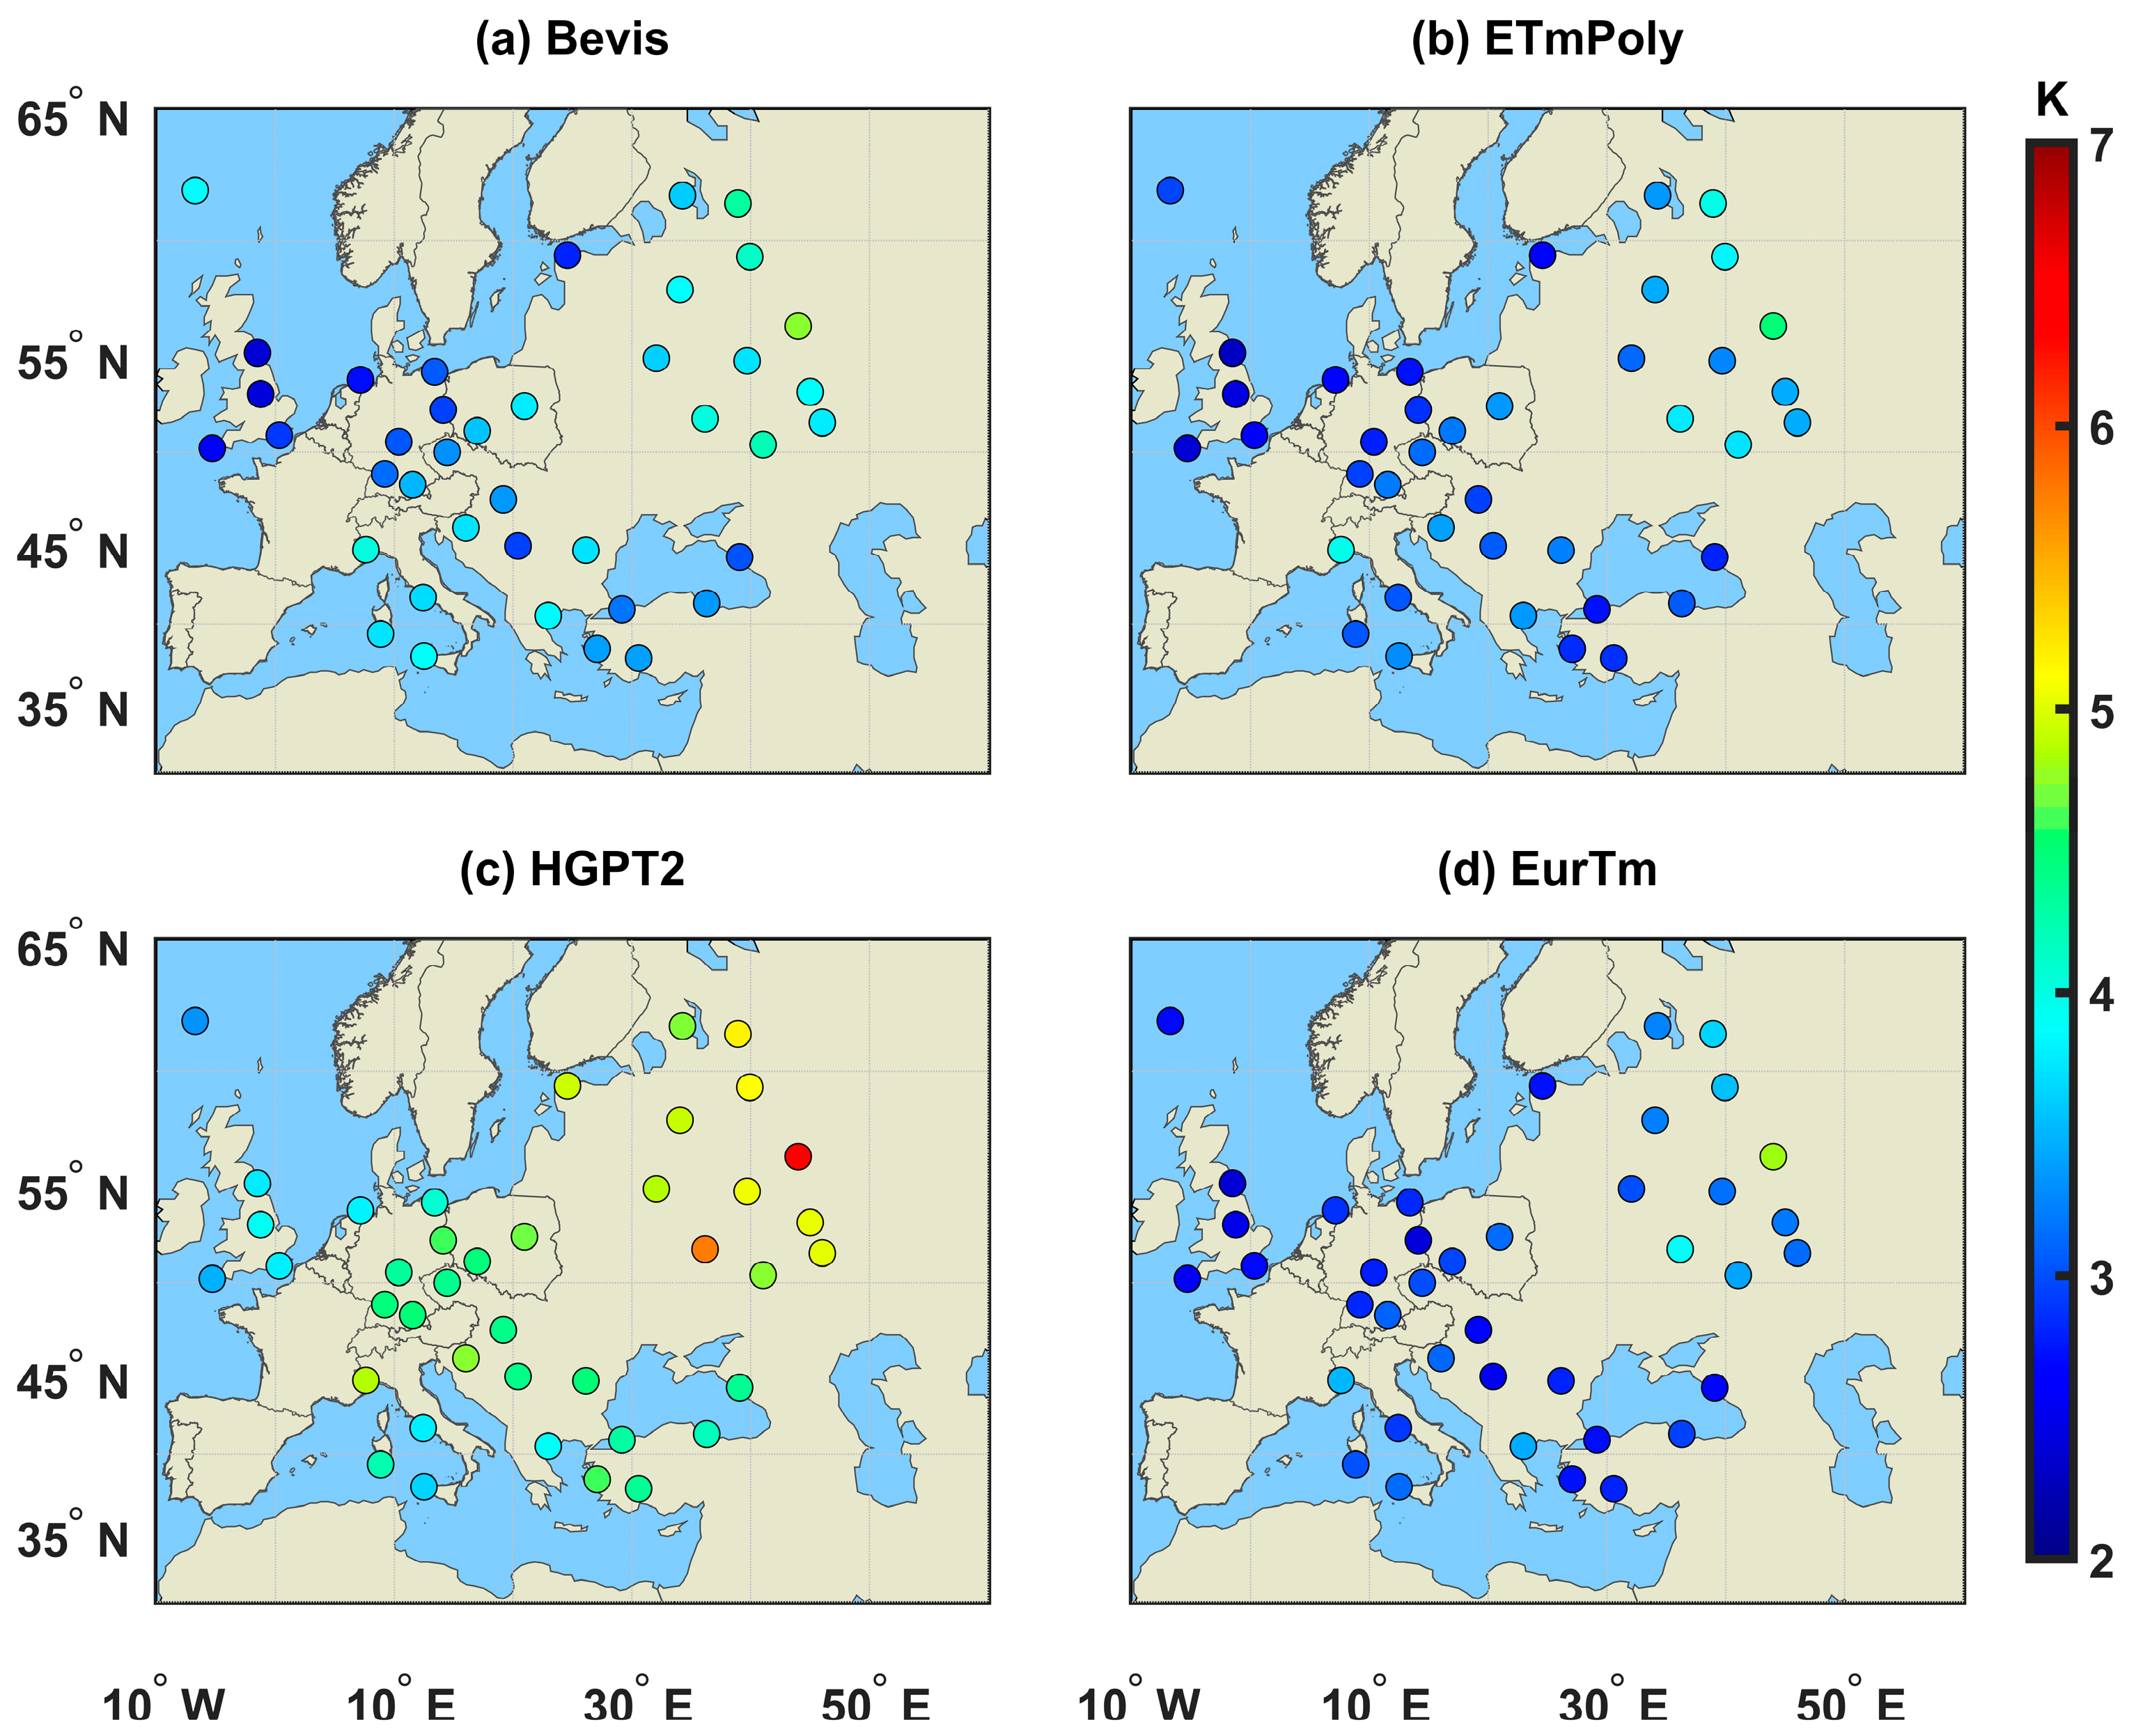
To validate the spatial performance of the EurTm model at the modeling stations, we calculated the MAE and RMSE values for all four Tm models. These error metrics are comparatively presented in the form of geographical distribution maps, with detailed results shown in Figure 4 and Figure 5.
Figure 4.
Spatial distribution of MAE between the four Tm models and measurements from 40 radiosonde stations across Europe in 2024.
Figure 5.
Spatial distribution of RMSE between the four Tm models and measurements from 40 radiosonde stations across Europe in 2024.
Figure 4 reveals that both the Bevis and ETmPoly models exhibit larger MAE values in northeastern Europe. The HGPT2 model demonstrates significantly higher MAE values in central and northeastern Europe compared to other European regions. While the other three models exhibit greater spatial variability, the EurTm model achieves a more homogeneous MAE distribution (predominantly 2–3 K) across Europe and consistently yields better results at every station. Figure 5 further reveals that the spatial distribution of RMSE for all four models resembles that of MAE, albeit with generally elevated values. These results demonstrate that the proposed EurTm model achieves greater stability and accuracy across Europe.
Table 1 presents statistical results of MAE and RMSE values from the 40 modeling stations in 2024. For MAE, the HGPT2, Bevis, and ETmPoly models yielded average values of 3.61 K, 2.84 K, and 2.52 K across Europe, respectively. In contrast, the EurTm model demonstrated a lower average MAE of 2.35 K. These results indicate substantial estimation errors for the HGPT2, Bevis, and ETmPoly models in European applications, with EurTm showing a notable improvement. Specifically, EurTm achieved reductions in average MAE of approximately 34.9% compared to HGPT2, 17.3% compared to Bevis, and 6.8% compared to ETmPoly. MAE values for the EurTm model ranged narrowly from 1.88 K to 3.56 K, further confirming its stability. The average RMSE values were 4.49 K for HGPT2, 3.48 K for Bevis, and 3.15 K for the ETmPoly model. The EurTm model again demonstrated superior performance with an average RMSE of 3.02 K, representing reductions of 13.2% compared to the Bevis model, 32.7% compared to the HGPT2 model, and 4.1% compared to the ETmPoly model. Among all evaluated models, the EurTm model demonstrated superior accuracy for European applications.
Table 1.
Error statistics of various Tm models based on 40 modeling stations in 2024.
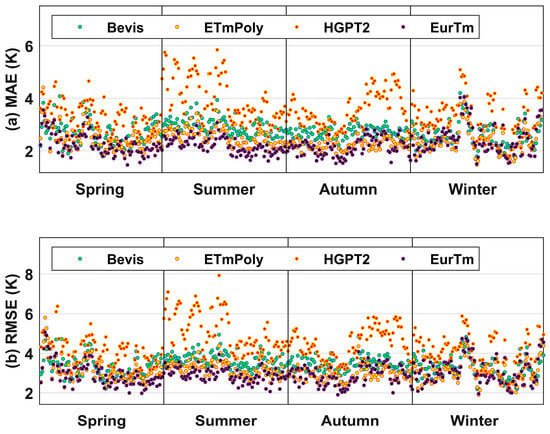
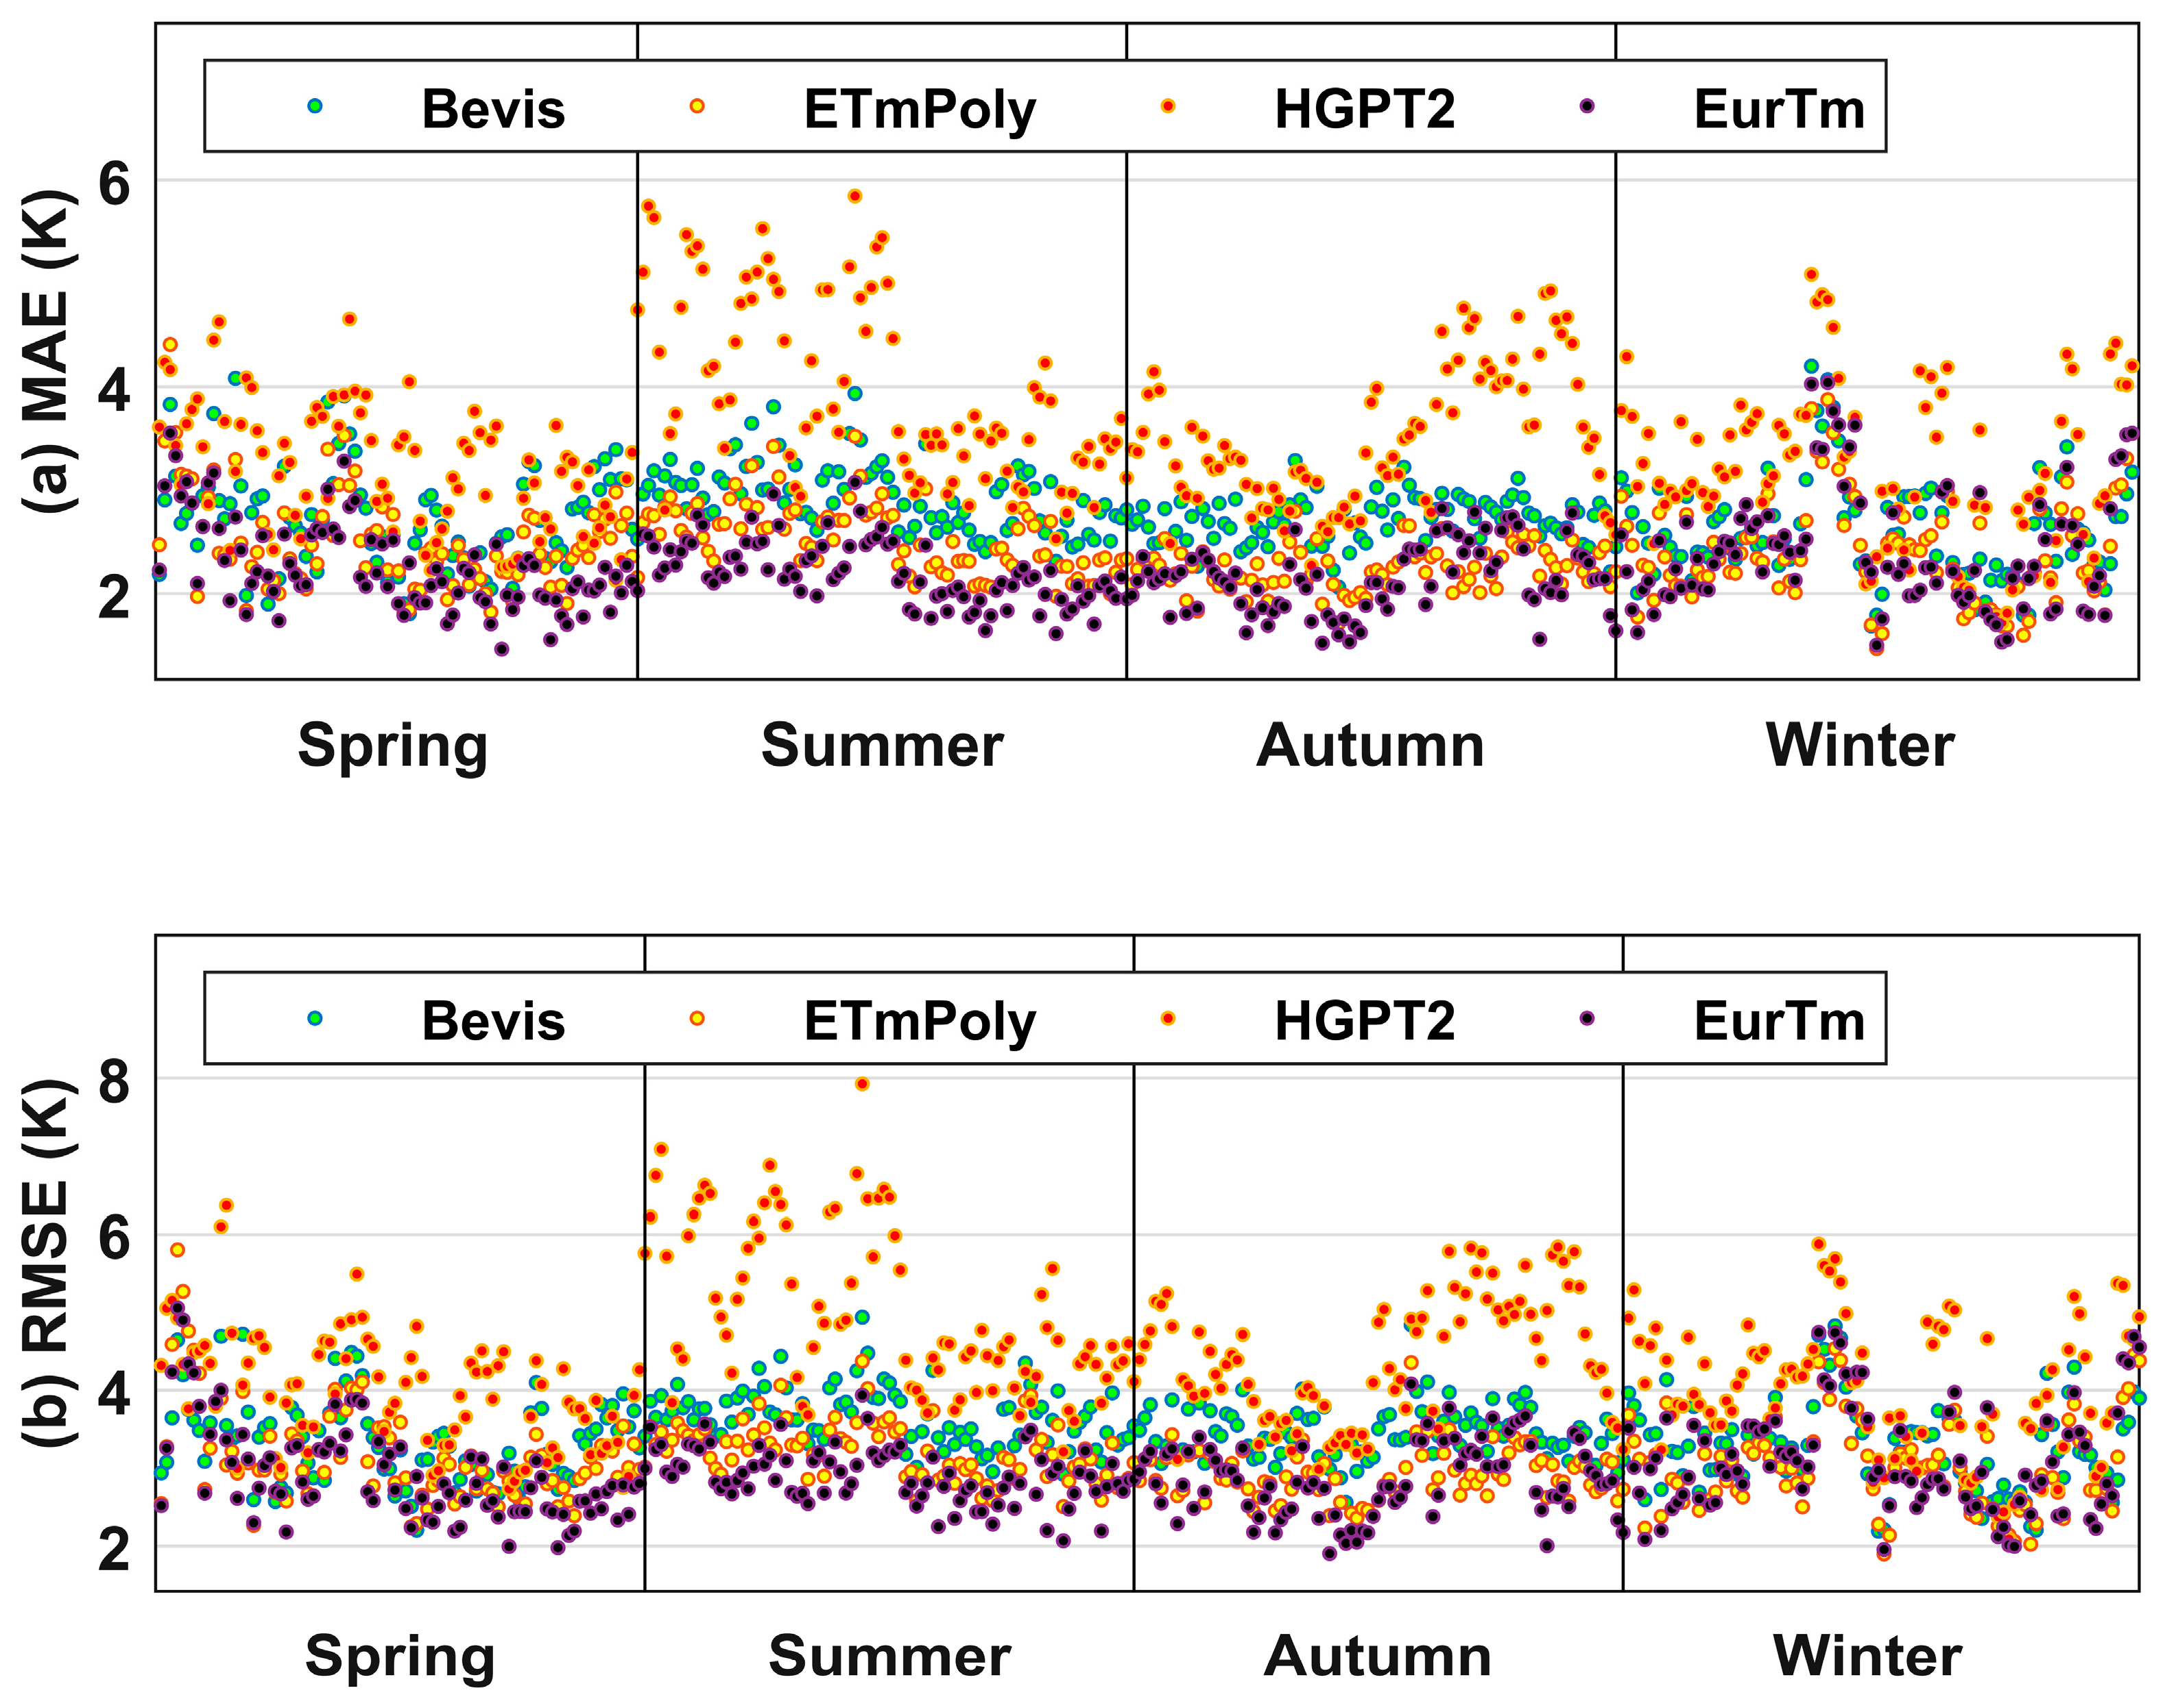
An analysis of daily MAE and RMSE values was conducted for the four Tm models to evaluate their seasonal performance. As shown in Figure 6, all models exhibited clear seasonal variations in MAE. The Bevis, ETmPoly, and HGPT2 models showed higher MAE values during summer. The Bevis model performed better in winter, while ETmPoly and HGPT2 achieved lower errors in autumn. In contrast, the EurTm model demonstrated larger MAE values in spring and winter, with the smallest errors occurring in autumn. Furthermore, the HGPT2 model exhibited higher MAE than the other models on most days in Europe during 2024, indicating the largest average deviation in Tm estimation. Regarding RMSE, the seasonal trends across the models were generally consistent with those of MAE, though RMSE fluctuations were more pronounced. Overall, the EurTm model achieved smaller and more stable daily MAE and RMSE values, was less affected by seasonal variations, and outperformed all other comparative models.
Figure 6.
Daily average error results between the four Tm models and measurements at modeling stations in 2024.
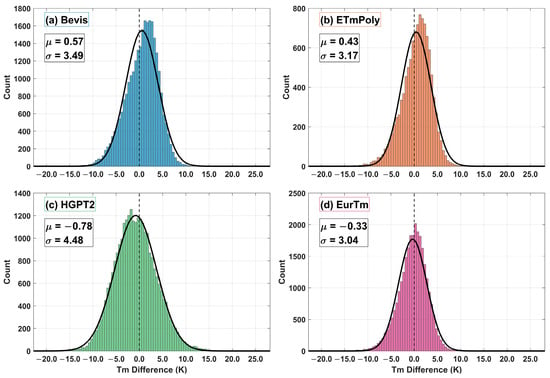
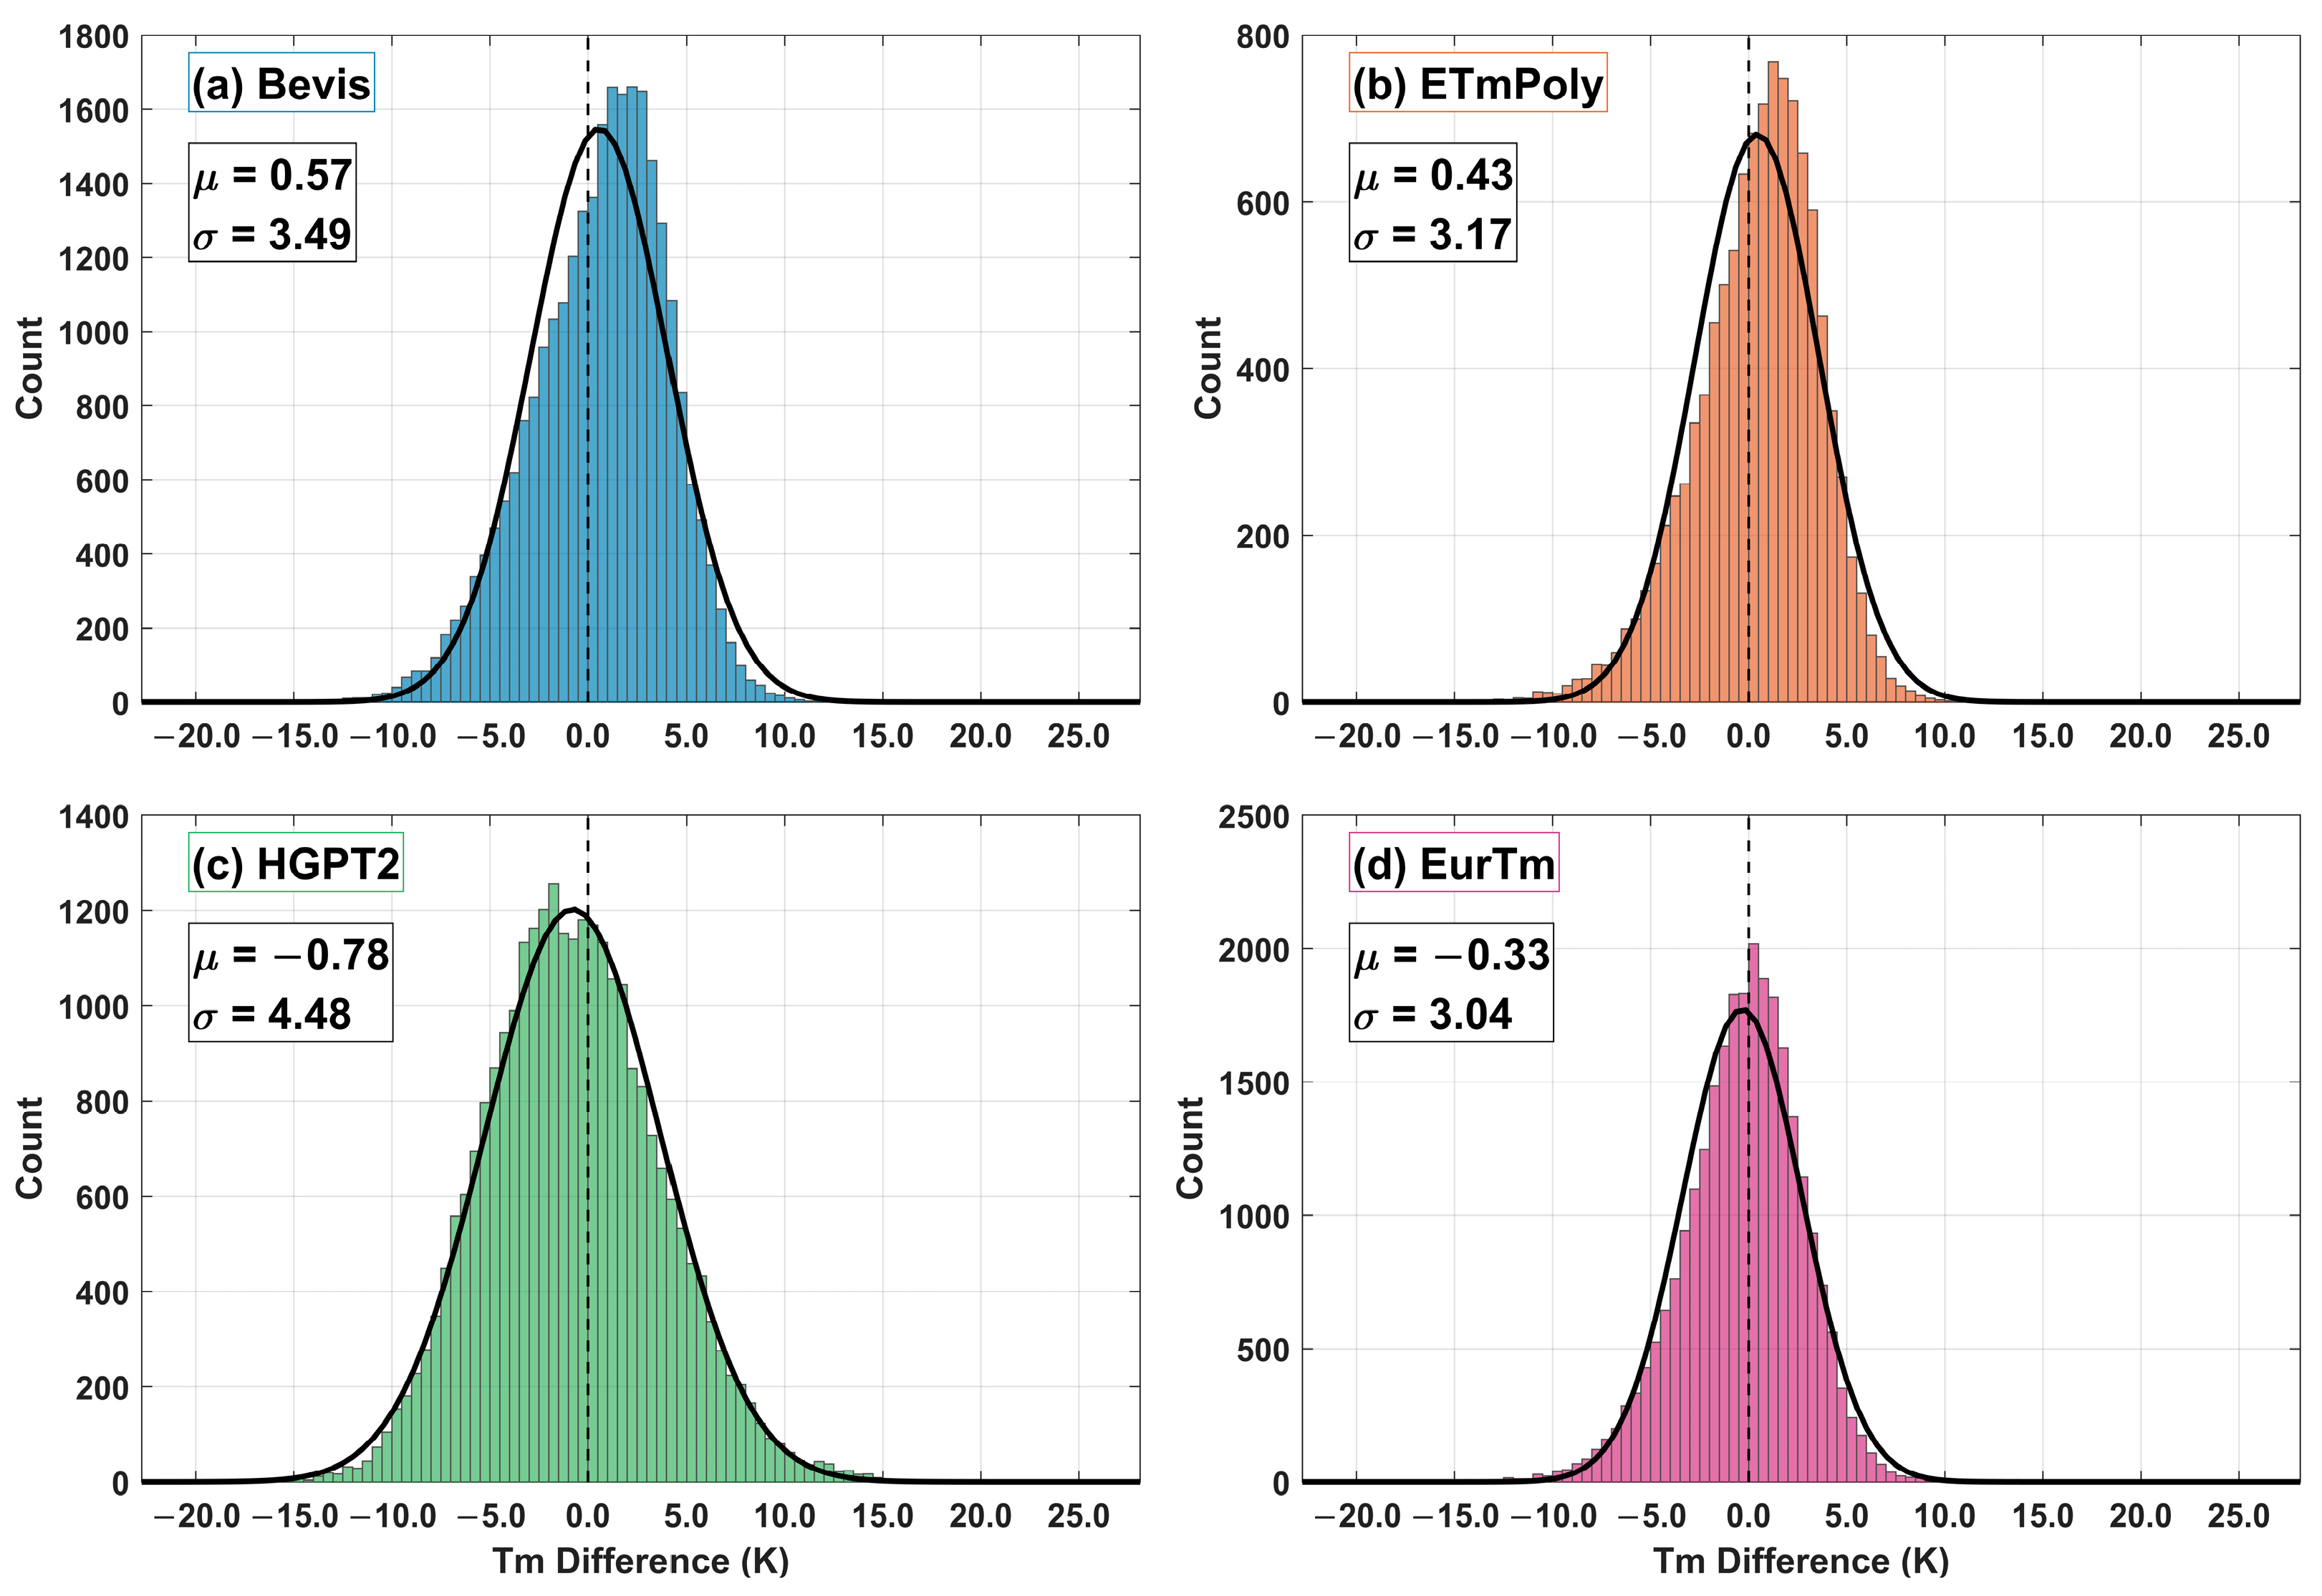
Furthermore, to comprehensively evaluate the error characteristics of the four Tm models at the modeling stations, this study statistically analyzed the residuals of each model and generated histograms, as shown in Figure 7. To quantitatively assess the distribution properties of the residuals, Jarque–Bera normality tests were conducted. The results indicated that the residual distributions of all models significantly deviated from normality, with p-values less than 0.001 for Bevis, ETmPoly, HGPT2, and EurTm. Despite this, the EurTm model exhibited the most favorable concentration characteristics, achieving the smallest mean of −0.33 K and the smallest standard deviation of 3.04 K, indicating minimal error fluctuation and the lowest estimation bias. The residual distribution of the HGPT2 model was the most dispersed, with a mean of −0.78 K and a standard deviation of 4.48 K. In comparison, the Bevis model exhibited a clear positive bias, showing a mean of 0.57 K and a standard deviation of 3.49 K, whereas the ETmPoly model displayed intermediate performance, with a mean of 0.43 K and a standard deviation of 3.17 K. In summary, despite the fact that the residuals of all models did not strictly conform to a normal distribution, the EurTm model still attained the highest accuracy and stability in estimating Tm across Europe.
Figure 7.
Histogram of the distribution of differences between the four models and the Tm values from the modeling stations (μ and σ represent the mean and standard deviation of the normal distribution curve, describing its central tendency and dispersion, respectively).
To quantitatively evaluate the statistical significance of the performance differences among the models, paired t-tests were conducted on the RMSE sequences from the modeling stations in 2024. The results demonstrate that the EurTm model achieved statistically highly significant improvements compared to the Bevis, ETmPoly, and HGPT2 models (all p-values < 0.001). This indicates that the probability of these observed differences occurring by chance is less than 0.1%, providing strong statistical evidence for the conclusive superiority of the EurTm model in estimating Tm over the European region.
3.2. Accuracy Analysis of Tm Models at Non-Modeling Stations in 2024
At the modeling stations, the EurTm model demonstrated significantly better accuracy in estimating Tm compared to the other three models and exhibited strong overall performance. However, the generalization capability of a model is crucial for assessing its practical value. To evaluate this, we further calculated the MAE and RMSE values for the 13 non-modeling stations in 2024. The detailed results are summarized in Table 2 and visually presented in Figure 8.
Table 2.
Error Statistics of Tm Models Based on Non-Modeling Stations in 2024.
Figure 8.
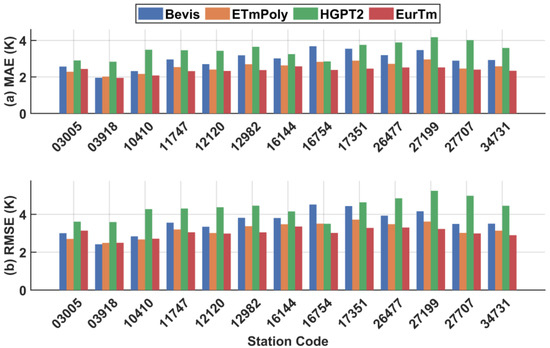
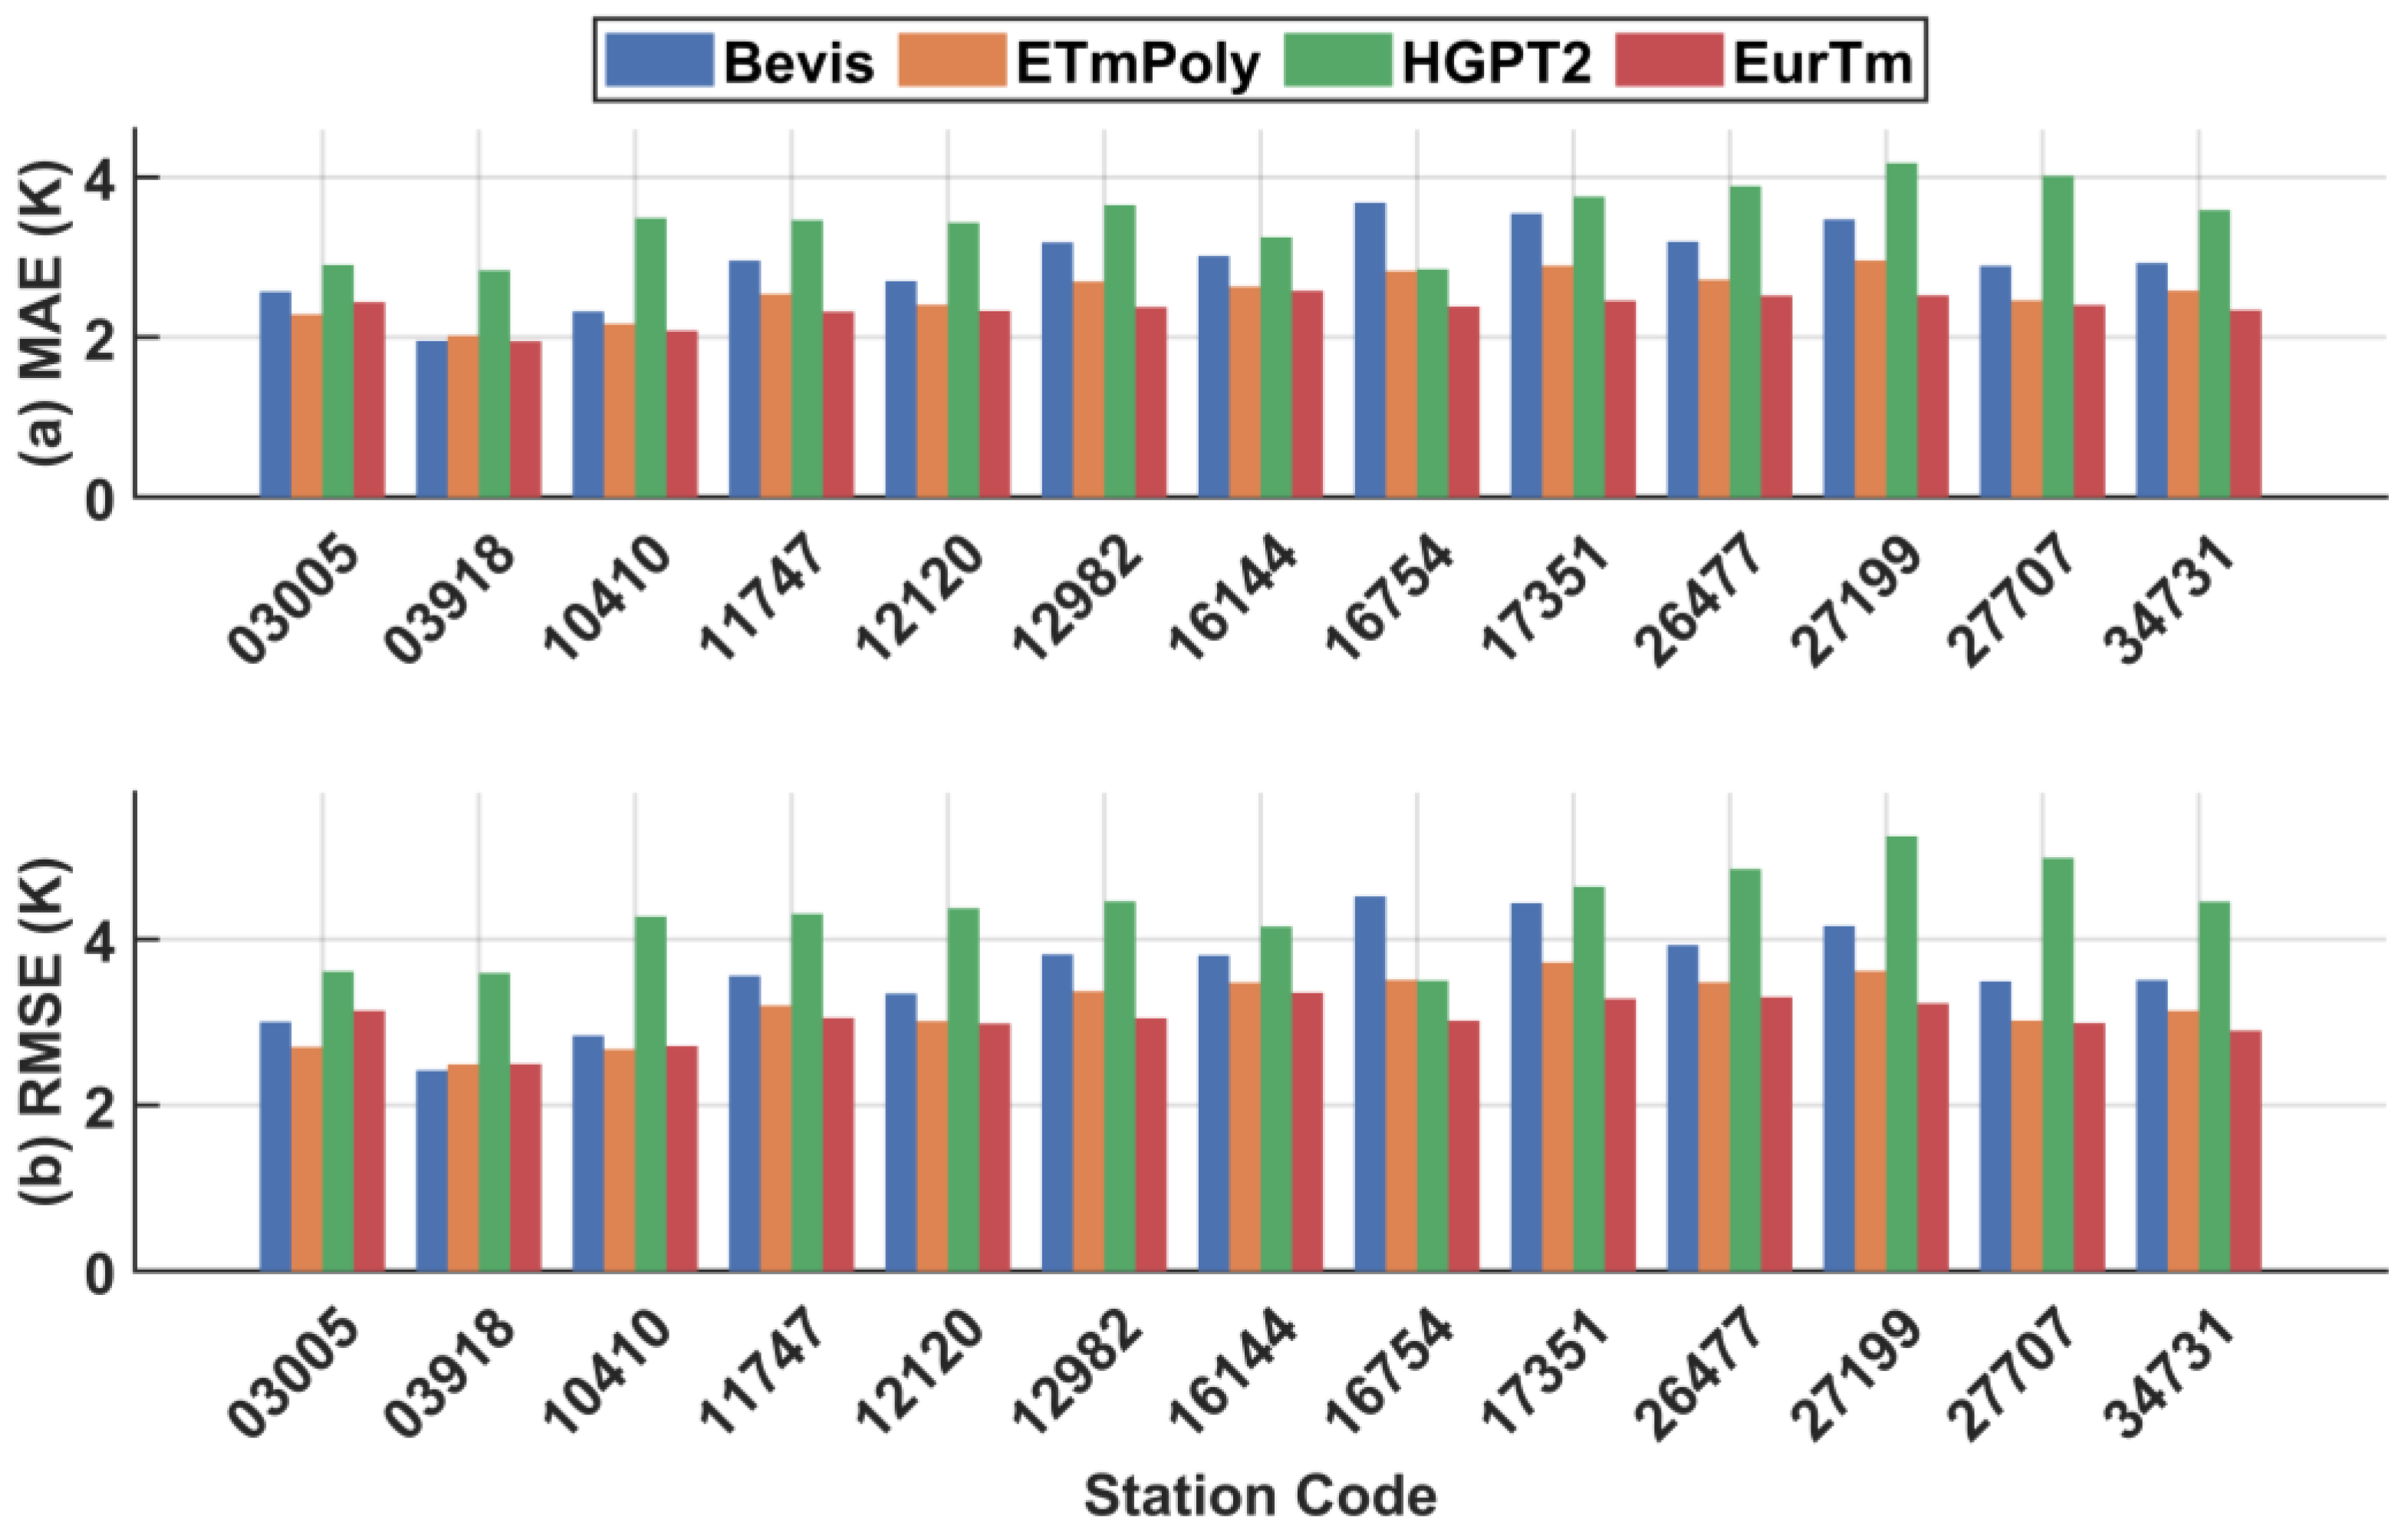
MAE and RMSE results of the four Tm models at 13 non-modeling radiosonde stations in 2024.
Table 2 indicates that at the 13 validation stations, the ranking of the four models was identical for MAE and RMSE. EurTm yielded the smallest errors (MAE: 2.36 K, RMSE: 3.04 K), whereas HGPT2 produced the largest (MAE: 3.49 K, RMSE: 4.34 K). The Bevis model (MAE: 2.96 K, RMSE: 3.60 K) and ETmPoly model (MAE: 2.55 K, RMSE: 3.19 K) showed moderate accuracy. Relative improvements in MAE for EurTm were approximately 32.4% over HGPT2, 20.3% over Bevis, and 7.5% over ETmPoly, with corresponding RMSE improvements of 30.0%, 16.1%, and 4.7%. These results confirm that EurTm provides the highest accuracy and stability among the evaluated models.
The superior performance of the EurTm model and the comparatively poor results of the HGPT2 model are clearly illustrated in Figure 8, which displays the MAE and RMSE metrics for all four models at the 13 validation stations during 2024. Specifically, EurTm achieved the lowest MAE values across most stations and the lowest RMSE values among all four models. Conversely, HGPT2 produced the highest MAE values at nearly all stations and exhibited higher RMSE values at most stations compared to the other models. Between the remaining two, the ETmPoly model generally outperformed the Bevis model, recording lower MAE values at most stations and consistently achieving lower RMSE values across all non-modeling stations.
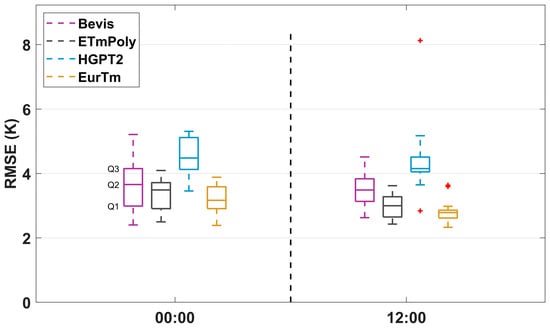
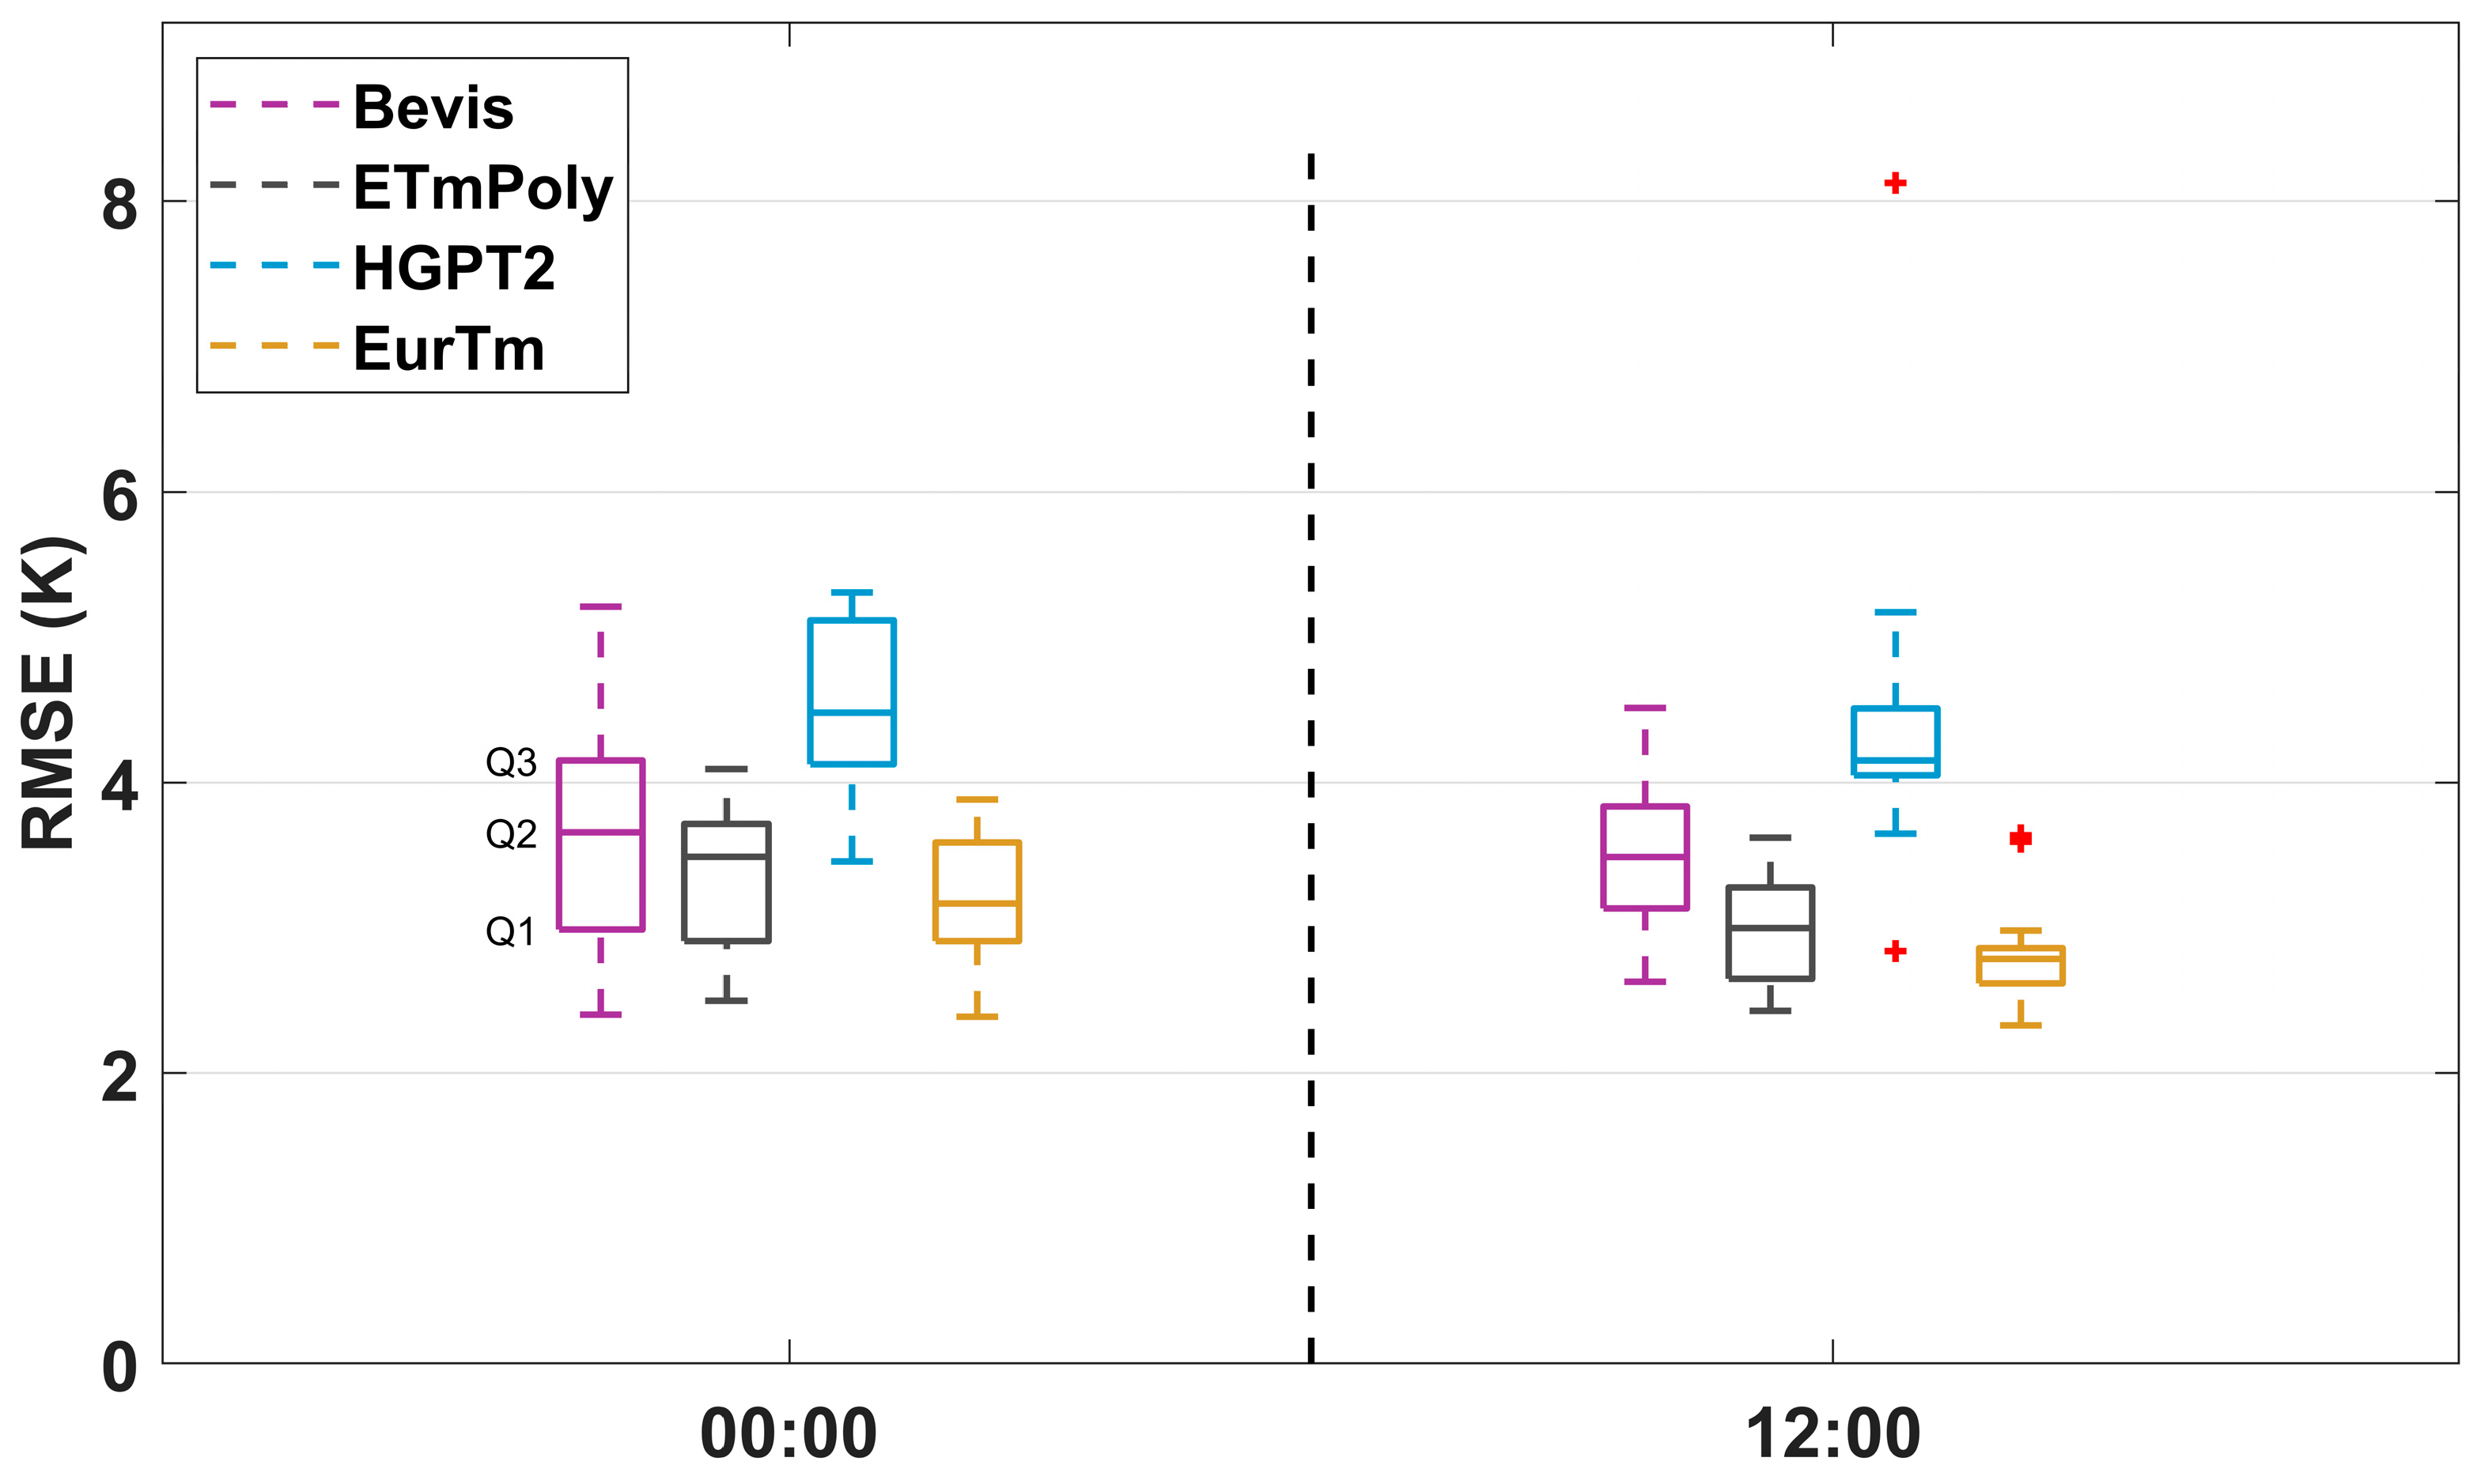
To evaluate the four different Tm models’ applicability at different observation times, this study calculated RMSE values for UTC 00:00 and 12:00 using non-modeling station data. The results are presented as boxplots in Figure 9. The analysis revealed that at UTC 00:00, the EurTm model exhibited the lowest median RMSE of 3.17 K. It was followed by the ETmPoly model with 3.49 K, the Bevis model with 3.66 K, and the HGPT2 model, which had the highest median RMSE of 4.48 K. At UTC 12:00, the EurTm model consistently recorded the lowest median RMSE at 2.79 K. The ETmPoly and Bevis models showed median values of 3.00 K and 3.49 K, respectively, while the HGPT2 model maintained the highest median RMSE at 4.15 K. These results clearly indicate the EurTm model’s superior performance in capturing instantaneous Tm variations compared to the other three models, which exhibit notable limitations in this regard. This efficacy of the EurTm model is primarily due to its incorporated daily cycle term, which significantly enhances its capability to represent diurnal Tm variations.
Figure 9.
RMSE statistics of Tm models at different observation times based on 13 non-modeling stations in 2024 (In the box plot, Q1 and Q3 represent the first and third quartiles, respectively, with their distance indicating data dispersion; Q2 denotes the median, reflecting the central tendency of the data; red plus signs indicate outliers).
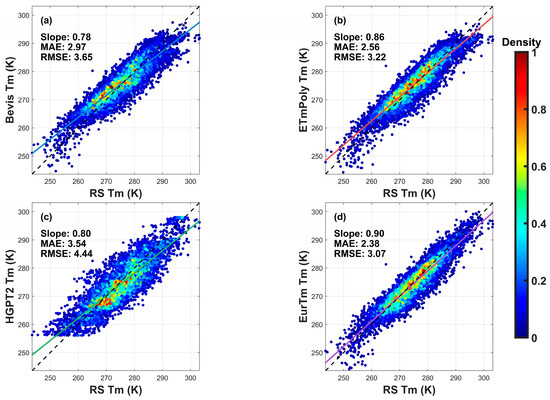
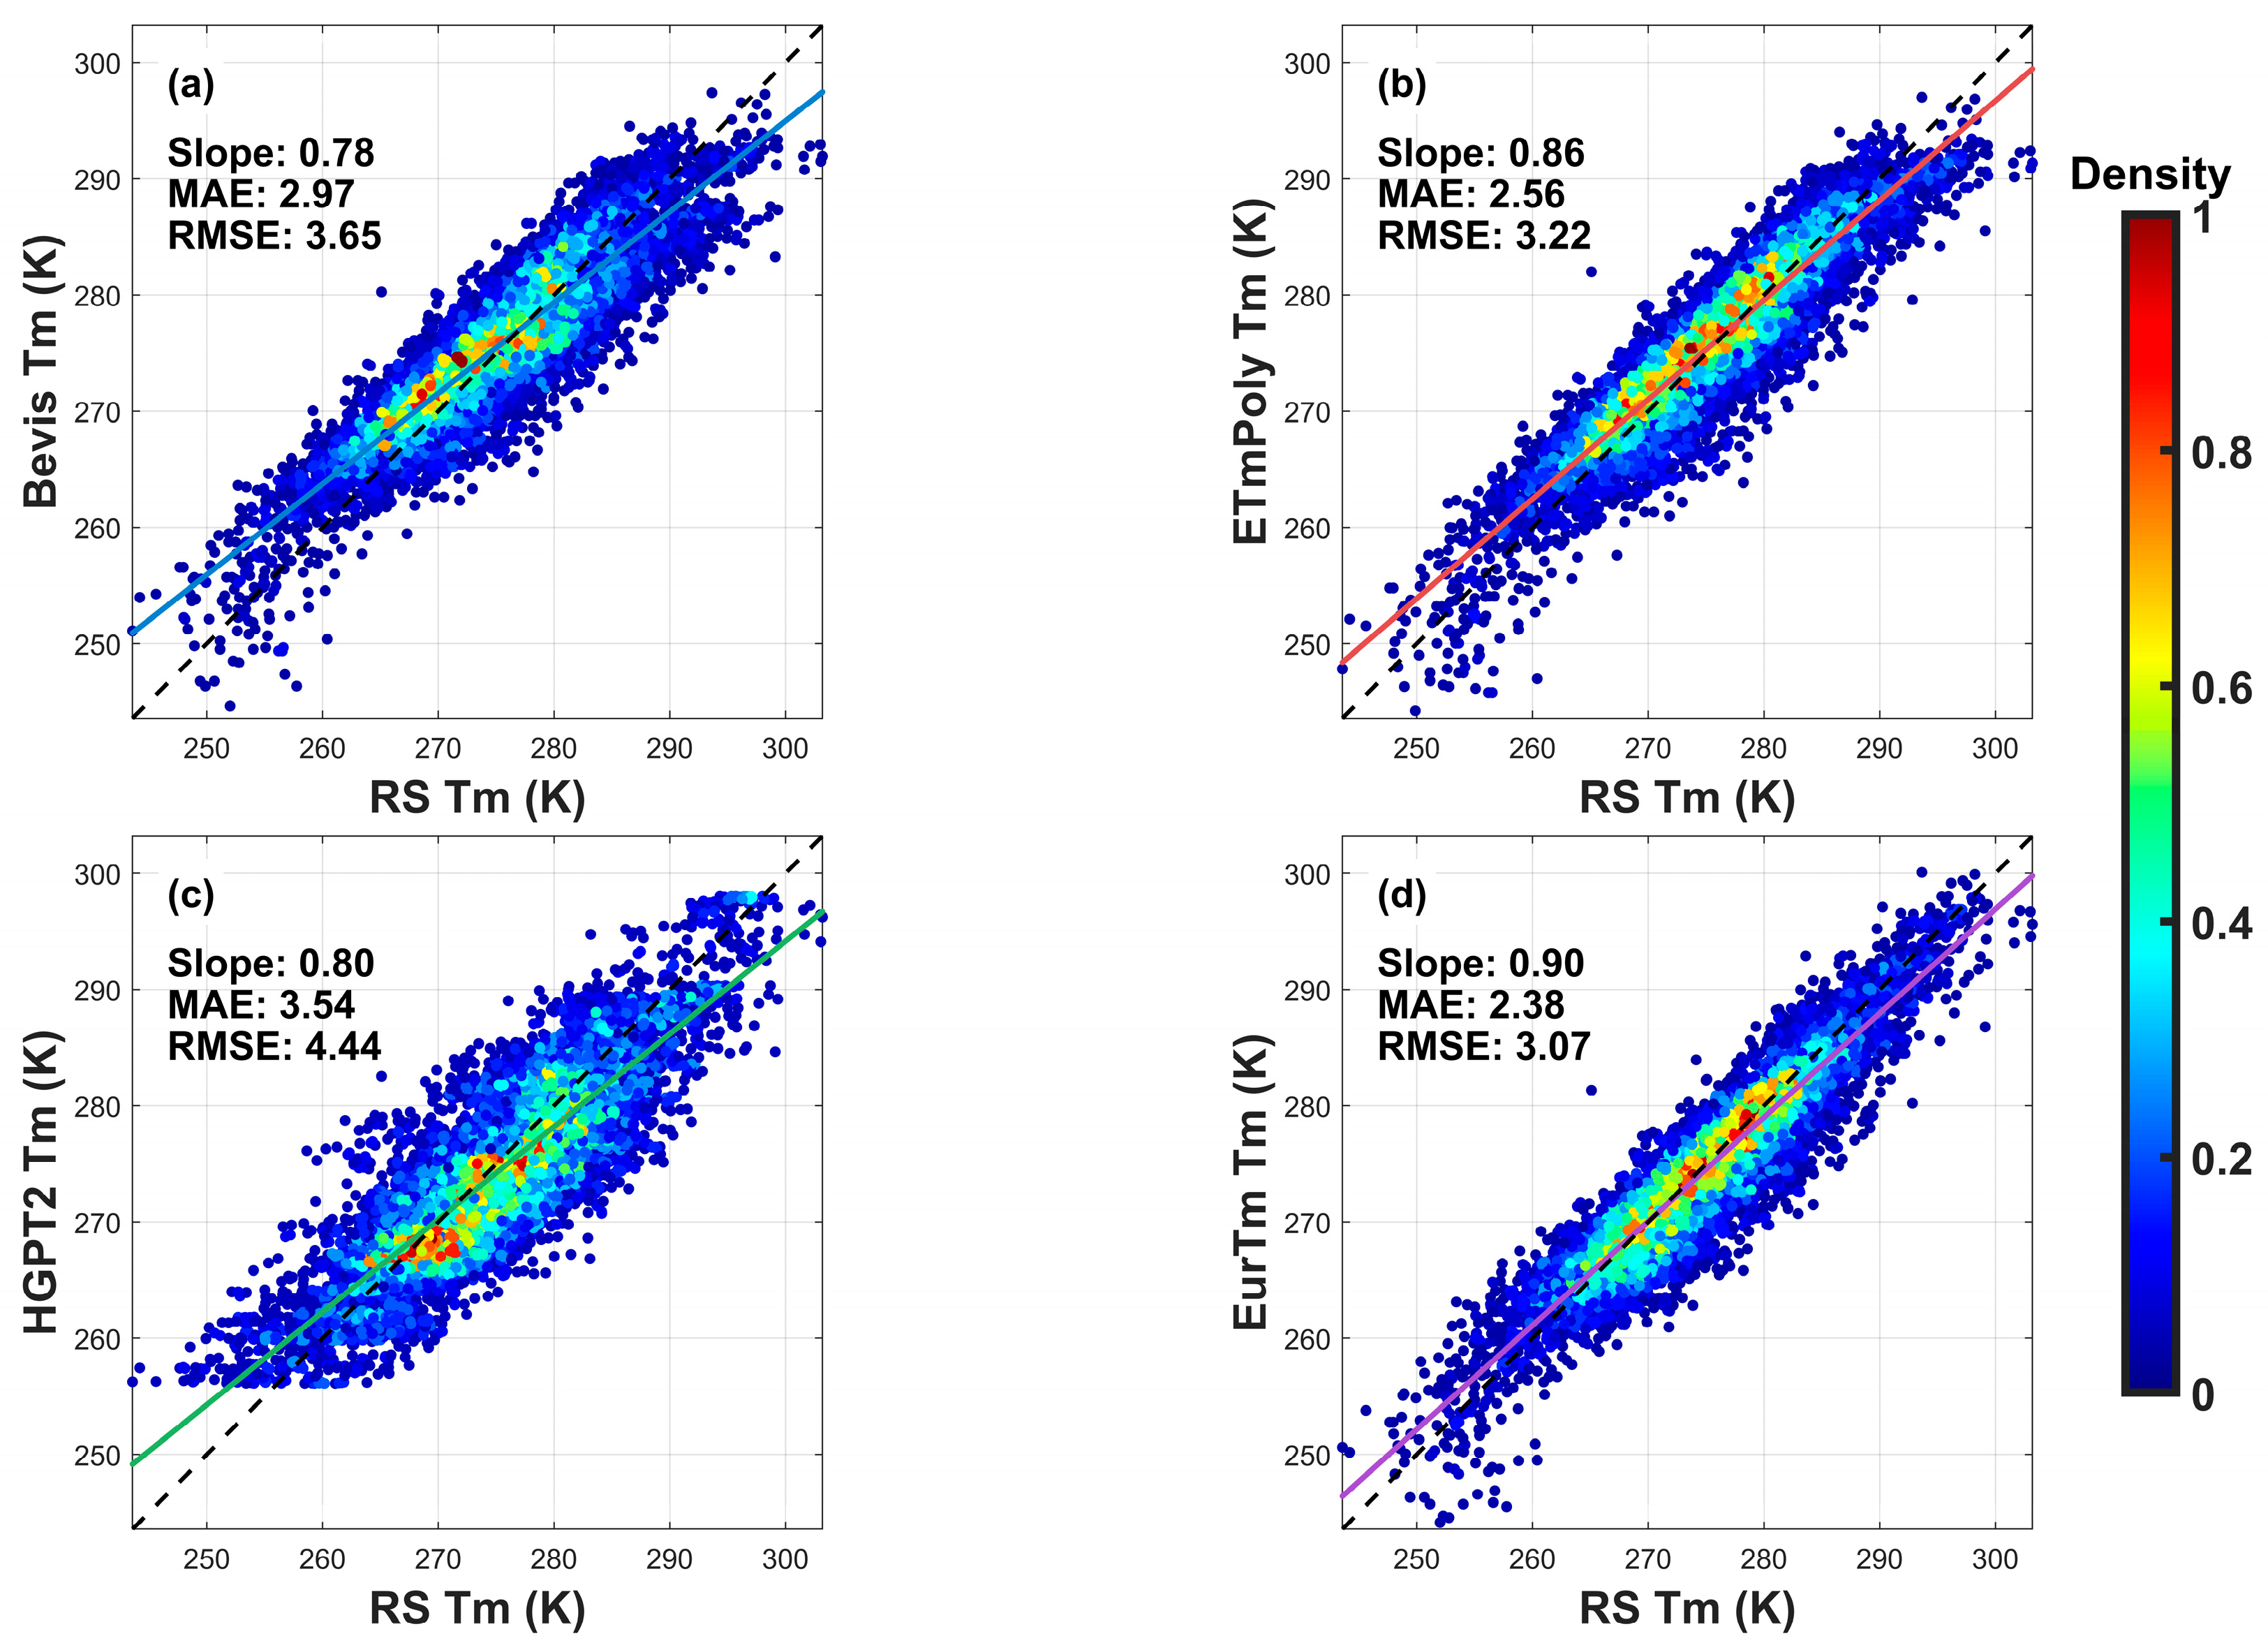
To further evaluate the consistency of the four models in estimating Tm, Figure 10 presents the linear regression analysis between the model-derived estimates and radiosonde-observed Tm values at non-modeling stations in 2024. The dashed line represents the 1:1 reference line, while the solid line indicates the fitted regression line. The results show that the EurTm model exhibits a tighter scatter distribution around the 1:1 line, with the optimal regression slope of 0.90. In contrast, the HGPT2 model displays the most dispersed scatter distribution and the lowest slope of 0.80, indicating the poorest performance. In terms of MAE, the EurTm model achieves 2.38 K, outperforming the ETmPoly model at 2.56 K, the Bevis model at 2.97 K, and the HGPT2 model at 3.54 K. Similarly, for RMSE, the EurTm model yields the best result of 3.07 K, whereas the HGPT2 model shows the largest error of 4.44 K. Notably, the HGPT2 model exhibits a clear value range limitation in its Tm estimates, approximately between 256 K and 298 K, where predicted values remain constrained within this interval regardless of the actual Tm magnitudes. This limitation is likely due to systematic underestimation introduced by grid interpolation in boundary regions. The EurTm model, developed based on the HGPT2 framework and enhanced by incorporating measured Ts data and UTC information, effectively mitigates this limitation. Overall, the EurTm model demonstrates a more robust linear relationship between estimated and radiosonde-observed Tm values.
Figure 10.
Scatter plots between the four Tm models and non-modeling stations in 2024.
4. Impact of Tm on GNSS PWV Calculation Accuracy
A key objective of the European regional model is to increase the accuracy of Tm estimates, leading to improved GNSS-derived PWV results. Nevertheless, the spatial separation between GNSS and radiosonde stations, combined with the fact that most GNSS sites lack meteorological instrumentation and are used mainly for geodetic purposes, poses a challenge for evaluating the role of Tm in GNSS PWV determination. In response, this work employs the methodology described in reference [38] to quantify the influence of Tm on GNSS PWV, following Equation (11).
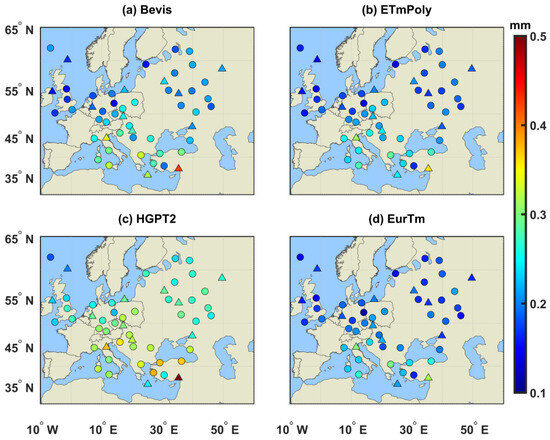
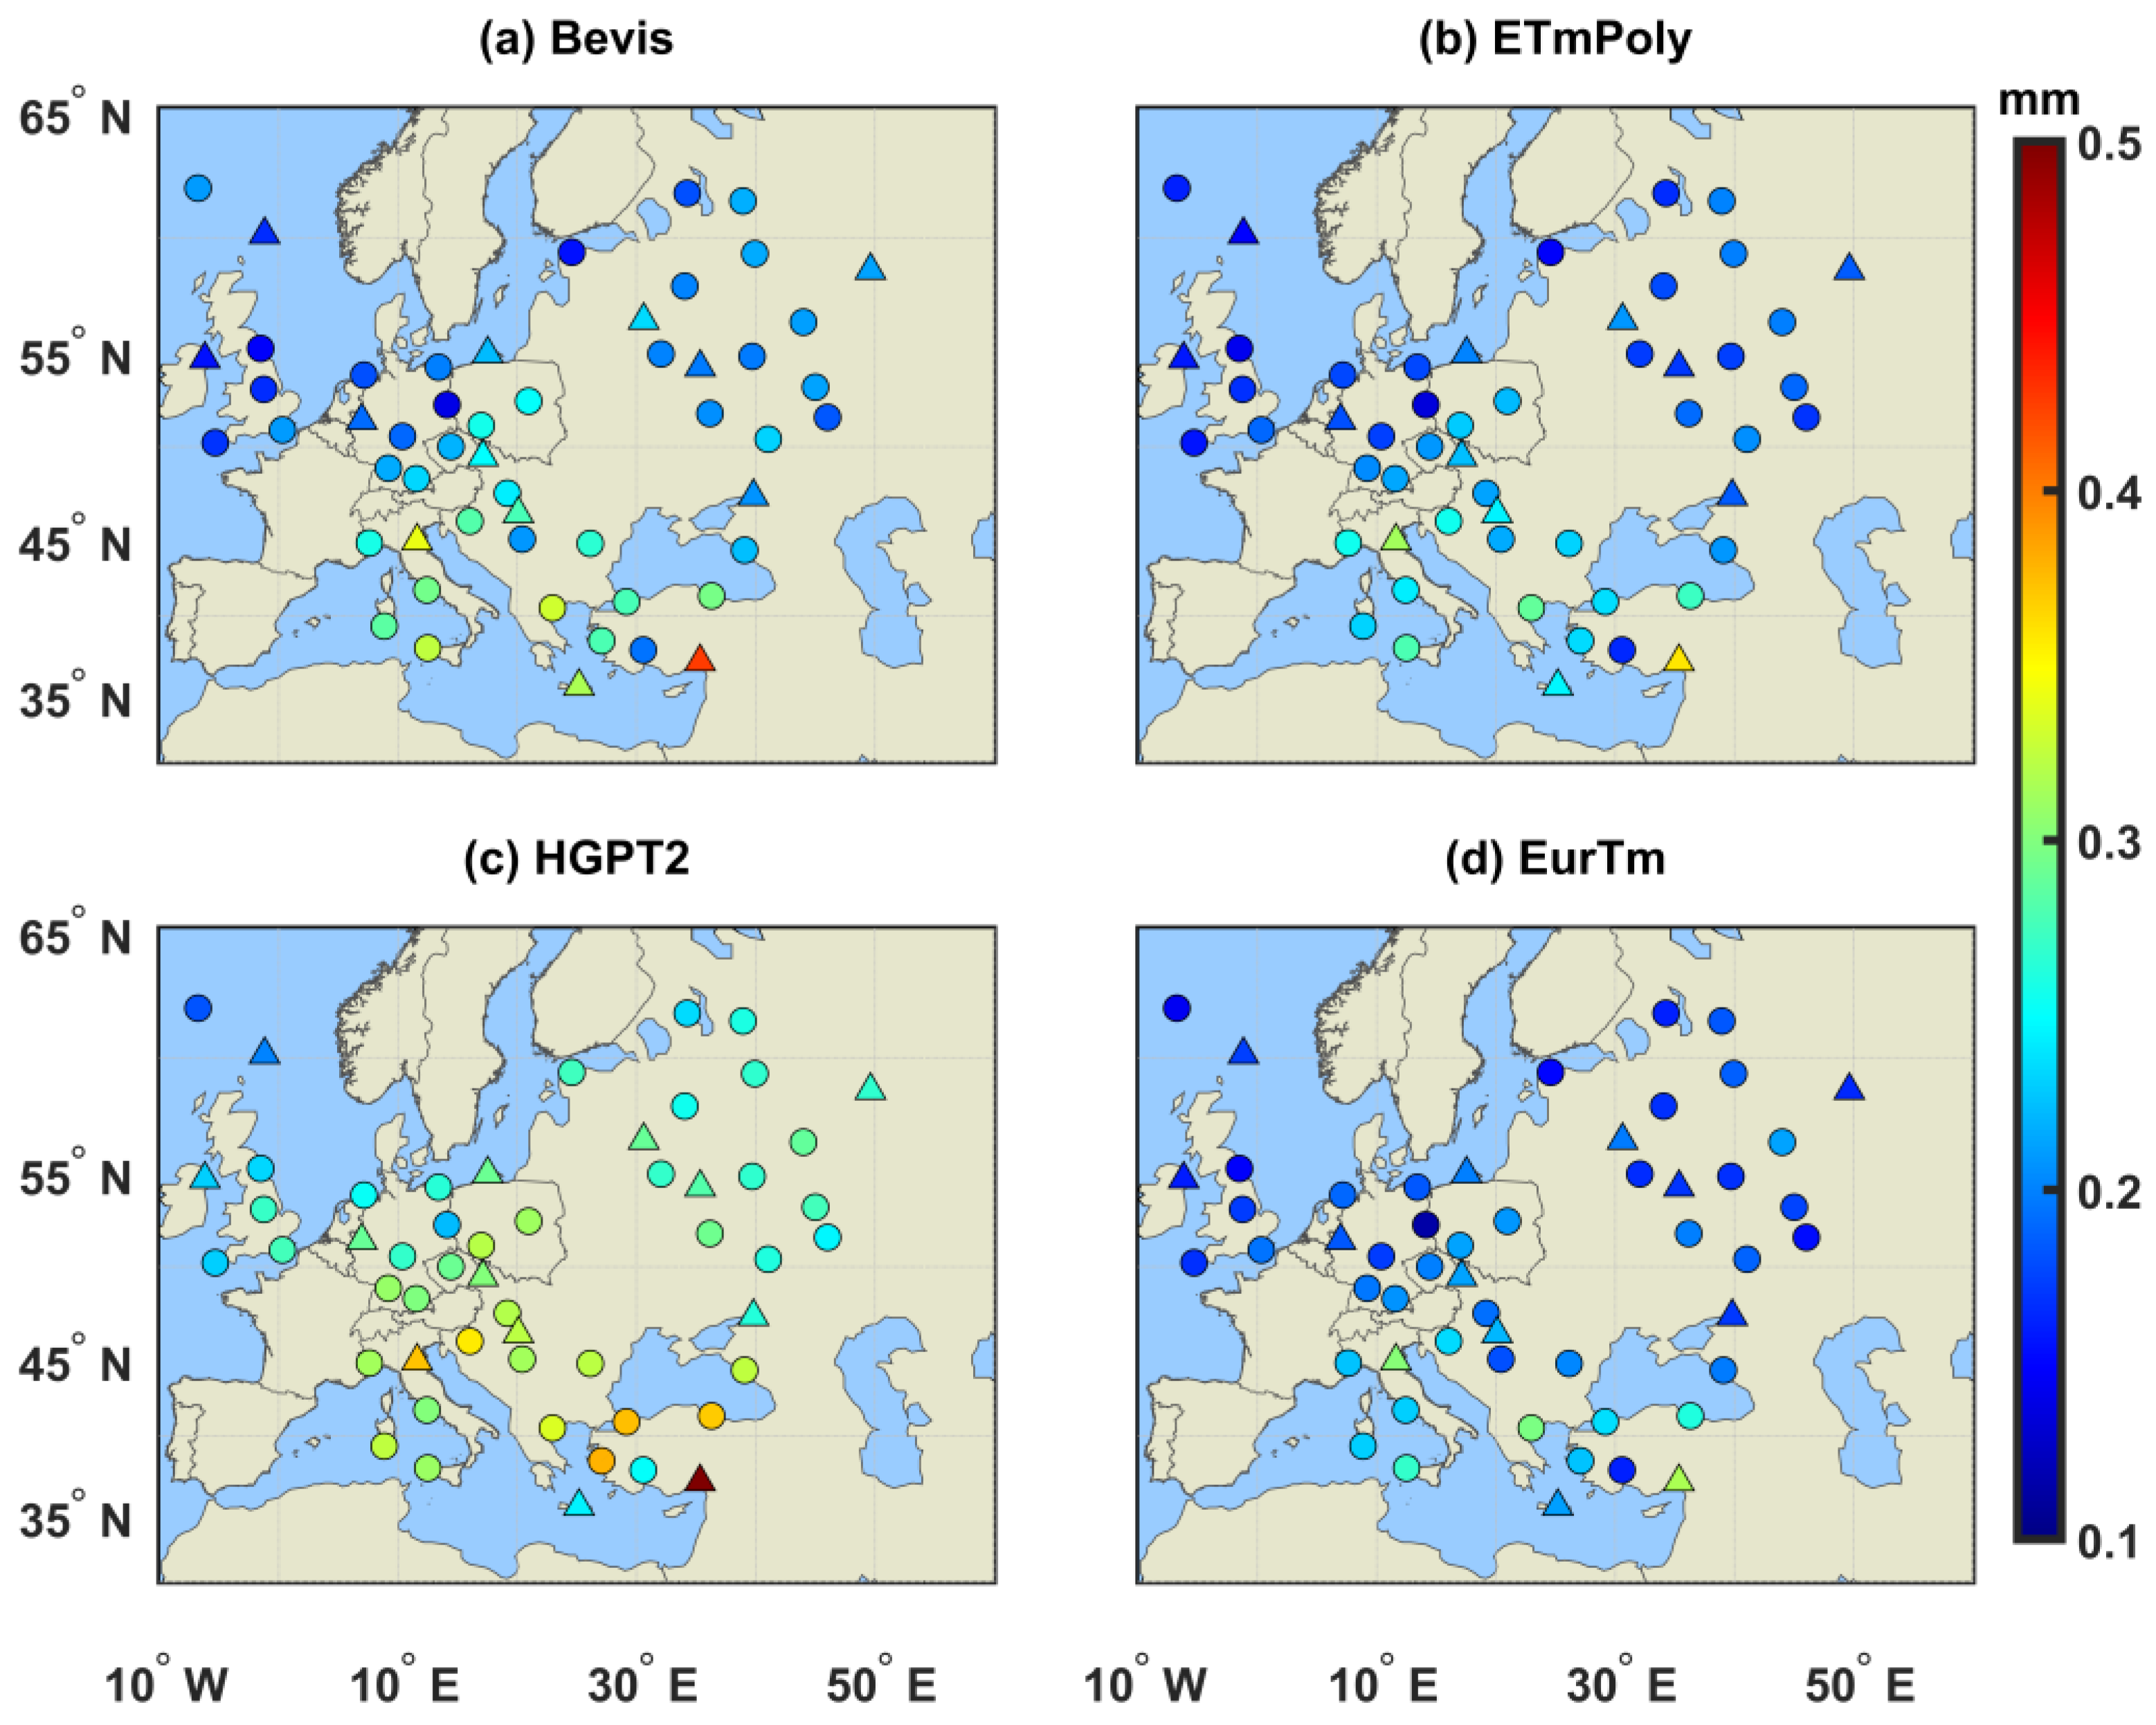
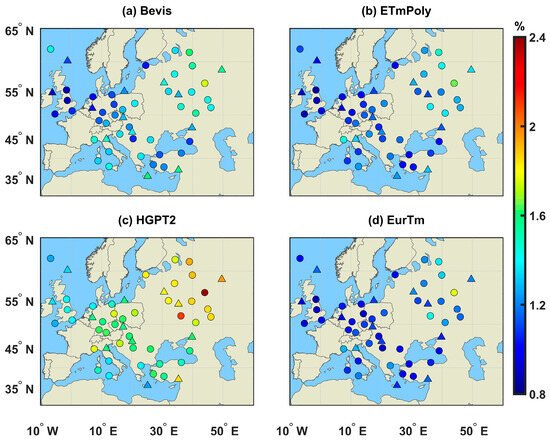
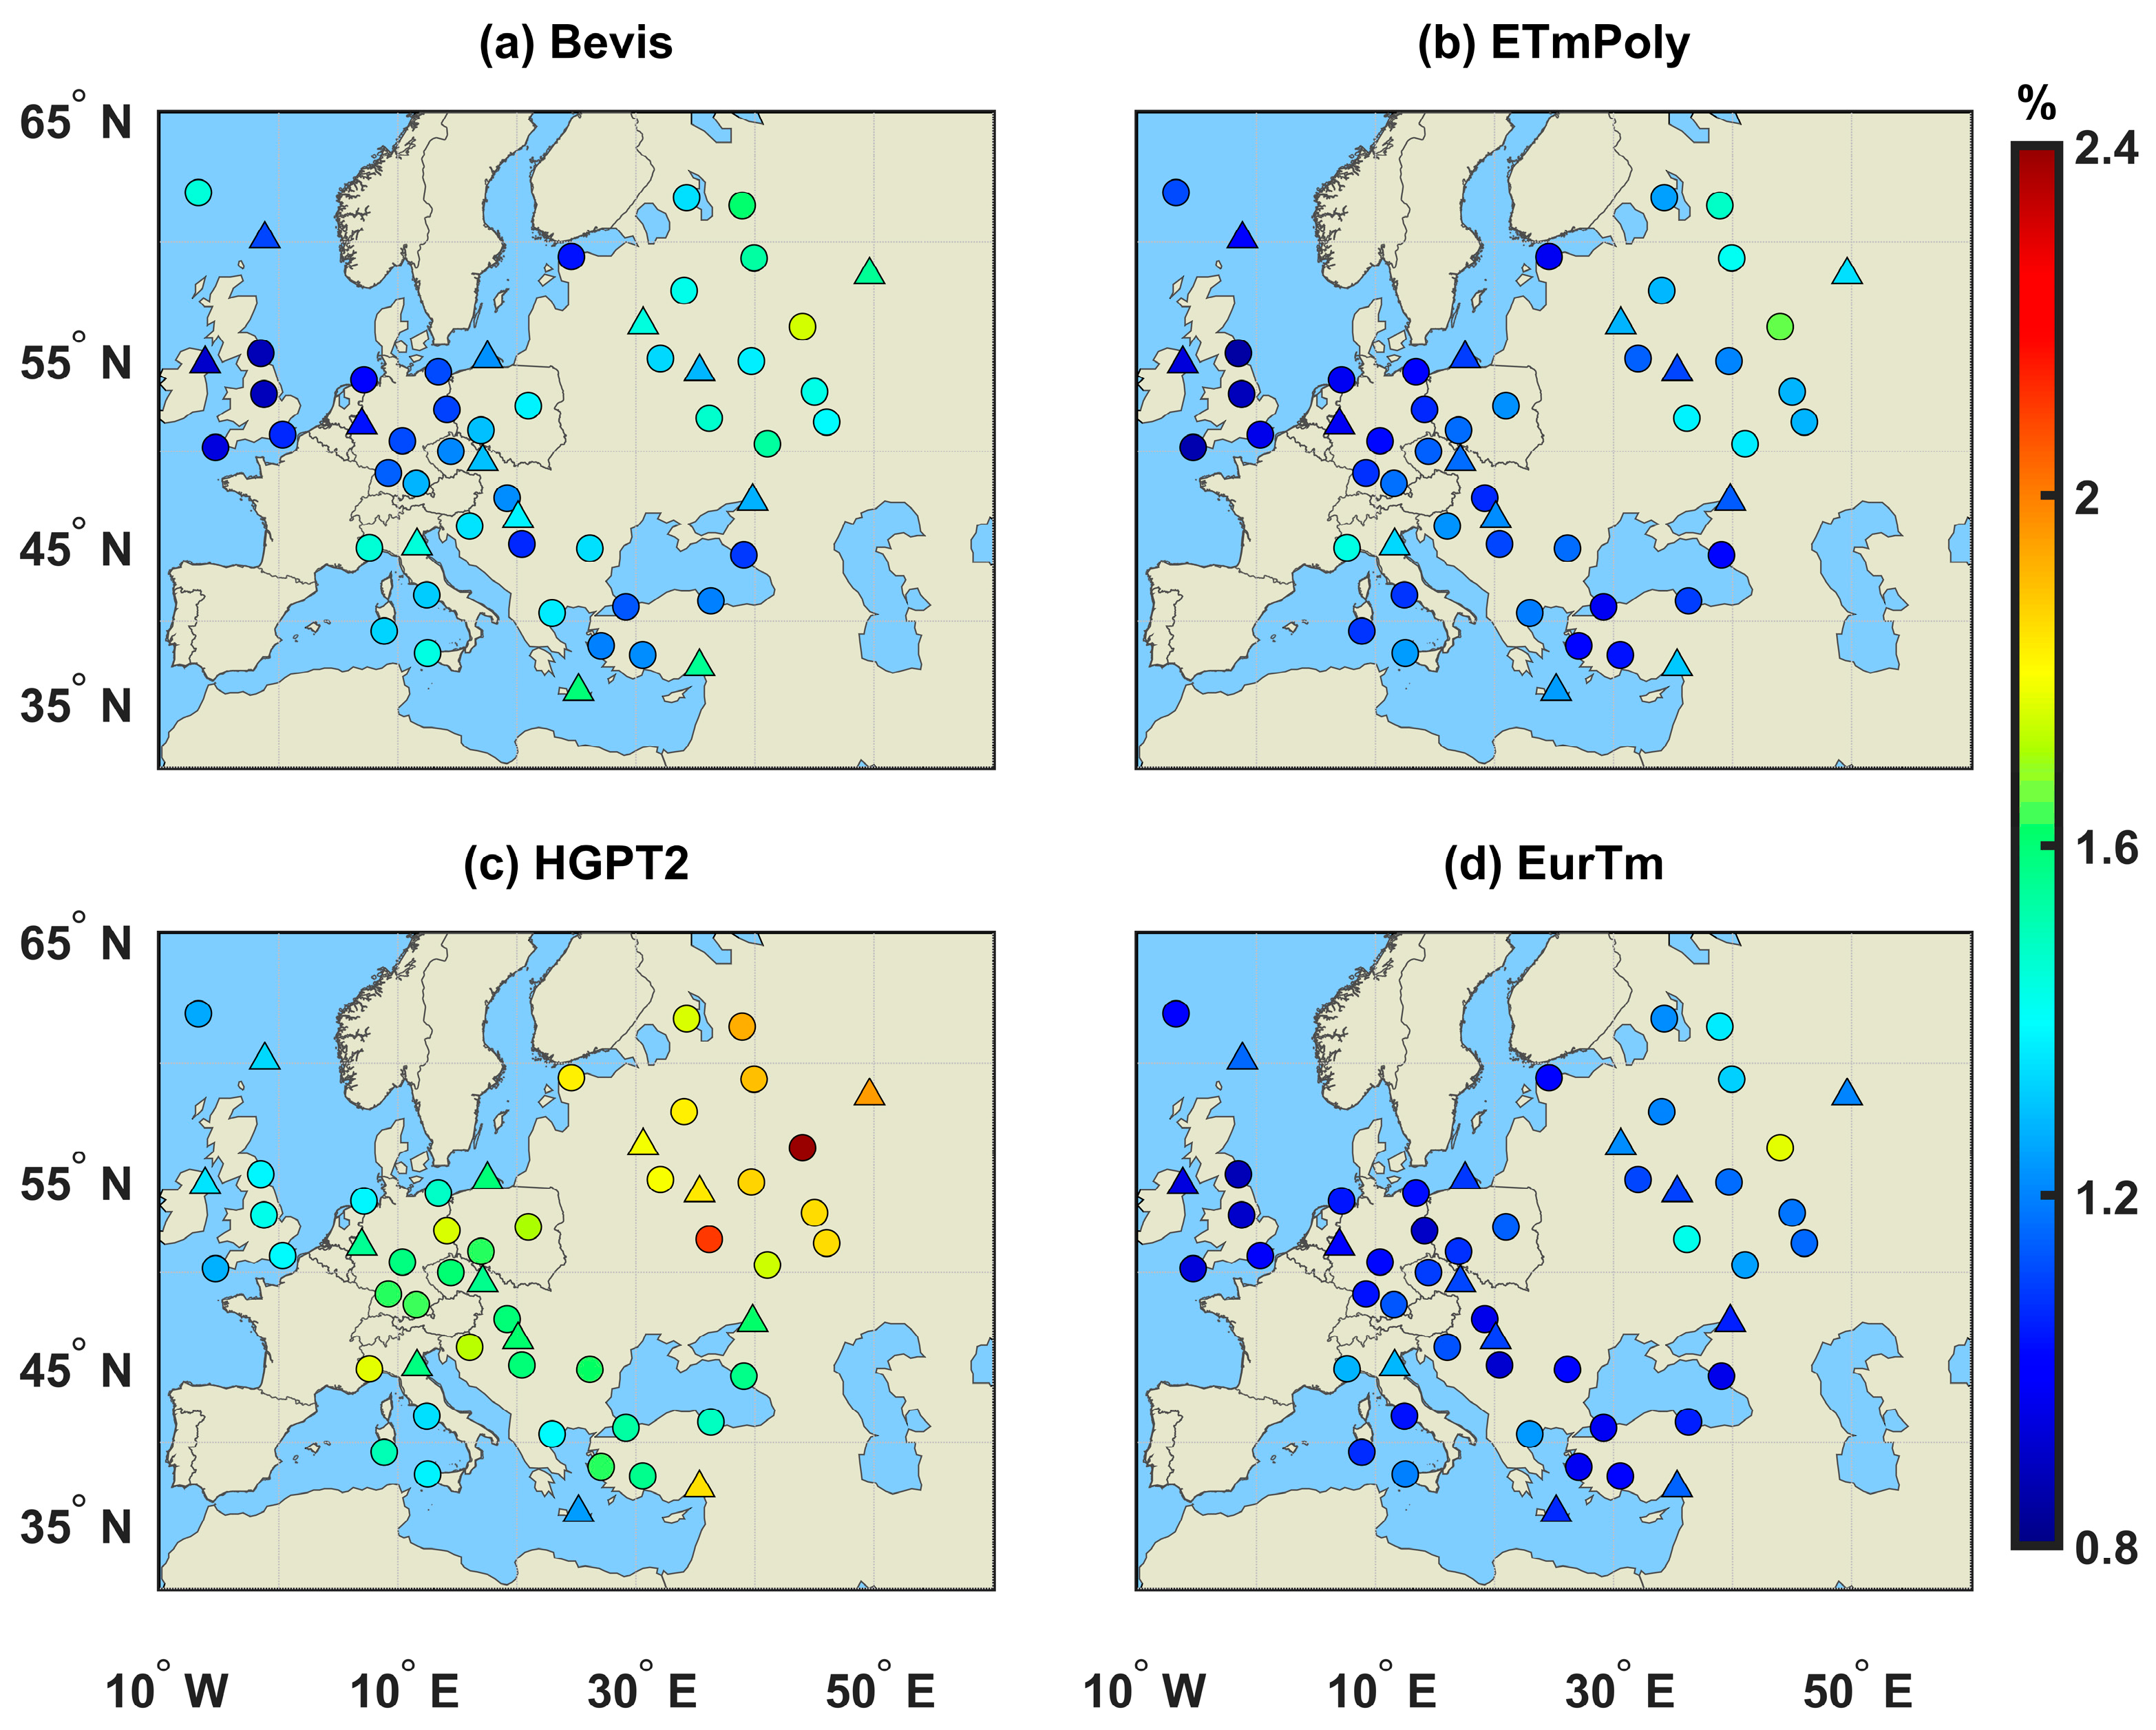
In this context, RMSEpwv refers to the RMSE of PWV, while RMSEΠ represents the RMSE of the conversion factor. Additionally, RMSETm denotes the RMSE of Tm, and RMSEpwv/PWV indicates the relative error of PWV. The atmospheric refractivity constants k2′ and k3 are also considered. For this analysis, we employed data from 53 European radiosonde stations collected in 2024. The theoretical findings regarding the RMSEpwv and the RMSEpwv/PWV are visually presented in Figure 11 and Figure 12, and tabulated in Table 3.
Figure 11.
Theoretical Root Mean Square Error of PWV Calculated from Radiosonde Data and Four Different Models for the Year 2024.
Figure 12.
Theoretical Relative Error of PWV Calculated from Radiosonde Data and Four Different Models for the Year 2024.
Table 3.
Statistical Results of RMSEPWV and RMSEPWV/PWV for Various Tm Models Based on 53 Radiosonde Stations in Europe in 2024.
As presented in Table 3 and Figure 11 and Figure 12, which show the calculated RMSEPWV and RMSEPWV/PWV from 2024 radiosonde observations and their spatial patterns, the Bevis and HGPT2 models exhibit the highest errors in Europe. Their average RMSEPWV/PWV values are 1.28% and 1.63%, with RMSEPWV averages of 0.23 mm and 0.29 mm. The ETmPoly model shows averages of 0.21 mm and 1.15%, while the EurTm model is optimal at 0.20 mm and 1.11%. This demonstrates that the EurTm model’s more accurate Tm estimates effectively boost PWV retrieval accuracy in the region.
5. Discussion
This study developed the EurTm model for the European region by integrating the Tm from HGPT2 model, the difference between Ts obtained by HGPT2 and Ts measured by radiosonde stations, and diurnal variation. By effectively capturing how Tm varies spatiotemporally and the factors influencing it, the EurTm model demonstrates superior estimation performance across Europe. This is evidenced by the high-accuracy exhibited in the comparative analysis of various Tm models in Section 3. Furthermore, the model’s reliability is validated by the analysis in Section 4 concerning its impact on PWV calculation accuracy. The following discussion elaborates on the key factors contributing to the EurTm model’s superior performance.
The applicability of the Bevis model in Europe is restricted by the strong regional specificity of Tm, despite its derivation of a linear Tm-Ts relationship from two years of data across 13 U.S. radiosonde stations. In contrast, the ETmPoly model, developed using European radiosonde data, incorporates UTC-polynomial coefficients in its Tm–Ts regression equation to account for diurnal variations, resulting in improved accuracy and a better representation of local Tm characteristics. However, further advancements, such as the HGPT2 model, despite offering high spatiotemporal resolution, present distinct challenges. Its grid-based linear estimation approach is limited in capturing local transient meteorological anomalies and nonlinear processes. Furthermore, its heavy reliance on Ts modeling accuracy and the pronounced diurnal pattern in Tm residuals, as identified in Section 2, underscore its main weaknesses and contribute to its diminished accuracy in Europe. In response to these shortcomings, the EurTm model synthesizes the detailed spatiotemporal structure of HGPT2 with accurate Ts data obtained from radiosondes. The model integrates UTC terms to capture daily periodicities and utilizes least squares estimation for coefficient optimization. Experimental results confirm that EurTm significantly outperforms the other three models. This superior performance demonstrates that incorporating measured Ts and UTC terms effectively corrects HGPT2’s primary error sources and enhances regional adaptability. Consequently, EurTm provides a lightweight yet accurate Tm estimation framework for Europe, offering valuable insights for the optimization of regional empirical models elsewhere.
6. Conclusions
To enhance the accuracy of empirical Tm models in the European region, this study proposes an enhanced weighted mean temperature model (EurTm). The model adopts a hybrid modeling paradigm of “global model + regional characteristic adjustment,” building upon the HGPT2 global model by incorporating regional surface temperature residual correction and diurnal variation modeling. It was constructed using meteorological radiosonde data from 40 stations across Europe from 2014 to 2023 and optimized via the least squares method. Validation was performed using reference values derived from 2024 radiosonde data through numerical integration, with the main findings and methodological contributions summarized as follows:
- (1)
- At the modeling stations, the EurTm model achieved average MAE and RMSE values of 2.35 K and 3.02 K, respectively. Compared to the Bevis, ETmPoly, and HGPT2 models, its accuracy improved by 13.2%, 4.1%, and 32.7%, respectively. In terms of seasonal performance, the EurTm model demonstrated the most stable behavior with the smallest daily error values. Regarding residual distribution, this model exhibited the smallest mean and standard deviation of residuals, indicating significant advantages in both minimal error and highest stability.
- (2)
- At the non-modeling stations, the EurTm model achieved average MAE and RMSE values of 2.36 K and 3.04 K, respectively. Compared to the Bevis, ETmPoly, and HGPT2 models, it improved accuracy by 16.1%, 4.7%, and 30.0%. In evaluations across different time periods, the EurTm model demonstrated the best responsiveness to instantaneous variations in Tm. In linear regression with radiosonde-derived Tm values, the model not only exhibited a stronger linear relationship but also successfully overcame the value range limitation observed in the HGPT2 model for Tm estimation.
- (3)
- Analysis of the PWV retrieval accuracy across different models indicates that the EurTm model achieved average RMSEPWV and RMSEPWV/PWV values of 0.20 mm and 1.11%, respectively. These results outperform the other three comparative models, further confirming the superior Tm accuracy of the EurTm model.
In conclusion, the hybrid modeling paradigm of “global model + regional characteristic adjustment” proposed in this study not only significantly enhances Tm estimation accuracy in the European region but also holds potential for extension to other geographically complex areas. By integrating the universality of global models with the specificity of regional observational data, this framework provides a reusable technical pathway for high-precision regional Tm modeling. The resulting EurTm model demonstrates reliable Tm estimation capability and a solid theoretical foundation in Europe, effectively meeting the requirements for GNSS atmospheric inversion applications and providing efficient, practical data support for meteorological research, while also offering a methodological reference for regional meteorological parameter modeling in other parts of the world.
Author Contributions
Conceptualization, B.Z.; methodology, B.Z. and Y.S.; investigation, T.W.; formal analysis, T.W.; writing—original draft preparation, T.W.; data curation, B.Z.; writing—review and editing. All authors have read and agreed to the published version of the manuscript.
Funding
This research was financially supported by the Natural Science Foundation of Henan Province (Grant No. 242300420618) and the Scientific Research Innovation Foundation for Graduate Students of Xinyang Normal University (Grant No. 2025KYJJ86).
Data Availability Statement
The datasets used and analyzed during the current study are available from the corresponding author on reasonable request. The measured radiosonde observations are obtained from University of Wyoming at http://weather.uwyo.edu/upperair/seasia.html (accessed on 2 June 2025).
Acknowledgments
The authors acknowledge the University of Wyoming for providing the radiosonde observation data.
Conflicts of Interest
The authors declare no conflicts of interest.
References
- Huang, L.; Wang, Y.; Bi, H.; Zhu, G.; Liu, L.; Jiang, W. Initial results of atmospheric weighted mean temperature estimation with Pangu-Weather in real-time GNSS PWV retrieval for China. GPS Solut. 2025, 29, 48. [Google Scholar] [CrossRef]
- Zhao, Q.; Liu, Y.; Yao, W.; Yao, Y. Hourly rainfall forecast model using supervised learning algorithm. IEEE Trans. Geosci. Remote Sens. 2021, 60, 4100509. [Google Scholar] [CrossRef]
- Sun, Y.; Yang, F.; Liu, M.; Li, Z.; Gong, X.; Wang, Y. Evaluation of weighted mean temperature derived from multiple reanalysis data over China using radiosonde observations. Atmos. Res. 2023, 284, 106247. [Google Scholar]
- Zhao, Q.; Liu, Y.; Ma, X.; Yao, W.; Yao, Y.; Li, X. An improved rainfall forecasting model based on GNSS observations. IEEE Trans. Geosci. Remote Sens. 2020, 58, 4891–4900. [Google Scholar] [CrossRef]
- Sapucci, L.F. Evaluation of modeling water-vapour-weighted mean tropospheric temperature for GNSS-integrated water vapour estimates in Brazil. J. Appl. Meteorol. Climatol. 2014, 53, 715–730. [Google Scholar] [CrossRef]
- Zhu, D.; Sun, P.; Hu, Q.; Zhang, K.; Wu, S.; He, P.; Yu, A.; Yin, W.; Liu, W. A fusion framework for producing an accurate PWV map with spatiotemporal continuity based on GNSS, ERA5 and MODIS data. IEEE Trans. Geosci. Remote Sens. 2024, 62, 5802214. [Google Scholar] [CrossRef]
- Zhu, D.; Zhang, K.; Sun, P.; Wu, S.; Wan, M. Homogenization of daily precipitable water vapor time series derived from GNSS observations over China. Adv. Space Res. 2023, 72, 1751–1763. [Google Scholar] [CrossRef]
- Bevis, M.; Businger, S.; Herring, A.T.; Rocken, C.; Anthes, R.A.; Ware, R.H. GPS meteorology: Remote sensing of atmospheric water vapor using the global positioning system. J. Geophys. Res. Atmos. 1992, 97, 15787–15801. [Google Scholar] [CrossRef]
- Zhang, B.; Guo, Z.; Liu, X.; Shen, Y.; Yan, J.; Xu, F.; Cui, Y. Bevis Refined Model of Weighted Average Temperature in Hong Kong Considering Multi-Factors. J. Xinyang Norm. Univ. (Nat. Sci. Ed.) 2023, 36, 269–273. [Google Scholar]
- Suresh Raju, C.; Saha, K.; Thampi, B.V.; Parameswaran, K. Empirical model for mean temperature for Indian zone and estimation of precipitable water vapour from ground based GPS measurements. Ann. Geophys. 2007, 25, 1935–1948. [Google Scholar] [CrossRef]
- Mekik, C.; Deniz, I. Modelling and validation of the weighted mean temperature for Turkey. Meteorol. Appl. 2017, 24, 92–100. [Google Scholar] [CrossRef]
- Emardson, T.R.; Derks, H. On the relation between the wet delay and the integrated precipitable water vapour in the european atmosphere. Meteorol. Appl. 2010, 7, 61–68. [Google Scholar] [CrossRef]
- Liu, J.; Yao, Y.; Sang, J. A new weighted mean temperature model in China. Adv. Space Res. 2018, 61, 402–412. [Google Scholar] [CrossRef]
- Zhang, F.; Barriot, J.-P.; Xu, G.; Yeh, T.-K. Metrology Assessment of the Accuracy of Precipitable Water Vapor Estimates from GPS Data Acquisition in Tropical Areas: The Tahiti Case. Remote Sens. 2018, 10, 758. [Google Scholar] [CrossRef]
- Yao, Y.; Zhu, S.; Yue, S. A globally applicable, season-specific model for estimating the weighted mean temperature of the atmosphere. J. Geod. 2012, 86, 1125–1135. [Google Scholar] [CrossRef]
- Lan, Z.; Zhang, B.; Geng, Y. Establishment and analysis of global gridded Tm–Ts relationship model. Geod. Geodyn. 2016, 7, 101–107. [Google Scholar] [CrossRef]
- Yao, Y.; Zhang, B.; Xu, C.; Chen, J. Analysis of the global Tm–Ts correlation and establishment of the latitude-related linear model. Chin. Sci. Bull. 2014, 59, 2340–2347. [Google Scholar] [CrossRef]
- Baldysz, Z.; Nykiel, G. Improved Empirical Coefficients for Estimating Water Vapor Weighted Mean Temperature over Europe for GNSS Applications. Remote Sens. 2019, 11, 1995. [Google Scholar] [CrossRef]
- Li, L.; Li, Y.; He, Q.; Wang, X. Weighted Mean Temperature Modelling Using Regional Radiosonde Observations for the Yangtze River Delta Region in China. Remote Sens. 2022, 14, 1909. [Google Scholar] [CrossRef]
- Bhm, J.; Mller, G.; Schindelegger, M.; Pain, G.; Weber, R. Development of an improved empirical model for slant delays in the troposphere (GPT2w). GPS Solut. 2015, 19, 433–441. [Google Scholar] [CrossRef]
- Landskron, D.; Boehm, J. VMF3/GPT3: Refined discrete and empirical troposphere mapping functions. J. Geod. 2018, 92, 349–360. [Google Scholar] [CrossRef] [PubMed]
- Yao, Y.; Zhang, B.; Yue, S.; Xu, C.; Peng, W. Global empirical model for mapping zenith wet delays onto precipitable water. J. Geod. 2013, 87, 439–448. 21. [Google Scholar] [CrossRef]
- Yao, Y.; Xu, C.; Zhang, B.; Cao, N. GTm-III: A new global empirical model for mapping zenith wet delays onto precipitable water vapour. Geophys. J. Int. 2018, 197, 202–212. [Google Scholar] [CrossRef]
- Sun, Z.; Zhang, B.; Yao, Y. A Global Model for Estimating Tropospheric Delay and Weighted Mean Temperature Developed with Atmospheric Reanalysis Data from 1979 to 2017. Remote Sens. 2019, 11, 1893. [Google Scholar] [CrossRef]
- Huang, L.; Jiang, W.; Liu, L.; Chen, H.; Ye, S. A new global grid model for the determination of atmospheric weighted mean temperature in GPS precipitable water vapor. J. Geod. 2019, 93, 159–176. [Google Scholar] [CrossRef]
- Huang, L.; Liu, L.; Chen, H.; Jiang, W. An improved atmospheric weighted mean temperature model and its impact on GNSS precipitable water vapor estimates for China. GPS Solut. 2019, 23, 51. [Google Scholar] [CrossRef]
- Mateus, P.; Catalão, J.; Mendes, V.B.; Nico, G. An ERA5-Based Hourly Global Pressure and Temperature (HGPT) Model. Remote Sens. 2020, 12, 1098. [Google Scholar] [CrossRef]
- Mateus, P.; Mendes, V.B.; Plecha, S.M. HGPT2: An ERA5-Based Global Model to Estimate Relative Humidity. Remote Sens. 2021, 13, 2179. [Google Scholar] [CrossRef]
- Li, H.; Liu, X.; Zhou, P.; Liu, Z.; Li, M.; Cao, Z. Machine Learning–Based Multiscale Quantification of Long-Term Emission Contributions to PM2.5 Variability in China. Atmos. Pollut. Res. 2025, 102786. [Google Scholar] [CrossRef]
- Benevides, P.; Catalao, J.; Nico, G. Neural Network Approach to Forecast Hourly Intense Rainfall Using GNSS Precipitable Water Vapor and Meteorological Sensors. Remote Sens. 2019, 11, 966. [Google Scholar] [CrossRef]
- Zhang, Q.; Ye, J.; Zhang, S.; Han, F. Precipitable Water Vapor Retrieval and Analysis by Multiple Data Sources: Ground-Based GNSS, Radio Occultation, Radiosonde, Microwave Satellite, and NWP Reanalysis Data. J. Sens. 2018, 2018, 3428303. [Google Scholar] [CrossRef]
- Wang, X.; Zhang, K.; Wu, S.; Fan, S.; Cheng, Y. Water vapor-weighted mean temperature and its impact on the determination of precipitable water vapor and its linear trend. J. Geophys. Res. Atmos. 2016, 121, 833–852. [Google Scholar] [CrossRef]
- Li, H.; Wang, X.; Wu, S.; Zhang, K.; Chen, X.; Qiu, C.; Zhang, S.; Zhang, J.; Xie, M.; Li, L. Development of an Improved Model for Prediction of Short-Term Heavy Precipitation Based on GNSS-Derived PWV. Remote Sens. 2020, 12, 4101. [Google Scholar] [CrossRef]
- Guerova, G.; Jones, J.; Douša, J.; Dick, G.; de Haan, S.; Pottiaux, E.; Bock, O.; Pacione, R.; Elgered, G.; Vedel, H.; et al. Review of the state of the art and future prospects of the ground-based GNSS meteorology in Europe. Atmos. Meas. Tech. 2016, 9, 5385–5406. [Google Scholar] [CrossRef]
- Shen, Y.; Li, P.; Zhang, B.; Wu, T.; Zhu, J.; Li, Q.; Li, W. An Empirical Atmospheric Weighted Average Temperature Enhancement Model in the Yunnan–Guizhou Plateau Considering Surface Temperature. Remote Sens. 2024, 16, 4366. [Google Scholar] [CrossRef]
- Levenberg, K. A method for the solution of certain problems in least squares. Q. Appl. Math. 1944, 2, 164–168. [Google Scholar] [CrossRef]
- Marquardt, W. An algorithm for least-squares estimation of nonlinear parameters. J. Soc. Ind. Appl. Math. 1963, 11, 431–441. [Google Scholar] [CrossRef]
- Zhang, B.; Wang, Z.; Li, W.; Jiang, W.; Shen, Y.; Zhang, Y.; Zhang, S.; Tian, K. An Improved Spatiotemporal Weighted Mean Temperature Model over Europe Based on the Nonlinear Least Squares Estimation Method. Remote Sens. 2022, 14, 3609. [Google Scholar] [CrossRef]

Disclaimer/Publisher’s Note: The statements, opinions and data contained in all publications are solely those of the individual author(s) and contributor(s) and not of MDPI and/or the editor(s). MDPI and/or the editor(s) disclaim responsibility for any injury to people or property resulting from any ideas, methods, instructions or products referred to in the content. |
© 2025 by the authors. Licensee MDPI, Basel, Switzerland. This article is an open access article distributed under the terms and conditions of the Creative Commons Attribution (CC BY) license.