Next Issue
Volume 12, August-2
Previous Issue
Volume 12, July-2
 
 
remotesensing-logo

Journal Browser

Journal Browser

Remote Sens., Volume 12, Issue 15 (August-1 2020) – 164 articles

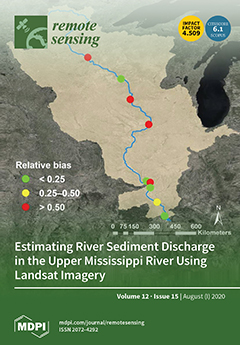
Cover Story (view full-size image): With a decline in the number of operational river gauges monitoring sediments, a viable means of quantifying sediment transport is needed. In this study, we address this issue by applying relationships between hydraulic geometry of river channels, water discharge, water-leaving surface reflectance, and suspended sediment concentration (SSC) to quantify sediment discharge with the aid of space-based observations. We examined 5490 Landsat scenes to estimate water discharge, SSC, and sediment discharge for the period 1984–2017 at nine gauging sites along the Upper Mississippi River. The results show that the water discharge and SSC retrieval from Landsat imagery yield reasonable sediment discharge estimates for the Upper Mississippi River. View this paper
  • Issues are regarded as officially published after their release is announced to the table of contents alert mailing list.
  • You may sign up for e-mail alerts to receive table of contents of newly released issues.
  • PDF is the official format for papers published in both, html and pdf forms. To view the papers in pdf format, click on the "PDF Full-text" link, and use the free Adobe Reader to open them.
Order results
Result details
Section
Select all
Export citation of selected articles as:
17 pages, 9231 KiB  
Article
Use of Remote Sensing in Comprehending the Influence of Urban Landscape’s Composition and Configuration on Land Surface Temperature at Neighbourhood Scale
by Ifeanyi R. Ejiagha, M. Razu Ahmed, Quazi K. Hassan, Ashraf Dewan, Anil Gupta and Elena Rangelova
Remote Sens. 2020, 12(15), 2508; https://doi.org/10.3390/rs12152508 - 04 Aug 2020
Cited by 22 | Viewed by 5006
Abstract
The spatial composition and configuration of land use land cover (LULC) in the urban landscape impact the land surface temperature (LST). In this study, we assessed such impacts at the neighbourhood level of the City of Edmonton. In doing so, we employed Landsat-8 [...] Read more.
The spatial composition and configuration of land use land cover (LULC) in the urban landscape impact the land surface temperature (LST). In this study, we assessed such impacts at the neighbourhood level of the City of Edmonton. In doing so, we employed Landsat-8 Operational Land Imager (OLI) and Thermal Infrared Sensors (TIRS) satellite images to derive LULC and LST maps, respectively. We used three classification methods, such as ISODATA, random forest, and indices-based, for mapping LULC classes including built-up, water, and green. We obtained the highest overall accuracy of 98.53 and 97.90% with a kappa value of 0.96 and 0.92 in the indices-based method for the 2018 and 2015 LULC maps, respectively. Besides, we estimated the LST map from the brightness temperature using a single-channel algorithm. Our analysis showed that the highest contributors to LST were the industrial (303.51 K in 2018 and 295.99 K in 2015) and residential (303.47 K in 2018 and 296.56 K in 2015) neighbourhoods, and the lowest contributor was the riverine/creek (298.77 K in 2018 and 292.89 K in 2015) during the 2018 late summer and 2015 early spring seasons. We also found that the residential neighbourhoods exhibited higher LST in comparison with the industrial with the same LULC composition. The result was also supported by our surface albedo analysis, where industrial and residential neighbourhoods were giving higher and lower albedo values, respectively. This indicated that the rooftop materials played further role in impacting the LST. In addition, our spatial autocorrelation (local Moran’s I) and proximity (near distance) analyses revealed that the structural configurations would additionally play an important role in contributing to the LST in the neighbourhoods. For example, the cluster pattern with a small gap of minimum 2.4 m between structures in the residential neighbourhoods were showing higher LST in compared with the sparse pattern, with large gaps between structures in the industrial areas. The wide passages for wind flow through the large gaps would be responsible for cooling the LST in the industrial neighbourhoods. The outcomes of this study would help planners in planning and designing urban neighbourhoods, and policymakers and stakeholders in developing strategies to balance surface energy and mitigate local warming. Full article
(This article belongs to the Special Issue Understanding Urban Systems Using Remote Sensing)
Show Figures

Graphical abstract

23 pages, 4837 KiB  
Review
Integrated Satellite–Terrestrial Connectivity for Autonomous Ships: Survey and Future Research Directions
by Marko Höyhtyä and Jussi Martio
Remote Sens. 2020, 12(15), 2507; https://doi.org/10.3390/rs12152507 - 04 Aug 2020
Cited by 27 | Viewed by 7363
Abstract
An autonomous vessel uses multiple different radio technologies such as satellites, mobile networks and dedicated narrowband systems, to connect to other ships, services, and the remote operations center (ROC). In-ship communication is mainly implemented with wired technologies but also wireless links can be [...] Read more.
An autonomous vessel uses multiple different radio technologies such as satellites, mobile networks and dedicated narrowband systems, to connect to other ships, services, and the remote operations center (ROC). In-ship communication is mainly implemented with wired technologies but also wireless links can be used. In this survey paper, we provide a short overview of autonomous and remote-controlled systems. This paper reviews 5G-related standardization in the maritime domain, covering main use cases and both the role of autonomous ships and that of people onboard. We discuss the concept of a connectivity manager, an intelligent entity that manages complex set of technologies, integrating satellite and terrestrial technologies together, ensuring robust in-ship connections and ship-to-outside connections in any environment. This survey paper describes the architecture and functionalities of connectivity management required for an autonomous ship to be able to operate globally. As a specific case example, we have implemented a research environment consisting of ship simulators with connectivity components. Our simulation results on the effects of delays to collision avoidance confirm the role of reliable connectivity for safety. Finally, we outline future research directions for autonomous ship connectivity research, providing ideas for further work. Full article
Show Figures

Graphical abstract

31 pages, 7726 KiB  
Article
Remote Sensing Analysis of Surface Temperature from Heterogeneous Data in a Maize Field and Related Water Stress
by Marinella Masina, Alessandro Lambertini, Irene Daprà, Emanuele Mandanici and Alberto Lamberti
Remote Sens. 2020, 12(15), 2506; https://doi.org/10.3390/rs12152506 - 04 Aug 2020
Cited by 10 | Viewed by 5376
Abstract
Precision agriculture aims at optimizing crop production by adapting management actions to real needs and requires that a reliable and extensive description of soil and crop conditions is available, that multispectral satellite images can provide. The purpose of the present study, based on [...] Read more.
Precision agriculture aims at optimizing crop production by adapting management actions to real needs and requires that a reliable and extensive description of soil and crop conditions is available, that multispectral satellite images can provide. The purpose of the present study, based on activities carried out in 2019 on an agricultural area north of Ravenna (Italy) within the project LIFE AGROWETLANDS II, is to evaluate the potentials and limitations of freely available satellite thermal images for the identification of water stress conditions and the optimization of irrigation management practices, especially in agricultural areas and wetlands affected by saline soils and salt water capillary rise. Point field surveys and a very-high resolution thermal survey (5 cm) by an unmanned aerial vehicle (UAV) supported thermal camera were performed on a maize field tentatively at every Landsat-8 passage to check land surface temperature (LST) and canopy cover (CC) estimated from satellite. Temperature measured in the soil near ground surface and from UAV flying at 100 m altitude is compared with LST estimated from satellite measurements using three conversion methods: the top of atmosphere brightness temperature based on Landsat-8 band 10 (SB) corrected to account only for surface emissivity, the radiative transfer equation (RTE) for atmosphere effects correction, and the original split window method (SW) using both Thermal Infrared Sensor (TIRS) bands. The comparison shows discrepancies, due to extreme difference in resolution, the systematic hour of satellite passage (11 am solar time), and systematic differences between methods beside the unavoidable inaccuracy of UAV measurements. Satellite derived temperatures result usually lower than UAV measurements; SB produced the lowest values, SW the best (difference = −1.7 ± 1.7), and RTE the median (difference = −2.7 ± 1.6). The correlation between contemporary 30 m resolution temperature values of near pixels and corresponding tile-average temperatures was not significant, due to the purely numerical interpolation from the 100 m resolution TIRS images, whereas the time pattern along the season is consistent among methods, being correlation coefficient always greater than 0.85. Correlation coefficients among temperatures obtained from Landsat-8 by different methods are almost 1, showing that values are almost strictly related by a linear transformation. All the methods are useful to estimate water stress, since its associated Crop Water Stress Index (CWSI) is, from its definition, insensitive to linear transformation of temperatures. Actual evapotranspiration (ETa) maps are evaluated with the Surface Energy Balance Algorithm for Land (SEBAL) based on the three Landsat-8 derived LSTs; the higher is LST, the lower is ETa. Resulting ETa estimates are related with LST but not strictly, due to variation in vegetation cover and soil, therefore patterns result similar but not equivalent, whereas values are dependent on the atmosphere correction method. RTE and SW result in the best methods among the tested ones and the derived ETa values result reliable and appropriate to user needs. For real time application the Normalized Difference Moisture Index (NDMI), which can also be derived from more frequent Sentinel-2 passages, can be profitably used in combination or as a substitute of the CWSI. Full article
(This article belongs to the Special Issue Application of Remote Sensing in Agroforestry)
Show Figures

Figure 1

28 pages, 11778 KiB  
Article
Landslide Susceptibility Assessment of Wildfire Burnt Areas through Earth-Observation Techniques and a Machine Learning-Based Approach
by Mariano Di Napoli, Palmira Marsiglia, Diego Di Martire, Massimo Ramondini, Silvia Liberata Ullo and Domenico Calcaterra
Remote Sens. 2020, 12(15), 2505; https://doi.org/10.3390/rs12152505 - 04 Aug 2020
Cited by 40 | Viewed by 5788
Abstract
Climate change has increased the likelihood of the occurrence of disasters like wildfires, floods, storms, and landslides worldwide in the last years. Weather conditions change continuously and rapidly, and wildfires are occurring repeatedly and diffusing with higher intensity. The burnt catchments are known, [...] Read more.
Climate change has increased the likelihood of the occurrence of disasters like wildfires, floods, storms, and landslides worldwide in the last years. Weather conditions change continuously and rapidly, and wildfires are occurring repeatedly and diffusing with higher intensity. The burnt catchments are known, in many parts of the world, as one of the main sensitive areas to debris flows characterized by different trigger mechanisms (runoff-initiated and debris slide-initiated debris flow). The large number of studies produced in recent decades has shown how the response of a watershed to precipitation can be extremely variable, depending on several on-site conditions, as well as the characteristics of precipitation duration and intensity. Moreover, the availability of satellite data has significantly improved the ability to identify the areas affected by wildfires, and, even more importantly, to carry out post-fire assessment of burnt areas. Many difficulties have to be faced in attempting to assess landslide risk in burnt areas, which present a higher likelihood of occurrence; in densely populated neighbourhoods, human activities can be the cause of the origin of the fires. The latter is, in fact, one of the main operations used by man to remove vegetation along slopes in an attempt to claim new land for pastures or construction purposes. Regarding the study area, the Camaldoli and Agnano hill (Naples, Italy) fires seem to act as a predisposing factor, while the triggering factor is usually represented by precipitation. Eleven predisposing factors were chosen and estimated according to previous knowledge of the territory and a database consisting of 400 landslides was adopted. The present work aimed to expand the knowledge of the relationship existing between the triggering of landslides and burnt areas through the following phases: (1) Processing of the thematic maps of the burnt areas through band compositions of satellite images; and (2) landslide susceptibility assessment through the application of a new statistical approach (machine learning techniques). The analysis has the scope to support decision makers and local agencies in urban planning and safety monitoring of the environment. Full article
(This article belongs to the Section Remote Sensing in Geology, Geomorphology and Hydrology)
Show Figures

Graphical abstract

24 pages, 6149 KiB  
Article
Using UAV Collected RGB and Multispectral Images to Evaluate Winter Wheat Performance across a Site Characterized by Century-Old Biochar Patches in Belgium
by Ramin Heidarian Dehkordi, Victor Burgeon, Julien Fouche, Edmundo Placencia Gomez, Jean-Thomas Cornelis, Frederic Nguyen, Antoine Denis and Jeroen Meersmans
Remote Sens. 2020, 12(15), 2504; https://doi.org/10.3390/rs12152504 - 04 Aug 2020
Cited by 18 | Viewed by 5042
Abstract
Remote sensing data play a crucial role in monitoring crop dynamics in the context of precision agriculture by characterizing the spatial and temporal variability of crop traits. At present there is special interest in assessing the long-term impacts of biochar in agro-ecosystems. Despite [...] Read more.
Remote sensing data play a crucial role in monitoring crop dynamics in the context of precision agriculture by characterizing the spatial and temporal variability of crop traits. At present there is special interest in assessing the long-term impacts of biochar in agro-ecosystems. Despite the growing body of literature on monitoring the potential biochar effects on harvested crop yield and aboveground productivity, studies focusing on the detailed crop performance as a consequence of long-term biochar enrichment are still lacking. The primary objective of this research was to evaluate crop performance based on high-resolution unmanned aerial vehicle (UAV) imagery considering both crop growth and health through RGB and multispectral analysis, respectively. More specifically, this approach allowed monitoring of century-old biochar impacts on winter wheat crop performance. Seven Red-Green-Blue (RGB) and six multispectral flights were executed over 11 century-old biochar patches of a cultivated field. UAV-based RGB imagery exhibited a significant positive impact of century-old biochar on the evolution of winter wheat canopy cover (p-value = 0.00007). Multispectral optimized soil adjusted vegetation index indicated a better crop development over the century-old biochar plots at the beginning of the season (p-values < 0.01), while there was no impact towards the end of the season. Plant height, derived from the RGB imagery, was slightly higher for century-old biochar plots. Crop health maps were computed based on principal component analysis and k-means clustering. To our knowledge, this is the first attempt to quantify century-old biochar effects on crop performance during the entire growing period using remotely sensed data. Ground-based measurements illustrated a significant positive impact of century-old biochar on crop growth stages (p-value of 0.01265), whereas the harvested crop yield was not affected. Multispectral simplified canopy chlorophyll content index and normalized difference red edge index were found to be good linear estimators of harvested crop yield (p-value(Kendall) of 0.001 and 0.0008, respectively). The present research highlights that other factors (e.g., inherent pedological variations) are of higher importance than the presence of century-old biochar in determining crop health and yield variability. Full article
(This article belongs to the Special Issue UAVs for Vegetation Monitoring)
Show Figures

Figure 1

29 pages, 22416 KiB  
Article
Classification of Urban Area Using Multispectral Indices for Urban Planning
by Philip Lynch, Leonhard Blesius and Ellen Hines
Remote Sens. 2020, 12(15), 2503; https://doi.org/10.3390/rs12152503 - 04 Aug 2020
Cited by 20 | Viewed by 10179
Abstract
An accelerating trend of global urbanization accompanying population growth makes frequently updated land use and land cover (LULC) maps critical. LULC maps have been widely created through the classification of remotely sensed imagery. Maps of urban areas have been both dichotomous (urban or [...] Read more.
An accelerating trend of global urbanization accompanying population growth makes frequently updated land use and land cover (LULC) maps critical. LULC maps have been widely created through the classification of remotely sensed imagery. Maps of urban areas have been both dichotomous (urban or non-urban) and entailing of discrete urban types. This study incorporated multispectral built-up indices, designed to enhance satellite imagery, for introducing new urban classification schemes. The indices examined are the new built-up index (NBI), the built-up area extraction index (BAEI), and the normalized difference concrete condition index (NDCCI). Landsat Level-2 data covering the city of Miami, FL, USA was leveraged with geographic data from the Florida Geospatial Data Library and Florida Department of Environmental Protection to develop and validate new methods of supervised and unsupervised classification of urban area. NBI was used to extract discrete urban features through object-oriented image analysis. BAEI was found to possess properties for visualizing and tracking urban development as a low-high gradient. NDCCI was composited with NBI and BAEI as the basis for a robust urban intensity classification scheme superior to that of the United States Geological Survey National Land Cover Database 2016. BAEI, implemented as a shadow index, was incorporated in a novel infill geosimulation of high-rise construction. The findings suggest that the proposed classification schemes are advantageous to the process of creating more detailed cartography in response to the increasing global demand. Full article
(This article belongs to the Special Issue Remote Sensing-Based Urban Planning Indicators)
Show Figures

Graphical abstract

23 pages, 8483 KiB  
Article
Vegetation Detection Using Deep Learning and Conventional Methods
by Bulent Ayhan, Chiman Kwan, Bence Budavari, Liyun Kwan, Yan Lu, Daniel Perez, Jiang Li, Dimitrios Skarlatos and Marinos Vlachos
Remote Sens. 2020, 12(15), 2502; https://doi.org/10.3390/rs12152502 - 04 Aug 2020
Cited by 54 | Viewed by 11733
Abstract
Land cover classification with the focus on chlorophyll-rich vegetation detection plays an important role in urban growth monitoring and planning, autonomous navigation, drone mapping, biodiversity conservation, etc. Conventional approaches usually apply the normalized difference vegetation index (NDVI) for vegetation detection. In this paper, [...] Read more.
Land cover classification with the focus on chlorophyll-rich vegetation detection plays an important role in urban growth monitoring and planning, autonomous navigation, drone mapping, biodiversity conservation, etc. Conventional approaches usually apply the normalized difference vegetation index (NDVI) for vegetation detection. In this paper, we investigate the performance of deep learning and conventional methods for vegetation detection. Two deep learning methods, DeepLabV3+ and our customized convolutional neural network (CNN) were evaluated with respect to their detection performance when training and testing datasets originated from different geographical sites with different image resolutions. A novel object-based vegetation detection approach, which utilizes NDVI, computer vision, and machine learning (ML) techniques, is also proposed. The vegetation detection methods were applied to high-resolution airborne color images which consist of RGB and near-infrared (NIR) bands. RGB color images alone were also used with the two deep learning methods to examine their detection performances without the NIR band. The detection performances of the deep learning methods with respect to the object-based detection approach are discussed and sample images from the datasets are used for demonstrations. Full article
Show Figures

Graphical abstract

26 pages, 10839 KiB  
Article
YOLO-Fine: One-Stage Detector of Small Objects Under Various Backgrounds in Remote Sensing Images
by Minh-Tan Pham, Luc Courtrai, Chloé Friguet, Sébastien Lefèvre and Alexandre Baussard
Remote Sens. 2020, 12(15), 2501; https://doi.org/10.3390/rs12152501 - 04 Aug 2020
Cited by 80 | Viewed by 14483
Abstract
Object detection from aerial and satellite remote sensing images has been an active research topic over the past decade. Thanks to the increase in computational resources and data availability, deep learning-based object detection methods have achieved numerous successes in computer vision, and more [...] Read more.
Object detection from aerial and satellite remote sensing images has been an active research topic over the past decade. Thanks to the increase in computational resources and data availability, deep learning-based object detection methods have achieved numerous successes in computer vision, and more recently in remote sensing. However, the ability of current detectors to deal with (very) small objects still remains limited. In particular, the fast detection of small objects from a large observed scene is still an open question. In this work, we address this challenge and introduce an enhanced one-stage deep learning-based detection model, called You Only Look Once (YOLO)-fine, which is based on the structure of YOLOv3. Our detector is designed to be capable of detecting small objects with high accuracy and high speed, allowing further real-time applications within operational contexts. We also investigate its robustness to the appearance of new backgrounds in the validation set, thus tackling the issue of domain adaptation that is critical in remote sensing. Experimental studies that were conducted on both aerial and satellite benchmark datasets show some significant improvement of YOLO-fine as compared to other state-of-the art object detectors. Full article
(This article belongs to the Special Issue Convolutional Neural Networks for Object Detection)
Show Figures

Graphical abstract

28 pages, 6414 KiB  
Article
Development of Land Surface Albedo Algorithm for the GK-2A/AMI Instrument
by Kyeong-Sang Lee, Sung-Rae Chung, Changsuk Lee, Minji Seo, Sungwon Choi, Noh-Hun Seong, Donghyun Jin, Minseok Kang, Jong-Min Yeom, Jean-Louis Roujean, Daeseong Jung, Suyoung Sim and Kyung-Soo Han
Remote Sens. 2020, 12(15), 2500; https://doi.org/10.3390/rs12152500 - 04 Aug 2020
Cited by 10 | Viewed by 4013
Abstract
The Korea Meteorological Administration successfully launched Korea’s next-generation meteorological satellite, Geo-KOMPSAT-2A (GK-2A), on 5 December 2018. It belongs to the new generation of GEO (Geostationary Elevation Orbit) satellite which offers capabilities to disseminate high spatial- (0.5–2 km) and high temporal-resolution (10 min) observations [...] Read more.
The Korea Meteorological Administration successfully launched Korea’s next-generation meteorological satellite, Geo-KOMPSAT-2A (GK-2A), on 5 December 2018. It belongs to the new generation of GEO (Geostationary Elevation Orbit) satellite which offers capabilities to disseminate high spatial- (0.5–2 km) and high temporal-resolution (10 min) observations over a broad area, herein a geographic disk encompassing the Asia–Oceania region. The targeted objective is to enhance our understanding of climate change, owing to a bulk of coherent observations. For such, we developed an algorithm to map the land surface albedo (LSA), which is a major Essential Climate Variable (ECV). The retrieval algorithm devoted to GK-2A/Advanced Meteorological Imager (AMI) data considered Japan’s Himawari-8/Advanced Himawari Imager (AHI) data for prototyping, as this latter owns similar specifications to AMI. Our proposed algorithm is decomposed in three major steps: atmospheric correction, bidirectional reflectance distribution function (BRDF) modeling and angular integration, and narrow-to-broadband conversion. To perform BRDF modeling, the optimization method using normalized reflectance was applied, which improved the quality of BRDF modeling results, particularly when the number of observations was less than 15. A quality assessment was performed to compare our results to those of Moderate Resolution Imaging Spectroradiometer (MODIS) LSA products and ground measurement from Aerosol Robotic Network (AERONET) sites, Australian and New Zealand flux tower network (OzFlux) site and the Korea Flux Network (KoFlux) site from throughout 2017. Our results show dependable spatial and temporal consistency with MODIS broadband LSA data, and rapid changes in LSA due to snowfall and snow melting were well expressed in the temporal profile of our results. Our outcomes also show good agreement with the ground measurements from AERONET, OzFlux and KoFlux ground-based network with root mean square errors (RMSE) of 0.0223 and 0.0306, respectively, which is close to the accuracy of MODIS broadband LSA. Moreover, our results reveal still more reliable LSA products even when clouds are frequently present, such as during the summer monsoon season. It shows that our results are useful for continuous LSA monitoring. Full article
(This article belongs to the Special Issue Earth Monitoring from A New Generation of Geostationary Satellites)
Show Figures

Graphical abstract

25 pages, 15582 KiB  
Article
Water Stress Estimation in Vineyards from Aerial SWIR and Multispectral UAV Data
by Zacharias Kandylakis, Alexandros Falagas, Christina Karakizi and Konstantinos Karantzalos
Remote Sens. 2020, 12(15), 2499; https://doi.org/10.3390/rs12152499 - 04 Aug 2020
Cited by 16 | Viewed by 5154
Abstract
Mapping water stress in vineyards, at the parcel level, is of significant importance for supporting crop management decisions and applying precision agriculture practices. In this paper, a novel methodology based on aerial Shortwave Infrared (SWIR) data is presented, towards the estimation of water [...] Read more.
Mapping water stress in vineyards, at the parcel level, is of significant importance for supporting crop management decisions and applying precision agriculture practices. In this paper, a novel methodology based on aerial Shortwave Infrared (SWIR) data is presented, towards the estimation of water stress in vineyards at canopy scale for entire parcels. In particular, aerial broadband spectral data were collected from an integrated SWIR and multispectral instrumentation, onboard an unmanned aerial vehicle (UAV). Concurrently, in-situ leaf stomatal conductance measurements and supplementary data for radiometric and geometric corrections were acquired. A processing pipeline has been designed, developed, and validated, able to execute the required analysis, including data pre-processing, data co-registration, reflectance calibration, canopy extraction and water stress estimation. Experiments were performed at two viticultural regions in Greece, for several vine parcels of four different vine varieties, Sauvignon Blanc, Merlot, Syrah and Xinomavro. The performed qualitative and quantitative assessment indicated that a single model for the estimation of water stress across all studied vine varieties was not able to be established (r2 < 0.30). Relatively high correlation rates (r2 > 0.80) were achieved per variety and per individual variety clone. The overall root mean square error (RMSE) for the estimated canopy water stress was less than 29 mmol m−2 s−1, spanning from no-stress to severe canopy stress levels. Overall, experimental results and validation indicated the quite high potentials of the proposed instrumentation and methodology. Full article
(This article belongs to the Section Remote Sensing in Agriculture and Vegetation)
Show Figures

Graphical abstract

20 pages, 6809 KiB  
Article
Multi-Year Comparison of CO2 Concentration from NOAA Carbon Tracker Reanalysis Model with Data from GOSAT and OCO-2 over Asia
by Farhan Mustafa, Lingbing Bu, Qin Wang, Md. Arfan Ali, Muhammad Bilal, Muhammad Shahzaman and Zhongfeng Qiu
Remote Sens. 2020, 12(15), 2498; https://doi.org/10.3390/rs12152498 - 04 Aug 2020
Cited by 27 | Viewed by 6429
Abstract
Accurate knowledge of the carbon budget on global and regional scales is critically important to design mitigation strategies aimed at stabilizing the atmospheric carbon dioxide (CO2) emissions. For a better understanding of CO2 variation trends over Asia, in this study, [...] Read more.
Accurate knowledge of the carbon budget on global and regional scales is critically important to design mitigation strategies aimed at stabilizing the atmospheric carbon dioxide (CO2) emissions. For a better understanding of CO2 variation trends over Asia, in this study, the column-averaged CO2 dry air mole fraction (XCO2) derived from the National Oceanic and Atmospheric Administration (NOAA) CarbonTracker (CT) was compared with that of Greenhouse Gases Observing Satellite (GOSAT) from September 2009 to August 2019 and with Orbiting Carbon Observatory 2 (OCO-2) from September 2014 until August 2019. Moreover, monthly averaged time-series and seasonal climatology comparisons were also performed separately over the five regions of Asia; i.e., Central Asia, East Asia, South Asia, Southeast Asia, and Western Asia. The results show that XCO2 from GOSAT is higher than the XCO2 simulated by CT by an amount of 0.61 ppm, whereas, OCO-2 XCO2 is lower than CT by 0.31 ppm on average, over Asia. The mean spatial correlations of 0.93 and 0.89 and average Root Mean Square Deviations (RMSDs) of 2.61 and 2.16 ppm were found between the CT and GOSAT, and CT and OCO-2, respectively, implying the existence of a good agreement between the CT and the other two satellites datasets. The spatial distribution of the datasets shows that the larger uncertainties exist over the southwest part of China. Over Asia, NOAA CT shows a good agreement with GOSAT and OCO-2 in terms of spatial distribution, monthly averaged time series, and seasonal climatology with small biases. These results suggest that CO2 can be used from either of the datasets to understand its role in the carbon budget, climate change, and air quality at regional to global scales. Full article
(This article belongs to the Special Issue Remote Sensing of Greenhouse Gases and Air Pollution)
Show Figures

Graphical abstract

8 pages, 211 KiB  
Editorial
Remote Sensing for Land Administration
by Rohan Bennett, Peter van Oosterom, Christiaan Lemmen and Mila Koeva
Remote Sens. 2020, 12(15), 2497; https://doi.org/10.3390/rs12152497 - 04 Aug 2020
Cited by 15 | Viewed by 6335
Abstract
Land administration constitutes the socio-technical systems that govern land tenure, use, value and development within a jurisdiction. The land parcel is the fundamental unit of analysis. Each parcel has identifiable boundaries, associated rights, and linked parties. Spatial information is fundamental. It represents the [...] Read more.
Land administration constitutes the socio-technical systems that govern land tenure, use, value and development within a jurisdiction. The land parcel is the fundamental unit of analysis. Each parcel has identifiable boundaries, associated rights, and linked parties. Spatial information is fundamental. It represents the boundaries between land parcels and is embedded in cadastral sketches, plans, maps and databases. The boundaries are expressed in these records using mathematical or graphical descriptions. They are also expressed physically with monuments or natural features. Ideally, the recorded and physical expressions should align, however, in practice, this may not occur. This means some boundaries may be physically invisible, lacking accurate documentation, or potentially both. Emerging remote sensing tools and techniques offers great potential. Historically, the measurements used to produce recorded boundary representations were generated from ground-based surveying techniques. The approach was, and remains, entirely appropriate in many circumstances, although it can be timely, costly, and may only capture very limited contextual boundary information. Meanwhile, advances in remote sensing and photogrammetry offer improved measurement speeds, reduced costs, higher image resolutions, and enhanced sampling granularity. Applications of unmanned aerial vehicles (UAV), laser scanning, both airborne and terrestrial (LiDAR), radar interferometry, machine learning, and artificial intelligence techniques, all provide examples. Coupled with emergent societal challenges relating to poverty reduction, rapid urbanisation, vertical development, and complex infrastructure management, the contemporary motivation to use these new techniques is high. Fundamentally, they enable more rapid, cost-effective, and tailored approaches to 2D and 3D land data creation, analysis, and maintenance. This Special Issue hosts papers focusing on this intersection of emergent remote sensing tools and techniques, applied to domain of land administration. Full article
(This article belongs to the Special Issue Remote Sensing for Land Administration)
15 pages, 6552 KiB  
Article
Preliminary Evaluation and Correction of Sea Surface Height from Chinese Tiangong-2 Interferometric Imaging Radar Altimeter
by Lin Ren, Jingsong Yang, Xiao Dong, Yunhua Zhang and Yongjun Jia
Remote Sens. 2020, 12(15), 2496; https://doi.org/10.3390/rs12152496 - 04 Aug 2020
Cited by 18 | Viewed by 2834
Abstract
In this study, we performed preliminary comparative evaluation and correction of two-dimensional sea surface height (SSH) data from the Chinese Tiangong-2 Interferometric Imaging Radar Altimeter (InIRA) with the goal of advancing its retrieval. Data from the InIRA were compared with one-dimensional SSH data [...] Read more.
In this study, we performed preliminary comparative evaluation and correction of two-dimensional sea surface height (SSH) data from the Chinese Tiangong-2 Interferometric Imaging Radar Altimeter (InIRA) with the goal of advancing its retrieval. Data from the InIRA were compared with one-dimensional SSH data from the traditional altimeters Jason-2, Saral/AltiKa, and Jason-3. Because the sea state bias (SSB) of distributed InIRA data has not yet been considered, consistency was maintained by neglecting the SSB for the traditional altimeters. The results of the comparisons show that the InIRA captures the same SSH trends as those obtained by traditional altimeters. However, there is a significant deviation between InIRA and traditional altimeter SSHs; consequently, systematic and parametric biases were analyzed. The parametric bias was found to be related to the incidence angles and a significant wave height. Upon correcting the two biases, the standard deviation significantly reduced to 8.1 cm. This value is slightly higher than those of traditional altimeters, which typically have a bias of ~7.0 cm. The results indicate that the InIRA is promising in providing a wide swath of SSH measurements. Moreover, we recommend that the InIRA retrieval algorithm should consider the two biases to improve SSH accuracy. Full article
(This article belongs to the Section Ocean Remote Sensing)
Show Figures

Graphical abstract

32 pages, 1205 KiB  
Review
Deep Learning for Land Use and Land Cover Classification Based on Hyperspectral and Multispectral Earth Observation Data: A Review
by Ava Vali, Sara Comai and Matteo Matteucci
Remote Sens. 2020, 12(15), 2495; https://doi.org/10.3390/rs12152495 - 03 Aug 2020
Cited by 182 | Viewed by 17733
Abstract
Lately, with deep learning outpacing the other machine learning techniques in classifying images, we have witnessed a growing interest of the remote sensing community in employing these techniques for the land use and land cover classification based on multispectral and hyperspectral images; the [...] Read more.
Lately, with deep learning outpacing the other machine learning techniques in classifying images, we have witnessed a growing interest of the remote sensing community in employing these techniques for the land use and land cover classification based on multispectral and hyperspectral images; the number of related publications almost doubling each year since 2015 is an attest to that. The advances in remote sensing technologies, hence the fast-growing volume of timely data available at the global scale, offer new opportunities for a variety of applications. Deep learning being significantly successful in dealing with Big Data, seems to be a great candidate for exploiting the potentials of such complex massive data. However, there are some challenges related to the ground-truth, resolution, and the nature of data that strongly impact the performance of classification. In this paper, we review the use of deep learning in land use and land cover classification based on multispectral and hyperspectral images and we introduce the available data sources and datasets used by literature studies; we provide the readers with a framework to interpret the-state-of-the-art of deep learning in this context and offer a platform to approach methodologies, data, and challenges of the field. Full article
Show Figures

Graphical abstract

22 pages, 13695 KiB  
Article
Seasonal Comparisons of Himawari-8 AHI and MODIS Vegetation Indices over Latitudinal Australian Grassland Sites
by Ngoc Nguyen Tran, Alfredo Huete, Ha Nguyen, Ian Grant, Tomoaki Miura, Xuanlong Ma, Alexei Lyapustin, Yujie Wang and Elizabeth Ebert
Remote Sens. 2020, 12(15), 2494; https://doi.org/10.3390/rs12152494 - 03 Aug 2020
Cited by 11 | Viewed by 4535
Abstract
The Advanced Himawari Imager (AHI) on board the Himawari-8 geostationary (GEO) satellite offers comparable spectral and spatial resolutions as low earth orbiting (LEO) sensors such as the Moderate Resolution Imaging Spectroradiometer (MODIS) and Visible Infrared Imaging Radiometer Suite (VIIRS) sensors, but with hypertemporal [...] Read more.
The Advanced Himawari Imager (AHI) on board the Himawari-8 geostationary (GEO) satellite offers comparable spectral and spatial resolutions as low earth orbiting (LEO) sensors such as the Moderate Resolution Imaging Spectroradiometer (MODIS) and Visible Infrared Imaging Radiometer Suite (VIIRS) sensors, but with hypertemporal image acquisition capability. This raises the possibility of improved monitoring of highly dynamic ecosystems, such as grasslands, including fine-scale phenology retrievals from vegetation index (VI) time series. However, identifying and understanding how GEO VI temporal profiles would be different from traditional LEO VIs need to be evaluated, especially with the new generation of geostationary satellites, with unfamiliar observation geometries not experienced with MODIS, VIIRS, or Advanced Very High Resolution Radiometer (AVHRR) VI time series data. The objectives of this study were to investigate the variations in AHI reflectances and normalized difference vegetation index (NDVI), enhanced vegetation index (EVI), and two-band EVI (EVI2) in relation to diurnal phase angle variations, and to compare AHI VI seasonal datasets with MODIS VIs (standard and sun and view angle-adjusted VIs) over a functional range of dry grassland sites in eastern Australia. Strong NDVI diurnal variations and negative NDVI hotspot effects were found due to differential red and NIR band sensitivities to diurnal phase angle changes. In contrast, EVI and EVI2 were nearly insensitive to diurnal phase angle variations and displayed nearly flat diurnal profiles without noticeable hotspot influences. At seasonal time scales, AHI NDVI values were consistently lower than MODIS NDVI values, while AHI EVI and EVI2 values were significantly higher than MODIS EVI and EVI2 values, respectively. We attributed the cross-sensor differences in VI patterns to the year-round smaller phase angles and backscatter observations from AHI, in which the sunlit canopies induced a positive EVI/ EVI2 response and negative NDVI response. BRDF adjustments of MODIS VIs to solar noon and to the oblique view zenith angle of AHI resulted in strong cross-sensor convergence of VI values (R2 > 0.94, mean absolute difference <0.02). These results highlight the importance of accounting for cross-sensor observation geometries for generating compatible AHI and MODIS annual VI time series. The strong agreement found in this study shows promise in cross-sensor applications and suggests that a denser time series can be formed through combined GEO and LEO measurement synergies. Full article
(This article belongs to the Special Issue Earth Monitoring from A New Generation of Geostationary Satellites)
Show Figures

Graphical abstract

18 pages, 5059 KiB  
Article
Crop Mapping from Sentinel-1 Polarimetric Time-Series with a Deep Neural Network
by Yang Qu, Wenzhi Zhao, Zhanliang Yuan and Jiage Chen
Remote Sens. 2020, 12(15), 2493; https://doi.org/10.3390/rs12152493 - 03 Aug 2020
Cited by 24 | Viewed by 5344
Abstract
Timely and accurate agricultural information is essential for food security assessment and agricultural management. Synthetic aperture radar (SAR) systems are increasingly available in crop mapping, as they provide all-weather imagery. In particular, the Sentinel-1 sensor provides dense time-series data, thus offering a unique [...] Read more.
Timely and accurate agricultural information is essential for food security assessment and agricultural management. Synthetic aperture radar (SAR) systems are increasingly available in crop mapping, as they provide all-weather imagery. In particular, the Sentinel-1 sensor provides dense time-series data, thus offering a unique opportunity for crop mapping. However, in most studies, the Sentinel-1 complex backscatter coefficient was used directly which limits the potential of the Sentinel-1 in crop mapping. Meanwhile, most of the existing methods may not be tailored for the task of crop classification in time-series polarimetric SAR data. To solve the above problem, we present a novel deep learning strategy in this research. To be specific, we collected Sentinel-1 time-series data in two study areas. The Sentinel-1 image covariance matrix is used as an input to maintain the integrity of polarimetric information. Then, a depthwise separable convolution recurrent neural network (DSCRNN) architecture is proposed to characterize crop types from multiple perspectives and achieve better classification results. The experimental results indicate that the proposed method achieves better accuracy in complex agricultural areas than other classical methods. Additionally, the variable importance provided by the random forest (RF) illustrated that the covariance vector has a far greater influence than the backscatter coefficient. Consequently, the strategy proposed in this research is effective and promising for crop mapping. Full article
(This article belongs to the Special Issue Deep Learning and Remote Sensing for Agriculture)
Show Figures

Graphical abstract

24 pages, 6651 KiB  
Article
Automated Geometric Quality Inspection of Prefabricated Housing Units Using BIM and LiDAR
by Yi Tan, Silin Li and Qian Wang
Remote Sens. 2020, 12(15), 2492; https://doi.org/10.3390/rs12152492 - 03 Aug 2020
Cited by 34 | Viewed by 5847
Abstract
Traditional quality inspection of prefabricated components is labor intensive, time-consuming, and error prone. This study developed an automated geometric quality inspection technique for prefabricated housing units using building information modeling (BIM) and light detection and ranging (LiDAR). The proposed technique collects the 3D [...] Read more.
Traditional quality inspection of prefabricated components is labor intensive, time-consuming, and error prone. This study developed an automated geometric quality inspection technique for prefabricated housing units using building information modeling (BIM) and light detection and ranging (LiDAR). The proposed technique collects the 3D laser scanned data of the prefabricated unit using a LiDAR which contains accurate as-built surface geometries of the prefabricated unit. On the other hand, the BIM model of the prefabricated unit contains the as-designed geometries of the unit. The scanned data and BIM model are then automatically processed to inspect the geometric quality of individual elements of the prefabricated units including both structural and mechanical elements, as well as electrical and plumbing (MEP) elements. To validate the proposed technique, experiments were conducted on two prefabricated bathroom units (PBUs). The inspection results showed that the proposed technique can provide accurate quality inspection results with 0.7 mm and 0.9 mm accuracy for structural and MEP elements, respectively. In addition, the experiments also showed that the proposed technique greatly improves the inspection efficiency regarding time and labor. Full article
(This article belongs to the Section Engineering Remote Sensing)
Show Figures

Figure 1

24 pages, 16818 KiB  
Article
Multi-Sensor Approach to Improve Bathymetric Lidar Mapping of Semi-Arid Groundwater-Dependent Streams: Devils River, Texas
by Kutalmis Saylam, Aaron R. Averett, Lucie Costard, Brad D. Wolaver and Sarah Robertson
Remote Sens. 2020, 12(15), 2491; https://doi.org/10.3390/rs12152491 - 03 Aug 2020
Cited by 6 | Viewed by 4770
Abstract
Remote sensing technology enables detecting, acquiring, and recording certain information about objects and locations from distances relative to their geographic locations. Airborne Lidar bathymetry (ALB) is an active, non-imaging, remote sensing technology for measuring the depths of shallow and relatively transparent water bodies [...] Read more.
Remote sensing technology enables detecting, acquiring, and recording certain information about objects and locations from distances relative to their geographic locations. Airborne Lidar bathymetry (ALB) is an active, non-imaging, remote sensing technology for measuring the depths of shallow and relatively transparent water bodies using light beams from an airborne platform. In this study, we acquired Lidar datasets using near-infrared and visible (green) wavelength with the Leica Airborne Hydrography AB Chiroptera-I system over the Devils River basin of southwestern Texas. Devils River is a highly groundwater-dependent stream that flows 150 km from source springs to Lake Amistad on the lower Rio Grande. To improve spatially distributed stream bathymetry in aquatic habitats of species of state and federal conservation interest, we conducted supplementary water-depth observations using other remote sensing technologies integrated with the airborne Lidar datasets. Ground penetrating radar (GPR) mapped the river bottom where vegetation impeded other active sensors in attaining depth measurements. We confirmed the accuracy of bathymetric Lidar datasets with a differential global positioning system (GPS) and compared the findings to sonar and GPR measurements. The study revealed that seamless bathymetric and geomorphic mapping of karst environments in complex settings (e.g., aquatic vegetation, entrained air bubbles, riparian zone obstructions) require the integration of a variety of terrestrial and remotely operated survey methods. We apply this approach to Devils River of Texas. However, the methods are applicable to similar streams globally. Full article
(This article belongs to the Special Issue Remote Sensing for Biodiversity Mapping and Monitoring)
Show Figures

Graphical abstract

29 pages, 13310 KiB  
Article
Segmentation of Vegetation and Flood from Aerial Images Based on Decision Fusion of Neural Networks
by Loretta Ichim and Dan Popescu
Remote Sens. 2020, 12(15), 2490; https://doi.org/10.3390/rs12152490 - 03 Aug 2020
Cited by 7 | Viewed by 4054
Abstract
The detection and evaluation of flood damage in rural zones are of great importance for farmers, local authorities, and insurance companies. To this end, the paper proposes an efficient system based on five neural networks to assess the degree of flooding and the [...] Read more.
The detection and evaluation of flood damage in rural zones are of great importance for farmers, local authorities, and insurance companies. To this end, the paper proposes an efficient system based on five neural networks to assess the degree of flooding and the remaining vegetation. After a previous analysis the following neural networks were selected as primary classifiers: you only look once network (YOLO), generative adversarial network (GAN), AlexNet, LeNet, and residual network (ResNet). Their outputs were connected in a decision fusion scheme, as a new convolutional layer, considering two sets of components: (a) the weights, corresponding to the proven accuracy of the primary neural networks in the validation phase, and (b) the probabilities generated by the neural networks as primary classification results in the operational (testing) phase. Thus, a subjective behavior (individual interpretation of single neural networks) was transformed into a more objective behavior (interpretation based on fusion of information). The images, difficult to be segmented, were obtained from an unmanned aerial vehicle photogrammetry flight after a moderate flood in a rural region of Romania and make up our database. For segmentation and evaluation of the flooded zones and vegetation, the images were first decomposed in patches and, after classification the resulting marked patches were re-composed in segmented images. From the performance analysis point of view, better results were obtained with the proposed system than the neural networks taken separately and with respect to some works from the references. Full article
(This article belongs to the Special Issue Deep Neural Networks for Remote Sensing Applications)
Show Figures

Graphical abstract

13 pages, 3640 KiB  
Article
Causal Analysis of Accuracy Obtained Using High-Resolution Global Forest Change Data to Identify Forest Loss in Small Forest Plots
by Yusuke Yamada, Toshihiro Ohkubo and Katsuto Shimizu
Remote Sens. 2020, 12(15), 2489; https://doi.org/10.3390/rs12152489 - 03 Aug 2020
Cited by 9 | Viewed by 3148
Abstract
Identifying areas of forest loss is a fundamental aspect of sustainable forest management. Global Forest Change (GFC) datasets developed by Hansen et al. (in Science 342:850–853, 2013) are publicly available, but the accuracy of these datasets for small forest plots has not been [...] Read more.
Identifying areas of forest loss is a fundamental aspect of sustainable forest management. Global Forest Change (GFC) datasets developed by Hansen et al. (in Science 342:850–853, 2013) are publicly available, but the accuracy of these datasets for small forest plots has not been assessed. We used a forest-wide polygon-based approach to assess the accuracy of using GFC data to identify areas of forest loss in an area containing numerous small forest plots. We evaluated the accuracy of detection of individual forest-loss polygons in the GFC dataset in terms of a “recall ratio”, the ratio of the spatial overlap of a forest-loss polygon determined from the GFC dataset to the area of a corresponding reference forest-loss polygon, which we determined by visual interpretation of aerial photographs. We analyzed the structural relationships of recall ratio with area of forest loss, tree species, and slope of the forest terrain by using linear non-Gaussian acyclic modelling. We showed that only 11.1% of forest-loss polygons in the reference dataset were successfully identified in the GFC dataset. The inferred structure indicated that recall ratio had the strongest relationships with area of forest loss, forest tree species, and height of the forest canopy. Our results indicate the need for careful consideration of structural relationships when using GFC datasets to identify areas of forest loss in regions where there are small forest plots. Moreover, further studies are required to examine the structural relationships for accuracy of land-use classification in forested areas in various regions and with different forest characteristics. Full article
Show Figures

Graphical abstract

19 pages, 5838 KiB  
Article
Mapping the Essential Urban Land Use in Changchun by Applying Random Forest and Multi-Source Geospatial Data
by Shouzhi Chang, Zongming Wang, Dehua Mao, Kehan Guan, Mingming Jia and Chaoqun Chen
Remote Sens. 2020, 12(15), 2488; https://doi.org/10.3390/rs12152488 - 03 Aug 2020
Cited by 33 | Viewed by 4727
Abstract
Understanding urban spatial pattern of land use is of great significance to urban land management and resource allocation. Urban space has strong heterogeneity, and thus there were many researches focusing on the identification of urban land use. The emergence of multiple new types [...] Read more.
Understanding urban spatial pattern of land use is of great significance to urban land management and resource allocation. Urban space has strong heterogeneity, and thus there were many researches focusing on the identification of urban land use. The emergence of multiple new types of geospatial data provide an opportunity to investigate the methods of mapping essential urban land use. The popularization of street view images represented by Baidu Maps is benificial to the rapid acquisition of high-precision street view data, which has attracted the attention of scholars in the field of urban research. In this study, OpenStreetMap (OSM) was used to delineate parcels which were recognized as basic mapping units. A semantic segmentation of street view images was combined to enrich the multi-dimensional description of urban parcels, together with point of interest (POI), Sentinel-2A, and Luojia-1 nighttime light data. Furthermore, random forest (RF) was applied to determine the urban land use categories. The results show that street view elements are related to urban land use in the perspective of spatial distribution. It is reasonable and feasible to describe urban parcels according to the characteristics of street view elements. Due to the participation of street view, the overall accuracy reaches 79.13%. The contribution of street view features to the optimal classification model reached 20.6%, which is more stable than POI features. Full article
(This article belongs to the Special Issue Urban Land Use Mapping and Analysis in the Big Data Era)
Show Figures

Graphical abstract

14 pages, 10663 KiB  
Letter
Automatic Mapping of Landslides by the ResU-Net
by Wenwen Qi, Mengfei Wei, Wentao Yang, Chong Xu and Chao Ma
Remote Sens. 2020, 12(15), 2487; https://doi.org/10.3390/rs12152487 - 03 Aug 2020
Cited by 62 | Viewed by 6218
Abstract
Massive landslides over large regions can be triggered by heavy rainfalls or major seismic events. Mapping regional landslides quickly is important for disaster mitigation. In recent years, deep learning methods have been successfully applied in many fields, including landslide automatic identification. In this [...] Read more.
Massive landslides over large regions can be triggered by heavy rainfalls or major seismic events. Mapping regional landslides quickly is important for disaster mitigation. In recent years, deep learning methods have been successfully applied in many fields, including landslide automatic identification. In this work, we proposed a deep learning approach, the ResU-Net, to map regional landslides automatically. This method and a baseline model (U-Net) were collectively tested in Tianshui city, Gansu province, where a heavy rainfall triggered more than 10,000 landslides in July 2013. All models were performed on a 3-band (near infrared, red, and green) GeoEye-1 image with a spatial resolution of 0.5 m. At such a fine spatial resolution, the study area is spatially heterogeneous. The tested study area is 128 km2, 80% of which was used to train models and the remaining 20% was used to validate accuracy of the models. This proposed ResU-Net achieved higher accuracy than the baseline U-Net model in this mountain region, where F1 improved by 0.09. Compared with the U-Net model, this proposed model (ResU-Net) performs better in discriminating landslides from bare floodplains along river valleys and unplanted terraces. By incorporating environmental information, this ResU-Net may also be applied to other landslide mapping, such as landslide susceptibility and hazard assessment. Full article
Show Figures

Graphical abstract

19 pages, 16219 KiB  
Article
Proof of Concept for Sea Ice Stage of Development Classification Using Deep Learning
by Ryan Kruk, M. Christopher Fuller, Alexander S. Komarov, Dustin Isleifson and Ian Jeffrey
Remote Sens. 2020, 12(15), 2486; https://doi.org/10.3390/rs12152486 - 03 Aug 2020
Cited by 17 | Viewed by 4048
Abstract
Accurate maps of ice concentration and ice type are needed to address increased interest in commercial marine transportation through the Arctic. RADARSAT-2 SAR imagery is the primary source of data used by expert ice analysts at the Canadian Ice Service (CIS) to produce [...] Read more.
Accurate maps of ice concentration and ice type are needed to address increased interest in commercial marine transportation through the Arctic. RADARSAT-2 SAR imagery is the primary source of data used by expert ice analysts at the Canadian Ice Service (CIS) to produce sea ice maps over the Canadian territory. This study serves as a proof of concept that neural networks can be used to accurately predict ice type from SAR data. Datasets of SAR images served as inputs, and CIS ice charts served as labelled outputs to train a neural network to classify sea ice type. Our results show that DenseNet achieves the highest overall classification accuracy of 94.0% including water and the highest ice classification accuracy of 91.8% on a three class dataset using a fusion of HH and HV SAR polarizations for the input samples. The 91.8% ice classification accuracy validates the premise that a neural network can be used to effectively categorize different ice types based on SAR data. Full article
(This article belongs to the Special Issue Polar Sea Ice: Detection, Monitoring and Modeling)
Show Figures

Graphical abstract

2 pages, 155 KiB  
Erratum
Erratum: Skoneczny, H., et al. Fire Blight Disease Detection for Apple Trees: Hyperspectral Analysis of Healthy, Infected and Dry Leaves. Remote Sensing 2020, 12(13), 2101
by Hubert Skoneczny, Katarzyna Kubiak, Marcin Spiralski, Jan Kotlarz, Artur Mikiciński and Joanna Puławska
Remote Sens. 2020, 12(15), 2485; https://doi.org/10.3390/rs12152485 - 03 Aug 2020
Viewed by 2295
Abstract
The authors wish to make the following corrections to this paper [...] Full article
(This article belongs to the Special Issue Spectroscopic Analysis of Plants and Vegetation)
20 pages, 4092 KiB  
Article
Comparison of CORINE Land Cover Data with National Statistics and the Possibility to Record This Data on a Local Scale—Case Studies from Slovakia
by Vladimír Falťan, František Petrovič, Ján Oťaheľ, Ján Feranec, Michal Druga, Matej Hruška, Jozef Nováček, Vladimír Solár and Veronika Mechurová
Remote Sens. 2020, 12(15), 2484; https://doi.org/10.3390/rs12152484 - 03 Aug 2020
Cited by 15 | Viewed by 5182
Abstract
Monitoring of land cover (LC) provides important information of actual land use (LU) and landscape dynamics. LC research results depend on the size of the area, purpose and applied methodology. CORINE Land Cover (CLC) data is one of the most important sources of [...] Read more.
Monitoring of land cover (LC) provides important information of actual land use (LU) and landscape dynamics. LC research results depend on the size of the area, purpose and applied methodology. CORINE Land Cover (CLC) data is one of the most important sources of LU data from a European perspective. Our research compares official CLC data (third hierarchical level of nomenclature at a scale of 1:100,000) and national statistics (NS) of LU in Slovakia between 2000 and 2018 at national, county, and local levels. The most significant differences occurred in arable land and permanent grassland, which is also related to the recording method and the development of agricultural land management. Due to the abandonment of agricultural areas, a real recorded increase in forest cover due to forest succession was not introduced in the official records of Land register. New modification of CLC methodology for identifying LC classes at a scale of 1:10,000 and fifth hierarchical level of CLC is firstly applied for local case studies representing lowland, basin, and mountain landscape. The size of the least identified and simultaneously recorded area was established at 0.1 ha the minimum width of a polygon was established at 10 m, the minimum recorded width of linear elements such as communications was established at 2 m. The use of the fifth CLC level in the case studies areas generated average boundary density 17.2 km/km2, comparing to the 2.6 km/km2 of the third level. Therefore, when measuring the density of spatial information by the polygon boundary lengths, the fifth level carries 6.6 times more information than the third level. Detailed investigation of LU affords better verification of national statistics data at a local level. This study also contributes to a more detailed recording of the current state of the Central European landscape and its changes. Full article
Show Figures

Graphical abstract

11 pages, 778 KiB  
Letter
The T Index: Measuring the Reliability of Accuracy Estimates Obtained from Non-Probability Samples
by François Waldner
Remote Sens. 2020, 12(15), 2483; https://doi.org/10.3390/rs12152483 - 03 Aug 2020
Cited by 4 | Viewed by 3890
Abstract
In remote sensing, the term accuracy typically expresses the degree of correctness of a map. Best practices in accuracy assessment have been widely researched and include guidelines on how to select validation data using probability sampling designs. In practice, however, probability samples may [...] Read more.
In remote sensing, the term accuracy typically expresses the degree of correctness of a map. Best practices in accuracy assessment have been widely researched and include guidelines on how to select validation data using probability sampling designs. In practice, however, probability samples may be lacking and, instead, cross-validation using non-probability samples is common. This practice is risky because the resulting accuracy estimates can easily be mistaken for map accuracy. The following question arises: to what extent are accuracy estimates obtained from non-probability samples representative of map accuracy? This letter introduces the T index to answer this question. Certain cross-validation designs (such as the common single-split or hold-out validation) provide representative accuracy estimates when hold-out sets are simple random samples of the map population. The T index essentially measures the probability of a hold-out set of unknown sampling design to be a simple random sample. To that aim, we compare its spread in the feature space against the spread of random unlabelled samples of the same size. Data spread is measured by a variant of Moran’s I autocorrelation index. Consistent interpretation of the T index is proposed through the prism of significance testing, with T values < 0.05 indicating unreliable accuracy estimates. Its relevance and interpretation guidelines are also illustrated in a case study on crop-type mapping. Uptake of the T index by the remote-sensing community will help inform about—and sometimes caution against—the representativeness of accuracy estimates obtained by cross-validation, so that users can better decide whether a map is fit for their purpose or how its accuracy impacts their application. Subsequently, the T index will build trust and improve the transparency of accuracy assessment in conditions which deviate from best practices. Full article
Show Figures

Graphical abstract

23 pages, 6450 KiB  
Article
Coastline Fractal Dimension of Mainland, Island, and Estuaries Using Multi-temporal Landsat Remote Sensing Data from 1978 to 2018: A Case Study of the Pearl River Estuary Area
by Xinyi Hu and Yunpeng Wang
Remote Sens. 2020, 12(15), 2482; https://doi.org/10.3390/rs12152482 - 03 Aug 2020
Cited by 8 | Viewed by 3631
Abstract
The Pearl River Estuary Area was selected for this study. For the past 40 years, it has been one of the most complex coasts in China, yet few studies have analyzed the complexity and variations of the area’s different coastlines. In this investigation, [...] Read more.
The Pearl River Estuary Area was selected for this study. For the past 40 years, it has been one of the most complex coasts in China, yet few studies have analyzed the complexity and variations of the area’s different coastlines. In this investigation, the coastlines of the Pearl River Estuary Area were extracted from multi-temporal Landsat remote sensing data from 1978, 1988, 1997, 2008, and 2018. The coastline of this area was classified into mainland, island, and estuarine. To obtain more detailed results of the mainland and island, we regarded this area as the main body, rezoned into different parts. The box-counting dimension was applied to compute the bidimensional (2D) fractal dimension. Coastline length and the fractal dimension of different types of coastline and different parts of the main body were calculated and compared. The fractal dimension of the Pearl River Estuary Area was found to have increased significantly, from 1.228 to 1.263, and coastline length also increased during the study period. The island and mainland showed the most complex coastlines, while estuaries showed the least complexity during the past forty years. A positive correlation was found between length and 2D-fractal dimension in some parts of the study area. Land reclamation had the strongest influence on fractal dimension variations. Full article
(This article belongs to the Special Issue Coastal Environments and Coastal Hazards)
Show Figures

Graphical abstract

18 pages, 4528 KiB  
Article
Apple Shape Detection Based on Geometric and Radiometric Features Using a LiDAR Laser Scanner
by Nikos Tsoulias, Dimitrios S. Paraforos, George Xanthopoulos and Manuela Zude-Sasse
Remote Sens. 2020, 12(15), 2481; https://doi.org/10.3390/rs12152481 - 03 Aug 2020
Cited by 40 | Viewed by 6640
Abstract
Yield monitoring systems in fruit production mostly rely on color features, making the discrimination of fruits challenging due to varying light conditions. The implementation of geometric and radiometric features in three-dimensional space (3D) analysis can alleviate such difficulties improving the fruit detection. In [...] Read more.
Yield monitoring systems in fruit production mostly rely on color features, making the discrimination of fruits challenging due to varying light conditions. The implementation of geometric and radiometric features in three-dimensional space (3D) analysis can alleviate such difficulties improving the fruit detection. In this study, a light detection and range (LiDAR) system was used to scan apple trees before (TL) and after defoliation (TD) four times during seasonal tree growth. An apple detection method based on calibrated apparent backscattered reflectance intensity (RToF) and geometric features, capturing linearity (L) and curvature (C) derived from the LiDAR 3D point cloud, is proposed. The iterative discretion of apple class from leaves and woody parts was obtained at RToF > 76.1%, L < 15.5%, and C > 73.2%. The position of fruit centers in TL and in TD was compared, showing a root mean square error (RMSE) of 5.7%. The diameter of apples estimated from the foliated trees was related to the reference values based on the perimeter of the fruits, revealing an adjusted coefficient of determination (R2adj) of 0.95 and RMSE of 9.5% at DAFB120. When comparing the results obtained on foliated and defoliated tree’s data, the estimated number of fruit’s on foliated trees at DAFB42, DAFB70, DAFB104, and DAFB120 88.6%, 85.4%, 88.5%, and 94.8% of the ground truth values, respectively. The algorithm resulted in maximum values of 88.2% precision, 91.0% recall, and 89.5 F1 score at DAFB120. The results point to the high capacity of LiDAR variables [RToF, C, L] to localize fruit and estimate its size by means of remote sensing. Full article
(This article belongs to the Section Remote Sensing in Agriculture and Vegetation)
Show Figures

Graphical abstract

21 pages, 6106 KiB  
Article
Species Monitoring Using Unmanned Aerial Vehicle to Reveal the Ecological Role of Plateau Pika in Maintaining Vegetation Diversity on the Northeastern Qinghai-Tibetan Plateau
by Yu Qin, Yi Sun, Wei Zhang, Yan Qin, Jianjun Chen, Zhiwei Wang and Zhaoye Zhou
Remote Sens. 2020, 12(15), 2480; https://doi.org/10.3390/rs12152480 - 03 Aug 2020
Cited by 15 | Viewed by 3831
Abstract
Plateau pika (Ochotona curzoniae, hereafter pika) is considered to exert a profound impact on vegetation species diversity of alpine grasslands. Great efforts have been made at mound or quadrat scales; nevertheless, there is still controversy about the effect of pika. It [...] Read more.
Plateau pika (Ochotona curzoniae, hereafter pika) is considered to exert a profound impact on vegetation species diversity of alpine grasslands. Great efforts have been made at mound or quadrat scales; nevertheless, there is still controversy about the effect of pika. It is vital to monitor vegetation species composition in natural heterogeneous ecosystems at a large scale to accurately evaluate the real role of pika. In this study, we performed field survey at 55 alpine grassland sites across the Shule River Basin using combined methods of aerial photographing using an unmanned aerial vehicle (UAV) and traditional ground measurement. Based on our UAV operation system, Fragmentation Monitoring and Analysis with aerial Photography (FragMAP), aerial images were acquired. Plot-scale vegetation species were visually identified, and total pika burrow exits were automatically retrieved using the self-developed image processing software. We found that there were significant linear relationships between the vegetation species diversity indexes obtained by these two methods. Additionally, the total number of identified species by the UAV method was 71, which was higher than the Quadrat method recognition, with the quantity of 63. Our results indicate that the UAV was suitable for long-term repeated monitoring vegetation species composition of multiple alpine grasslands at plot scale. With the merits of UAV, it confirmed that pika’s disturbance belonged to the medium level, with the density ranging from 30.17 to 65.53 ha−1. Under this density level, pika had a positive effect on vegetation species diversity, particularly for the species richness of sedge and forb. These findings conclude that the UAV was an efficient and economic tool for species monitoring to reveal the role of pika in the alpine grasslands. Full article
Show Figures

Graphical abstract

20 pages, 33575 KiB  
Article
Linear and Non-Linear Models for Remotely-Sensed Hyperspectral Image Visualization
by Radu-Mihai Coliban, Maria Marincaş, Cosmin Hatfaludi and Mihai Ivanovici
Remote Sens. 2020, 12(15), 2479; https://doi.org/10.3390/rs12152479 - 02 Aug 2020
Cited by 6 | Viewed by 4468
Abstract
The visualization of hyperspectral images still constitutes an open question and may have an important impact on the consequent analysis tasks. The existing techniques fall mainly in the following categories: band selection, PCA-based approaches, linear approaches, approaches based on digital image processing techniques [...] Read more.
The visualization of hyperspectral images still constitutes an open question and may have an important impact on the consequent analysis tasks. The existing techniques fall mainly in the following categories: band selection, PCA-based approaches, linear approaches, approaches based on digital image processing techniques and machine/deep learning methods. In this article, we propose the usage of a linear model for color formation, to emulate the image acquisition process by a digital color camera. We show how the choice of spectral sensitivity curves has an impact on the visualization of hyperspectral images as RGB color images. In addition, we propose a non-linear model based on an artificial neural network. We objectively assess the impact and the intrinsic quality of the hyperspectral image visualization from the point of view of the amount of information and complexity: (i) in order to objectively quantify the amount of information present in the image, we use the color entropy as a metric; (ii) for the evaluation of the complexity of the scene we employ the color fractal dimension, as an indication of detail and texture characteristics of the image. For comparison, we use several state-of-the-art visualization techniques. We present experimental results on visualization using both the linear and non-linear color formation models, in comparison with four other methods and report on the superiority of the proposed non-linear model. Full article
(This article belongs to the Special Issue Advances in Hyperspectral Data Exploitation)
Show Figures

Figure 1

Previous Issue
Next Issue
Back to TopTop