


Abstract
Eastern Thailand serves as a critical case study for the escalating tension between agricultural preservation and urban expansion, a dynamic recently intensified by the COVID-19 pandemic. This study addresses a pivotal research question: To what extent do emerging socio-economic realities, such as policy shifts, labor fluctuations, and climatic extremes, alter the spatiotemporal continuity of urban expansion? Employing a mixed-methods approach, we integrated multi-stakeholder insights with quantitative spatial modeling to simulate context-specific land use futures through 2030. Qualitative findings indicate that while COVID-19 accelerated agricultural modernization, evidenced by increased mechanization and e-commerce integration, these shifts have limited long-term impact on land use patterns. Instead, regional policy, climate change, and technological innovation emerged as the primary drivers of landscape transformation. Quantitative simulations reveal that urban growth will concentrate in the western provinces bordering Bangkok and the southern coastal corridors of Chon Buri and Rayong. Crucially, across all scenarios, approximately 60% of new urban land is projected to be converted from existing croplands, followed by significant losses in natural forest cover. These results demonstrate that current growth-oriented policies may undermine regional food security and ecosystem services. This study provides a framework for balancing agricultural modernization with ecological preservation, offering essential evidence for developing the integrated, sustainability-focused land use frameworks required to meet 2030 development goals.
Keywords:
land change modeling; mixed methods; agriculture; urbanization; pandemic; Eastern Thailand 1. Introduction
Southeast Asia, with its growing population and robust economic development, faces mounting tension between agriculture and urbanization. Agriculture remains central to the region’s economy and food security, employing over 159 million people in 2021 [1]. In Thailand, a representative case within the region, agriculture contributes roughly 8% to the national GDP and occupies 46% of the country’s land area [2]. Yet, rapid economic growth and urban expansion are driving substantial land use change, particularly around Bangkok and in industrial development zones such as the Eastern Economic Corridor (EEC). Between 2000 and 2020, cropland cover in Thailand declined markedly, from 53.77% to 46.54% of the national land area, while urban regions expanded rapidly [3]. To address these pressures, Thailand has introduced policies such as the Land Lease for Agriculture Act to protect farmland from abandonment or misuse [4]. However, balancing farmland preservation with the demands of urbanization and economic development remains a critical challenge. The COVID-19 pandemic further complicated this balance; construction and infrastructure projects were delayed by labor shortages, supply chain disruptions, and reduced investment, temporarily slowing urbanization [5,6]. At the same time, widespread job losses in cities triggered reverse migration to rural areas, briefly strengthening small-scale farming; however, agriculture was also exposed to disrupted supply chains and declining export revenues [7]. Using multitemporal remote sensing observations, Chen et al. [8] found that COVID-19 had only a short-term and limited impact on agricultural land use in Eastern Thailand. Consequently, this study conceptualizes the COVID-19 pandemic as a diagnostic shock. While the pandemic itself is a transient event, the vulnerabilities it highlighted (such as labor dependency and export fragility) provide the empirical justification for the long-term drivers analyzed in our scenarios. By analyzing the regional response to this acute disruption, our study allows for a spatially explicit quantification of land-change dynamics that distinguishes long-term structural transformations from transitory fluctuations, providing a more robust basis for near-term geographic projections.
Previous investigations [3,9,10,11,12,13] have employed multi-temporal satellite imagery and spatial analysis to quantify the rate of land-cover conversion. Rather than merely documenting trends, these studies provide a longitudinal analysis of how urban sprawl has fragmented local ecosystems, offering a technical foundation for current land use policy development. However, relying solely on historical data is insufficient for anticipating future landscape dynamics. By integrating past land use patterns with land change models, researchers and planners can simulate potential scenarios and explore alternative development pathways. This approach has been increasingly applied to guide adaptive, forward-looking land use policies in Southeast Asia and particularly Thailand. For example, Walsh et al. [14] used a cellular automata (CA) model to simulate the expansion of lowland paddy rice and upland crops at the expense of forests in Nang Rong District, northeastern Thailand. Fox et al. [15] applied the CLUE-s model to montane mainland Southeast Asia, including parts of Thailand, and predicted rapid growth in rubber and other tree crops. More recently, Tontisirin and Anantsuksomsri [16] employed a Cellular Automata–Markov model to project land use changes in Eastern Thailand, finding that coastal areas became more urbanized than inland areas.
Rather than predicting a single ‘true’ future, scenario testing in land change modeling allows researchers and decision-makers to explore a range of plausible alternatives and their potential implications. This approach is particularly useful for identifying risks, trade-offs, and opportunities, while providing evidence to support adaptive land use planning. The definition of scenarios typically involves translating qualitative narratives, for example, policy visions, stakeholder perspectives, or socio-economic pathways, into quantitative model inputs. However, land change modeling in Southeast Asia has so far relied heavily on quantitative data analysis. Scenarios have often been defined either through researchers’ own assumptions [14] or through relatively limited inputs from stakeholders or experts [15]. While these approaches are technically sound, they lack rigorous qualitative discourse analysis and systematic translation into quantitative parameters. It risks underrepresenting the feasible and context-specific incentives and constraints driving future land conversion in the study area. A more balanced integration of quantitative and qualitative approaches has greater potential to capture how emerging drivers, such as climate change, technological innovation, and socio-economic transformation, shape stakeholder and policymaker perceptions. As demonstrated by Siegel et al. [17] in their study of deforestation in a Brazilian national forest, and by Saqib et al. [18] in their assessment of agricultural land changes in Pakistan, such integration is critical for improving our understanding of land use transitions. This need is particularly urgent in the post-COVID era, as agricultural and urbanization dynamics in Thailand adjust to its diagnostic shock in ways that illuminate or shape land use conversion trends [6]. The integration of qualitative interviews into quantitative land use modeling is also grounded in the Story-and-Simulation (SAS) framework [19,20]. While quantitative models effectively capture historical spatial trends, they often struggle to account for sudden policy shifts or subjective stakeholder behaviors. Integrating qualitative data is therefore necessary to define scenarios that are not only statistically significant but also socio-politically plausible. This mixed-methods approach allows for a more nuanced representation of complex drivers that are frequently omitted in purely data-driven simulations.
The primary objective of this study was to evaluate the recalibration of the rural-to-urban land conversion trajectory in the EEC following the COVID-19 pandemic. Specifically, it assesses the extent to which emerging drivers, such as policy realignments, shifting labor dynamics, and climatic extremes, disrupt the established spatiotemporal continuity of urban expansion. To address this, we employed a mixed-methods approach that integrated qualitative and quantitative analyses to simulate plausible future land use scenarios. Thematic analysis of in-depth interviews with farmers and key stakeholders were used to define scenarios and identify specific incentives and constraints, which were then incorporated into quantitative land change modeling for scenario testing and comparison. Eastern Thailand provides an ideal case study of the competing pressures between agricultural protection and urban expansion in Thailand and across much of Southeast Asia. The region is notable for its diverse crop production, including high-value export commodities such as durian, rubber, rice, and rambutan, while simultaneously facing rapid land use change driven by planned urbanization near the coast and industrial corridor [8]. The study area spans seven provinces with markedly different land use policies for urbanization and agricultural development, enabling us to compare not only future trajectories across scenarios but also their spatial variability within the region.
2. Materials and Methods
2.1. Study Area
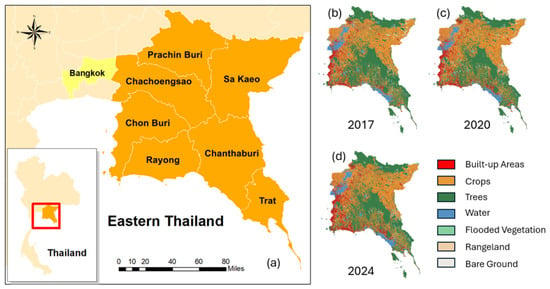
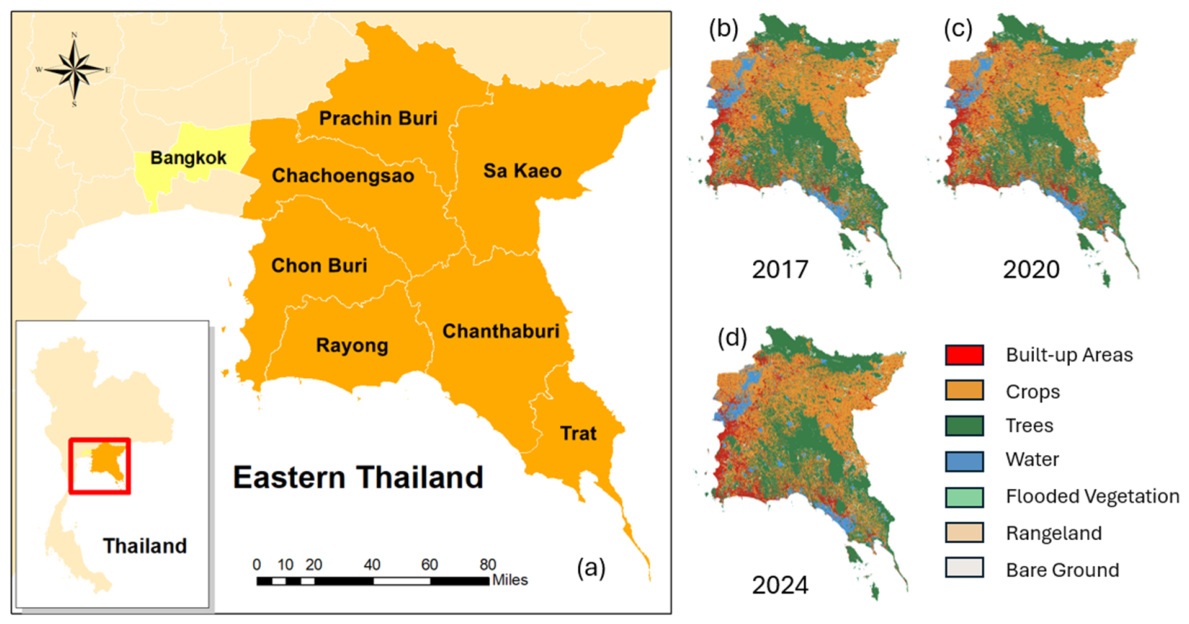
Eastern Thailand encompasses seven provinces—Chachoengsao, Chanthaburi, Chon Buri, Prachin Buri, Rayong, Sa Kaeo, and Trat, with Bangkok bordering Chachoengsao to the west [Figure 1a]. The region covers more than 34,000 km2 and is home to over 4.8 million residents [21]. While climatic conditions vary slightly among provinces, the region generally experiences three distinct seasons: hot (mid-February to mid-May), wet (mid-May and mid-October), and cool (mid-October and mid-February) [22]. Increasing climate variability, however, has blurred these seasonal distinctions, complicating agricultural planning [23].
Figure 1.
(a) The study area of Eastern Thailand, which consists of seven provinces—Chachoengsao, Chanthaburi, Chon Buri, Prachin Buri, Rayong, Sa Kaeo, and Trat (modified after [8])—and its historical land use maps [years (b) 2017, (c) 2020 and (d) 2024].
Agricultural land accounts for approximately 54–69% of the total area [24], underscoring the sector’s significance in Eastern Thailand. The region is characterized by a mix of coastal plains, rolling hills, and fertile river basins that support diverse agricultural activities. Major crops include rice, durian, eucalyptus, oil palm, pineapple, sugarcane, cassava, rubber, mangosteen, and coconut. Crop distribution differs across provinces; for instance, rice cultivation is more prominent in Eastern Chachoengsao, resembling patterns typical of Central Thailand. Fruit orchards, particularly durian, mangosteen, rambutan, and longan, are a hallmark of the region, with provinces like Chanthaburi and Rayong being major fruit producers. Rubber, cassava, and sugarcane are also important cash crops, while coastal zones support aquaculture and fishing. Over the past few decades, agricultural modernization and agro-industry expansion have increasingly shaped the rural landscape of Eastern Thailand.
In contrast, parts of the region, Rayong, Chon Buri, and Chachoengsao, form the core of the EEC, a national development initiative aimed at promoting foreign investment in twelve target industries, ranging from next-generation automotive and intelligent electronics to advanced agriculture and biotechnology [25]. These initiatives have accelerated urban expansion, reshaped land cover, and intensified competition for water resources, frequently creating tensions with surrounding smallholder farms [16].
2.2. Data
2.2.1. Historical Land Use Maps
We utilized three historical land cover and land use maps (Figure 1) jointly developed by Esri (Environmental Systems Research Institute, Inc., Redlands, CA, USA) and Microsoft (Redmond, WA, USA) [26]. According to the developers, these global-coverage maps (2017–2024) were generated using recent artificial intelligence (AI) modeling structures trained on billions of human-labeled image pixels, resulting in a relatively high reported accuracy of 85.0% [26]. The product also leverages high-resolution (10 m) Sentinel-2 satellite imagery to capture smallholder farms. The maps classify land into nine categories: crops, built-up areas, water, trees (natural forests), flooded vegetation, rangeland, bare ground, snow/ice, and clouds. Among them, snow/ice and clouds were not found in our study area and were excluded from our analysis. Due to the relatively short operational period of the Sentinel-2 mission, we selected maps from 2017 (the earliest possible), 2020, and 2024 for analysis.
2.2.2. Interview Data Collection
Data collections were performed in summers 2024 and 2025. In 2024, we conducted structured interviews (including both closed- and open-ended items) with 52 farmers, semi-structured interviews with 10 stakeholders from government, trade, and agricultural research sectors, and 11 farm visits in Chanthaburi and Trat. In 2025, seven additional stakeholder interviews were completed. Stakeholders represented government, civil society, and private sectors across local to international scales. In 2025, we also shared preliminary findings at a workshop with the Young Smart Farmers Association in Chanthaburi, where we had the opportunity to gain additional context and feedback from farmers. This association was established under the Thai government’s Young Smart Farmer (YSF) program, initiated in 2014 to address challenges with an aging farming population. The program encourages young people (aged 17–45) to pursue agriculture as a career by emphasizing innovation, technology, and entrepreneurship [27].
Farmer and key stakeholder participants were aged 20 years or older and knowledgeable about agricultural trends in Thailand or Eastern Thailand. Recruitment used snowball and purposive sampling with guidance from a community advisory board of agricultural experts. Together, these sampling strategies provided a strong participant pool with expertise on growing different crop types, on different farm sizes, over time. A summary of the interview participant characteristics is shown in Table 1. While the sample of interviewed farmers exhibits a younger age profile compared to the national average, this distribution aligns with the study’s focus on emerging agricultural transitions. The disproportionate representation of farmers under the age of 46 was a result of purposive sampling aimed at capturing stakeholders most involved in the adoption of heavy machinery, e-commerce, and cooperative-led profit maximization. Crucially, we utilize the insights from this ‘early adopter’ group to identify systemic incentives and constraints rather than as a direct behavioral template for the entire population. By treating these findings as structural drivers within our spatial modeling framework, which is itself constrained by existing regional land-tenure data, we ensure that the 2030 projections reflect the broader regional agricultural system’s trajectory rather than an isolated subgroup. In addition to age distribution, the sample exhibits a skew toward medium- and large-scale landholdings, exceeding the regional average. This distribution was an intentional outcome of our purposive sampling strategy, which prioritized stakeholders who possess the capital and scale necessary to implement the structural shifts, such as advanced mechanization and e-commerce integration, central to our 2030 scenarios. While smallholder dynamics remain critical to the region’s social fabric, large-scale producers act as the primary drivers of spatial land-cover transitions and industrial-scale agricultural expansion. Consequently, the 2030 projections should be viewed as an exploration of modernization-intensive trajectories, reflecting the land use decisions of those stakeholders most capable of responding to the policy and technological incentives modeled in this study. The selection of interviewees was also guided by a combination of logistical feasibility and purposive sampling. We specifically targeted farmers and policymakers with significant longitudinal experience in Eastern Thailand’s agricultural and industrial sectors. By prioritizing respondents with deep contextual knowledge of the regional land use history, we ensured that the qualitative drivers translated into the quantitative model were grounded in expert observation. The geographical distribution of these experts ranged from local districts or provinces to regional and national levels through which they provided knowledge on a cross-section of the region’s diverse socio-economic landscapes for Chachoengsao (10), Chanthaburi (13), Chon Buri (8), Prachin Buri (8), Rayong (11), Sa Kaeo (9), and Trat (10).
Table 1.
Interview participant characteristics.
The interview protocol was designed to progress from introductory background questions aimed at establishing rapport, to increasingly targeted questions concerning pandemic adaptations, climate change, technology, and policy. The design was intentionally iterative; insights emerging from earlier interviews informed the refinement of subsequent questions, thereby enhancing the relevance and depth of the inquiry. This sequencing not only facilitated participant comfort—an important factor in eliciting candid and nuanced responses—but also ensured sustained alignment with the study’s thematic objectives [28]. Farmer interviews covered demographics, crop types, practices, and market channels before, during, and after the pandemic, along with open-ended questions on the impacts of COVID-19 and climate change, government responses, and lasting effects. Stakeholder interviews addressed broader agricultural issues in Eastern Thailand, including pandemic and climate change impacts on labor, information flows, government programs, intermediary roles, and e-commerce. Interviews lasted 25–60 min, were primarily conducted in Thai with on-site translation (unless the participant preferred English), and were audio-recorded for transcription and analysis.
2.2.3. Ancillary Data
We collected the topographic data Digital Elevation Model (DEM) from the Terra Advanced Spaceborne Thermal Emission and Reflection Radiometer (ASTER) Global Digital Elevation Model (GDEM) Version 3 product [29]. This free-access dataset had a spatial resolution of 30 m covering the entire study area. This version of DEM offers significant advancements over earlier versions through its improved coverage, reduced artifacts, and enhanced accuracy. The road network vector data was collected from OpenStreetMaps through the Humanitarian Data Exchange (HDE) platform [30], and was classified into three categories—primary, secondary, and tertiary roads.
2.3. Methods
2.3.1. Quantitative Land Change Modeling
To ensure spatial consistency, all datasets were resampled to the same 30 m resolution. Historical land use maps from 2017 and 2020 were used to train the land change model, which was then applied to simulate 2024 land use conditions. The simulated 2024 map was compared with the observed 2024 map to assess model performance. We employed the open-access Land Change Modeler (LCM), a statistically based modeling tool integrated into TerrSet version 20.02 [31], to generate a 2030 land use projection for Eastern Thailand. LCM has been widely applied across diverse geographic regions and disciplines over the past decade [16,32,33]. The 2030 projection horizon was selected to balance predictive reliability with policy relevance. While structural drivers such as climate change and technological advancement operate over longer cycles, their immediate impacts are often realized through rapid policy shifts and localized ‘shocks’ to land use systems. By utilizing a 2030 target, the model minimizes the cumulative uncertainty inherent in long-term Markovian extrapolations while remaining synchronized with Asian Development Bank’s Strategy 2030 timelines [5]. Furthermore, the integration of stakeholder-derived weights allowed the model to bypass purely historical trends, incorporating anticipated technological interventions and climate adaptation strategies as non-linear modifiers to the spatial transition potentials. Consequently, the 2030 results represent a mechanistic assessment of how emerging structural drivers interact with existing landscape trajectories.
Given the study’s focus on competition between agricultural and urban land uses and the predominance of one-way conversion to urban areas, we modeled five specific transitions: crops → built-up areas, trees → built-up areas, bare ground → built-up areas, flooded vegetation → built-up areas, and rangeland → built-up areas. A separate sub-model was developed for each transition to estimate its spatial transition potential. Two categories of explanatory variables were used; i.e., topographic and proximity drivers. Both were shown to be effective in land change modeling across varied contexts, including the expansion of tree plantations in montane mainland Southeast Asia, forest-to-agriculture conversion in Brazil, and urbanization in the southeastern United States [15,17,33]. From the DEM, we derived slope and aspect layers. The road network was converted from vector to raster at 30 m resolution to create a road proximity layer to primary, secondary and tertiary roads, reflecting the role of transportation in both human mobility and crop product distribution. Using the 2017 land use map, we generated proximity-to-urban and proximity-to-water layers, also at 30 m resolution. Proximity to existing urban areas is a critical factor, as new urban development often clusters near established urban footprints due to pre-existing physical and socioeconomic infrastructure [34]. Water proximity was included given its longstanding importance as a contested resource between agricultural and urban sectors in the region [35].
Transition potentials were estimated using the Multi-Layer Perceptron (MLP), a machine learning approach capable of modeling complex, non-linear relationships [36]. To incorporate temporal dynamics, the MLP was integrated with Markov Chain (MC) analysis. MC analysis generates a transition probability matrix based on historical land use changes but does not account for causal drivers or spatial heterogeneity [37]. The MLP component addresses these limitations by incorporating spatially explicit driving factors for each sub-model, while the MC component regulates the timing and magnitude of transitions. This hybrid MLP–MC approach has been shown to substantially improve predictive performance compared to the use of either method in isolation [37]. To ensure methodological rigor and mitigate the risk of model overfitting, the transition potential modeling was driven exclusively by spatially explicit, biophysical, and proximity-based variables rather than qualitative interview data. While the interview phase provided valuable regional insights, this sample size was deemed insufficient for the high-dimensional requirements of the land change model training process. The qualitative findings were instead reserved for the scenario-building phase, acting as a thematic guide for adjusting transition probabilities in future-oriented simulations, thereby balancing statistical reliability with stakeholder-informed context.
In the 2024 projection, each pixel was assigned to a land cover category based on modeled changes for that location. To evaluate the model’s accuracy, the predicted land use map was compared to the actual 2024 map using the Receiver Operating Characteristic (ROC) method [38]. ROC analysis measures how well the model distinguishes between change and no-change samples by calculating the proportion of correctly classified cases (true positives) and incorrectly classified cases (false positives) for different probability thresholds. The Area Under the Curve (AUC) condensed these results into a single metric, representing the overall discrimination ability. An AUC value of 1.0 signifies perfect classification, whereas a value of 0.5 reflects random guessing. In land change modeling, an AUC of 0.80 or above is generally regarded as satisfactory [39]. In addition, K-location was employed to assess the model’s spatial accuracy in distributing land-cover categories. Unlike some other metrics, which can be inflated by an accurate prediction of the total quantity of change, K-location isolates the model’s ability to correctly specify the spatial position of transitions. It measures the success of the model’s spatial rules in placing changed pixels in their correct geographical locations, making it a rigorous metric for evaluating the geographic performance of the MLP-Markov chain model against the effects of persistence.
2.3.2. Qualitative Interview Data Analysis
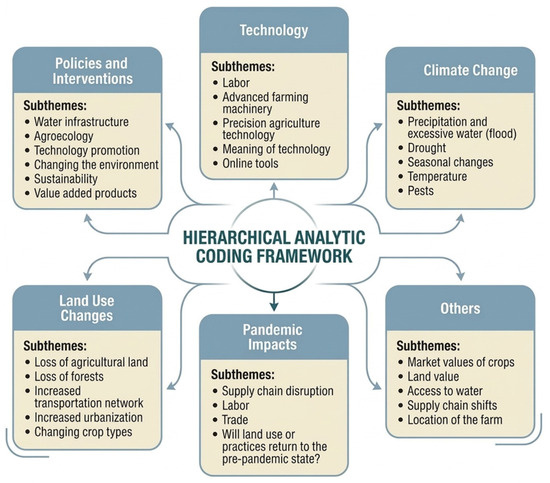
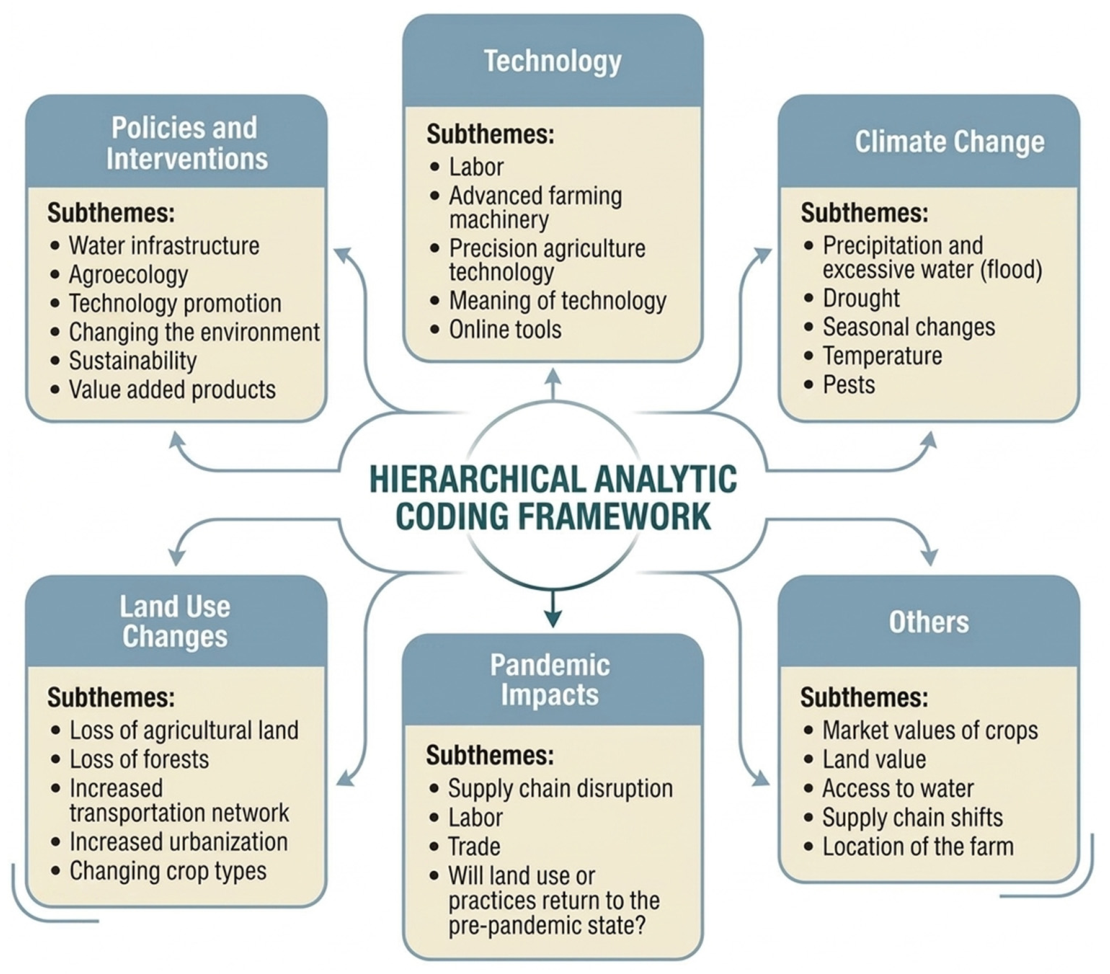
Audio recordings were transcribed, cleaned in two iterative rounds, and imported into the software NVivo 15 (Lumivero, Denver, CO, USA) for qualitative analysis. NVivo’s collaborative cloud environment enabled simultaneous organization, coding, and thematic development across the research team. A codebook was developed inductively—first informed by the relevant literature and then revised based on themes arising during interviews. All transcripts were independently coded by three team members in sequential rounds. Unanimous coding reinforced theme validity, while discrepancies prompted discussion, leading to refinement of interpretations and identification of additional themes. A hierarchical analytic coding framework was used, with parent codes representing broad thematic categories and child codes capturing specific subthemes (Figure 2). Descriptive codes were also used to document contextual details such as sector (civil society, government, and private), operational scale (international, national, provincial, regional, and district/local), crop type (durian, rice, mangosteen, multiple, and others), and year interviewed (2024 and 2025).
Figure 2.
A hierarchical analytic coding framework, with parent codes representing broad thematic categories and child codes capturing specific subthemes.
2.3.3. Incentives and Constraints for Future Land Use Scenario Simulation
In land change modeling, incentives and constraints are two sides of what shape how land is allocated and transformed over time [40]. Incentives are factors that encourage or motivate changes in land use, while constraints are factors that limit or restrict land use changes. In our study, the analysis for projecting land use patterns in 2030 incorporated a set of carefully selected incentives and constraints, which were identified through the structured interviews described in the previous section. The variables included (i) policies and interventions such as urbanization stimulus and water infrastructure development plans; (ii) technological factors like precision agriculture technology adoption and the availability of advanced farming machinery; (iii) climatic parameters such as mean annual temperature and precipitation variability; and (iv) demographic and socio-economic drivers such as population growth rate, median household income, and the average age of the labor force. These factors were chosen based on their frequent recurrence in the qualitative interview data, indicating their critical influence on future land use dynamics. Please refer to the Results and Discussion Section for more details about the findings of the qualitative analysis. Although demographic and socio-economic drivers were not explicitly addressed in the interviews, their critical importance for land use change modeling have been highlighted in the literature [41,42], and they were therefore incorporated into this study. Qualitative findings suggest that the COVID-19 pandemic acted as an accelerator for existing trends within agricultural communities, notably the increased adoption of heavy machinery, the transition to digital distribution channels (such as e-commerce), and enhanced participation in cooperatives to mitigate technology costs. These observations support the conceptualization of the pandemic as a diagnostic shock rather than a fundamental determinant of land use trajectories. Given the evidence that these impacts reinforced structural shifts rather than creating divergent long-term patterns, pandemic-specific variables were excluded from the formal scenario testing. A more detailed evaluation of these dynamics is provided in Section 3.2.
To assess the relative importance of each factor, a standardized weighting scale (0–3) was applied (Table 2), enabling systematic comparison across diverse domains of influence. Given the variation in development patterns and policies across the study area, factor weights were evaluated separately for each of the seven provinces analyzed. In TerrSet’s LCM module, a value of 0 represents an absolute constraint—no change is permitted. Values between 0 and 1 discourage change, a value of 1 indicates neutrality (i.e., neither incentive nor constraint), and values greater than 1 encourage change. To ensure transparency and reproducibility, we utilized a discretized step-function algorithm (also known as linear binning) for translating qualitative data into model weights. The assignment of weights was not based on subjective assessments, but rather on a frequency and intensity analysis of interview transcripts. This ensures that the qualitative ‘signal’ (consensus) is translated into a quantitative ‘impact’ (weight) in a way that is consistent across all seven provinces, providing a reproducible and objective algorithmic bridge between the interviews and the spatial simulation. To reconcile diverse or conflicting perspectives, we implemented a five-tiered consensus framework to weigh each driver: factors identified by a supermajority (>75%) were classified as significant constraints or incentives, while those mentioned by 51–75% were classified as high. Factors with 26–50% mentions were categorized as moderate, and those with <25% were categorized as low. This rubric provides a reproducible logic for aggregating diverse stakeholder views into the spatial model. In instances where factors were not mentioned or were explicitly cited as irrelevant to land use transitions, they were interpreted as providing no constraint or incentive.
Table 2.
Grading scales for factors of incentives and constraints and their interpretations.
2.3.4. Land Use Scenarios
Based on the analysis of key stakeholder interview data, we developed five future land use change scenarios to explore plausible “what-if” outcomes. Covering seven provinces, our study differs from prior work, which typically applied uniform weights for incentives and constraints across the entire area. Instead, we assigned weights for each province individually based on our interviews, accounting for the varying impacts of policies, technologies, and climate under the same scenario.
- (a)
- Business as usual
The baseline simulation assumes no additional incentives or constraints. Projections of future urbanization are based solely on observed drivers and land use transitions from 2017 to 2024. All grading scale values for incentives and constraints were set to 1 across all seven provinces.
- (b)
- Eastern Economic Corridor (EEC)-focused urban development
This scenario (Table 3) reflects the Thai government’s plan to prioritize urban development within the EEC over non-EEC regions [16]. Urban expansion is concentrated in the three EEC provinces (Chachoengsao, Rayong, and Chon Buri), while the remaining four provinces receive comparatively fewer resources, such as limited urbanization incentives and reduced investment in water infrastructure. Population growth and household income were expected to exert a stronger influence in the non-EEC provinces; however, our survey highlighted concerns about population stagnation or decline in these areas, particularly as younger residents tend to migrate toward the industrial and economic opportunities of the EEC, particularly after the COVID-19 pandemic. For Chanthaburi and Trat in particular, multiple stakeholders anticipated population decline to negatively affect future development. An aging farmer population further compounds this challenge by limiting local urban growth potential [43,44]. Lower weights were assigned to the driver—precision agriculture technology adoption in the non-EEC provinces, as stakeholders considered these areas more likely to adopt such technologies, thereby slowing the conversion of farmland to built-up areas. New water infrastructure can significantly promote urbanization as industrial investment has rapidly increased water demand. The non-EEC region will possibly lack the resources to build needed infrastructure, leading to the moderate loss of cropland. Finally, climate change was projected to negatively affect agricultural productivity, with higher temperatures and more severe droughts and flooding expected to accelerate shifts from agricultural land to urban land uses.
Table 3.
Weights of incentives and constraints for the scenario of Eastern Economic Corridor (EEC)-focused urban development.
- (c)
- Urban-focused development across all provinces
Unlike the EEC-focused scenario, this hypothetical scenario (Table 4) assumes a balanced distribution of urban expansion across all seven provinces. Resources and economic drivers (such as urbanization incentives) are allocated more evenly, encouraging simultaneous urban growth throughout Eastern Thailand. However, because resources are dispersed, the magnitude of impact in each province is relatively lower compared to the concentrated investment under the EEC-focused scenario. Given the existing policy priority and industrial base, the EEC provinces remain more attractive, with population growth and household income expected to exert a stronger positive influence on urban development, according to our interviews. The role of water infrastructure investment is uncertain. The interview data suggest that improvements in water infrastructure are likely to primarily benefit established industries in the EEC, while in the non-EEC provinces, water remains equally critical for both urban expansion and agricultural production. Climate change is expected to negatively affect agriculture, thereby incentivizing urbanization. However, this effect is likely to be moderated due to the presence of the Land Lease for Agriculture Act that incentivizes agricultural land use [4].
Table 4.
Weights of incentives and constraints for the scenario of urban-focused development across all provinces.
- (d)
- Climate change-driven land use change
This scenario (Table 5) isolates the impacts of climate change on urban development, highlighting how climate-related factors reshape the balance of incentives and constraints in land use decisions. Climate change directly affects three key drivers—climate variability, water infrastructure, and precision agriculture technology adoption. Increasing frequency of droughts and heavy rainfall events are expected to intensify agricultural losses, thereby incentivizing cropland conversion and urban expansion, with particularly strong impacts in non-EEC provinces. Investment in water infrastructure is unlikely to keep pace with climate shifts, further amplifying vulnerability. Interview data indicated that the agricultural sector is more immediately and severely affected, making it a potential driver of urbanization across the region. At the same time, precision agriculture technology adoption emerges as a critical countermeasure, especially in provinces where agriculture remains central to the economy. Under this scenario, there will be no urbanization stimulus, and the drivers of population growth and household income are expected to have less positive impact of land conversion to built-up areas as compared to the urban-focused scenario.
Table 5.
Weights of incentives and constraints for the scenario of climate change-driven land use change.
- (e)
- Sustainable land development
This scenario (Table 6) prioritizes the sustainable development of agriculture across all seven provinces while constraining urbanization. It aligns with conservation-oriented policies, the United Nations Sustainable Development Goals (SDGs), and Thai national sustainability strategies [45,46]. Under this scenario, improved water infrastructure is expected in the traditional agricultural provinces of Sa Kaeo, Prachin Buri, Chanthaburi, and Trat to support agricultural preservation and slow the pace of urban expansion. Policies aimed at attracting younger populations back to rural areas are anticipated to impose stronger constraints on urbanization in non-EEC provinces compared to EEC provinces. Similar patterns are expected in the adoption of precision agricultural technologies and in the implementation of urban stimulus (essentially growth control) policies, both of which would reinforce agricultural sustainability while constraining land conversion to built-up areas.
Table 6.
Weights of incentives and constraints for the scenario of sustainable land development.
3. Results and Discussion
In this section we provide details about the model performance, drivers and constraints considered in developing land use scenarios (including policies, technology, climate change and lasting pandemic impacts), and the results of each land use scenario developed based on those drivers and constraints.
3.1. Model Performance and Historical Land Use Changes
The achieved AUC of 85.9% indicates a high probability that the model correctly ranks change pixels with higher transition potentials than no-change pixels, exceeding the commonly recommended threshold of 80% for reliable certainty [39]. Our K-location of 0.82 further demonstrates that the model possesses a high spatial accuracy in identifying transition areas. By isolating the “Hits” (correctly predicted transitions) from “Correct Rejections” (predicted persistence), we confirmed that the model accurately captures the spatial logic of actual land-cover changes. This multi-metric validation ensures that the results are not merely a reflection of the dominant stable landscape, but a precise identification of transition-prone areas.
Comparisons between the actual and predicted 2024 maps revealed relatively large discrepancies for flooded vegetation (30.8%) and rangeland (18.3%). Similar difficulties have been documented in prior studies, often attributed to seasonal variability, mixed spectral signals, and the transitional nature of these land cover types [47,48]. However, these categories were retained to ensure a comprehensive representation of the ecological landscape, and their limited spatial extent (4.1%) ensures that the primary findings regarding cropland-to-urban conversion remain statistically robust. In contrast, other land use categories showed differences below 10%, including water (7.7%), trees (1.7%), bare ground (5.0%), crops (2.2%), and built-up areas (7.5%). Crops, built-up areas, and trees remained the dominant land use categories, occupying 37.1%, 14.6%, and 28.8% of the study area, respectively.
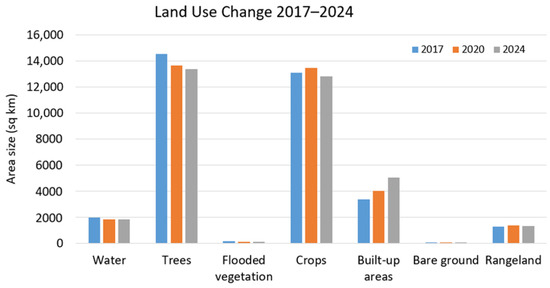
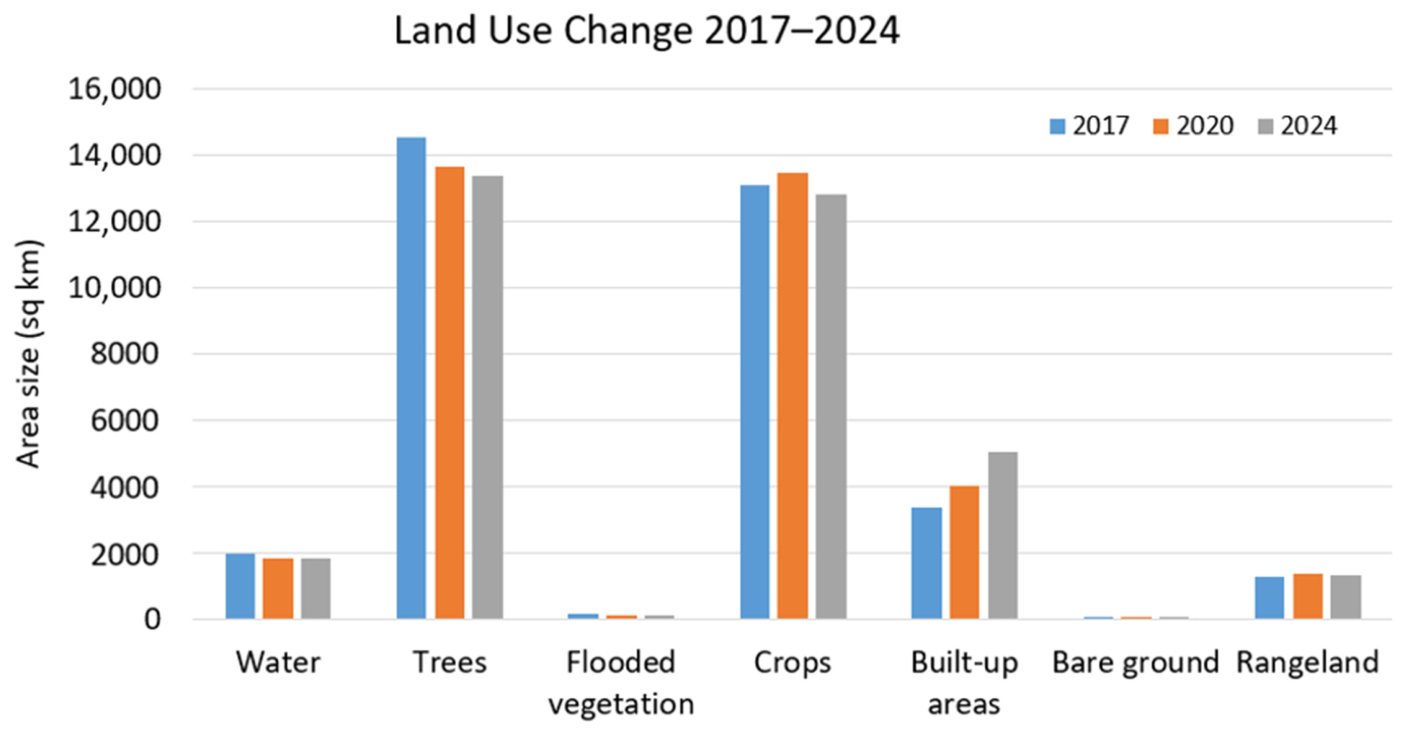
Temporal comparisons of land use categories (Figure 3) revealed a consistent decline in both trees and water, with tree cover decreasing from 14,537 km2 in 2017 to 13,389 km2 in 2024. In contrast, built-up areas expanded steadily from 3384 km2 in 2017 to 5033 km2 in 2024, representing a rapid annual growth rate of 5.9%. Crops and rangeland fluctuated over the study period. While their rates of change were comparatively modest relative to the pronounced expansion of built-up areas, they did show a decrease more recently.
Figure 3.
Comparison of land use area by category within the study area for the years 2017, 2020, and 2024.
3.2. Major Incentives and Constraints Driving Future Land Use Scenarios
3.2.1. Policies and Interventions
Government policies and farmer-led interventions will play a critical role in steering future land use and land cover patterns. Revenue guarantee programs and trade policies can incentivize investment in long-term, high-value crops, influencing spatial distribution of land allocation. Capacity-building initiatives, such as the Young Smart Farmers program, equip farmers with technical, marketing, and digital skills, promoting the cultivation of high-value crops, value-added products and supporting participation in online marketplaces. Farmer-led strategies, including investment in irrigation infrastructure will enable intensive cropping in well-resourced areas, while resource-poor regions may transition to low-input or diversified cropping systems. Changing international regulations related to sustainability (such as the EU Deforestation Free policies) were also noted by interviewees as important for changing their practices as they will need to show that they are abiding with those policies in order to participate in international trade.
Meanwhile, the Thai government’s urbanization policies in Eastern Thailand are primarily centered around the EEC, aiming to stimulate economic development and help the country escape from the middle-income trap by providing investment incentives for the private sector and developing infrastructure, including land, rail, water, and air transportation. Additionally, the Thai government has implemented the Infrastructure and Public Utilities Action Plan in the Eastern Special Development Zone 2023–2027, which includes 77 projects aimed at upgrading the transport network and connecting the EEC area seamlessly with all systems [49]. Hence, coastal areas have become more urbanized than inland regions, posing a threat to Thailand’s agricultural heritage and contributing to the future decline of farmland.
3.2.2. Technology
Technology adoption is expected to further shape future land cover patterns by enabling farmers to intensify production where resources allow and adopt resilient strategies where challenges exist. Digital platforms for marketing and communication reduce reliance on local markets, allowing high-value crops to be cultivated in previously underutilized areas and improving assessment of global market trends. The reliance on digital platforms increased during the COVID-19 pandemic and is expected to continue. An agricultural economist interviewed in 2025 explained that this represents a structural shift for agricultural communities (and society more broadly): “I think it’s also a kind of structural shift. For me, before the pandemic, our company never worked from home and now we work from home three days per week or something like that. It has not returned back to the pre-pandemic levels. That’s why I think the adaptation happened during the pandemic so we also continue that for the farmers.” Farm management tools, such as pest identification apps, weather sensors, and irrigation monitoring systems, allow farmers to sustain sensitive crops like durian even under climate stress. These tools also support farmers pursuing non-farm incomes as a key stakeholder from a local department of agriculture explained: “More farmers want to be Smart Farmers, like the Young Smart Farmer group that we met yesterday, they came to use automatic sensing systems for watering and to measure the conditions of the soil such as the moisture. If they have other business they don’t have to worry about things that work on the farm. So, it seems they can have an automatic system.” Areas lacking access to these technologies may shift toward low-risk, drought-tolerant crops, or even non-crop lands. Precision agriculture and forecasting tools optimize water use and inputs, concentrating intensive cultivation in technologically equipped regions and limiting expansion in resource-poor areas. In this way, technology acts as both an enabler of high-value, climate-sensitive cropping and a determinant of spatial differentiation in land cover across the region. Beyond technical specifications, the adoption of these technologies relies on social innovation to align new products with public expectations. By addressing social barriers and fostering community-led implementation, the transition toward advanced agricultural models can become more resilient and widely supported.
3.2.3. Climate Change
Climate variability and extreme events are expected to exert a growing influence on land cover in Eastern Thailand. Flood-prone lowlands may become unsuitable for sensitive crops due to waterlogging and root damage, potentially leading to crop abandonment, conversion to flood-tolerant species, or fallowing. Droughts and water scarcity will continue to constrain the expansion of water-intensive crops such as rice and durian. Areas with better access to irrigation or water-saving technologies may see a concentration of these high-value crops, whereas regions lacking resources may shift toward drought-tolerant species, diversified cropping systems or urban regions. Seasonal unpredictability will further affect planting and harvest schedules, potentially reducing cropping intensity and encouraging more diversified land use. Farmers are seeking adaptations to shifting conditions but are limited by environmental constraints. A key stakeholder from a trade association described these challenges: “So, the farmers have awareness about climate change and are trying to learn and share their adaptations with agricultural processes and learn about the new weather each day, each year. But the plants are not learning, that is why the farmers are trying to control the weather in the same year by giving the same water and humidity to the plants. But these days if they have a drought problem, they bring water to the plants because it catalyzes the plants to give flowers and products. They try to learn more about innovation and knowledge for adaptation in agriculture.” Climate pressures are likely to produce heterogeneous land cover patterns, concentrating intensive cultivation in areas with adaptive capacity while promoting resilient, low-input cropping or the change of land use type in vulnerable zones. To address the challenges posed by climate change, it is essential to integrate Climate-Smart Agriculture (CSA) into regional land use planning. By utilizing precision farming and data-driven crop management, the region can improve climate resilience while minimizing the environmental footprint of agricultural activities.
3.2.4. Pandemic-Related Drivers
The COVID-19 pandemic highlighted labor, market, and export vulnerabilities. Limited availability of migrant labor from Myanmar, Cambodia, and Laos [50], combined with competition from service and retail sectors, may make labor-intensive crops less attractive. Rising wage expectations and labor shortages could drive farmers to shift land toward crops that require less labor or offer higher returns per unit of effort. At the same time, the rapid adoption of online marketplaces reduced dependence on physical markets and middlemen, enabling cultivation of high-value, export-oriented crops in areas not traditionally favored for such production. These dynamics suggest that high-value crops may become concentrated in areas with reliable labor, market access, and favorable land conditions, while marginal or labor-intensive land may transition toward lower-maintenance cropping systems. Our interviews suggest that while there was broad recognition that the pandemic accelerated pre-existing agricultural trends, grouping all crop types under a single “crops” category led many policymakers and stakeholders to view the pandemic as having little lasting impact on future land use policy. Consequently, pandemic-related drivers were excluded from the scenario testing in this study which focuses on the enduring structural shifts that the pandemic brought to light. Although pandemic-related variables could be modeled as low-weight factors, qualitative stakeholder data revealed that these adaptations were primarily operational rather than structural in nature. Furthermore, spatiotemporal analyses confirmed that urban expansion remained predominantly aligned with long-term policy drivers throughout the crisis. Consequently, this study prioritized variables with sustained transformative power to ensure model parsimony and maintain a focus on long-term regional sustainability.
3.3. Comparisons of Future Land Use Scenarios
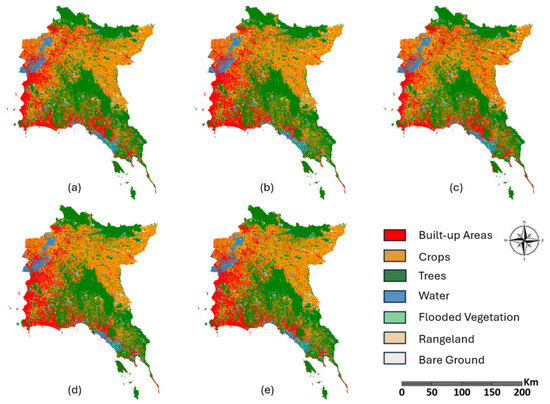
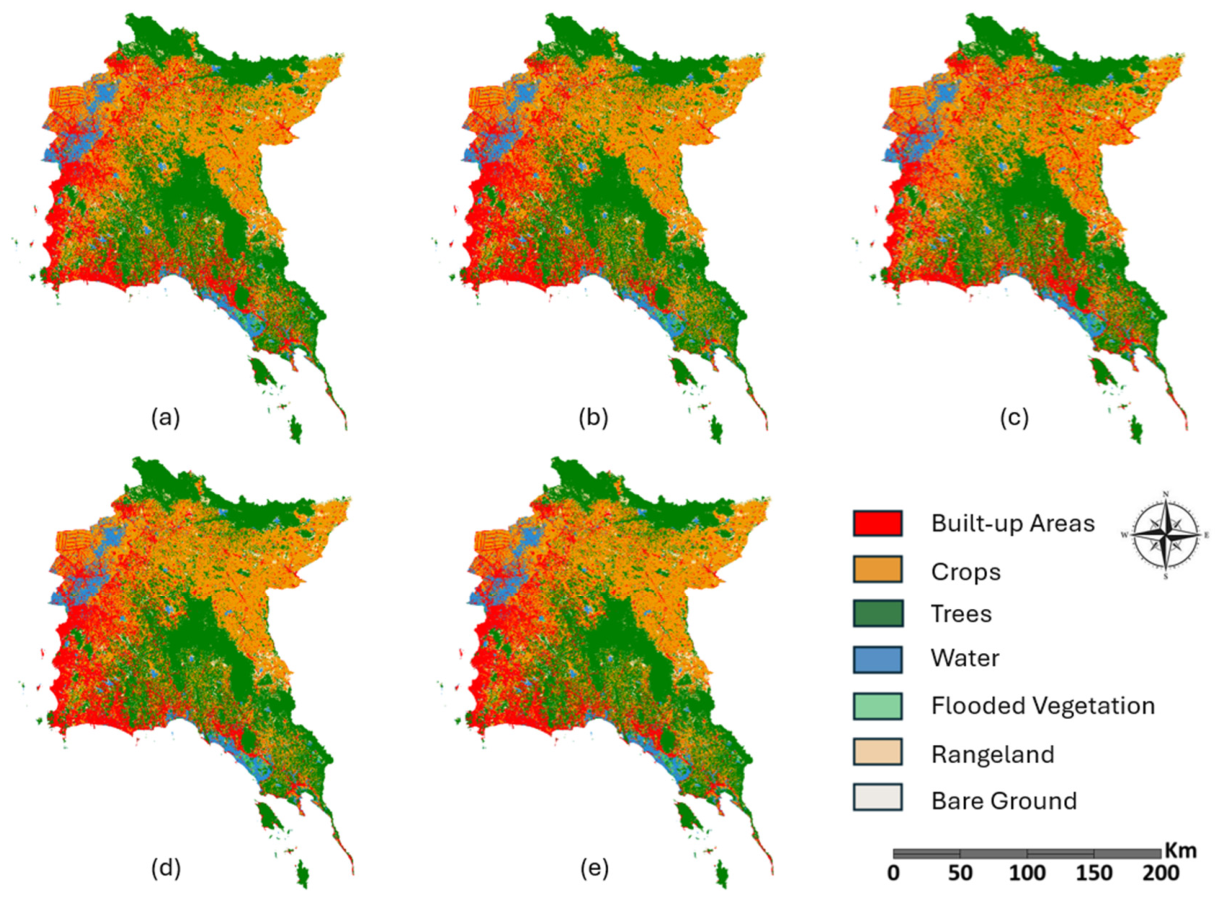
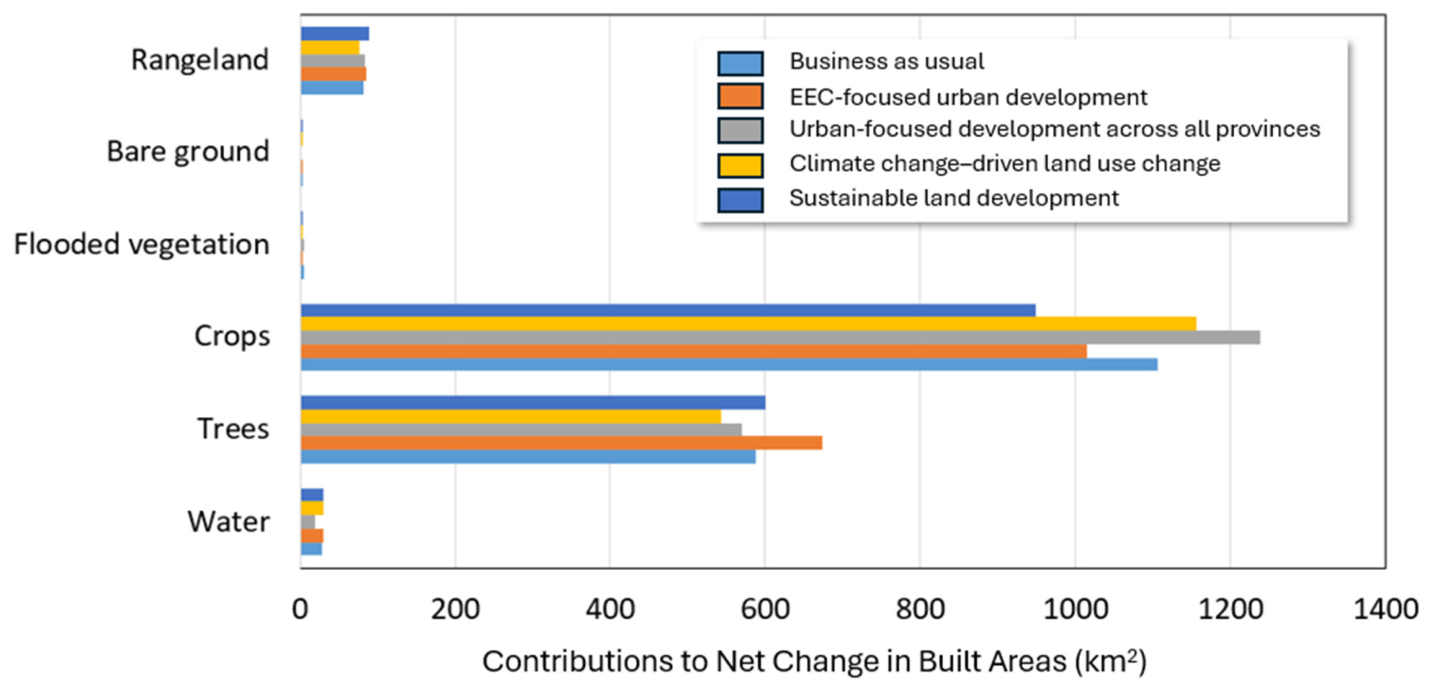
For all scenarios, we observed a noticeable increase in urban built-up areas compared to any of the three historical land use maps (Figure 4). While variation existed across the five scenarios, the average annual urbanization rate was 5.3%, similar to the pace observed since 2017. Crops and trees were the primary sources of land for urban expansion. Across all scenarios, nearly 60% of newly added urban land came from the loss of crops, followed by the loss of natural forests (Figure 5). While tree cover historically experienced a larger decline than cropland on average, our 2030 projections suggest a transition in the primary source of urban expansion and that the loss of crops will be significantly higher than that of trees (p < 0.05) across all tested scenarios. As natural forest areas become increasingly protected or spatially exhausted, the model predicts that the ‘next wave’ of urbanization will primarily displace agricultural land. We would like to highlight that recent historical trends already support this projection. Comparing 2020 to 2024 data, cropland loss has already surpassed tree cover loss (663 sq km vs. 265 sq km). This indicates that the transition from ecological to agricultural displacement is already underway. More particularly, much of Thailand’s agriculture, particularly rice paddies, orchards, and vegetable farms, is located in peri-urban areas around Bangkok and other regional cities. As urban areas expand, farmland is often the first to be converted into residential, commercial, or industrial land [51]. Agricultural land near urban centers experiences rapid increases in market value due to demand for housing and infrastructure, prompting many farmers to sell their land as economic returns from urban development exceed those from crops [52]. Urban expansion also fragments farmland into smaller parcels, reducing efficiency and economies of scale, which further discourages continued farming [53]. Additionally, competition for water resources, especially in central Thailand where irrigation is critical, along with pollution and land degradation from urban activities, decreases agricultural sustainability [3]. Finally, migration of younger generations to cities reduces the available agricultural workforce, accelerating the decline of farming in expanding urban areas [54]. In Eastern Thailand, the loss of natural forests to urbanization is generally lower than that of croplands. This is largely because forests are often located in protected areas, mountainous regions, or otherwise less accessible terrain, whereas croplands are concentrated in lowland and peri-urban areas adjacent to expanding cities [51]. Legal protections for forested lands, including forest reserves and conservation regulations, further limit their conversion, while privately owned croplands face fewer restrictions and are more easily sold for development [52]. Urban expansion also tends to follow existing road networks and flat terrain, overlapping primarily with agricultural areas rather than forested regions. Additionally, forests are contiguous and less accessible, reducing the likelihood of conversion [3].
Figure 4.
The 2030 potential land use maps for five simulated scenarios: (a) business as usual, (b) Eastern Economic Corridor (EEC)-focused urban development, (c) urban-focused development across all provinces, (d) climate change-driven land use change, and (e) sustainable land development.
Figure 5.
Contributions of different land use categories to the net change in urban expansion from 2024 to 2030 under the five simulated scenarios.
When comparing the five scenarios, croplands experienced the greatest loss to urbanization under the scenario of urban-focused development across all provinces, followed by the climate change-driven and business-as-usual scenarios. As expected, the sustainable land use scenario resulted in the lowest agricultural loss. Interestingly, the EEC-focused urban development scenario also performed relatively well, protecting cropland more effectively than all scenarios except sustainable land use. The EEC was designed to concentrate industrial and urban development within targeted areas of the eastern provinces, including Chon Buri, Rayong, and Chachoengsao. By directing urban expansion and infrastructure investment into this designated zone, the EEC can relieve development pressure on croplands in the broader eastern region [16]. Our results indicate that this approach helps preserve agricultural land outside the corridor in agriculturally focused provinces such as Chanthaburi, by reducing incentives for peri-urban cropland conversion. In addition, EEC regulations and infrastructure planning are likely to encourage higher-density urban development rather than horizontal sprawl, further limiting encroachment into surrounding farmland.
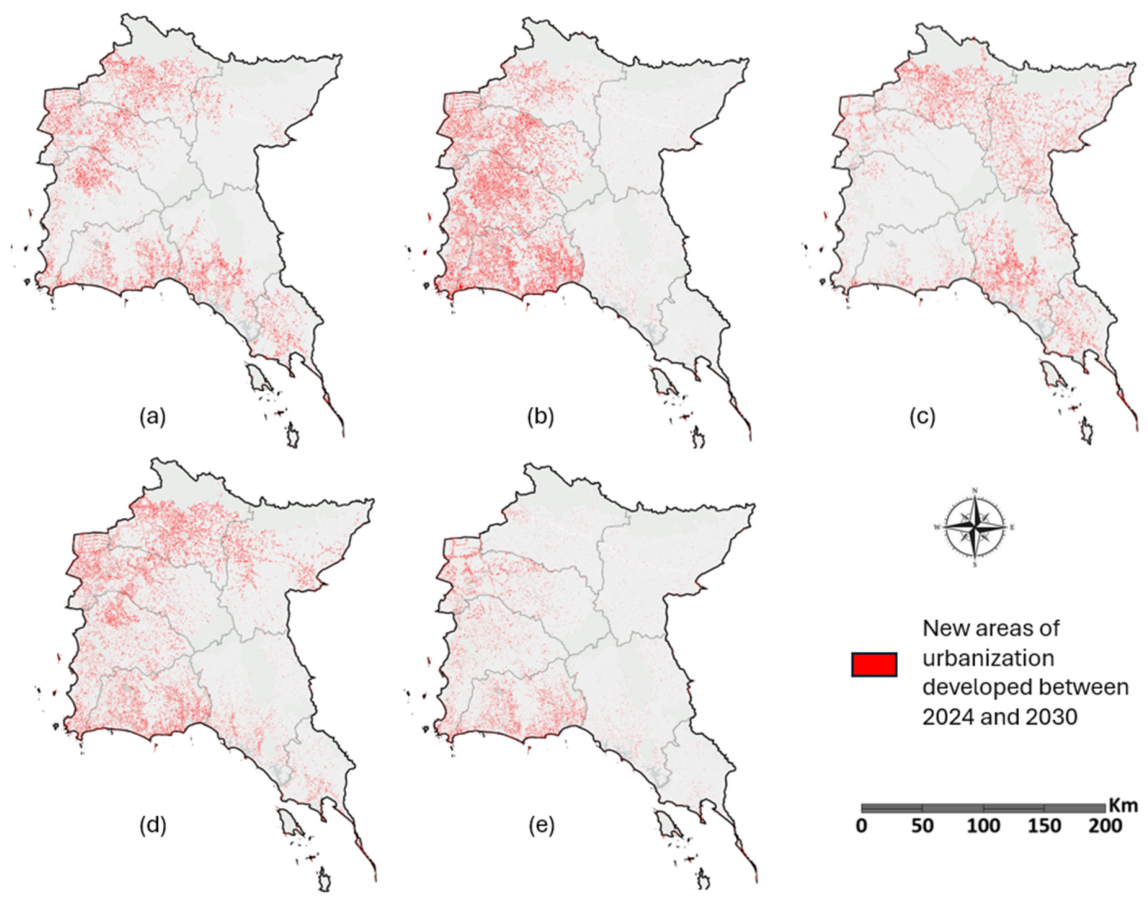
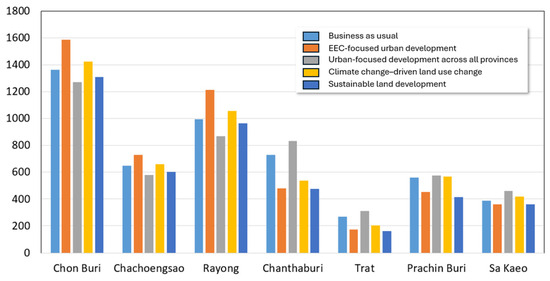
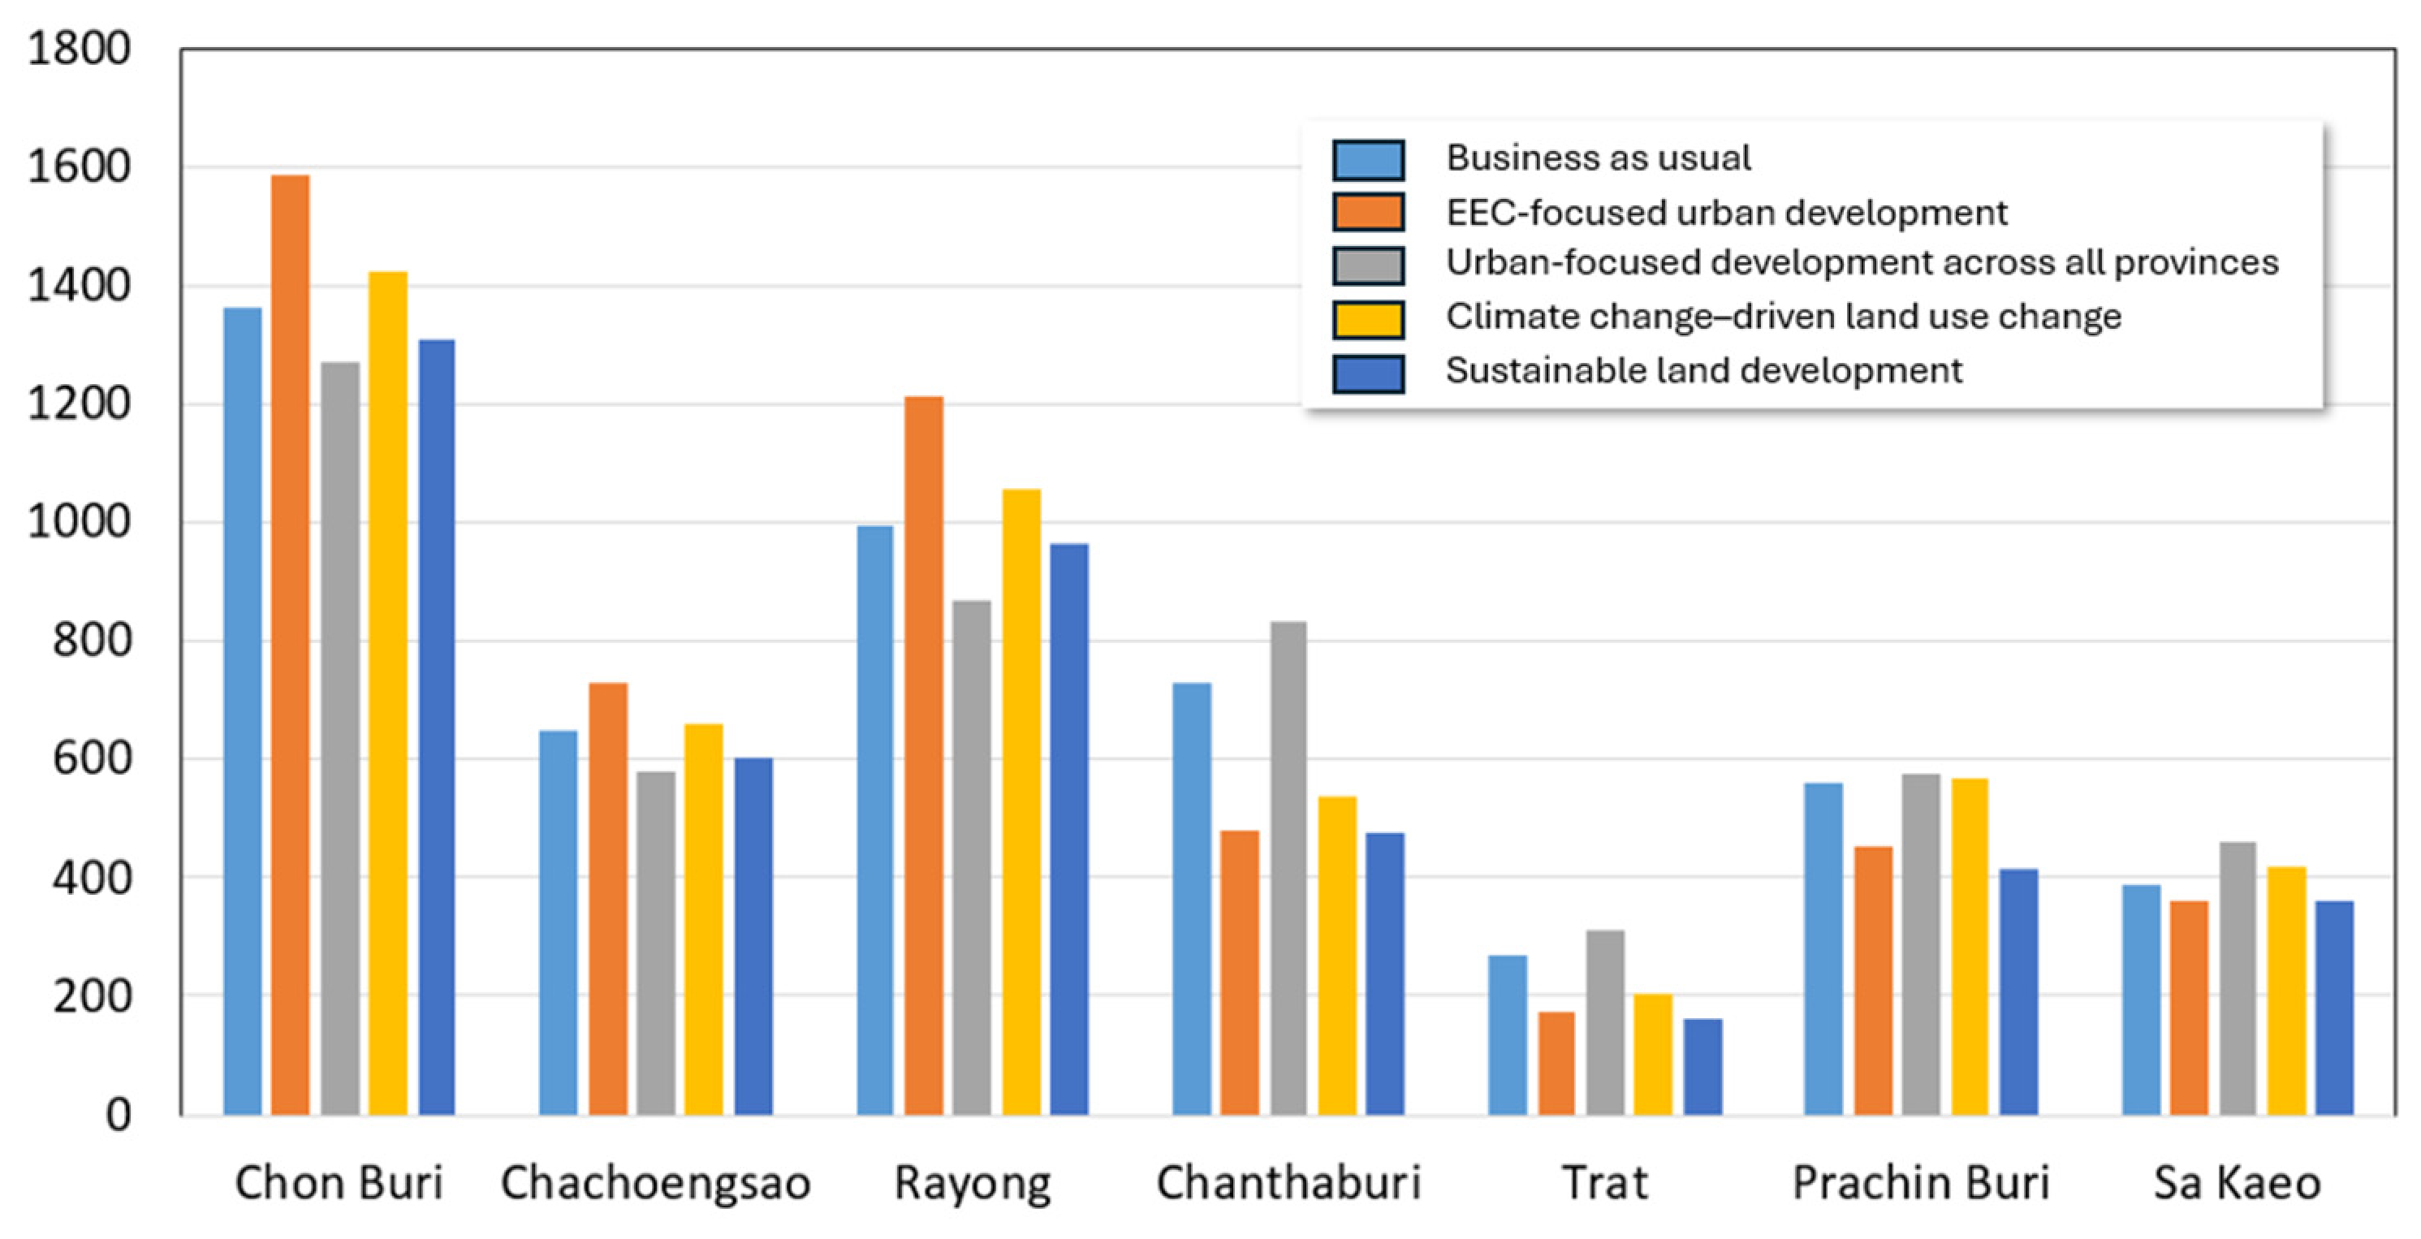
The simulated urban expansion from 2024 to 2030 revealed markedly different spatial patterns across the seven provinces (Figure 6 and Figure 7). As noted earlier, the EEC-focused development scenario helped to protect non-EEC regions from substantial agricultural-to-urban conversion. In contrast, under the scenario promoting urban development across all provinces, new urbanization was most prominent in the non-EEC provinces, resulting in the greatest loss of croplands among all scenarios. We acknowledge that the weights of incentives were derived from interviews, which may introduce subjectivity and bias towards the underdeveloped non-EEC regions. Nevertheless, the results highlight the potential for significant urban development in provinces that are currently agriculture focused. In the remaining scenarios, whether assuming no policy changes (business as usual), emphasizing climate change impacts, or prioritizing conservation, new urban land was projected to follow the spatial patterns established under current urbanization policies that prioritize the EEC. This growth is expected to concentrate primarily in the western provinces adjacent to Bangkok and in the southern coastal areas, particularly around the city of Pattaya, Chon Buri and the city of Rayong, Rayong.
Figure 6.
Spatial distribution of urban expansion (new built-up areas) from 2024 to 2030 under five simulated scenarios: (a) business as usual, (b) Eastern Economic Corridor (EEC)-focused urban development, (c) urban-focused development across all provinces, (d) climate change-driven land use change, and (e) sustainable land development.
Figure 7.
Increase in built-up areas across the seven provinces from 2024 to 2030 under five simulated scenarios.
While the encroachment of urban expansion onto cropland, rather than forest, aligns with regional topographic constraints and forest protection mandates, this study provides a critical spatially explicit quantification of these dynamics. By integrating slope, elevation, and proximities as baseline geographic controls within the MLP-Markov model, we isolated the socio-economic drivers of expansion from physical limitations. The results move beyond the ‘self-evident’ by revealing the acceleration rates of cropland loss and identifying specific vulnerable corridors that face the highest risk of conversion by 2030. These findings provide a necessary empirical bridge between general geographic assumptions and the precise spatial targeting required for sub-national land use policy. In alignment with Thailand’s commitments as an IPBES (Intergovernmental Science-Policy Platform on Biodiversity and Ecosystem Services) signatory since 2012, such targeting facilitates the harmonization of regional development with biodiversity conservation and the protection of essential ecosystem services.
4. Conclusions
This study evaluates future land use change scenarios in Eastern Thailand to determine the extent to which emerging socio-political and environmental drivers, such as policy shifts, labor dynamics, and extreme climate events, disrupt the spatiotemporal continuity of urban expansion. Using a mixed-methods approach, it combined qualitative interviews with quantitative land change modeling to simulate plausible futures. Structured stakeholder interviews highlighted policy decisions, climate change, and technological advancements as key drivers, while the pandemic was generally not expected to exert lasting influence on land use. We also found that urban expansion is projected to continue, particularly in areas bordering Bangkok and along cities in the southern coast, such as Pattaya and Rayong. This expansion is expected to drive substantial cropland loss, more so than forest decline. While policies supporting urbanization and infrastructure development within the EEC may ease pressure on agricultural lands outside the region, urban growth is likely to persist following the existing spatial patterns under most future scenarios, including those shaped by climate change and sustainability goals. To ensure regional resilience and sustainability, we propose a differentiated policy framework tailored to the specific spatial trajectories identified in our scenarios. For the industrial-urban growth zones, like Chon Buri and Rayong, planning authorities should move away from horizontal expansion toward compact city models. Implementing industrial buffer zones is essential to prevent the encroachment of infrastructure on adjacent fertile lands, ensuring that the EEC’s economic growth does not come at the cost of regional food security. For high-value horticultural hubs, such as Chanthaburi and Trat, the establishment of permanent agricultural preserves can be supported by subsidies for CSA to enhance productivity and incentivize farmers to resist land conversion pressures from the service and industrial sectors.
Author Contributions
Conceptualization, G.C., C.H., S.A. and N.T.; methodology, G.C., S.A., N.T., J.W., R.C., C.L.J., E.A., K.R., N.S., K.P. and S.S.; formal analysis, G.C., J.W., R.C., C.L.J., E.A., K.R. and N.S.; investigation, G.C., J.W., R.C., C.L.J., E.A., K.R., N.S., K.P. and S.S.; resources, G.C., C.H., S.A. and N.T.; data curation, G.C., J.W., R.C., C.L.J., E.A., K.R. and N.S.; writing—original draft preparation, G.C., J.W., R.C., C.L.J., E.A., K.R. and N.S.; writing—review and editing, G.C., C.H., S.A., N.T., J.W., R.C., C.L.J., E.A., K.R., N.S., K.P. and S.S.; supervision, G.C.; project administration, G.C. and C.H.; funding acquisition, G.C., C.H., S.A. and N.T. All authors have read and agreed to the published version of the manuscript.
Funding
This research was funded by the U.S. National Science Foundation, grant number 2153579; the National Research Council of Thailand, grant number N42A680811; and the Social Innovation Hub, Chulalongkorn University, through the project “Navigating the Landscape of Social Inclusivity in Thailand”.
Institutional Review Board Statement
The study protocols were approved by the Institutional Review Board of the University of North Carolina at Charlotte (protocol number: IRB-22-1037). All research was performed in accordance with relevant institutional and government guidelines and regulations. Informed consent was obtained from all participants involved in the study.
Informed Consent Statement
Informed consent was obtained from all subjects involved in the study.
Data Availability Statement
Historical land use maps and ancillary data are openly available from their respective data providers. Qualitative interview data is available from the corresponding author upon reasonable request. Access may be subject to institutional and data protection policies.
Acknowledgments
The authors would like to thank numerous contributors who provided vital field and technical support, including Prasit Deewatthanawong, Witsanu Attavanich, Joseph Hoff, Xiaoxia Newton, Cuizhen Wang, Penelope Karagounis, Noot Sittitoon, Kaittisak Kumse, Aphaporn Changthom and Rujira Deewatthanawong.
Conflicts of Interest
The authors declare no conflicts of interest.
References
- Minh, P.H.; Arbiol, J.; Orencio, P. Cultivating Security: Sustainable Agriculture in ASEAN. Available online: https://theaseanmagazine.asean.org/article/cultivating-security-sustainable-agriculture-in-asean (accessed on 6 April 2026).
- FAO (Food and Agriculture Organization of the United Nations). Scaling up Climate Ambition on Land Use and Agriculture Through Nationally Determined Contributions and National Adaptation Plans (SCALA). Available online: https://www.fao.org/in-action/scala/countries/thailand/en (accessed on 6 April 2026).
- Wang, Y.; Hu, Y.; Niu, X.; Yan, H.; Zhen, L. Land use/cover change and its driving mechanism in Thailand from 2000 to 2020. Land 2022, 11, 2253. [Google Scholar] [CrossRef] [Scilit]
- Thai Government. Land Lease for Agriculture Act (No. 2) B.E. 2559. Available online: https://data.opendevelopmentmekong.net/en/laws_record/land-lease-for-agriculture-act-no-2-b-e-2559-2016 (accessed on 6 April 2026).
- Asian Development Bank. Recovering and Reimagining Our Cities. Available online: https://www.adb.org/multimedia/partnership-report2021/strategy-2030/recovering-and-re-imagining-our-cities/ (accessed on 6 April 2026).
- Hammelman, C.; Chen, G.; Tontisirin, N.; Anantsuksomsri, S.; Moore, F.; Ly, S.; Birla, S.; Archambault, Z.; Fleming, E.; Gwanfogbe, J.; et al. The COVID-19 Pandemic’s lasting consequences for tropical crop cultivation in Eastern Thailand. Appl. Geogr. 2025, 179, 103636. [Google Scholar] [CrossRef] [Scilit]
- Tansuchat, R.; Suriyankietkaew, S.; Petison, P.; Punjaisri, K.; Nisei, S. Impacts of COVID-19 on sustainable agriculture value chain development in Thailand and ASEAN. Sustainability 2022, 14, 12985. [Google Scholar] [CrossRef] [Scilit]
- Chen, G.; Hammelman, C.; Anantsuksomsri, S.; Tontisirin, N.; Todd, A.R.; Hicks, W.W.; Robinson, H.M.; Calloway, M.G.; Bell, G.M.; Kinsey, J.E., III. Fine-Scale (10 m) Dynamics of Smallholder Farming Through COVID-19 in Eastern Thailand. Remote Sens. 2024, 16, 1035. [Google Scholar] [CrossRef] [Scilit]
- Muttitanon, W.; Tripathi, N.K. Land use/land cover changes in the coastal zone of Ban Don Bay, Thailand using Landsat 5 TM data. Int. J. Remote Sens. 2005, 26, 2311–2323. [Google Scholar] [CrossRef] [Scilit]
- Arunyawat, S.; Shrestha, R.P. Assessing land use change and its impact on ecosystem services in Northern Thailand. Sustainability 2016, 8, 768. [Google Scholar] [CrossRef] [Scilit]
- Khamchiangta, D.; Dhakal, S. Time series analysis of land use and land cover changes related to urban heat island intensity: Case of Bangkok Metropolitan Area in Thailand. J. Urban Manag. 2020, 9, 383–395. [Google Scholar] [CrossRef] [Scilit]
- Thien, B.B.; Phuong, V.T.; Huong, D.T. Detection and assessment of the spatio-temporal land use/cover change in the Thai Binh province of Vietnam’s Red River delta using remote sensing and GIS. Model. Earth Syst. Environ. 2023, 9, 2711–2722. [Google Scholar] [CrossRef] [Scilit]
- Liu, J.; Hu, Y.; Feng, Z.; Xiao, C. A Review of Land Use and Land Cover in Mainland Southeast Asia over Three Decades (1990–2023). Land 2025, 14, 828. [Google Scholar] [CrossRef] [Scilit]
- Walsh, S.J.; Entwisle, B.; Rindfuss, R.R.; Page, P.H. Spatial simulation modelling of land use/land cover change scenarios in northeastern Thailand: A cellular automata approach. J. Land Use Sci. 2006, 1, 5–28. [Google Scholar] [CrossRef] [Scilit]
- Fox, J.; Vogler, J.B.; Sen, O.L.; Giambelluca, T.W.; Ziegler, A.D. Simulating land-cover change in montane mainland Southeast Asia. Environ. Manag. 2012, 49, 968–979. [Google Scholar] [CrossRef] [Scilit] [PubMed]
- Tontisirin, N.; Anantsuksomsri, S. Economic development policies and land use changes in thailand: From the eastern seaboard to the eastern economic corridor. Sustainability 2021, 13, 6153. [Google Scholar] [CrossRef] [Scilit]
- Siegel, K.; Perez, A.F.; Kinnebrew, E.; Mills-Novoa, M.; Ochoa, J.; Shoffner, E. Integration of qualitative and quantitative methods for land-use-change modeling in a deforestation frontier. Conserv. Biol. 2022, 36, e13924. [Google Scholar] [CrossRef] [Scilit]
- Saqib, S.E.; Kaleem, M.; Yaseen, M.; Yang, S.; Visetnoi, S. Land Use Policy From green fields to housing societies: Unraveling the mysteries behind agricultural land conversion in Pakistan. Land Use Policy 2024, 144, 107256. [Google Scholar] [CrossRef] [Scilit]
- Alcamo, J. The SAS Approach: Combining Qualitative and Quantitative Scenarios. In Environmental Futures: The Practice of Environmental Scenario Analysis; Elsevier: Amsterdam, The Netherlands, 2008; pp. 123–150. [Google Scholar]
- Mallampalli, V.R.; Mavrommati, G.; Thompson, J.; Duveneck, M.; Meyer, S.; Ligmann-Zielinska, A.; Druschke, C.G.; Hychka, K.; Kenney, M.A.; Kok, K.; et al. Methods for translating narrative scenarios into quantitative assessments of land use change. Environ. Model. Softw. 2016, 82, 7–20. [Google Scholar] [CrossRef] [Scilit]
- Thai National Statistical Office. Important Statistics and Indicators. Available online: https://www.nso.go.th/nsoweb/nso/statistics_and_indicators?set_lang=en (accessed on 6 April 2026).
- The Government Public Relations Department, Thailand. The Seasons of Thailand. Available online: https://thailand.go.th/issue-focus-detail/009_142 (accessed on 25 April 2026).
- Asian Development Bank. Climate Risk Country Profile—Thailand. Available online: https://www.adb.org/sites/default/files/publication/722251/climate-risk-country-profile-thailand.pdf (accessed on 6 April 2026).
- Thai National Statistical Office. Statistical Yearbook Thailand. Available online: https://www.nso.go.th/public/e-book/Statistical-Yearbook/SYB-2024/6/ (accessed on 6 April 2026).
- Royal Thai Embassy. Eastern Economic Corridor (EEC). Available online: https://washingtondc.thaiembassy.org/en/page/eastern-economic-corridor-eec?menu=641d81544b5b821b825ac133 (accessed on 6 April 2026).
- Karra, K.; Kontgis, C.; Statman-Weil, Z.; Mazzariello, J.C.; Mathis, M.; Brumby, S.P. Global land use/land cover with Sentinel 2 and deep learning. In Proceedings of the 2021 IEEE International Geoscience and Remote Sensing Symposium IGARSS, Brussels, Belgium, 11–16 July 2021; pp. 4704–4707. [Google Scholar]
- Jansuwan, P.; Zander, K.K. Getting Young People to Farm: How Effective Is Thailand’s Young Smart Farmer Programme? Sustainability 2021, 13, 11611. [Google Scholar] [CrossRef] [Scilit]
- Hay, I.; Cope, M. Interviewing. In Qualitative Research Methods in Human Geography, 5th ed.; Hay, I., Cope, M., Eds.; Oxford University Press: Oxford, UK, 2021; pp. 287–309. [Google Scholar]
- ASTER Science Team. ASTER Global Digital Elevation Model V003. Available online: https://www.earthdata.nasa.gov/data/catalog/lpcloud-astgtm-003 (accessed on 6 April 2026). [CrossRef]
- HDE (Humanitarian Data Exchange). Thailand Roads (OpenStreetMap Export). Available online: https://data.humdata.org/dataset/hotosm_tha_roads (accessed on 6 April 2026).
- Clark University. TerrSet. Available online: https://www.clarku.edu/centers/geospatial-analytics/terrset (accessed on 6 April 2026).
- Anand, J.; Gosain, A.K.; Khosa, R. Prediction of land use changes based on Land Change Modeler and attribution of changes in the water balance of Ganga basin to land use change using the SWAT model. Sci. Total Environ. 2018, 644, 503–519. [Google Scholar] [CrossRef] [Scilit]
- Abbasnezhad, B.; Abrams, J.B.; Hepinstall-Cymerman, J. Incorporating social and policy drivers into land-use and land-cover projection. Sustainability 2023, 15, 14270. [Google Scholar] [CrossRef] [Scilit]
- Gharaibeh, A.; Shaamala, A.; Obeidat, R.; Al-Kofahi, S. Improving land-use change modeling by integrating ANN with Cellular Automata-Markov Chain model. Heliyon 2020, 6, e05092. [Google Scholar] [CrossRef] [Scilit] [PubMed]
- Thepprasit, C.; Sukrakanchana, B.; Sa-nguanduan, N. Assessing Water Use Efficiency and Stress in Thailand’s River Basins: Trends, Challenges, and Policy Strategies. Sustainability 2025, 17, 4477. [Google Scholar] [CrossRef] [Scilit]
- Muttitanon, W.; Mishra, V.N.; Rai, P.K. A remote sensing aided multi-layer perceptron-Markov chain analysis for land use and land cover change prediction in Patna district (Bihar), India. Arab. J. Geosci. 2016, 9, 249. [Google Scholar]
- Sankarrao, L.; Ghose, D.K.; Rathinsamy, M. Predicting land-use change: Intercomparison of different hybrid machine learning models. Environ. Model. Softw. 2021, 145, 105207. [Google Scholar] [CrossRef] [Scilit]
- Thompson, M.L.; Zucchini, W. On the statistical analysis of ROC curves. Stat. Med. 1989, 8, 1277–1290. [Google Scholar] [CrossRef] [Scilit]
- Talukdar, S.; Eibek, K.U.; Akhter, S.; Ziaul, S.K.; Islam, A.R.M.T.; Mallick, J. Modeling fragmentation probability of land-use and land-cover using the bagging, random forest and random subspace in the Teesta River Basin, Bangladesh. Ecol. Indic. 2021, 126, 107612. [Google Scholar] [CrossRef] [Scilit]
- Bryan, B.A. Incentives, land use, and ecosystem services: Synthesizing complex linkages. Environ. Sci. Policy 2013, 27, 124–134. [Google Scholar] [CrossRef] [Scilit]
- Verburg, P.H.; Schot, P.P.; Dijst, M.J.; Veldkamp, A. Land use change modelling: Current practice and research priorities. GeoJournal 2004, 61, 309–324. [Google Scholar] [CrossRef] [Scilit]
- Seto, K.C.; Fragkias, M.; Güneralp, B.; Reilly, M.K. A meta-analysis of global urban land expansion. PLoS ONE 2011, 6, e23777. [Google Scholar] [CrossRef] [Scilit] [PubMed]
- Jansuwan, P.; Zander, K.K. What to do with the farmland? Coping with ageing in rural Thailand. J. Rural Stud. 2021, 81, 37–46. [Google Scholar] [CrossRef] [Scilit]
- Pravalprukskul, P.; Bech, T.; Messerli, P. Land Use Policy Maize boom, bust and beyond: Investigating land use transitions in the northern Thai uplands. Land Use Policy 2023, 132, 106815. [Google Scholar] [CrossRef] [Scilit]
- Chansarn, S. Assessing the sustainable development of Thailand. Procedia Environ. Sci. 2013, 17, 611–619. [Google Scholar] [CrossRef] [Scilit]
- United Nations. The 17 Sustainable Development Goals (SDGs). Available online: https://sdgs.un.org/goals (accessed on 6 April 2026).
- Sankey, T.T.; Leonard, J.M.; Moore, M.M. Unmanned aerial vehicle− Based rangeland monitoring: Examining a century of vegetation changes. Rangel. Ecol. Manag. 2019, 72, 858–863. [Google Scholar] [CrossRef] [Scilit]
- Xu, X.; Li, D.; Liu, H.; Zhao, G.; Cui, B.; Yi, Y.; Yang, W.; Du, J. Comparative Validation and Misclassification Diagnosis of 30-Meter Land Cover Datasets in China. Remote Sens. 2024, 16, 4330. [Google Scholar] [CrossRef] [Scilit]
- Pitakdumrongkit, K. Eastern Economic Corridor (EEC): Updates and Ways Forward. Available online: https://isc.mfa.go.th/en/content/eec-updates-and-ways-forward?cate=5f204a5928600c531517cb75 (accessed on 6 April 2026).
- International Labour Organization (ILO). COVID-19: Impact on Migrant Workers and Country Response in Thailand; ILO: Geneva, Switzerland, 2020; Available online: https://www.ilo.org/resource/brief/covid-19-impact-migrant-workers-and-country-response-thailand (accessed on 24 April 2026).
- Likitswat, F.; Sahavacharin, A. Landscape change analysis: Ecosystem services in the peri-urban agriculture of Bangkok. J. Archit. Plan. Res. Stud. 2023, 20, 25–38. [Google Scholar] [CrossRef] [Scilit]
- Fakkhong, S.; Suwanmaneepong, S.; Mankeb, P. Farmer’s perceptions towards economic sustainability of rice farming in peri-urban area, Bangkok, Thailand. Int. J. Agric. Technol. 2016, 12, 1759–1772. [Google Scholar]
- Menakanit, A.; Davivongs, V.; Naka, P.; Pichakum, N. Bangkok’s urban sprawl: Land fragmentation and changes of peri-urban vegetable production areas in Thawi Watthana District. J. Urban Reg. Anal. 2022, 14, 59–78. [Google Scholar] [CrossRef] [Scilit]
- Gullette, G.; Thebpanya, P.; Singto, S. Socioeconomic and livelihood impacts within Bangkok’s expanding metropolitan region. Build. Cities 2022, 3, 808–823. [Google Scholar] [CrossRef] [Scilit]

Disclaimer/Publisher’s Note: The statements, opinions and data contained in all publications are solely those of the individual author(s) and contributor(s) and not of MDPI and/or the editor(s). MDPI and/or the editor(s) disclaim responsibility for any injury to people or property resulting from any ideas, methods, instructions or products referred to in the content. |
© 2026 by the authors. Licensee MDPI, Basel, Switzerland. This article is an open access article distributed under the terms and conditions of the Creative Commons Attribution (CC BY) license.