


Abstract
Polluted mangroves are ecologically sensitive habitats that provide ecosystem services. In a selected polluted forest of Simaisma, viable aerobic, halophilic, and heterotrophic hydrocarbon-degrading bacterial strains were isolated from both rhizosphere and non-rhizosphere regions. The chemical composition of sediment showed a clear distinction between the rhizosphere and non-rhizosphere sites, as well as coastal and non-coastal sediments, as per Principal Component Analysis (PCA) clustering. Anthracene, an indicator of oil pollution, was present along with vanadium, another marker of oil pollution. Through selective enrichment cultures, a total of 25 hydrocarbon-degrading bacterial strains were isolated, including Lysinibacillus xylanilyticus, Bacillus cereus, Lysinibacillus sphaericus, Pseudomonas stutzeri, Acinetobacter calcoaceticus, and Staphylococcus warneri. To link the adaptation of bacteria to sediment chemistry, nine B. cereus strains were investigated using their MALDI-TOF MS protein profiles combined with their dendrogram. The relationship between protein profiles of B. cereus strains with their biosurfactant production capabilities was explained by a tanglogram. The tanglegram suggests that biosurfactant production is an important functional trait in B. cereus, but it is not consistently reflected in the overall protein profile. This suggests that bacterial adaptation in the polluted mangrove sediments may involve changes at multiple cellular levels, including metabolic activity and variation in protein expression profiles. These findings confirm the involvement of mangrove-associated bacteria in the sustainability of mangrove forests by promoting bioremediation of oil pollution, thereby protecting coastal ecosystems and their environmental and socio-economic aspects.
1. Introduction
Mangroves are shrubs that grow in intertidal zones, mainly found in tropical and subtropical areas [1]. They can thrive in harsh conditions such as high salinity, direct sunlight, extreme temperatures, flooding, and minimal rainfall [2]. They provide a large number of ecosystem services, such as feeding and breeding grounds for marine animals [3], carbon sequestration [4], coastal protection by acting as flood barriers [5], climate regulation [6], and nutrient cycling [7]. Despite their ecological and environmental importance, they are under anthropogenic stress due to coastal development, oil extraction, refineries, industries, and marine transportation in coastal areas, causing severe oil pollution [8].
Oil pollution is one of the main threats to mangrove forests, which can disappear if not adapted to such pollution [8]. According to reports, nearly 238 major oil spills have occurred in the past 60 years, resulting in the loss of approximately 126,000 ha of mangrove swamps [8]. The Arabian Gulf is one of the most affected areas [9], especially as a result of ship transportation [10], oil exploration [11], industrial discharges [12], and the Gulf War oil spill [13]. Qatar, situated on the northeastern coast of the Arabian Peninsula, features an extensive 550 km coastline. It is blessed with various coastal ecosystems, including mangroves, seagrass, mudflats (also known as sabkhas), and coral reefs [14]. Sediments in the mangrove rhizosphere represent the habitat for a large number of microbial communities, with bacteria and fungi constituting 91% of mangrove microbial communities [15]. These microbial communities shape the mangrove ecosystem by acting as principal degraders of pollutants and recyclers of organics in the biogeochemical cycles [16]. In addition, the interaction between the microbial communities and mangrove roots becomes crucial for the adaptation of mangrove plants to oil pollution [17]. The rhizosphere is the zone extending up to 4 mm around the plant roots. This region has unique physicochemical characteristics shaped by the root exudate’s direct and indirect influence. Root exudates are organic and inorganic compounds secreted by the roots, which modify the soil’s physicochemical properties, in turn, supporting microbial growth and activities. The root exudates are primarily confined to the rhizosphere region, which makes the rhizosphere region the highest in microorganism activity compared to the non-rhizosphere areas [18]. This clearly leads to higher microbial densities and activities in the rhizosphere, including those of hydrocarbon-degrading bacteria, which help the plant to tolerate the pollution [19]. By altering their metabolic pathways, hydrocarbon-degrading bacteria can effectively handle pollutants at the metabolic level, which is frequently upregulated or evolved by these bacteria in response to hydrocarbon exposure. This improves the efficiency of hydrocarbon degradation or eventually expands their capacity to metabolize a wider variety of hydrocarbons by acquiring specialized catabolic genes through horizontal genes [20]. Although the microbial communities of mangroves have been studied, knowledge about the cultivable fraction of hydrocarbon-degrading ones that are highly tolerant to hydrocarbon toxicity, and their functional traits in the mangrove rhizosphere is limited.
The interest towards hydrocarbon-degrading bacteria is related to their metabolism highly adapted at the metabolic level. Hydrocarbon-degrading bacteria’s capacity to produce biosurfactants may be affected by their adaptive responses to the surrounding microenvironment, which encompasses alterations in community composition, shifting metabolic interactions, and stress factors like variations in pH, temperature, or contaminant exposure. These adaptive processes can influence biosurfactant production, structural variety, and functional effectiveness, thus affecting the overall performance of hydrocarbon-degrading bacteria in situ [21]. However, the role of the symbiosis between the rhizosphere and associated hydrocarbon-degrading bacteria in their adaptation requires more investigations. Using genomic tools should be feasible, especially metagenomics, but it is expensive and time-consuming. However, Matrix-assisted laser desorption ionization time-of-flight mass spectrometry (MALDI-TOF MS) is a mass spectrometry-based analysis that differentiates between microorganisms in a quick and efficient way. It analyzes ions from oligonucleotides, polymers, and proteins, which serve as a basis for organism identification and differentiation. Due to its robustness and accuracy, it is widely used in clinical applications but not extensively in environmental microbiology [22]. It enables the analysis of proteins and peptides, providing readable sequence information for protein synthesis and processing [23]. This capability facilitates functional diversity studies through peptide mass fingerprinting [24].
This research examines how the mangrove rhizosphere influences microbial and chemical processes in oil-polluted sediments of the Simaisma mangrove ecosystem. Three primary hypotheses were investigated: (1) Rhizosphere sediments are distinct from non-rhizosphere sediments regarding chemical composition and microbial diversity; (2) Hydrocarbon-degrading bacteria linked to the rhizosphere show greater functional activity, especially in biosurfactant production, compared to non-rhizosphere counterparts; and (3) Protein expression profiles of these bacteria are associated with biosurfactant production and sediment chemistry, indicating adaptations to hydrocarbons and environmental stressors. This study investigates bacterial adaptation at structural and functional levels by integrating chemical analyses, bacterial isolation, functional assays, and protein profiling, emphasizing the rhizosphere’s role in facilitating bioremediation and tree survival in contaminated sediments.
The study highlights the role of hydrocarbon-degrading bacteria in the mangrove rhizosphere, which contributes to the survival and resilience of mangrove trees in oil-polluted areas. The detection of hydrocarbons and oil-associated trace metals indicates the presence of marine oil pollution and underscores the necessity to explore bacterial adaptation at both structural (changes in community composition) and functional (degradation pathways, resistance mechanisms, and metabolic activity) levels. These results demonstrate the ecological resilience and inherent bioremediation capacity of microbial communities within mangrove ecosystems. In addition to the ecological aspect, this study also addresses wider issues related to environmental sustainability and socio-economic resilience in coastal areas that depend on mangrove ecosystems for fisheries, shoreline protection, and local livelihoods. By integrating ecological, microbiological, and environmental monitoring approaches, the research contributes to developing scientific and interdisciplinary frameworks for sustainable coastal management. In this context, the study supports efforts to define, quantify, and monitor sustainability through environmental indicators, pollution tracking, and ecosystem health assessment. It also highlights the value of sustainability tools, such as ecological risk evaluation, ecosystem service appraisal, and extended environmental monitoring, to inform policy development, management strategies, and regulatory frameworks aimed at protecting vulnerable coastal ecosystems.
2. Materials and Methods
2.1. Study Area
Simaisma mangrove forests are situated in the Al Daayen municipality, the eastern region of Qatar (GPS coordinates 25°34′42.0″ N 51°29′22.1″ E). They are an afforested mangrove forest in Qatar [19]. A regional study revealed that surface sediments from the Simaisma beach contained total petroleum hydrocarbons (TPHs) at an average concentration of approximately 51.9 ± 84.1 µg/L [25].
2.2. Sediment Sampling
Sediment samples were collected using sterile 50 mL FalconTM conical centrifuge tubes. These samples were collected from a depth of 10 cm beneath two representative mangrove trees, labelled as S1 (tree 1) and S2 (tree 2). Around each tree, 6 root areas were selected, and at each area, sediments and rhizosphere samples were sampled from a depth of 10 cm to account for spatial heterogeneity and microbial diversity. The six samples were rigorously mixed to be representative of the tree. Therefore, S1 and S2 are considered independent in biological sampling. However, in analytical procedures, technical replicates were used to ensure precision. For rhizosphere sampling, roots were visibly present in the sampling area. The presence of roots stabilizes the sediments, so it minimizes the disturbance caused by thermodynamic movement in mangroves. In addition, sampling was performed from a non-rhizospheric area situated 5 m away from Tree 1 (S1F) and 10 m away from Tree 2 (S2F). Two sediment controls were collected: one from a coastal region, designated as the coastal control, and another from a non-coastal area located 1 km away from both mangrove and coastal zones. The purpose of including these controls was to assess variations in the chemical composition among mangrove sediments, coastal sediments, and non-coastal sediments. The samples were transported to the laboratory at 4 °C, and the stones, roots, and straws were removed from the samples. The information about sampling sites and sampling IDs is provided in Table 1.
Table 1.
Sampling sites and sample IDs are given in Table 1.
2.3. Chemical Analysis of Sediments
2.3.1. Determination of Total Organic Carbon and Total Inorganic Carbon (TIC)
The total carbon (TC), total organic carbon (TOC), total inorganic carbon (TIC), and total nitrogen (TN) contents were quantified using a TOC analyzer (Skalar Primacs MCS-Formacs CA16, Breda, The Netherlands), providing insights into the organic and inorganic fractions of the sediments. Samples were first dried at 40 °C for 72 h.
2.3.2. Determination of Total Petroleum Hydrocarbons (PAH) and Diesel Range Organics (DRO)
Petroleum hydrocarbons, specifically polycyclic aromatic hydrocarbons (PAHs), were identified and quantified using Gas Chromatography–Mass Spectrometry (GC–MS) (Shimadzu, Kyoto, Japan). Samples were first dried at 40 °C for 72 h.
2.3.3. Determination of Elemental Composition of Sediments
Heavy elements were determined using 24 h dried samples at 103 °C by Inductively Coupled Plasma Optical Emission Spectrometer (Perkin-Elmer, Optima 7300DV, Waltham, MA, USA) fitted with an autosampler. The samples were dried and ground prior to acid digestion. Potassium (K), Arsenic (As), Vanadium (V), Antimony (Sb), Calcium (Ca), Barium (Ba), Beryllium (Be), Boron (B), Cadmium (Cd), Cobalt (Co), Chromium (Cr), Copper (Cu), Aluminum (Al), Magnesium (Mg), Iron (Fe), Manganese (Mn), Lithium (Li), Molybdenum (Mo), Nickel (Ni), Lead (Pb), Strontium (Sr), Phosphorus (P), Sodium (Na), and Zinc (Zn) were quantified in the sediments.
2.3.4. Fourier Transform Infrared Spectroscopy (FTIR)
The chemical structure of the dried samples (sediments was further analyzed by FTIR Fourier Transform Infrared Spectroscopy (FTIR) (SHIMADZU-IRSpirit, Kyoto, Japan). Samples were first dried for 72 h at 40 °C. FTIR spectra between 400 and 4000 cm−1 were used to identify functional groups in the sediments. This detailed chemical analysis of sediments gives insights into the chemical composition of the sediments. These analyses are crucial for detecting spatial differences in sediment composition and for understanding the environmental factors that influence the distribution of cultivable hydrocarbon-degrading bacterial isolates. which are highly tolerant to hydrocarbon toxicity.
2.4. Culture Medium and Isolation of Hydrocarbon-Degrading Bacteria by Enrichment Culture
The enrichment culture technique is a commonly referenced method in the literature for isolating hydrocarbon-degrading bacteria that can use hydrocarbons as their only source of carbon and energy. Sediments were introduced into a minimal salt medium (MSM), enriched with a hydrocarbon source (5% diesel, corresponding to 37.5 g/L hydrocarbons). Diesel stock solution contained 750 g/L hydrocarbons, as kindly provided by a local oil refinery Unit (personal communication). MSM medium contains (g/L): 4, NH4NO3; 2, Na2HPO4; 0.53, KH2PO4; 0.17, K2SO4, and 0.1, MgSO4, H2O. 1 mL of sterile trace element solution was added to MSM before sterilization. The trace elements solution is composed of (g/L): 0.1, EDTA; 0.042, ZnSO4; 0.199, MnSO4, H2O; 0.05, H3BO3 and 0.1 NiCl2 [26].
The 30 mL medium was inoculated with 1 g of sediment and maintained under shaking conditions (30 °C, 200 rpm) for 4 days, during which only the bacteria able to metabolize the hydrocarbons will grow. This step was repeated three more times with inoculation using 1 mL of the previous culture. Bacterial strains were grown and purified using Luria Broth (LB, liquid) and LB agar (solid). Strains were selected based on their ability to grow on MSM containing 5% diesel as the sole carbon source.
2.5. Evaluation of Growth of the Isolates Using Diesel as Sole Carbon Source
Growth of the isolates was evaluated in MSM liquid medium supplemented with 5% (v/v) diesel, equivalent to 37.5 g/L of hydrocarbons. The 20 mL culture was inoculated with the pure strain’s suspension in MSM to start with an initial OD of 0.15. Indeed, overnight pure cultures in LB medium were centrifuged, washed twice, and the cells were resuspended in MSM. The cultures were tightly sealed with parafilm and then incubated at 30 °C in darkness for 7 d in a shaker set at 200 rpm. The growth was evaluated by determining the Colony Forming Units (CFU) by spreading 100 µL of serial dilutions on LB solid medium and incubating for 2 d at 30 °C.
2.6. Determination of Diesel Solubilization and Emulsification Activities of Isolates
Bacterial isolates were assessed for biosurfactant activity, including diesel solubilization and emulsification, after an incubation period of 7 days as described in Section 2.5. Emulsification and solubilization assays were performed following the protocols described by [27]. After incubation, 15 mL of each culture was centrifuged at 10,000 rpm for 15 min. Then, 1 mL of the supernatant was mixed with 0.15 mL of diesel. An individual culture control was performed for each strain by using 0.15 mL of MSM instead of diesel (biotic control). The abiotic test was performed by mixing 1.15 mL of distilled water with 1 mL of diesel. The tubes were vigorously vortexed for 2 min and placed for 1 h to separate diesel from the aqueous phase. The O.D of the aqueous phase was measured at 400 nm. The emulsification activity was measured as EU units/volume, where 0.01 absorbance corresponds to one activity unit.
For diesel solubilization, 0.9 mL of supernatant was mixed with 10 mL of Tris-HCl 20 mM (pH 7). Then, 0.2 mL of diesel, representing 2% (v/v) of the total volume, was added. In control 1, 0.2 mL of Tris-HCl buffer replaced diesel, in order to subtract the residual quantity of hydrocarbons in the supernatant. In control 2, the supernatant was replaced with 0.9 mL of HCl buffer in order to subtract the quantity of hydrocarbons that may solubilize from diesel, without biosurfactant activity. All the glass tubes were sealed with parafilm and incubated vertically in the dark, in a shaker set at 30 °C and 300 rpm. After 24 h of incubation, tubes were placed for 30 min for the separation of the diesel layer from the aqueous layer. Then, 4 mL of the aqueous layer was mixed with 4 mL of pure hexane, vortexed vigorously for 2 min, and centrifuged for 15 min at 4500 rpm. The OD of the hexane phase was measured at 295 nm, with hexane used as a blank. A calibration curve was plotted between diesel concentrations in hexane ranging from 0.3 to 1.25 µL of diesel per mL of hexane. The calibration curve was used to calculate diesel concentration in the samples. The initial diesel concentration was 18.347 μL/mL.
2.7. Identification of Isolates by MALDI-TOF (Matrix-Assisted Laser Desorption/Ionization Time-of-Flight)
MALDI-TOF MS (Bruker Daltonics, Bremen, Germany) with MALDI Biotarget-48 sample spots was used to identify the isolates of hydrocarbon-degrading bacteria, following the protocol described in the published literature [28]. For this purpose, overnight cultures on solid LB medium were used. The analysis generates a mass spectrum specific to each strain, which is compared with a database of known bacteria. Bacterial strains were identified based on the mass peaks with m/z ranging from 2000 to 20,000. Biotyper software 3.1 was used to generate log scores based on conserved ribosomal proteins. A log score between 0.000 and 3.000 was attained for each strain. Identification is considered accurate, with high confidence at the probable species level when the MALDI score ranges from 2.3 to 3.0. Scores between 2.000 and 2.299 indicate a probable correct species-level identification with high accuracy at the genus level. Scores from 1.700 to 1.999 provide probable genus-level identification. Scores below 1.700 are not considered for identification because of the lack of accuracy, or the ribosomal proteins do not match the database entry. MALDI-TOF MS generates distinct protein mass spectra (fingerprints) from whole microbial cells, primarily consisting of highly abundant proteins like ribosomal proteins. It is, in fact, the most commonly utilized technique for the rapid identification of bacteria. These spectra, however, offer consistent molecular patterns that vary across species, strains, and physiological conditions, allowing for the differentiation of microorganisms and identification of phenotypic variability. Recent studies have also demonstrated its value in environmental microbiology for exploring microbial diversity and ecological adaptations. For example, Ashfaq et al. (2022) combined MALDI-TOF MS with principal component analysis (PCA) to rapidly identify environmental isolates and distinguish microbial communities based on their proteomic fingerprints, thus validating its application in ecological and environmental research [29]. Likewise, research conducted in coastal and hypersaline settings in Qatar showed that MALDI-TOF MS paired with multivariate analyses can differentiate bacterial isolates and cluster strains according to ecological or functional traits. AlDisi et al. employed MALDI-TOF MS along with PCA to discriminate closely related Bacillus and Virgibacillus isolates and to associate spectral clustering with ecological functions within mineral-forming microbial communities [30]. Furthermore, Yousefi et al. (2025) applied MALDI-TOF MS protein profiling to hydrocarbon-degrading bacteria isolated from the mangrove rhizospheres in Qatar, revealing high diversity among isolates and suggesting adaptation to local micro-environmental conditions [31].
2.8. Data Analysis of Protein Profiles Obtained from MALDI-TOF
The protein profiles obtained from MALDI-TOF were preprocessed in R (version 4.5.1, R Core Team, 2025) prior to statistical analysis. The preprocessing includes processing of Mass spectrometry data using the MALDIquant package in R. MALDIquant is a robust R package, which is designed for a complete analysis pipeline of mass spectrometry data [32]. Raw spectra were first smoothed using the Savitzky–Golay algorithm to reduce noise, followed by baseline correction using the SNIP method. Total ion current (TIC) normalization was then applied to standardize signal intensity across samples. Peaks were detected based on a signal-to-noise ratio threshold. A unified reference m/z list was generated from the aligned peaks, and an intensity matrix was constructed for downstream comparative and statistical analyses. The matrix obtained from preprocessing in R was further run in MATLAB (Version 2025b; MathWorks, Natick, MA, USA) to generate high-quality dendrograms.
2.9. Statistical Analysis
Normality of the variables was evaluated using both the Kolmogorov–Smirnov and Shapiro–Wilk tests. Variables with p > 0.05 were considered approximately normally distributed, whereas those with p < 0.05 were treated as non-normal. The sediment compositional differences among the sampling sites were assessed by General Linear Model (GLM). PCA was performed on the sediment chemical data and bacterial activity variables to explore multivariate relationships among sampling sites and environmental parameters. In this study, PCA was applied as an exploratory multivariate technique to visualize relationships among sampling sites and environmental variables. PCA is a powerful approach to explain data by combining several variables into lesser variables called principal components [33]. Prior to PCA, variables were centered and scaled to unit variance to ensure comparability among parameters measured in different units. An independent t-test was performed at a 95% confidence interval to compare the differences in growth, diesel emulsification, and solubilization of bacterial isolates from the rhizosphere and non-rhizosphere regions. Statistical significance was evaluated at a threshold of p < 0.05. Given the limited number of comparisons and the exploratory nature of the analyses, no additional p-value correction was applied. All the statistical analyses were conducted using SPSS software (version 31.0.1.0, IBM Corp., Armonk, NY, USA). All the experiments were performed in triplicate, and results are reported as mean ± standard error (SE).
3. Results and Discussions
3.1. Chemical Characterization of Mangrove Sediments
Performing chemical analysis of sediments is important because this information offers important insights into the geochemical characteristics of mangrove sediments and is crucial for understanding the underlying factors that explain the differences seen between chosen sites. Results are shown in Table 2.
Table 2.
Chemical composition of the sediments: total nitrogen (TN), total carbon (TC), total organic carbon (TOC), total inorganic carbon (TIC), and diesel-range organics (DRO) in the analyzed sample. The sample codes refer to those presented in Table 1.
3.1.1. Analysis of Total Organic Carbon (TOC) in the Sediments
TOC serves as an indicator of organic pollution and microbial biomass abundance. Rhizosphere samples show elevated TOC levels, whereas non-rhizosphere and CNC controls display significantly lower values (0–0.5%). Elevated TOC in S1R, S2R, and CC indicates organic contributions, potentially from hydrocarbons or biogenic pollutants. Low CNC values suggest minimal organic contamination.
TOC content varied between 0.41% (w/w) and 1.60% (w/w) among sediments, as shown in Table 2. This indicates the presence of organic matter, which may be generated from plant debris, microbial activity, and pollution [34]. In addition, this would involve the role of root exudates and organic contributions from plants, enhancing the rhizosphere with greater quantities of bioavailable organic matter. The CNC has no TOC, whereas the coastal control shows the highest TOC (1.7), indicating high pollution affecting all the coastal sediments. Based on GLM analysis, TOC (%w) and TIC (%w) show statistically significant differences among sampling sites. While N (%w) and TC (%w) do not show significant differences, suggesting that their distribution is not varying among sites.
3.1.2. Analysis of Total Inorganic Carbon (TIC) in the Sediments
TIC is lower in rhizosphere samples (9.7% w/w) than in non-rhizosphere soils (10.8% w/w). This difference may indicate that microbial activity in the rhizosphere leads to organic acid production, which can dissolve carbonates and reduce inorganic carbon levels [35]. CNC shows a similar high TIC (10.9), while the CC has a slightly lower value (9.2).
3.1.3. Analysis of Nitrogen in the Sediments
Nitrogen is lower in rhizosphere soils (S1R = 0.07, S2R = 0.14) compared to non-rhizosphere soils (S1NR = 0.20, S2NR = 0.20). This suggests that plants and rhizosphere microorganisms consume more nitrogen, likely due to root exudates stimulating microbial activity. The CNC has negligible nitrogen (0.02), while the coastal control (CC = 0.13) shows a moderate background level.
3.1.4. Analysis of Polycyclic Aromatic Hydrocarbons (PAHs)
Polycyclic aromatic hydrocarbon (PAH) analysis revealed the presence of phenanthrene and anthracene in rhizosphere and non-rhizosphere sediments, as shown in Table 2. The presence of phenanthrene and anthracene in sediments indicates the contribution of petrogenic sources, as a result of some anthropogenic activities [36]. The presence of anthracene in the rhizosphere may arise from various factors, such as microbial transformation, varying degradation rates, and sorption to organic matter linked with roots. In this research, degradation was deduced indirectly from hydrocarbon levels and the activity of bacteria, instead of being measured directly. Thus, the buildup of anthracene probably indicates a mix of biological and physicochemical processes instead of solely microbial activity.
Phenanthrene is found at minimal concentrations in both rhizosphere and non-rhizosphere soils (0.20–0.30 ppm) but is not detected in either control. However, reduced S2R values (0.20) might indicate increased degradation in that rhizosphere relative to others. Anthracene showed considerable differences among all sampling locations, signifying site-specific factors affecting its distribution, whereas phenanthrene levels were relatively consistent across sites, implying a more uniform environmental presence or stable sources throughout the study area. These varying patterns might indicate dissimilarities in the physicochemical characteristics, decay rates, or origins of these polycyclic aromatic hydrocarbons in mangrove sediments. Most likely, this indicated the continuous feeding of sediments with oil-polluting compounds. Anthracene is detected only in rhizosphere samples (S1R = 0.50, S2R = 0.42), while non-rhizosphere soils and controls contain none. This may indicate that anthracene is either a byproduct of hydrocarbon transformation under rhizosphere microbial activity or is mobilized more readily in root-influenced soils.
3.1.5. Analysis of Diesel Range Organics (DROs)
Sediments in the rhizosphere exhibit elevated DRO levels (S1R = 0.74, S2R = 0.6) in relation to sediments outside the rhizosphere (S1NR = 0.40, S2NR = 0.40). This might indicate that hydrocarbons are held longer in the rhizosphere, potentially because root exudates are mobilizing them, or that degradation is occurring but not fully achieved. The CNC lacks a DRO, and the CC contains 0.40. Highest DRO concentrations were found in coastal control, as indicated in Table 2. The presence of DROs in the sediments further confirms the contamination of sediments with petroleum hydrocarbons. For DRO, the GLM shows an F-value of 18.45 and p = 0.052, indicating a non-significant trend toward differences among the groups.
3.1.6. Analysis of the Elemental Composition
The rhizosphere (S1R, S2R) and non-rhizosphere (S1NR, S2NR) samples exhibit largely comparable levels of primary elements (Ca, Na, Mg, K, Sr), typically aligning with the natural sediments’ makeup. The relative abundance of major and minor elements in the sediments followed the order: Ca > Na > Mg > B > Al > Sr > K > Fe > P > Cu > As > Mn > Ba > Ni > V > Cr > Li > Zn > Co > Mo > Sb > Cd. The dominance of Ca, Na, and Mg reflects a strong marine influence and tidal exchange [37]. Fe, Ca, Mg, Na, K, Sr, B, Li, Mo, and P are mostly major elements and have no standard “permissible limits”. Trace elements are considered toxic and have standard “permissible limits” in sediments.
The behavior of trace metals exhibits more distinct variations. Key nutrients such as Fe, P, Mn, and Zn are more prevalent in control samples (CNC, CC) than in the other samples, indicating a depletion under field conditions, likely resulting from plant absorption [38]. The sediments in the rhizosphere typically show elevated micronutrient concentrations (Cu, As, Mn, Zn) compared to non-rhizosphere, indicating potential root-mediated mobilization. The findings indicate that although the main sediment chemistry (macro-elements) remains stable and similar in both rhizosphere and non-rhizosphere areas, harmful trace elements, particularly As and Cu, are notably higher, regardless of rhizosphere impact.
The primary ecological concern arises from arsenic and copper. Arsenic ranged from 49.1 to 59 mg/kg across all the sediments, which is higher than the permissible limit (<3.8) [34], indicating contamination by arsenic in these sites. Copper concentrations exceeded the permissible range at all sampling sites, indicating potential ecological risk. Numerous studies have reported that elevated Cu levels are toxic to bacterial communities, inhibiting growth and disrupting microbial metabolic activities [39]. Interactions in the rhizosphere seem to boost the mobilization of specific micronutrients, yet they do not change the basic pattern of contamination [40]. Trace elements are considered toxic and have very standard “permissible limits” in sediments. Ba and nickel contamination are only observed in non-coastal control, as their concentration is slightly higher than permissible limits. The presence of vanadium and nickel in the soil is an indication of petroleum activity, as vanadium is an important metal in heavy petroleum feedstock (HPF) [41]. Based on the GLM results, significant differences among the groups were observed for Al, As, Ba, Co, Cr, Fe, Li, Mg, Mn, Mo, Ni, P, Sb, and V, indicating that the concentrations of these elements and compounds varied depending on the site and group. While Ca, Cd, Cu, Na, Sr, and Zn are not statistically different among sites. The concentration of heavy metals is provided in Table 3.
Table 3.
Analysis of the elemental components in the sediments.
To accurately depict results when vanadium (V) and nickel (Ni) are treated as oil tracers at moderate concentrations, normalization to a stable lithogenic element like Al or Fe was carried out to differentiate natural background from anthropogenic/oil contributions (Table 4).
Table 4.
Normalization of Ni and V concentrations to Fe and Al.
Vanadium is a recognized indicator of petroleum pollution because of its prevalence in crude oil. This research shows that similar V/Al ratios at all sampling locations, including the nominal control sites (CNC and CC), suggest that all areas have experienced some level of oil contamination, likely from diffuse or historical origins. Normalizing conservative elements like Al and Fe helps correct the natural variability in sediments, yet the consistent V/Al ratios imply that even the control sites lack pristine conditions. In comparison, nickel demonstrates more variability and seems to be primarily influenced by natural lithogenic sources instead of enrichment from petroleum. These findings indicate that although Ni might indicate sediment composition, V verifies the extensive impact of petroleum in the examined mangrove sediments.
3.2. PCA of Chemical Composition of Sediments
PCA is a statistical method employed to decrease the dimensionality of extensive datasets by converting a group of potentially correlated variables into a reduced group of uncorrelated variables known as principal components, all while preserving as much variability from the original data as feasible [45]. PCA accomplishes this by identifying the directions (principal components) that optimize variance within the data, where the first component accounts for the highest variation, the second (orthogonal to the first) accounts for the next highest, and so forth [33]. The sediments from various locations show a geochemical imprint of marine oil contamination, marked by hydrocarbons (DRO, PAHs) and oil-tracer metals (Ni, V, As, Cu). The pollution pattern identified connects the observed chemical signatures straight to petroleum sources that come from the marine environment. Although the rhizosphere affects the spread and behavior of these pollutants via mechanisms like organic matter enrichment or microbial activity, it does not serve as the pollution source, suggesting that the hydrocarbons are externally introduced and later altered by root zone dynamics. To illustrate the differences in sediment chemical composition among the selected mangrove sites, PCA was conducted on the chemical dataset, including major and minor elements, TOC content, PAH, and DRO.
In this study, PCA was utilized as an exploratory multivariate technique to visualize relationships among sampling sites and measured geochemical variables. The first two principal components explained 76.6% of the total variance, with PC1 accounting for 59.7% and PC2 for 16.9% (Figure 1A). The score plot shows a separation between coastal and non-coastal sediments as well as differences between rhizosphere and non-rhizosphere samples. The coastal control (CNC) is clearly separated along the positive side of PC1, indicating a distinct chemical composition compared to other sediments, while CC is differentiated mainly along PC2. Rhizosphere (SR1, SR2) and non-rhizosphere (SNR1, SNR2) samples cluster on the negative side of the PC1 axis, although some separation between these groups is observed. Soil composition may vary considerably in terms of organic matter content, microbial activity, and abundance, as well as organic carbon turnover in areas closer to tree roots compared to more distant regions [46]. The PCA biplot (Figure 1B) illustrates the contribution of geochemical variables to sample distribution. Several metals, including Al, As, B, Ba, Ca, Cd, Co, Cr, Cu, Fe, K, Li, Mg, Mn, Mo, Na, Ni, P, Sb, Sr, V, and Zn, show strong positive loading on PC1, suggesting their association with the chemical variability observed among sediments. Organic carbon fractions and hydrocarbon indicators (TOC, DROs, Anthracene, and phenanthrene) contribute mainly to variation along PC2. The loading plots (Figure 1C,D) further highlight that PC1 is largely associated with metal distribution, whereas PC2 reflects variability in carbon fractions and organic contaminants. As reported in previous studies, soil organic matter influences the mobility of antimony and arsenic by acting as an electron donor in waterlogged environments [47]. In mangroves, high organic carbon content may also influence mobility of heavy metals [48]. TIC and TC are negatively loaded on PC2. These loadings indicate that PC1 represents variation in metal distribution and DRO presence, while PC2 indicates the distribution of carbon fractions and trace elements. Overall, PCA suggests that metals, carbon fractions and contaminants collectively contribute to the observed variability in sediment chemistry among the sampled sites.
Figure 1.
(A) PCA plot showing the distribution of sampling sites along PC1 (59.7%) and PC2 (16.9%), (B) PCA plot illustrating the clustering of metals (blue) and organic contaminants (red) influencing the distribution of samples, (C) Bar plot of PC1 loadings showing the variables that contribute to the variation explained by PC1 (59.7%), (D) Bar plot of PC2 loadings showing the variables contributing to the second principal component (16.8%).
3.3. Investigation of the Functional Group of Sediments Using FTIR Analysis
The FTIR spectra of the sediment samples indicated the dominance of functional groups associated with aromatic hydrocarbons, ethers, and carboxylic compounds. All the samples exhibited a peak at 714 cm−1, corresponding to C-H aromatic groups that undergo out-of-plane deformation stretching as shown in Figure 2. Peaks between 756 and 877 cm−1 might be an indication of C–H bending vibrations of the benzene ring [49]. The presence of these peaks highlights the predominance of aromatic structures, which may originate from petroleum-derived hydrocarbons or root-associated organic residues commonly present in mangrove environments. A distinct peak at 860 cm−1 found in all the sediments is possibly a characteristic of aromatic hydrocarbons [50]. The relatively stronger intensity of this band in rhizosphere samples suggests an enrichment of aromatic and microbial metabolites near the root zone compared to the non-rhizosphere, indicating enhanced biological activity and organic accumulation. The band observed between 911 and 1150 cm−1 can be attributed to C–O–C stretching, a likely indication of ether linkage [51]. The distinct peak at 1080 cm−1 has appeared in all the sediment samples, which could be an indication of aromatic ether [52]. This region may also include Si–O stretching of silicate minerals, reflecting the coexistence of organic and inorganic components in the sediments. Such mineral–organic interactions often stabilize organic matter by adsorption onto mineral surfaces, contributing to carbon preservation in mangrove soils [53]. The absorption at 1400 cm−1 corresponds to C=C bending vibrations, potentially indicating the presence of aromatic compounds [54]. A weak band at 1636 cm−1 represents C=C stretching, possibly suggesting the presence of either aromatic or aliphatic hydrocarbons [55]. These unsaturated groups are typically linked to partially oxidized hydrocarbons and microbial metabolites, further confirming the biogenic and petrogenic contributions to sediment organic matter. A strong peak at 1787 cm−1 might be C=O stretching vibrations, indicative of carbonyl functional groups [56]. Such carbonyl and carboxylic features often arise from oxidative degradation of organic material, suggesting active microbial and photochemical transformation processes occurring in surface sediments. The broad absorption band between 2500 and 2600 cm−1 is assigned to O–H stretching of carboxylic acids, particularly when hydrogen-bonded [57]. The peak at 2534 cm−1 was only observed in coastal control; it disappears in all the other samples. Its presence may reflect stronger hydrogen bonding and higher salinity-related interactions within coastal sediments compared to the mangrove-associated sites. Finally, the peak at 3409 cm−1, observed exclusively in the coastal control sample, corresponds to O–H stretching vibrations, which may be associated with higher water content in the coastal sediment [58]. The presence of this peak suggests a higher moisture content or hydrogen-bonded OH groups in the coastal sediment compared to the mangrove rhizosphere and non-rhizosphere samples.
Figure 2.
FTIR spectra of sediment samples collected from rhizosphere, non-rhizosphere, coastal, and non-coastal sediments.
The FTIR confirms the presence of carbonyl functional groups (C=O stretching), and ether linkages (C–O–C), and aromatic compounds (C–H bending vibrations) in the sediments. The higher organic signatures detected in rhizosphere sediments are consistent with previous observations from TOC analyses, where elevated organic content was observed in plant-associated sediments. This further supports the role of plant–microbe interactions in promoting the accumulation and transformation of organic matter.
Apart from trace metal patterns, FTIR analysis indicated the existence of functional groups typical of aromatic hydrocarbons, carbonyls, and ether linkages, such as C–H bending vibrations of benzene rings (714–877 cm−1), aromatic ether (1080 cm−1), and carbonyl C=O stretching (1787 cm−1). The prevalence of these aromatic and unsaturated groups in all sediment samples suggests contributions from petroleum-derived hydrocarbons, reinforcing the idea that the mangrove sediments.
3.4. Isolation and Identification of Hydrocarbon-Degrading Bacterial Strains
The rhizosphere-associated isolates include Acinetobacter calcoaceticus, Lysinibacillus xylanilyticus, B. cereus, and Lysinibacillus sphaericus. While the non-rhizosphere-associated isolates include B. cereus, Acinetobacter calcoaceticus, Staphylococcus warneri, and Pseudomonas stutzeri, as shown in Table 5. The bacterial isolates obtained from rhizosphere and non-rhizosphere sediments exhibited distinct taxonomic diversity. Most of them have been mentioned in the literature for their role in oil bioremediation. Lysinibacillus sphaericus has been shown to exhibit high efficiency in degrading aromatic hydrocarbons (phenanthrene, toluene, and naphthalene), diesel oil, and oily sludge, with removal efficiencies of up to 95% for C10–C28 hydrocarbons [59]. In a recent study, Staphylococcus warneri has been isolated from the bottom of oil tank sludge and has demonstrated high tolerance to oil [60]. Pseudomonas stutzeri was isolated from coal mine soil, and it demonstrated high capability to degrade polyaromatic hydrocarbons [61]. B. cereus and Pseudomonas aeruginosa were isolated from oil-contaminated workshops in North Central, Nigeria. Lipase produced by these bacteria showed promising results in the biodegradation of crude oil [62].
Table 5.
List of sampling sites, isolate IDs, identified species, and their MALDI scores from the rhizosphere region and the non-rhizosphere region. MALDI score values ≥ 2.0 indicate reliable species-level identification, while scores between 1.7 and 1.99 indicate probable genus-level identification. Total isolates analyzed: n = 25 (Rhizosphere n = 13; non-rhizosphere n = 12). The lowercase letters (a, b, c, d) represent different bacterial strains isolated from the same sample.
In this study, nine different B. cereus strains have been isolated, four from the rhizosphere region and five from the non-rhizosphere region. Acinetobacter calcoaceticus has been shown as hydrocarbon degrader, isolated from the roots of canola oil from Canadian soil [63]. Lysinibacillus fusiformis is known for its ability to degrade polyaromatic hydrocarbons [64]. Lysinibacillus xylanilyticus is an efficient plant growth stimulator [65] and known for the degradation of low concentrations of polyethylene [66]. Bacillus pseudomycoides was reported as an efficient dye degrader, and for use in the bioremediation of mixed dyes [67]. In a recent study, Bacillus pseudomycoides was shown to exhibit a 23.43% removal of petroleum hydrocarbons [68].
This research focused on culturable bacteria that break down hydrocarbons, tolerate elevated diesel levels, and demonstrate significant degradation abilities. While 5% diesel enrichment may promote rapid-growing or opportunistic taxa, this method enables the discovery of bacterial strains that are highly adapted to oil-contaminated settings and can effectively break down petroleum hydrocarbons, serving as vital players in bioremediation. The approach also underscores the importance of the mangrove rhizosphere in sustaining these unique communities, stressing its role in natural attenuation processes within mangrove sediments. Further studies will focus on evaluating the total abundance or community structure in situ, but instead on examining the adaptation and activity of resilient, functionally active strains fostered by the mangrove rhizosphere.
3.5. Evaluation of the Growth of the Isolate Strain in Liquid MSM Supplemented with 5% (v/v) Diesel
The study was performed to evaluate the potential of the isolated strains to produce biomass by growth at a high concentration of hydrocarbons from diesel (37.5 g/L). The growth potential of the 25 isolates was evaluated through their CFU after 7 d growth (Figure 3). Bacterial isolates from the rhizosphere areas exhibited significantly higher tolerance to diesel compared to those from the non-rhizosphere areas. Their produced biomass ranged from 1.70 ± 0.05 CFU × 108/mL to 2.50 ± 0.02 CFU × 108/mL. The highest biomass was obtained with the isolates SD110, later identified as Lysinibacillus sphaericus. The lowest biomass was produced by the isolate SD205b (Bacillus pseudomycoides) in the rhizosphere region. Conversely, the isolates from the non-rhizosphere areas demonstrated comparatively lower growth, with strain SD1F100c (B. cereus) producing the highest biomass (1.2 ± 0.09 108/mL) and strain SD2F100d (Staphylococcus warneri) with the lowest biomass (0.40 ± 0.01 CFU × 108/mL). Bacterial isolates obtained from 5 m away from the tree showed comparatively higher growth than those isolated from 10 m away. This difference may be attributed to the dense root network of mangroves, which likely enriches the surrounding microenvironment through the activity of root exudates [19].
Figure 3.
Growth potential of the isolates in 5% diesel-MSM, evaluated as CFU after 7 d incubation. Isolates from SD100a to SD210 are from the rhizosphere region (black), while isolates from SD1F100a to SD1F110a are 5 m away from the tree (gray), and SD2F100a to SD2F110b are 10 m away from the tree (red), in the non-rhizosphere region.
The statistical analysis of the CFUs indicates that the growth of the rhizosphere-isolates in 5% (v/v) diesel is significantly higher (p-value = 0.001 at 95% confidence interval) than that of the non-rhizosphere isolates (Figure 3). These findings align with previous speculations, which suggest that higher plants in general would promote the adaptation of diverse soil microbial communities [69]. Here, it may be concluded that the secretions from the mangrove roots in the rhizosphere area would provide the rhizosphere-associated hydrocarbon-degrading bacteria with nutrients that help in tolerating hydrocarbon toxicity and gradually acquire tolerance traits. This is enhanced due to the fact that the carbon and nutrient content of bulk sediments is relatively low [70], which is favorable for acquiring new degradative ways based on polluting hydrocarbons as substrate.
3.6. Evaluation of Biosurfactant Production as a Result of Adaptation in the Rhizosphere
The capability of producing biosurfactants as active biomolecules by rhizosphere- and non-rhizosphere-associated bacteria was evaluated. Bacteria produce biosurfactants to increase the bioavailability of hydrocarbons either by their emulsification or by solubilization. These biomolecules enable bacteria to utilize nonpolar organic hydrocarbons through combined activities to survive. In addition, their activities are adaptive and depend on the harsh conditions [71]. Both activities in the cultures of 25 isolates, as performed in Section 2.7, are shown (Figure 4A,B).
Figure 4.
(A) A two-way graph indicating diesel solubilization and emulsification values of the isolates of the rhizosphere region, (B) isolates of the non-rhizosphere region, (C) a conceptual model of microbial growth-investment in rhizosphere and non-rhizosphere sediments.
Lower SA and EA values were obtained with the non-rhizosphere isolates (Figure 4B) compared to those of the rhizosphere isolates (Figure 4A). This can be attributed to their lower growth (Figure 3). Student t-test confirms these differences (EA p-value = 0.001 and SA p-value = 0.009 at 95% confidence interval). However, the capability of each isolate to synthesize these two biosurfactants is evaluated by the determination of their specific activities.
The specific activity per cell of each isolate was calculated based on their growth in MSM medium supplemented with 5% diesel. For clarity, Table 6 provides the information about growth, biosurfactant activity (EA, SA), and specific activity per cell (EA/CFU, SA/CFU).
Table 6.
Bacterial growth, biosurfactant production and specific activity of isolates after one week of incubation within one week of incubation. Bold values in the table indicates significant high values. The lowercase letters (a, b, c, d) represent different bacterial strains isolated from the same sample.
Although rhizosphere-associated isolates exhibited higher overall biosurfactant activity and biomass, their specific activity per cell (EA/CFU, SA/CFU) was lower than that of the non-rhizosphere isolates, as indicated in Table 6. While the specific activity (SA/CFU and EA/CFU) reflects the capability and provides insight into cellular-level, it just provides an insight into the cultivable fraction of hydrocarbon degraders among the rhizosphere and the non-rhizosphere-associated strains with high tolerance to hydrocarbon toxicity.
In addition, this may be due to a different adaptation of the rhizosphere-associated strains, due to the expected higher density of bacteria, their growth rates, and the cumulative biosurfactant activities. This suggests that the non-rhizosphere isolates are adapted to synthesize higher specific activity due to their lower cell density.
3.7. Insights on the Adaptation of the Isolated Strains from the Mangrove Forest Through Biosurfactants Production and Protein Profiles
The data obtained from growth by 5% diesel tolerance, biosurfactant production, and specific activity of isolates were utilized to perform PCA analysis (Figure 5A). This PCA analysis reflects adaptations of these bacterial isolates toward pollution and environmental stress. The first two principal components explained 99% of the total variance, with PC1 contributing 85% and PC2 contributing 14%. The PCA plot revealed three distinct clusters, indicating significant differences in the enzymatic activity among the bacterial isolates. Group 1 comprises isolates of the rhizosphere region, group II indicates isolates of the non-rhizosphere region (5 m away from the tree), and group III indicates isolates of the non-rhizosphere region (10 m away from the tree). These patterns indicate that the isolates have developed adaptive responses to environmental pollutants and stress, with distinct enzymatic activities shaped by proximity to the rhizosphere.
Figure 5.
(A) PCA clustering of isolates activity, blue dots represent bacterial isolates, red labels illustrate the groups, blue circle indicates the clusters formed by bacterial isolates, (B) A tanglegram representing the relationships between the dendrogram of biosurfactant production and the dendrogram of protein profiles of B. cereus. The isolates (green) are B. cereus that belong to the rhizosphere region, while the isolates (red) are B. cereus that belong to the non-rhizosphere region. G1, G2, G3, and G4 are the groups that are created based on patterns of isolates on the leaves. The dashed lines connect the same bacterial strain across the two analyses.
To further explore the relationship between enzymatic activity and protein expression patterns of the isolates, a tanglegram was constructed. Tanglegram compares hierarchical clustering of B. cereus by combining a dendrogram created from two distinct datasets, biosurfactant production (left dendrogram) and protein profiles (right dendrogram) (Figure 5B). The dotted lines connecting the labels in the center represent the one-to-one correspondence between the same isolates in both trees. The degree of tangles or crossing of these lines indicates the extent of incongruence between the two datasets [72]. In G1, SD205a, SD2F110a, and SD200c are present, sharing the same clade; SD200c is showing incongruence, while falling in the same group. The specific sub-clade grouping appears similar but is not identical for all three strains. In G2 and G3, there is a high level of incongruence, except for strain SD100c, which showed congruence between the two dendrograms by dotted lines. In G4, SD2F100b showed strong congruence, indicating that the protein profiles data correlate strongly with the biosurfactant production. The protein profile dendrogram indicates variation among the isolates, which aligns with previous findings that B. cereus exhibits high protein profile variability in response to environmental stress [73]. The tangling in G1, G2, and G3 indicates that the genes and cellular machinery responsible for biosurfactant production are likely regulated independently of the overall protein expression patterns used for the protein profile clustering. The two traits do not co-segregate reliably. Based on the tanglegram analysis, the rhizosphere does not appear to exert a significant influence on the protein profile or biosurfactant production capacity of the B. cereus strain. However, these results contrast with observations reported for Pseudomonas aeruginosa, which exhibits a high degree of adaptive variation among isolates from different sampling sites. As a Gram-negative bacterium, its protein expression profile is strongly influenced by environmental conditions [74]. According to previous studies, certain gene expression indicates a high level of phenotypic and genetic adaptability in P. aeruginosa [75]. As reported in literature, B. cereus, a Gram-positive bacterium are highly resistant to environmental changes due to its thick cell wall and more conserved stress responses such as sporulation [76]. Gram-positive bacteria can resist extreme conditions by activating the general stress response (GSR), which is controlled by SigB (sigma factor). SigB plays a key role in regulating the expression of over 200 genes that maintain cellular functions under various stress conditions [77]. In contrast, the limited adaptive divergence observed in B. cereus in this study is consistent with the lack of statistically significant variation in TC, DROs, phenanthrene, and metals such as Ca, Cd, Cu, Na, Sr, and Zn across sampling sites. The relatively uniform distribution of organic contaminants likely contributes to the similar physiological and functional responses exhibited by the strains, regardless of their origin within the rhizosphere or non-rhizosphere zone. These findings suggest that sediment geochemistry shapes the functional behavior of B. cereus, but its adaptive routes are largely conserved, reflecting a stable response to environmental pressures in the Simaisma mangrove ecosystem. Overall, the combination of analytical approaches such as tanglegram, PCA clustering, and functional assays explains the heterogeneity of B. cereus populations in mangrove sediments.
4. Conclusions
This study investigated the influence of the mangrove rhizosphere on the functional traits of cultivable hydrocarbon-degrading bacteria and their role in sustainable bioremediation strategies. Initially, bacterial isolates exhibiting high tolerance to 5% (v/v) diesel were obtained through selective enrichment cultures and subsequently identified at the genus and species levels using MALDI-TOF MS. To gain insights into the adaptive strategies of Bacillus cereus, their protein expression profiles were analyzed using advanced statistical tools. Tanglegram analysis revealed that while some strains exhibited congruence between protein profiles and biosurfactant production, a majority showed significant incongruence, indicating that these two traits are largely regulated independently. These findings suggest that the rhizosphere exerts only a limited influence on the protein expression of B. cereus. Furthermore, the relatively uniform distribution of organic contaminants, such as DROs and phenanthrene, as well as metals including Ca, Cd, Cu, Na, Sr, and Zn across the sampling sites likely contributes to the comparable physiological and functional responses observed among strains. Overall, this study highlights the conserved adaptive strategies of B. cereus in mangrove sediments, demonstrating how sediment geochemistry influences bacterial functional behavior while maintaining a stable response across rhizosphere and non-rhizosphere zones.
Our findings suggest that the mangrove rhizosphere is crucial in influencing the functional diversity of bacteria that degrade hydrocarbons. Isolates associated with the rhizosphere showed greater overall biosurfactant activity and biomass, indicating improved adaptation to hydrocarbon-rich environments and the beneficial effect of organic matter linked to roots. Multivariate analyses, such as PCA and tanglegram comparisons, showed unique clustering of isolates according to their proximity to the rhizosphere, indicating that bacterial enzymatic activities and adaptive responses are shaped by the conditions in the rhizosphere. Although the protein profiles of B. cereus stayed mostly stable, probably because of their natural resistance to stress, the overall findings indicate that the rhizosphere encourages the selection and preservation of bacterial strains that can endure oil contamination and engage in natural bioremediation activities within mangrove sediments.
It is important to highlight that the sample size used in the PCA analysis is somewhat restricted. The PCA served mainly as an exploratory instrument to illustrate possible connections between bacterial functional traits and sampling areas. The classification of isolates based on their closeness to the rhizosphere indicates a potential effect of root-related environments on bacterial functional reactions, but some of the variation could also represent inherent differences among samples. Thus, these findings suggest possible trends instead of conclusive proof of rhizosphere-driven adaptation.
This research examined how the mangrove rhizosphere affects the functional characteristics of cultivable hydrocarbon-degrading bacteria and their contribution to sustainable bioremediation approaches. It emphasizes the significance of mangrove ecosystems for environmental sustainability and socio-economic resilience, advocating for comprehensive scientific methods for sustainable development and aiding in the definition, quantification, monitoring, and management of sustainability via environmental indicators, assessment tools, and well-informed policies and regulations.
Author Contributions
A.S.: Writing—original draft, Methodology, Investigation, Data curation. Z.A.D.: Writing—review and editing, Conceptualization. H.A.-J.: Formal analysis, Resources, Writing—review and editing, Conceptualization. M.H.A.-D.: Formal analysis, Resources, Supervision, Writing—review and editing. S.J.: Formal analysis, Resources, Supervision, Writing—review and editing. S.S.: Formal analysis, Resources, Supervision, Writing—review and editing. M.A.A.-G.: Formal analysis, Resources, Supervision, Writing—review and editing. N.Z.: Writing—review and editing, Writing—original draft, Supervision, Resources, Project administration, Conceptualization. All authors have read and agreed to the published version of the manuscript.
Funding
This project is funded by Qatar University, as sponsorship as a Graduate Assistant for the first author.
Institutional Review Board Statement
Not applicable.
Informed Consent Statement
Not applicable.
Data Availability Statement
Data are contained within the article.
Acknowledgments
The authors gratefully acknowledge Qatar University for providing the Graduate Assistantship for the first author. We extend our gratitude to the Central Laboratories Unit (CLU-QU) for their very kind support in the chemical analysis of our samples. We would like to acknowledge the Environmental Science Center, Qatar University (ESC-QU), for helping us with some chemical analysis in this project.
Conflicts of Interest
The authors declare the following financial interests/personal relationships, which may be considered as potential competing interests: Nabil Zouari reports were provided by Qatar University. Nabil Zouari reports a relationship with Qatar University that includes employment. If there are other authors, they declare that they have no known competing financial interests or personal relationships that could have appeared to influence the work reported in this paper.
References
- Wang, Y.-S.; Gu, J.-D. Ecological Responses, Adaptation and Mechanisms of Mangrove Wetland Ecosystem to Global Climate Change and Anthropogenic Activities. Int. Biodeterior. Biodegrad. 2021, 162, 105248. [Google Scholar] [CrossRef] [Scilit]
- Adame, M.F.; Reef, R.; Santini, N.S.; Najera, E.; Turschwell, M.P.; Hayes, M.A.; Masque, P.; Lovelock, C.E. Mangroves in Arid Regions: Ecology, Threats, and Opportunities. Estuar. Coast. Shelf Sci. 2021, 248, 106796. [Google Scholar] [CrossRef] [Scilit]
- Arceo-Carranza, D.; Chiappa-Carrara, X.; Chávez López, R.; Yáñez Arenas, C. Mangroves as Feeding and Breeding Grounds. In Mangroves: Ecology, Biodiversity and Management; Rastogi, R.P., Phulwaria, M., Gupta, D.K., Eds.; Springer: Singapore, 2021; pp. 63–95. ISBN 9789811624940. [Google Scholar]
- Wilcox, S.M.; Mulligan, C.N.; Neculita, C.M. Mineral Carbonation for Carbon Sequestration: A Case for MCP and MICP. Int. J. Mol. Sci. 2025, 26, 2230. [Google Scholar] [CrossRef] [Scilit]
- Asari, N.; Suratman, M.N.; Mohd Ayob, N.A.; Abdul Hamid, N.H. Mangrove as a Natural Barrier to Environmental Risks and Coastal Protection. In Mangroves: Ecology, Biodiversity and Management; Rastogi, R.P., Phulwaria, M., Gupta, D.K., Eds.; Springer: Singapore, 2021; pp. 305–322. ISBN 9789811624940. [Google Scholar]
- Alongi, D.M. Impacts of Climate Change on Blue Carbon Stocks and Fluxes in Mangrove Forests. Forests 2022, 13, 149. [Google Scholar] [CrossRef] [Scilit]
- Alongi, D.M. Macro- and Micronutrient Cycling and Crucial Linkages to Geochemical Processes in Mangrove Ecosystems. J. Mar. Sci. Eng. 2021, 9, 456. [Google Scholar] [CrossRef] [Scilit]
- Onyena, A.P.; Sam, K. A Review of the Threat of Oil Exploitation to Mangrove Ecosystem: Insights from Niger Delta, Nigeria. Glob. Ecol. Conserv. 2020, 22, e00961. [Google Scholar] [CrossRef] [Scilit]
- Gevao, B.; Boyle, E.A.; Carrasco, G.G.; Ghadban, A.N.; Zafar, J.; Bahloul, M. Spatial and Temporal Distributions of Polycyclic Aromatic Hydrocarbons in the Northern Arabian Gulf Sediments. Mar. Pollut. Bull. 2016, 112, 218–224. [Google Scholar] [CrossRef] [Scilit] [PubMed]
- Al-Majed, N.; Mohammadi, H.; Al-Ghadban, A.; Al-Awadi, A.R. Regional Report of the State of the Marine Environment; Regional Organization for the Protection of the Environment: Sulaibikhat, Kuwait, 2000. [Google Scholar]
- UNEP Regional Office for Asia. Environmental Impact Assessment: Basic Procedures for Developing Countries; Regional Office for Asia and the Pacific: Bangkok, Thailand, 1988. [Google Scholar]
- Dahab, O.A.; Al-Madfa, H. Oil Pollution in Qatari Coastal Sediments. Environ. Pollut. 1993, 81, 113–116. [Google Scholar] [CrossRef] [Scilit]
- Al-Arfaj, A.A.; Alam, I.A. Chemical Characterization of Sediments from the Gulf Area after the 1991 Oil Spill. Mar. Pollut. Bull. 1993, 27, 97–101. [Google Scholar] [CrossRef] [Scilit]
- Burt, J.A.; Ben-Hamadou, R.; Abdel-Moati, M.A.R.; Fanning, L.; Kaitibie, S.; Al-Jamali, F.; Range, P.; Saeed, S.; Warren, C.S. Improving Management of Future Coastal Development in Qatar through Ecosystem-Based Management Approaches. Ocean Coast. Manag. 2017, 148, 171–181. [Google Scholar] [CrossRef] [Scilit]
- Palit, K.; Rath, S.; Chatterjee, S.; Das, S. Microbial Diversity and Ecological Interactions of Microorganisms in the Mangrove Ecosystem: Threats, Vulnerability, and Adaptations. Environ. Sci. Pollut. Res. 2022, 29, 32467–32512. [Google Scholar] [CrossRef] [Scilit] [PubMed]
- Mai, Z.; Ye, M.; Wang, Y.; Foong, S.Y.; Wang, L.; Sun, F.; Cheng, H. Characteristics of Microbial Community and Function with the Succession of Mangroves. Front. Microbiol. 2021, 12, 764974. [Google Scholar] [CrossRef] [Scilit]
- Sundaramanickam, A.; Nithin, A.; Balasubramanian, T. Role of Mangroves in Pollution Abatement. In Mangroves: Ecology, Biodiversity and Management; Rastogi, R.P., Phulwaria, M., Gupta, D.K., Eds.; Springer: Singapore, 2021; pp. 257–278. ISBN 978-981-16-2494-0. [Google Scholar]
- Agarwal, P.; Vibhandik, R.; Agrahari, R.; Daverey, A.; Rani, R. Role of Root Exudates on the Soil Microbial Diversity and Biogeochemistry of Heavy Metals. Appl. Biochem. Biotechnol. 2024, 196, 2673–2693. [Google Scholar] [CrossRef] [Scilit]
- Siddique, A.; Disi, Z.A.; AlGhouti, M.; Zouari, N. Diversity of Hydrocarbon-Degrading Bacteria in Mangroves Rhizosphere as an Indicator of Oil-Pollution Bioremediation in Mangrove Forests. Mar. Pollut. Bull. 2024, 205, 116620. [Google Scholar] [CrossRef] [Scilit] [PubMed]
- Das, N.; Das, A.; Das, S.; Bhatawadekar, V.; Pandey, P.; Choure, K.; Damare, S.; Pandey, P. Petroleum Hydrocarbon Catabolic Pathways as Targets for Metabolic Engineering Strategies for Enhanced Bioremediation of Crude-Oil-Contaminated Environments. Fermentation 2023, 9, 196. [Google Scholar] [CrossRef] [Scilit]
- Ali Khan, A.H.; Tanveer, S.; Alia, S.; Anees, M.; Sultan, A.; Iqbal, M.; Yousaf, S. Role of Nutrients in Bacterial Biosurfactant Production and Effect of Biosurfactant Production on Petroleum Hydrocarbon Biodegradation. Ecol. Eng. 2017, 104, 158–164. [Google Scholar] [CrossRef] [Scilit]
- Sandrin, T.R.; Goldstein, J.E.; Schumaker, S. MALDI TOF MS Profiling of Bacteria at the Strain Level: A Review. Mass. Spectrom. Rev. 2013, 32, 188–217. [Google Scholar] [CrossRef] [Scilit]
- Šebela, M. Biomolecular Profiling by MALDI-TOF Mass Spectrometry in Food and Beverage Analyses. Int. J. Mol. Sci. 2022, 23, 13631. [Google Scholar] [CrossRef] [Scilit]
- Avanzi, I.R.; Gracioso, L.H.; Baltazar, M.d.P.G.; Karolski, B.; Perpetuo, E.A.; do Nascimento, C.A.O. Rapid Bacteria Identification from Environmental Mining Samples Using MALDI-TOF MS Analysis. Environ. Sci. Pollut. Res. 2017, 24, 3717–3726. [Google Scholar] [CrossRef] [Scilit]
- Al-Shamary, N.; Hassan, H.; Leitão, A.; Hutchinson, S.M.; Mondal, D.; Bayen, S. Baseline Distribution of Petroleum Hydrocarbon Contamination in the Marine Environment around the Coastline of Qatar. Mar. Pollut. Bull. 2023, 188, 114655. [Google Scholar] [CrossRef] [Scilit]
- Attar, A.; Jaoua, S.; Ahmed, T.; Al Disi, Z.; Zouari, N. Evidencing the Diversity and Needs of Adjustment of the Nutritional Requirements for Hydrocarbon-Degrading Activity of Pseudomonas aeruginosa Adapted to Harsh Conditions Using 2 Full Factorial Design. RSC Adv. 2017, 7, 45920–45931. [Google Scholar] [CrossRef] [Scilit]
- Eldos, H.I.; Zouari, N.; Saeed, S.; Ashfaq, M.Y.M.; Al-Ghouti, M.A. Isolation, Identification, and Characterization of Potential Biosurfactant-Producing Bacteria from Processing Wastewater for the Development of Eco-Friendly Green Technology. Bioresour. Technol. Rep. 2024, 25, 101763. [Google Scholar] [CrossRef] [Scilit]
- Topić Popović, N.; Kazazić, S.P.; Bojanić, K.; Strunjak-Perović, I.; Čož-Rakovac, R. Sample Preparation and Culture Condition Effects on MALDI-TOF MS Identification of Bacteria: A Review. Mass. Spectrom. Rev. 2023, 42, 1589–1603. [Google Scholar] [CrossRef] [Scilit]
- Ashfaq, M.Y.; Da’na, D.A.; Al-Ghouti, M.A. Application of MALDI-TOF MS for Identification of Environmental Bacteria: A Review. J. Environ. Manag. 2022, 305, 114359. [Google Scholar] [CrossRef] [Scilit]
- Al Disi, Z.; Al-Ghouti, M.A.; Zouari, N. Investigating the Simultaneous Removal of Hydrocarbons and Heavy Metals by Highly Adapted Bacillus and Pseudomonas Strains. Environ. Technol. Innov. 2022, 27, 102513. [Google Scholar] [CrossRef] [Scilit]
- Yousefi, M.; Al Disi, Z.A.; Ashfaq, M.Y.; Zouari, N. Diversity of Hydrocarbon-Degrading Bacteria Isolated from the Rhizosphere of Mangrove Forests in Two Coastal Regions of Qatar. Mar. Environ. Res. 2025, 211, 107442. [Google Scholar] [CrossRef] [Scilit] [PubMed]
- Gibb, S.; Strimmer, K. MALDIquant: A Versatile R Package for the Analysis of Mass Spectrometry Data. Bioinformatics 2012, 28, 2270–2271. [Google Scholar] [CrossRef] [Scilit]
- Greenacre, M.; Groenen, P.J.; Hastie, T.; d’Enza, A.I.; Markos, A.; Tuzhilina, E. Principal Component Analysis. Nat. Rev. Methods Primers 2022, 2, 100. [Google Scholar]
- Tue, N.T.; Nguyen, P.T.; Quan, D.M.; Dung, L.V.; Quy, T.D.; Nhuan, M.T.; Thai, N.D. Sedimentary Composition and Organic Carbon Sources in Mangrove Forests along the Coast of Northeast Vietnam. Reg. Stud. Mar. Sci. 2018, 17, 87–94. [Google Scholar] [CrossRef] [Scilit]
- Kuzyakov, Y. Priming Effects: Interactions between Living and Dead Organic Matter. Soil Biol. Biochem. 2010, 42, 1363–1371. [Google Scholar] [CrossRef] [Scilit]
- Baran, A.; Tarnawski, M.; Urbański, K.; Klimkowicz-Pawlas, A.; Spałek, I. Concentration, Sources and Risk Assessment of PAHs in Bottom Sediments. Environ. Sci. Pollut. Res. 2017, 24, 23180–23195. [Google Scholar] [CrossRef] [Scilit]
- Li, Y.-H.; Schoonmaker, J. Chemical Composition and Mineralogy of Marine Sediments; University of Hawaii: Honolulu, HI, USA, 2003; pp. 1–35. [Google Scholar]
- Weih, M.; Hamnér, K.; Pourazari, F. Analyzing Plant Nutrient Uptake and Utilization Efficiencies: Comparison between Crops and Approaches. Plant Soil 2018, 430, 7–21. [Google Scholar] [CrossRef] [Scilit]
- Trannum, H.C.; Olsgard, F.; Skei, J.M.; Indrehus, J.; Øverås, S.; Eriksen, J. Effects of Copper, Cadmium and Contaminated Harbour Sediments on Recolonisation of Soft-Bottom Communities. J. Exp. Mar. Biol. Ecol. 2004, 310, 87–114. [Google Scholar] [CrossRef] [Scilit]
- Korenblum, E.; Massalha, H.; Aharoni, A. Plant–Microbe Interactions in the Rhizosphere via a Circular Metabolic Economy. Plant Cell 2022, 34, 3168–3182. [Google Scholar] [CrossRef] [Scilit]
- Vishnyakov, A. Vanadium and Nickel Recovery from the Products of Heavy Petroleum Feedstock Processing: A Review. Metals 2023, 13, 1031. [Google Scholar] [CrossRef] [Scilit]
- Adomako, D.; Nyarko, B.J.B.; Dampare, S.B.; Serfor-Armah, Y.; Osae, S.; Fianko, J.R.; Akaho, E.H.K. Determination of Toxic Elements in Waters and Sediments from River Subin in the Ashanti Region of Ghana. Environ. Monit. Assess. 2008, 141, 165–175. [Google Scholar] [CrossRef] [Scilit] [PubMed]
- Lyman, W.J.; Glazer, A.E.; Ong, J.H.; Coons, S.F. Overview of Sediment Quality in the United States. Final Report; Little (Arthur D.), Inc.: Cambridge, MA, USA, 1987. [Google Scholar]
- MacDonald, D.D.; Ingersoll, C.G.; Smorong, D.E.; Lindskoog, R.A.; Sloane, G.; Biernacki, T. Development and Evaluation of Numerical Sediment Quality Assessment Guidelines for Florida Inland Waters; Florida Department of Environmental Protection: Tallahassee, FL, USA, 2003.
- Hammoumi, D.; Al-Aizari, H.S.; Alaraidh, I.A.; Okla, M.K.; Assal, M.E.; Al-Aizari, A.R.; Moshab, M.S.; Chakiri, S.; Bejjaji, Z. Seasonal Variations and Assessment of Surface Water Quality Using Water Quality Index (WQI) and Principal Component Analysis (PCA): A Case Study. Sustainability 2024, 16, 5644. [Google Scholar] [CrossRef] [Scilit]
- Mueller, C.W.; Baumert, V.; Carminati, A.; Germon, A.; Holz, M.; Kögel-Knabner, I.; Peth, S.; Schlüter, S.; Uteau, D.; Vetterlein, D.; et al. From Rhizosphere to Detritusphere—Soil Structure Formation Driven by Plant Roots and the Interactions with Soil Biota. Soil Biol. Biochem. 2024, 193, 109396. [Google Scholar] [CrossRef] [Scilit]
- Guo, H.; Li, X.; Xiu, W.; He, W.; Cao, Y.; Zhang, D.; Wang, A. Controls of Organic Matter Bioreactivity on Arsenic Mobility in Shallow Aquifers of the Hetao Basin, P.R. China. J. Hydrol. 2019, 571, 448–459. [Google Scholar] [CrossRef] [Scilit]
- Verbeeck, M.; Thiry, Y.; Smolders, E. Soil Organic Matter Affects Arsenic and Antimony Sorption in Anaerobic Soils. Environ. Pollut. 2020, 257, 113566. [Google Scholar] [CrossRef] [Scilit] [PubMed]
- Lingegowda, D.C.D.; Kumar, J.K.; Prasad, A.G.D.; Zarei, M.; Gopal, S. FTIR spectroscopic studies on cleome gynandra—Comparative analysis of functional group before and after extraction. Rom. J. Biophys. 2012, 22, 137–143. [Google Scholar]
- Al Lafi, A.G. FTIR Spectroscopic Analysis of Ion Irradiated Poly (Ether Ether Ketone). Polym. Degrad. Stab. 2014, 105, 122–133. [Google Scholar] [CrossRef] [Scilit]
- Ashtarinezhad, A.; Panahyab, A.; Mohamadzadehasl, B.; Vatanpour, H.; Shirazi, F.H. FTIR Microspectroscopy Reveals Chemical Changes in Mice Fetus Following Phenobarbital Administration. Iran. J. Pharm. Res. 2015, 14, 121–130. [Google Scholar]
- Stuart, B.H. Infrared Spectroscopy: Fundamentals and Applications; John Wiley & Sons: Hoboken, NJ, USA, 2004; ISBN 978-0-470-01113-3. [Google Scholar]
- Siddique, A.; Disi, Z.A.; Al-Ghouti, M.A.; Zouari, N. Role of Mineral-Forming Bacteria in Mangrove Rhizosphere in Enhancing Coastal Soil Stability, Carbon Sequestration, and Heavy Metals Removal. Earth-Sci. Rev. 2025, 266, 105151. [Google Scholar] [CrossRef] [Scilit]
- Podstawka, E.; Kafarski, P.; Proniewicz, L.M. Effect of an Aliphatic Spacer Group on the Adsorption Mechanism on the Colloidal Silver Surface of L-Proline Phosphonodipeptides. J. Raman Spectrosc. 2008, 39, 1726–1739. [Google Scholar] [CrossRef] [Scilit]
- Ku, S.; Mun, S.P. Characterization of Pyrolysis Tar Derived from Lignocellulosic Biomass. J. Ind. Eng. Chem. 2006, 12, 853–861. [Google Scholar]
- Amir, R.M.; Anjum, F.M.; Khan, M.I.; Khan, M.R.; Pasha, I.; Nadeem, M. Application of Fourier Transform Infrared (FTIR) Spectroscopy for the Identification of Wheat Varieties. J. Food Sci. Technol. 2013, 50, 1018–1023. [Google Scholar] [CrossRef] [Scilit]
- Rozenberg, M.; Jung, C.; Shoham, G. Low Temperature FTIR Spectra and Hydrogen Bonds in Polycrystalline Cytidine. Spectrochim. Acta Part A Mol. Biomol. Spectrosc. 2004, 60, 2369–2375. [Google Scholar] [CrossRef] [Scilit] [PubMed]
- Guo, L.; Sato, H.; Hashimoto, T.; Ozaki, Y. FTIR Study on Hydrogen-Bonding Interactions in Biodegradable Polymer Blends of Poly(3-Hydroxybutyrate) and Poly(4-Vinylphenol). Macromolecules 2010, 43, 3897–3902. [Google Scholar] [CrossRef] [Scilit]
- Hernández-Santana, A.; Dussán, J. Lysinibacillus sphaericus Proved to Have Potential for the Remediation of Petroleum Hydrocarbons. Soil Sediment. Contam. Int. J. 2018, 27, 538–549. [Google Scholar] [CrossRef] [Scilit]
- Sadeghian fard Boroojeni, S.; Motamedi, H. Screening Oil Tank Bottom Sludge Microbial Community for Identification of Native Efficient Hydrocarbon-Degrading Bacteria for Bioremediation Purposes. Int. J. Environ. Sci. Technol. 2024, 22, 375–386. [Google Scholar] [CrossRef] [Scilit]
- Singh, P.; Tiwary, B.N. Optimization of Conditions for Polycyclic Aromatic Hydrocarbons (PAHs) Degradation by Pseudomonas stutzeri P2 Isolated from Chirimiri Coal Mines. Biocatal. Agric. Biotechnol. 2017, 10, 20–29. [Google Scholar] [CrossRef] [Scilit]
- Abubakar, A.; Abioye, O.P.; Aransiola, S.A.; Maddela, N.R.; Prasad, R. Crude Oil Biodegradation Potential of Lipase Produced by Bacillus subtilis and Pseudomonas aeruginosa Isolated from Hydrocarbon Contaminated Soil. Environ. Chem. Ecotoxicol. 2024, 6, 26–32. [Google Scholar] [CrossRef] [Scilit]
- Ho, M.T.; Li, M.S.M.; McDowell, T.; MacDonald, J.; Yuan, Z.-C. Characterization and Genomic Analysis of a Diesel-Degrading Bacterium, Acinetobacter Calcoaceticus CA16, Isolated from Canadian Soil. BMC Biotechnol. 2020, 20, 39. [Google Scholar] [CrossRef] [Scilit]
- Nwinyi, O.C.; Amund, O.O. Biodegradation of Selected Polycyclic Aromatic Hydrocarbons by Axenic Bacterial Species Belonging to the Genera Lysinibacillus and Paenibacillus. Iran. J. Sci. Technol. Trans. Sci. 2017, 41, 577–587. [Google Scholar] [CrossRef] [Scilit]
- Ahsan, N.; Marian, M.; Suga, H.; Shimizu, M. Lysinibacillus xylanilyticus Strain GIC41 as a Potential Plant Biostimulant. Microb. Environ. 2021, 36, ME21047. [Google Scholar] [CrossRef] [Scilit]
- Esmaeili, A.; Pourbabaee, A.A.; Alikhani, H.A.; Shabani, F.; Esmaeili, E. Biodegradation of Low-Density Polyethylene (LDPE) by Mixed Culture of Lysinibacillus xylanilyticus and Aspergillus Niger in Soil. PLoS ONE 2013, 8, e71720. [Google Scholar] [CrossRef] [Scilit]
- Hossain, M.S.; Paul, G.K.; Mahmud, S.; Saleh, M.A.; Uddin, M.S.; Dutta, A.K.; Roy, A.K.; Saha, A.K.; Sheam, M.M.; Ahmed, S.; et al. Mixed Dye Degradation by Bacillus pseudomycoides and Acinetobacter haemolyticus Isolated from Industrial Effluents: A Combined Affirmation with Wetlab and in Silico Studies. Arab. J. Chem. 2022, 15, 104078. [Google Scholar] [CrossRef] [Scilit]
- Rahmatullah, R.; Anwar, S.; Yani, M.; Firlandiana, M. Efficiency of Bacillus pseudomycoides RAY21 and Bacillus subtilis CYA27 Endospore Formulation on Biochar and Oil Spill Dispersant. HAYATI J. Biosci. 2025, 32, 374–386. [Google Scholar] [CrossRef] [Scilit]
- Prober, S.M.; Leff, J.W.; Bates, S.T.; Borer, E.T.; Firn, J.; Harpole, W.S.; Lind, E.M.; Seabloom, E.W.; Adler, P.B.; Bakker, J.D.; et al. Plant Diversity Predicts Beta but Not Alpha Diversity of Soil Microbes across Grasslands Worldwide. Ecol. Lett. 2015, 18, 85–95. [Google Scholar] [CrossRef] [Scilit] [PubMed]
- Sasse, J.; Martinoia, E.; Northen, T. Feed Your Friends: Do Plant Exudates Shape the Root Microbiome? Trends Plant Sci. 2018, 23, 25–41. [Google Scholar] [CrossRef] [Scilit] [PubMed]
- Schultz, J.; Rosado, A.S. Extreme Environments: A Source of Biosurfactants for Biotechnological Applications. Extremophiles 2020, 24, 189–206. [Google Scholar] [CrossRef] [Scilit]
- Scornavacca, C.; Zickmann, F.; Huson, D.H. Tanglegrams for Rooted Phylogenetic Trees and Networks. Bioinformatics 2011, 27, i248–i256. [Google Scholar] [CrossRef] [Scilit]
- Yuan, L.; Zhang, B.; Dai, H.; Miao, Y.; Xu, Z.; Yang, Z.; Jiao, X. Starvation-Induced Metabolic Adaptation of Bacillus cereus during Biofilm Formation: Phenotypic Characterization and Proteomic Analysis. Food Res. Int. 2025, 220, 117167. [Google Scholar] [CrossRef] [Scilit]
- Ramos, J.L.; Gallegos, M.-T.; Marqués, S.; Ramos-González, M.-I.; Espinosa-Urgel, M.; Segura, A. Responses of Gram-Negative Bacteria to Certain Environmental Stressors. Curr. Opin. Microbiol. 2001, 4, 166–171. [Google Scholar] [CrossRef] [Scilit]
- Liew, S.M.; Puthucheary, S.D.; Rajasekaram, G.; Chai, H.C.; Chua, K.H. Proteomic Profiling of Clinical and Environmental Strains of Pseudomonas aeruginosa. Mol. Biol. Rep. 2021, 48, 2325–2333. [Google Scholar] [CrossRef] [Scilit] [PubMed]
- Carlin, F.; Brillard, J.; Broussolle, V.; Clavel, T.; Duport, C.; Jobin, M.; Guinebretière, M.-H.; Auger, S.; Sorokine, A.; Nguyen-Thé, C. Adaptation of Bacillus cereus, an Ubiquitous Worldwide-Distributed Foodborne Pathogen, to a Changing Environment. Food Res. Int. 2010, 43, 1885–1894. [Google Scholar] [CrossRef] [Scilit]
- Bonilla, C.Y. Generally Stressed Out Bacteria: Environmental Stress Response Mechanisms in Gram-Positive Bacteria. Integr. Comp. Biol. 2020, 60, 126–133. [Google Scholar] [CrossRef] [Scilit] [PubMed]
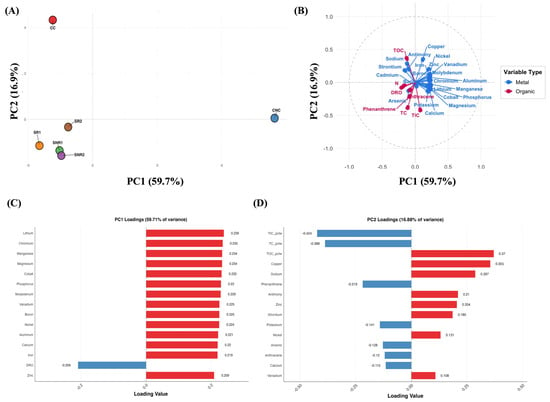
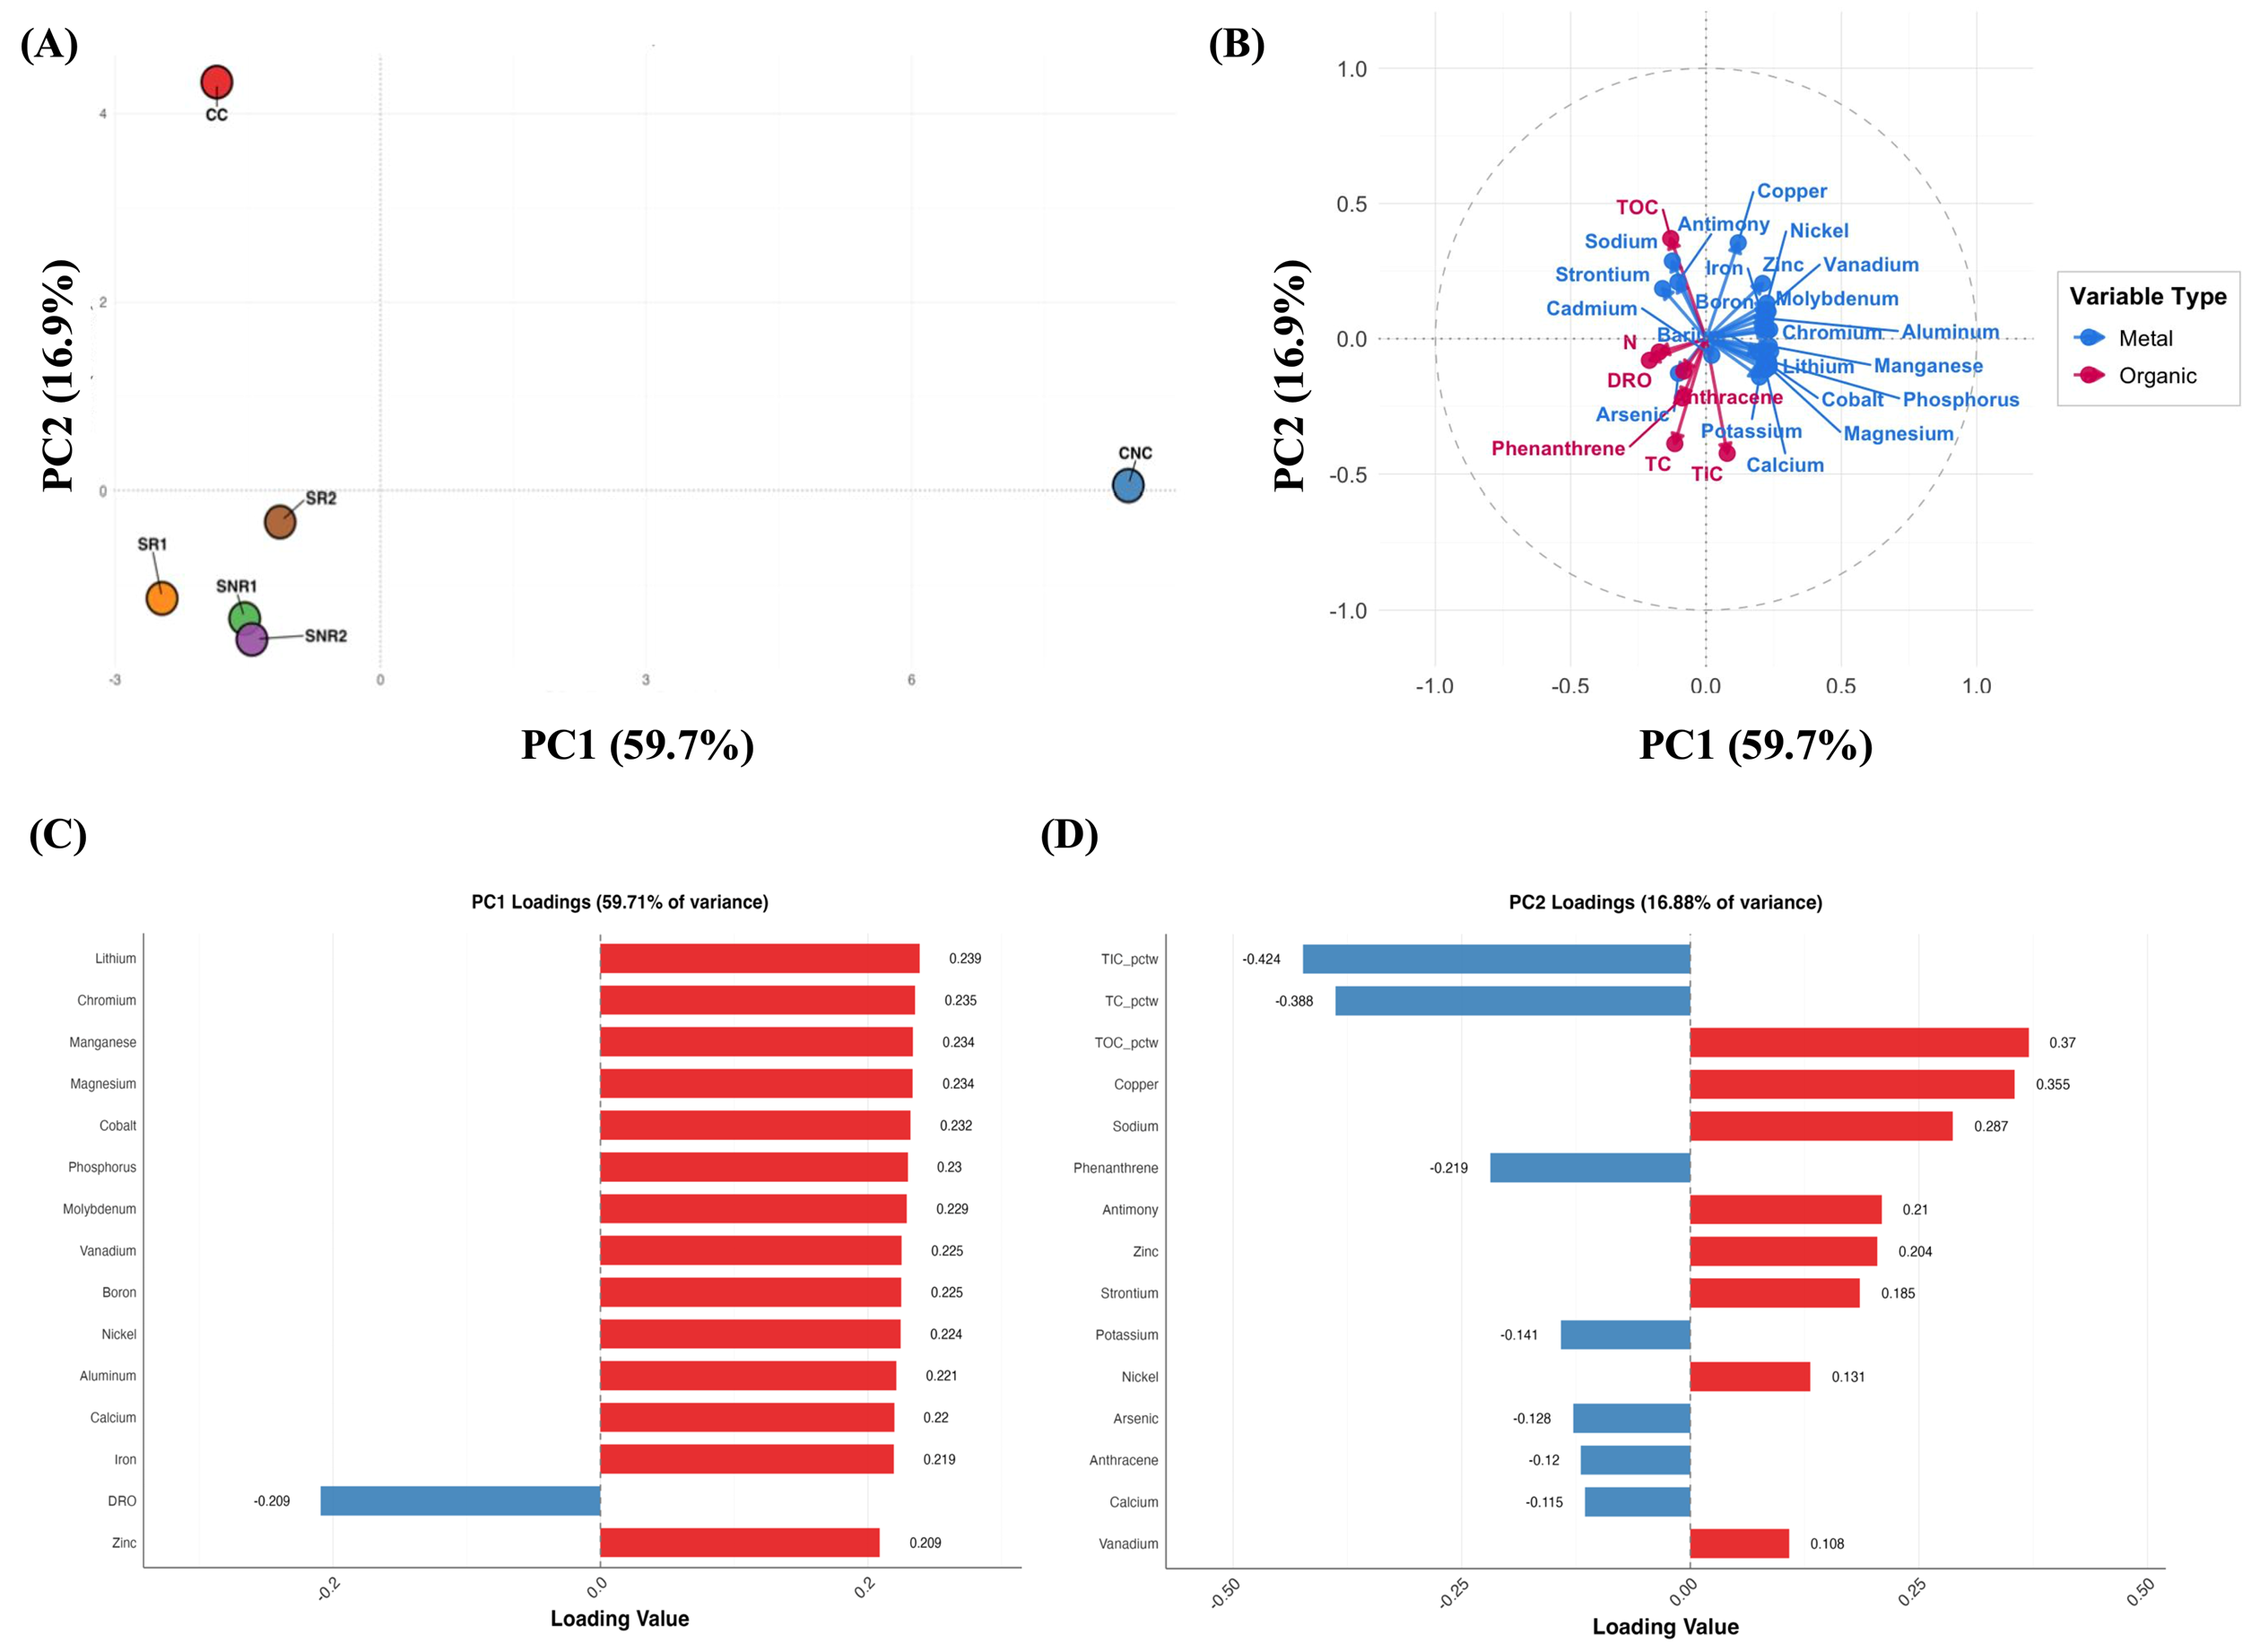
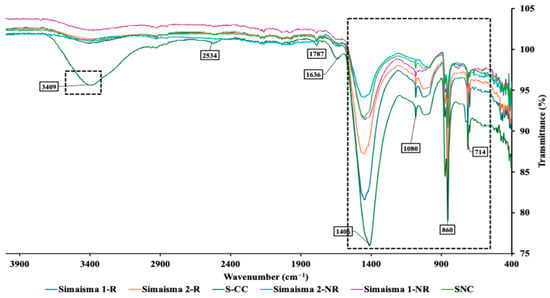
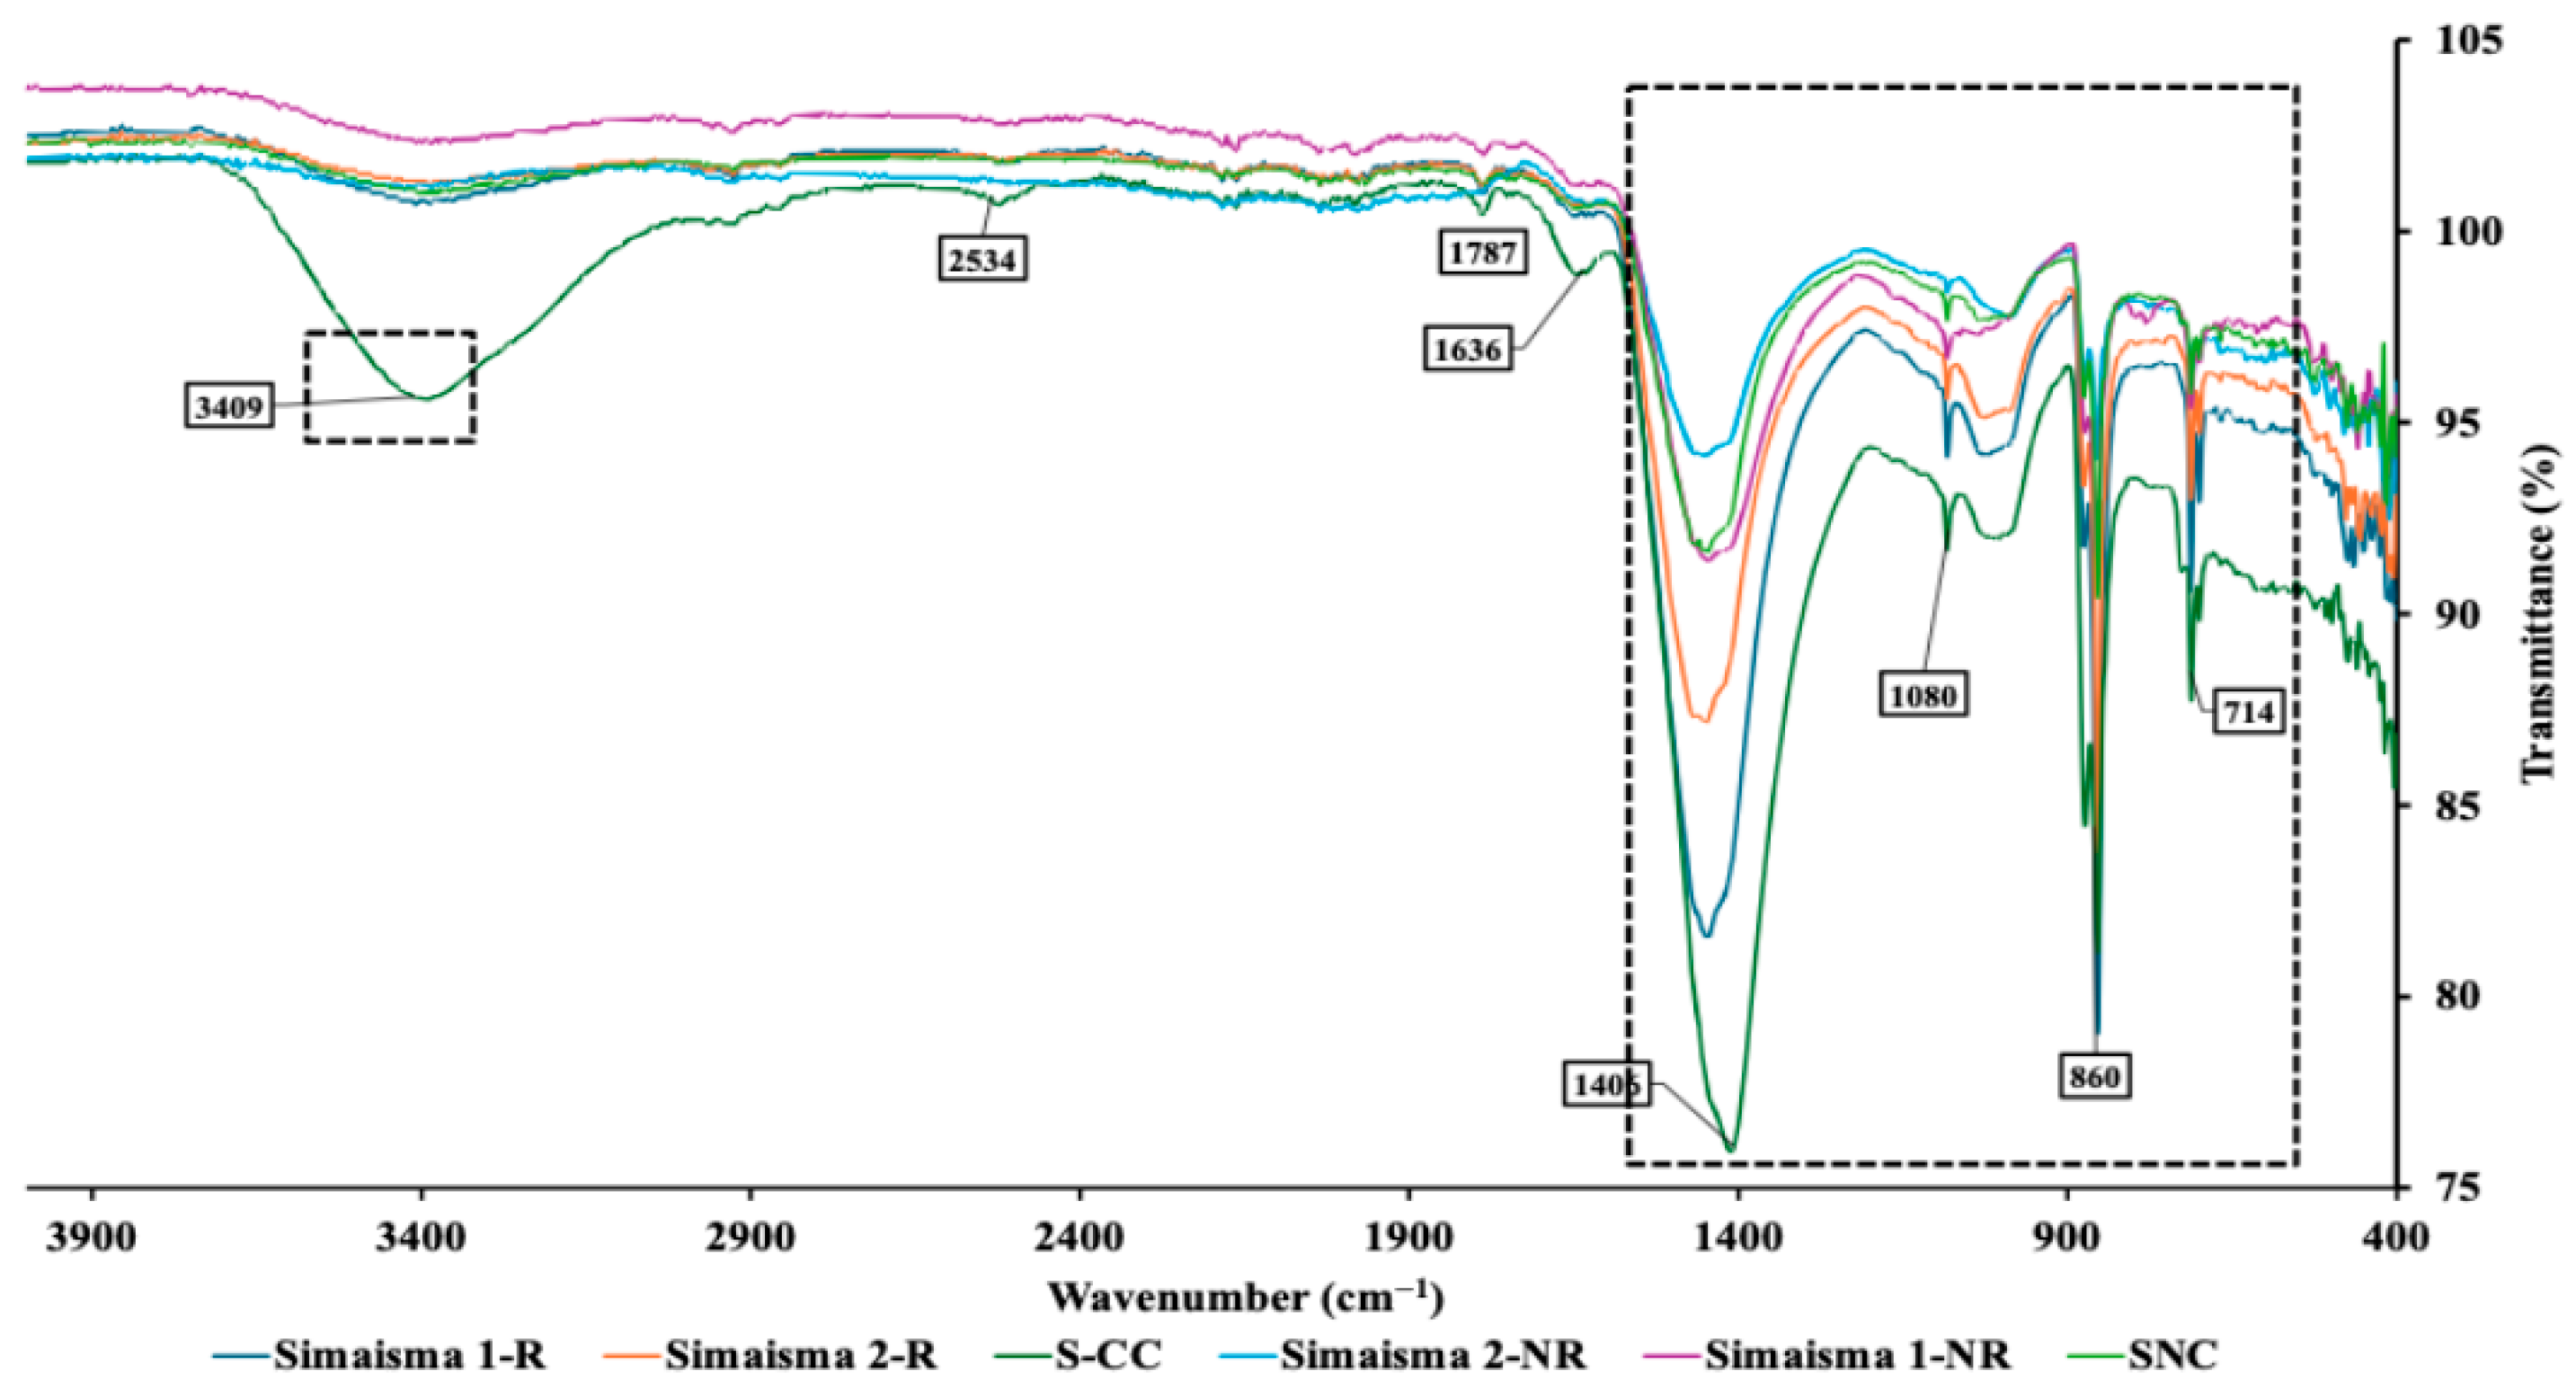
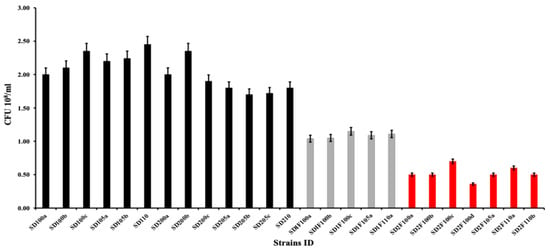
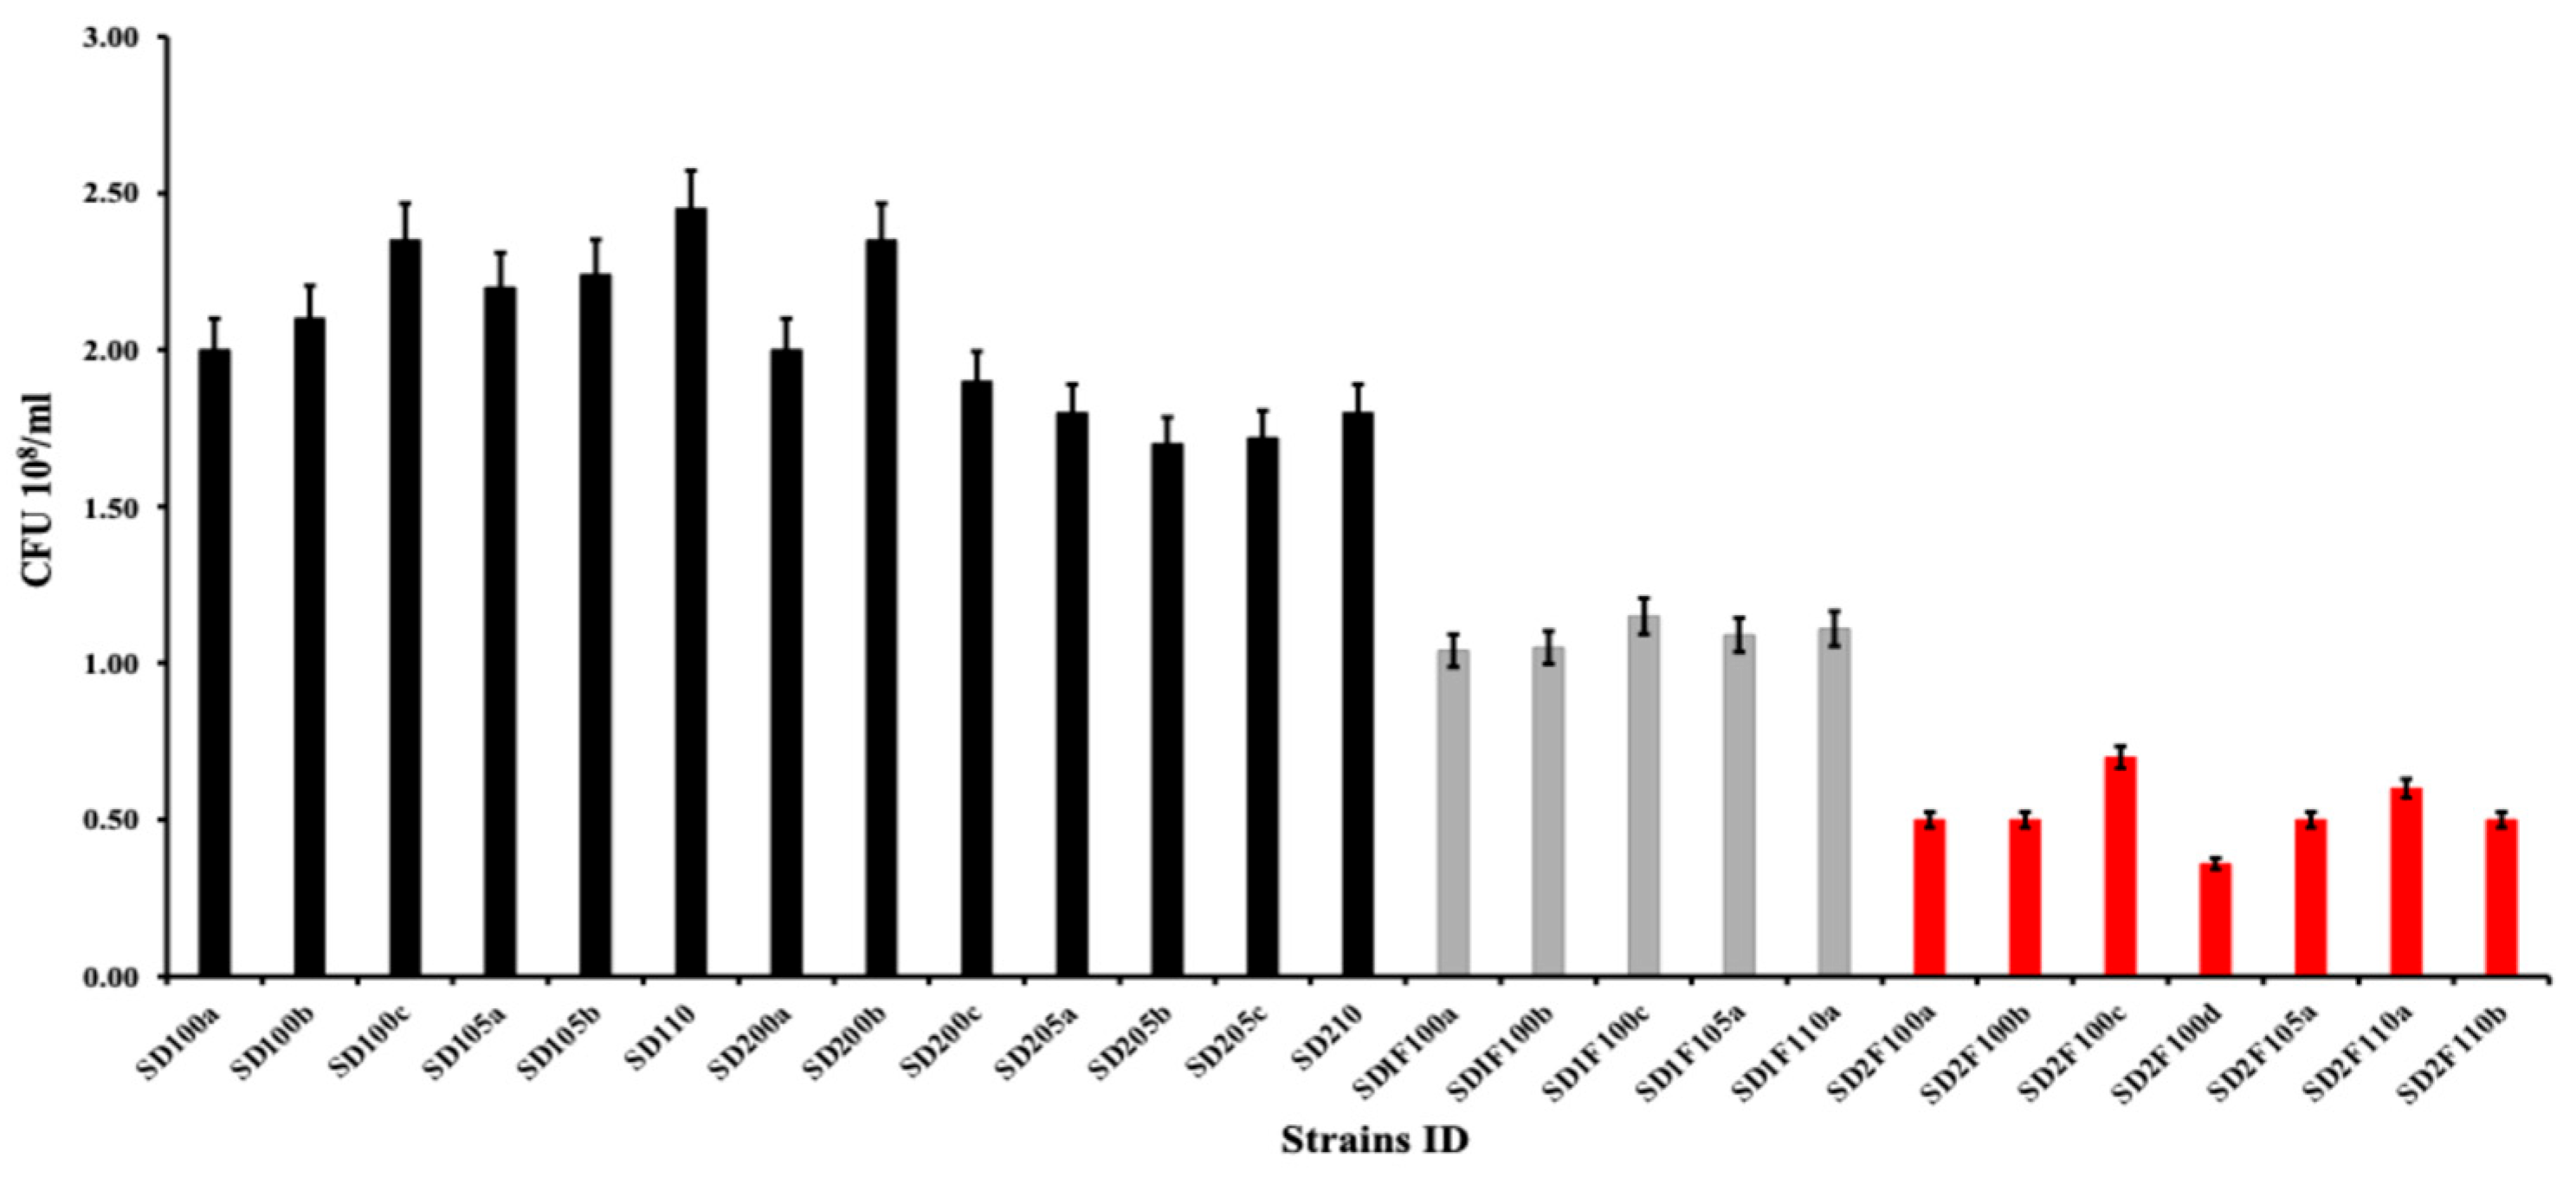
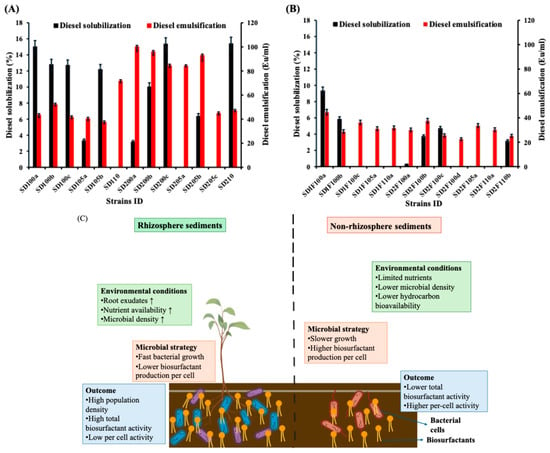
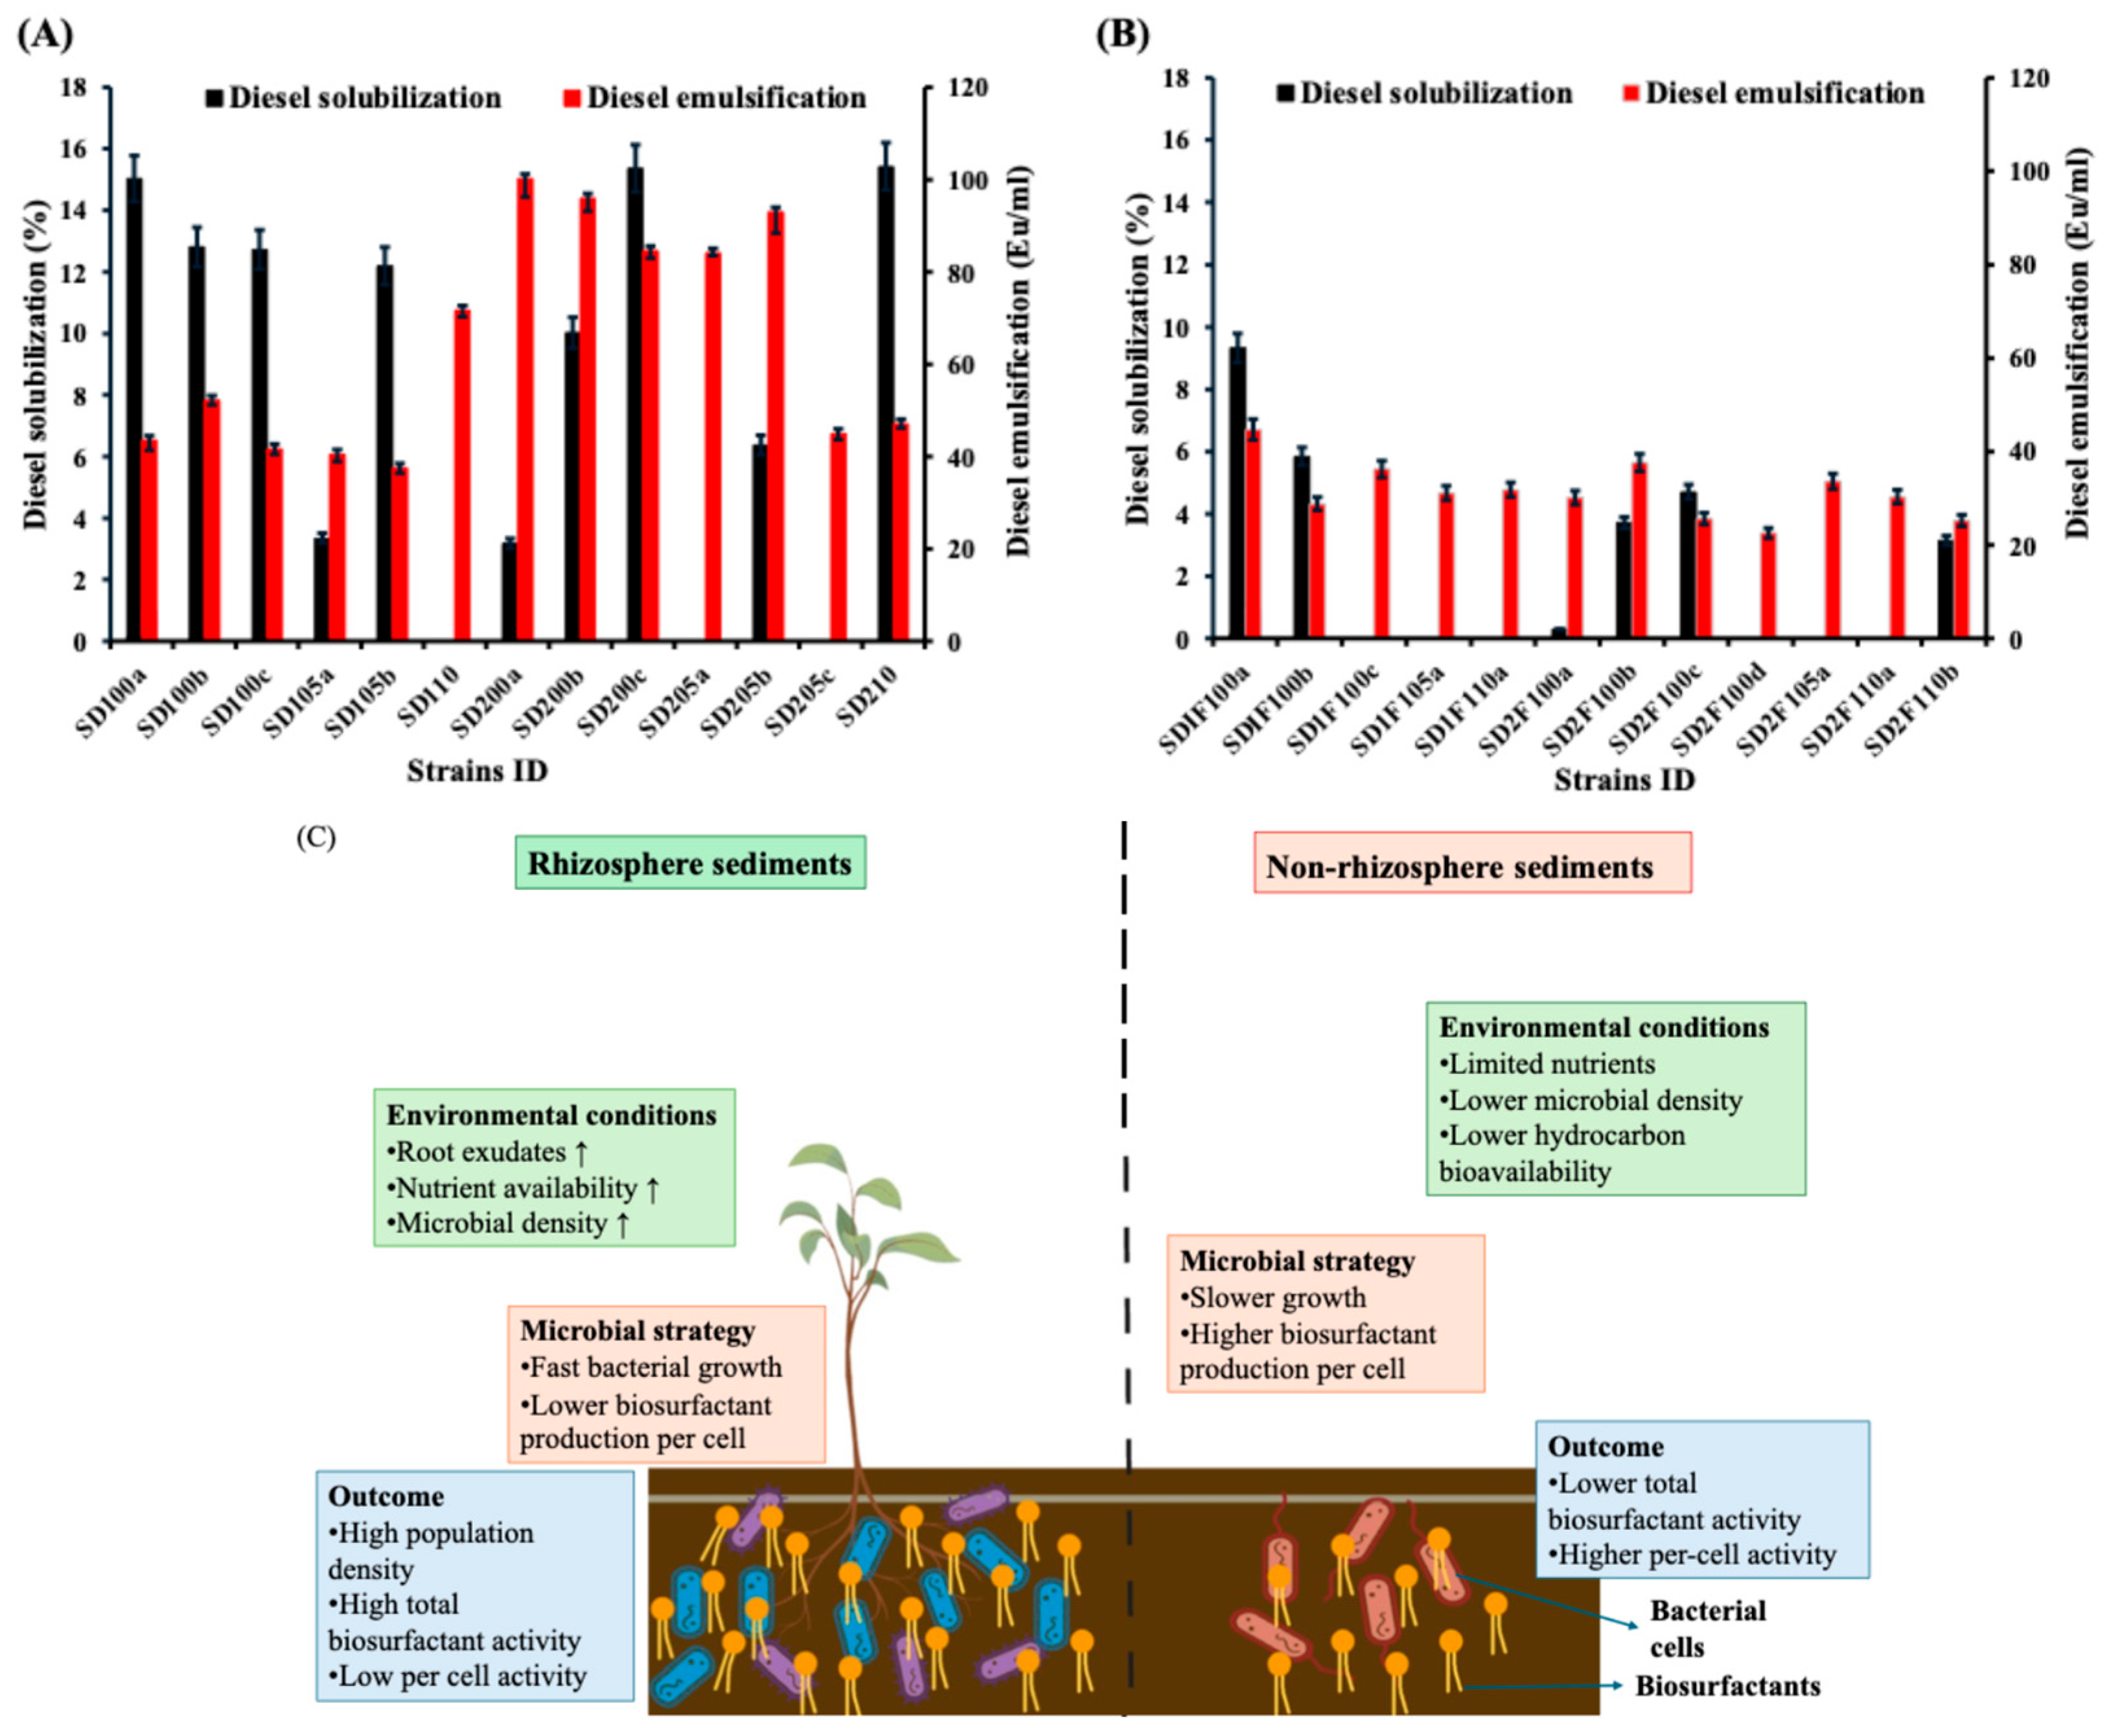
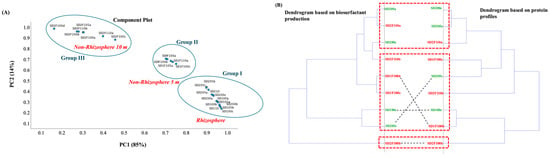
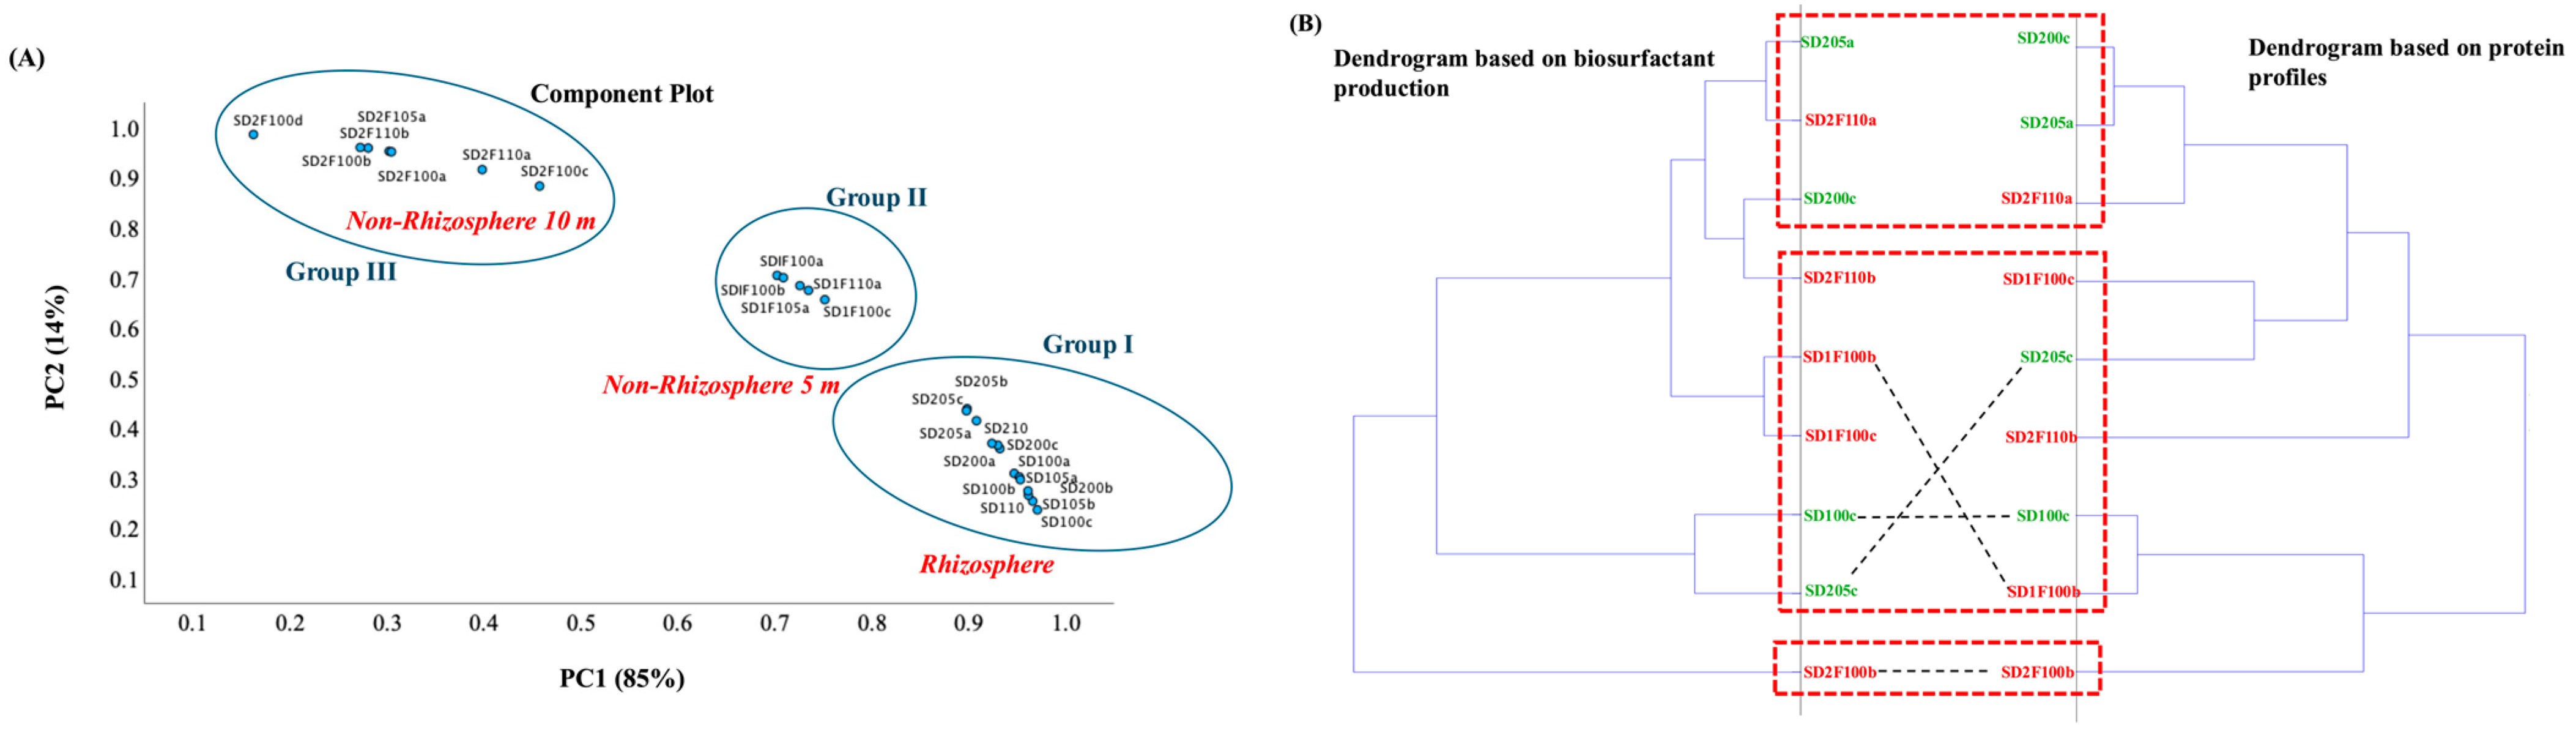

Disclaimer/Publisher’s Note: The statements, opinions and data contained in all publications are solely those of the individual author(s) and contributor(s) and not of MDPI and/or the editor(s). MDPI and/or the editor(s) disclaim responsibility for any injury to people or property resulting from any ideas, methods, instructions or products referred to in the content. |
© 2026 by the authors. Licensee MDPI, Basel, Switzerland. This article is an open access article distributed under the terms and conditions of the Creative Commons Attribution (CC BY) license.