


Abstract
Rapid urbanization in plateau mountain regions exacerbates the tension between rigid resource demands and fragile ecological carrying capacities. Enhancing the resilience of the Water–Energy–Food (W–E–F) nexus is therefore essential for coping with external shocks. This study constructs a multidimensional resilience evaluation framework based on the Pressure-State-Response (PSR) model, taking the Kunming Metropolitan Area—a typical plateau mountain region—as a case study. Integrating the TOPSIS model, Coupling Coordination Degree (CCD) model, and spatial autocorrelation analysis, we systematically assessed both individual subsystem and comprehensive W–E–F nexus resilience from 2005 to 2020. Results show that W–E–F nexus resilience generally improved from 2005 to 2020, but subsystem development remained uneven across space, with water resilience characterized by a peripheral-high/central-low pattern, energy resilience by a core-high/periphery-low structure, and food resilience by the strongest spatial heterogeneity and volatility. By 2020, the mean comprehensive resilience reached 0.67, with 58.3% of counties above the average, exhibiting significant spatial clustering. Based on resilience levels and limiting subsystems of 2020, the metropolitan area was classified into Enhancement, Adjustment, and Maintenance zones, comprising 6, 16, and 2 counties respectively, to support differentiated regional governance. This study provides a spatially explicit regulation paradigm to bolster urban resilience against resource constraints and climate uncertainty.
1. Introduction
The Water–Energy–Food (W–E–F) nexus has emerged as a critical concept in sustainable development, designed to unravel the non-linear coupling characteristics and cross-scale association mechanisms among these key resource systems [1,2,3]. Since the W–E–F nexus was first proposed at the Bonn Conference in 2011, it has been recognized globally as a pivotal non-traditional security challenge, intrinsically linked to the United Nations Sustainable Development Goals (SDGs) (e.g., Zero Hunger SDG 2, Clean Water and Sanitation SDG 6, Affordable and Clean Energy SDG 7) [3,4]. Examining these interactive relationships reveals a dual dynamic. On one hand, the synergistic effects, where energy powers water extraction and food production while food security underpins system stability, serve as the cornerstone for enhancing system functionality. Conversely, with the increasing frequency of extreme climate events, the impact of sudden public health crises (such as the COVID-19 pandemic), and disorderly urban expansion, resource competition is exacerbating supply–demand imbalances and functional conflicts, potentially leading to the co-degradation of the entire system. Consequently, the vulnerability and resilience levels of the W–E–F nexus have become key variables determining regional sustainable development capacity [2,5,6,7]. Enhancing the resilience of the urban and regional W–E–F nexus has thus become a critical pathway for coping with uncertain disturbances and mitigating external shocks [5,8,9]. Against the backdrop of increasingly severe resource constraints, cities urgently require a strategic transformation from solely pursuing resource utilization efficiency to enhancing system resilience.
Resilience refers to a system’s capacity to maintain core functions, rapidly recover, and undergo structural adaptation when subjected to external shocks [10]. Specific to the W–E–F nexus, the core objective is to transition from coordinated development to resilience enhancement. This requires not only improving the independent resilience of each subsystem but also optimizing their coupling relationships to synergistically elevate the comprehensive resilience of both the subsystems and the overall nexus [6,7,9,11]. Existing research has explored the efficiency assessment and coordinated evolution of the W–E–F nexus across global [12], national [13], urban agglomeration [8], provincial [14], and watershed [15] scales, utilizing methods such as input–output analysis [16], system dynamics [17], and multi-objective optimization [18]. However, two major gaps remain. First, most studies emphasize temporal dynamics or aggregate performance, while insufficiently addressing the spatial heterogeneity of W–E–F resilience. Because resilience is shaped by geographically uneven resource endowments, risk exposure, coupling vulnerabilities, and adaptive capacities, assessments that do not explicitly account for spatial differences cannot identify where the nexus is most fragile, where adaptive capacity is strongest, or where intervention should be prioritized. Second, although resilience offers a more policy-relevant perspective than traditional efficiency-based approaches, it has seldom been translated into actionable territorial governance tools. As a result, existing research provides limited guidance for converting resilience assessment into differentiated regulatory strategies. This gap directly underscores the need for policy-oriented spatial zoning: if W–E–F resilience varies across regions, then governance must also be spatially differentiated. In China, although the county level is an appropriate scale for implementing differentiated management goals and precise regional governance [19,20], county-based studies remain relatively limited in the W–E–F nexus literature, especially compared with analyses at the provincial or prefectural levels. Furthermore, analyzing resilience from a geospatial perspective reveals its spatial distribution and agglomeration characteristics, which can better guide the regulation of multi-level administrative units. Therefore, there is an urgent need to construct policy-oriented research based on geographical zoning and regulatory frameworks, particularly within the collaborative governance structures of urban agglomerations.
Compared with other mountainous urban agglomerations globally, the Kunming Metropolitan Area—a typical plateau mountain ecologically fragile zone—possesses an ecosystem far more sensitive to climate change than plain-based urban agglomerations [21,22]. Simultaneously, as a rapidly expanding developing metropolitan area, this region concentrates the acute contradiction between the rigid surge in resource demand driven by urbanization and the shortcomings of environmental carrying capacity, serving as a microcosm of the development dilemmas faced by numerous emerging mountain cities worldwide. Furthermore, as China’s strategic gateway to South Asia and Southeast Asia, its unique location entails complex cross-scale resource flows and geopolitical risks [21]. Therefore, deeply analyzing the resilience evolution mechanism of the W–E–F nexus in this region and constructing differentiated regulatory pathways based on geographical zoning are not only crucial for safeguarding regional sustainable development but also provide a universal theoretical paradigm for resource governance in similar ecologically fragile urban agglomerations.
In light of this, taking the Kunming Metropolitan Area as a case study, this research adopts a comprehensive geographical perspective to deeply explore the spatiotemporal evolution trajectories of W–E–F nexus resilience across 24 counties in both temporal and spatial dimensions, as well as the feedback mechanisms and synergistic effects of the W–E–F nexus. Subsequently, precise zoning governance schemes are formulated to provide decision support for addressing resource risks under the dual stresses of climate change and urban expansion. The main contributions of this study are as follows: (1) Focusing on the ecological vulnerability of a plateau mountain metropolitan area, we establish a resilience assessment and optimization framework grounded in a comprehensive geographical perspective, incorporating spatial heterogeneity, cross-scale interactions, and subsystem feedbacks, thereby overcoming the limitations of traditional studies that overlook spatial processes and dynamic coupling relationships. (2) We propose an adaptive zoning governance strategy oriented toward resilience enhancement, classifying the study area into distinct optimization zones according to the comprehensive resilience of the W–E–F nexus and the dominant limiting subsystems. This approach shifts governance from uniform regulation to targeted, constraint-specific intervention, with the goal of promoting regional resource sustainability, systemic coordination, and spatial equity.
2. Materials and Methods
2.1. Theoretical and Research Framework
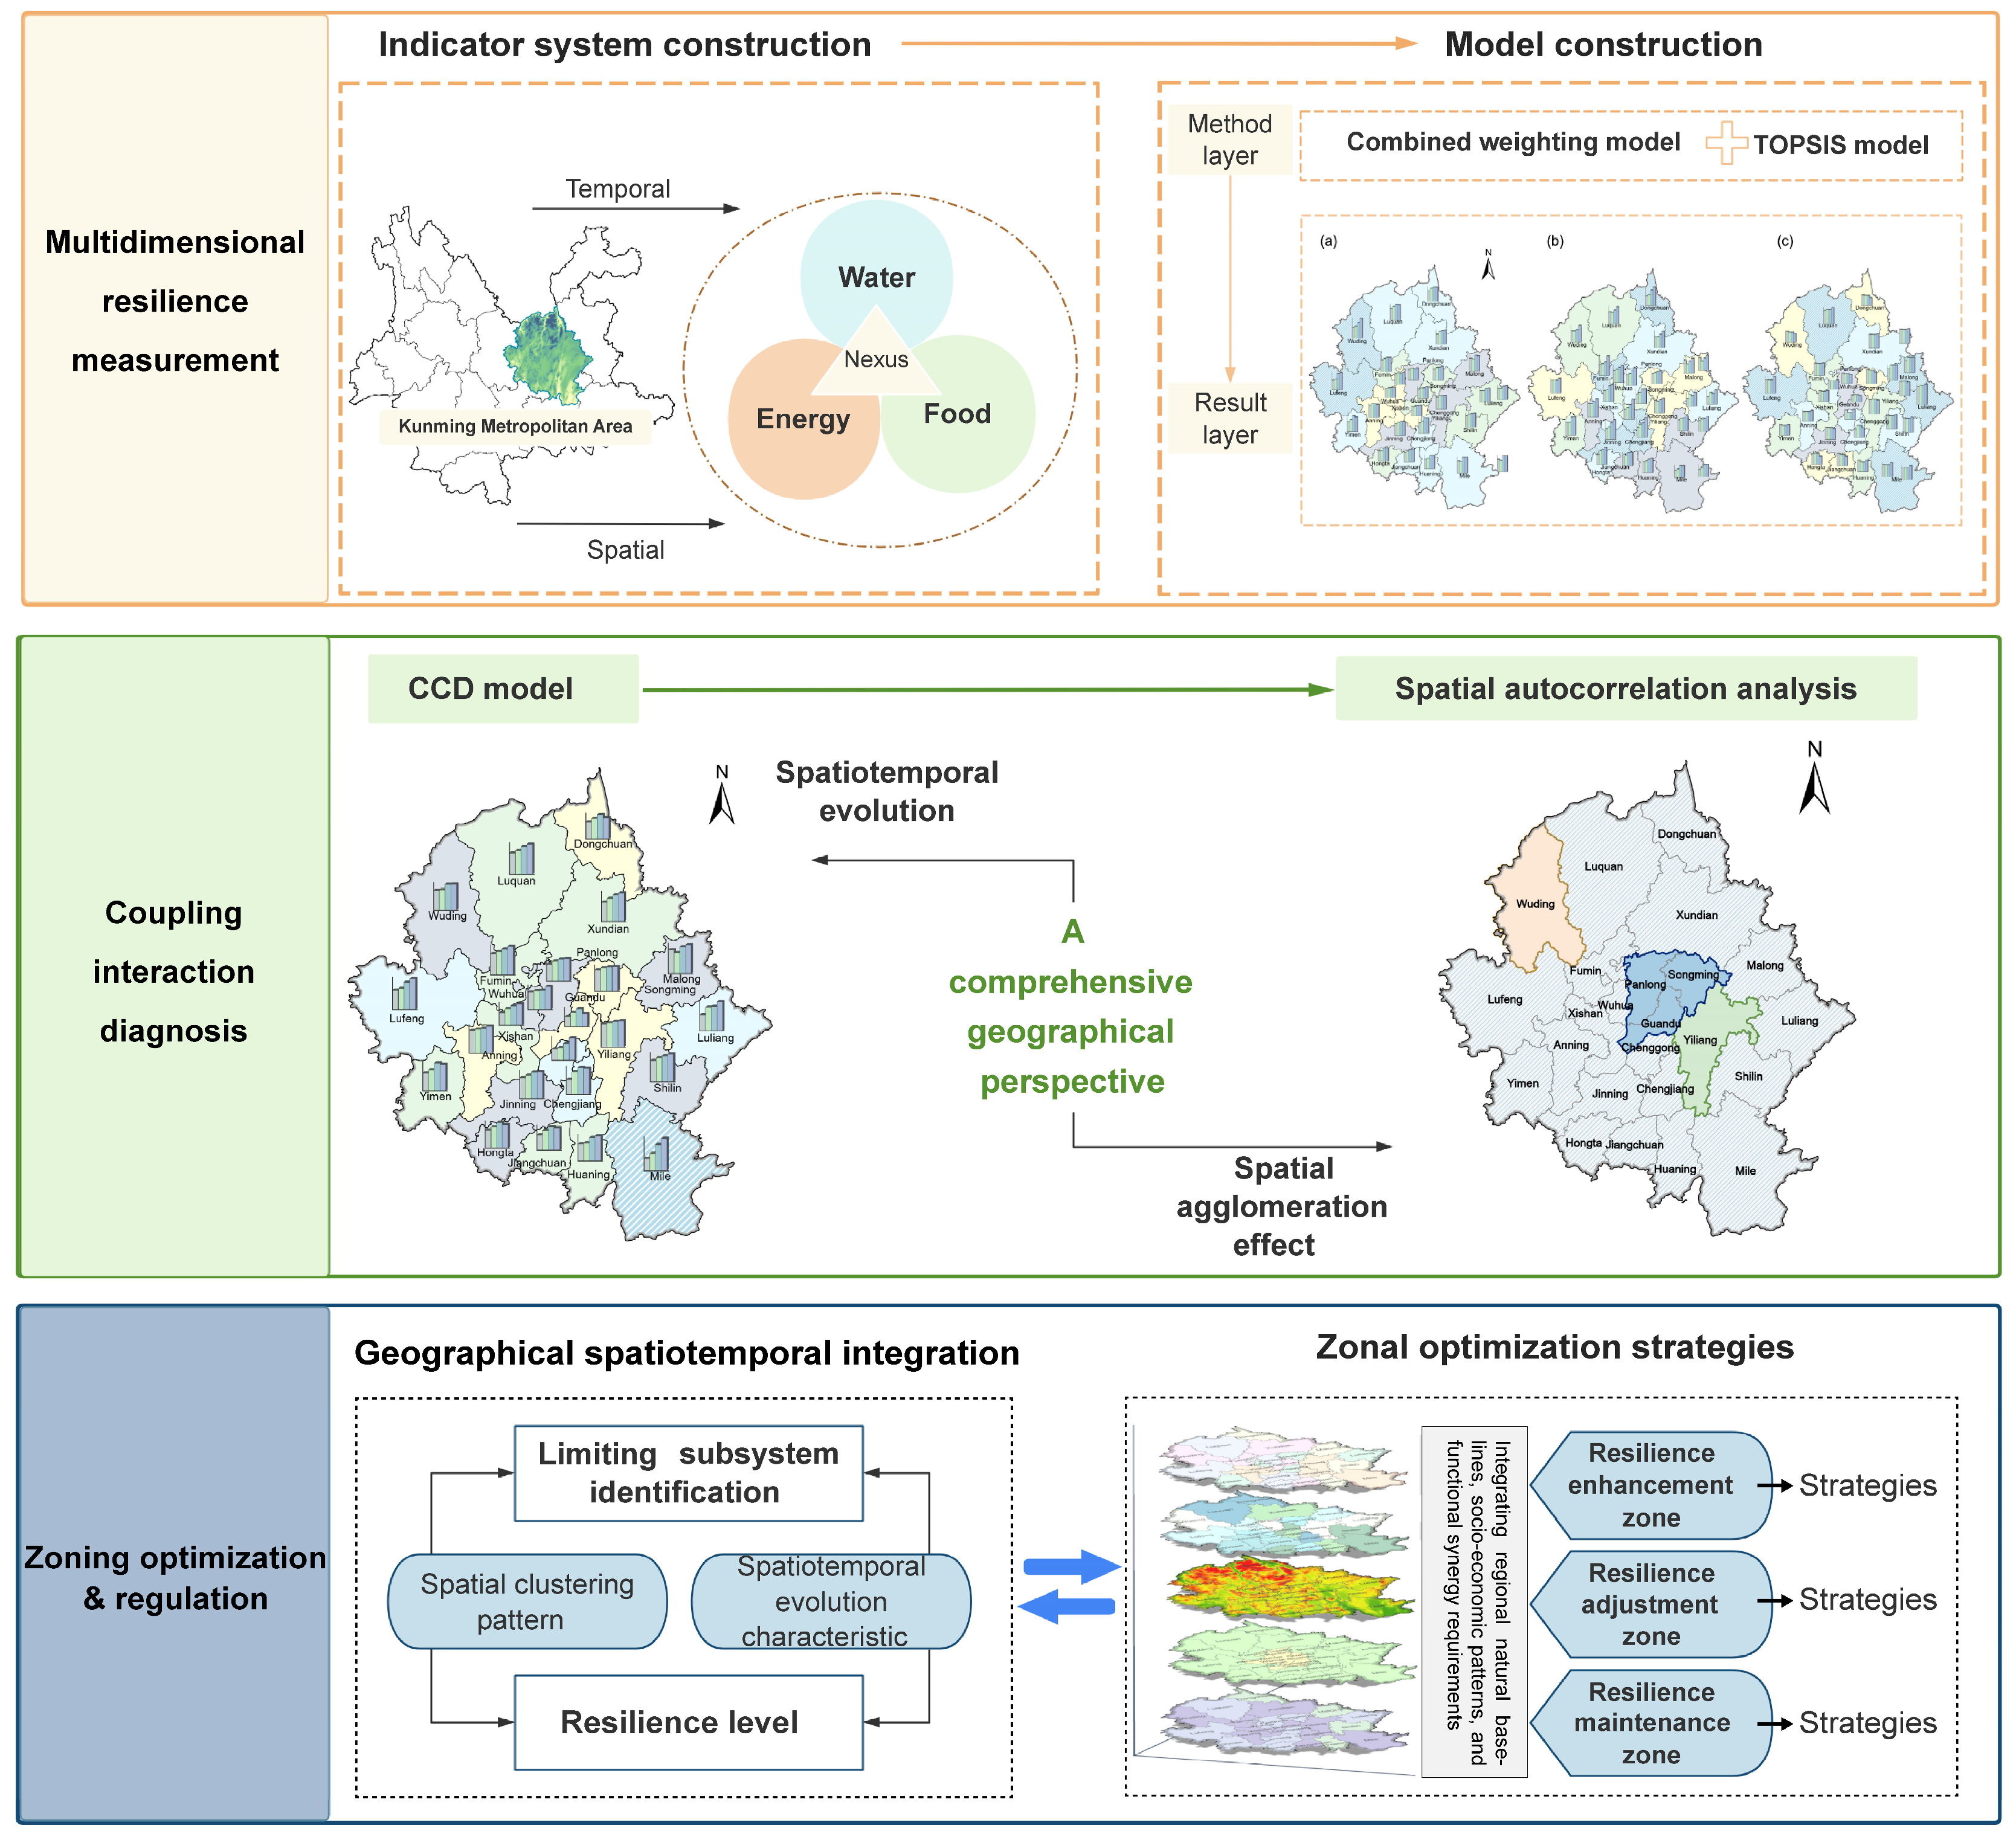
This study adopts the comprehensive geographical research paradigm of “Pattern–Process–Mechanism–Regulation.” Guided by theories of human–earth system coupling and resilience [10,23,24], we developed an analytical framework titled “Multidimensional Resilience Characterization–Spatiotemporal Coupling Process–Zoned Refined Governance” (Figure 1). This framework is designed to systematically reveal the mutual feedback mechanisms and spatial differentiation regularities of W–E–F nexus resilience within the plateau mountain metropolitan area, comprising three primary modules:
- (1)
- Multidimensional Resilience Measurement: Addressing the ecological fragility and resource constraints inherent to the plateau mountain region, we established a resilience evaluation index system based on the Pressure-State-Response (PSR) model to capture the external pressures, internal states, and response capabilities of the W–E–F system. By employing a combined weighting method and the Technique for Order Preference by Similarity to Ideal Solution (TOPSIS) model, we quantitatively measured the resilience indices of each subsystem to precisely characterize the spatiotemporal features of system resilience.
- (2)
- Spatiotemporal Coupling Interaction Mechanisms: We employed the Coupling Coordination Degree (CCD) model to dynamically analyze the mutual feedback relationships and evolutionary trajectories among the water, energy, and food subsystems. Integrated with spatial autocorrelation analysis, this module uncovers the spatial agglomeration patterns and association effects of resilience.
- (3)
- Limiting Subsystem Identification and Zoning Governance: Building on the preceding analyses, we precisely identified the key limiting subsystems constraining resilience enhancement. Subsequently, we delineated W–E–F optimization management zones based on “resilience level–limiting type” characteristics and proposed locally adapted spatial regulation strategies to facilitate resilience enhancement and the sustainable development of regional resource systems.
Figure 1.
Research framework.
2.2. Study Area
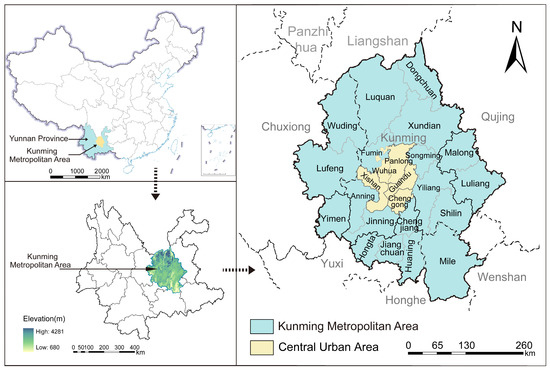
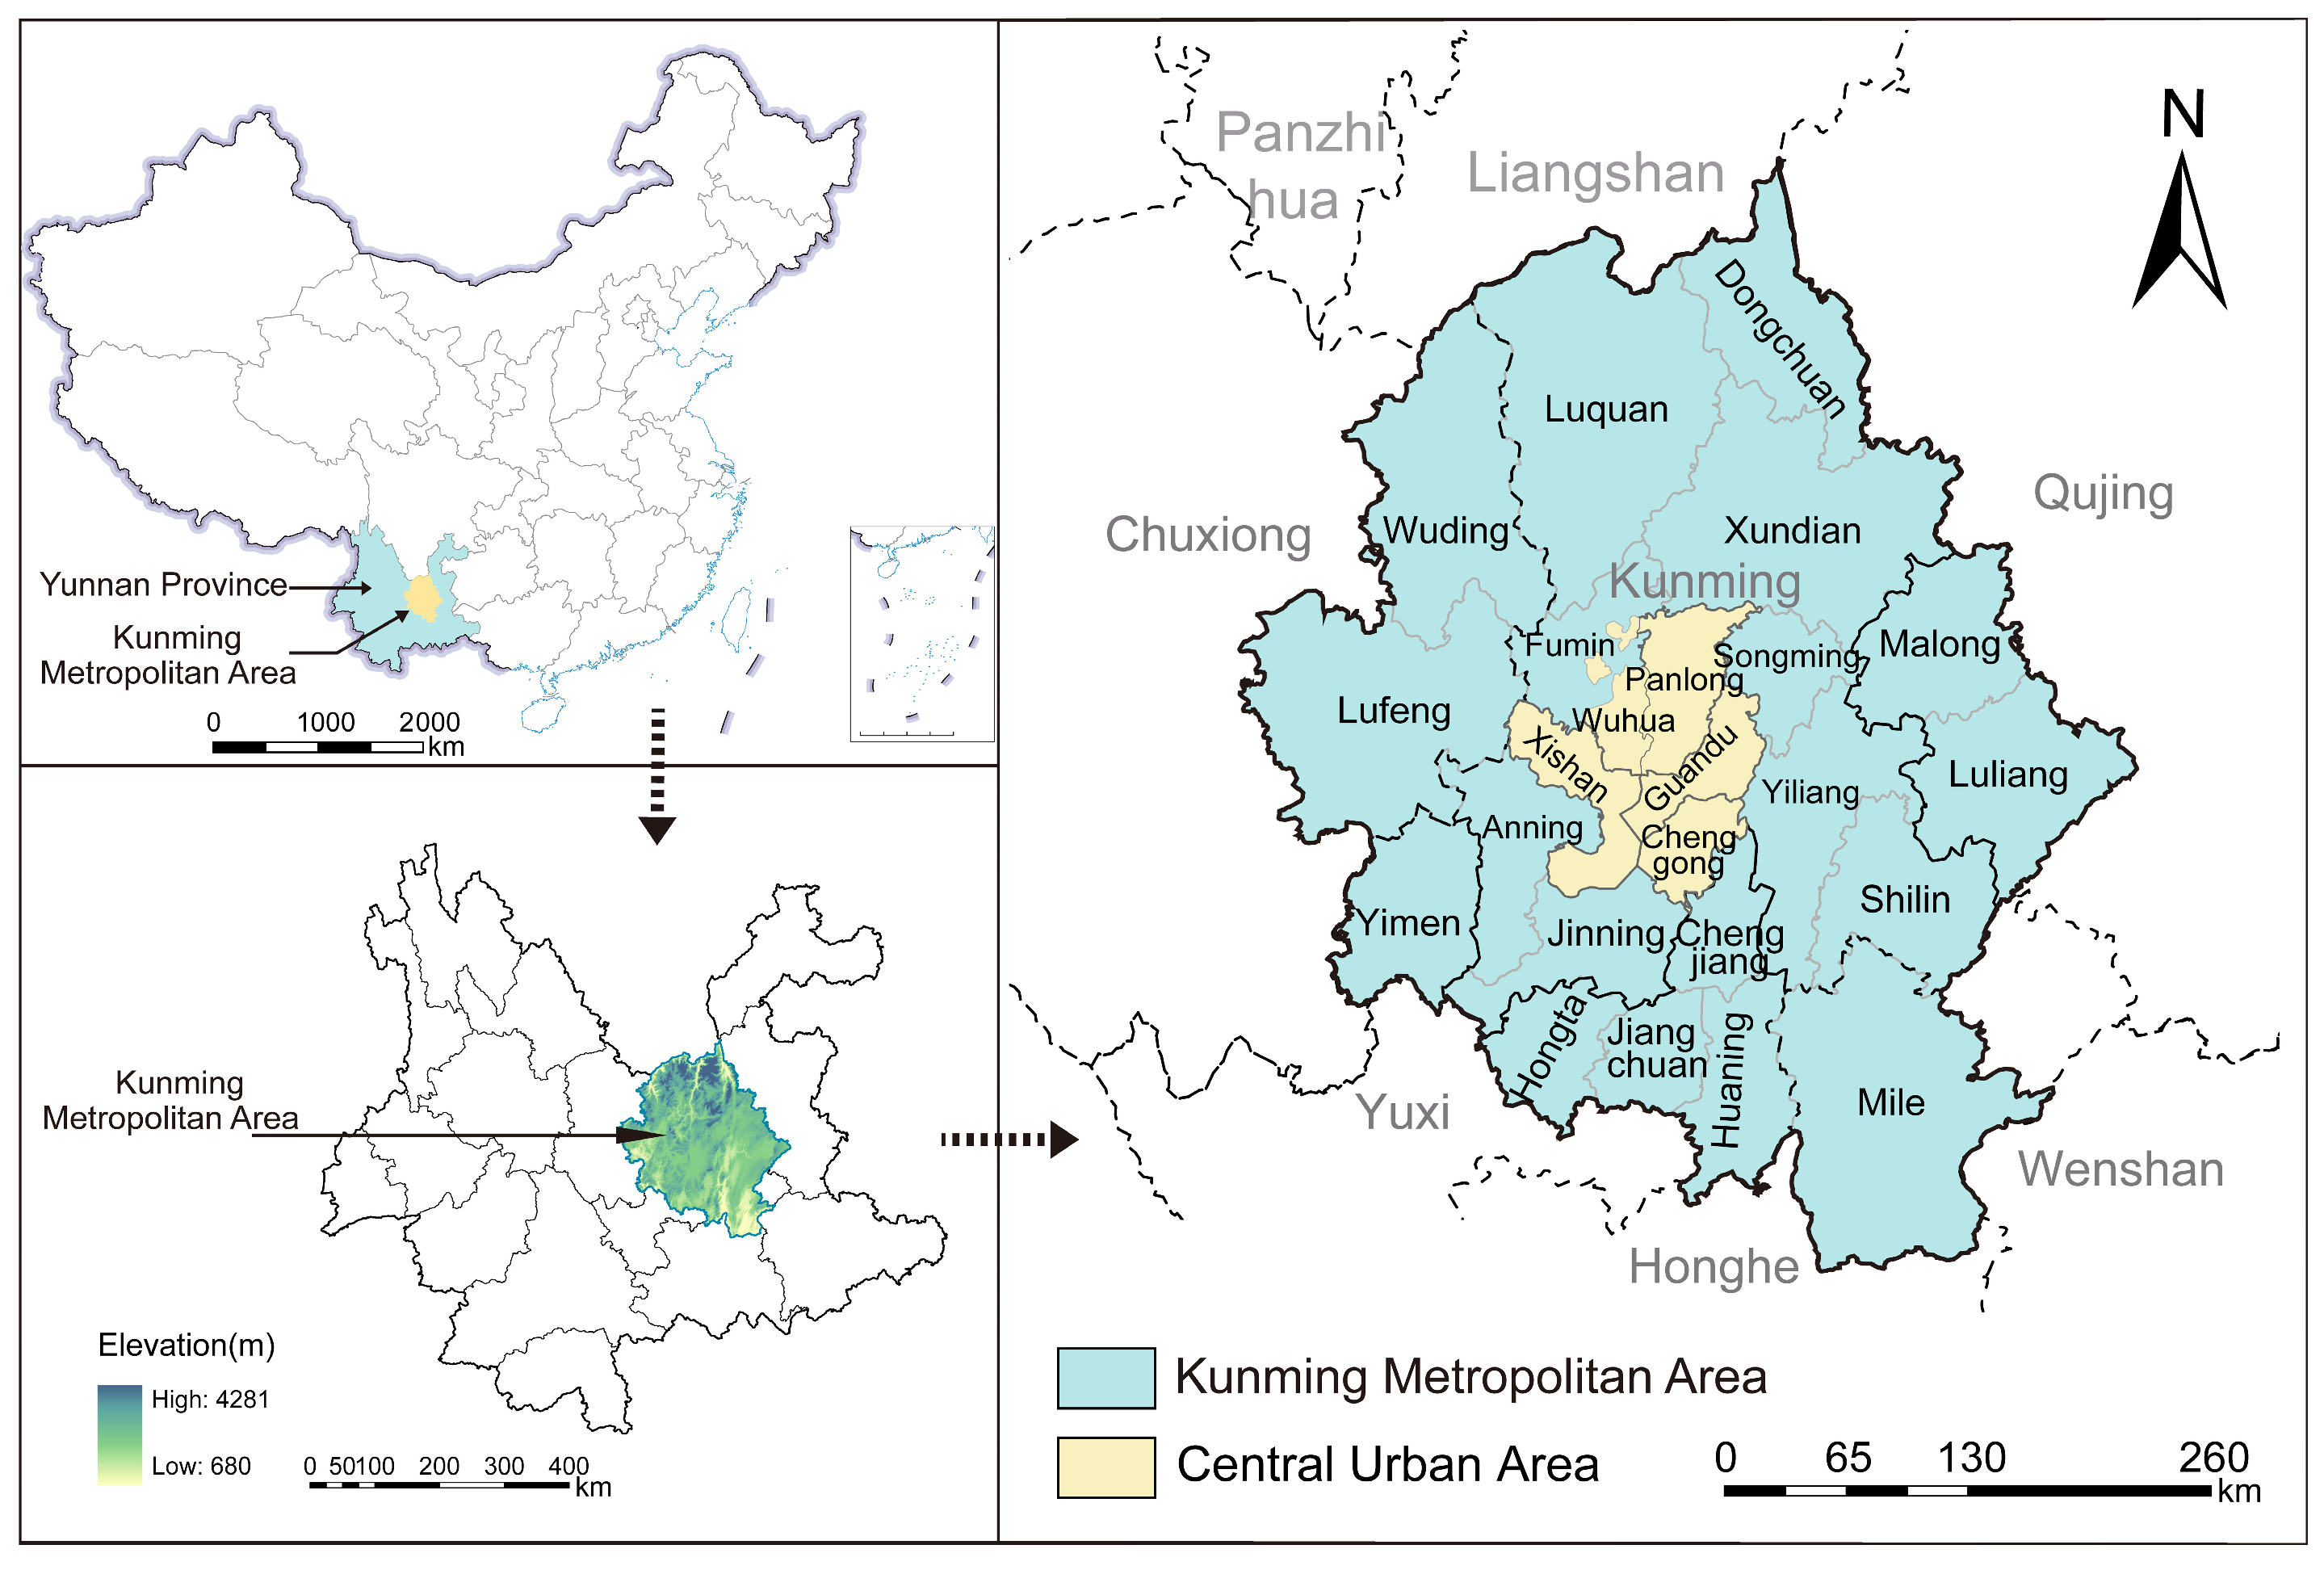
The Kunming Metropolitan Area (101°31′53″ E–104°3′35″ E, 23°47′4″ N–26°35′31″ N) is situated in the central Yunnan–Guizhou Plateau, with an average altitude of approximately 1900 m. Characterized by a typical mountain monsoon climate with distinct dry and wet seasons, the region covers a total area of 40,300 km2, accounting for approximately 10.23% of Yunnan Province. It encompasses 24 counties spanning five prefectures and cities: Kunming, Qujing, Yuxi, Chuxiong, and Honghe (Figure 2). As a strategic hub for China’s opening-up to South and Southeast Asia and the core growth pole of the Central Yunnan Urban Agglomeration, this region sustains high-intensity human activities and economic functions. However, it simultaneously confronts severe challenges inherent to its plateau mountain environment [21].
Figure 2.
Location of the Study Area.
The interplay of uneven precipitation, Karst landforms, rapid urbanization, and climate change intensifies water scarcity, energy–food competition, and land-use conflicts, significantly compromising the sustainability of the W–E–F nexus. In terms of hydrology, statistics from 2023 reveal that per capita water resources stand at only 733 m3—less than 32.7% of the national average (2239.8 m3)—underscoring an acute supply–demand imbalance highly susceptible to climate fluctuations. Regarding energy structure, fossil fuel consumption remains dominant, exceeding 75% in 2020, which imposes high external dependency on the system. In the agricultural sector, rapid urbanization has substantially weakened food production capacity, resulting in declines of 8.3% and 12.6% in arable land retention and grain sowing areas, respectively, over the past decade. The uncertainty induced by climate change compounds the rigid resource demands driven by urban expansion, exacerbating inter-sectoral competition and functional conflicts. This dynamic precipitates cascading risks characterized by water shortages, energy limitations, and grain production reductions.
2.3. Data Source
The data used in this study were primarily derived from the Yunnan Provincial Water Resources Bulletin, Yunnan Economic Yearbook, China Statistical Yearbook, and Statistical Yearbooks and Statistical Bulletins of National Economic and Social Development for counties within the Kunming Metropolitan Area. Additionally, publicly available online datasets, such as those from the National Bureau of Statistics of China (www.stats.gov.cn), were used. We selected 2005, 2010, 2015, and 2020 as the reference years. For missing indicator values in these years, a linear interpolation method was applied to supplement the dataset. The procedure was as follows: first, we identified the county-year observations with missing data; second, we located the nearest preceding and subsequent years for which complete data were available; third, we calculated the average annual change between the two known values; and fourth, we estimated the missing value based on this change. Linear interpolation was chosen because the relevant indicators exhibit relatively stable interannual variation without sharp fluctuations, and because the data were primarily derived from official statistical yearbooks and bulletins with high completeness. In practice, the vast majority of county-year observations consisted of original reported values, with only a very small proportion requiring interpolation.
2.4. Methodology
2.4.1. Evaluation Index System for W–E–F Nexus Resilience
The operation of subsystems within the W–E–F nexus is constrained by the spatiotemporal interactions of multidimensional factors, rendering single-dimensional indicators inadequate for scientifically assessing the system’s state [5,9,16,25]. Especially for plateau mountainous metropolitan regions, constructing an evaluation framework that is scientific, systematic, and tailored to regional characteristics is critical. In this study, the PSR framework is adopted as the theoretical basis for constructing the evaluation index system. The reason is that the PSR framework and resilience theory share a consistent process logic in describing system evolution under external disturbances. Specifically, the Pressure dimension characterizes the external stresses and constraint conditions faced by the W–E–F nexus, such as resource scarcity, environmental load, and human activity intensity, which correspond to the disturbance context and vulnerability sources of resilience. The State dimension reflects the operational condition, structural stability, and functional performance of the system under stress, thereby representing its capacity to absorb shocks and maintain essential functions. The Response dimension captures the regulation, management, technological investment, and adaptive actions taken by governments and society, which directly correspond to the system’s recovery, adaptation, and transformation capacities [26,27]. Therefore, PSR is not merely an environmental assessment tool in this study; rather, it provides a structured pathway for operationalizing resilience by translating the resilience process of “disturbance resistance–absorption and maintenance–adaptive recovery” into measurable dimensions of “pressure–state–response.” Building on this foundation, and with reference to previous studies [16,28], regional resource and environmental constraints, and data availability in the Kunming Metropolitan Area, we established the evaluation index system for W–E–F nexus resilience (Table 1).
Table 1.
Evaluation Index System and Its Weights for the W–E–F Nexus Resilience.
2.4.2. TOPSIS Model
TOPSIS is a widely established multi-attribute decision analysis method [29,30]. In this study, we employed TOPSIS integrated with a combined weighting scheme that merges the Analytic Hierarchy Process (AHP) and the Entropy Weight Method (EWM). This hybrid approach effectively balances subjective expert judgment with objective data variance to systematically evaluate the spatiotemporal resilience evolution of W–E–F subsystems from 2005 to 2020. Detailed calculation procedures are available in the Supplementary Materials.
2.4.3. CCD Model
The CCD model was employed to characterize the dynamic interaction relationships among W–E–F subsystems, where the CCD serves as the measure of the W–E–F nexus’s comprehensive resilience. CCD not only incorporates the resilience strength of individual subsystems (water, energy, and food) within the W–E–F nexus but also accurately measures the coupling quality and coordinated development level among them. Capturing both aspects is essential for comprehensively revealing the aggregate resilience of the regional W–E–F nexus [16,31]. Unlike the Coupling Degree, which solely quantifies interaction strength, the CCD integrates interaction intensity and development quality into a unified framework [31,32]. The calculation formulas are as follows:
where Ww, Ee, Ff represent the resilience of the water, energy, and food subsystems, respectively; C denotes the coupled degree (0 ≤ C ≤ 1.0); D represents the CCD (0 ≤ D ≤ 1.0), reflecting the coupling coordination within the W–E–F nexus; and T serves as the comprehensive coordination index, where α, β, γ denote the weight coefficients for the water, energy, and food subsystems, respectively. Based on prior research [33], we assume equal importance for the three subsystems, setting α = β = γ = 1/3.
2.4.4. Spatial Autocorrelation Analysis
Spatial autocorrelation analysis was employed to identify spatial clustering patterns in the comprehensive resilience of the W–E–F nexus by constructing a spatial weight matrix [16,34]. Specifically, we used a Queen contiguity spatial weight matrix. If two counties share either a common boundary or a common vertex, Wij = 1; otherwise, Wij = 0, and Wii = 0. The matrix was then row-standardized. On this basis, we calculated the global Moran’s I values for the coupling coordination degree in 2005, 2010, 2015, and 2020 and used permutation tests to obtain the corresponding z-scores and p-values. Calculations were performed using GeoDa 1.22 software. The Global Moran’s I serves as the primary metric for quantifying global spatial autocorrelation, calculated as follows:
where I ranges from −1 to 1; Ii represents the local Moran index; n denotes the total number of spatial units; xi and xj represent the variable values at locations i and j; is the mean value; and wij represents the spatial weight matrix. Positive value (I > 0) indicates a positive spatial correlation, with higher values signifying a stronger spatial agglomeration trend in comprehensive resilience. A value of zero (I = 0) signifies a random spatial distribution with no correlation. Conversely, a negative value (I < 0) indicates negative spatial correlation, denoting significant spatial disparity [35].
To further detect localized agglomeration patterns, Local Indicators of Spatial Association (LISA) were utilized [36], calculated as
where Ii represents the local Moran index. Based on the LISA results, spatial patterns are categorized into four types: “H–H Cluster” (regions of high resilience bordered by high-resilience neighbors); “L–H Cluster” (low resilience surrounded by high resilience); “L–L Cluster” (low resilience bordered by low-resilience neighbors); and “H–L Cluster” (high resilience surrounded by low resilience).
2.4.5. Zoning Optimization Framework for the W–E–F Nexus Resilience
To translate the W–E–F nexus resilience assessment results into actionable spatial governance schemes, this study constructs a “Diagnosis-Zoning-Regulation” framework comprising three steps, aiming to implement differentiated management tailored to regional specificities.
Step 1: Delineation of Optimization Zones Based on Comprehensive Resilience.
Comprehensive resilience serves as the core criterion for determining regional strategic positioning. Based on relevant literature [37] and the W–E–F nexus resilience of each county in 2020, the study area is classified into three optimization zones:
- Resilience Maintenance Zone: Defined by a comprehensive resilience index exceeding 0.7. The governance priority is “defense and conservation”, aiming to sustain the existing high resilience level and prevent system degradation caused by over-development.
- Resilience Adjustment Zone: Defined by a comprehensive resilience index ranging from 0.6 to 0.7. The governance priority is “optimization and transformation”, aiming to facilitate the system’s transition to a higher resilience level.
- Resilience Enhancement Zone: Defined by a comprehensive resilience index lower than 0.6. The governance priority is “reshaping and decoupling”, indicating an urgent need to enhance system resilience through systemic restructuring.
Step 2: Identification of Limiting Subsystems Based on the bucket effect.
Accurately identifying the constraints that limit resilience is critical for formulating regulatory policies. Guided by Liebig’s Law of the Minimum (commonly referred to as the “bucket effect”), this study systematically compares the standardized resilience scores of the water, energy, and food subsystems for each county. The subsystem exhibiting the lowest score is identified as the primary limiting factor for that region.
Step 3: Integrated Zoning Regulation.
By spatially superimposing the optimization zones (Step 1) with the limiting subsystems (Step 2) and integrating regional natural baselines, socio-economic patterns, and functional synergy requirements, differentiated spatial regulation strategies are formulated for each specific zone type.
3. Results Analysis
3.1. Spatiotemporal Evolution of the W–E–F Subsystem Resilience
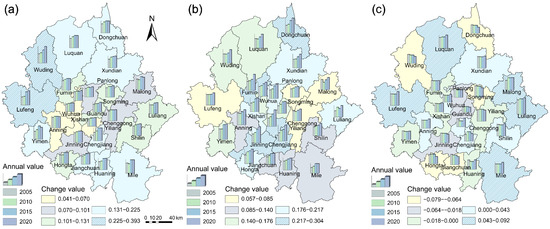
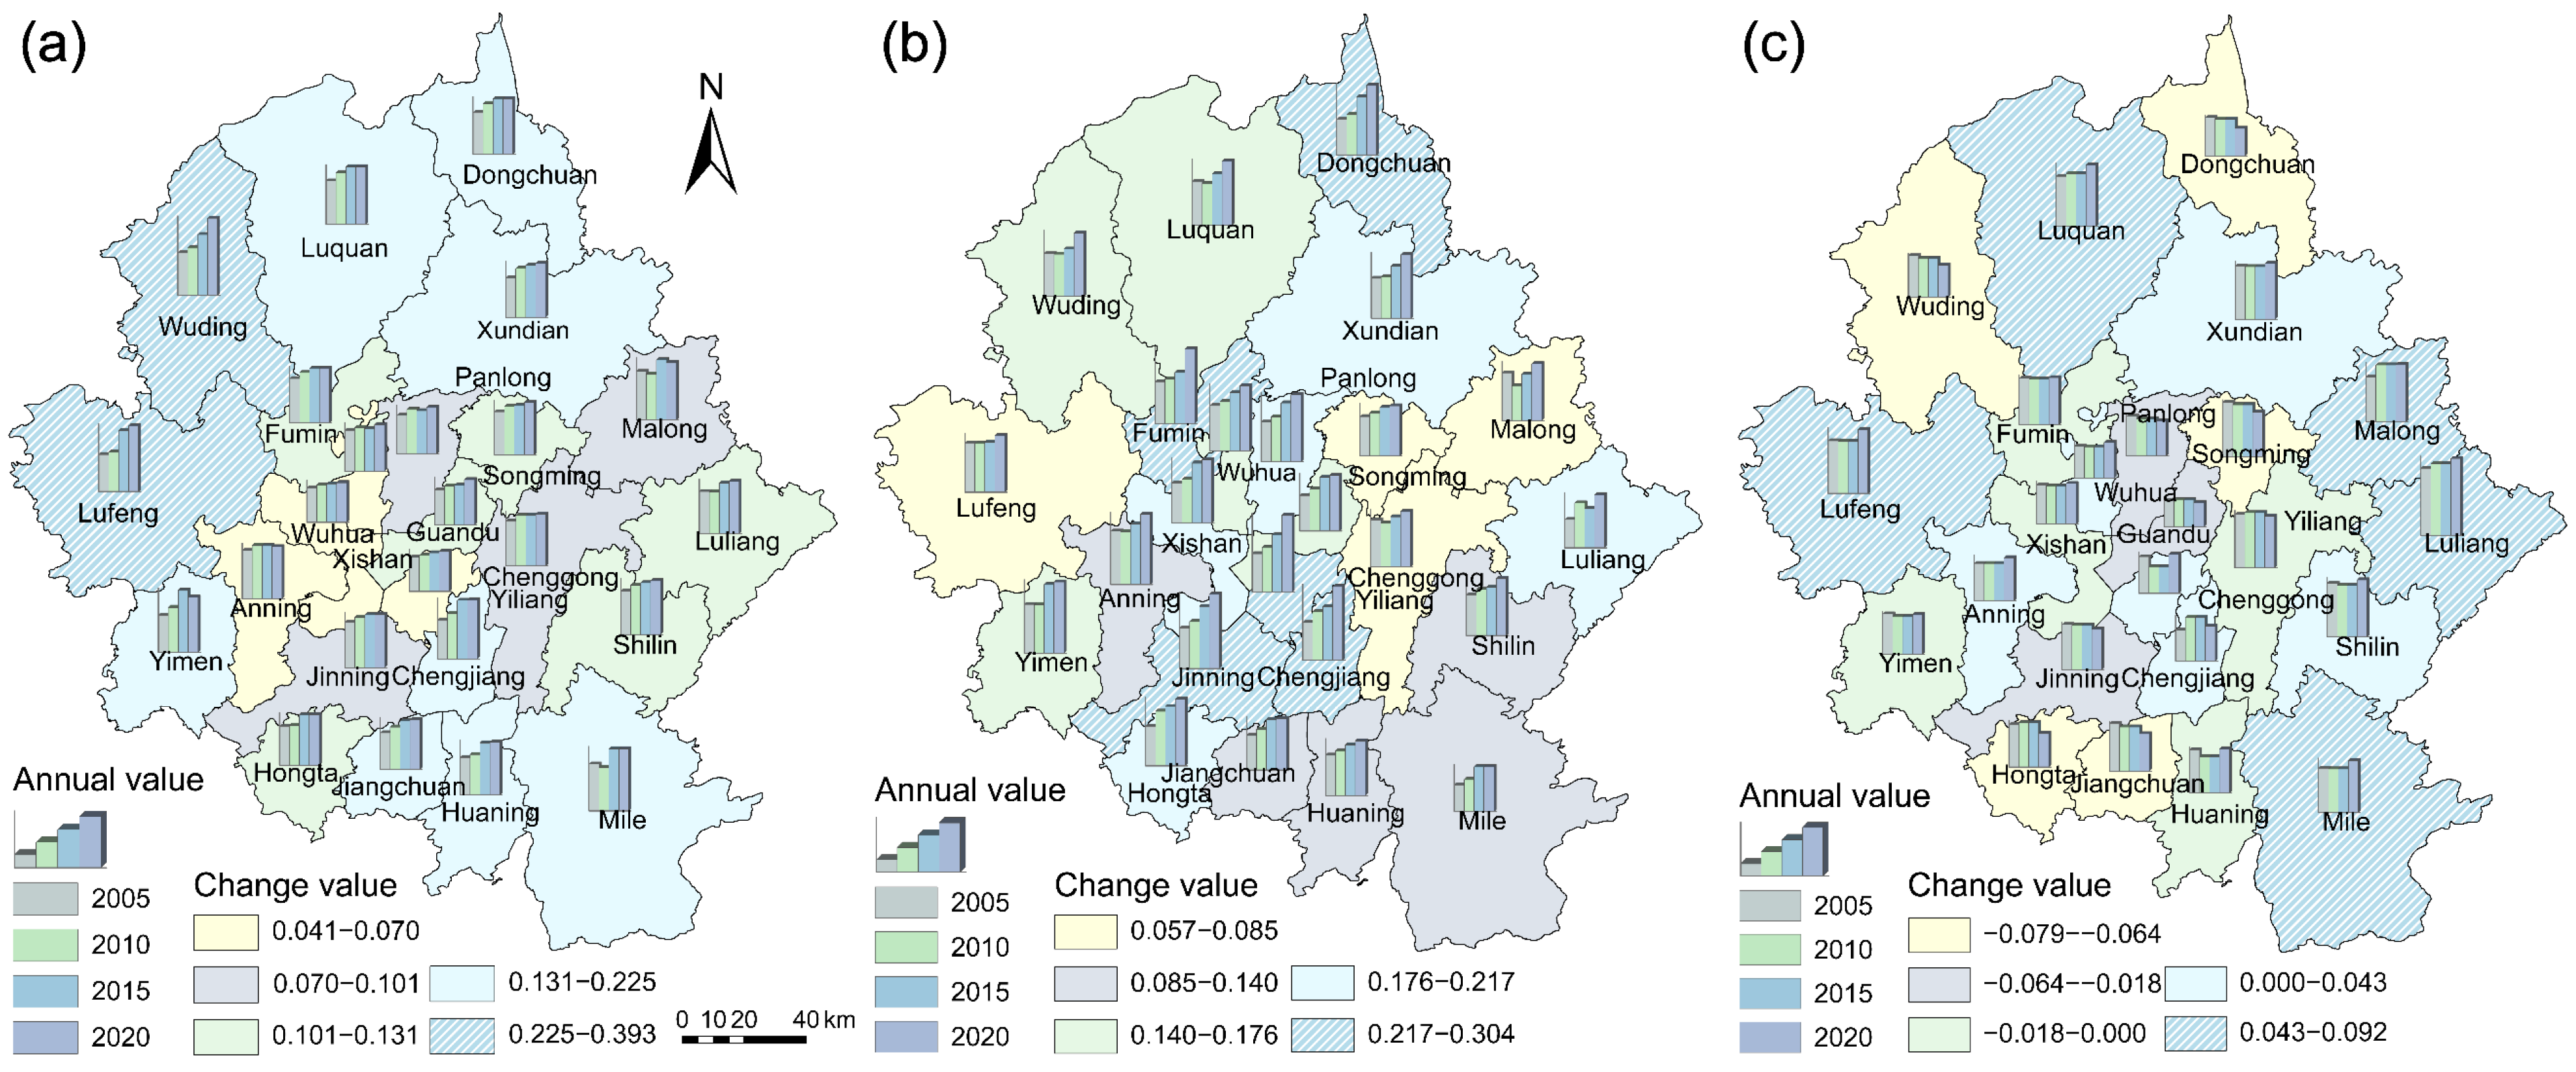
From 2005 to 2020, the resilience of the water subsystem generally trended upward across the study area (Figure 3a), except in a few industrial and water-constrained localities on the metropolitan periphery and in the eastern part of the region (Anning, Malong, and Mile). In 2020, the distribution exhibited a distinct peripheral-high, central-low decreasing gradient. Peripheral counties, Lufeng and Wuding, demonstrated substantial growth between 2005 and 2020, recording the highest increases, with growth rates of 77.68% and 81.01%, respectively. In contrast, central urban districts (e.g., Wuhua) exhibited marginal improvements (growth rates < 15%), indicating that water resilience is primarily conditioned by the balance between natural resource endowment and concentrated demand pressure.
Figure 3.
Spatiotemporal Evolution of the W–E–F Subsystem Resilience in the Kunming Metropolitan Area (2005–2020). (a) Water Subsystem; (b) Energy Subsystem; (c) Food Subsystem.
The energy subsystem resilience improved in most regions from 2005 to 2020, except for Yiliang, Malong, and Luliang, some peripheral regions characterized by industrial undertaking and transformation upgrading (Figure 3b). Unlike the water subsystem, it exhibited a pronounced core-high, periphery-low spatial structure. High-resilience areas were concentrated in the metropolitan core and major development corridors, where energy infrastructure, grid connectivity, technological upgrading, and policy support are more strongly concentrated. Peripheral counties, in contrast, remained at the lower end of the distribution, indicating that energy resilience is determined less by natural resource availability than by the degree of infrastructural concentration, network integration, and energy-use efficiency.
The food subsystem resilience exhibited the most significant spatial heterogeneity and volatility, with an average coefficient of variation of 25%, suggesting that its resilience values differed substantially across the study area relative to the overall mean (Figure 3c). The resilience in 2020 ranged from 0.18 to 0.60, forming a southeast-high to northwest-low distribution. Areas with stronger agricultural foundations and more continuous cultivated land, such as Malong (+27.94%) and Luquan (+22.09%), tended to maintain positive growth over the study period. By contrast, declines were concentrated in the metropolitan center and in zones undergoing rapid urban expansion or land-use transition, like Panlong (−12.40%) and Dongchuan (−28.23%). This pattern suggests that food subsystem resilience is particularly sensitive to the reconfiguration of land, labor, and agricultural functions under metropolitanization. Therefore, compared with the water and energy subsystems, food subsystem resilience appears to be the most directly affected by the tension between metropolitan growth and the preservation of agricultural production space.
3.2. Spatiotemporal Evolution of the W–E–F Comprehensive Resilience
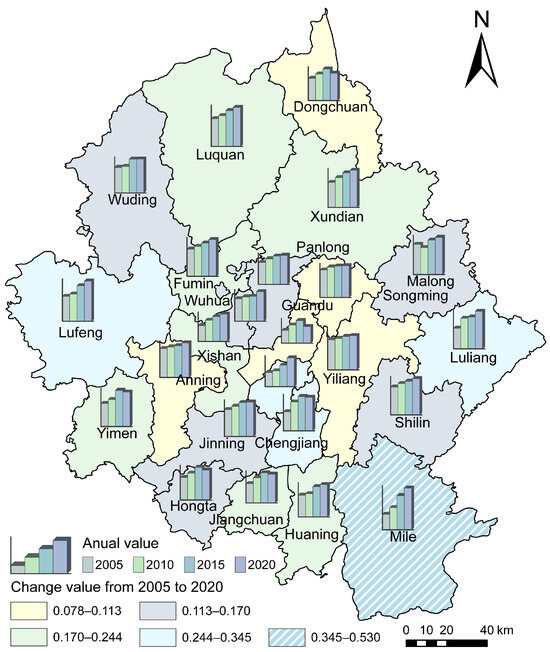
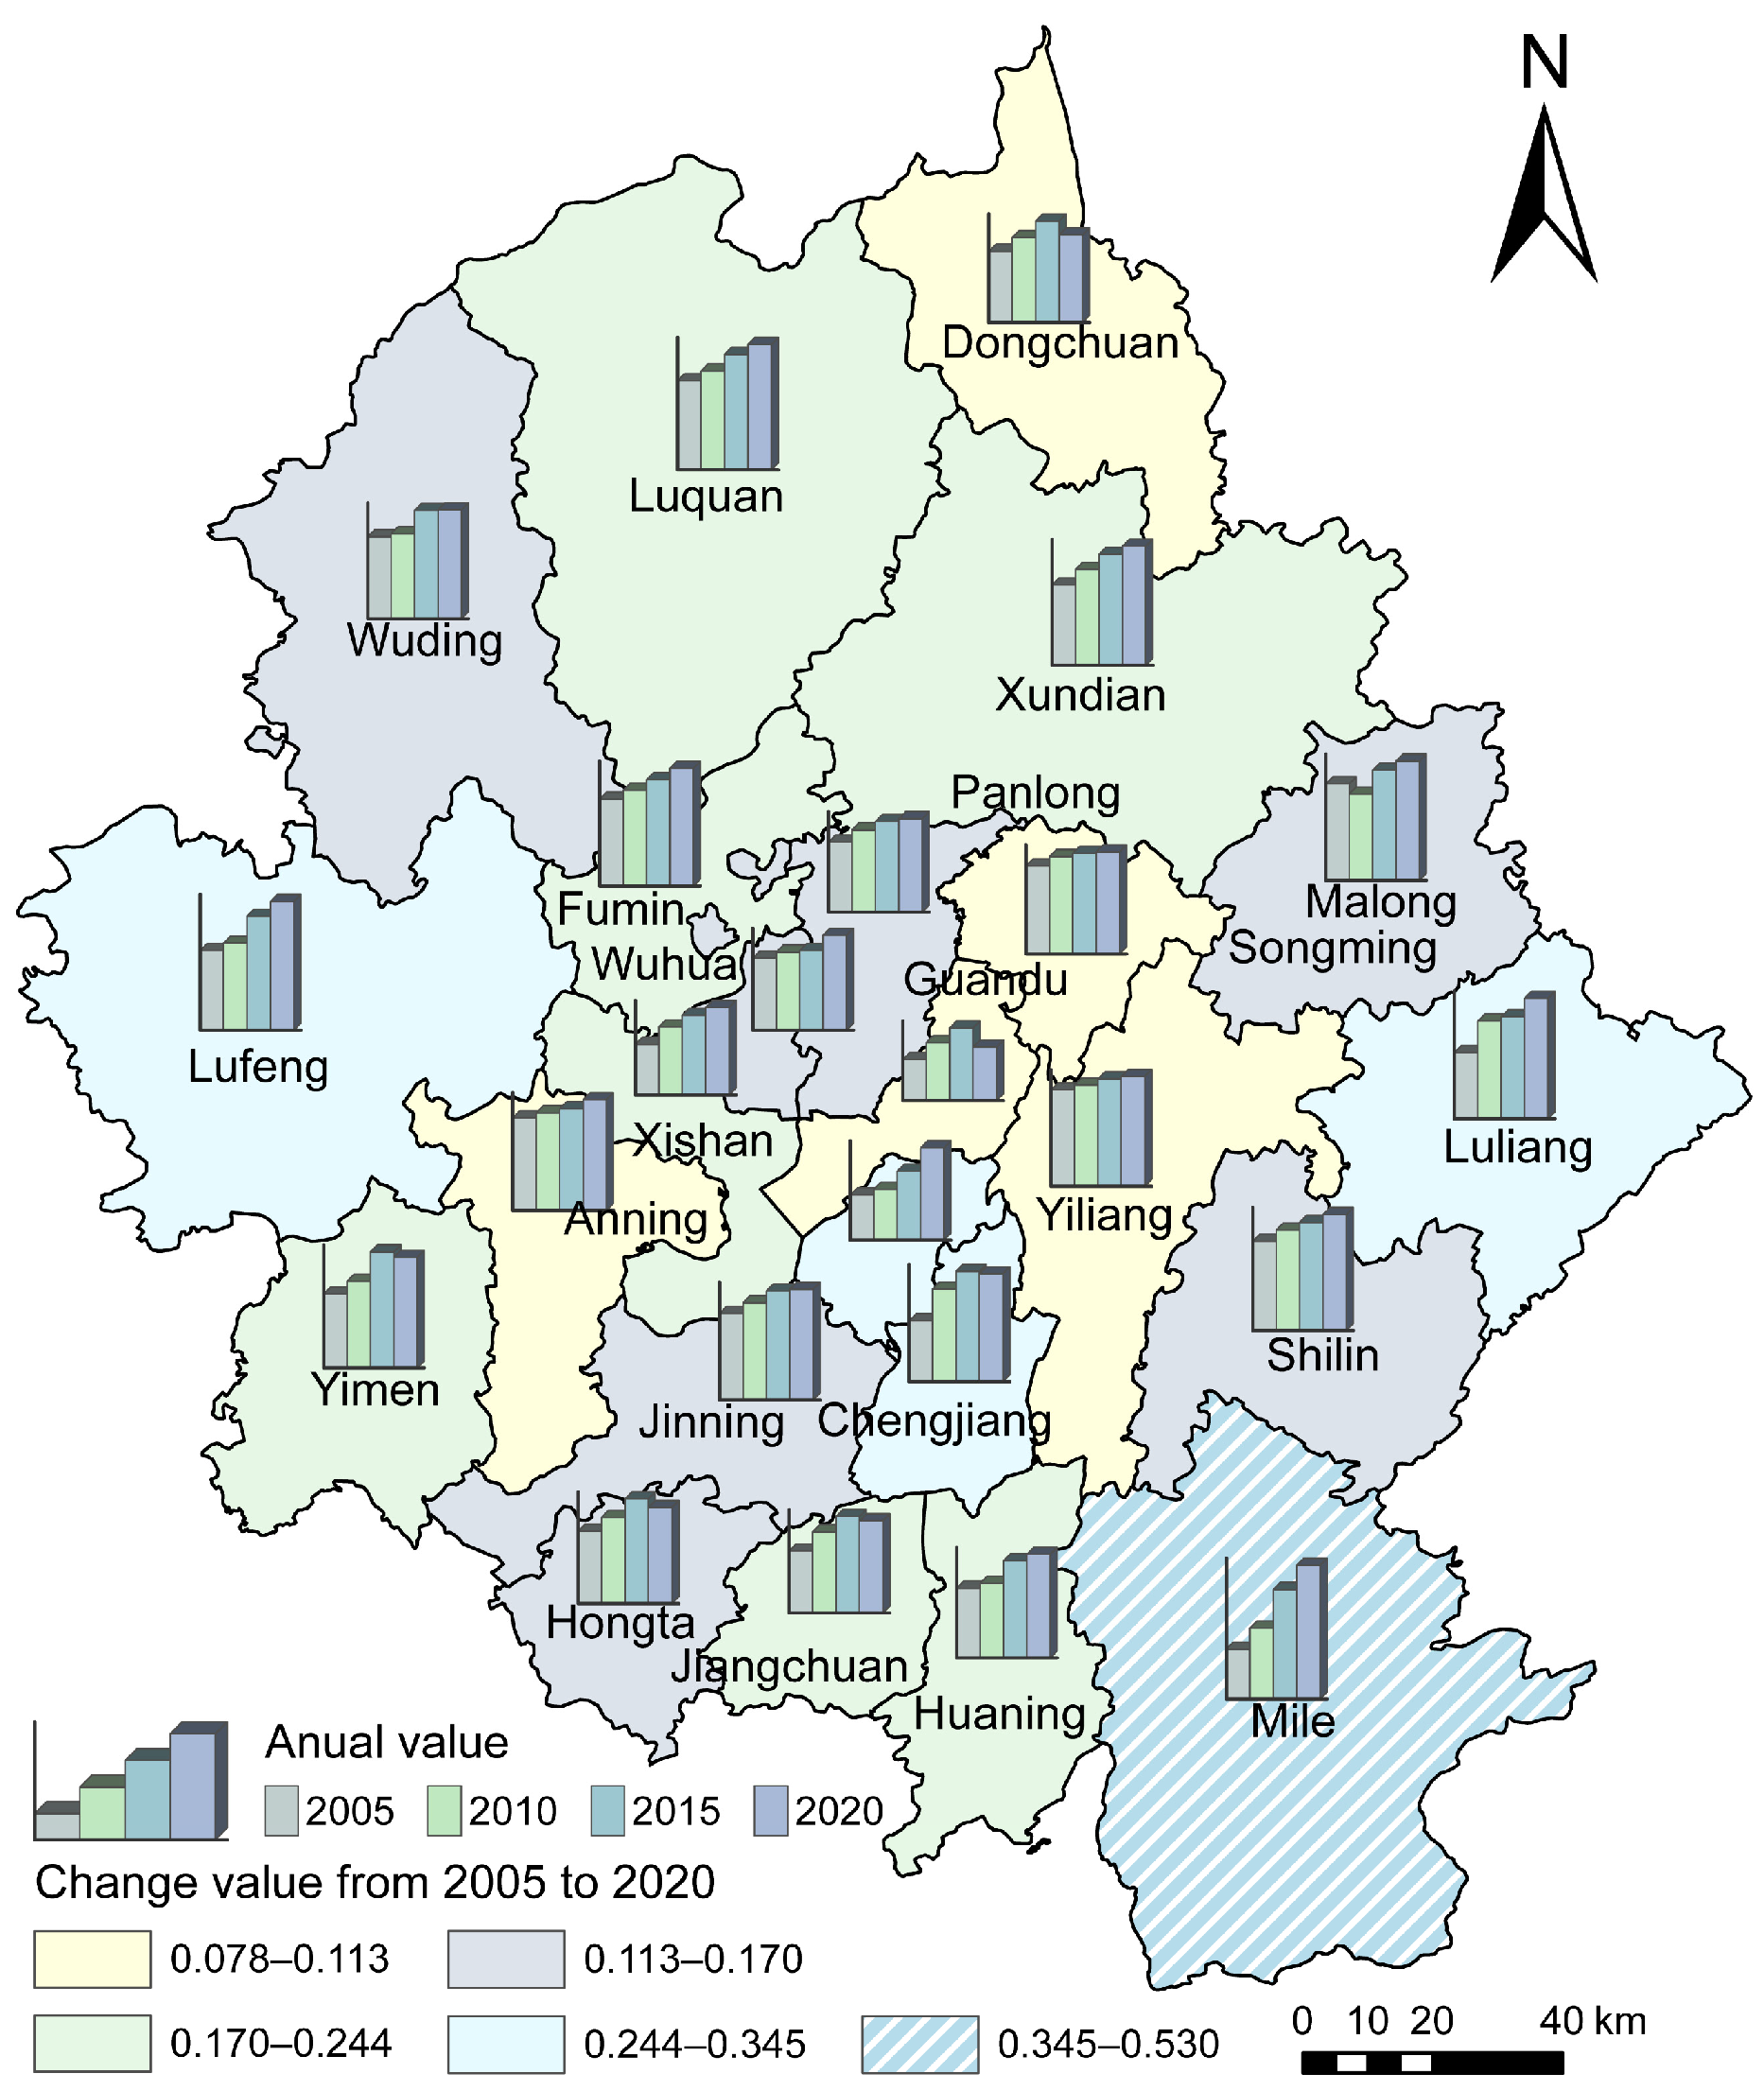
From 2005 to 2020, the comprehensive resilience of the W–E–F nexus generally trended upward, with the regional average rising to 0.67 in 2020 and 58.3% of the counties exceeding this average (Figure 4). Spatially, the metropolitan area exhibited a clear gradient of differentiation, reflecting uneven development stages of nexus resilience. The highest levels of comprehensive resilience were concentrated in a limited number of peripheral and agriculturally or ecologically supportive localities, such as Lufeng and Mile, while relatively high resilience was observed in several outer counties and transitional zones. By contrast, lower levels were mainly distributed in the metropolitan core and in areas facing stronger pressures from urban expansion, resource demand, and functional transformation. A small group of central urban districts remained at the bottom of the hierarchy, including Panlong, Xishan, and Chenggong, indicating persistent constraints on the coordinated functioning of water, energy, and food subsystems. Overall, this hierarchical pattern reveals a pronounced spatial polarization in comprehensive resilience across the metropolitan area, with peripheral counties generally outperforming the central urban districts. This suggests that comprehensive W–E–F resilience is shaped not only by the resilience of individual subsystems, but also by the extent to which resource endowment, infrastructure support, and land-use functions can be coordinated under metropolitanization.
Figure 4.
Spatiotemporal Evolution of the W–E–F Nexus Comprehensive Resilience in the Kunming Metropolitan Area (2005–2020).
Based on their temporal trajectories, the 24 counties can be classified into two distinct evolutionary patterns. Fluctuating regions, including Guandu, Dongchuan, Fumin, and Malong, experienced pronounced period-specific volatility and followed non-linear trajectories, such as “rise–stagnation–decline,” indicating high sensitivity to external disturbances and internal restructuring. By contrast, ascending regions, represented by Mile and Lufeng, showed sustained improvement over time, gradually transitioning from recession to coordinated development and reflecting a steady enhancement in system synergy. Moreover, resilience evolution in some neighboring counties displayed significant spatial correlation effects. For example, the counties surrounding Chengjiang showed synchronized changes in W–E–F nexus resilience, suggesting that the trajectories of peripheral areas were strongly influenced by the dynamics of nearby growth centers. This points to an underlying spatial linkage mechanism, whereby interregional interaction, functional spillover, and regional coordination jointly shaped resilience evolution.
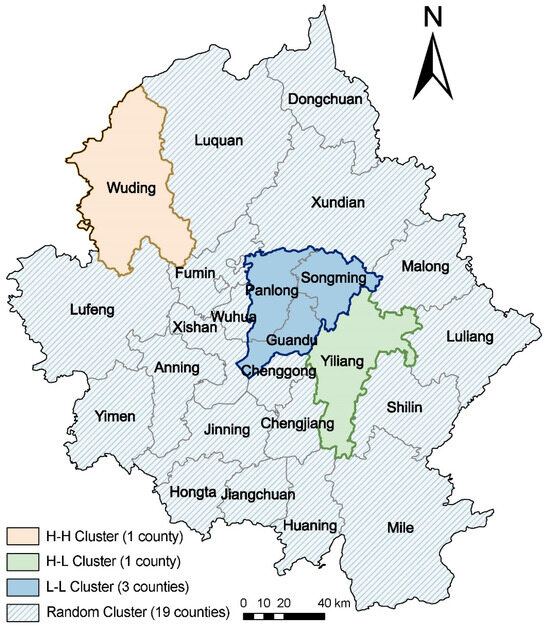
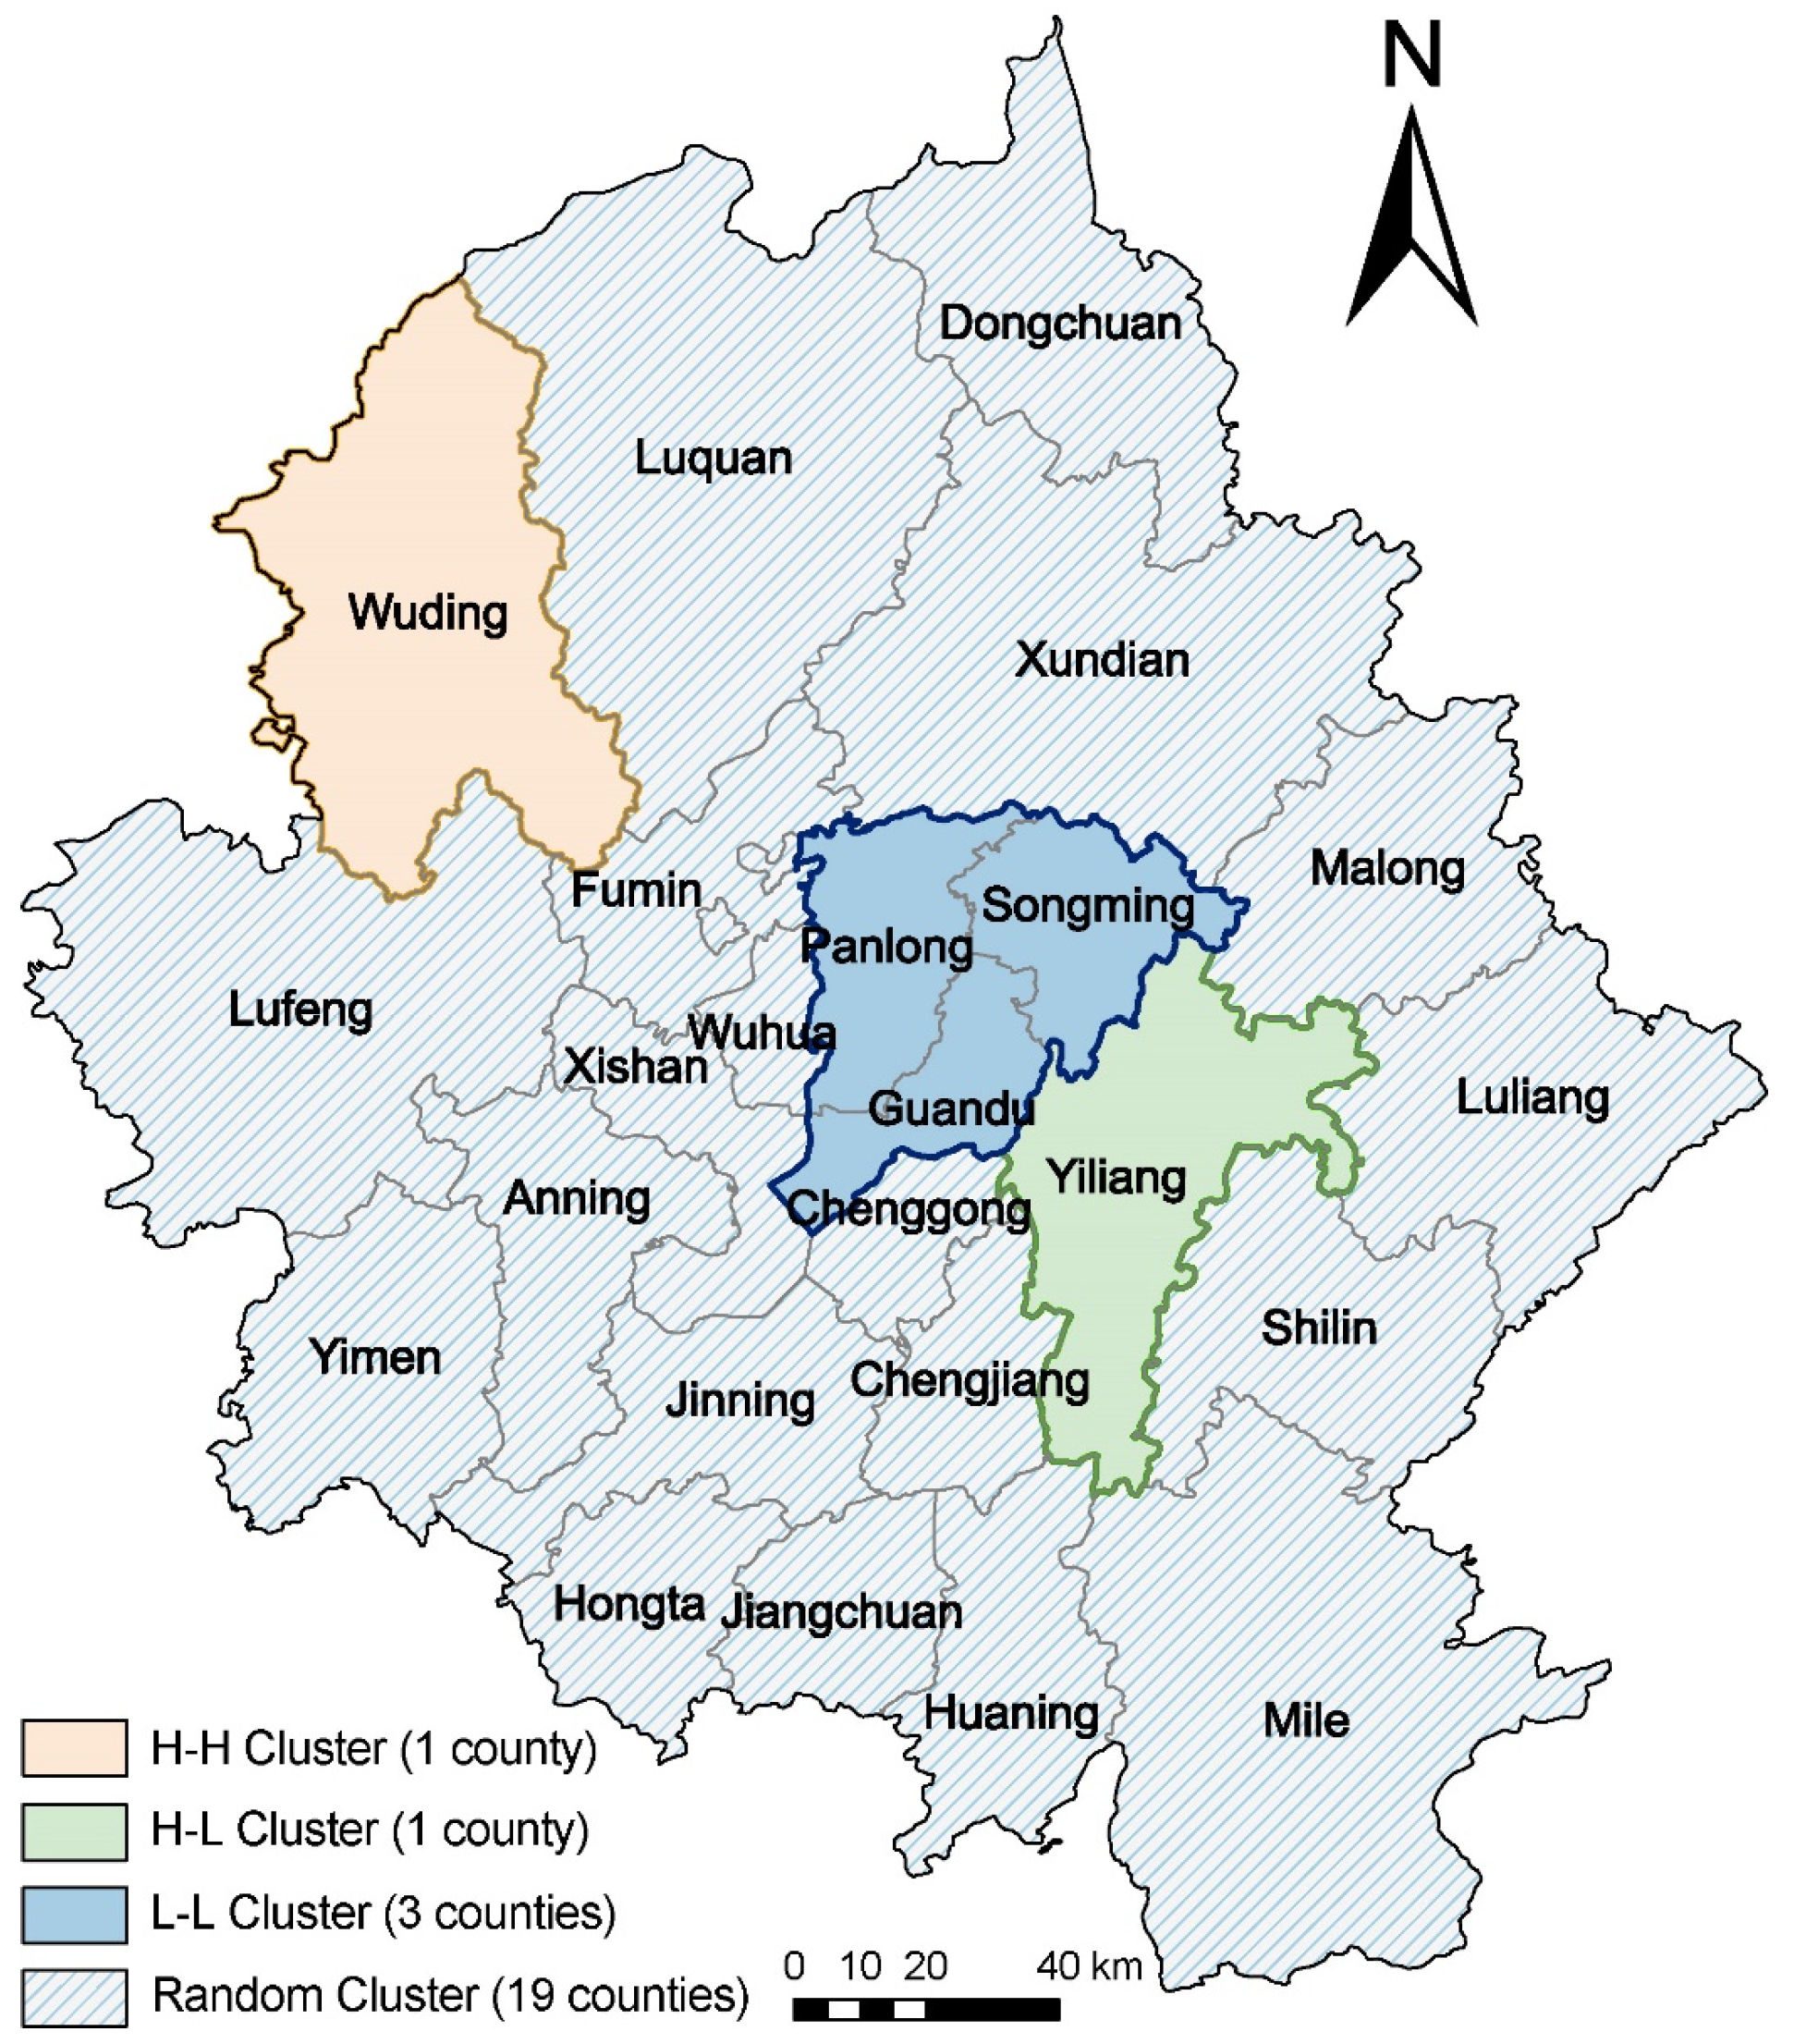
Furthermore, the global Moran’s I results show that the coupling coordination degree in the Kunming metropolitan area exhibited no significant spatial autocorrelation in 2005 or 2010 but became significantly and positively spatially correlated in 2015 and 2020. The global Moran’s I values were 0.230, 0.252, 0.482, and 0.261 in 2005, 2010, 2015, and 2020, respectively, revealing a temporal pattern of initial increase followed by decline. This indicates that positive spatial dependence persisted throughout the study period, while the intensity of spatial clustering varied over time. Specifically, spatial agglomeration was weak and statistically insignificant in the early stage, became most pronounced in 2015 (Moran’s I = 0.482, p = 0.0045, z-score = 3.1598), and remained evident in 2020 (Moran’s I = 0.261, p = 0.0188, z-score = 2.3251) despite a moderate decline. These results suggest that the study area did not follow a linear trajectory toward increasingly stronger spatial agglomeration but instead entered a later stage in which agglomeration and diffusion, as well as regional equalization and differentiation, coexisted. LISA in 2020 identified distinct clusters: a High-High Cluster in Wuding (synergistic resilience zone), a Low-Low Cluster in central urban districts like Guandu (low-resilience depression), and a High-Low Cluster in Yiliang (polarization effect). This clustering pattern highlights the strong spatial dependence and disparate development of W–E–F nexus comprehensive resilience across the region (Figure 5).
Figure 5.
Spatial Clustering Result of the Kunming Metropolitan Area’s W–E–F Nexus Comprehensive Resilience in 2020.
3.3. Optimization Zones and Improvement Paths of the W–E–F Nexus Resilience
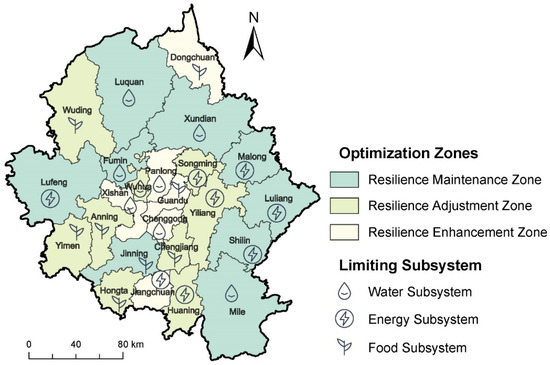
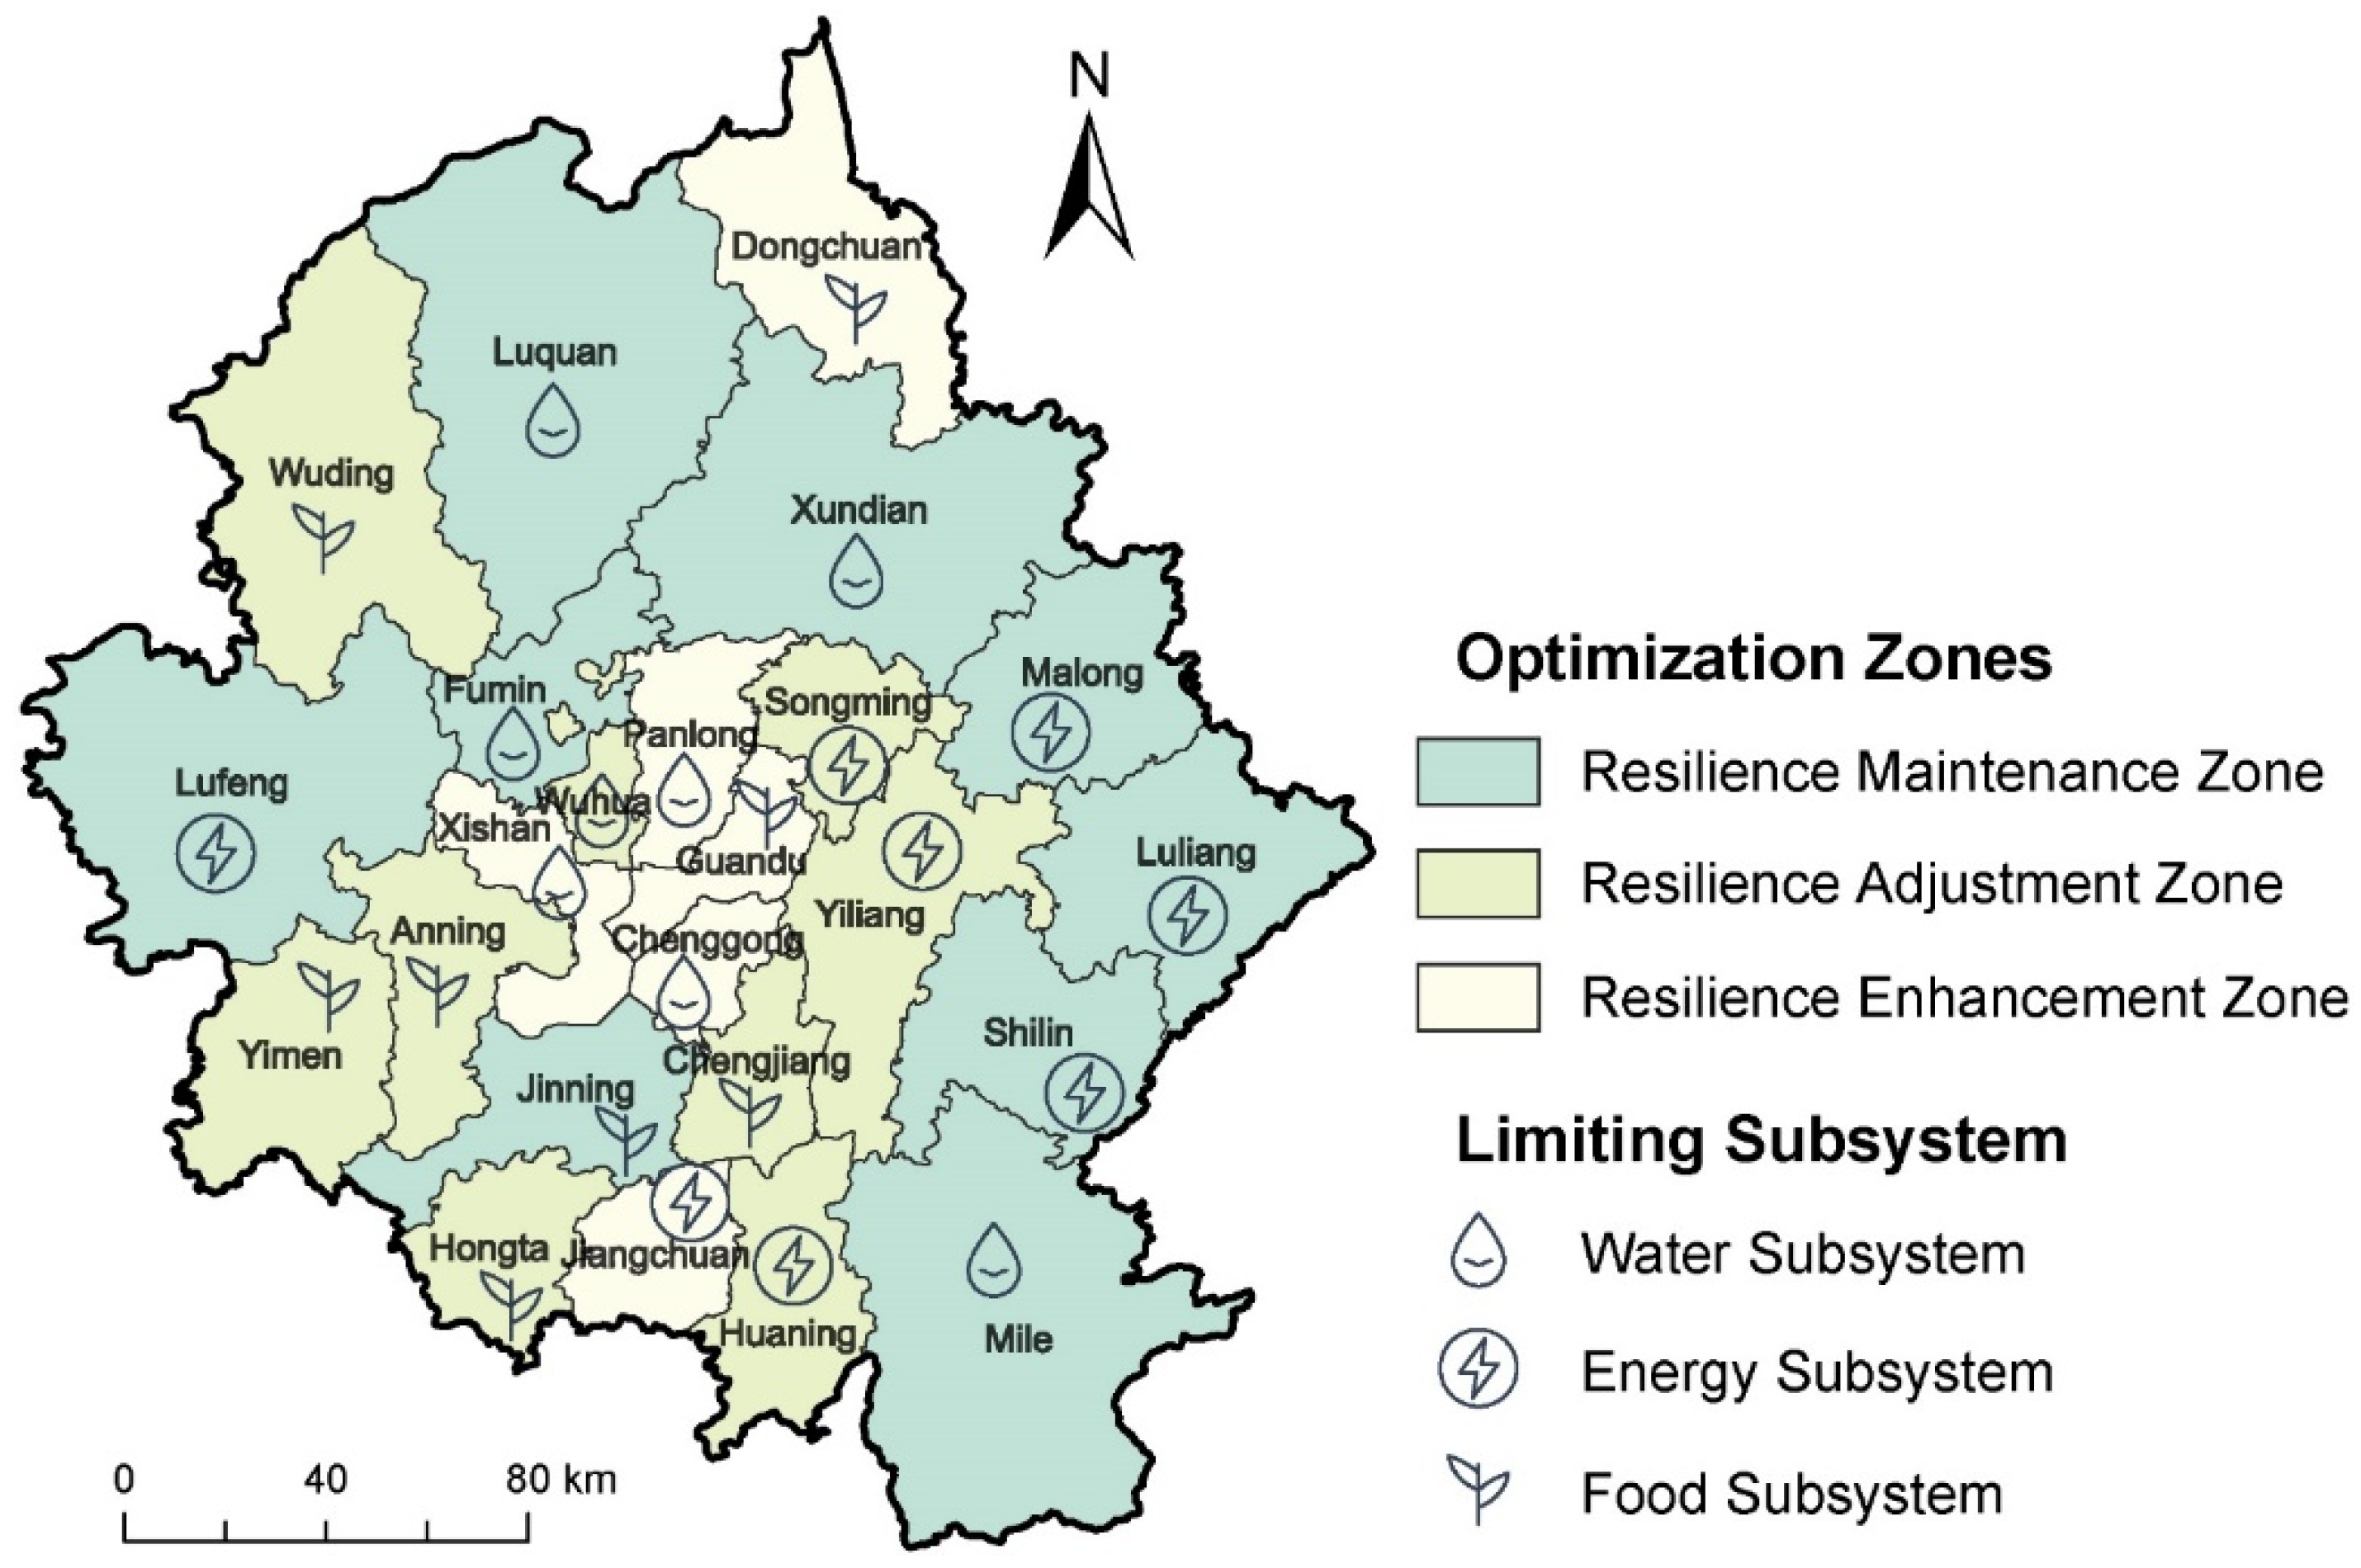
The Resilience Maintenance Zone encompasses nine counties, Jinning, Shilin, Fumin, Malong, Xundian, Luliang, Luquan, Lufeng, and Mile, with a mean comprehensive resilience of 0.7672 (Figure 6). Geographically, this zone is predominantly situated in the periphery of the Kunming Metropolitan Area, distant from the core urban agglomeration. Consequently, urbanization and industrialization pressures remain relatively low, preserving a robust ecological foundation for the W–E–F nexus. Regarding internal constraints, Fumin, Xundian, Luquan, and Mile are limited by the water subsystem, primarily attributable to low per capita water resources and utilization rates in these mountainous areas. Shilin, Malong, Luliang, and Lufeng face constraints from the energy subsystem, stemming largely from low energy self-sufficiency rates and a high reliance on primary energy consumption. Jinning is constrained by the food subsystem, a result of its limited grain sowing area and per capita grain output.
Figure 6.
Optimization Zones of the W–E–F Nexus Resilience in the Kunming Metropolitan Area.
The Resilience Adjustment Zone comprises nine counties, Wuhua, Hongta, Songming, Huaning, Chengjiang, Wuding, Yiliang, Anning, and Yimen, with a mean comprehensive resilience of 0.6642. While its average water subsystem resilience approximates that of the Maintenance Zone, the average food subsystem resilience is significantly lower. Spatially, this zone occupies the transition belt between the core urban area and the periphery, covering Kunming’s suburbs and the core districts of neighboring cities (e.g., Hongta in Yuxi). Consequently, it bears the dual functions of urban expansion and rural development. In terms of constraints, Wuhua is limited by the water subsystem; as a core district of Kunming, its high population density and concentrated industrial activities generate excessive water demand. Songming, Huaning, and Yiliang are constrained by the energy subsystem, primarily due to insufficient energy supply capabilities and high external dependency. Hongta, Chengjiang, Wuding, Anning, and Yimen are constrained by the food subsystem, where rapid urbanization has encroached upon high-quality arable land, significantly diminishing food production capacity.
The Resilience Enhancement Zone includes six counties, Guandu, Dongchuan, Xishan, Chenggong, Jiangchuan, and Panlong, recording a mean comprehensive resilience of 0.5340. Spatially, this zone is concentrated within Kunming’s core urban districts (e.g., Guandu, Panlong) and resource-exhausted areas (e.g., Dongchuan). Subject to high-intensity anthropogenic activities and ecological pressure, the W–E–F nexus here encounters the most severe challenges. Xishan, Chenggong, and Panlong are constrained by the water subsystem. Notably, Xishan exhibits the lowest water subsystem resilience in the metropolitan area, a consequence of complex mountainous terrain and low utilization rates. Jiangchuan is limited by the energy subsystem, owing to lagging energy infrastructure and a low proportion of clean energy consumption. Guandu and Dongchuan are constrained by the food subsystem. In particular, Guandu’s arable land has been nearly exhausted by urban construction, rendering its food supply highly dependent on external sources and resulting in the lowest food subsystem resilience across the region.
4. Discussion
4.1. Potential Driving Pathways of the W–E–F Nexus Resilience
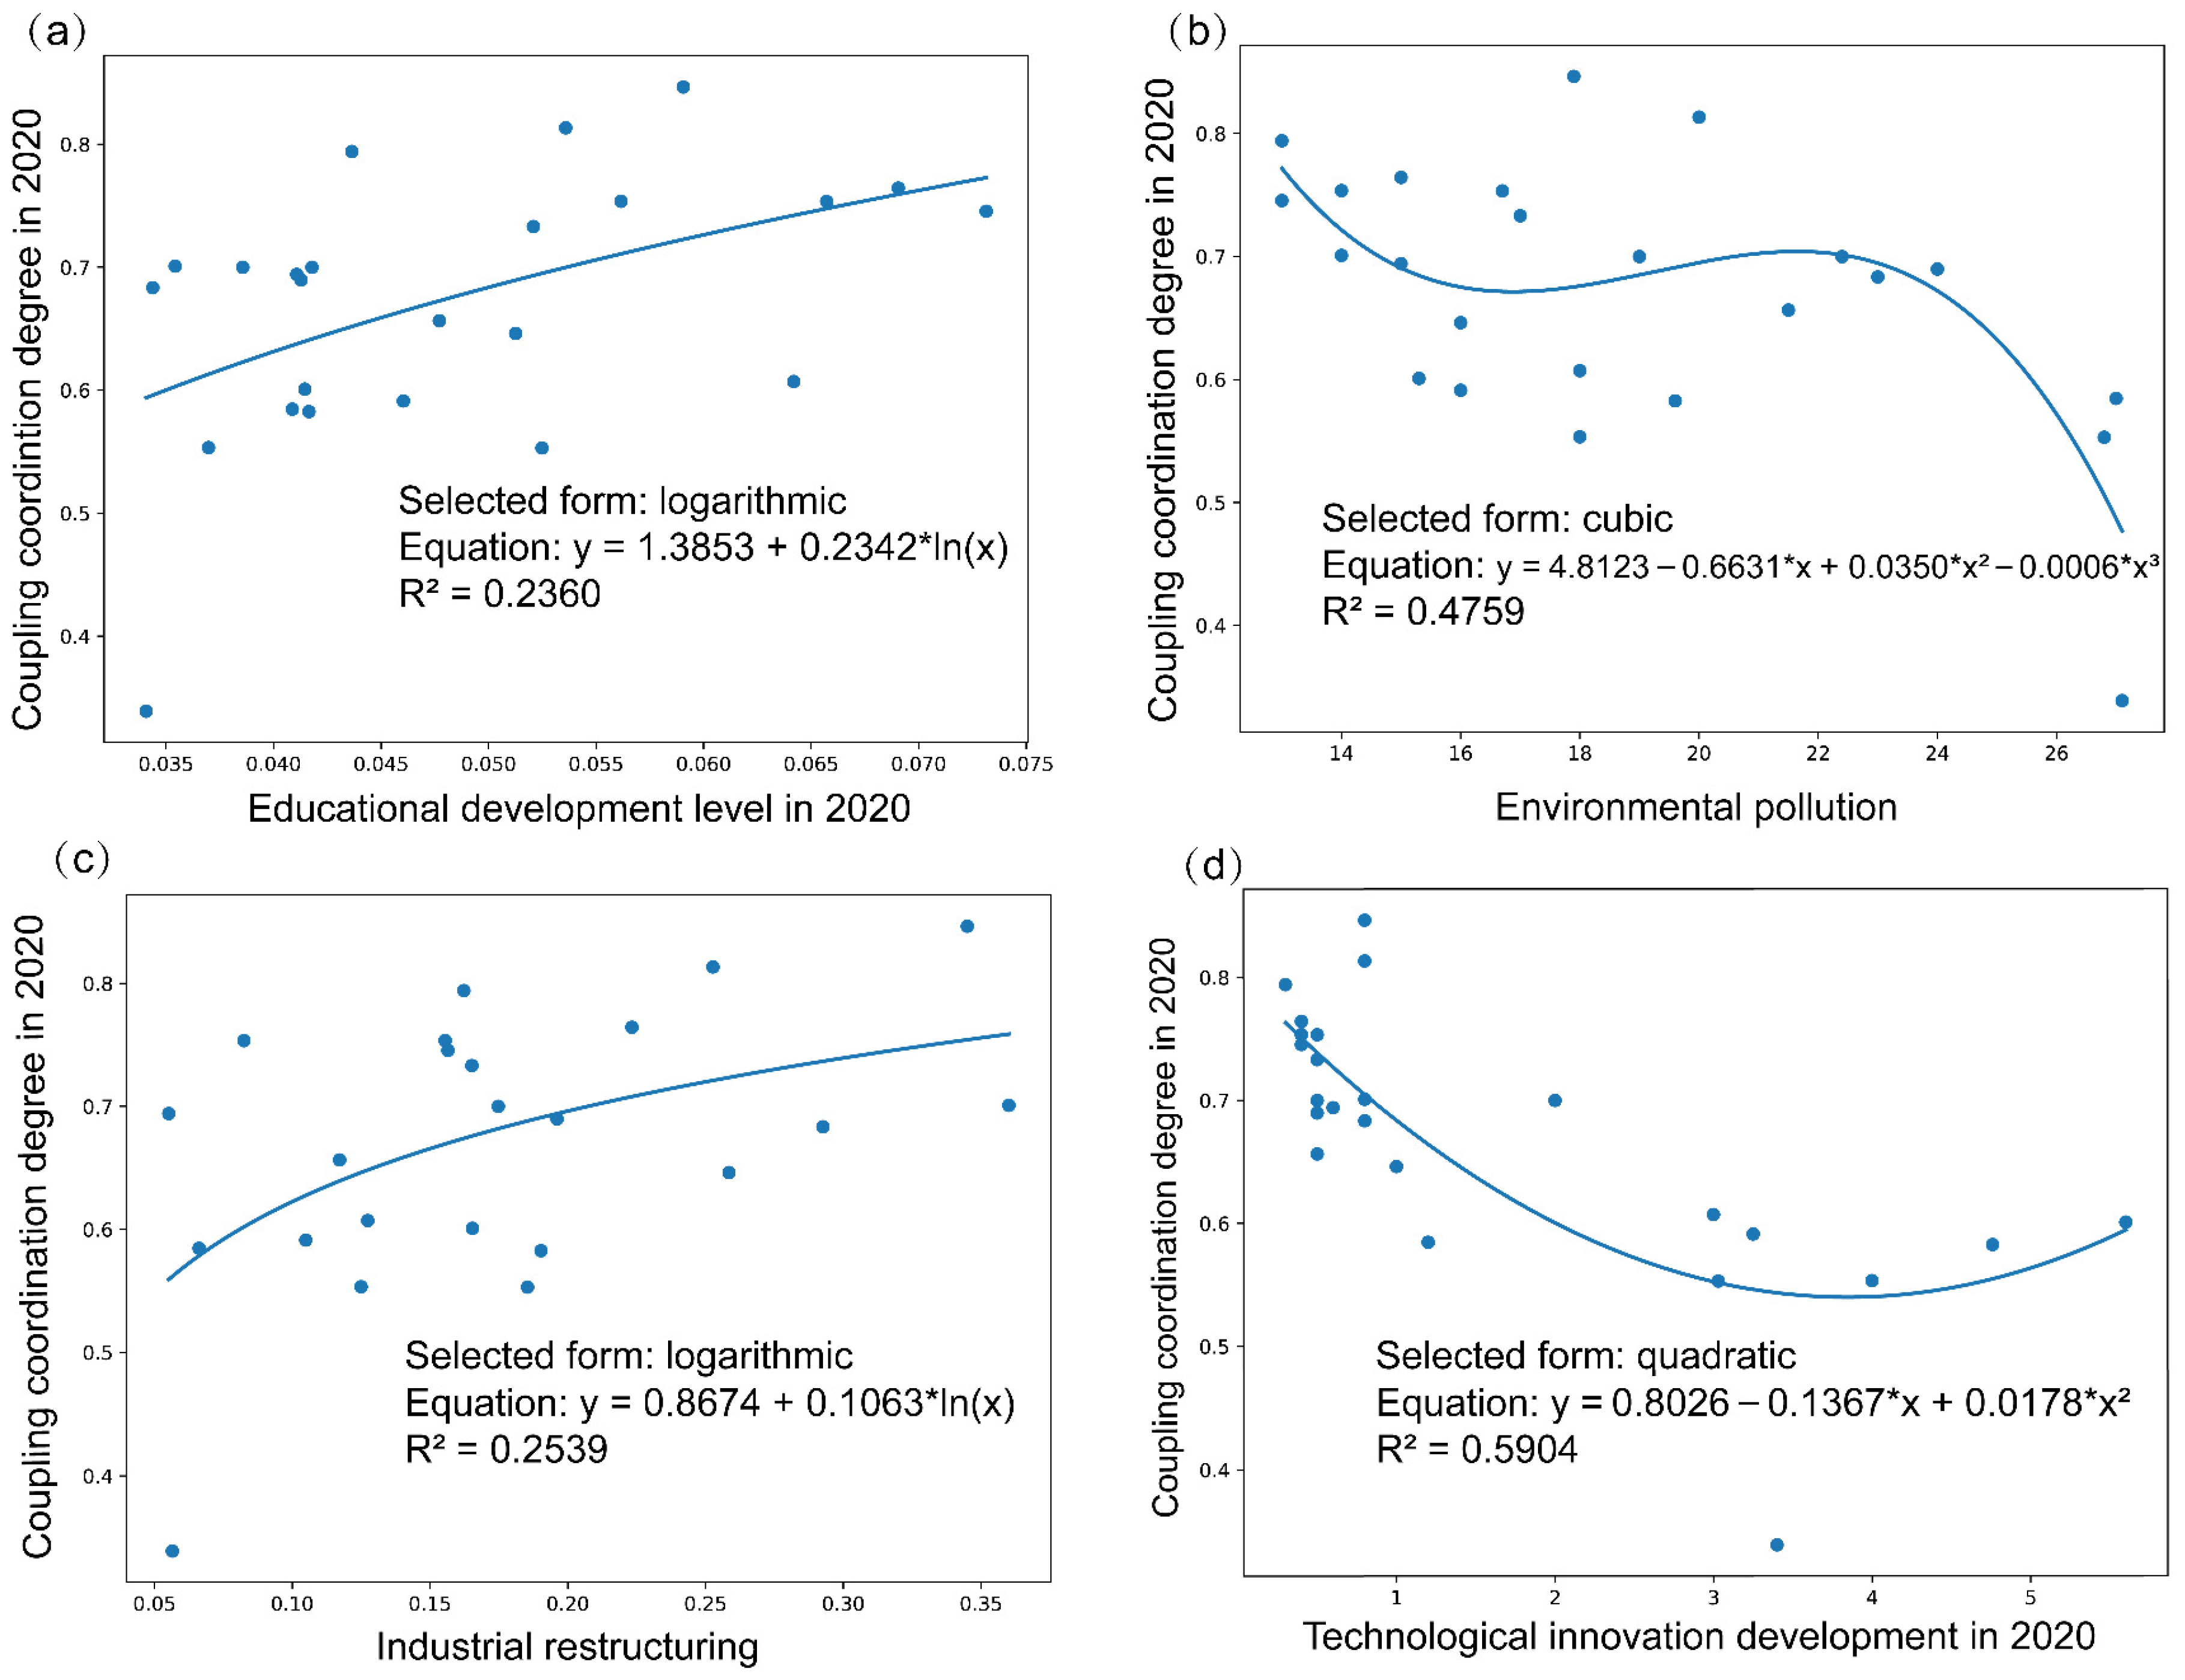
The coordinated evolution of the W–E–F nexus is shaped by a complex interplay between endogenous variables and exogenous drivers [7,31,38]. Whereas endogenous factors (e.g., resource utilization efficiency) delineate internal resource flows, exogenous drivers—such as climate change, urbanization, and institutional innovation—continuously reconfigure system resilience via the Pressure-State-Response mechanism [39,40]. To elucidate the specific pathways driving resilience enhancement within the Kunming Metropolitan Area, this study selected four potential driving factors—industrial restructuring, technological innovation development, educational development, and environmental pollution (Table 2)—and analyzed their correlations with system performance.
Table 2.
Potential Driving Factors of the W–E–F Nexus Resilience.
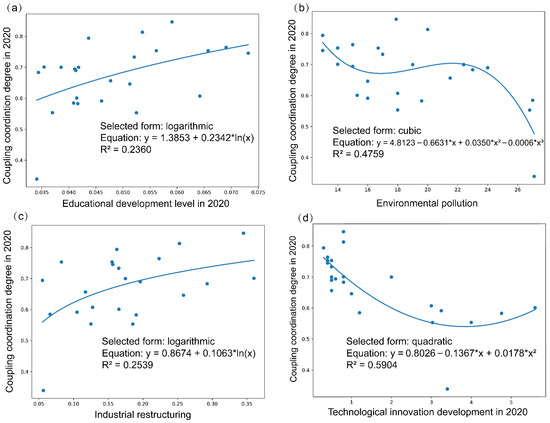
In Figure 7, technological innovation shows the strongest explanatory power and exhibits an evident nonlinear relationship with resilience, suggesting that its positive effects are threshold-dependent. Once innovation accumulation reaches a critical level, technological progress can substantially improve resource allocation efficiency, system metabolism, and adaptive capacity, thereby promoting resilience enhancement. In contrast, environmental pollution functions primarily as a constraining factor. Higher pollution levels weaken ecosystem regulation and environmental carrying capacity, thereby reducing the coordinated operational capacity of the W–E–F nexus. Industrial restructuring represents an important structural pathway through which resilience can be improved, as optimization of the industrial structure helps reduce resource pressure and enhances the efficiency and flexibility of regional development. Educational development, although relatively weaker in explanatory strength, provides indispensable human-capital support by facilitating technology diffusion, strengthening governance capacity, and improving the social basis of adaptation [41]. Overall, the results indicate that W–E–F resilience is not driven by a single factor, but rather by the combined action of innovation, ecological conditions, structural transformation, and human-capital accumulation. This further implies that resilience-oriented governance should prioritize coordinated advances in innovation promotion, environmental governance, industrial upgrading, and educational investment. Given the significant spatial heterogeneity of these driving factors (e.g., the drastic disparity in urbanization levels from the core to the periphery), this further underscores the necessity of implementing differentiated governance strategies.
Figure 7.
Correlation Analysis Between W–E–F Nexus Resilience and Potential Driving Factors. (a) Educational Development Level; (b) Environmental Pollution; (c) Industrial Restructuring; (d) Technological Innovation Development.
4.2. Resilience-Oriented Zoning Governance of the Water–Energy–Food Nexus
Based on the W–E–F nexus resilience assessment, zoning results, and relevant policy documents, this study proposes differentiated regulation pathways for the optimization zones. These recommendations should be understood as policy-oriented directions inferred from the resilience results, rather than direct engineering prescriptions. For the Resilience Maintenance Zone, governance should prioritize ecological conservation and infrastructure reinforcement, because these areas, although relatively resilient, still face structural risks related to resource mismatch and utilization inefficiency. In mountainous counties such as Xundian and Luquan, strengthening decentralized small-scale water facilities may be more adaptive than relying solely on large transfer systems, as previous studies [42] show that local water access, buffering capacity, and micro-scale adaptation are critical for agricultural resilience under climate variability. To alleviate the Energy–Food land-use conflict, Shilin may cautiously explore the Agrivoltaic (Agri-PV) model, namely the co-use of the same land for photovoltaic generation and agricultural production. Existing studies indicate that Agri-PV can improve land-use efficiency and, under suitable conditions, reduce evapotranspiration and water stress; however, these effects are highly dependent on crop type, panel configuration, and site conditions [43]. Therefore, unlike more generalized promotion strategies in previous studies, our recommendation is limited to pilot exploration after site-specific suitability assessment. For land-constrained areas such as Jinning, technology-intensive facility agriculture may be more feasible, which is consistent with studies emphasizing that improving output and water-use efficiency can be more effective than simple scale expansion [44].
Situated within the urban–rural transition belt and beset by intense land-use conflicts, the Resilience Adjustment Zone requires a governance strategy focused on “stock optimization and boundary control.” To mitigate severe water stress in areas like Wuhua District, enforcing Sponge City construction standards is imperative, utilizing green infrastructure such as permeable pavements and rain gardens to achieve natural accumulation and purification of rainwater, thereby alleviating urban waterlogging and replenishing groundwater. On the energy side, regions like Songming should leverage industrial plants and public building rooftops to advance county-wide distributed photovoltaic construction, reducing external energy dependency. Regarding the risk of “non-grain conversion” of arable land in Anning and Hongta, the red line for permanent basic farmland protection must be strictly enforced. Strict control over illegal land occupation by industrial and commercial capital is required, alongside high-standard farmland construction to improve land quality, preventing urban expansion from compromising food security resilience.
The Resilience Enhancement Zone encompasses resource-exhausted cities and high-density core districts, where the system operates under critical pressure, necessitating “ecological restoration and functional decoupling” strategies. For Dongchuan District, the primary pathway involves mine restoration and the secondary development of land resources. By remediating legacy mining sites and reclaiming damaged land into fertile fields suitable for characteristic agriculture in dry–hot valleys, the region can achieve a resilient transition from “mining dependency” to “ecological agriculture.” For core urban districts like Panlong and Guandu, the focus is on water environment governance and external resource allocation, expediting the implementation of rain–sewage diversion and the Central Yunnan Water Diversion Project to replace ecological water use. Meanwhile, Jiangchuan and similar areas should accelerate rural power grid upgrades to enhance carrying capacity for electrified agricultural facilities, supporting agricultural modernization through energy infrastructure leaps and breaking the negative feedback loop of inefficient resource use.
Furthermore, the spatial agglomeration characteristics and gradient disparities of the W–E–F nexus resilience in the Kunming Metropolitan Area necessitate a shift from isolated governance by individual administrative units to a cross-regional collaborative mechanism that transcends administrative boundaries. From the perspective of optimal resource allocation, the three types of zones exhibit significant functional complementarity in endowments and demands: the advantages in food, renewable energy, and water reserves of the Resilience Maintenance Zone are naturally complementary to the high-intensity demands of the Resilience Enhancement Zone. To address the severe resource–demand mismatch caused by administrative fragmentation, mechanisms such as cross-regional scheduling and supply–demand coordination are imperative. From the perspective of risk governance, the risk propagation mechanism of the W–E–F nexus implies that a local disruption can evolve into a region-wide crisis. Therefore, cross-regional risk assessment and joint response mechanisms based on regional characteristics are essential.
4.3. A Paradigm for Optimizing the W–E–F Nexus from a Geographical Perspective
A pivotal contribution of this study lies in bridging the gap between theoretical resilience assessment and practical zoning governance. By establishing a “Diagnosis–Zoning–Regulation” closed loop, the framework translates abstract resilience indices into tangible spatial units (namely, Resilience Enhancement, Adjustment, and Maintenance Zones). This spatialization of risk enables decision-makers to visualize cascading failure pathways—exemplified by how water scarcity in one zone might trigger energy insecurity in another—and to intercept these risks through targeted spatial interventions [19,20,45].
Furthermore, the framework advocates for “Horizontal Collaborative Governance” to dismantle the “silo effect” of sectoral management. Acknowledging the trade-offs within the nexus, it calls for the establishment of a cross-departmental coordination mechanism where water quotas, energy targets, and land-use plans are harmonized rather than conflicted. By integrating technological innovation (e.g., Internet of Things (IoT) monitoring) with institutional flexibility (e.g., unified resource planning), this approach cultivates a resilient system capable of self-organization, ensuring that local resource optimization contributes to the holistic synergy of the metropolitan area.
4.4. Limitations and Prospects
Although this study establishes a resilience-oriented zoning framework for the W–E–F nexus in the Kunming Metropolitan Area, certain limitations persist. Given the significant regional disparities in resource endowment, social development, economic foundations, and technological conditions, a broader spectrum of factors must be incorporated to ensure the scientific robustness of resilience enhancement strategies. Consequently, future evaluations should incorporate critical indicators, such as ecosystem service valuation and resource metabolic efficiency, to better capture complex feedback mechanisms [15,36,46]. Crucially, as the W–E–F nexus functions as a complex coupled system, future research must go beyond linear assumptions to reveal the spatial non-linear driving mechanisms underlying system resilience evolution [21]. By employing advanced methods such as spatial econometric models and geographically weighted regression-based algorithms, researchers can better understand how multidimensional factors interactively shape resilience across different spatial scales.
Furthermore, transitioning from static assessment to dynamic simulation represents a vital direction for future inquiry. Developing System Dynamics models that capture comprehensive mutual feedback mechanisms will enable the quantitative simulation of evolutionary trends and future scenarios [47]. This approach is essential for identifying security thresholds for water usage, food production, and energy generation under varying external shocks. Finally, the geographical scope should be expanded from the single metropolitan area to the entire Central Yunnan Urban Agglomeration or even larger regional scales. Investigating cross-scale interaction mechanisms within these broader domains, particularly by introducing complex network analysis, is critical for understanding the transition from local optimization to regional holistic collaboration, providing scientific support for shifting from a “single-core polarization” to a “multi-center networking” development model [48,49].
5. Conclusions
This study developed a multidimensional resilience assessment framework for the W–E–F nexus based on the Pressure–State–Response (PSR) model and applied it to the Kunming Metropolitan Area from 2005 to 2020. The results showed that the resilience of the water, energy, and food subsystems generally increased over time, but their evolutionary trajectories were asynchronous, reflecting differences in geographical conditions, resource endowment, and regional functions. At the integrated level, W–E–F nexus resilience exhibited a clear “Core–Periphery” spatial pattern and significant positive spatial autocorrelation, indicating that resilience is shaped not only by local conditions but also by spatial spillover effects among neighboring counties. Based on limiting factors and coupling coordination stages, the 24 counties were further classified into Resilience Enhancement, Adjustment, and Maintenance Zones, providing a basis for differentiated spatial governance.
Methodologically, this study demonstrates that the PSR-based framework is effective for capturing the combined influence of external pressures, internal system states, and governance responses on W–E–F resilience in ecologically fragile metropolitan regions. From a policy perspective, the zoning results provide a practical reference for moving from uniform management to place-based regulation, which may support more targeted decision-making in resource allocation, ecological protection, and infrastructure planning.
Several limitations should also be noted. First, the analysis is constrained by the availability and consistency of county-scale data. Second, although the indicator system was constructed systematically, some subjectivity remains in the weighting process. Third, since the framework was tested only in the Kunming Metropolitan Area, caution is needed when generalizing the findings to other regions with different socio-ecological conditions. Future research could extend this framework to other metropolitan or ecologically vulnerable regions, incorporate higher-resolution and more dynamic datasets, and further explore complex driving mechanisms through nonlinear modeling and spatially heterogeneous methods.
Supplementary Materials
The following supporting information can be downloaded at: https://www.mdpi.com/article/10.3390/su18094396/s1.
Author Contributions
Conceptualization, W.T., D.X. and Y.X.; methodology, Y.X.; validation, M.W., W.X. and Y.X.; resources, W.T. and Y.X.; data curation, D.X., M.W. and Y.X.; writing—original draft preparation, D.X.; writing—review and editing, W.T., D.X. and Y.X.; supervision, W.T., W.X. and Y.X.; project administration, Y.X.; funding acquisition, W.T. and D.X. All authors have read and agreed to the published version of the manuscript.
Funding
This research was funded by the Yunnan Provincial Department of Education Scientific Research Fund Project, China [Grant No. 2025J0014]; the Undergraduate Innovative Research Project of Yunnan University, China [Grant No. 20241027].
Institutional Review Board Statement
Not applicable.
Informed Consent Statement
Not applicable.
Data Availability Statement
The original contributions presented in this study are included in the article and Supplementary Materials. Further inquiries can be directed to the corresponding author.
Conflicts of Interest
The authors declare no conflicts of interest.
References
- Al-Saidi, M.; Elagib, N.A. Towards Understanding the Integrative Approach of the Water, Energy and Food Nexus. Sci. Total Environ. 2017, 574, 1131–1139. [Google Scholar] [CrossRef] [Scilit]
- Huntington, H.P.; Schmidt, J.I.; Loring, P.A.; Whitney, E.; Aggarwal, S.; Byrd, A.G.; Dev, S.; Dotson, A.D.; Huang, D.; Johnson, B.; et al. Applying the Food–Energy–Water Nexus Concept at the Local Scale. Nat. Sustain. 2021, 4, 672–679. [Google Scholar] [CrossRef] [Scilit]
- Leck, H.; Conway, D.; Bradshaw, M.; Rees, J. Tracing the Water–Energy–Food Nexus: Description, Theory and Practice. Geogr. Compass 2015, 9, 445–460. [Google Scholar] [CrossRef] [Scilit]
- Biggs, E.M.; Bruce, E.; Boruff, B.; Duncan, J.M.A.; Horsley, J.; Pauli, N.; McNeill, K.; Neef, A.; Van Ogtrop, F.; Curnow, J.; et al. Sustainable Development and the Water–Energy–Food Nexus: A Perspective on Livelihoods. Environ. Sci. Policy 2015, 54, 389–397. [Google Scholar] [CrossRef] [Scilit]
- Li, J.; Tian, G.; Wu, Z.; Niu, X.; Lou, Z.; Zhao, Q.; Xia, Q.; Zhang, J. A Regionally Adaptive Framework for Water-Energy-Food Nexus Resilience: Multi-Method Spatiotemporal Analysis in the Yellow River Basin. Humanit. Soc. Sci. Commun. 2025, 12, 1545. [Google Scholar] [CrossRef] [Scilit]
- Shu, Q.; Scott, M.; Todman, L.; McGrane, S.J. Development of a Prototype Composite Index for Resilience and Security of Water-Energy-Food (WEF) Systems in Industrialised Nations. Environ. Sustain. Indic. 2021, 11, 100124. [Google Scholar] [CrossRef] [Scilit]
- Xu, D.; Hu, J.; Wang, C.; Wang, H.; Li, Z.; Dong, J.; Li, J. Quantitative Characterization of Resilience and Analysis of Driving Mechanisms in the Water-Energy-Food Nexus System of Major Grain-Producing Regions. J. Hydrol. 2025, 663, 134201. [Google Scholar] [CrossRef] [Scilit]
- An, H.; Li, X.; Huang, J.; Wu, H. Synergistic Evolution of Water-Energy-Food System Resilience and Efficiency in Urban Agglomerations. J. Environ. Manag. 2024, 355, 120371. [Google Scholar] [CrossRef] [Scilit]
- Tian, G.; Li, J.; Wu, Z.; Zhao, Q.; Xia, Q.; Zhang, J.; Niu, X. Unveiling the Resilience of the Water-Energy-Food Nexus: A Context-Specific Framework and Evolutionary Insights for the Yellow River Basin. Agric. Water Manag. 2025, 315, 109514. [Google Scholar] [CrossRef] [Scilit]
- Meerow, S.; Newell, J.P.; Stults, M. Defining Urban Resilience: A Review. Landsc. Urban Plan. 2016, 147, 38–49. [Google Scholar] [CrossRef] [Scilit]
- Huang, R.; Han, Y. Differentiated Optimization Policies for Water–Energy–Food Resilience Security: Empirical Evidence Based on Shanxi Province and the GWR Model. Water 2025, 17, 1540. [Google Scholar] [CrossRef] [Scilit]
- Eriksson, N.; Avellán, T.; Teutschbein, C.; Blicharska, M. Towards a Common Understanding of Water-Energy-Food Nexus Research: A View of the European Nexus Community and Beyond. Sci. Total Environ. 2025, 967, 178775. [Google Scholar] [CrossRef] [Scilit]
- Ma, Y.; Meng, J.; Han, Z.; Wang, Q.; Wang, M.; Zhang, Q. Water–Energy–Food Nexus Security and New Quality Productive Forces in China: Coupling Coordination and Drivers. Sustain. Horiz. 2025, 16, 100167. [Google Scholar] [CrossRef] [Scilit]
- Huang, D.; Wen, F.; Li, G.; Wang, Y. Coupled Development of the Urban Water-Energy-Food Nexus: A Systematic Analysis of Two Megacities in China’s Beijing-Tianjin-Hebei Area. J. Clean. Prod. 2023, 419, 138051. [Google Scholar] [CrossRef] [Scilit]
- Yin, D.; Yu, H.; Shi, Y.; Zhao, M.; Zhang, J.; Li, X. Matching Supply and Demand for Ecosystem Services in the Yellow River Basin, China: A Perspective of the Water-Energy-Food Nexus. J. Clean. Prod. 2023, 384, 135469. [Google Scholar] [CrossRef] [Scilit]
- Wang, S.; Yang, J.; Wang, A.; Liu, T.; Du, S.; Liang, S. Coordinated Analysis and Evaluation of Water–Energy–Food Coupling: A Case Study of the Yellow River Basin in Shandong Province, China. Ecol. Indic. 2023, 148, 110138. [Google Scholar] [CrossRef] [Scilit]
- Ouyang, Y.; Cai, Y.; Xie, Y.; Yue, W.; Guo, H. Multi-Scale Simulation and Dynamic Coordination Evaluation of Water-Energy-Food and Economy for the Pearl River Delta City Cluster in China. Ecol. Indic. 2021, 130, 108155. [Google Scholar] [CrossRef] [Scilit]
- Zhang, T.; Tan, Q.; Zhang, T.; He, L.; Yu, X.; Zhang, S. A Multi-Objective Optimization Decision-Making Methodology for Fostering Synergies in the Water-Energy-Food Nexus. J. Clean. Prod. 2024, 479, 144051. [Google Scholar] [CrossRef] [Scilit]
- Xu, Y.; Zhao, X.; Huang, P.; Pu, J.; Ran, Y.; Zhou, S.; Zhao, Q.; Feng, Y.; Tang, Y.; Tao, J.; et al. A New Framework for Multi-Level Territorial Spatial Zoning Management: Integrating Ecosystem Services Supply-Demand Balance and Land Use Structure. J. Clean. Prod. 2024, 441, 141053. [Google Scholar] [CrossRef] [Scilit]
- Zhao, X.; Xu, Y.; Pu, J.; Tao, J.; Chen, Y.; Huang, P.; Shi, X.; Ran, Y.; Gu, Z. Achieving the Supply-Demand Balance of Ecosystem Services through Zoning Regulation Based on Land Use Thresholds. Land Use Policy 2024, 139, 107056. [Google Scholar] [CrossRef] [Scilit]
- Xu, Y.; Wang, M.; Tang, W.; Li, S.; Ai, W.; Xu, W.; Xu, D.; Liu, C.; Sun, J.; Cui, W. Territorial Spatial Carbon Balance Governance from a Spatially Refined Perspective: Incorporating Sub-Regional Differences in Spatial Driving Effects into Zoning Regulation. Environ. Impact Assess. Rev. 2026, 117, 108222. [Google Scholar] [CrossRef] [Scilit]
- Yang, K.; Han, Q.; de Vries, B. Urbanization Effects on the Food-Water-Energy Nexus within Ecosystem Services: A Case Study of the Beijing-Tianjin-Hebei Urban Agglomeration in China. Ecol. Indic. 2024, 160, 111845. [Google Scholar] [CrossRef] [Scilit]
- Fan, J.; Wang, Y.; Wang, C.; Chen, T.; Jin, F.; Zhang, W.; Li, L.; Xu, Y.; Dai, E.; Tao, A.; et al. Reshaping the Sustainable Geographical Pattern: A Major Function Zoning Model and Its Applications in China. Earths Future 2019, 7, 25–42. [Google Scholar] [CrossRef] [Scilit]
- Zhao, W.; Ni, Z.; Yin, C.; Liu, Y.; Pereira, P. Research Framework for Integrated Geography: Composite Driving–System Evolution–Coupling Mechanism–Synergistic Regulation. Geogr. Sustain. 2025, 6, 100321. [Google Scholar] [CrossRef] [Scilit]
- Van Vuuren, D.P.; Bijl, D.L.; Bogaart, P.; Stehfest, E.; Biemans, H.; Dekker, S.C.; Doelman, J.C.; Gernaat, D.E.H.J.; Harmsen, M. Integrated Scenarios to Support Analysis of the Food–Energy–Water Nexus. Nat. Sustain. 2019, 2, 1132–1141. [Google Scholar] [CrossRef] [Scilit]
- Fu, X.; Liu, Y.; Xie, Z.; Jiang, F.; Xu, J.; Yang, Z.; Deng, Z.; Wang, Q.; Liao, M.; Wu, X.; et al. A Coupled PSR-Based Framework for Holistic Modeling and Flood Resilience Assessment: A Case Study of the 2022 Flood Events in Five Southern Provinces of China. J. Hydrol. 2024, 636, 131255. [Google Scholar] [CrossRef] [Scilit]
- Jiao, L.; Wang, L.; Lu, H.; Fan, Y.; Zhang, Y.; Wu, Y. An Assessment Model for Urban Resilience Based on the Pressure-State-Response Framework and BP-GA Neural Network. Urban Clim. 2023, 49, 101543. [Google Scholar] [CrossRef] [Scilit]
- Liu, L.; Chen, J.; Wang, C. Spatiotemporal evolution and trend prediction of regional water–energy–food–ecology system vulnerability: A case study of the Yangtze River Economic Belt, China. Environ. Geochem. Health 2023, 45, 9621–9638. [Google Scholar] [CrossRef] [Scilit] [PubMed]
- Xia, Q.; Tian, G.; Zhao, D.; Zhao, Q.; Varis, O. Effects of New-Type Urbanization on Resource Pressure: Evidence from a Water-Energy-Food System Perspective in China. Sustain. Cities Soc. 2024, 107, 105411. [Google Scholar] [CrossRef] [Scilit]
- Zhu, Y.; Zhang, C.; Fang, J.; Miao, Y. Paths and Strategies for a Resilient Megacity Based on the Water-Energy-Food Nexus. Sustain. Cities Soc. 2022, 82, 103892. [Google Scholar] [CrossRef] [Scilit]
- Lu, Z.; Yang, S.; Chen, W.; Lu, L.; Fan, Y.; Yue, C.; Shi, Y. Coupling Coordination and Driving Factors of the Water-Energy-Food Nexus in China: A Sustainable Development Perspective. Energy Nexus 2025, 20, 100545. [Google Scholar] [CrossRef] [Scilit]
- Zhang, Z.; Xu, Y. Evaluation of Water—Energy—Food—Economy Coupling Efficiency Based on Three-Dimensional Network Data Envelopment Analysis Model. Water 2022, 14, 3133. [Google Scholar] [CrossRef] [Scilit]
- Hu, Y.; Duan, W.; Zou, S.; Chen, Y.; De Maeyer, P.; Van de Voorde, T.; Takara, K.; Kayumba, P.M.; Kurban, A.; Goethals, P.L.M. Coupling Coordination Analysis of the Water-Food-Energy-carbon Nexus for Crop Production in Central Asia. Appl. Energy 2024, 369, 123584. [Google Scholar] [CrossRef] [Scilit]
- Huan, Y.; Ji, L.; Su, Y.; Kong, F.; Lan, Y.; Feng, Z.; Wang, S.; Liang, T.; Wang, M.; Mo, P.; et al. Global Governance Priorities Derived from SDG Spatiotemporal Dynamics and Causal Interactions. Gondwana Res. 2026, 151, 242–253. [Google Scholar] [CrossRef] [Scilit]
- Wang, H.; Shi, Q.; Li, H.; Di, D.; Li, Z.; Jiang, M. Spatiotemporal evolution of water ecological footprint based on the emergy-spatial autocorrelation method. Environ. Sci. Pollut. Res. 2023, 30, 47844–47860. [Google Scholar] [CrossRef] [Scilit]
- Anselin, L. Local Indicators of Spatial Association—LISA. Geogr. Anal. 1995, 27, 93–115. [Google Scholar] [CrossRef] [Scilit]
- Wang, S.; Kong, W.; Ren, L.; Ye, D.; Dai, B. Research on misuses and modification of coupling coordination degree model in China. J. Nat. Resour. 2021, 36, 793–810. [Google Scholar] [CrossRef] [Scilit]
- Wen, C.; Dong, W.; Zhang, Q.; He, N.; Li, T. A System Dynamics Model to Simulate the Water-Energy-Food Nexus of Resource-Based Regions: A Case Study in Daqing City, China. Sci. Total Environ. 2022, 806, 150497. [Google Scholar] [CrossRef] [Scilit] [PubMed]
- Dong, Q.; Zhong, K.; Liao, Y.; Xiong, R.; Wang, F.; Pang, M. Coupling Coordination Degree of Environment, Energy, and Economic Growth in Resource-Based Provinces of China. Resour. Policy 2023, 81, 103308. [Google Scholar] [CrossRef] [Scilit]
- Raviv, O.; Palatnik, R.R.; Castellini, M.; Gusperti, C.; Vergalli, S.; Sirota, J.; Shechter, M. Synergies of CGE and IAM Modelling for Climate Change Implications on WEFE Nexus in the Mediterranean. Clim. Risk Manag. 2024, 44, 100608. [Google Scholar] [CrossRef] [Scilit]
- Li, G.; Kang, D.; Hao, M.; Liang, L.; He, L. Spatial-Temporal Characteristics and Driving Factors of Collaborative Security of Water-Energy-Food Linkage System in the Yellow River Basin. Geogr. Geo-Inf. Sci. 2024, 40, 84–91. [Google Scholar]
- Sahoo, S.; Singha, C.; Govind, A.; Moghimi, A. Review of climate-resilient agriculture for ensuring food security: Sustainability opportunities and challenges of India. Environ. Sustain. Indic. 2025, 25, 100544. [Google Scholar] [CrossRef] [Scilit]
- GEF Scientific and Technical Advisory Panel. Agrivoltaics: Sustainable Use of Land for Solar Energy and Agriculture; Global Environment Facility: Washington, DC, USA, 2024; Available online: https://www.stapgef.org/resources/advisory-documents/agrivoltaics (accessed on 15 March 2026).
- Solar Energy Industries Association. Agrivoltaics: Considerations for Co-Locating Solar and Agricultural Practices. 2024. Available online: https://cleanpower.org/resources/agrivoltaics-considerations-for-colocating-solar-and-agricultural-practices/ (accessed on 15 March 2026).
- Fan, J. A Century of Integrated Research on the Human-Environment System in Chinese Human Geography. Prog. Hum. Geogr. 2022, 46, 988–1008. [Google Scholar] [CrossRef] [Scilit]
- Villarroel Walker, R.; Beck, M.B.; Hall, J.W.; Dawson, R.J.; Heidrich, O. The Energy-Water-Food Nexus: Strategic Analysis of Technologies for Transforming the Urban Metabolism. J. Environ. Manag. 2014, 141, 104–115. [Google Scholar] [CrossRef] [Scilit]
- Sušnik, J. Data-Driven Quantification of the Global Water-Energy-Food System. Resour. Conserv. Recycl. 2018, 133, 179–190. [Google Scholar] [CrossRef] [Scilit]
- Liu, J.; Hull, V.; Godfray, H.C.J.; Tilman, D.; Gleick, P.; Hoff, H.; Pahl-Wostl, C.; Xu, Z.; Chung, M.G.; Sun, J.; et al. Nexus Approaches to Global Sustainable Development. Nat. Sustain. 2018, 1, 466–476. [Google Scholar] [CrossRef] [Scilit]
- White, D.D.; Jones, J.L.; Maciejewski, R.; Aggarwal, R.; Mascaro, G. Stakeholder Analysis for the Food-Energy-Water Nexus in Phoenix, Arizona: Implications for Nexus Governance. Sustainability 2017, 9, 2204. [Google Scholar] [CrossRef] [Scilit]

Disclaimer/Publisher’s Note: The statements, opinions and data contained in all publications are solely those of the individual author(s) and contributor(s) and not of MDPI and/or the editor(s). MDPI and/or the editor(s) disclaim responsibility for any injury to people or property resulting from any ideas, methods, instructions or products referred to in the content. |
© 2026 by the authors. Licensee MDPI, Basel, Switzerland. This article is an open access article distributed under the terms and conditions of the Creative Commons Attribution (CC BY) license.