Article

New-Quality Marine Productive Forces and High-Quality Development of the Marine Economy in China: Mediating Mechanisms and Threshold Effect

School of Economics and Management, Dalian Ocean University, Dalian 116023, China
*
Author to whom correspondence should be addressed.
Sustainability 2026, 18(9), 4377; https://doi.org/10.3390/su18094377
Submission received: 27 March 2026 / Revised: 20 April 2026 / Accepted: 21 April 2026 / Published: 29 April 2026

Abstract

With the implementation of China’s strategy to build a maritime power, new-quality marine productive forces have emerged as an important driver of high-quality development in the marine economy. Based on panel data from 11 coastal provinces in China covering the period 2013–2022, this study constructs a comprehensive evaluation index system for both new-quality marine productive forces and the high-quality development of the marine economy. It employs the entropy method to calculate a composite development index and uses panel models, mediation effect models, and threshold regression models to examine the mechanism through which new-quality marine productive forces influence the high-quality development of the marine economy. The study finds the following: (1) New-quality marine productive forces are positively associated with the high-quality development of the marine economy. (2) They are also positively associated with marine science and technology innovation, which in turn is associated with the high-quality development of the marine economy, suggesting a partial mediating role. (3) The level of economic development plays a nonlinear moderating role: the positive association is not significant at lower levels of economic development, strengthens at moderate levels, and weakens at higher levels.

1. Introduction

In recent years, China has integrated the building of a maritime power into the overall layout of Chinese-style modernization, clearly stating it as an important strategic task for national development [1]. As a vital component of the national economy, the marine economy has become an important contributor to China’s economic growth [2]. According to preliminary estimates, China’s gross ocean product (GOP) reached 10.5438 trillion yuan in 2024, marking the first time it has exceeded 10 trillion yuan. China’s marine economy has shown robust growth momentum. The sustained prosperity of the marine economy has not only injected new vitality into economic growth but also provided important support for advancing marine science and technology innovation and enhancing the competitiveness of marine industries [3]. Currently, academic research on high-quality marine economic development focuses on three aspects. The first concerns its connotation [4,5,6,7]. High-quality marine economic development refers to a development pattern in which innovation serves as the core driving force during marine resource exploitation and production, green development principles are implemented, and the rational use of marine resources is promoted alongside the openness of coastal cities, ultimately achieving coordinated development across marine systems. This model reflects the integration of the five development concepts—innovation, coordination, green, openness, and shared into the marine sector, representing a theoretical advancement in marine development models for the new era. The second aspect concerns evaluation and measurement. Existing studies mainly use multi-indicator evaluation models to measure the development levels of China’s coastal provinces. The development of the marine economy is no longer solely about expanding total output but places more emphasis on the integration of scale and quality, reflecting a systematic combination of development, innovation, coordination, and sustainability [8,9]. The third aspect concerns pathways to achieving high-quality marine economic development. Some scholars suggest that factors influencing this process include the digital economy [10], marine ecological security [11], and industrial upgrading [12]. For example, Wei et al. highlighted the role of the digital economy in empowering high-quality marine development, identifying transmission channels related to resource allocation efficiency and industrial upgrading [13]. Yi et al., adopting a green finance perspective, found that green finance significantly promotes the high-quality development of the marine economy through the mediating effect of green technological innovation [14], and that this relationship exhibits nonlinear characteristics with technological innovation levels serving as a threshold.
In September 2023, the concept of “new-quality productive forces” was first introduced to accelerate the transformation of the economic growth model through innovation and to foster its development [15]. As the concrete manifestation of the theory of new-quality productive forces in the maritime sector, marine new-quality productive forces both follow the general laws governing the evolution of new-quality productive forces and exhibit significant differences due to the unique characteristics of the maritime industry; they demonstrate an overall trend of dynamic development in the process of building a unified national market, while also forming regional characteristics within the competitive and cooperative relationships among coastal regions. Marine new-quality productive forces possess three distinct features. First, the workforce is becoming increasingly high-skilled, requiring mastery of interdisciplinary knowledge and practical maritime capabilities. Second, the means of production are becoming intelligent, relying on digital technologies such as future industries and artificial intelligence. Third, the objects of labor are expanding from nearshore to deep-sea, polar regions, and marine biological resources. At the same time, due to the resource-dependent nature, ecological fragility, and international openness of the marine economy, marine new-quality productive forces inherently incorporate special dimensions such as green environmental constraints and responses to marine pollutant emissions, which distinguish them from terrestrial new-quality productive forces.
Regarding research on new-quality productive forces, the domestic academic community has made initial progress; however, studies on marine new-quality productive forces remain limited. This is primarily reflected in four areas. First, research on the theoretical connotations of marine new-quality productive forces. The core essence of the transformation and energy-level leap of marine new-quality productive forces is concentrated in the two dimensions of “new” and “quality,” emphasizing “promoting the new through quality” and “driving quality through the new” [16,17]. Second, research on measurement methods for marine new-quality productive forces. Currently, most scholars employ methods such as the entropy-weighted Topsis method, the Gini coefficient, kernel density estimation, spatio-temporal convergence models, the Moran’s I index, and spatial Markov chains [18,19,20,21] to measure the development level of China’s marine new-quality productive forces. Third, research on the indicator system for the level of marine new-quality productive forces. Currently, scholars focus on constructing an indicator system for China’s marine new-quality productive forces based on the three new types of factors [22]; they also explore the indicator system from various research perspectives, such as constructing it around four aspects: scientific and technological productive forces, green productive forces, digital productive forces, and open productive forces [23]. Fourth, research on the impact of marine new-quality productive forces on other variables. For instance, Gao et al. examined the impact of marine new-quality productive forces on the resilience of the marine economy, finding that they are positively associated with the marine economy’s resistance, recovery, and evolutionary capabilities, with a stronger promotional effect on underdeveloped marine economic zones [24].
The formation and deepening of new-quality marine productive forces essentially rely on the continuous advancement of marine science and technology innovation; scientific and technological innovation and industrial upgrading will be the core areas for fostering new-quality productive forces. To advance the development of new-quality marine productive forces, we must firmly adhere to the strategic orientation of “strengthening the nation through the sea and pursuing dreams in the deep blue,” with the goal of high-quality development of the marine economy. By accelerating the efficient development and utilization of marine resources, we can fully leverage the driving role of new-quality productive forces. Research into the dynamic mechanisms through which new-quality marine productive forces empower the high-quality development of the marine economy is a critical issue in the current marine economic field; however, related discussions are still in their infancy, and research progress remains insufficient [25,26], with certain limitations remaining in terms of research perspectives and mediating mechanisms. To fully tap into the development potential of the blue economy, there is an urgent need to systematically clarify the cultivation pathways and supporting mechanisms of new-quality marine productivity, and to conduct in-depth research on its measurement, optimization, and regulatory approaches.
This paper focuses on the impact of new-quality marine productive forces on the high-quality development of the marine economy, as well as the scientific measurement, systematic optimization, and effective regulation of its development level. Utilizing panel data from 11 coastal provinces in China from 2013 to 2022, this study investigates the direct enabling effects, indirect mechanisms, and threshold effects of new-quality marine productive forces on the high-quality development of the marine economy, thereby providing decision-making references for advancing the strategy to build a maritime power. The marginal contributions of this paper are primarily reflected in three aspects. First, addressing the issue that existing research has insufficiently addressed the multidimensional connotations of “high-quality development,” this paper constructs an analytical framework that integrates sustainable development and new economic growth theories. It systematically elucidates the intrinsic logic by which new-quality marine productive forces empower the high-quality development of the marine economy and clarifies the connotations and dimensions of new-quality marine productive forces. Second, in response to the lack of clarity regarding mediating mechanisms, this study reveals the key mediating role of marine technological innovation in the relationship between the two, thereby supplementing the existing literature’s neglect of transmission mechanisms. Third, to address the issue of a single threshold variable, this study examines, for the first time, the dual threshold effect using the level of economic development as the threshold variable, revealing that the driving effect of new-quality marine productive forces exhibits a nonlinear characteristic of “initially strengthening and then slowing down” as economic development levels rise.

2. Theoretical Analysis and Research Hypotheses

2.1. Direct Impact of Marine New-Quality Productive Forces on the High-Quality Development of the Marine Economy

New-quality productive forces represent a new form of production emerging from the accelerated evolution of scientific and technological innovation against the backdrop of a society characterized by the deep integration of digitalization, informatization, and intelligentization. Their core components consist of three key elements: a highly skilled workforce, new means of production, and expanded objects of labor [27]. Unlike traditional productive forces, which primarily rely on resource inputs and scale expansion, new-quality productive forces emphasize technological breakthroughs, the restructuring of production factors, and business model innovation as core drivers, propelling a systemic transformation of production methods from extensive to intensive, and from factor-driven to innovation-driven. As a concrete manifestation in the marine sector, new-quality marine productive forces represent an advanced, innovation-driven form of productivity. While inheriting the general characteristics of new-quality productive forces, they exhibit a unique development logic due to the resource-dependent, technology-intensive, and internationally open nature of the marine industry. Specifically, marine new-quality productive forces systematically reshape the marine production function by cultivating high-quality workers with interdisciplinary knowledge and practical marine skills, applying new means of production represented by intelligent equipment and digital platforms, and expanding new objects of labor such as deep-sea, polar, and marine biological resources. The first dimension is the skill upgrading of these new-type workers. The high-quality, multidisciplinary marine workforce cultivated by marine new-quality productive forces is reflected in the continuous increase in the average years of education per capita in coastal regions, the expanding enrollment of university students in marine-related majors, and the steady growth in per capita output value and income. These workers not only possess interdisciplinary knowledge and advanced technologies but also effectively utilize digital and intelligent tools for marine resource development and ecological conservation, thereby considerably enhancing labor productivity and innovation efficiency, providing substantial human capital support for the high-quality development of the marine economy. The second dimension is the intelligent upgrading of new means of production. New means of production, represented by information technology services in coastal regions and enterprise digitalization, provide advanced digital platforms and R&D infrastructure for marine production activities. These means of production can notably improve the precision and efficiency of marine production activities, reduce resource consumption and environmental risks, and simultaneously drive the transformation of the marine industry toward high-end and green development.
The third dimension is the in-depth expansion of new objects of labor. New objects of labor, represented by the proportion of strategic emerging industries and future industries, give rise to new marine business models and open up new growth points for high-quality development. As an innovation-driven advanced productivity, marine new-quality productive forces help strengthen independent innovation capabilities in key marine technology fields, thereby substantially promoting an overall improvement in the level of marine scientific and technological innovation [28]. As a development paradigm aligned with new international rules, marine new-quality productive forces facilitate the coordinated utilization of both domestic and international resources, injecting new momentum into the transformation of the marine economic development model [29] and enhancing China’s competitive position and level of openness within the global value chain. Based on this, Hypothesis 1 is proposed.
Hypothesis 1. 
Marine new-quality productive forces have a considerable positive impact on the high-quality development of the marine economy.

2.2. The Mediating Effect of Marine Science and Technology Innovation on the Relationship Between Marine New-Quality Productive Forces and High-Quality Development of the Marine Economy

The realization of new-quality marine productive forces and the high-quality development of the marine economy rely heavily on the support of marine science and technology innovation. Marine science and technology innovation serves as a crucial link between the formation of new-quality productive forces and the achievement of high-quality development, and also acts as a core mechanism for integrating new types of workers, new means of production, and new objects of labor into productive forces.
However, China’s current innovation capacity in marine science and technology remains limited. This is reflected in a high dependence on foreign sources for key core technologies, insufficiently close collaboration among industry, academia, and research institutions, and low efficiency in the commercialization of innovation outcomes—issues that have become key constraints on marine economic growth [30]. Continuously improving the level of marine science and technology innovation may help break through key technological bottlenecks in the digital ocean, accelerate industrial digitalization, attract more high-level innovative talent [31], and promote technological progress and efficiency gains in the marine industry by overcoming technological barriers [32]. In terms of its mechanisms, marine technological innovation, as a core driver of high-quality marine economic development, can enhance firms’ technological absorption capacity and product value-added at the micro level; facilitate the optimization and upgrading of the marine industrial structure and value chain advancement at the meso level; and contribute to better coastal urban governance, higher resource utilization efficiency, and improved ecological quality, thereby strengthening urban sustainability at the macro level. Moreover, marine technological innovation can help raise the level of smart infrastructure in coastal regions; drive digital transformation in port logistics, marine monitoring, deep-sea exploration, and other key areas; and thus provide renewed momentum for high-quality marine economic development. Based on this, Hypothesis 2 is proposed.
Hypothesis 2. 
Marine new-quality productive forces are positively associated with the high-quality development of the marine economy through the mediating role of marine science and technology innovation.

2.3. The Threshold Effect of Economic Development Level on the Relationship Between Marine New-Quality Productive Forces and High-Quality Marine Economic Development

Improvements in the level of economic development help enhance the efficiency of marine resource exploitation and utilization, providing an important foundation for achieving high-quality development of the marine economy. Through the dual mechanisms of business model transformation and supply–demand alignment, economic development can accelerate the adoption of digital and networked technologies in the marine sector, drive the continuous deepening of the marine economy, and give rise to new economic forms, thereby helping to establish a balance between new supply and demand relationships within the marine economy [33]. According to threshold effect theory, the influence of a variable on an outcome is not linear and uniform, but rather may undergo structural changes before and after a specific threshold value [34]. As a key threshold variable, the level of economic development may exert differentiated effects on the absorption capacity, conversion efficiency, and spillover effects of marine new-quality productive forces at different stages. When the level of economic development is low, inadequate infrastructure, a weak institutional environment, and insufficient innovation capacity may constrain the positive influence of marine new-quality productive forces on high-quality marine economic development. However, once the economic level crosses a certain threshold, the supporting conditions tend to mature, and the marginal contribution of marine new-quality productive forces to high-quality marine economic development becomes considerably stronger [35]. Based on this, Hypothesis 3 is proposed.
Hypothesis 3. 
The relationship between marine new-quality productive forces and the high-quality development of the marine economy is subject to a threshold effect, with the level of economic development as the threshold variable.

3. Materials and Methods

3.1. Entropy Weight Method

Based on the research by Jin and Liu [36], this study employs the entropy method to calculate the weights of each indicator and constructs a composite index evaluation model to assess the comprehensive levels of both high-quality development of the marine economy and marine new-quality productive forces. The specific steps are as follows:
Step 1: Perform dimensionless processing on the data using Equations (1) and (2).
x i j = x i j x j m i n x j m a x x j m i n
x i j = x j m a x x i j x j m a x x j m i n
In the formula: i-th denotes the evaluation object; j-th denotes the evaluation indicator; and x i j and x i j represent the initial and standardized values of the corresponding indicator, respectively.
Step 2: Calculate the proportion x i j of each standardized indicator y i j within the evaluation indicator system for the high-quality development of the marine economy and for marine new-quality productive forces.
y i j = x i j i = 1 n x i j
Step 3: Set θ = 1 ln ( n ) , and let e j denote the entropy value of the j indicator. Here, n represents the sample size corresponding to the j indicator, and y i j denotes the weight of the j-th indicator for the i-th individual. Use Equation (4) to measure the information entropy of the evaluation indicators.
e j = θ i = 1 n y i j × ln y i j
Step 4: Calculate the coefficient of variation d j , where 1 represents the assigned value for the high-quality development of the marine economy and marine new-quality productive forces in the entropy method. The smaller the coefficient of variation, the smaller the comprehensive weight of the indicator in the evaluation of high-quality development of the marine economy and marine new-quality productive forces.
d j = 1 e j
Step 5: Calculate the comprehensive weight w j of indicator d j using the following formula:
w j = d j j = 1 k d j
Step 6: Calculate the comprehensive evaluation index S i j as the sum of the products of the comprehensive weight w j of each indicator and its corresponding normalized value x i j :
S i j = w j × x i j
Following the design of the above indicator system, relevant data were collected and processed. Through scientific calculation and comprehensive analysis, the weight values of each indicator were obtained.

3.2. Baseline Regression Model

To investigate the driving effect of the formation of marine new-quality productive forces on the high-quality development of the marine economy and mitigate estimation biases potentially caused by multicollinearity, this paper constructs a panel baseline regression model as follows:
H Q D M E i t = α 0 + α 1 M N Q P i t + α 2 F S i t + α 3 O P E N i t + α 4 E N V i t + α 5 E D U i t + α 6 I N S T i t + ε i t
Here, i represents the city; t represents the year. H Q D M E i t denotes the level of high-quality development of the marine economy; M N Q P i t represents the development level of marine new-quality productive forces; α 0 is the constant term; FS, OPEN, ENV, EDU, and INST are control variables, representing the intensity of fiscal support, the degree of openness to the outside world, the strength of environmental regulations, the level of education, and the marine industrial structure, respectively; and ε i t is the random disturbance term.

3.3. Mediation Effect Model

This section primarily explores the mediating role of marine scientific and technological innovation (MSTI). Based on the research hypotheses proposed earlier, a mediating model is constructed on the foundation of the baseline regression model as follows:
M S T I i t = β 0 + β 1 M N Q P i t + + α 2 F S i t + α 3 O P E N i t + α 4 E N V i t + α 5 E D U i t + α 6 I N S T i t + ε i t
H Q D M E i t = γ 0 + γ 1 M N Q P i t + γ 2 M S T I i t + α 3 F S i t + α 4 O P E N i t + α 5 E N V i t + α 6 E D U i t + α 7 I N S T i t + ε i t
In the formula, MSTI represents the variable of marine scientific and technological innovation, while β and γ denote the parameters to be estimated, respectively. The other variables remain the same as previously defined. When β 1 is statistically significant, it indicates that marine new-quality productive forces have a significant positive impact on marine scientific and technological innovation. Based on this, when γ 2 is statistically significant and γ 1 is either insignificant or has a coefficient smaller than α 1 , it suggests the presence of a mediating effect.

3.4. Threshold Effect Model

Following the methodological approach of Hansen [34], this paper constructs a panel threshold model with the level of economic development as the threshold variable. The specific model is specified as follows:
H Q D M E i t = α 0 + α 1 M N Q P i t I E D L i t q + α 2 E D L i t I E D L i t > q +   α n c o n t r o l i t + ε i t
In the formula, I(∙) is an indicator function, and q is the threshold value, which takes a value of 0 or 1. The meanings of other variables are the same as those in Equation (1). E D L i t serves as the threshold variable. Equation (4) represents a single-threshold panel model. If multiple thresholds exist, it can be further extended as follows:
H Q D M E i t = α 0 + α 1 M N Q P i t I E D L i t q 1 + α 2 M N Q P i t I q 1 < E D L i t q 2 + α n M N Q P i t I E D L i t > q n + α n c o n t r o l i t + ε i t

4. Variable Definitions and Data Descriptions

4.1. Variable Definitions

4.1.1. Dependent Variable

Taking the level of high-quality development of the marine economy (HQD-ME) as the dependent variable, and following the principles of scientific rigor and operational feasibility, this study examines the current status of high-quality marine economic development in coastal regions. The study period spans 2013–2022, covering 11 provinces. Drawing on the research of Qiu et al. [8] and Lu et al. [4], and based on the new development philosophy, this study constructs an evaluation system consisting of 25 specific indicators. The entropy method was used to determine the indicator weights and to calculate the comprehensive level of high-quality development of the marine economy in China’s coastal regions from 2013 to 2022. The specific evaluation indicator system is presented in Table 1.
Table 1 presents the comprehensive evaluation indicators for the level of high-quality development of China’s marine economy:
(1)
Innovation is the core driving force behind the high-quality development of the marine economy. Based on three dimensions—R&D investment, research output, and talent structure—this paper selects the following five indicators to measure the level of marine innovation and development: marine R&D expenditure intensity, the number of marine research papers published, the number of marine research projects, the proportion of master’s and doctoral degree holders among marine researchers, and the ratio of marine GDP to regional GDP. Specifically, marine R&D expenditure intensity is expressed as the ratio of internal R&D expenditure to marine GDP; the number of marine research papers and projects is measured by the absolute number of relevant papers and projects in the marine field during the respective years; the proportion of master’s and doctoral degree holders among marine researchers is measured by the percentage of personnel with master’s degrees or higher in research institutions; and the ratio of marine GDP to regional GDP reflects the contribution of the marine economy to regional development.
(2)
Coordination serves as a key criterion for evaluating the balanced development of the marine economic system both internally and in relation to its external environment. This paper selects five indicators across four dimensions—industrial structure, growth drivers, urban-rural coordination, and employment stability—namely the share of the marine tertiary sector, the growth rate of marine GDP, the urbanization rate in coastal areas, the coefficient of variation in disposable income between urban and rural residents in coastal areas, and the unemployment rate. Among these, the share of the marine tertiary sector reflects the level of industrial upgrading; the growth rate of marine GDP measures the dynamic growth level of the marine economy; the urbanization rate in coastal areas is represented by the proportion of the urban population to the total population; the coefficient of variation in disposable income between urban and rural residents is measured by the ratio of urban to rural disposable income; and the unemployment rate is represented by the registered urban unemployment rate.
(3)
Green development is a key indicator of the sustainable development level of the marine economy. Based on four dimensions—pollution emissions, environmental governance, energy consumption, and ecological protection—this paper selects five indicators: the volume of industrial wastewater directly discharged into the sea per unit of output value; the share of environmental protection expenditure; the volume of solid waste discharged per unit of marine GDP; per capita electricity consumption in coastal areas; and the coverage rate of marine nature reserves. Specifically, the volume of industrial wastewater directly discharged into the sea per unit of output value is expressed as the ratio of such wastewater volume to marine GDP; the share of environmental protection expenditure is measured by the ratio of investment in environmental pollution control to GDP; the volume of solid waste discharged per unit of marine GDP is expressed as the ratio of general industrial solid waste generation to marine GDP; per capita electricity consumption in coastal areas reflects energy consumption intensity; and the coverage rate of marine nature reserves is expressed as the ratio of marine nature reserve area to the total area of coastal regions.
(4)
The degree of openness is a key indicator of the marine economy’s integration into the global development landscape. This paper examines three dimensions of openness—trade, investment, and tourism—and selects five indicators: the economic openness of coastal regions, international container throughput at coastal ports, the amount of actual foreign capital utilization, the proportion of overseas visitors, and inbound tourism reception capacity. Specifically, economic openness is represented by the ratio of total imports and exports to GDP; international container throughput reflects a port’s function as an international logistics hub; the amount of actual utilized foreign capital is measured by the actual amount of foreign direct investment received; the proportion of foreign tourists is represented by the ratio of foreign tourists to total tourists; and inbound tourism reception capacity is measured by the ratio of foreign tourists to the permanent resident population.
(5)
Shared development serves as the fundamental basis for evaluating whether the achievements of marine economic development benefit the people. This paper examines five dimensions—educational resources, medical resources, income levels, public facilities, and employment—and selects five indicators: the number of students enrolled in marine-related programs, the number of hospital beds per capita in coastal areas, urban residents’ disposable income, per capita park green space area, and urban enterprise employment. Specifically, the number of students enrolled in marine-related programs reflects the scale of talent cultivation in the marine sector; the number of hospital beds per capita is calculated as the ratio of hospital beds to the permanent resident population; urban residents’ disposable income is used to measure income levels; the per capita park green space area reflects the quality of the urban ecological environment; and urban enterprise employment is represented by the ratio of the number of employees in urban enterprises to the total population.

4.1.2. Core Explanatory Variable

The core explanatory variable (MNQP) is used to characterize the level of development of marine new-quality productive forces. Based on the Marxist theory of the three elements of productive forces, and integrating China’s key discourses on new-quality productive forces with the unique characteristics of the marine industry, this paper defines marine new-quality productive forces as an advanced form of productive forces in the marine sector. They are centered on high-quality, multidisciplinary marine workers, supported by new means of production such as intelligent equipment and digital platforms, and carried out through new objects of labor, while also incorporating constraints on marine ecological carrying capacity and the ability to respond to disaster risks. Specifically, they drive the high-quality development of the marine economy through systematic upgrades across three dimensions. First, a leap in worker skills: workers master interdisciplinary knowledge and digital and intelligent tools, considerably enhancing labor productivity and innovation efficiency. Second, the intelligent upgrading of means of production: smart equipment and digital infrastructure notably improve production precision and resource utilization efficiency, reduce environmental risks, and promote the industry’s transition toward high-end and green development. Third, the deep expansion of objects of labor: they extend from nearshore to deep-sea and marine biological resources, giving rise to emerging business models. The synergy among these three dimensions distinguishes marine new-quality productive forces from their terrestrial counterparts, making them a core driving force for the efficient utilization of marine resources, the green transformation of industries, and high-quality development. Drawing on the Marxist theory of the three elements of productive forces and the research of Wang [37] and Ye et al. [22], this paper constructs an evaluation index system for China’s marine new-quality productive forces from three dimensions—new types of laborers, new types of means of production, and new types of objects of labor (see Table 2). The entropy method is then employed to calculate the weights of these indicators, yielding the evaluation index system for marine new-quality productive forces for the period 2013–2022. The specific indicators are presented in Table 2.
In the evaluation index system for new-quality marine productive forces developed in this paper, some indicators (such as the number of robots, the proportion of revenue from information technology services, and the level of enterprise digitization) reflect the overall level of technological progress in a region rather than being purely marine industry-specific indicators. This is primarily due to limitations in the availability of detailed marine sector data at the provincial level. However, this paper considers these indicators to be reasonable: First, the marine industry is deeply integrated with regional digital economic infrastructure, and the spillover effects of digital technology are widely permeating key sectors such as marine transportation, marine fisheries, and marine engineering equipment. Second, existing studies generally adopt similar approaches, such as those by Wang [37] and Ye et al. [22], and these indicators possess acceptable reliability given the data constraints. Third, this paper explicitly acknowledges this limitation in the discussion section and suggests that future research utilizes more granular marine-specific data for validation.

4.1.3. Mediating Variable

Drawing on the research approach of Liu et al. [38] and incorporating existing literature, this study selects marine science and technology innovation (MSTI) as the mediating variable. It is measured using the ratio of internal marine R&D expenditures to general local fiscal expenditures. It should be noted that marine science and technology innovation is a complex process encompassing multiple stages, including basic research, applied development, and technology transfer. This study uses the proportion of internal R&D expenditures to fiscal expenditures as a proxy variable, primarily based on data availability and established practices in existing research [38]. Future studies may employ more comprehensive innovation indicators to further validate these findings.

4.1.4. Control Variables

In addition to the level of new-quality marine productive forces, numerous factors may influence the high-quality development of the marine economy. To mitigate endogeneity issues caused by omitted variables, this study draws on the research of Qiu and Lin [39] and Xu et al. [40], and incorporates fiscal support intensity, openness degree, environmental regulation intensity, educational attainment, and marine industrial structure as control variables in the model. Specifically, fiscal support intensity is represented by the ratio of general budget expenditure to regional GDP; openness degree is measured by the ratio of total goods imports and exports (converted at the exchange rate) to regional GDP; environmental regulation intensity is represented by total investment in environmental pollution control; educational attainment is measured by average years of schooling per capita; and marine industrial structure is reflected by the share of marine tertiary industry output value in total marine output. To reduce data dispersion, individual missing values were imputed using linear interpolation.

4.1.5. Threshold Variable

Drawing on the research approach of Guo et al. [41] and incorporating existing literature, this study selects economic development level (EDL) as the threshold variable; it is measured using the logarithm of GDP per capita. The definitions of the variables are presented in Table 3.

4.2. Data Sources

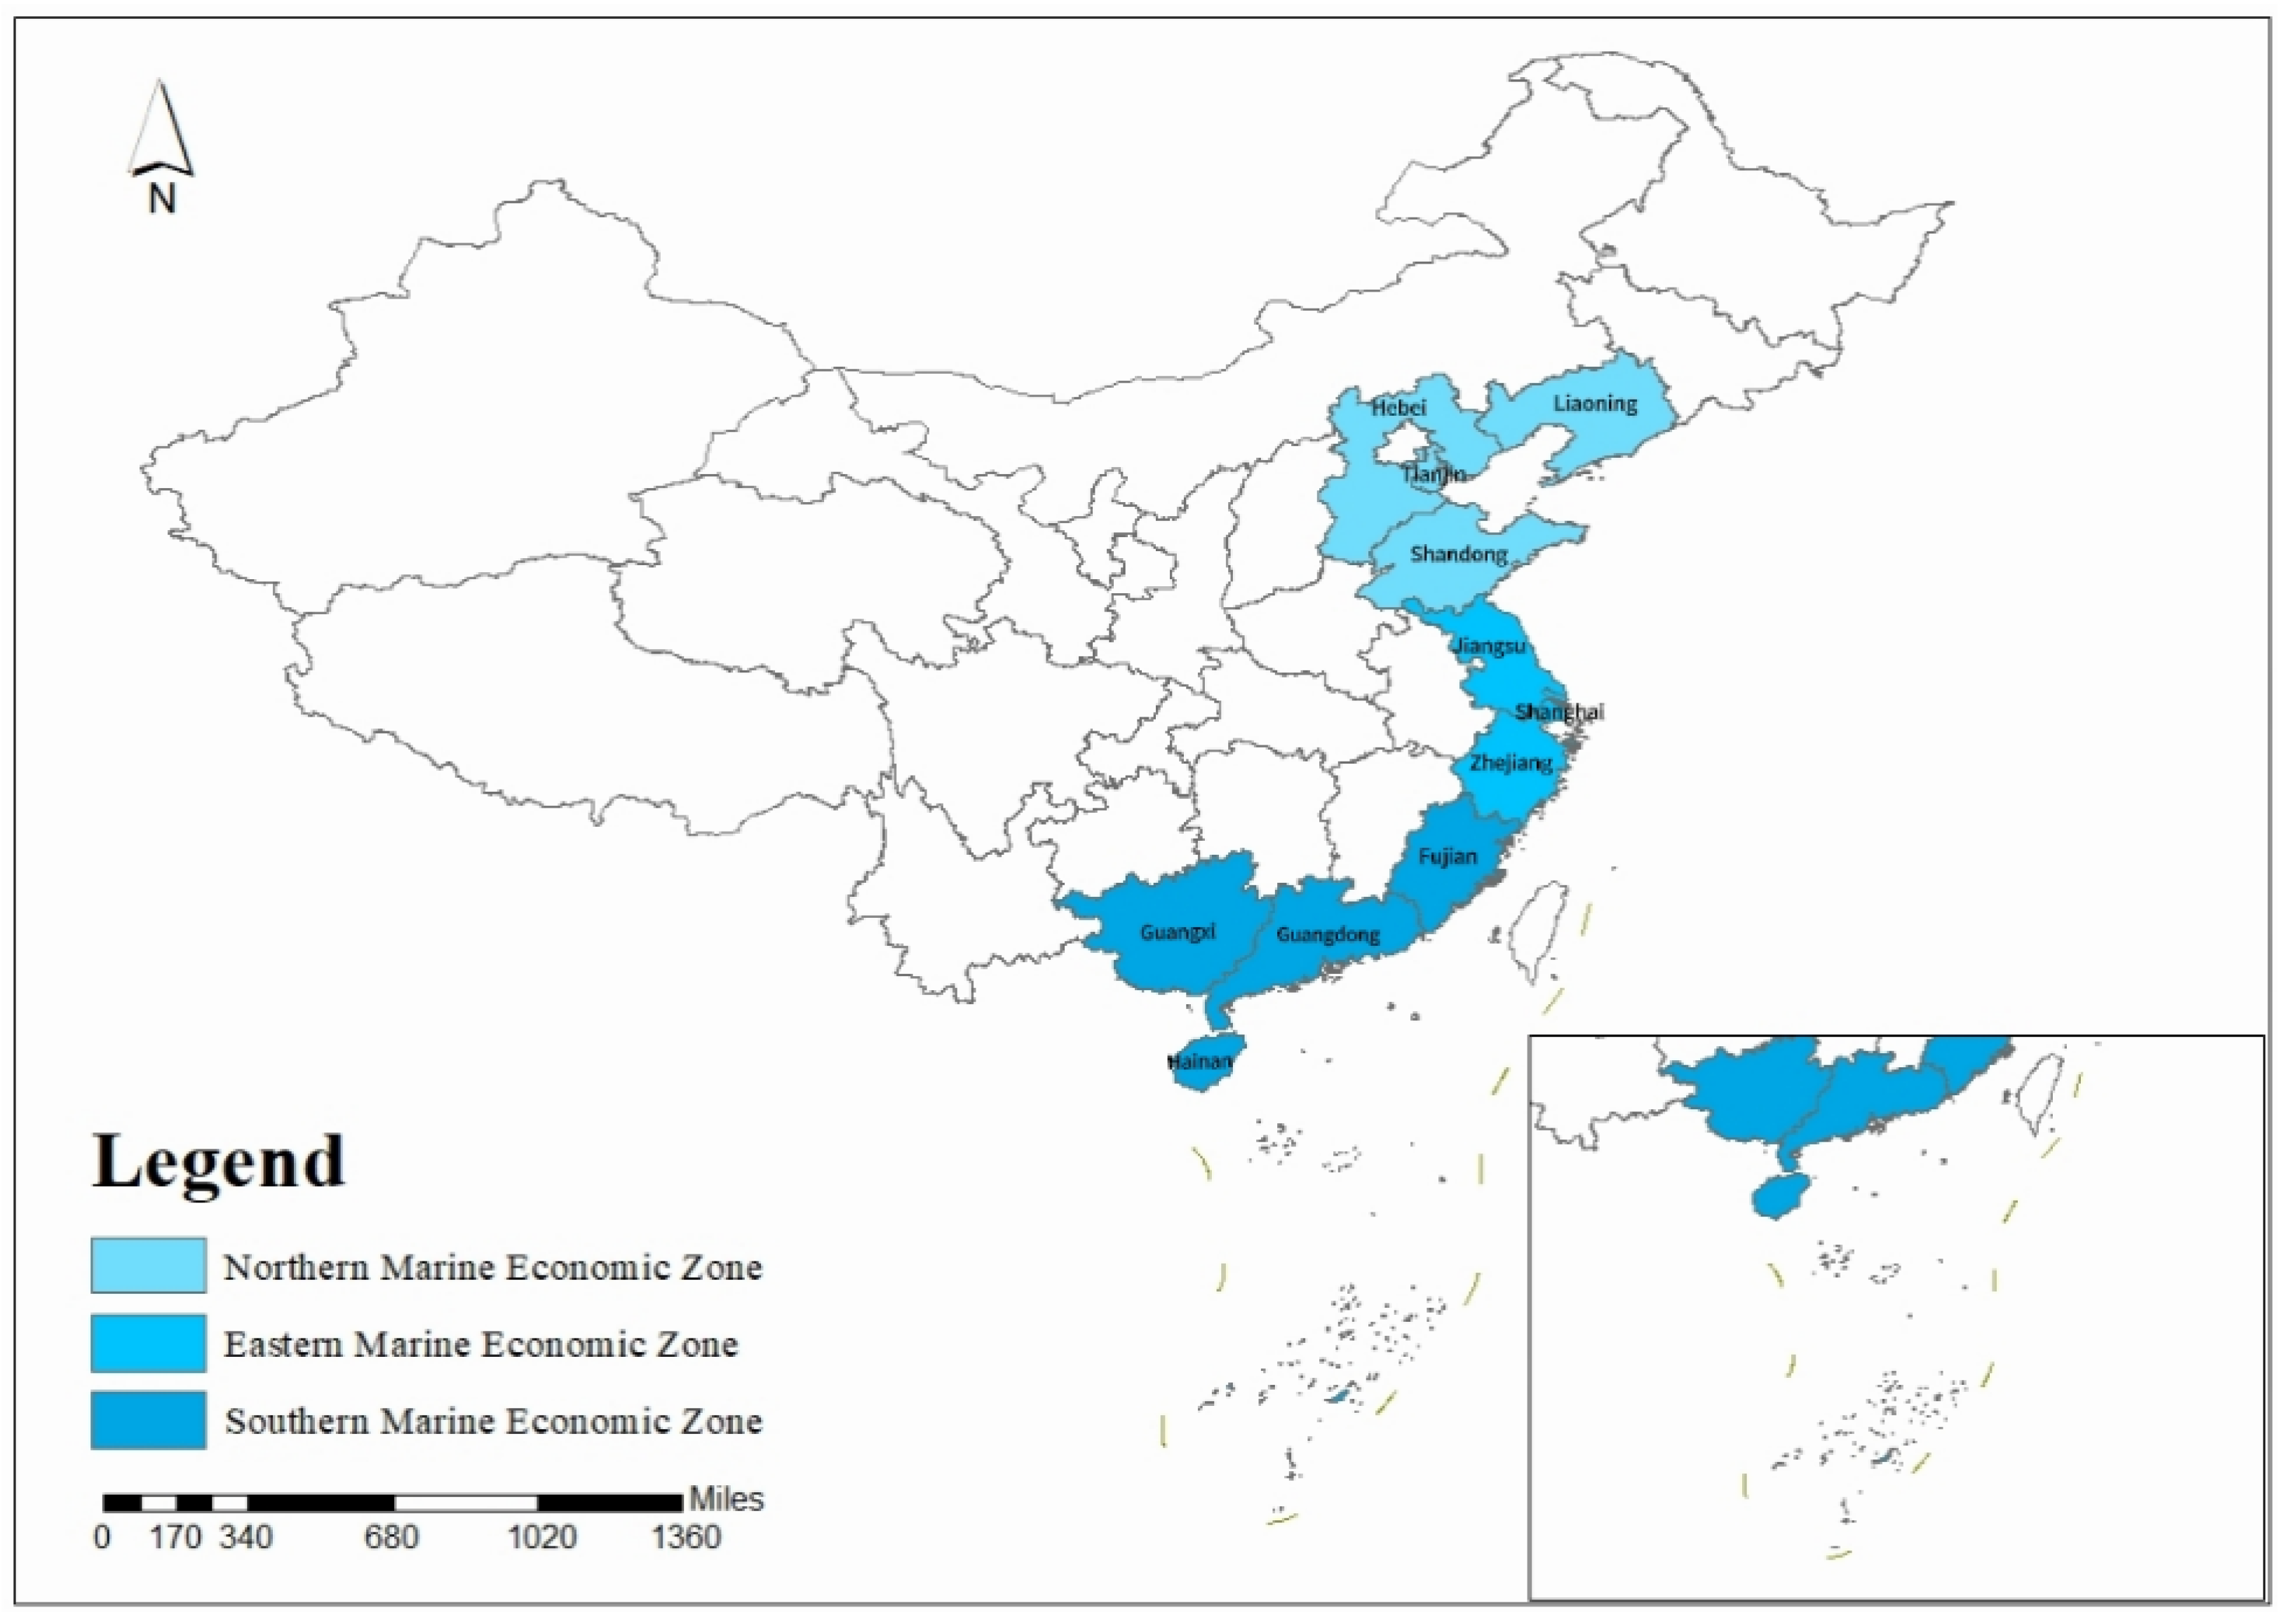
This study covers the period from 2013 to 2022, focusing on 11 coastal provinces in China, and divides the areas into the Northern Marine Economic Zone, the Eastern Marine Economic Zone, and the Southern Marine Economic Zone the three major marine economic circles are delineated as follows: the Northern Circle encompasses Liaoning, Hebei, Tianjin, and Shandong; the Eastern Circle covers Jiangsu, Shanghai, and Zhejiang; and the Southern Circle comprises Fujian, Guangdong, Guangxi, and Hainan. This timeframe was selected because 2013 marked the year China officially launched its “Maritime Power” strategy, after which marine economic statistical standards became more standardized; 2022 represents the latest year with available full-year data. This timeframe spans the “13th Five-Year Plan” period and the early stages of the “14th Five-Year Plan,” thereby reflecting recent trends in the development of new-quality marine productive forces. Data were primarily sourced from the China Marine Statistical Yearbook, China Statistical Yearbook, China Marine Environmental Quality Bulletin, China Fisheries Statistical Yearbook, China Environmental Statistical Yearbook, and China Statistical Yearbook. To minimize sample loss, interpolation methods were used to fill in missing data.

4.3. Descriptive Statistics

Table 4 presents the descriptive statistics for various variables across the 11 coastal provinces (autonomous regions and municipalities) of China from 2013 to 2022.
As shown in Table 4, there are 110 valid observations for each variable. The mean of the core explanatory variable, marine new-quality productive forces (MNQP), is 0.186, with a standard deviation of 0.085, a minimum value of 0.085, and a maximum value of 0.509. This indicates that, during the sample period, marine new-quality productive forces in China’s coastal regions were generally at a medium-to-low level, with notable development disparities among provinces. The dependent variable, high-quality development of the marine economy (HQD-ME), has a mean of 0.227, a standard deviation of 0.083, and a range between 0.104 and 0.406. This suggests that while the quality of marine economic development has steadily improved across provinces, certain disparities remain, and there is room for further overall improvement. The mediating variable, marine science and technology innovation (MSTI), has a mean of 0.175 and a standard deviation of 0.130, indicating a degree of regional innovation imbalance. The threshold variable, economic development level (EDL), is expressed in logarithmic form, with a mean of 11.155 and a standard deviation of 0.434, suggesting that coastal regions generally have a solid economic foundation, though internal development disparities persist. It is worth noting that the panel data used in this study cover 11 provinces and 10 years, comprising a total of 110 observations. The relatively small sample size may affect statistical power and estimation precision. Therefore, the regression results presented below should be interpreted as evidence of correlation rather than causal inference. To address potential endogeneity and reverse causality, this study employs methods such as lagged variables in robustness tests and provides an explicit discussion of these limitations.

5. Results

5.1. Analysis of the Evaluation Index for Marine New-Quality Productive Forces and High-Quality Marine Economic Development

5.1.1. Study Area

This study focuses on 11 coastal provinces (municipalities directly under the central government and autonomous regions) in China, including Liaoning, Hebei, Tianjin, Shandong, Jiangsu, Shanghai, Zhejiang, Fujian, Guangdong, Guangxi, and Hainan. The marine economic output of these provinces accounts for more than 95% of the national gross ocean product (GOP), making them highly representative. These regions are divided into three major marine economic zones: the Northern Marine Economic Zone (Liaoning, Hebei, Tianjin, Shandong), the Eastern Marine Economic Zone (Jiangsu, Shanghai, Zhejiang), and the Southern Marine Economic Zone (Fujian, Guangdong, Guangxi, Hainan). Figure 1 illustrates the geographical distribution of the study area, and Table 5 summarizes the key characteristics of each region (2013–2022 averages).
To quantitatively reveal the average levels and regional disparities across provinces during the study period, Table 5 summarizes the mean values of key variables for the 11 coastal provinces from 2013 to 2022, including per capita GDP (log), MNQP, and HQD-ME.
Table 5 reports the mean values of core variables for the 11 coastal provinces from 2013 to 2022. In terms of regional distribution, the Eastern Marine Economic Zone (Jiangsu, Shanghai, and Zhejiang) exhibits relatively high levels of per capita GDP, MNQP, and HQD-ME, with balanced development across the three provinces. The Northern Marine Economic Zone (Liaoning, Hebei, Tianjin, Shandong) exhibits considerable internal disparities; while Tianjin has the highest per capita GDP (11.414), its MNQP and HQD-ME do not correspondingly lead, and Shandong’s HQD-ME (0.252) is notably higher than that of other provinces in the same zone. The Southern Zone (Fujian, Guangdong, Guangxi, and Hainan) exhibits the most severe disparities. Guangdong ranks first nationally in both MNQP (0.468) and HQD-ME (0.385), while the indicator values for Guangxi and Hainan are among the lowest in the country.

5.1.2. Analysis of the Evaluation Index for Marine New-Quality Productive Forces

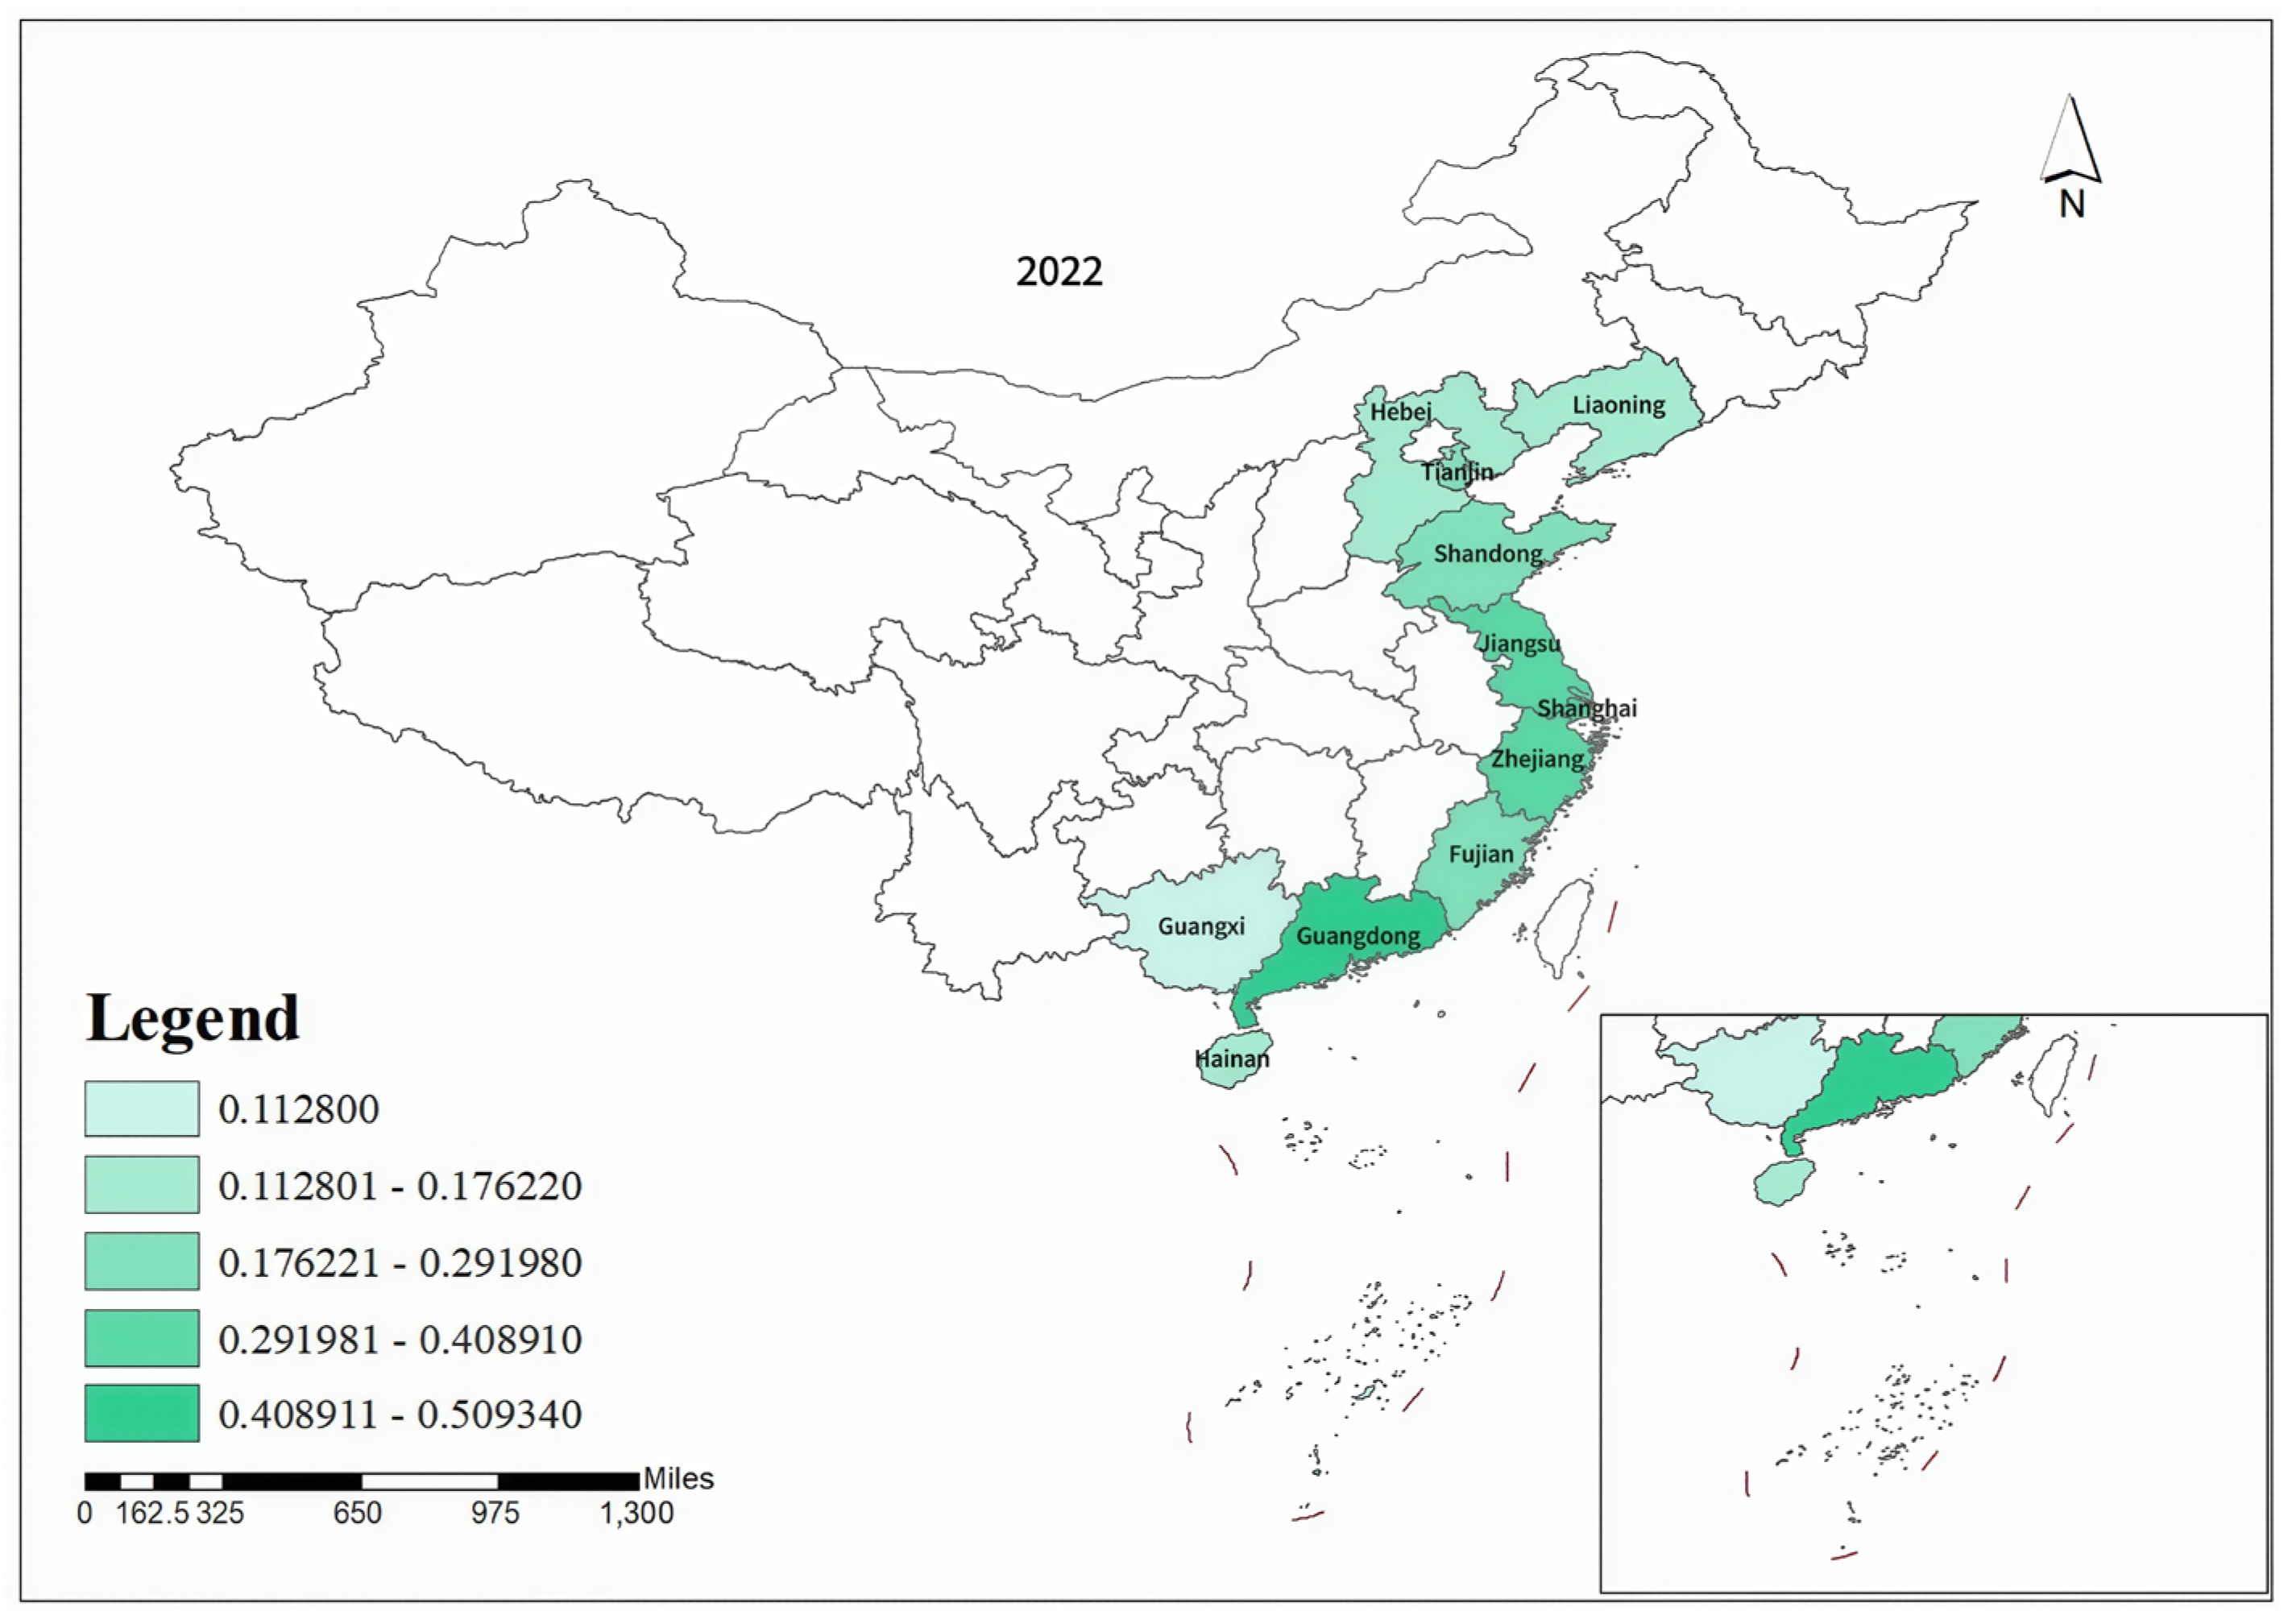
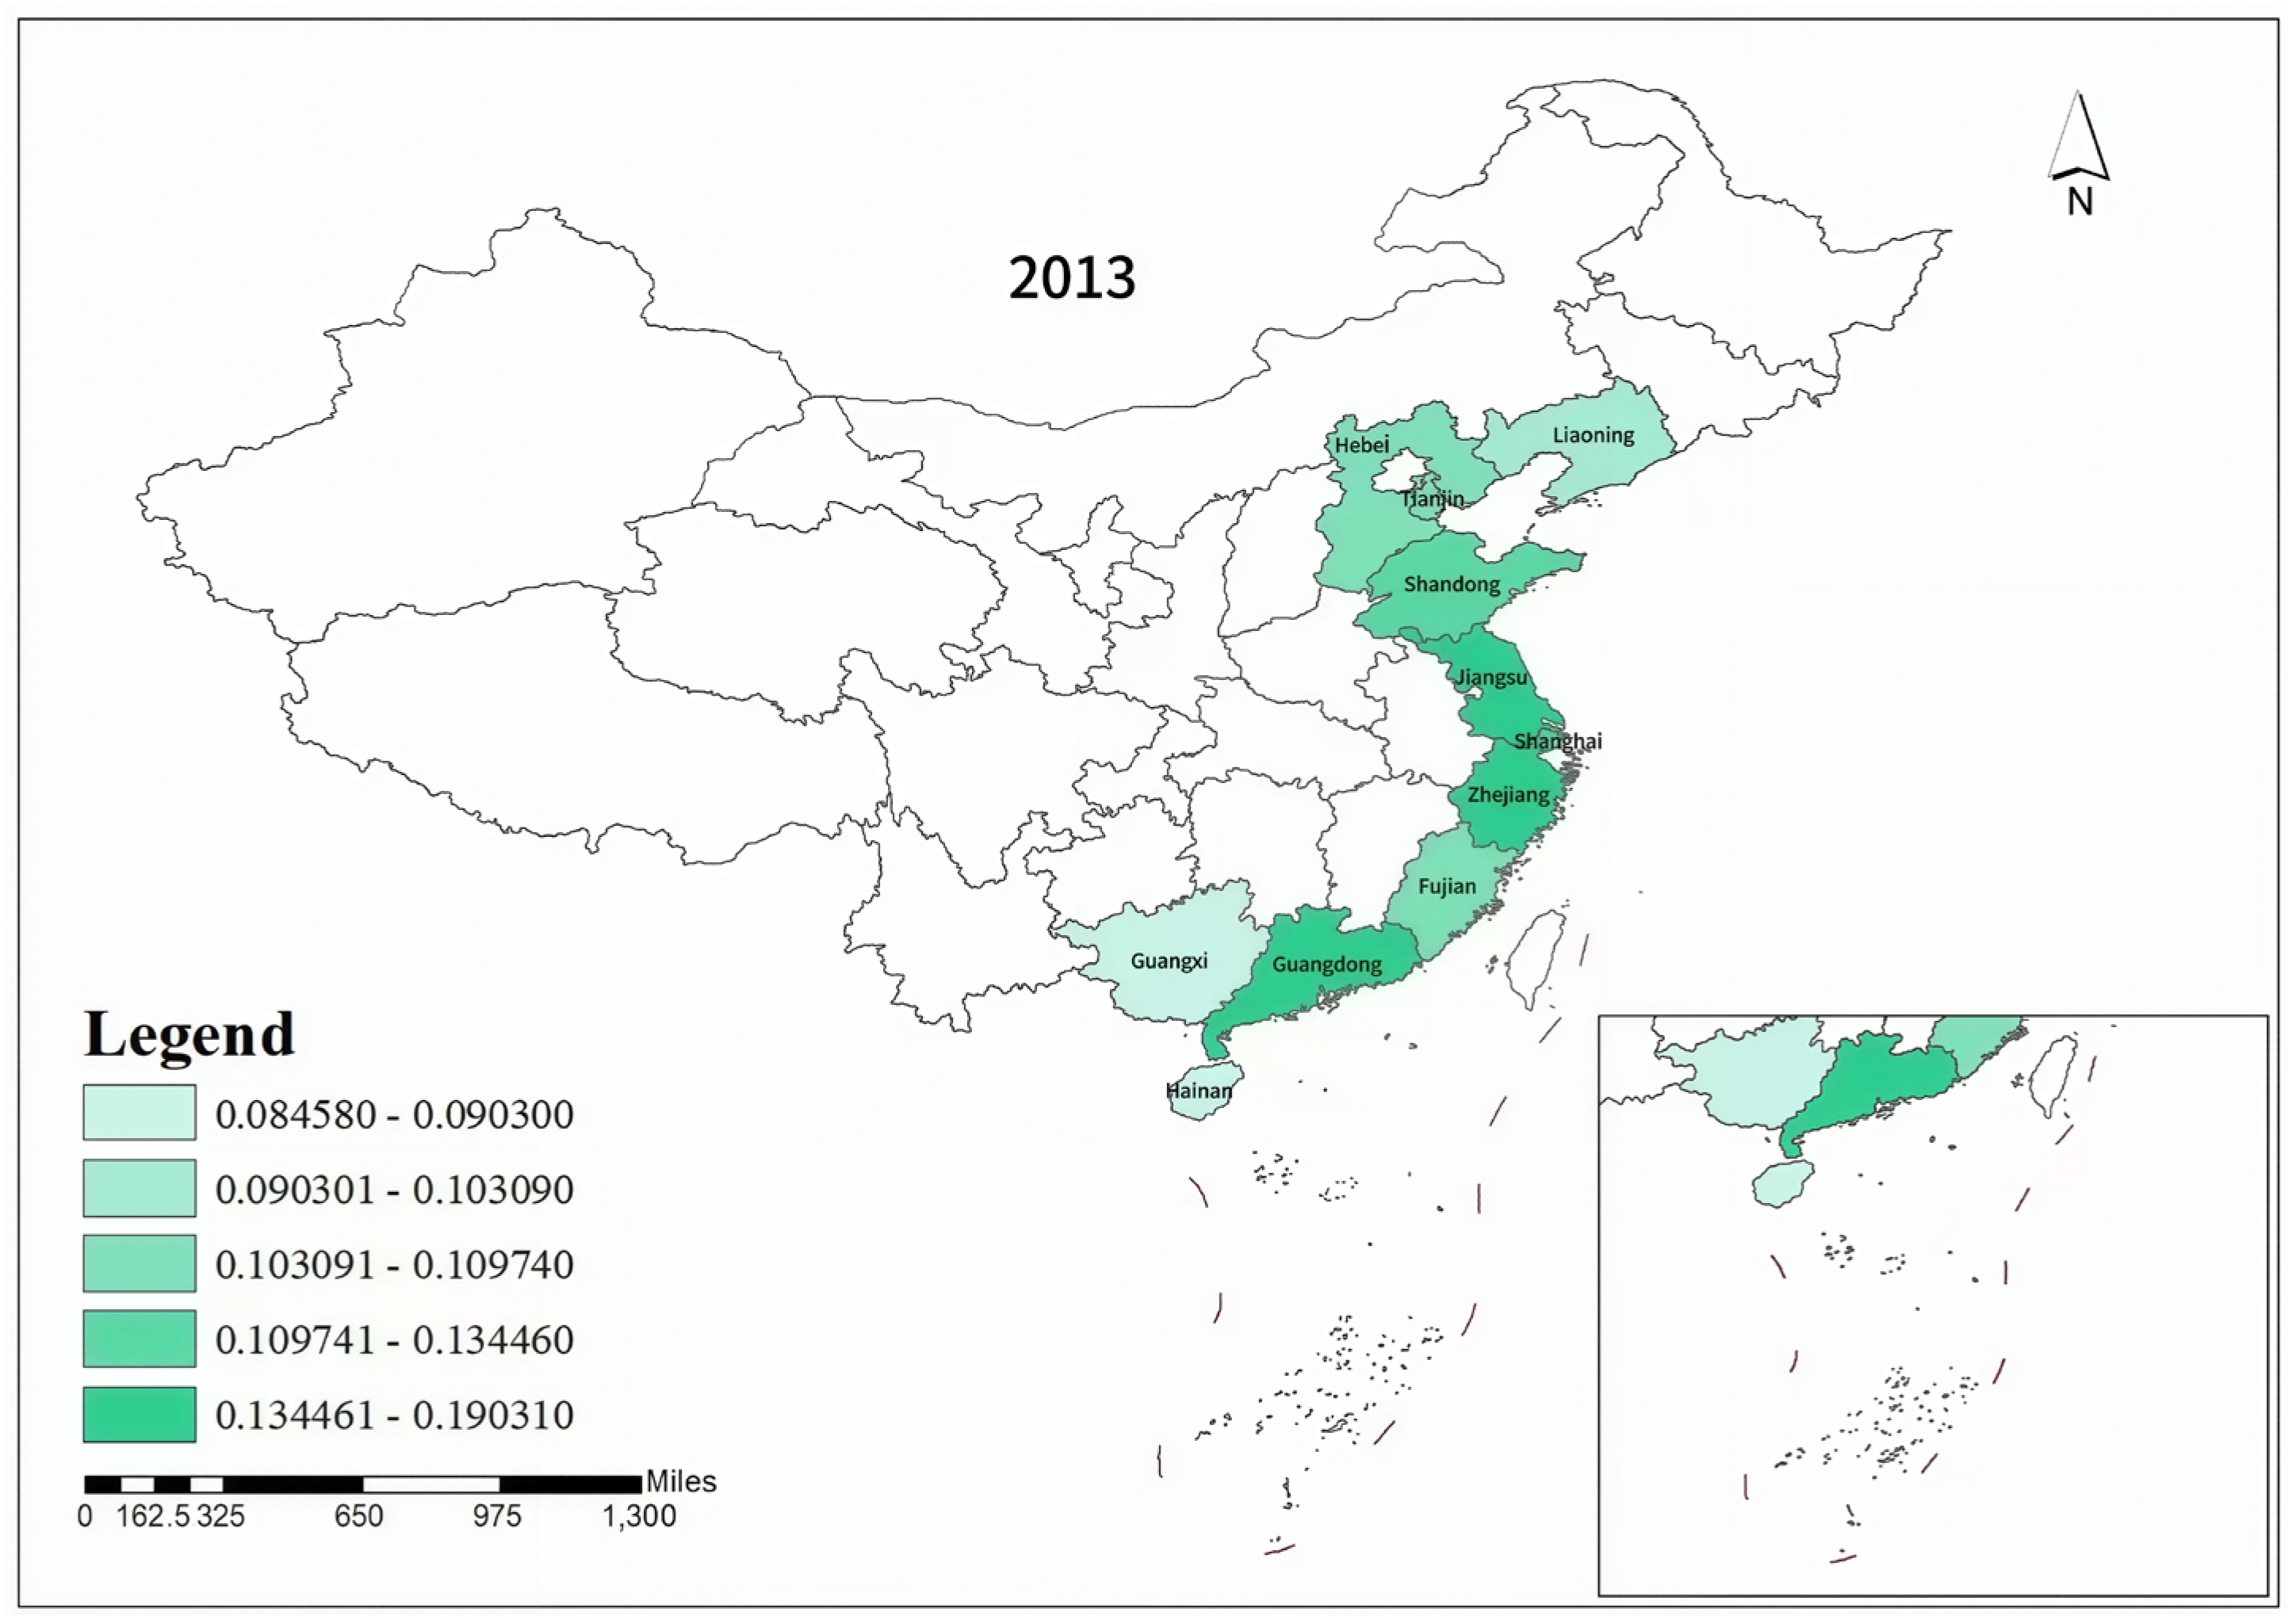
This study selected 2013 and 2022 as representative years, used ArcGIS 10.8.1 software to visualize the results of the evaluation index for the development of marine new-quality productive forces in China’s coastal regions. A comparative analysis was conducted between the two years, with the results shown in Figure 2 and Figure 3.
Figure 2 and Figure 3 show the spatial distribution of marine new-quality productive forces in China’s 11 coastal provinces in 2013 and 2022, respectively. Overall, between 2013 and 2022, the level of marine new-quality productive forces in coastal regions showed an upward trend, but significant regional disparities existed and widened over time.
In 2013, the marine new-quality productive forces of most provinces were concentrated in the range of 0.085–0.255. Among them, Guangdong, Jiangsu, and Zhejiang were relatively high, but still did not reach 0.255; Guangxi and Hainan were in the lowest range. In the Northern Marine Economic Zone, Liaoning, Hebei, Tianjin, and Shandong all fell within the 0.170–0.255 range, with relatively small internal variations. By 2022, regional divergence had clearly intensified. Guangdong surged into the 0.425–0.510 range, while Jiangsu, Zhejiang, and Shanghai entered the 0.340–0.425 range, and Shandong, Tianjin, and Fujian rose to the 0.255–0.340 range. However, Guangxi, Hainan, and Hebei remained in the 0.170–0.255 range, and Liaoning only reached the upper limit of that range. The Eastern Marine Economic Zone (Jiangsu, Shanghai, and Zhejiang) exhibited the highest overall level and the fastest growth. Within the Southern Marine Economic Zone, a polarized pattern emerged, characterized by “Guangdong leading while Guangxi and Hainan lagged behind.” The Northern Marine Economic Zone, meanwhile, was marked by “Shandong performing relatively well, while the remaining provinces grew slowly.” This distribution pattern provides a spatial foundation for the subsequent analysis of the heterogeneous impacts of marine new-quality productive forces on high-quality development.

5.1.3. Analysis of the Evaluation Index for High-Quality Marine Economic Development

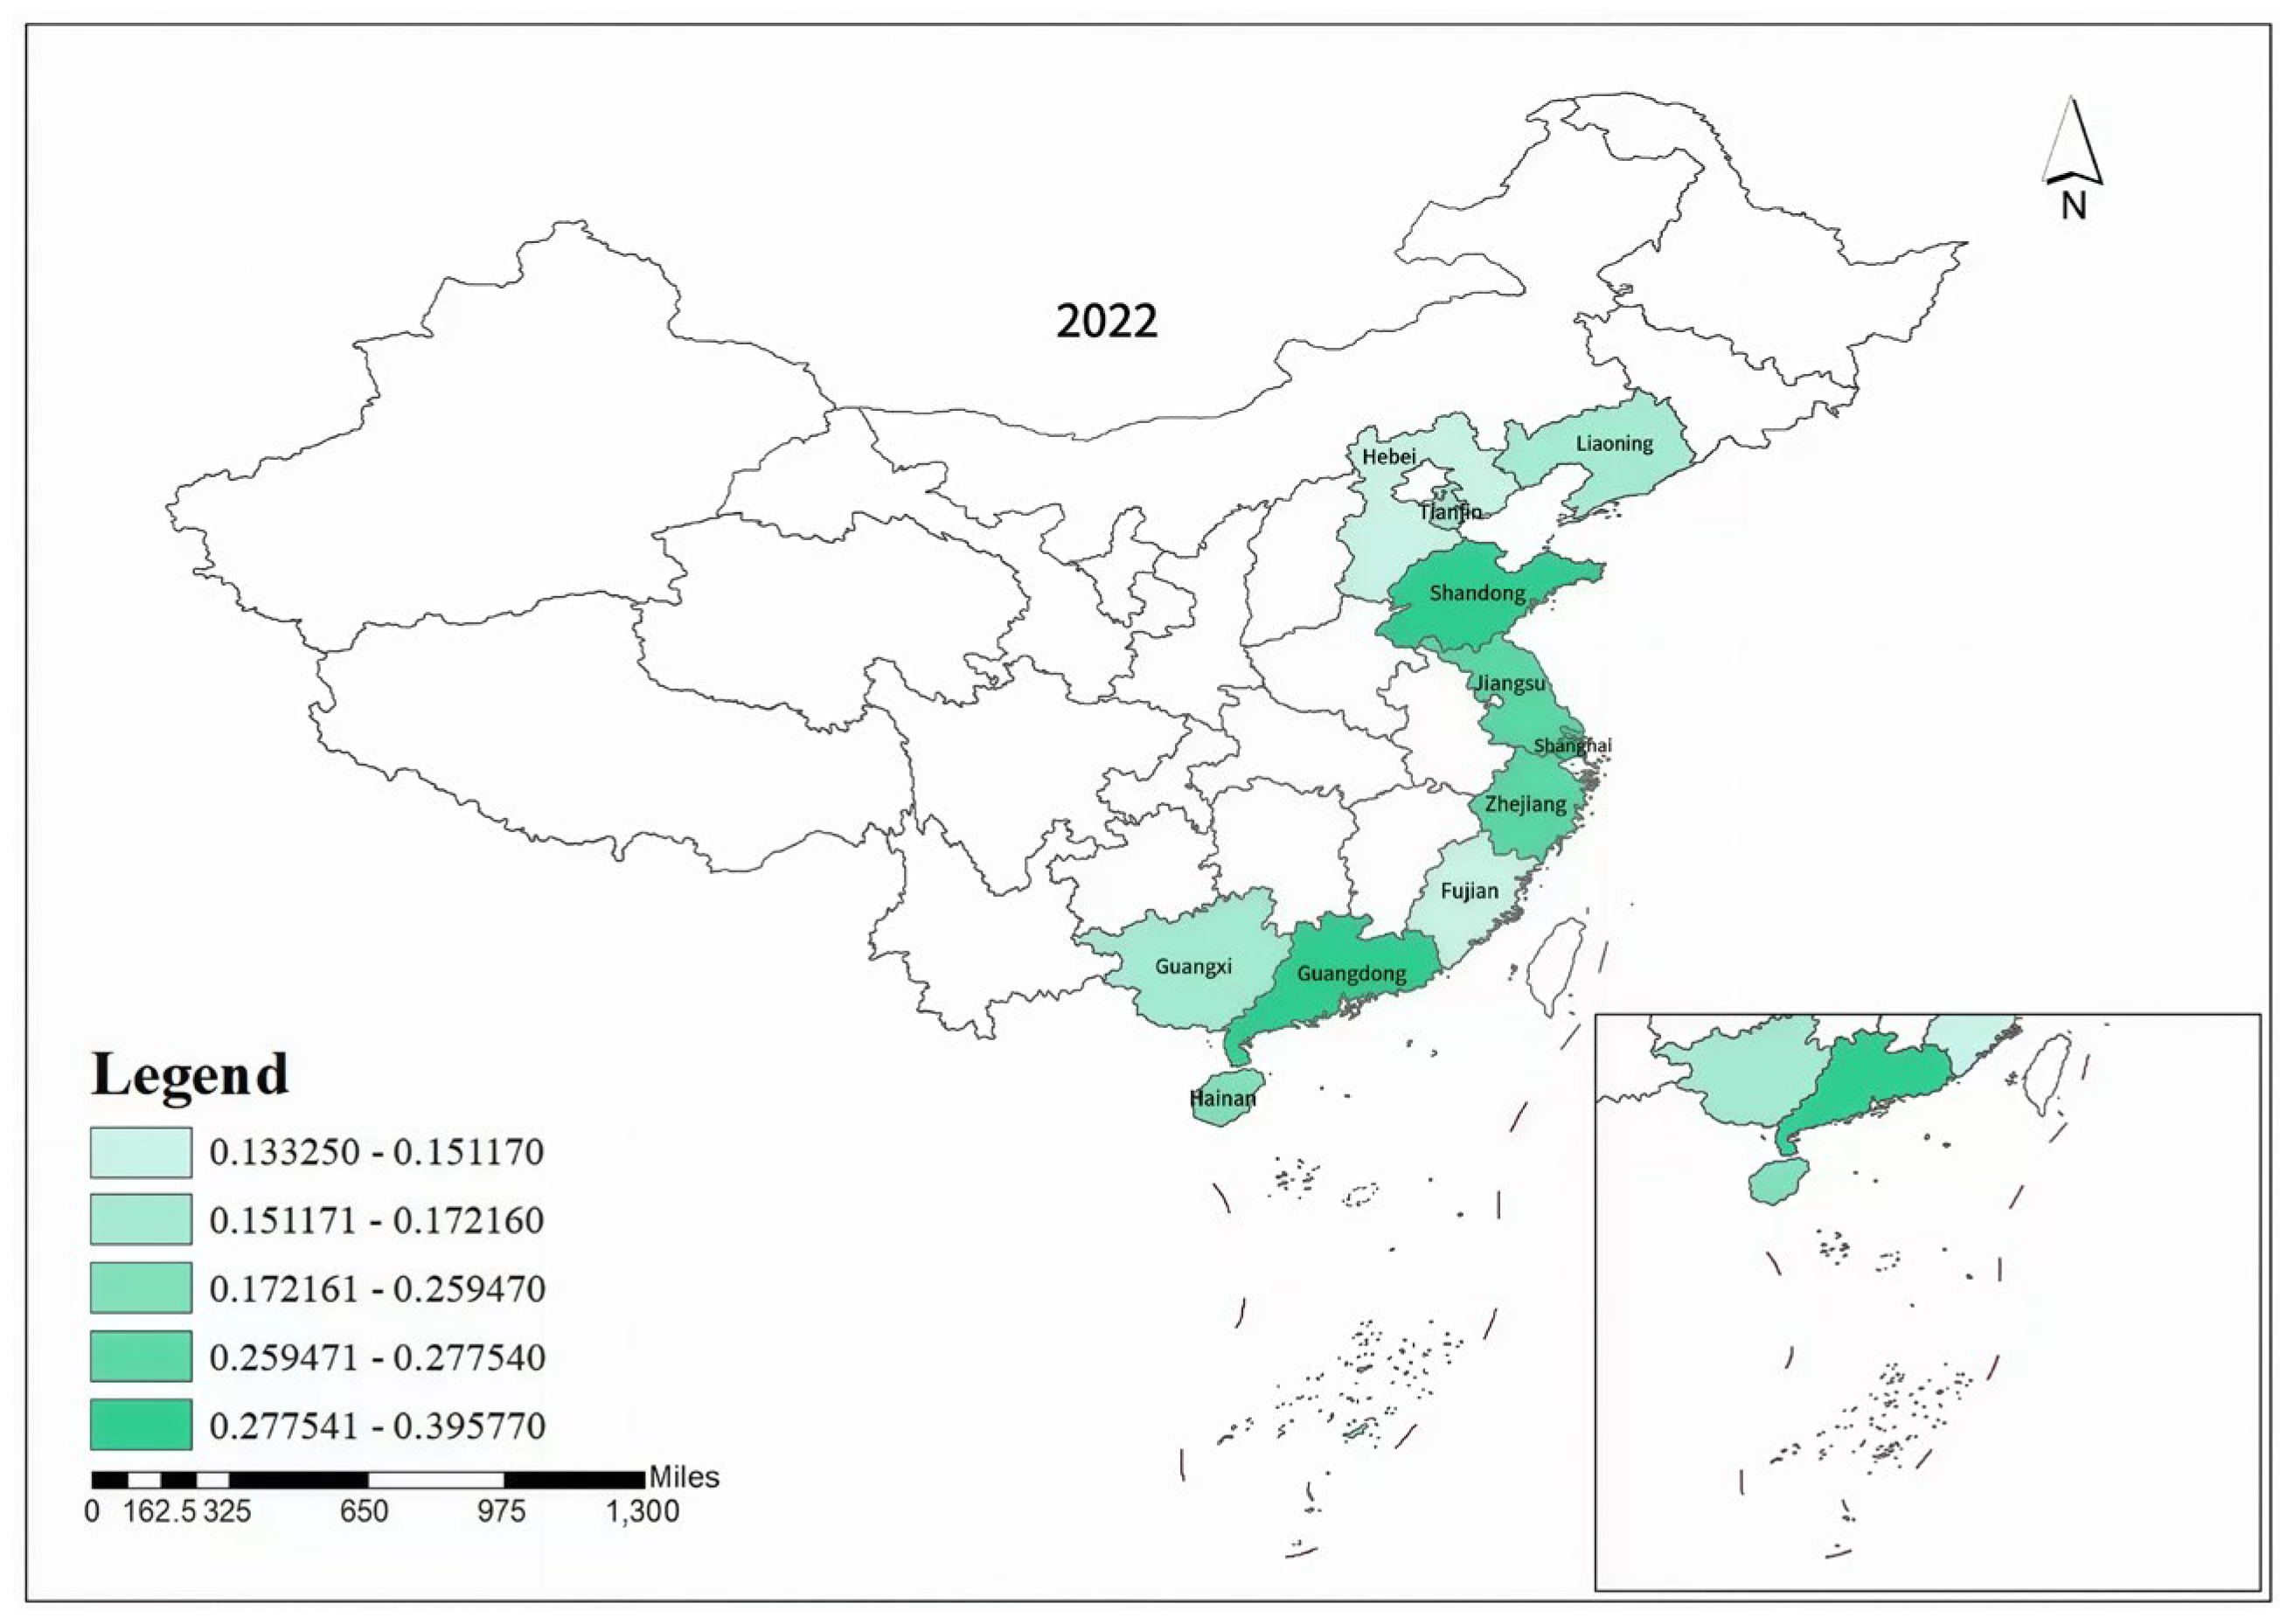
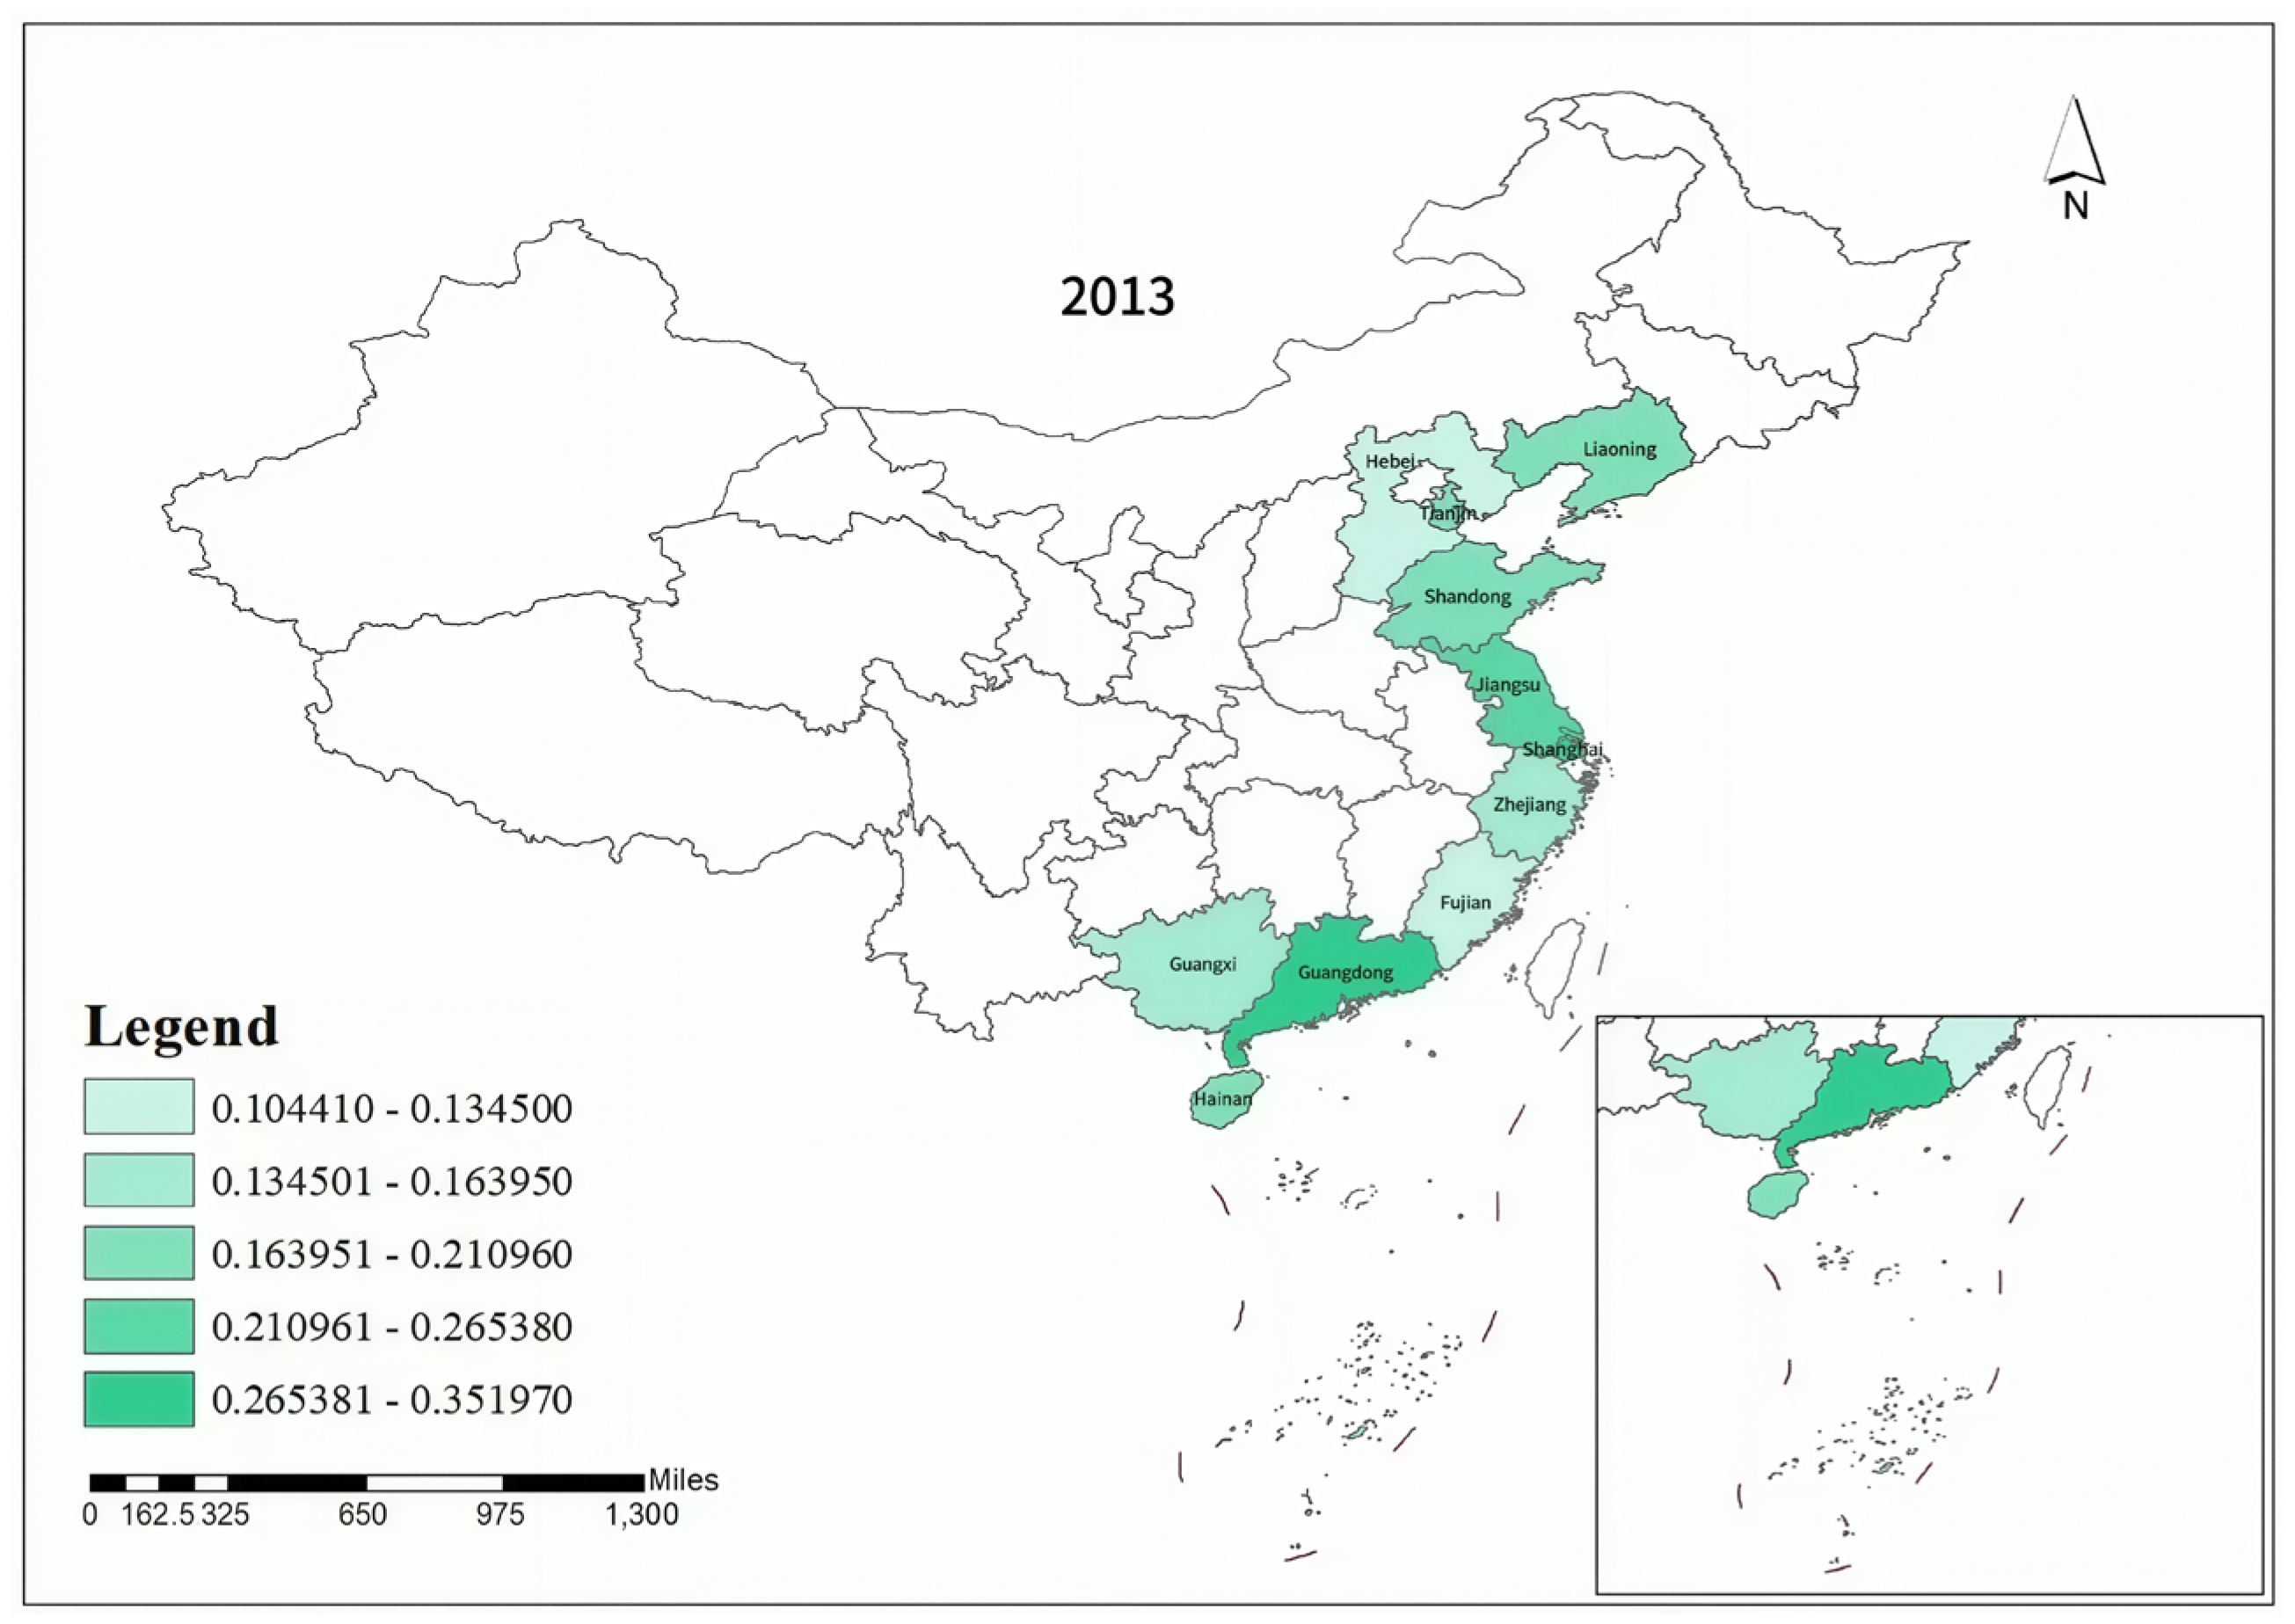
This study selected 2013 and 2022 as representative years, used ArcGIS 10.8.1 software to visualize the results of the high-quality development evaluation index for the marine economy in China’s coastal regions. A comparative analysis was conducted between the two years, with the results shown in Figure 4 and Figure 5.
Figure 4 and Figure 5 illustrate the spatial distribution of high-quality development of the marine economy across China’s 11 coastal provinces in 2013 and 2022, respectively. Overall, the level of high-quality marine economic development in coastal regions rose between 2013 and 2022, but the regional patterns and the evolution of marine new-quality productive forces exhibited both similarities and differences.
In 2013, the HQD-ME of most provinces was concentrated in the 0.104–0.224 range. Among them, Guangdong, Shanghai, and Shandong were relatively high but had not yet exceeded 0.224; Guangxi and Hainan were in the lowest range. In the Northern Marine Economic Zone, Liaoning, Hebei, Tianjin, and Shandong were all within the 0.104–0.224 range, with relatively small internal differences. By 2022, regional divergence had intensified. Guangdong surged into the 0.344–0.406 range, while Shanghai, Jiangsu, and Zhejiang entered the 0.284–0.344 range, and Shandong, Tianjin, and Fujian rose to the 0.224–0.284 range. However, Guangxi, Hainan, and Hebei remained in the 0.104–0.164 range, while Liaoning only reached the 0.164–0.224 range. Compared to the distribution of marine new-quality productive forces, the degree of polarization in high-quality marine economic development is slightly lower. Nevertheless, the overall advantage of the Eastern Marine Economic Zone remains evident. In the Southern Marine Economic Zone, the pattern of “Guangdong leading while Guangxi and Hainan lag behind” remains prominent, while the Northern Marine Economic Zone exhibits the characteristic of “Shandong performing relatively well, with the rest developing slowly.”

5.2. Benchmark Regression and Further Analysis

5.2.1. Benchmark Regression Analysis

This study employed Stata 17.0 software, Using panel data from 2013 to 2022, we conduct F-tests, LM tests, and Hausman tests to select the most appropriate model among pooled OLS, fixed-effects, and random-effects models. The results indicate that the fixed-effects model is the most suitable for the baseline regression. The baseline regression results are presented in Table 6.
As shown in Table 6, in Column (1), where no control variables were included, the coefficient for marine new-quality productive forces was 0.138 and was statistically significant at the 1% level, indicating a positive association with the high-quality development of the marine economy. As control variables were gradually introduced (Columns 2–6), the coefficient of marine new-quality productive forces fluctuated slightly, ranging from 0.136 to 0.193, and remained significant at the 1% or 5% level throughout. These results indicate that marine new-quality productive forces consistently show a stable positive association with the high-quality development of the marine economy, supporting the robustness of this relationship. This finding provides empirical support for Hypothesis 1, namely that marine new-quality productive forces are positively associated with the high-quality development of the marine economy. It is worth noting that even after the gradual inclusion of multiple control variables, the coefficient for marine new-quality productive forces remains statistically significant, suggesting that this positive association persists after controlling for other variables.
Regarding the control variables, the coefficient for fiscal support (FS) was positive and statistically significant at the 5% level in Models (2) through (6), suggesting that fiscal expenditure in support of the marine economy is positively associated with high-quality development. The coefficient for openness (OPEN) was positive in most models and reached marginal significance at the 10% level in Model (6), indicating that greater economic openness and stronger international exchange and cooperation may contribute to enhancing the quality of the marine economy. The coefficient for environmental regulation intensity (ENV) was negative but not statistically significant, which may reflect that the effects of current environmental constraint policies in the marine economy have not yet fully materialized; it could also be related to the measurement of indicators or policy intensity during the sample period, and thus warrants further investigation. The coefficient for the share of the marine tertiary sector (INST) was positive and significant at the 10% level in Model (6), suggesting that the transformation of the marine industrial structure toward a service-oriented and high-end model is an important pathway associated with high-quality development.
The overall model fit (R2) gradually increased from 0.077 to 0.202, indicating that the inclusion of control variables and fixed effects helps explain part of the variation in high-quality marine economic development. All F-statistics were significant at the 1% level, suggesting that the model specification is generally reliable. In summary, the baseline regression results not only confirm the important role of marine new-quality productive forces but also highlight the relevance of fiscal support, openness, and industrial structure optimization, providing preliminary empirical references for subsequent mechanism tests.

5.2.2. Further Analysis

Based on the results of the baseline regression, marine new-quality productive forces have a significant positive impact on the high-quality development of the marine economy. However, given that high-quality development of the marine economy is a comprehensive concept encompassing five dimensions—innovation, coordination, green development, openness, and shared benefits—the composite index may obscure the differentiated effects of MNQP across these dimensions. To reveal this heterogeneity, this paper further decomposes the HQD-ME into five sub-indexes, treating each as a dependent variable. Using the same model (1) as in the baseline regression, we estimate the impact of MNQP on each dimension. The regression results are presented in Table 7.
Table 7 reports the regression results for the association between marine new-quality productive forces (MNQP) and the various dimensions of high-quality marine economic development. MNQP shows a positive association with the innovation, coordination, and sharing dimensions, with coefficients of 0.402 (significant at the 1% level), 0.319 (significant at the 1% level), and 0.592 (significant at the 1% level), respectively. Among these, the coefficient for the sharing dimension is the largest, suggesting a relatively stronger association between MNQP and improvements in people’s well-being. MNQP shows a negative association with the green dimension (coefficient: −0.279, significant at the 5% level) and a positive but not statistically significant association with the openness dimension (coefficient: 0.108). Possible reasons for these findings are as follows. During the sample period (2013–2022), the development of marine new-quality productive forces may have focused primarily on digitalization, intelligentization, and industrial scale expansion, while the research, development, and application of green technologies typically involve a longer lag period, which may have prevented ecological and environmental performance from improving in tandem. In addition, the negative coefficients for environmental regulation intensity (ENV) in some dimensions may reflect the short-term cost effects of environmental constraint policies on economic activities. The lack of significance in the openness dimension suggests that the role of MNQP in driving the export-oriented economy has not yet fully materialized, which may be related to the strong independence of coastal provinces’ opening-up policies and insufficient interregional coordination. These results indicate that the enabling effect of marine new-quality productive forces on high-quality development varies across dimensions. The positive association observed in the composite index is primarily driven by the innovation, coordination, and sharing dimensions, while the negative association in the green dimension suggests that the integration of green technologies needs to be strengthened in the current process of fostering new-quality productive forces.

5.3. Robustness Checks

5.3.1. Replacement of Core Explanatory Variable

The core explanatory variable was replaced, and the entropy weight-TOPSIS method was applied to recalculate the development level of Marine New Quality Productivity (MNQP), yielding an updated comprehensive index. The corresponding regression results are reported in Table 8.
Table 8 presents the results of robustness tests conducted after recalculating the core explanatory variable “Marine New Quality Productivity (MNQP)” using the entropy-weighted TOPSIS method. After replacing the variable, the coefficients of MNQP in Models (1) through (5) remain positively significant at the 5% or 1% levels. Although the values fluctuate slightly compared to the baseline regression results (Table 5), both the significance and the direction of the coefficients remain consistent, indicating that the positive association between MNQP and high-quality marine economic development is robust and does not depend on a specific indicator weighting method. In Model (6), after introducing all control variables, the coefficient of MNQP decreases and becomes statistically insignificant. This may be because the entropy weighting method and the TOPSIS method assign differentiated weights to different indicators when constructing composite indices, thereby attenuating the contribution of certain dimensions. Consequently, with multiple control variables included, the statistical significance is temporarily reduced; however, the overall positive association remains unchanged.
In terms of control variables, the coefficient for fiscal support (FS) remains positively significant at the 1% or 5% level, once again confirming the important role of government fiscal resources in guiding the quality improvement and upgrading of the marine industry. The sign of the coefficient for openness (OPEN) is consistent with that in the baseline model, and it is marginally significant (at the 10% level) in Model (6), further supporting the positive association between expanding openness and improving the quality of the marine economy. The magnitude and significance of the coefficients for variables such as environmental regulation (ENV), average years of education (EDU), and marine industrial structure (INST) have not changed substantially, indicating that the effects of these factors remain relatively stable across different model specifications. Although the model’s goodness-of-fit (R2) has declined slightly, it remains within a reasonable range, reflecting that while the variable restructuring has led to minor adjustments in the information structure, it does not undermine the model’s overall explanatory power.
In summary, changing the construction of the core explanatory variables did not lead to substantial changes in the core conclusions, indicating that the main findings of this study are robust and do not depend solely on specific indicator weighting methods.

5.3.2. Winsorization Treatment

To further validate the aforementioned conclusions, this study applies Winsorization treatment to the test samples. Specifically, to mitigate the adverse effects of outliers in the dataset, all variables undergo 1% bilateral Winsorization, as detailed in Table 9.
Table 9 presents the regression results after applying two-sided trimming at the 1% level to all variables. This procedure is intended to reduce potential biases in parameter estimates caused by outliers and is a commonly used step in assessing model robustness. The results show that, after trimming, the coefficient of the core explanatory variable-marine new-quality productive forces (MNQP)-is statistically significant at the 1% level in Models (1) through (5), and remains significant at the 5% level in Model (6), which includes all control variables (coefficient: 0.148; t-value: 2.506). Compared with the baseline model (Table 6), neither the magnitude of the coefficient nor the significance level has changed substantially, suggesting that the positive association between MNQP and high-quality marine economic development is not primarily driven by a few outliers, and the estimation results are relatively stable.
It is worth noting that the estimation results for the control variables reveal more detailed information after trimming. The coefficient for fiscal support (FS) remains positively significant at the 1% level and stable, indicating the sustained role of government fiscal resources in supporting marine science and technology innovation and industrial upgrading. The coefficient for openness (OPEN) becomes positively significant at the 5% level in Model (6), suggesting that after excluding the influence of outliers, the association between openness and high-quality development appears clearer and more consistent. Although the coefficient for environmental regulation intensity (ENV) remains negative, it is not statistically significant, which may reflect the complex relationship between environmental constraint policies and marine economic performance; its effectiveness could depend on stronger policy enforcement or more comprehensive green technology support. The coefficient for marine industrial structure (INST) becomes positive but remains insignificant, suggesting that the effect of industrial upgrading on quality improvement may vary across the extremes of the sample distribution. The trends and significance levels of these control variable coefficients fluctuate within reasonable ranges, further supporting the stability of the model specification. Therefore, the goodness-of-fit and F-statistics for all models indicate that the models are valid and their explanatory power is not substantially weakened by sample trimming. Moreover, the significance of key variables is maintained or even enhanced. The regression results after trimming are largely consistent with the baseline regression, indicating that the influence of outliers on the core conclusions is limited.

5.3.3. Endogeneity Tests

In panel data models, reverse causality is a common source of endogeneity. Given the potential bidirectional relationship between marine new-quality productive forces and the high-quality development of the marine economy, the model may suffer from endogeneity. To mitigate this issue, this study replaces the current-period MNQP with its one-period lag (L.MNQP) and re-estimates the baseline regression, thereby reducing endogeneity bias and enhancing the reliability of the conclusions. The regression results are presented in Table 10.
As shown in Table 10, in Models (1) through (6), the coefficient of L.MNQP is consistently positive and significant at the 1% level, consistent with the sign and significance of the current-period MNQP coefficient in the baseline regression (Table 6). Taking Model (6), which includes all control variables, as an example, the coefficient of L.MNQP is 0.343, whereas the coefficient of current-period MNQP in the baseline regression is 0.136. Although the coefficient for the one-period lag is slightly larger than that for the current period—which may reflect the cumulative effect or dynamic transmission process of marine new-quality productive forces on high-quality development—the core conclusion that there is a positive association between marine new-quality productive forces and high-quality marine economic development remains supported. Thus, reverse causality does not appear to be a major concern in this study.

5.4. Mediation Effect Analysis

Using panel data from 2013 to 2022, this paper constructs a mediation model to examine whether marine science and technology innovation mediates the relationship between marine new-quality productive forces and the high-quality development of the marine economy. The mediation results are presented in Table 11.
As shown in Table 11, the coefficient for the direct association between marine new-quality productive forces and the high-quality development of the marine economy in Model (1) is 0.136, which is statistically significant at the 5% level, providing preliminary support for a positive relationship. Model (2) further examines the association between marine new-quality productive forces and the mediating variable, marine science and technology innovation. The results show that the coefficient of MNQP on MSTI is 0.324, significant at the 10% level, suggesting that improvements in marine new-quality productive forces are associated with the development of marine science and technology innovation. Finally, in Model (3), after simultaneously introducing MNQP and MSTI, the coefficient for marine science and technology innovation is 0.082, significant at the 5% level. This indicates that marine science and technology innovation plays a mediating role in the relationship between the two. This result is consistent with Hypothesis 2, namely that marine science and technology innovation partially mediates the association between marine new-quality productive forces and the high-quality development of the marine economy. This finding suggests that strengthening investment in marine science and technology R&D and optimizing the allocation of innovation resources may help unlock the potential of marine new-quality productive forces; however, the causal mechanism requires further verification.

5.5. Threshold Effect Analysis

Having confirmed that Marine New Quality Productivity (MNQP) significantly promotes the high-quality development of the marine economy, further clarification is needed regarding whether this effect is linear or nonlinear, as well as the role of economic development level in their relationship. In particular, it is necessary to examine whether the empowering effect of MNQP on high-quality marine economic development intensifies or weakens once the economic development level surpasses a certain threshold. To address this issue, a panel threshold model is constructed, with economic development level designated as the threshold variable. The threshold effect is estimated using the bootstrap method to compute the asymptotic estimate of the F-statistic and its corresponding p-value. The reasonableness of the threshold value is further validated through 300 grid searches and 300 bootstrap iterations. Table 12 presents the detailed results of the threshold regression.
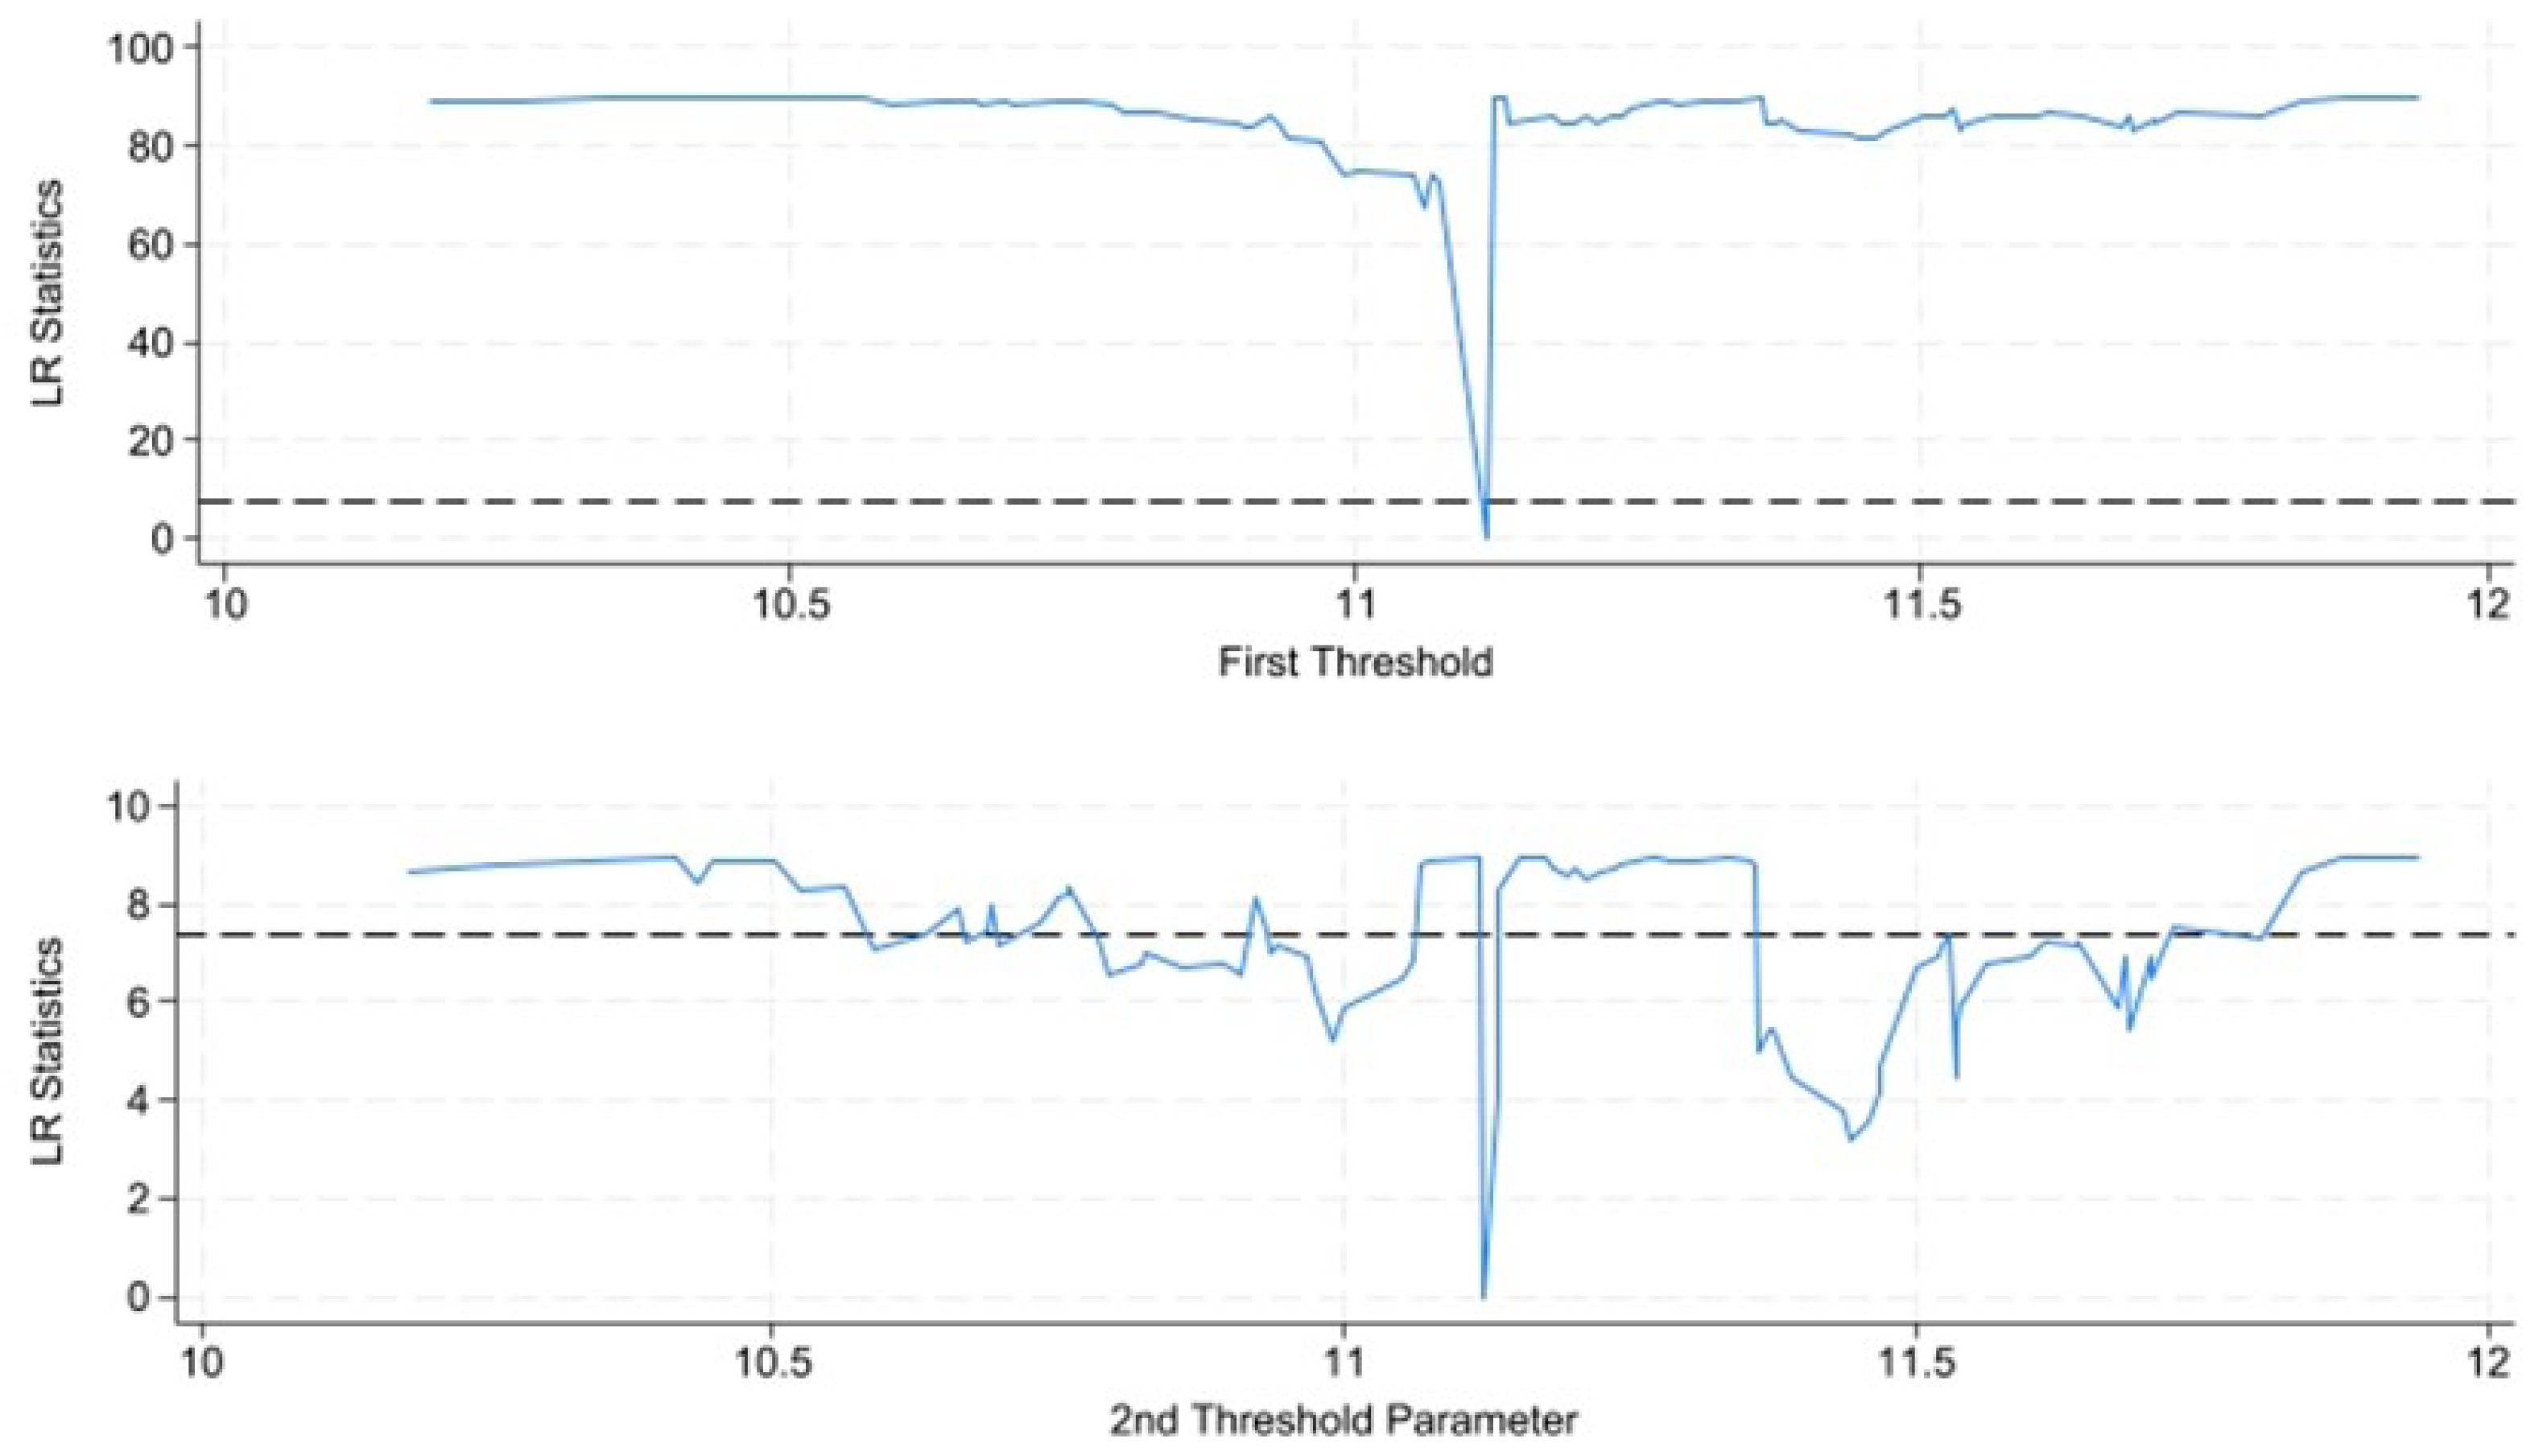
As shown in Table 12, in the threshold regression model using the level of economic development as the independent variable, the F-statistic in the double-threshold test is 72.57 with a p-value of 0.000, indicating the presence of a double-threshold effect. The estimated threshold values are γ1 = 11.1171 and γ2 = 11.1221. It is worth noting that the first threshold value estimated in the double-threshold model (γ1 = 11.1171) differs somewhat from the value estimated in the single-threshold model (11.0838). This may be because the double-threshold model is designed to more accurately capture the complex nonlinear relationship between the independent and dependent variables. When a second threshold is introduced, the two threshold values are re-optimized as a single unit to minimize the sum of squared residuals across the entire sample, resulting in a corresponding adjustment to the first threshold value. It should be noted that the two estimated threshold values are numerically very close (with a difference of approximately 0.004), which may reflect a continuous and smooth nonlinear relationship. Furthermore, the confidence intervals for the two estimates overlap considerably (as shown in Figure 6), indicating that this difference is not statistically significant; instead, attention should be focused on the consistency of their economic implications. In Figure 6, the LR statistics at both threshold values are significantly below the 5% critical line, and the confidence intervals are narrow, strongly supporting the conclusion that these two threshold estimates have high statistical significance and economic relevance, and are by no means coincidental.
Based on the above findings, this paper further conducts a single-threshold regression analysis using the level of economic development as the threshold variable, as shown in Table 13. The panel threshold regression results in Table 13, together with the likelihood ratio (LR) trend from the double-threshold estimates in Figure 6, collectively indicate that the level of economic development (EDL) plays a notable nonlinear moderating role in the relationship between marine new-quality productive forces (MNQP) and the high-quality development of the marine economy.
Based on the estimation results in Table 13, two significant thresholds (γ1 = 11.0838, γ2 = 11.1221) divide the sample into three intervals of economic development: low, medium, and high. At the low development stage (EDL ≤ 11.0838), the coefficient of marine new-quality productive forces (MNQP) is negative and not statistically significant, suggesting that when the regional economic foundation is relatively weak, the positive association between MNQP and economic quality has not yet materialized. This may be due to insufficient accumulation of innovation factors, limited industrial capacity, or inadequate supporting infrastructure. Once the economic development level exceeds the first threshold (11.0838 < EDL ≤ 11.1221), reaching the medium development stage, the marginal effect of MNQP becomes considerably stronger, with a coefficient of 0.1996 (significant at the 1% level). This indicates that at this stage, the regional economy has accumulated enough momentum to effectively absorb and transform innovation factors, and MNQP shows a notably positive association with high-quality development. However, when the economic development level surpasses the second, higher threshold (EDL > 11.1221), entering the high development stage, the coefficient remains positive but declines to 0.1191, and its significance level drops to 10%. This suggests that at high development levels, improvements in marine economic quality and efficiency may depend more on other factors such as industrial structure optimization and institutional innovation. In summary, the positive association between marine new-quality productive forces and high-quality marine economic development exhibits nonlinear characteristics across different stages of economic development: not significant at the low stage, markedly stronger at the medium stage, and somewhat weaker at the high stage. This finding is consistent with Hypothesis 3 and provides a reference for differentiated regional policy formulation.
In conclusion, the findings reveal that the promoting effect of Marine New Quality Productivity (MNQP) on the high-quality development of the marine economy does not follow a simple linear pattern; rather, it is significantly contingent upon the regional economic development stage, displaying pronounced “threshold effects” and an “optimal range.” This result confirms Hypothesis 3 and offers essential empirical evidence and theoretical grounding for designing differentiated, stage-appropriate policies to foster marine economic development.

6. Discussion

Based on panel data from 11 coastal provinces in China covering the period 2013–2022, this paper examines the mechanisms through which new-quality marine productive forces influence the high-quality development of the marine economy. The following sections provide an in-depth discussion of the main findings.

6.1. Discussion on the Positive Association with Marine New-Quality Productive Forces

The baseline regression results indicate a positive association between marine new-quality productive forces and the high-quality development of the marine economy. However, it is worth noting that as control variables were progressively included, the coefficient of MNQP rose from 0.138 (Model 1) to 0.193 (Model 3), and then fell back to 0.136 (Model 6). This fluctuation may reflect the moderating or interfering effects of different control variables on the MNQP coefficient. Specifically, the inclusion of fiscal support intensity (FS) and openness (OPEN) increased the MNQP coefficient, suggesting that these two variables may have a synergistic effect with MNQP—that is, government fiscal investment and an open external environment may help amplify the positive association of new-quality productive forces. Conversely, the inclusion of environmental regulation intensity (ENV) and marine industrial structure (INST) caused the coefficient to decrease, suggesting that part of the MNQP effect may be indirectly related to environmental regulation and industrial structure optimization. This finding indicates that the positive association of marine new-quality productive forces does not exist in isolation but is closely intertwined with the regional policy environment, level of openness, and industrial structure. This finding is consistent with the study by Gao et al. [24], who found that marine new-quality productive forces are positively associated with the resilience of the marine economy, and similarly highlighted the importance of the regional policy environment and the level of openness. Compared with the conclusions drawn by Yi et al. from a green finance perspective [14], this paper further suggests a synergistic amplifying effect of fiscal support and openness on the empowerment of marine new-quality productive forces, offering additional evidence for understanding the interactive effects of different policy instruments.

6.2. Discussion on the Mediating Role of Marine Science and Technology Innovation

The mediation analysis indicates that marine science and technology innovation plays only a partial mediating role between the two variables, with a relatively low level of statistical significance (10%). Although this result supports theoretical expectations, its magnitude is weaker than might be intuitively expected. Three possible reasons may account for this. First, the mediating variable used in this study reflects primarily innovation inputs and may not fully capture innovation outputs. If the efficiency of converting inputs into outputs is limited, the mediating effect would naturally be reduced. Second, marine science and technology innovation is characterized by long cycles and high risks; it may take a longer lag period for R&D investments to translate into tangible improvements in high-quality marine economic development, and the contemporaneous model used in this study may not have fully captured this dynamic process. Third, other potentially important mediating pathways may exist that were not included in the model, which could account for part of the transmission effect of marine new-quality productive forces. Therefore, future research should consider constructing a multidimensional innovation indicator system and further explore the relative importance of multiple mediating pathways. This study reveals that the mediating effect of marine technology innovation is relatively weak, which contrasts with the mediating effect of green technology innovation between green finance and the high-quality development of the marine economy identified by Yi et al. [14]. Possible reasons for this include the longer innovation cycle and higher risks associated with marine technology innovation, as well as the fact that the mediating variables used in this study reflect R&D inputs rather than outputs, which may lead to an underestimation. Wei et al. suggest that the digital economy may be positively associated with high-quality marine development by enhancing resource allocation efficiency [13]; this implies that, in addition to marine technology innovation, digital infrastructure and human capital accumulation may also be important mediating pathways, warranting further investigation in future research.

6.3. Discussion on the Threshold Effect Related to Economic Development Levels

The threshold effect test shows that the two estimated threshold values (11.1171 and 11.1221) are very close, and the coefficient of MNQP tends to decline at higher levels of economic development. At first glance, this finding appears to contradict the intuitive notion that “the higher the level of economic development, the stronger the role of new-quality productive forces,” but upon closer examination, it may be considered reasonable. First, the closeness of the two thresholds may indicate that there is no true “double-threshold” discrete structure, but rather a continuous, smooth curve where the marginal effect rises steeply at first and then declines gradually. In other words, the moderating effect of economic development level on the association of MNQP is gradual rather than abrupt. Second, the decline in the coefficient at the high-development stage (from 0.1996 to 0.1191) may be attributed to several factors. One is the law of diminishing marginal returns: when the economic development level is already high, the scope for efficiency improvements in the marine industry may narrow, and the marginal contribution of additional investments in new-quality productive forces could naturally decrease. Another is a shift in growth drivers: at very high levels of development, further growth in the marine economy may rely more on non-production factors such as institutional innovation, integration into global value chains, and expansion of high-end service industries, while the role of technological and productivity improvements represented by new-quality productive forces may become relatively less pronounced. A third factor is sample limitations: relatively few sample provinces are at extremely high development levels, which may affect the stability of statistical estimates. The policy implication of this finding is that developed regions should avoid simply expanding the scale of investment in new-quality productive forces and instead consider shifting toward more refined institutional innovation and open collaboration. The non-linear pattern of “initially strengthening and then weakening” observed in this paper shares both similarities and differences with the threshold effect of green finance identified by Yi et al. [14]—specifically, that the positive association of green technological innovation becomes stronger after crossing a certain threshold. Both studies confirm the presence of a non-linear moderating effect; however, in this paper the threshold variable is the level of economic development, and the marginal contribution tends to decline at higher levels. This difference may be attributed to the distinct mechanisms of the variables involved—there appears to be an “optimal range” within which economic development supports the release of productivity, whereas technological innovation tends to exhibit a continuous positive cumulative effect. Gao et al. found that marine new-quality productive forces are more strongly associated with economic resilience in less developed regions [24]. This finding seems to differ from the present study’s result that the positive association is not significant at low development levels. Notably, Gao et al. measured “economic resilience,” whereas the present study focuses on “high-quality development.” Moreover, the negative coefficient observed for low-development regions in this study may reflect constraints imposed by resource misallocation or lagging infrastructure on high-quality development.

6.4. Discussion on Regional Disparities

Table 5 shows that the Eastern Marine Economic Zone has relatively high mean values for both MNQP and HQD-ME, with relatively small disparities among the three provinces, whereas the Southern Zone exhibits notable internal disparities (with Guangdong leading and Guangxi and Hainan lagging). This pattern may be related to the degree of regional integration and innovation spillover effects. The Eastern Marine Economic Zone (Jiangsu, Shanghai, and Zhejiang) is part of the Yangtze River Delta region. It has long maintained a high level of integration in terms of infrastructure connectivity, talent mobility, and industrial collaboration. Innovative factors can flow relatively freely among the three provinces, thereby helping to reduce development gaps. In contrast, although Guangdong possesses strong economic strength within the Southern Marine Economic Zone, the geographical distance, industrial interdependence, and policy coordination between Guangxi and Hainan and Guangdong are relatively low. Consequently, Guangdong’s radiating and driving effects may not have effectively spilled over, resulting in a “center-periphery” polarization pattern. This observation suggests that promoting the coordinated regional development of new-quality marine productive forces requires not only increased investment in lagging regions but also the establishment of cross-regional coordination mechanisms to break down administrative barriers and facilitate the flow of innovation factors. The balanced development of the Eastern Marine Economic Zone and the polarized pattern of the Southern Zone are broadly consistent with the findings of Gao et al. regarding the spatial distribution of China’s three major coastal marine economic zones [24]. That study also revealed that the Yellow Sea and East China Sea regions (corresponding to the Eastern Marine Economic Zone in this paper) are relatively balanced in their development, whereas the South China Sea region (the Southern Marine Economic Zone) exhibits notable internal disparities. This consistency in regional heterogeneity offers empirical support for cross-regional coordination policies.
This study has several limitations. On the one hand, although the indicator system was designed to be as comprehensive as possible, it remains constrained by data availability. Future research could incorporate more micro-level enterprise data or indicators such as green total factor productivity to improve measurement accuracy. On the other hand, the study period only covers the years 2013–2022, which may not fully capture the dynamic evolution of marine new-quality productive forces over a longer timeframe. Furthermore, this study did not account for potential external factors such as spatial spillover effects or changes in the international environment. Future research could consider using spatial econometric models or global value chain analysis frameworks to further deepen the analysis. In summary, marine new-quality productive forces appear to be an important engine for promoting the high-quality development of China’s marine economy; however, the realization of their potential likely depends on the synergistic evolution of technological innovation and the stage of economic development. Going forward, it may be advisable to pursue a development path characterized by innovation-driven growth, regional coordination, and green, low-carbon practices. By combining policy guidance, institutional safeguards, and market mechanisms, it may be possible to comprehensively enhance the quality, efficiency, and international competitiveness of the marine economy.

7. Conclusions

Using panel data from 11 coastal provinces in China for the period 2013–2022, this study employs the entropy method, panel fixed-effects models, mediation models, and threshold models to examine the association between marine new-quality productive forces and the high-quality development of the marine economy. The main conclusions are as follows:
(1)
There is a positive association between marine new-quality productive forces and the high-quality development of the marine economy. This association remains robust after controlling for fiscal support, openness, environmental regulation, educational attainment, and marine industrial structure. Test results from replacing the core explanatory variable, trimming analysis, and one-period lagged regression support this conclusion.
(2)
Marine technological innovation plays a partial mediating role between marine new-quality productive forces and the high-quality development of the marine economy. Marine new-quality productive forces may indirectly contribute to high-quality marine economic development by fostering marine technological innovation; however, the strength of the mediating effect is limited, suggesting that other unidentified transmission channels may exist between the two.
(3)
The level of economic development exerts a nonlinear moderating effect on the association between marine new-quality productive forces and the high-quality development of the marine economy. At lower stages of economic development, the positive association is not significant; it strengthens considerably at intermediate stages; and it weakens somewhat at higher stages.

Author Contributions

Conceptualization, X.S. and H.T.; methodology, X.S. and H.T.; software, H.T.; validation, H.T., Y.W. and C.C.; formal analysis, X.S.; investigation, H.T.; re-sources, X.S.; data curation, H.T. and Y.W.; writing—original draft preparation, H.T.; writing—review and editing, X.S.; visu-alization, H.T.; supervision, X.S.; project administration, X.S.; funding acquisition, X.S. All authors have read and agreed to the published version of the manuscript.

Funding

This research was funded by [Educational Department of Liaoning Province] grant number [JYTMS20230512] And The APC was funded by [Xiujuan Sha].

Institutional Review Board Statement

Not applicable.

Informed Consent Statement

Not applicable.

Data Availability Statement

The data presented in this study are available on request from the corresponding author.

Conflicts of Interest

The authors declare no conflict of interest.

References

  1. Wang, H. Promoting Chinese Modernization Through New Achievements in Building a Maritime Power. Qi Zhi 2024, 53–55. Available online: http://www.qizhiwang.org.cn/n1/2024/0222/c458466-40181588.html (accessed on 27 March 2026).
  2. Li, X.-H.; He, J.-Y.; Yan, H. Study on regional differentiation, distribution dynamics and influencing factors of marine economic development in three major marine economic circles of China. J. Nat. Resour. 2022, 37, 966–984. [Google Scholar] [CrossRef]
  3. Di, Q.-B.; Kang, M.-Y.; Chen, X.-L. Study on the coupling coordination relationship and influencing factors between digital economy and high-quality development of marine economy and high-quality development of marine economy and its influencing factors. Mar. Econ. 2025, 15, 1–10. [Google Scholar] [CrossRef]
  4. Lu, Y.-Y.; Yuan, F.; Li, X.-Y. Construction and application of an evaluation index system for high-quality development of China’s marine economy: Based on the five development concepts. Enterp. Econ. 2019, 38, 122–130. [Google Scholar] [CrossRef]
  5. Ding, L.-L.; Yang, Y.; Li, H. Bidirectional Evaluation and Difference of High-quality Development Level of Regional Marine Economy. Econ. Geogr. 2021, 41, 31–39. [Google Scholar] [CrossRef]
  6. Min, C.; Ping, Y. Research on evaluation and improvement path of high-quality development capacity of marine economy. Ocean Dev. Manag. 2023, 40, 120–128. [Google Scholar] [CrossRef]
  7. Liu, L.-Q.; Liang, J.-Y.; Zhang, J. Research on High Quality Development Level and Coupling Coordination of China’s Marine Economy. Mar. Econ. 2023, 13, 115–126. [Google Scholar] [CrossRef]
  8. Qiu, R.-S.; Yin, W.; Han, L.-M. Evaluation and Type Division of High-quality Development Level of Regional Marine Economy in China. Stat. Decis. 2023, 39, 103–108. [Google Scholar] [CrossRef]
  9. Di, Q.-B.; Gao, G.-Y.; Yu, Z. Evaluation and influencing factors of high-quality development of marine economy in China. Sci. Geogr. Sin. 2022, 42, 650–661. [Google Scholar] [CrossRef]
  10. Wang, Z.-Y.; Wu, Q. Study on the Coupling and coordination of the digital economy and high-quality development of the marine economy. Resour. Dev. Mark. 2024, 40, 52–59. [Google Scholar] [CrossRef]
  11. Ni, R.; Guan, H.-J. Co-evolution and interactive response between marine ecological security and high-quality development of marine economy. Stat. Decis. 2023, 39, 127–131. [Google Scholar] [CrossRef]
  12. Fu, K.-B.; Ding, Z.-S.; Guo, Y.-H. Digital economy, industrial upgrading, and high-quality development of marine economy. Price Theory Pract. 2022, 78–81+205. [Google Scholar] [CrossRef]
  13. Yao, W.; Du, Y.; Cheng, H. How does the digital economy empower high-quality marine development? Int. Rev. Econ. Financ. 2026, 106, 104996. [Google Scholar] [CrossRef]
  14. Yi, C.; Zhang, Y.; Xi, S.; Lin, K. High-Quality Development of China’s Marine Economy: Green Finance Perspectives (2010–2021). Sustainability 2025, 17, 7271. [Google Scholar] [CrossRef]
  15. Xi, J.P. Presiding over the symposium on promoting the comprehensive revitalization of Northeast China in the new era: Firmly grasping the important mission of Northeast China and striving to write a new chapter in its revitalization. People’s Daily, 10 September 2023; p. 1.
  16. Yu, H.-J.; Lu, B.-Z.; Li, D.-H. The Connotative Characteristics, Development Path, and Policy Recommendations of Marine New Quality Productivity. J. Ocean Univ. China (Soc. Sci. Ed.) 2024, 11–18. [Google Scholar] [CrossRef]
  17. Ji, J.-Y.; Chi, Y.-H.; Cao, S.-P. The Research on the Logic, Multidimensional Connotation and Evaluation Framework of Marine New Quality Productivity. J. Ocean Univ. China (Soc. Sci. Ed.) 2024, 1–12. [Google Scholar] [CrossRef]
  18. Lei, X. Measuring the level of new quality, productivity decomposing regional differences, and dynamic evolution in China. J. Ind. Technol. Econ. 2024, 43, 30–39. [Google Scholar] [CrossRef]
  19. Li, Y.; Chen, H.-L.; Tian, M.-Z. Statistical measurement and spatio-temporal evolution characteristics of new quality productive forces level. Stat. Decis. 2024, 40, 11–17. [Google Scholar] [CrossRef]
  20. Wang, J.; Wang, R.-J. New quality productivity: Index construction and spatiotemporal evolution. J. Xi’an Univ. Financ. Econ. 2024, 37, 31–47. [Google Scholar] [CrossRef]
  21. Gong, Y.-R.; Liu, H.-W. The Theoretical implications, statistical measurement, and spatiotemporal differentiation Characteristics of New Quality Productive Forces. J. Hubei Minzu Univ. (Philos. Soc. Sci.) 2024, 42, 69–79. [Google Scholar] [CrossRef]
  22. Ye, F.; Wang, G.-D.; Shi, Y.-Y.; Guo, Y.-F.; Gao, P. Measurement of the level of marine new quality productive forces in China, regional differences and convergence studies. Mar. Sci. Bull. 2024, 43, 639–651. [Google Scholar] [CrossRef]
  23. Gu, B.-J.; Peng, Y.-W.; Chen, F. Evaluation of China’ s Marine New Quality Productivity and Identification of Key Influencing Factors. J. Ocean Univ. China (Soc. Sci.) 2024, 13–25. [Google Scholar] [CrossRef]
  24. Gao, Q.; Feng, Z.; Li, K. Research on the Impact of Marine New Quality Productive Forces on Marine Economic Resilience: A Case Study of 11 Coastal Provinces and Cities in China. Sustainability 2025, 17, 4457. [Google Scholar] [CrossRef]
  25. Xie, B.-J.; Li, Q.-W. The Logic and Path for Promoting High-Quality Development of Marine Economy with New Quality Productive Forces. Southeast Acad. Res. 2024, 107–118+247. [Google Scholar] [CrossRef]
  26. Sha, X.; Tang, H.; Wang, Y. Research on the measurement and spatio-temporal evolution of marine new-quality productivity in China. Front. Mar. Sci. 2025, 12, 1551481. [Google Scholar] [CrossRef]
  27. Zhang, L.; Pu, Q. The connotation characteristic, theoretical innovation and value implication of new quality productivity. J. Chongqing Univ. (Soc. Sci. Ed.) 2024, 29, 137–148. [Google Scholar] [CrossRef]
  28. Peng, X.-S. Formation Logic, Development Path, and Key Levers of New Quality Productive Forces. Econ. Rev. J. 2024, 23–30. [Google Scholar] [CrossRef]
  29. Fu, M.-J.; Li, X.-H. Policies for New Quality Productive Forces: Context, Logic and Focus. J. Hebei Univ. (Philos. Soc. Sci.) 2024, 1–10. [Google Scholar] [CrossRef]
  30. Wu, F.; Gao, Q.; Liu, T. Measurement on Efficiency of Marine Science and Technology Innovation on Marine Economy Growth. Stat. Decis. 2019, 35, 119–122. [Google Scholar] [CrossRef]
  31. Yan, T.; Chen, Y. The Impact of Digital Economy on High-Quality Development: Verification Based on Intermediary Model and Threshold Model. Econ. Manag. 2022, 36, 1–7. [Google Scholar]
  32. Ji, J.-Y.; Tang, R.-M.; Sun, X.-W. Marine Scientific and Technological Innovation, Marine Industrial Structure Upgrade and Marine Total Factor Productivity: Empirical Research Based on Threshold Effect of 11 Coastal Provinces in China. Sci. Technol. Manag. Res. 2021, 41, 73–80. [Google Scholar] [CrossRef]
  33. Hausmann, R.; Hwang, J.; Rodrik, D. What you export matters. J. Econ. Growth 2007, 12, 1–25. [Google Scholar] [CrossRef]
  34. Hansen, B.E. Threshold effects in non-dynamic panels: Estimation, testing, and inference. J. Econom. 1999, 93, 345–368. [Google Scholar] [CrossRef]
  35. Acemoglu, D.; Aghion, P.; Zilibotti, F. Distance to Frontier, Selection, and Economic Growth. J. Eur. Econ. Assoc. 2006, 4, 37–74. [Google Scholar] [CrossRef]
  36. Jin, Y.-S.; Liu, Z.-Y. The impact effect test of innovation ecosystem in Guangdong-Hong Kong-Macao Greater Bay Area on regional economy. Stat. Decis. 2024, 40, 129–133. [Google Scholar] [CrossRef]
  37. Wang, J. New quality productive forces: A theoretical framework and indicator system. J. Northwest Univ. (Philos. Soc. Sci. Ed.) 2024, 54, 35–44. [Google Scholar] [CrossRef]
  38. Liu, S.-R.; Zhou, Z.; Huo, J.-L. Digital Economy, Marine Science and Technology Innovation and High-quality Development of Marine Economy: Empirical Test Based on Panel Threshold Regression Model. J. China Univ. Pet. (Ed. Soc. Sci.) 2023, 39, 71–81. [Google Scholar] [CrossRef]
  39. Qiu, S.-Q.; Lin, S.-Q. New quality productive promotes high-quality development of marine economy: Theoretical mechanism and empirical testing. J. Hainan Univ. (Humanit. Soc. Sci.), 2025; in press. [CrossRef]
  40. Xu, Y.-P.; Su, Z.-P.; Zhang, Y.; Lin, S.-J. Research on the impact of marine new quality productive forces on high-quality development of marine economy. J. Beibu Gulf Univ. 2025, 40, 72–83. [Google Scholar] [CrossRef]
  41. Guo, J.; Gu, L.-J.; Wang, C. Tax structure and common prosperity: Threshold effects of economic development level. Macroeconomics 2022, 64–80+129. [Google Scholar] [CrossRef]
Figure 1. Geographic Distribution of the Study Area and Delineation of the Three Major Marine Economic Zones. Note: The white areas represent China’s inland provinces not included in this study. The base map was drawn based on Map No. GS (2022) 1873 from the Standard Map Service website of the Ministry of Natural Resources; the boundaries of the base map have not been modified.
Sustainability 18 04377 g001
Figure 2. Spatial Distribution of Marine New-Quality Productive Forces in 2013. Note: The white areas represent China’s inland provinces not included in this study. The base map was drawn based on Map No. GS (2022) 1873 from the Standard Map Service website of the Ministry of Natural Resources; the boundaries of the base map have not been modified.
Sustainability 18 04377 g002
Figure 3. Spatial Distribution of Marine New-Quality Productive Forces in 2022. Note: The white areas represent China’s inland provinces not included in this study. The base map was drawn based on Map No. GS (2022) 1873 from the Standard Map Service website of the Ministry of Natural Resources; the boundaries of the base map have not been modified.
Sustainability 18 04377 g003
Figure 4. Spatial Distribution of High-Quality Development of the Marine Economy in 2013. Note: The white areas represent China’s inland provinces not included in this study. The base map was drawn based on Map No. GS (2022) 1873 from the Standard Map Service website of the Ministry of Natural Resources; the boundaries of the base map have not been modified.
Sustainability 18 04377 g004
Figure 5. Spatial Distribution of High-Quality Development of the Marine Economy in 2022. Note: The white areas represent China’s inland provinces not included in this study. The base map was drawn based on Map No. GS (2022) 1873 from the Standard Map Service website of the Ministry of Natural Resources; the boundaries of the base map have not been modified.
Sustainability 18 04377 g005
Figure 6. LR Trend of Double-Threshold Estimates.
Sustainability 18 04377 g006
Table 1. Comprehensive Evaluation Indicators for the Level of High-Quality Development in the Marine Economy.
Target LevelCriterion LevelIndicator LevelUnitAttributeWeight
High-Quality Development of the Marine EconomyInnovationIntensity of R&D Investment in the Marine Sector%+0.040
Number of Marine Scientific Research Publicationspiece+0.054
Number of Marine Research Projectsquantity+0.054
Proportion of Master’s and Doctoral Degree Holders Among Marine Research Personnel%+0.021
Proportion of Gross Ocean Product (GOP) in Regional Gross Domestic Product (GDP)%+0.062
CoordinationProportion of the Tertiary Marine Industry in the Total Marine Economy%+0.013
Growth Rate of Gross Ocean Product (GOP)%+0.031
Urbanization Rate in Coastal Areas%+0.017
Disposable Income Disparity Coefficient Between Urban and Rural Residents in Coastal Areas%0.016
Unemployment Rate%0.011
GreenVolume of Industrial Wastewater Directly Discharged into the Sea per Unit of Gross Output Value of Marine Industrieston(s) per 10,000 yuan0.003
Proportion of Expenditure on Environmental Protection%+0.030
Volume of Solid Waste Discharge per Unit of Gross Ocean Product (GOP)ton(s) per 10,000 yuan0.004
Per Capita Electricity Consumption in Coastal Areaskilowatt-hour0.012
Coverage Rate of Marine Nature Reserves%+0.211
OpennessEconomic Openness of Coastal Regions%+0.089
International Container Throughput of Coastal Portsten thousand containers+0.050
Actual Amount of Direct Foreign Investment Utilized in Coastal Regionsten thousand US dollars+0.039
Proportion of Inbound Tourists in Coastal Regions%+0.021
Inbound Tourism Reception Capacity in Coastal Regionsperson-time+0.054
SharedNumber of Current Students Enrolled in Marine-Related Majorsperson+0.031
Per Capita Number of Medical Institution Beds in Coastal Regionsquantity+0.019
Disposable Income of Urban Residents in Coastal Areasyuan+0.027
Per Capita Area of Public Parks and Green Spaces in Coastal Regionssquare meters per person+0.014
Employment Status of Workers in Urban Establishmentsten thousand people+0.078
Table 2. Evaluation Index System for Marine New-Quality Productive Forces.
First-Level
Indicators
Second-Level
Indicators
Third-Level IndicatorsExplanation of Indicator
Calculation
AttributeWeight
New-Type LaborersLaborers’ SkillsEducational AttainmentAverage Years of Education per Capita in Coastal Regions+0.045
Human Capital StructureNumber of Undergraduate Students in Marine Sciences/Total Population+0.047
Labor ProductivityPer Capita Output ValueGDP of Coastal Regions/Total Population in Coastal Regions+0.047
Per Capita IncomeAverage Annual Wage per Capita in Coastal Regions+0.047
New-Type Objects of LaborNew-Quality IndustriesProportion of Strategic Emerging IndustriesValue Added of Emerging Strategic Industries/GDP+0.053
Future IndustriesNumber of Robots per Capita+0.053
Ecological EnvironmentGreen and Environmentally FriendlyForest Coverage Rate+0.083
Expenditure on Environmental Protection/Total Government Public Fiscal Expenditure+0.046
Pollutant EmissionsSulfur Dioxide Emissions per Unit of GDP0.045
Wastewater Discharge per Unit of GDP0.044
Generation of General Industrial Solid Waste per Unit of GDP0.045
Industrial Waste ManagementIndustrial Wastewater Treatment Facilities+0.049
Industrial Air Emission Treatment Facilities+0.048
New-Type Means of LaborMaterial Means of ProductionProportion of IT Service Revenue in Coastal RegionsRevenue from Information Technology Services in Coastal Regions/GDP+0.096
Unit Length of Long-Distance Optical Fiber Cable in Coastal RegionsLong-Distance Optical Fiber Cable Length per Unit Area in Coastal Regions+0.096
Intangible Material Means of ProductionPatents per CapitaNumber of Marine Patent Grants per Capita+0.049
R&D InvestmentR&D Expenditure of Marine Research Institutions as a Share of GDP+0.048
Enterprise DigitalizationDigitalization Level of Enterprises in Coastal Regions +0.059
The digitalization level of enterprises in coastal regions is evaluated by identifying firms to their respective provinces using keywords extracted from annual reports of listed companies, followed by aggregating keyword frequencies and calculating their average values.
Table 3. Definitions of Variables.
Variable TypeVariable NameVariable SymbolVariable Definition
Dependent VariableHigh-quality Development of the Marine EconomyHQD-MEComprehensive Index for High-Quality Development of the Marine Economy
Key Explanatory VariableNew-quality Productive Forces in the Marine EconomyMNQPComprehensive Index for the Development of New-Quality Productive Forces in the Marine Economy
Mediating VariableMarine Science and Technology InnovationMSTIInternal Expenditure on Marine R&D/General Local Fiscal Expenditure
Control Variablethe Intensity or Magnitude of Financial SupportFSGeneral Budgetary Expenditure/Gross Regional Product of Coastal Areas
Degree of Openness to the Outside WorldOPEN(Total Value of Goods Imports and Exports × USD/CNY Exchange Rate)/Gross Regional Product of Coastal Areas
Intensity of Environmental RegulationENVTotal Investment in Environmental Pollution Control
Educational AttainmentEDUAverage Years of Schooling per Person
Marine Industrial StructureINSTProportion of the Tertiary Marine Industry in Gross Ocean Product (GOP)
Threshold VariableLevel of Economic DevelopmentEDLLogarithm of Per Capita GDP
Table 4. Descriptive Statistics of Defined Variables.
VariableObsMeanStd. Dev.MinMax
MNQP1100.1860.0850.0850.509
HQD-ME1100.2270.0830.1040.406
FS1100.2010.0650.1050.354
OPEN1100.4460.2610.1081.178
ENV1100.0030.0020.0000.012
EDU1109.9390.6568.07711.738
INST1100.5700.1290.3251.626
MSTI1100.1750.130.0050.577
EDL11011.1550.43410.18212.104
Table 5. Key Characteristics of the Study Area (2013–2022 Averages).
ProvinceMarine Economic ZonePer Capita GDP (Logarithmic)MNQPHQD-ME
LiaoningNorthern10.8830.2690.172
HebeiNorthern10.6620.3030.120
TianjinNorthern11.4140.3250.168
ShandongNorthern11.0740.3790.252
JiangsuEastern11.5500.4570.273
ShanghaiEastern11.8090.3960.346
ZhejiangEastern11.3840.4080.233
FujianSouthern11.3680.3180.167
GuangdongSouthern11.2510.4680.385
GuangxiSouthern10.5330.2370.169
HainanSouthern10.7790.2260.210
Table 6. Baseline Regression Results.
VariableHQD-ME
(1)(2)(3)(4)(5)(6)
MNQP0.138 ***0.156 ***0.193 ***0.163 ***0.167 ***0.136 **
(2.861)(3.272)(3.650)(2.961)(2.980)(2.347)
FS 0.340 **0.358 **0.380 ***0.363 **0.327 **
(2.393)(2.525)(2.696)(2.477)(2.228)
OPEN 0.0680.0700.0710.085 *
(1.569)(1.616)(1.635)(1.950)
ENV −2.485 *−2.346−1.885
(−1.702)(−1.564)(−1.248)
EDU −0.002−0.006
(−0.444)(−1.052)
INST 0.052 *
(1.689)
_cons0.201 ***0.130 ***0.089 **0.096 **0.119 *0.129 *
(21.554)(4.137)(2.190)(2.370)(1.773)(1.921)
N110110110110110110
R20.0770.1290.1500.1750.1770.202
F8.1867.1545.6625.0544.0493.916
*** p < 0.01, ** p < 0.05, * p < 0.10.
Table 7. Regression Results of Marine New-Quality Productive Forces on the Dimensions of High-Quality Marine Economic Development.
Variable(1)(2)(3)(4)(5)
InnovCoorGreenOpenShare
MNQP0.402 ***0.319 ***−0.279 **0.1080.592 ***
(3.815)(4.635)(−2.620)(1.032)(7.540)
FS0.050−0.1400.614 **0.789 ***−0.259
(0.187)(−0.806)(2.289)(2.980)(−1.307)
OPEN0.0250.260 ***0.0970.233 ***−0.140 **
(0.316)(5.017)(1.208)(2.948)(−2.368)
ENV−5.237 *−6.461 ***−2.2490.400−11.184 ***
(−1.915)(−3.615)(−0.813)(0.147)(−5.479)
EDU−0.013−0.008−0.016−0.003−0.017 **
(−1.344)(−1.342)(−1.651)(−0.293)(−2.334)
INST0.237 ***0.305 ***0.093−0.105 *0.134 ***
(4.223)(8.296)(1.629)(−1.871)(3.189)
_cons0.1330.0930.430 ***0.1050.485 ***
(1.094)(1.177)(3.510)(0.869)(5.362)
N110110110110110
R20.4800.6840.2070.2290.756
F14.28533.5064.0584.61047.979
*** p < 0.01, ** p < 0.05, * p < 0.10.
Table 8. Robustness Test for Replacement of Core Explanatory Variable.
VariableHQD-ME
(1)(2)(3)(4)(5)(6)
MNQP0.136 **0.157 ***0.195 ***0.155 **0.159 **0.115
(2.534)(2.951)(3.289)(2.376)(2.403)(1.647)
FS 0.338 **0.355 **0.370 **0.354 **0.314 **
(2.351)(2.474)(2.587)(2.379)(2.110)
OPEN 0.0630.0600.0620.075 *
(1.423)(1.377)(1.400)(1.696)
ENV −2.292−2.138−1.824
(−1.476)(−1.336)(−1.145)
EDU −0.002−0.006
(−0.427)(−1.045)
INST 0.056 *
(1.743)
_cons0.185 ***0.110 ***0.0670.083 *0.1060.123 *
(10.924)(3.084)(1.427)(1.742)(1.484)(1.730)
N110110110110110110
R20.0610.1120.1300.1500.1520.178
F6.4196.1214.7994.1883.3583.366
*** p < 0.01, ** p < 0.05, * p < 0.10.
Table 9. Winsorization Treatment.
VariableHQD-ME
(1)(2)(3)(4)(5)(6)
MNQP0.140 ***0.158 ***0.195 ***0.166 ***0.170 ***0.148 **
(2.865)(3.251)(3.635)(2.936)(2.966)(2.506)
FS 0.327 **0.342 **0.367 **0.347 **0.331 **
(2.281)(2.400)(2.580)(2.341)(2.237)
OPEN 0.0690.0710.0720.094 **
(1.577)(1.618)(1.643)(2.009)
ENV −2.471−2.302−1.517
(−1.602)(−1.454)(−0.898)
EDU −0.003−0.003
(−0.509)(−0.517)
INST 0.084
(1.307)
_cons0.201 ***0.132 ***0.091 **0.097 **0.125 *0.073
(21.236)(4.185)(2.237)(2.399)(1.839)(0.937)
N110110110110110110
R20.0770.1240.1460.1690.1710.186
F8.2066.8805.4854.8233.8803.542
*** p < 0.01, ** p <0.05, * p < 0.10.
Table 10. Endogeneity Test.
VariableHQD-ME
(1)(2)(3)(4)(5)(6)
L.MNQP0.278 ***0.303 ***0.368 ***0.356 ***0.358 ***0.343 ***
(5.088)(5.584)(6.811)(6.235)(6.214)(5.615)
FS 0.325 **0.323 **0.332 **0.319 **0.308 **
(2.380)(2.519)(2.571)(2.386)(2.283)
OPEN 0.168 ***0.170 ***0.170 ***0.175 ***
(3.571)(3.600)(3.576)(3.634)
ENV −0.971−0.872−0.722
(−0.732)(−0.643)(−0.526)
EDU −0.002−0.003
(−0.409)(−0.666)
INST 0.021
(0.741)
_cons0.180 ***0.110 ***0.0260.0280.0470.051
(18.027)(3.559)(0.689)(0.735)(0.773)(0.834)
N999999999999
R20.2290.2770.3710.3750.3760.381
F25.88416.46916.73012.61310.0248.399
*** p < 0.01, ** p < 0.05.
Table 11. Test Results of the Mediating Effect of Marine Technological Innovation.
VariableHQD-MEMSTIHQD-ME
(1)(2)(3)
MNQP0.136 **0.324 *0.110 *
(2.347)(1.976)(1.891)
FS0.327 **−0.1800.341 **
(2.228)(−0.435)(2.379)
OPEN0.085 *0.0730.079 *
(1.950)(0.593)(1.849)
ENV−1.885−10.780 **−0.997
(−1.248)(−2.533)(−0.653)
EDU−0.0060.004−0.006
(−1.052)(0.249)(−1.134)
INST0.052 *0.1010.044
(1.689)(1.151)(1.444)
MSTI 0.082 **
(2.289)
_cons0.129 *0.0520.124 *
(1.921)(0.274)(1.898)
N110110110
R20.2020.2180.245
F3.9164.3114.258
** p < 0.05, * p < 0.10.
Table 12. Threshold Regression Results.
Threshold
Variable
Threshold TestThreshold ValueF-Valuep-ValueCritical Value95% Confidence Interval
1%5%10%
Level of economic developmentSingle Threshold Value11.083820.110.040026.910319.345416.5954[11.0273, 11.1017]
the First Threshold Value11.117120.110.040026.910319.345416.5954[11.0747, 11.1221]
the Second Threshold Value11.122172.570.000027.939022.625618.5186[11.0621, 11.1334]
Table 13. Threshold Effect Test Results.
ProjectCoefficientStandard
Deviation
T-Valuep-Value95% Confidence Interval
MNQP (EDL ≤ 11.0838)−0.78120.0579−1.350.207[−0.2072, 0.0509]
MNQP (11.0838 < EDL ≤ 11.1221)0.19960.05323.750.004[0.0810, 0.3181]
MNQP (EDL > 11.1221)0.11910.06131.940.081[−0.0175, 0.6902]
FS0.34920.15302.280.046[0.0082, 0.2556]
OPEN0.12120.03503.470.006[0.0433, 0.1992]
ENV−1.64631.6058−1.030.329[−5.2243, 1.9318]
EDU−0.00320.0049−0.650.529[−0.0142, 0.0078]
INST0.04800.02192.200.053[−0.0007, 0.09670]
constant term0.10120.05531.830.097[−0.0220, 0.2244]
Disclaimer/Publisher’s Note: The statements, opinions and data contained in all publications are solely those of the individual author(s) and contributor(s) and not of MDPI and/or the editor(s). MDPI and/or the editor(s) disclaim responsibility for any injury to people or property resulting from any ideas, methods, instructions or products referred to in the content.