


Abstract
This study conducts a cradle-to-gate Environmental Life Cycle Assessment (E-LCA) of tea production in Sri Lanka, comparing smallholder and estate-owned plantations processed by Orthodox and Crush–Tear–Curl (CTC) methods. Unlike most tea LCA studies that treat cultivation as a single undifferentiated phase, this work explicitly incorporates the perennial nature of tea by using a modular life cycle framework that separates the agronomic stages alongside factory processing up to the packed-tea gate. This approach allows a more precise allocation of long-term environmental burdens over the entire productive lifespan of the tea plant, addressing a methodological gap in the literature. Four production scenarios were evaluated: Smallholder-Orthodox, Smallholder-CTC, Estate-Orthodox, and Estate-CTC, with the functional unit set to 1 tonne of processed tea. Primary data were gathered through structured surveys of 30 plantations (25 smallholders, 5 estates) and 5 tea factories, supplemented by secondary data from Ecoinvent v3.11 and national statistics. The CML-IA Baseline method in SimaPro v9.5 was applied to characterize impacts across eight impact categories: global warming potential (GWP), abiotic element depletion, fossil fuel depletion, acidification, human toxicity, terrestrial ecotoxicity, freshwater ecotoxicity, and eutrophication. Results indicate that Smallholder-Orthodox systems have the highest GWP (3304 kg CO2 eq per tonne), whereas Estate-CTC systems show a lower GWP (2894.87 kg CO2 eq). Acidification potential ranges from 47.21 kg SO2 eq for Smallholder-Orthodox to 41.25 kg SO2 eq for Estate-CTC. Overall, the findings suggest that the scale of plantation management has a greater impact on environmental performance than processing technology, highlighting the need to focus sustainable practices on the cultivation stage, exactly where the perennial crop modeling approach used here provides the greatest analytical benefit.
1. Introduction
Tea, derived from the dried leaves of Camellia sinensis, is the second most consumed drink in the world, after water [1,2]. The three most popular types of tea are green (unfermented), black (fully fermented), and oolong (semi-fermented). Tea possesses significant antioxidative, anti-inflammatory, antimicrobial, anticarcinogenic, and cholesterol-lowering properties. Studies have suggested that bioactive polyphenols in tea provide health benefits including the prevention of many diseases such as cancer, diabetes, arthritis, cardiovascular disease, stroke, genital warts and obesity [3].
The drink is culturally and historically significant, tracing its origins to China as early as 2737 BC [1]. From there, tea culture spread across Asia and eventually to Europe during the 16th century, becoming integrated into the traditions of countries such as Japan, the United Kingdom, and several Middle Eastern nations [1]. Tea continues to demonstrate its importance both in consumption and economic value globally. In 2023, worldwide tea consumption was approximately 7.3 billion kilograms and is projected to rise to 8.3 billion kilograms by 2029 [2]. The global tea market was valued at around 292 billion USD in 2025 and is expected to expand to 377 billion dollars by 2030 [4]. World tea exports increased annually by 0.5 percent over the last decade to reach 1.84 million tonnes in 2022 [5]. China produces 47% of the world’s tea, followed by India, Kenya, and Sri Lanka [6].
In Sri Lanka, tea is the country’s primary export agricultural crop and a major source of foreign exchange; roughly 95% of production is exported to more than 140 countries [7]. Sri Lanka produced about 256 million kg of made tea in 2023, with Orthodox processing accounting for ca. 90% of output and Crush–Tear–Curl (CTC) about 9%. Tea export earnings reached Rs. 428 billion. Low-country teas (up to 600 m), known for a blackish appearance and strong cup color and taste, contributed about 61% of national output in 2023; medium- and high-grown teas contributed roughly 16% and 23%, respectively [8].
Despite its economic importance, tea production is embedded within global agrifood systems, which are a major source of greenhouse gas (GHG) emissions and environmental pressure. Agriculture is both a key contributor to climate change and one of the sectors most vulnerable to its impacts. Crop and livestock production, together with land-use change, account for about 20–25% of total anthropogenic GHG emissions in CO2 equivalents [9]. Growing populations and food demand have traditionally been met by expanding cultivated land and intensifying yields, but these strategies depend on increased use of inputs and resources, leading to significant ecological consequences [10]. In 2020, global agrifood system emissions reached 16 billion tonnes of CO2 eq, reflecting a 9% increase since 2000 [11]. Around one third of all anthropogenic GHG emissions originate from agrifood systems, spanning activities within the farm gate, land-use changes such as deforestation and peatland drainage, and pre and postproduction processes including food manufacturing, retail, consumption, and disposal [11,12,13].
From cultivation to final use, tea passes through many stages, each linked to environmental impacts shaped by inputs, processing, packaging, transport, and consumption [14]. The tea industry is energy and emission intensive, relying heavily on agrochemical inputs for cultivation and traditional fuels like firewood and coal for processing [15]. Tea cultivation and processing significantly contribute to negative environmental impacts such as habitat conversion, energy and agrochemical use, and wastewater generation. More recent studies have shown that the expansion of tea plantations has been linked to biodiversity loss through forest conversion [16,17,18,19,20].
Improving the environmental performance of tea products requires quantitative assessments across the entire life cycle [15]. Since sustainability in the tea industry involves all stakeholders in the value chain, from farmers and processors to businesses and consumers, such a comprehensive evaluation can only be achieved through Life Cycle Assessment [14]. Life Cycle Assessment (LCA) is widely recognized as an effective tool for quantitatively evaluating production and operational activities at different stages of agricultural systems, offering a comprehensive view of their environmental impacts and supporting sustainability goals [21].
Several studies worldwide have applied LCAs to evaluate the environmental impacts of tea production and consumption. Xu et al. [15] examined five organic tea products in China and found consumption dominated overall impacts due to boiling water [22]. Similarly, Sun et al. [23] showed that the use of electricity in processing and fertilizer application in cultivation were the main contributors to the overall environmental impacts of green tea. A study on black tea in China highlighted that shifting from chemical fertilizers to a mix of 70% organic and 30% chemical inputs significantly reduced global warming potential, primary energy demand, and water use [24]. Research on smallholder green tea production in Shaanxi Province revealed that high emissions were linked to coal use in processing and water boiling during consumption, while fertilizers were the main source of cultivation emissions [25]. Beyond China, a comprehensive assessment in Türkiye showed that the consumption stage accounted for 91% of the footprint, with brewing practices identified as the dominant contributor, whereas cultivation and transport had minor roles [14]. Similarly, analysis of Kenyan black tea production reported that consumption contributed about 85% of total impacts, while cultivation and processing together made up around 10% and transport about 4%, with consumer behavior (such as boiling excess water or adding milk) strongly influencing outcomes [26]. Studies on Darjeeling tea also confirmed that consumer practices, particularly in water boiling, accounted for more than half of emissions, while cradle-to-gate emissions varied widely depending on cultivation and transport methods [27]. In Iran, tea leaf production was found to contribute the largest share of impacts (57%), followed by diesel use in factories and multi-layer packaging, whereas improved practices such as optimized agrochemical use, three-layer packaging, and use of cooktops over electric kettles showed potential for reducing burdens [28].
Several studies have examined the environmental, social, and economic sustainability of tea production in Sri Lanka using life cycle-based approaches. Munasinghe et al. [29] combined LCA with value chain analysis to evaluate sustainability across the entire tea life cycle from plantations to waste disposal considering carbon emissions, energy use, labor, gender, and cost, and highlighting issues such as energy inefficiency, greenhouse gas emissions, and occupational health risks [29]. Kassel et al. [30] focused on factory-level processes, applying LCA with Intergovernmental Panel on Climate Change (IPCC) 2001 GWP and Eco-indicator 99 methods to assess environmental hotspots from leaf collection to packaged tea, and conducted a social LCA. Similarly, Vidanagama and Lokupitiya [31] analyzed energy use and associated GHG emissions in the tea and rubber sectors, identifying the significant contribution of energy consumption to environmental burdens.
However, these studies, like much of the global tea LCA literature, share a critical methodological limitation: the inadequate treatment of tea as a perennial crop. Most LCA research on perennial crops focuses predominantly on annual inputs and outputs while omitting establishment phase burdens and failing to account for temporal variability across multidecade productive cycles [32]. In tea production specifically, this approach neglects nursery production, land preparation, and the 2–3 year non-productive juvenile period, thereby underestimating true environmental impacts per kilogram of made tea [23,33].
Addressing these limitations, the present study fills multiple critical gaps in tea LCA research. First, it treats tea as a perennial crop by allocating establishment-phase and production-phase burdens across a complete 21-year black tea cycle, including nursery production, land preparation, long-term fertilizer and pesticide applications throughout the productive lifespan. Second, unlike previous Sri Lankan studies that focused narrowly on energy consumption and GHG emissions, this assessment is comprehensive, covering eight impact categories: global warming potential (GWP), acidification, eutrophication, terrestrial ecotoxicity, human toxicity, freshwater ecotoxicity, abiotic element depletion, and fossil fuel depletion. Third, no previous study has directly compared smallholder and estate production systems in Sri Lanka within a comprehensive LCA framework that integrates both cultivation and processing stages. By addressing these gaps, this study aims to produce region-specific evidence to inform targeted mitigation strategies and policy interventions for the tea sector.
2. Materials and Methods
2.1. Study Area
The study was conducted in the Pasgoda district secretariat, Matara district, Southern province, Sri Lanka. Covering an area of 148 km2, Pasgoda is a major low-country tea-producing region. The area compromises 17,872.96 acres of tea lands across 16,020 holdings, the majority of which are smallholder-operated. Data were collected from 30 tea plantations (5 estate-owned and 25 smallholder) and 5 tea factories (4 Orthodox and 1 CTC factory; the only factory operated using CTC method at that time in Pasgoda DS). Both plantation and factory sites were selected using convenience sampling based on their willingness to participate in the survey.
2.2. Goal and Scope Definition
The goal of this study was to assess the cradle-to-gate environmental impacts of low-country tea production in Sri Lanka and to identify key environmental hotspots across the supply chain.
The study compared four scenarios:
Scenario 1: Smallholder plantations with Orthodox processing
Scenario 2: Smallholder plantations with CTC processing
Scenario 3: Estate-owned plantations with Orthodox processing
Scenario 4: Estate-owned plantations with CTC processing
A modular modeling framework [32] was adopted to accommodate the perennial nature of tea cultivation, capturing management practices and yield variations across different plantation phases. The study was conducted in accordance with ISO 14040:2006 and ISO 14044:2006 guidelines [34,35].
2.3. System Boundary
The study adopted a cradle-to-gate system boundary extending from seedling production in the nursery to the point at which processed tea leaves the factory. Post factory activities such as distribution, marketing, and consumption were excluded. In line with ISO 14040:2006 and ISO 14044:2006 [34,35], the production chain was divided into foreground and background processes. Foreground processes included operations directly under the control of growers or factories, such as fertilizer application, pruning, and electricity use in the machines. Background processes involved upstream activities such as urea manufacture and polybag extrusion were modeled using secondary data obtained from Ecoinvent v3.11 and regional literature. Primary data for foreground processes were gathered through farmer and factory surveys.
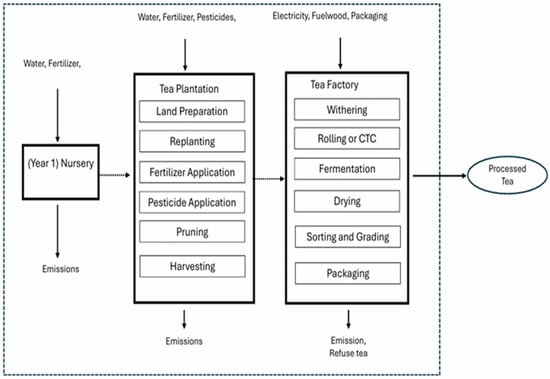
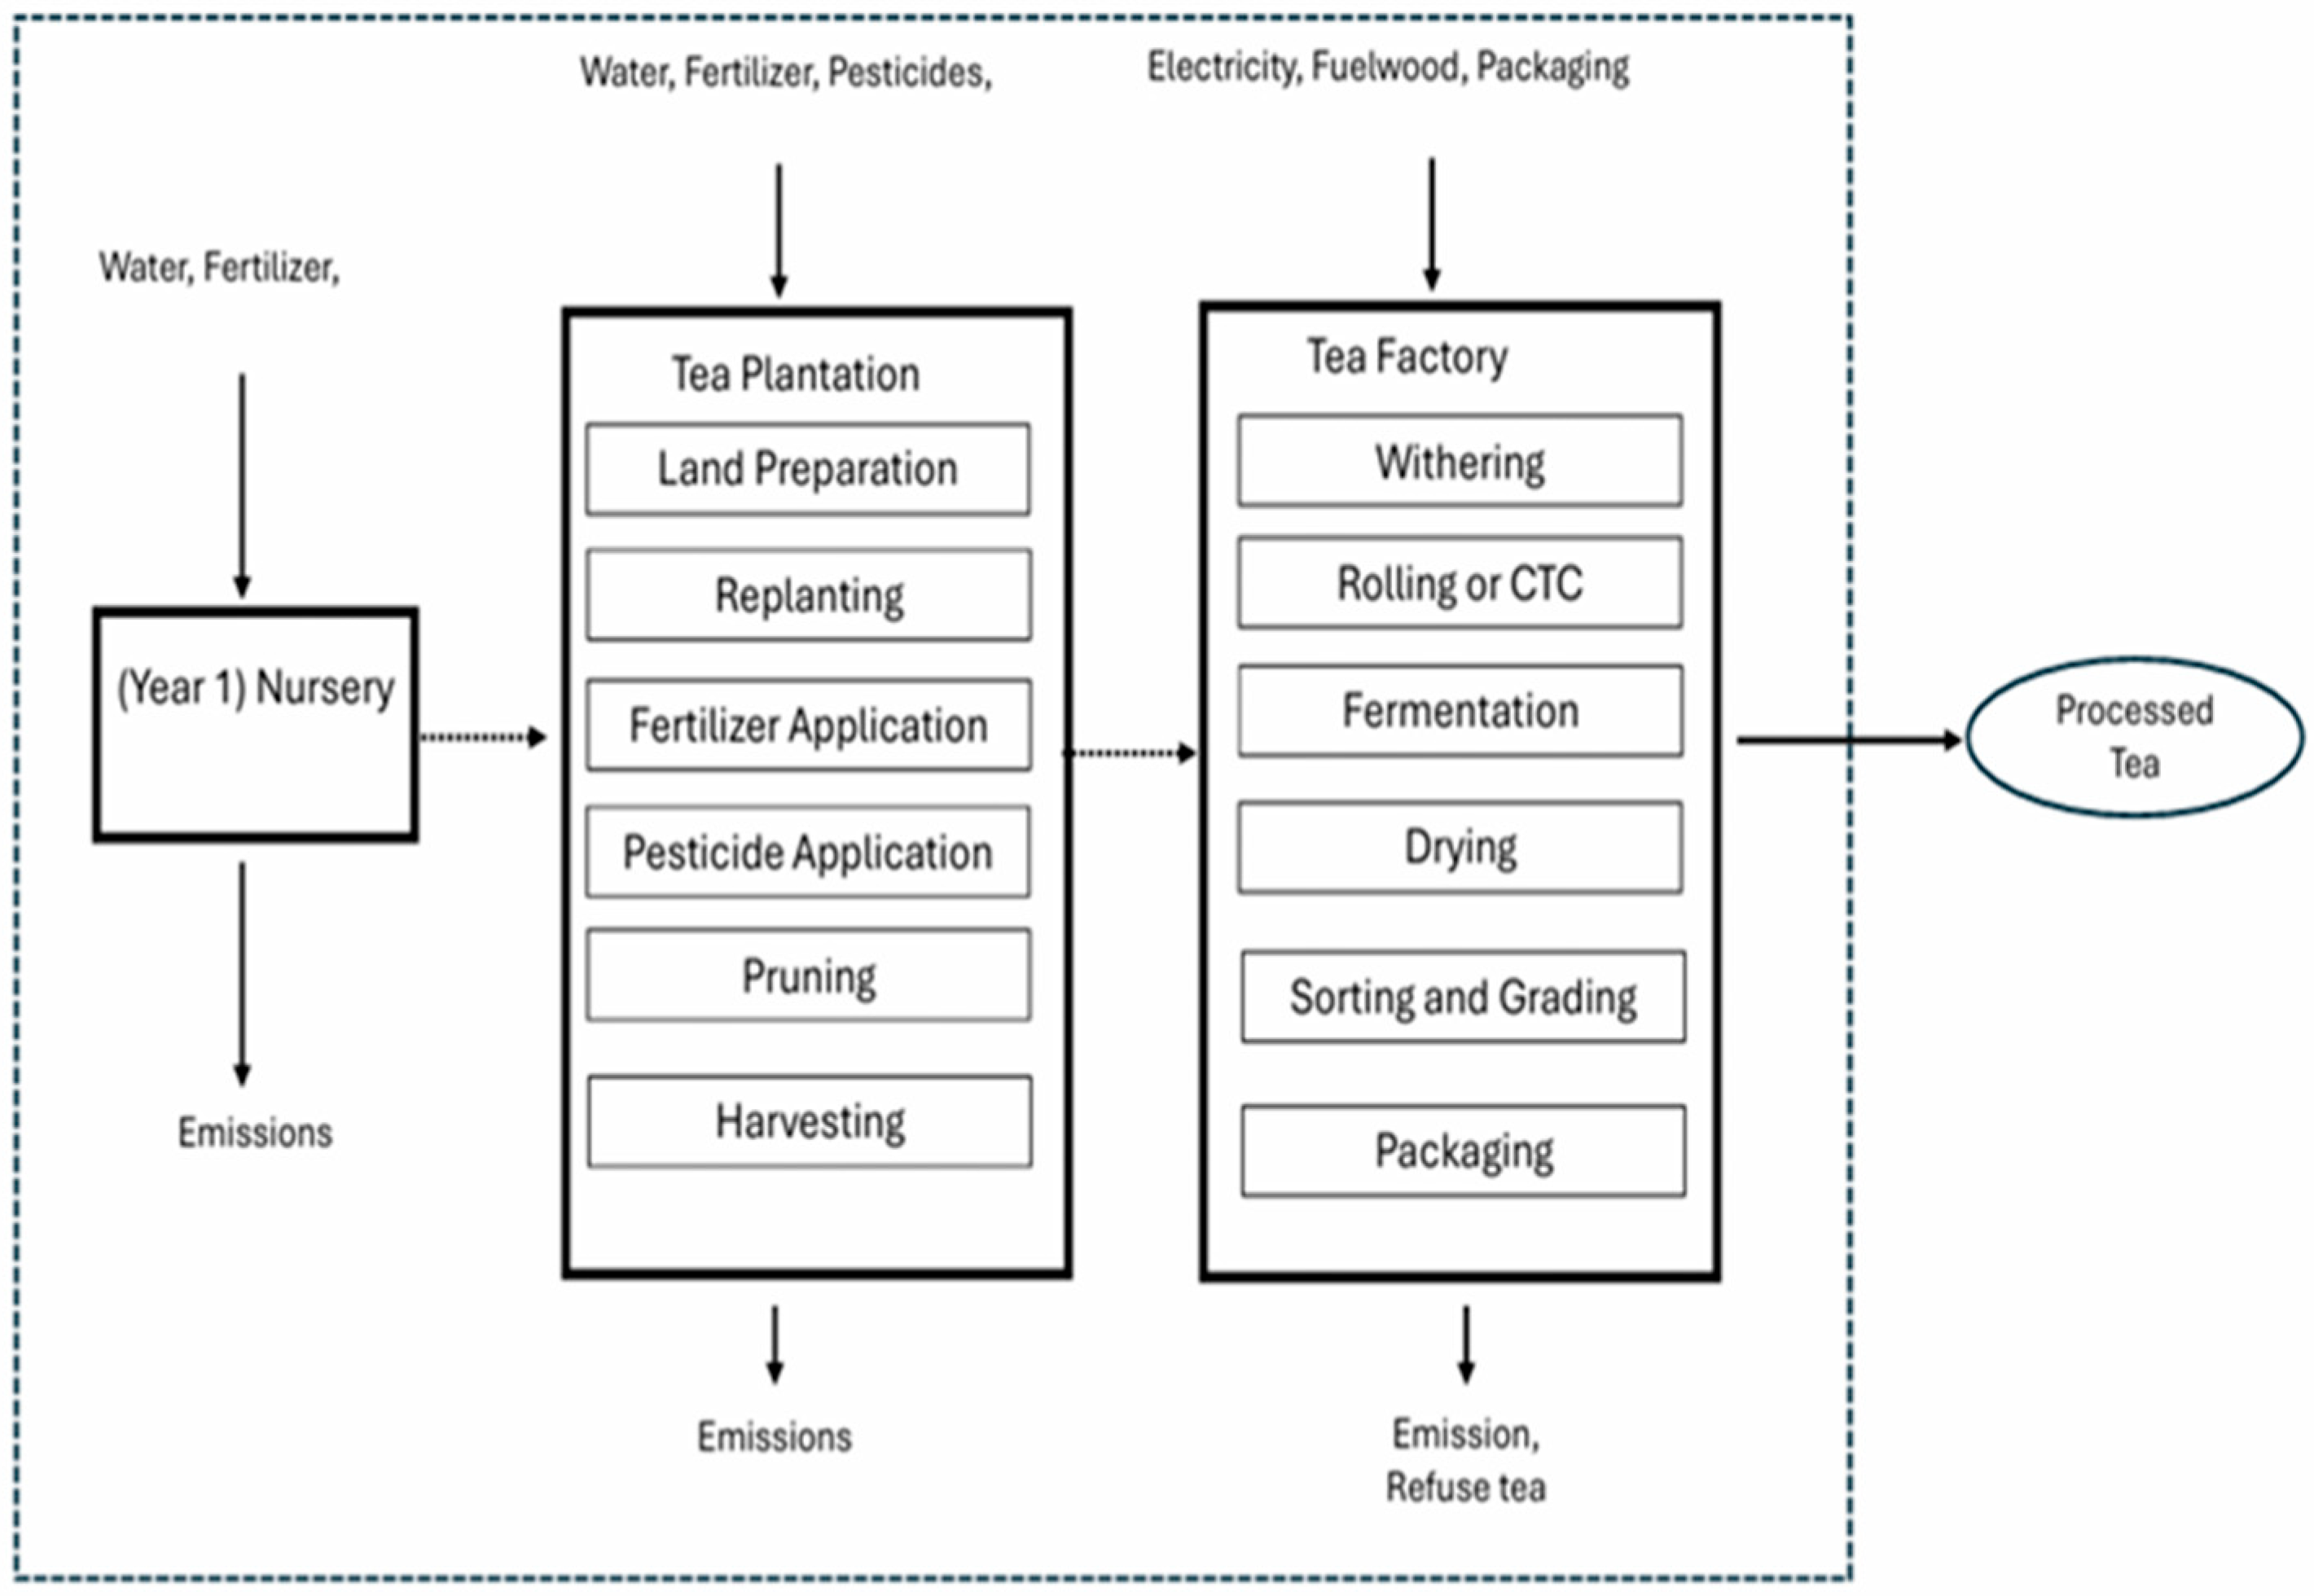
Inputs from the nursery stage were assumed to be representative and based on proxy data from a major supplier in the Pasgoda area. Although plantations varied in age, fertilizer application rates were considered consistent across different age classes, based on consultations with tea inspectors and insights from a pilot survey. The complete tea life cycle was modeled over 21 years, comprising one year for nursery propagation and 20 years of plantation life. Temporal yield variability was addressed by categorizing plantations into three age classes: early (3–8 years), mid (9–14 years), and late (15–20 years). Yields were averaged within each class to develop a phase-specific yield profile for the entire crop life cycle. Despite declining yields with age, input levels such as fertilizer remained unchanged across all phases (see Figure 1).
Figure 1.
Diagram of the system boundary (bold lines demarcate the foreground processes).
2.4. Functional Unit
The functional unit was defined as 1 tonne (1000 kg) of processed tea at the factory gate, equivalent to ca. 4650 kg of fresh tea leaves based on the regional factory records obtained from surveyed factories. This unit was selected because processed tea leaves the system boundary and provides a consistent basis for comparing the four production scenarios (Orthodox and CTC processing under smallholder and estate-owned plantation systems). All inventory inputs and outputs across the nursery, plantation, and processing phases were normalized to this functional unit.
2.5. Life Cycle Inventory
All life cycle modeling and impact assessment calculations were carried out using SimaPro v9.5, with background data drawn from the Ecoinvent v3.11 database. A mixed-methods approach was used to gather both primary and secondary data for each life cycle stage. Primary foreground data were obtained through structured farmer and factory surveys conducted in the Pasgoda Divisional Secretariat area, supplemented by on-site observations and factory production records. At the plantation level, data on inputs (fertilizer, agrochemicals) and outputs (green leaf yield) were collected. Plantations surveyed ranged from 3 to more than 20 years in age, enabling the development of a comprehensive yield profile. Site-specific practices, such as citronella establishment and cut-back, were also recorded. For the nursery stage, data were collected from a nursery known to be a major supplier in the region. Secondary data for background processes were drawn from the database mentioned above. Transportation of seedlings from nursery to plantations and of fresh tea leaves from plantations to factories were modeled as separate processes; distances and vehicle types were obtained from the farmer and factory surveys and matched to the corresponding Ecoinvent v3.11 transport datasets listed in Table S1 of the Supplementary Material.
2.5.1. Nursery Phase
The nursery phase lasting approximately one year consisted of seedling propagation using vegetative cuttings in polyethylene polybags. Input included polybags, fertilizers, agrochemicals, and water for irrigation. Due to the unavailability of direct data from multiple suppliers, a nursery that is a major supplier in the Pasgoda area was selected to provide proxy data. These inputs and outputs were then normalized per tonne of processed tea. This approach, though based on proxies, is consistent with ISO 14040:2006 and ISO 14044:2006 guidance [34,35], which permits the use of such inventories when direct data are unavailable.
2.5.2. Plantation Phase
The plantation phase spanning 20 years included three key phases: land rehabilitation and preparation, the unproductive phase, and the productive phase. Land preparation practices involved the use of manual methods such as ploughing, digging, and citronella establishment as a soil stabilizer. The unproductive phase, which lasts around three years, involved input applications (fertilizers, pesticides) without yield. Primary data on these activities were collected from surveyed smallholders and estate-owned plantations. Fertilizer use was calculated using the elemental composition of N, P, and K based on the quantity applied and nutrient percentage. Emissions associated with fertilizer use were calculated following IPCC methodologies for N2O and CO2 emissions from managed soils and urea application [36]. Plantation-level emissions were estimated per 1 tonne of processed tea (See Sections S1, S2 and S3 in Supplementary Material for more details). Yield variability across the three plantation age classes was used to derive a composite yield profile across the full life cycle of a tea field. Tea plucking in the study area is performed manually, and no mechanical harvesters or powered in-field equipment are used during harvesting. The commuting of workers to the fields and the use of manual hand tools were therefore excluded from the system boundary. The motorized transport of harvested fresh leaves from plantation to factory is included as a separate process, as described in Section 2.5.
2.5.3. Production Phase
The production phase covered processing steps at the factory level, which differed based on the technology used. Orthodox processing involved withering, rolling, fermentation, drying, sorting and grading, and packaging, whereas CTC processing involved withering, CTC, fermentation, drying, sorting and grading, and packaging. Data were collected from five factories, four Orthodox and one CTC, representing ca. 25% of the factories in the Pasgoda Divisional Secretariat (DS) area. Input data included electricity consumption and packaging material use. Environmental emissions from this stage were derived using secondary data from Ecoinvent v3.11. The study accounted for factory energy consumption and associated emissions per tonne of processed tea. Each processing stage’s inputs and outputs were documented and normalized to the functional unit, allowing for comparison across the four scenarios.
2.6. Life Cycle Impact Assessment
The life cycle impact assessment was conducted using the CML-IA baseline method [37], a widely used midpoint approach in agricultural LCA studies [38,39]. Eight impact categories were selected: global warming potential (GWP), abiotic depletion (ADP), abiotic depletion—fossil fuels (ADP-FF), acidification potential (AP), eutrophication potential (EP), human toxicity potential (HTP), freshwater aquatic ecotoxicity potential (FAETP), and terrestrial ecotoxicity potential (TETP). These categories were chosen based on their relevance to the major environmental issues associated with tea production, including fossil fuel combustion during processing, synthetic fertilizer use in cultivation, and agrochemical application in field operations. Together, these categories provide sufficient coverage across atmospheric, aquatic, and terrestrial environmental compartments.
2.7. Life Cycle Interpretation
The interpretation focused on comparing the environmental performance of the four production scenarios, identifying dominant contributing processes across the nursery, plantation, and processing phases, and assessing potential improvement opportunities. Sensitivity analysis was conducted to evaluate the influence of variations in key input parameters such as fertilizer use, electricity consumption, and fuelwood on selected environmental impact categories.
3. Results and Discussion
3.1. Nursery Phase
The inventory of the nursery phase is summarized in Table S2 of the Supplementary Material. The nursery phase, which encompasses seedling propagation in polyethylene polybags, represents a relatively minor share of the total cradle-to-gate impacts but nonetheless reveals notable differences between smallholder and estate systems. Across all eight impact categories, smallholder nurseries exhibit consistently higher per-unit burdens than estate-owned nurseries, with reductions of ca. 13% for fossil depletion and comparable margins for global warming and toxicity indicators (See Table 1). These results highlight that even at the nursery level, estates reduce per-unit environmental burdens.
Table 1.
Environmental impacts of the nursery stage (per tonne of made tea).
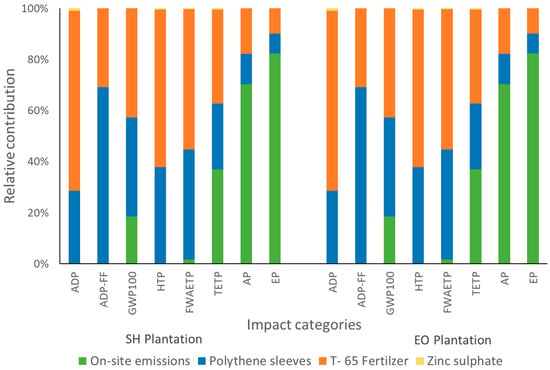
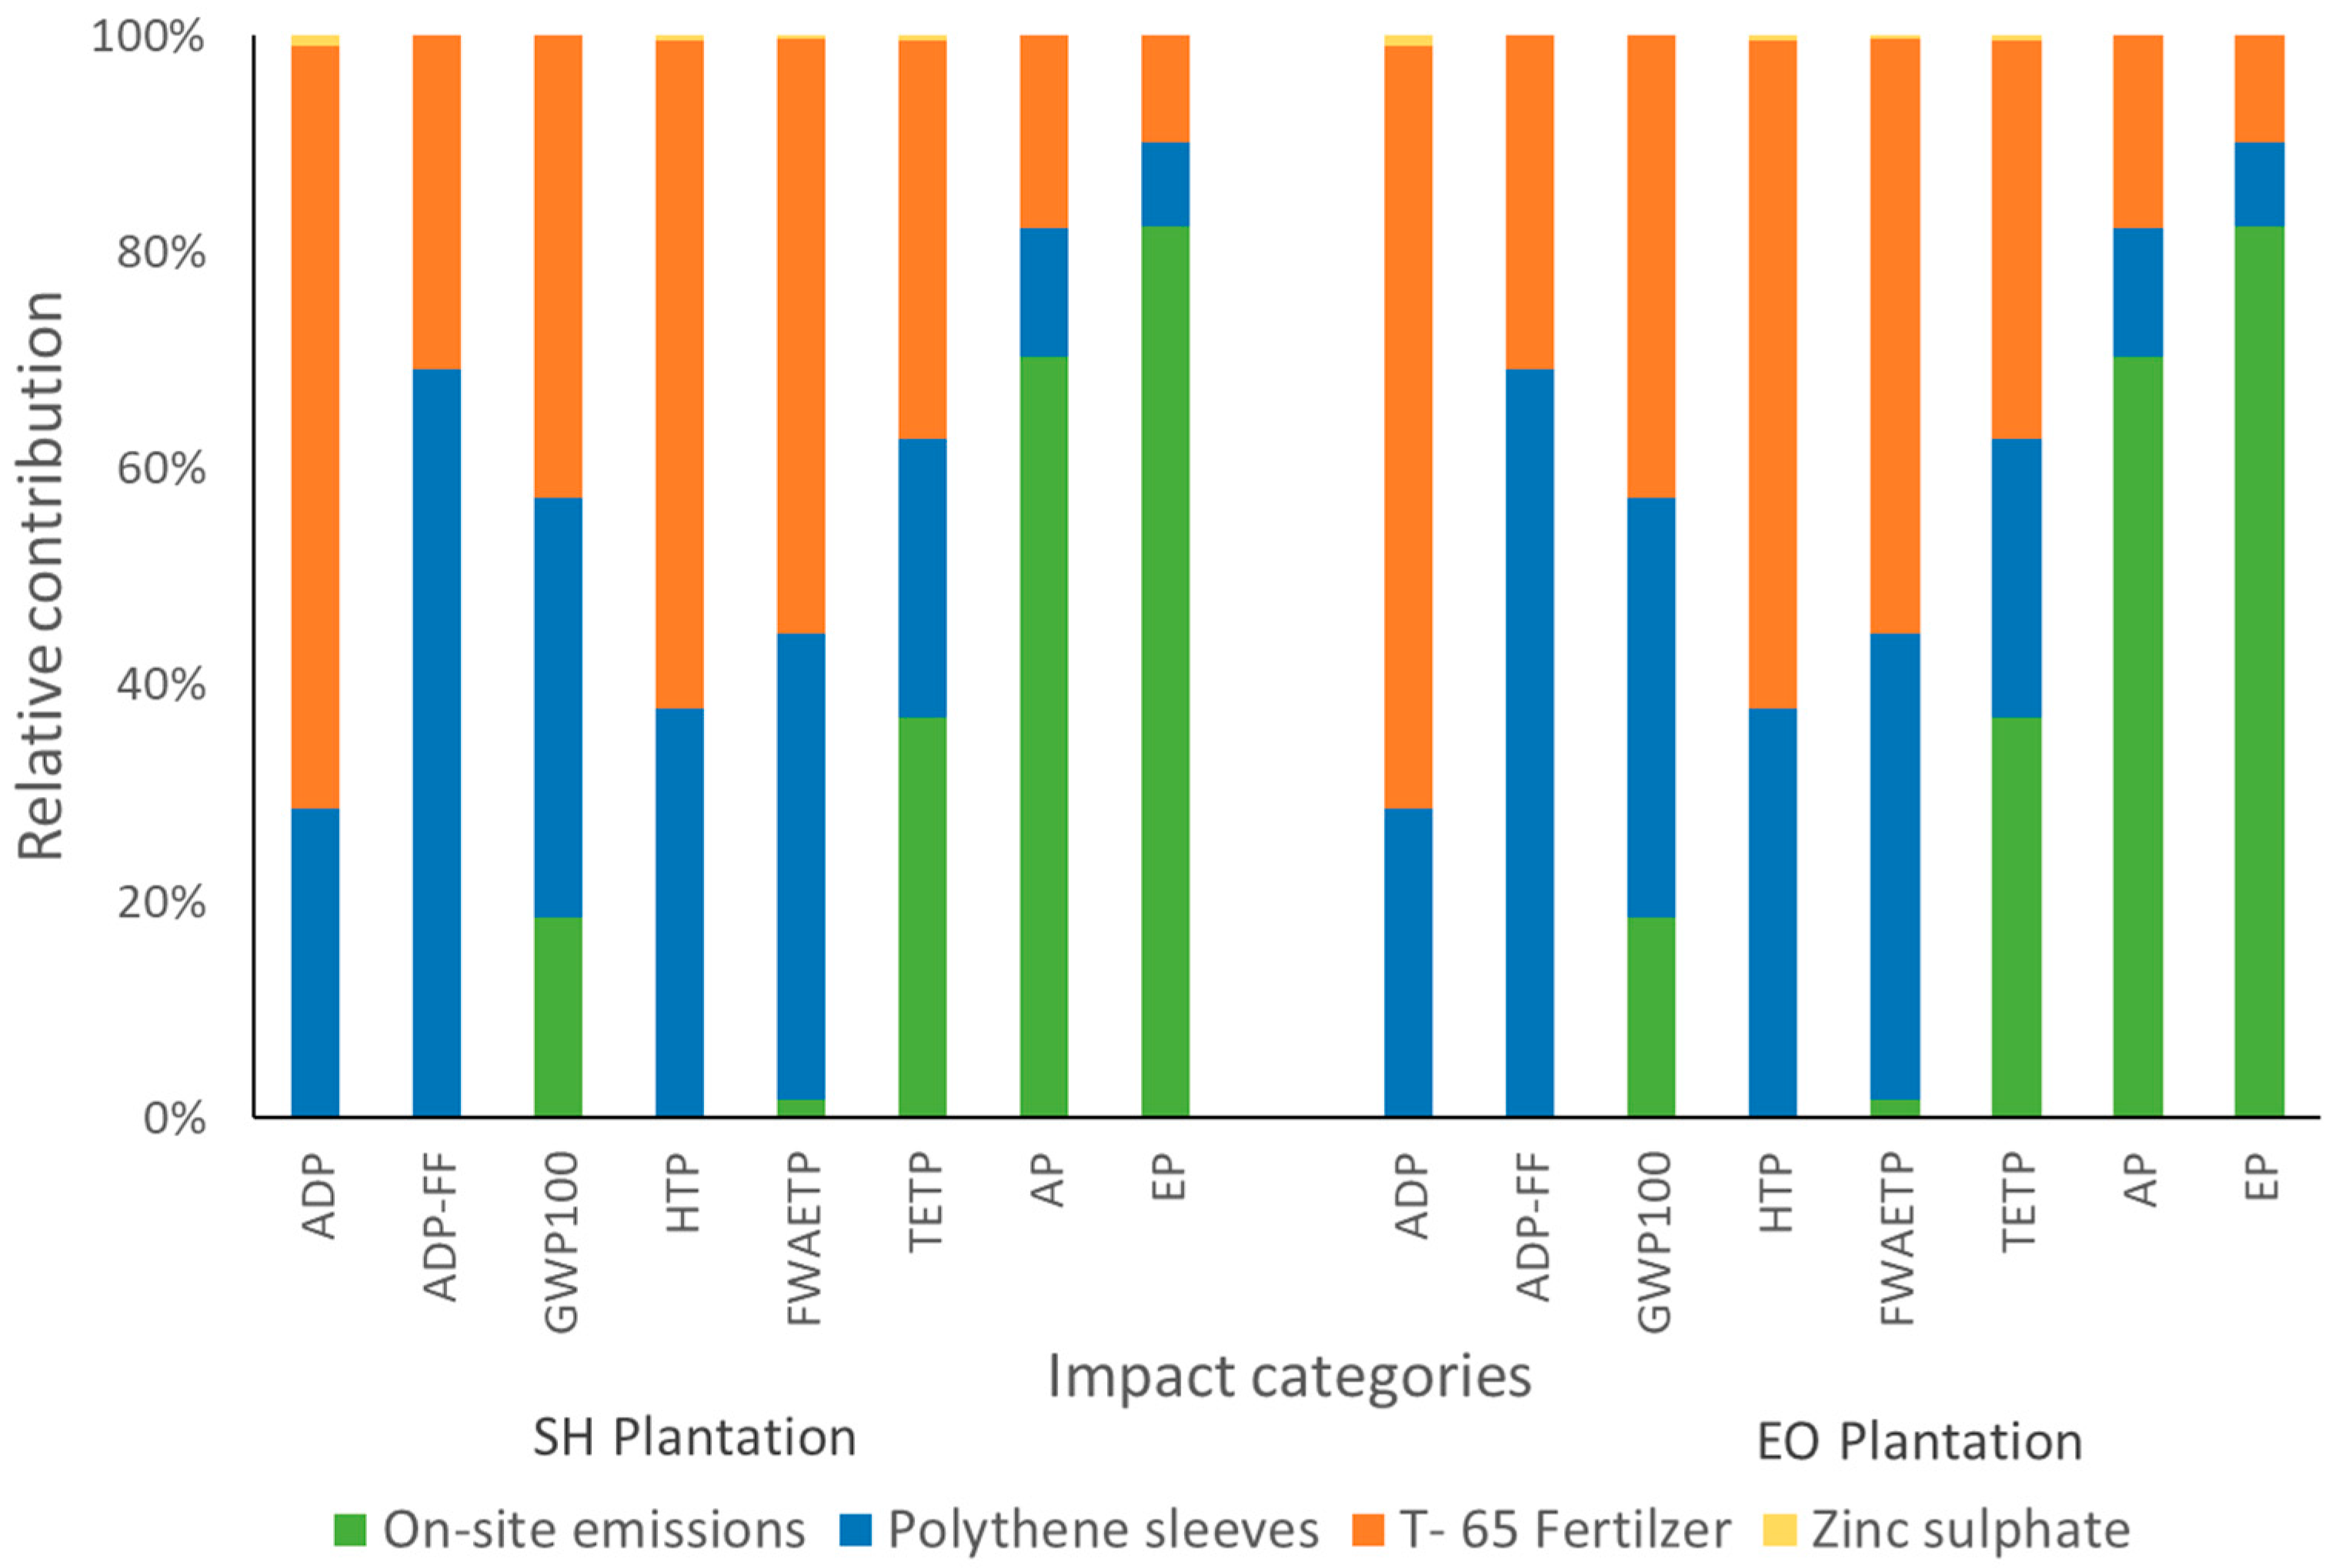
Figure 2 presents the relative contribution of individual inputs to each impact category for both smallholder and estate owned nursery systems. Although the absolute impact values differ between the two systems (Table 1), the relative contribution patterns remain nearly identical across all impact categories. This similarity occurs because both systems utilize the same types of inputs, namely polyethylene sleeves, T-65 fertilizer, zinc sulfate, and on-site emissions, while differing only in the quantities applied per functional unit. As a result, the proportional contribution of each input to the total impact does not substantially change, even though the overall magnitude of impacts is lower in the estate system.
Figure 2.
Relative contribution of nursery phase inputs of environmental impact categories in smallholder and estate owned tea plantations. Global warming potential (GWP), abiotic depletion (ADP), abiotic depletion—fossil fuels (ADP-FF), acidification potential (AP), eutrophication potential (EP), human toxicity potential (HTP), freshwater aquatic ecotoxicity potential (FAETP), and terrestrial eco-toxicity potential (TETP).
Across most impact categories (ADP, ADP-FF, HTP, FAETP, and TETP), T-65 fertilizer and polyethylene sleeves dominate the environmental burden, together accounting for the majority share of impacts. In contrast, on-site emissions contribute more significantly to impact categories such as acidification (AP) and eutrophication (EP), reflecting the effect of nutrient losses associated with fertilizer application and soil management in the nursery stage. Zinc sulfate shows only a negligible contribution across all categories.
3.2. Plantation Phase
Tables S3–S7 of the Supplementary Materials show the plantation-phase inventories. Within the plantation phase, which includes land preparation, the unproductive stage (years 1–3), and the productive stage (years 4–20), impacts rise sharply as the perennial crop enters its mature cycle. Smallholder plantations show consistently higher per-tonne burdens than estate-owned plantations across all eight impact categories, with the largest relative gaps in fossil fuel depletion, global warming, and eutrophication (see Table 2). The productive stage alone accounts for ca. 85–90% of these totals, with land preparation contributing less than 1% and the unproductive stage contributing ca. 6–7%, indicating that input efficiency should be prioritized during the productive years.
Table 2.
Environmental impacts of the plantation stage (per tonne of made tea).
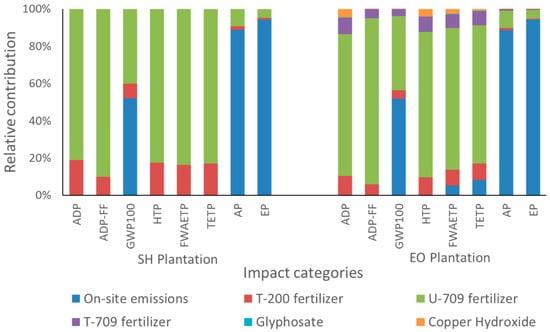
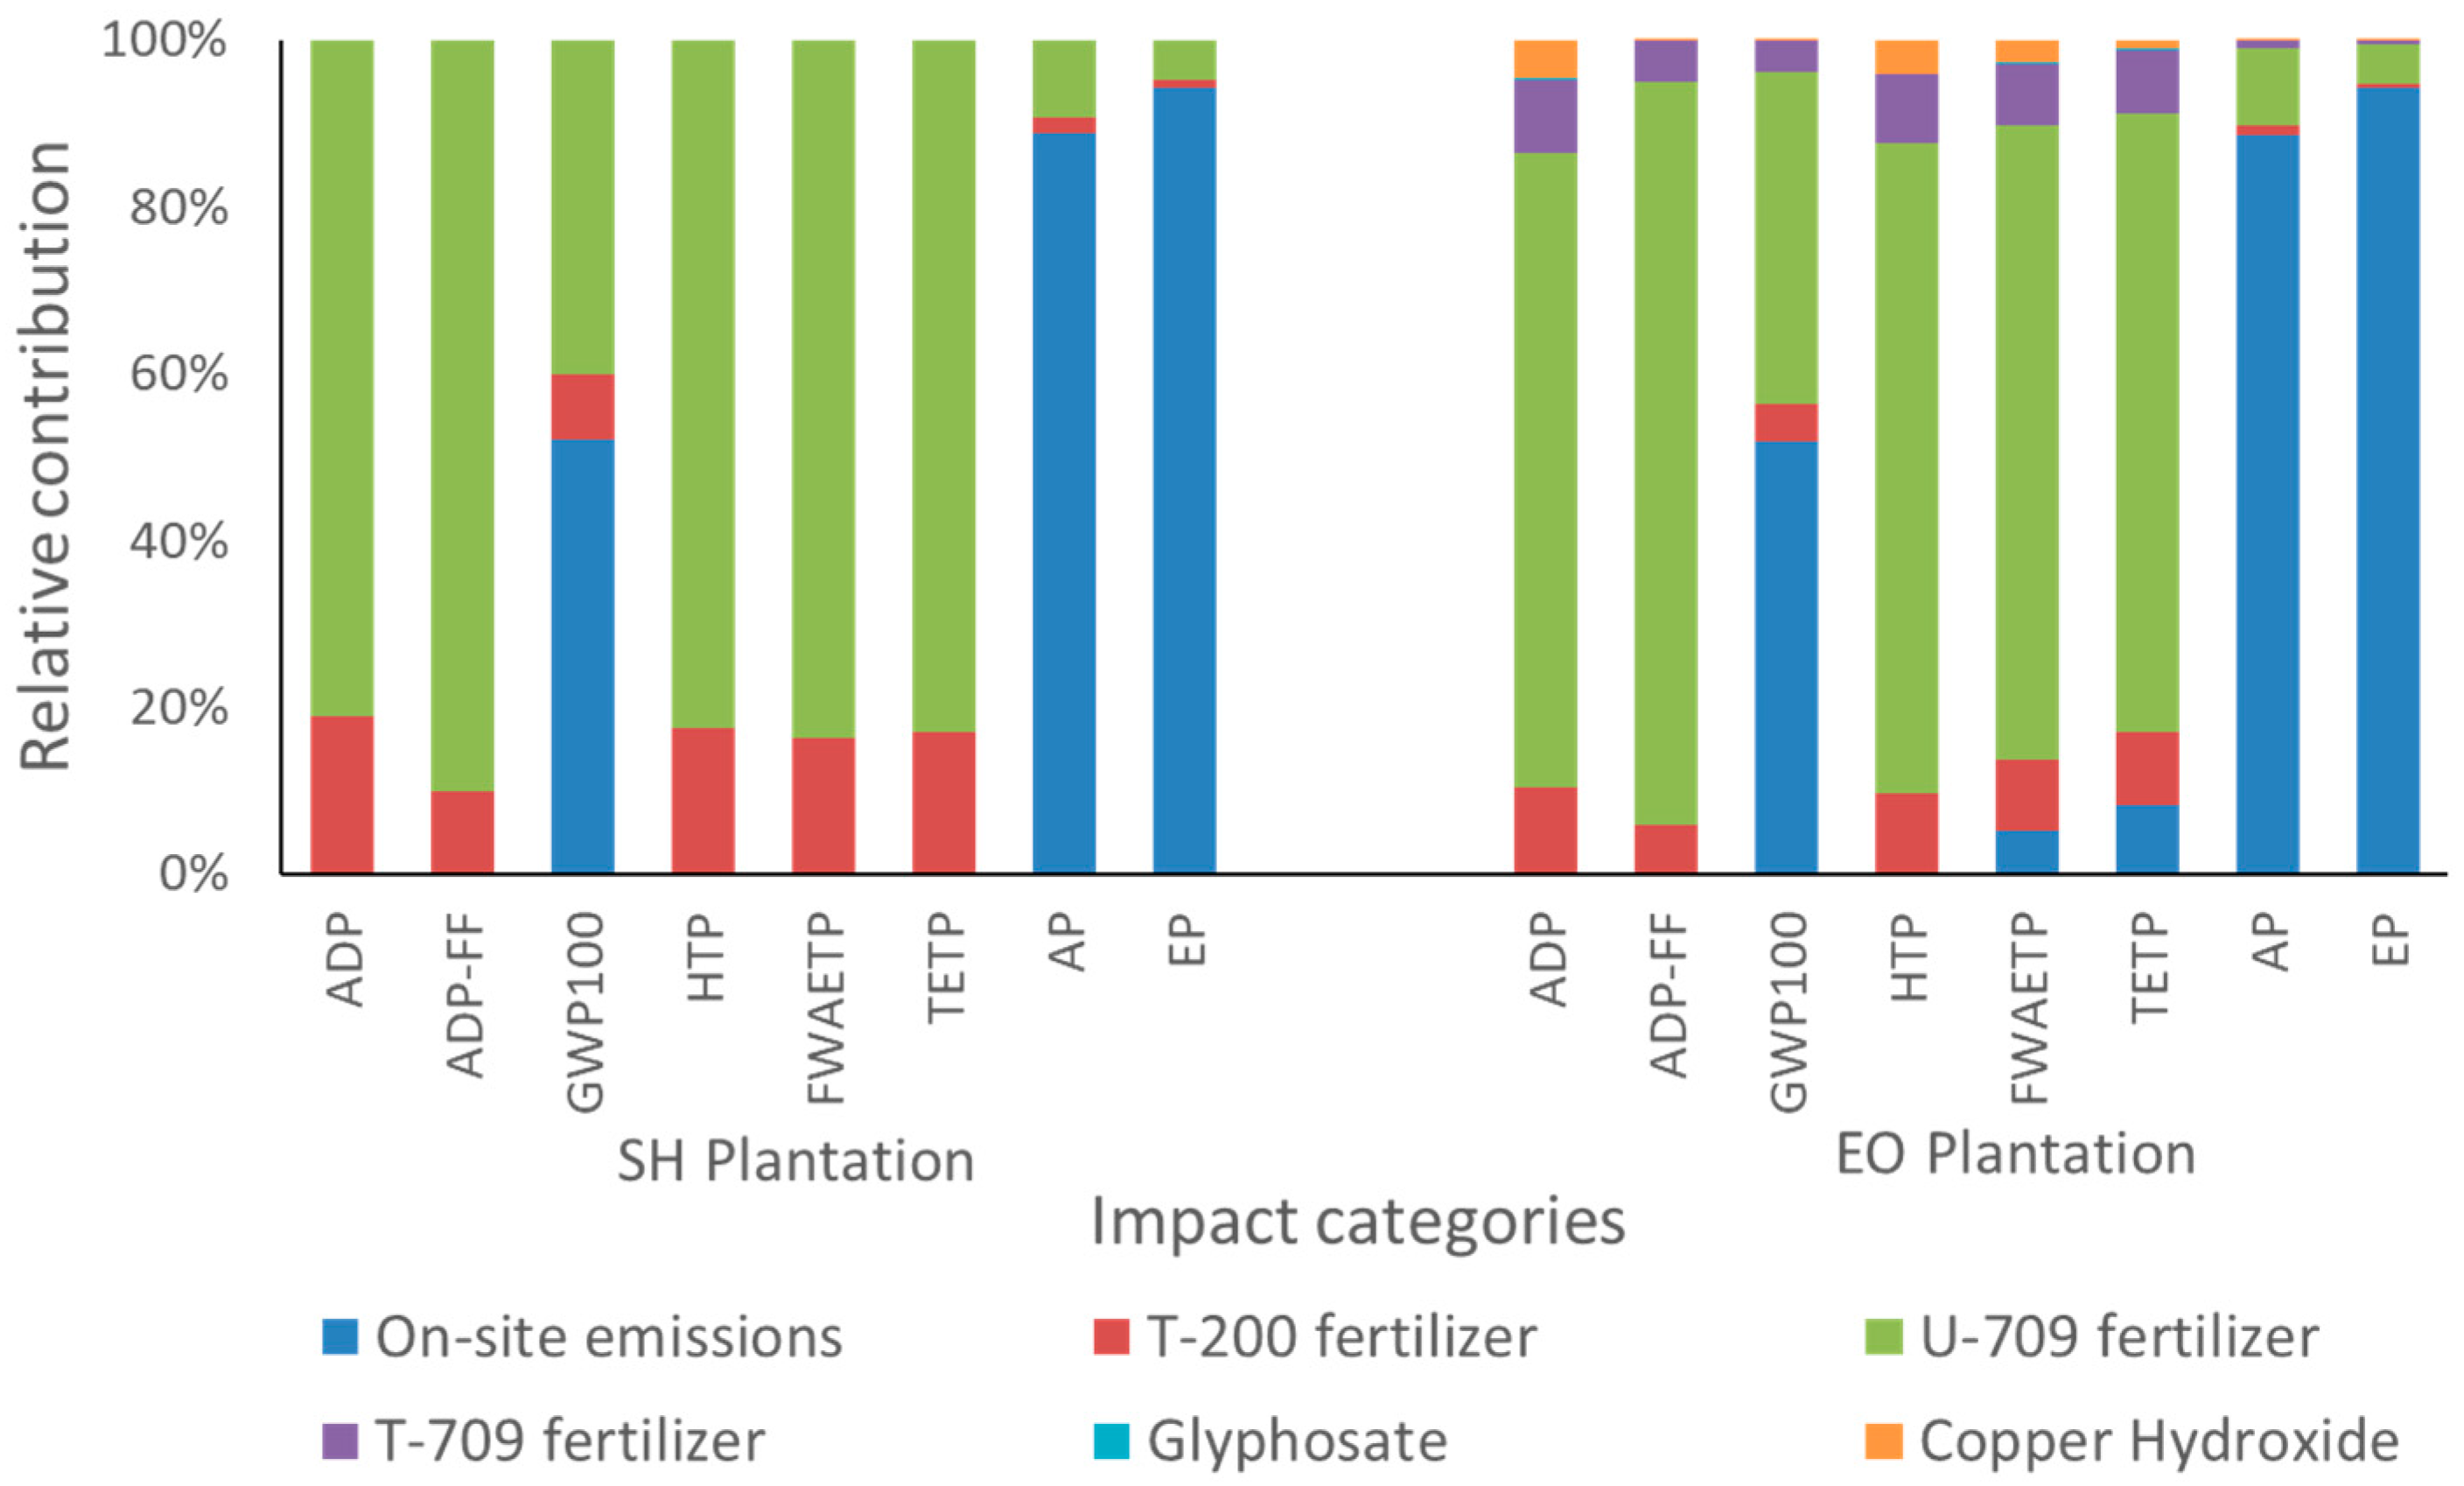
Figure 3 presents the relative contribution of individual inputs to each impact category for smallholder (SH) and estate-owned (EO) plantation systems. In both systems, U-709 fertilizer is the dominant contributor to ADP, ADP-FF, HTP, and ecotoxicity categories (FWAETP and TETP). T-200 fertilizer provides a secondary contribution, particularly in ADP and toxicity-related categories. For GWP, impacts are shared between on-site emissions and U-709 fertilizer in both systems, indicating the combined influence of field emissions and upstream fertilizer production. In contrast, AP and EP are dominated by on-site emissions in both plantation types, reflecting nitrogen-related soil emissions arising from fertilizer application.
Figure 3.
Relative contribution of plantation-phase inputs of environmental impact categories in smallholder (SH) and estate-owned (EO) tea plantations. Here, global warming potential (GWP), abiotic depletion (ADP), abiotic depletion—fossil fuels (ADP-FF), acidification potential (AP), eutrophication potential (EP), human toxicity potential (HTP), freshwater aquatic ecotoxicity potential (FAETP), and terrestrial eco-toxicity potential (TETP).
Compared to smallholders, the estate system shows a more distributed contribution pattern due to the additional influence of T-709 fertilizer and copper hydroxide, although their shares remain relatively small. Overall, while absolute impacts are lower in estates, the plantation phase in both systems is primarily driven by fertilizer use and associated field emissions during the productive stage.
3.3. Production Phase
3.3.1. CTC Processing
The CTC processing inventory is summarized in Table S8 of the Supplementary Materials. Withering, CTC, fermentation, drying, sorting and grading, and packaging contribute to the environmental profile of CTC factories (Table 3). Withering alone accounts for ca. 45% of the factory-level GWP, reflecting the high energy demand of leaf dehydration. Therefore, it is the principal hotspot for improving processing efficiency.
Table 3.
Environmental impacts of CTC processing (per tonne of made tea).
3.3.2. Orthodox Processing
The inventory of Orthodox processing is summarized in Table S9 of the Supplementary Materials. Orthodox factories exhibit consistently higher processing impacts than CTC factories across all eight categories, with the largest absolute differences in fossil fuel depletion and global warming potential (see Table 4). Withering is the primary hotspot in CTC processing, reinforcing leaf dehydration as the dominant driver of factory-level environmental burdens and energy-efficiency interventions.
Table 4.
Environmental impacts of Orthodox processing (per tonne of made tea).
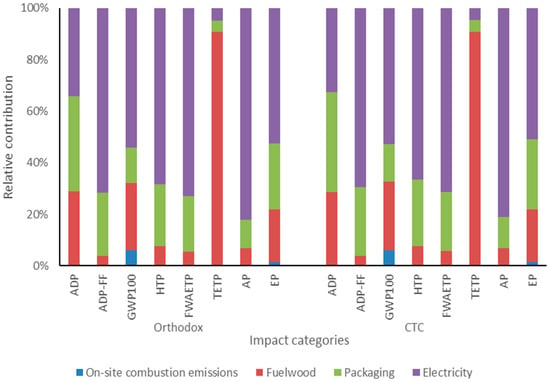
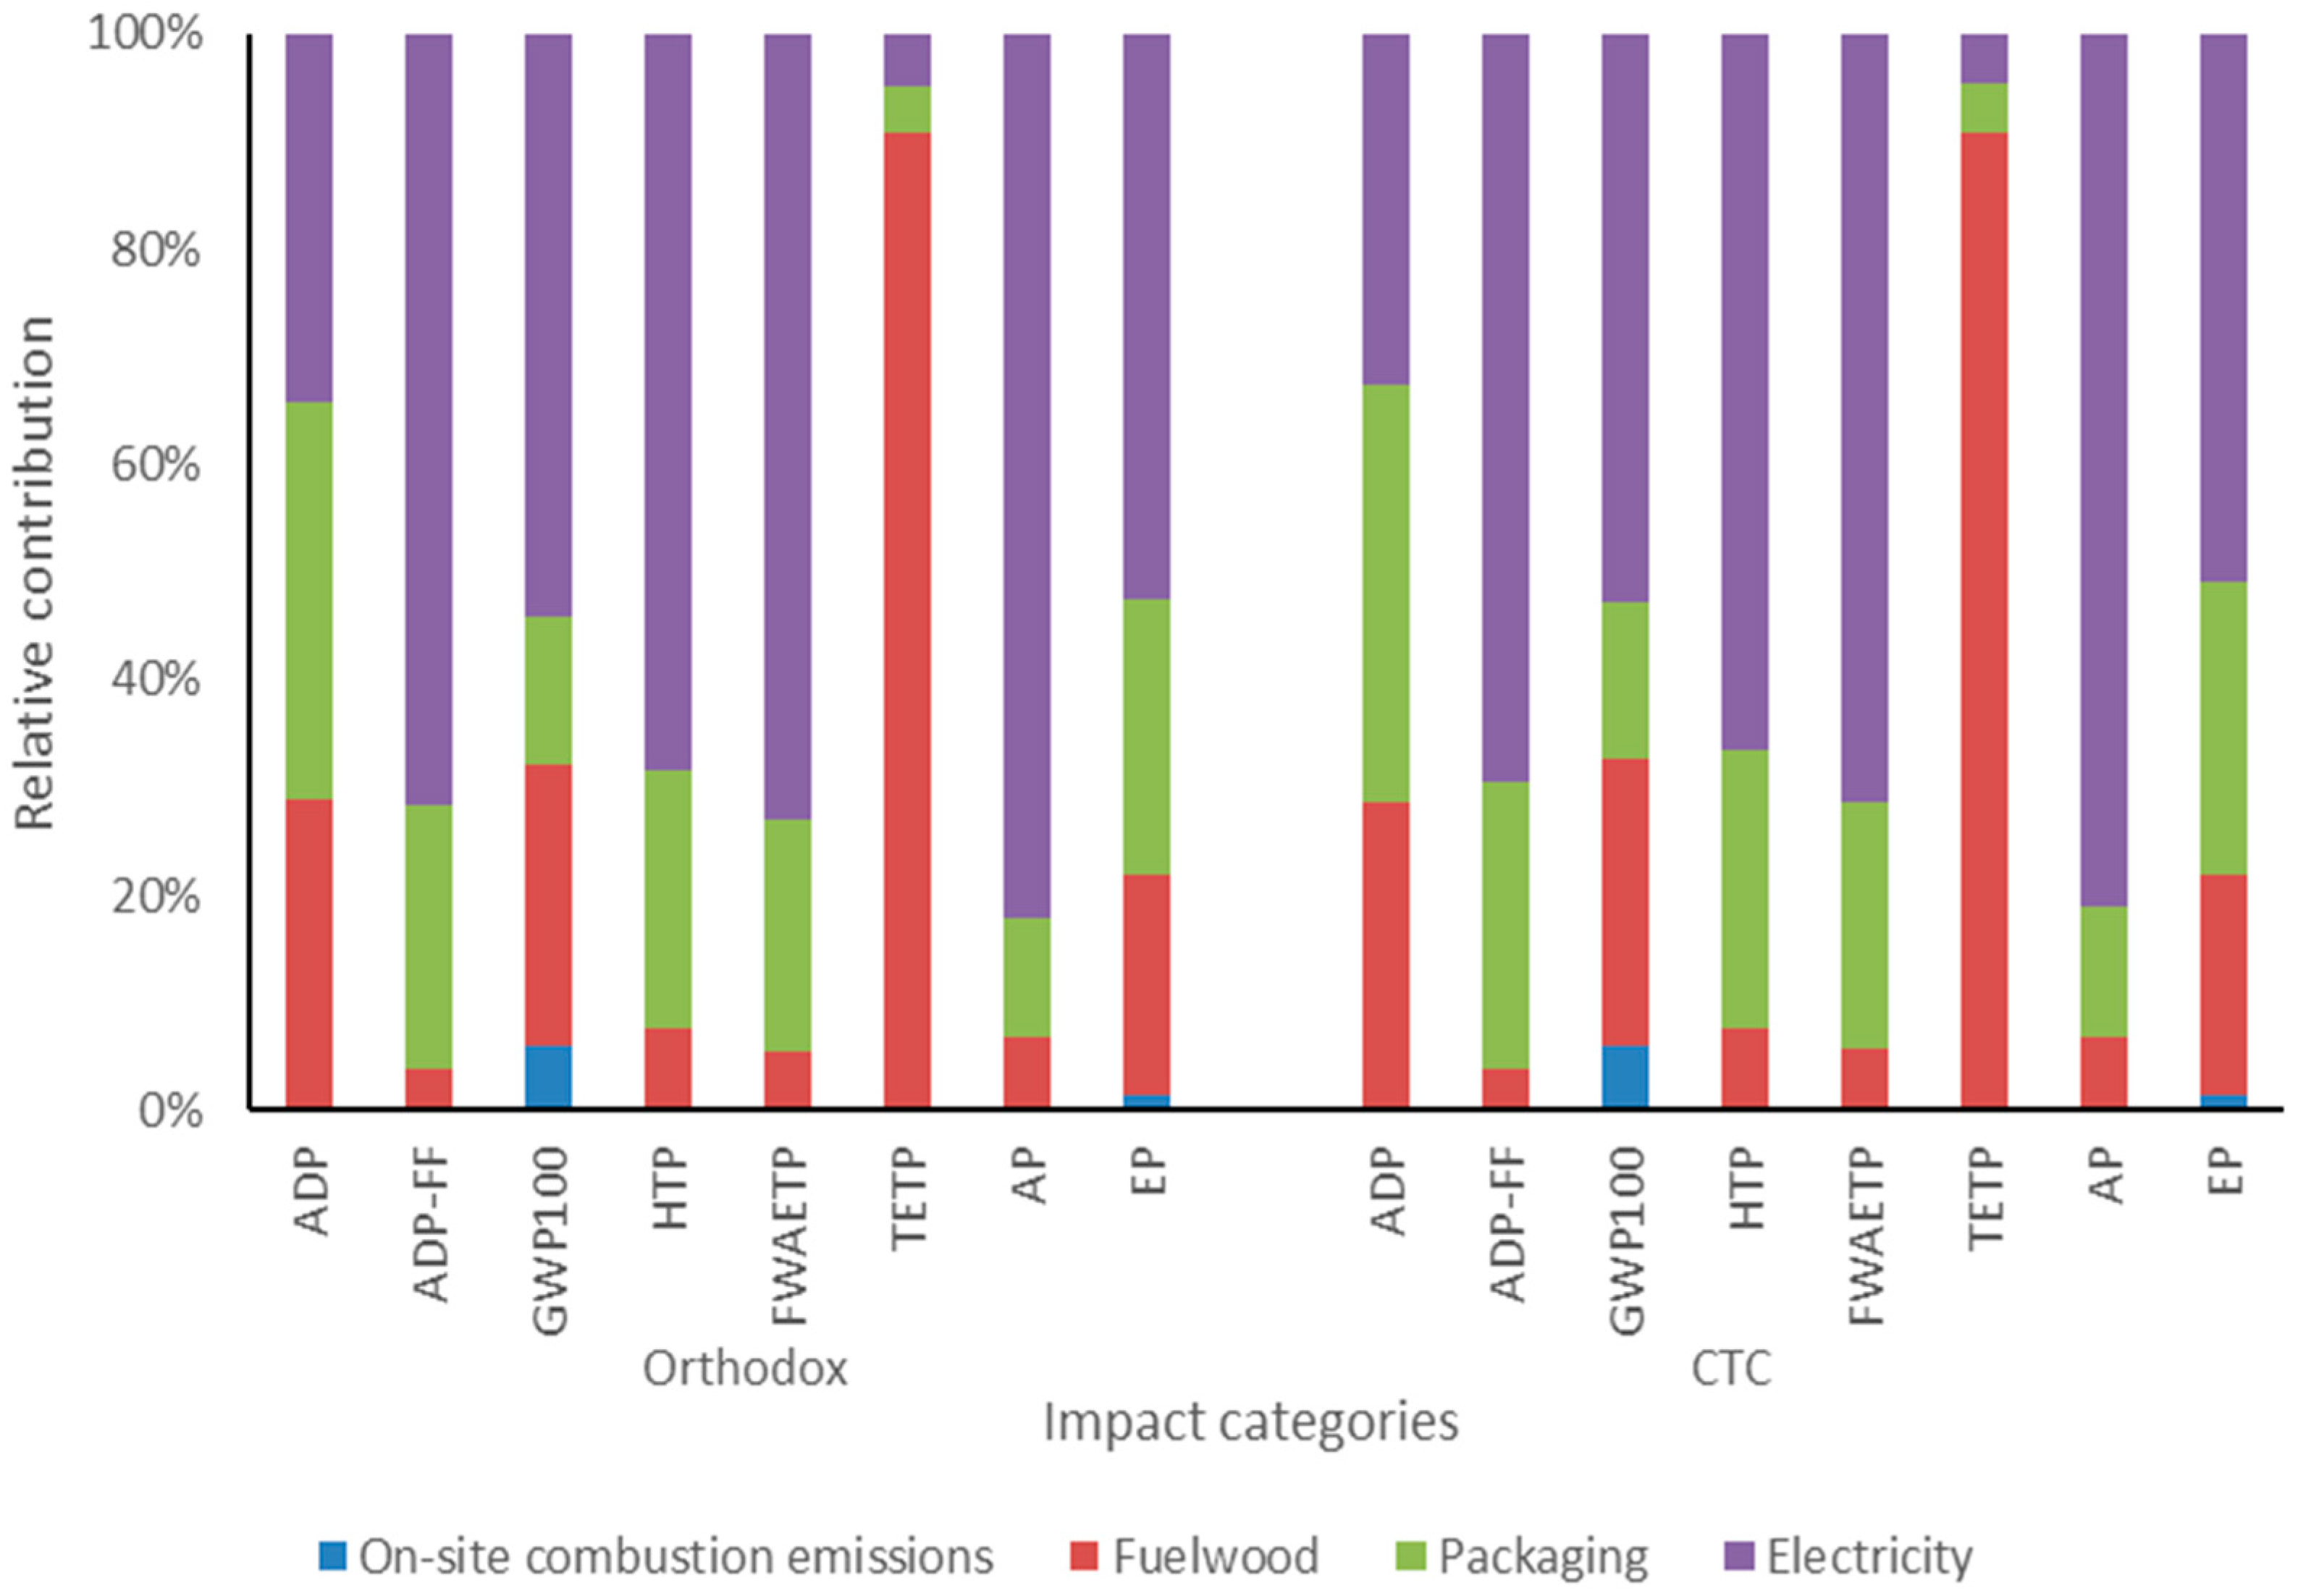
Figure 4 illustrates the relative contribution of key inputs to the environmental impacts of Orthodox and CTC tea processing methods. In both systems, electricity is the dominant contributor to ADP-FF, HTP, FWAETP, AP, and EP, highlighting the significance of grid electricity consumption during processing operations. For GWP100, impacts are shared mainly between electricity and fuelwood, with a smaller contribution from on-site combustion emissions, indicating the combined influence of thermal energy and electricity use. Packaging materials contribute notably to ADP and eutrophication, while their influence on other categories remains moderate.
Figure 4.
Relative contribution of plantation-phase inputs of environmental impact categories in Orthodox and CTC production methods. Here, global warming potential (GWP), abiotic depletion (ADP), abiotic depletion—fossil fuels (ADP-FF), acidification potential (AP), eutrophication potential (EP), human toxicity potential (HTP), freshwater aquatic ecotoxicity potential (FAETP), and terrestrial eco-toxicity potential (TETP).
Overall, the relative contribution patterns between Orthodox and CTC processing are very similar, with only minor percentage variations. This indicates that despite technological differences between the two processing methods, their environmental hotspot structure is governed primarily by energy use (electricity and fuelwood).
3.4. Complete Life Cycle Environmental Performance Comparison
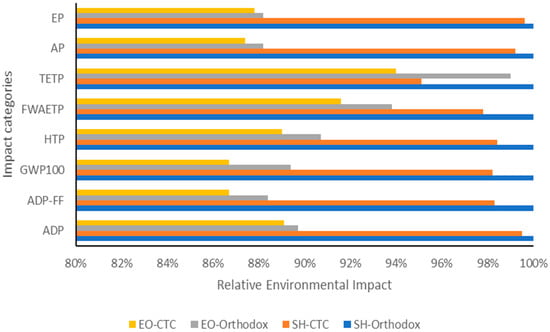
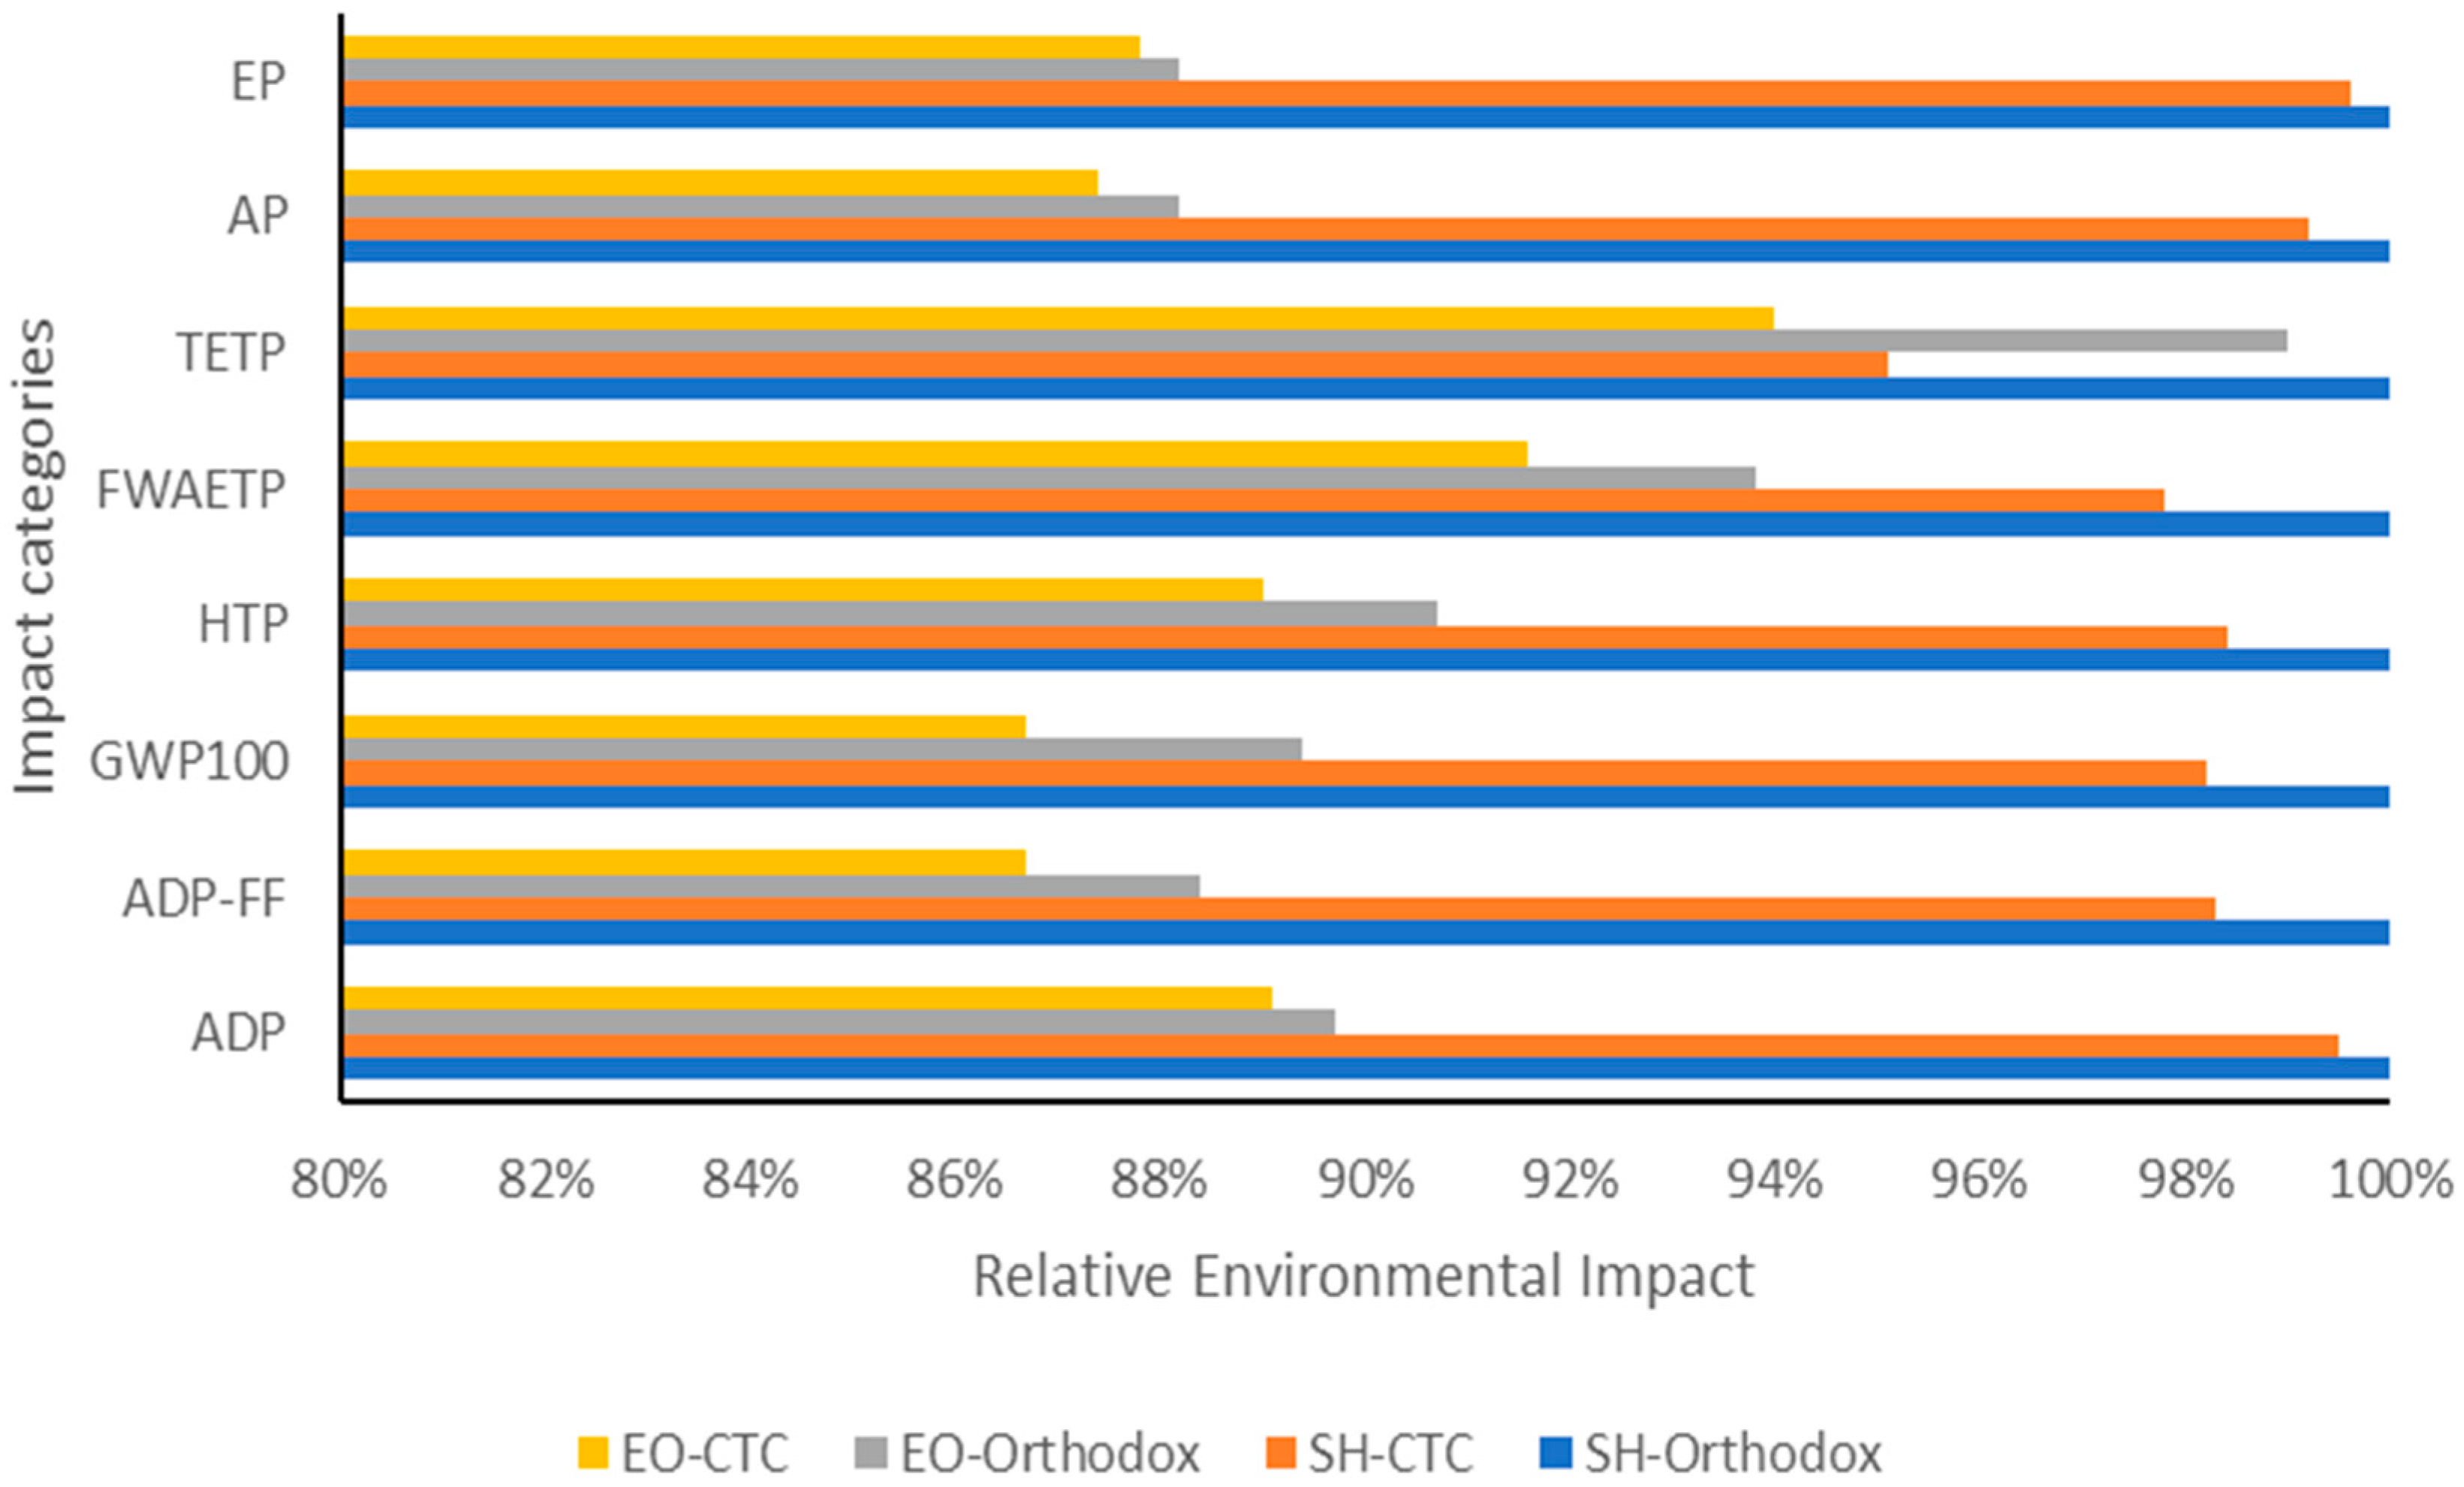
The results are integrated across all life cycle phases, yielding a consistent performance ranking of the four scenarios (see Figure 5). The SH-Orthodox > SH-CTC > EO-Orthodox > EO-CTC hierarchy holds without exception across all eight impact categories, indicating that the plantation management type exerts a stronger influence on the overall environmental performance than the processing technology. Relative to the worst-performing scenario (SH-Orthodox), the best-performing scenario (EO-CTC) reduces impacts by approximately 11–13% across the major categories, including global warming, fossil fuel depletion, human toxicity, acidification, and eutrophication (see Figure 5). Within each plantation type, switching from Orthodox to CTC processing yields only a modest additional improvement (ca. 2%), confirming that the dominant lever for reducing per-tonne impacts lies at the plantation stage rather than at the factory.
Figure 5.
Comparison of environmental impacts of four scenarios. SH and EO refer to smallholder and estate-owned, respectively. Here, global warming potential (GWP), abiotic depletion (ADP), abiotic depletion—fossil fuels (ADP-FF), acidification potential (AP), eutrophication potential (EP), human toxicity potential (HTP), freshwater aquatic ecotoxicity potential (FAETP), and terrestrial eco-toxicity potential (TETP).
3.5. Environmental Hotspot Identification and Optimization Opportunities
The analysis confirms that the plantation productive phase represents the dominant environmental hotspot across all scenarios, contributing ca. 85–90% of total plantation-related impacts. Within this phase, U-709 fertilizer application emerges as the primary driver of environmental burden. Improving the timing and frequency of fertilizer application, as well as minimizing spillage, has been shown to enhance nitrogen use efficiency in plantation systems. The use of slow-release fertilizers, particularly those with biodegradable coatings, has also been suggested as a sustainable approach to optimize nutrient management. According to the literature, adopting such strategies could allow for a reduction of ca. 20% in overall fertilizer application rates [40].
In this study, a 20% reduction in U-709 fertilizer application was applied during the productive phase of tea plantations. The results show that the greatest reductions were observed in acidification and eutrophication, which decreased by ca. 15.9–16.9, mainly due to suppressed NH3 emissions to the air and NO3− losses to the soil. Global warming potential (GWP100a) decreased by ca. 12.5–13.1%, while abiotic depletion and fossil fuel depletion were reduced by ca. 12.5–13.6%. Human toxicity and freshwater ecotoxicity declined by ca. 10.0–12.0%, and terrestrial ecotoxicity showed smaller reductions of ca. 2.7–3.3%.
The modeled 20% reduction in U-709 fertilizer application confirms that fertilizer management optimization can significantly reduce environmental impacts in tea plantation systems, with the largest reductions observed in acidification and eutrophication. Processing operations offer smaller but still relevant improvement potential: the withering stage is the single largest contributor to factory-level impacts, accounting for ca. 44–46% of the total processing impacts across the CTC and Orthodox methods. A comparison of the four scenarios indicates that the choice of plantation management system (smallholder versus estate) has a larger influence on overall per-tonne environmental impacts than the choice of processing method (CTC versus Orthodox).
3.6. Comparison with Previous Studies
The cradle-to-gate GWP values from this study are 3245.88 kg CO2 eq per tonne for Smallholder-CTC and 2894.87 kg CO2 eq per tonne for Estate-CTC. These figures are similar to those reported by Azapagic et al. [26] for Kenyan CTC tea: 2880 kg CO2 eq per tonne for small-scale operations and 2530 kg CO2 eq per tonne for large-scale operations. Both studies show that smallholder systems have a higher GWP than large-scale systems, confirming that plantation size influences the per-tonne environmental burden. The slightly higher values in our study are likely due to a more complete life cycle model that includes nursery production, land preparation, and the immature phase of the tea plant. Azapagic et al. [26] used a 5-year plantation-level average and did not explicitly treat the crop’s perennial nature.
Compared with Munasinghe et al. [29] who reported 2340 kg CO2 eq per tonne for low-country tea production in Sri Lanka at the cultivation and processing stages (with packaging reported separately at 16,700 kg CO2 eq per tonne), our cultivation-plus-processing values are higher. This difference is explained by our broader temporal scope, which captures the full perennial cycle rather than just the productive phase. The different treatment of packaging also reflects a different system boundary: Munasinghe et al. [29] assessed retail-ready tea bag packaging, while our cradle-to-gate study covers only the minimal bulk packaging used by auction-bound factories, making packaging a smaller share of the total impact.
Overall, the comparison with earlier studies confirms two consistent findings: smallholder systems have higher per-tonne environmental burdens than large-scale systems, and the life cycle burden is increased when the perennial nature of the tea crop is considered, compared with approaches that treat cultivation as a single undifferentiated stage. These results reinforce the value of the modular, system-specific framework used in this study.
3.7. Sensitivity Analysis
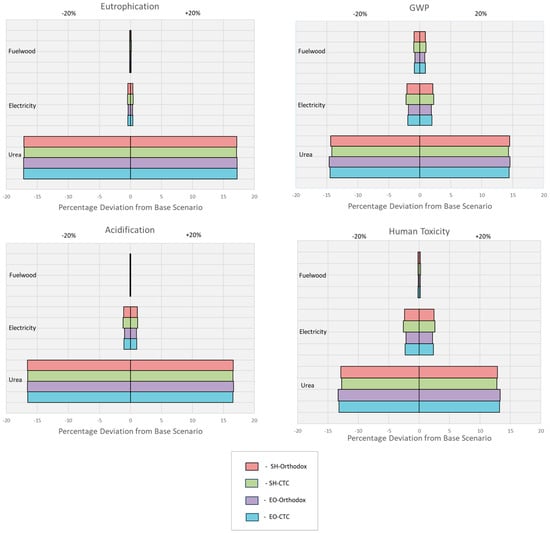
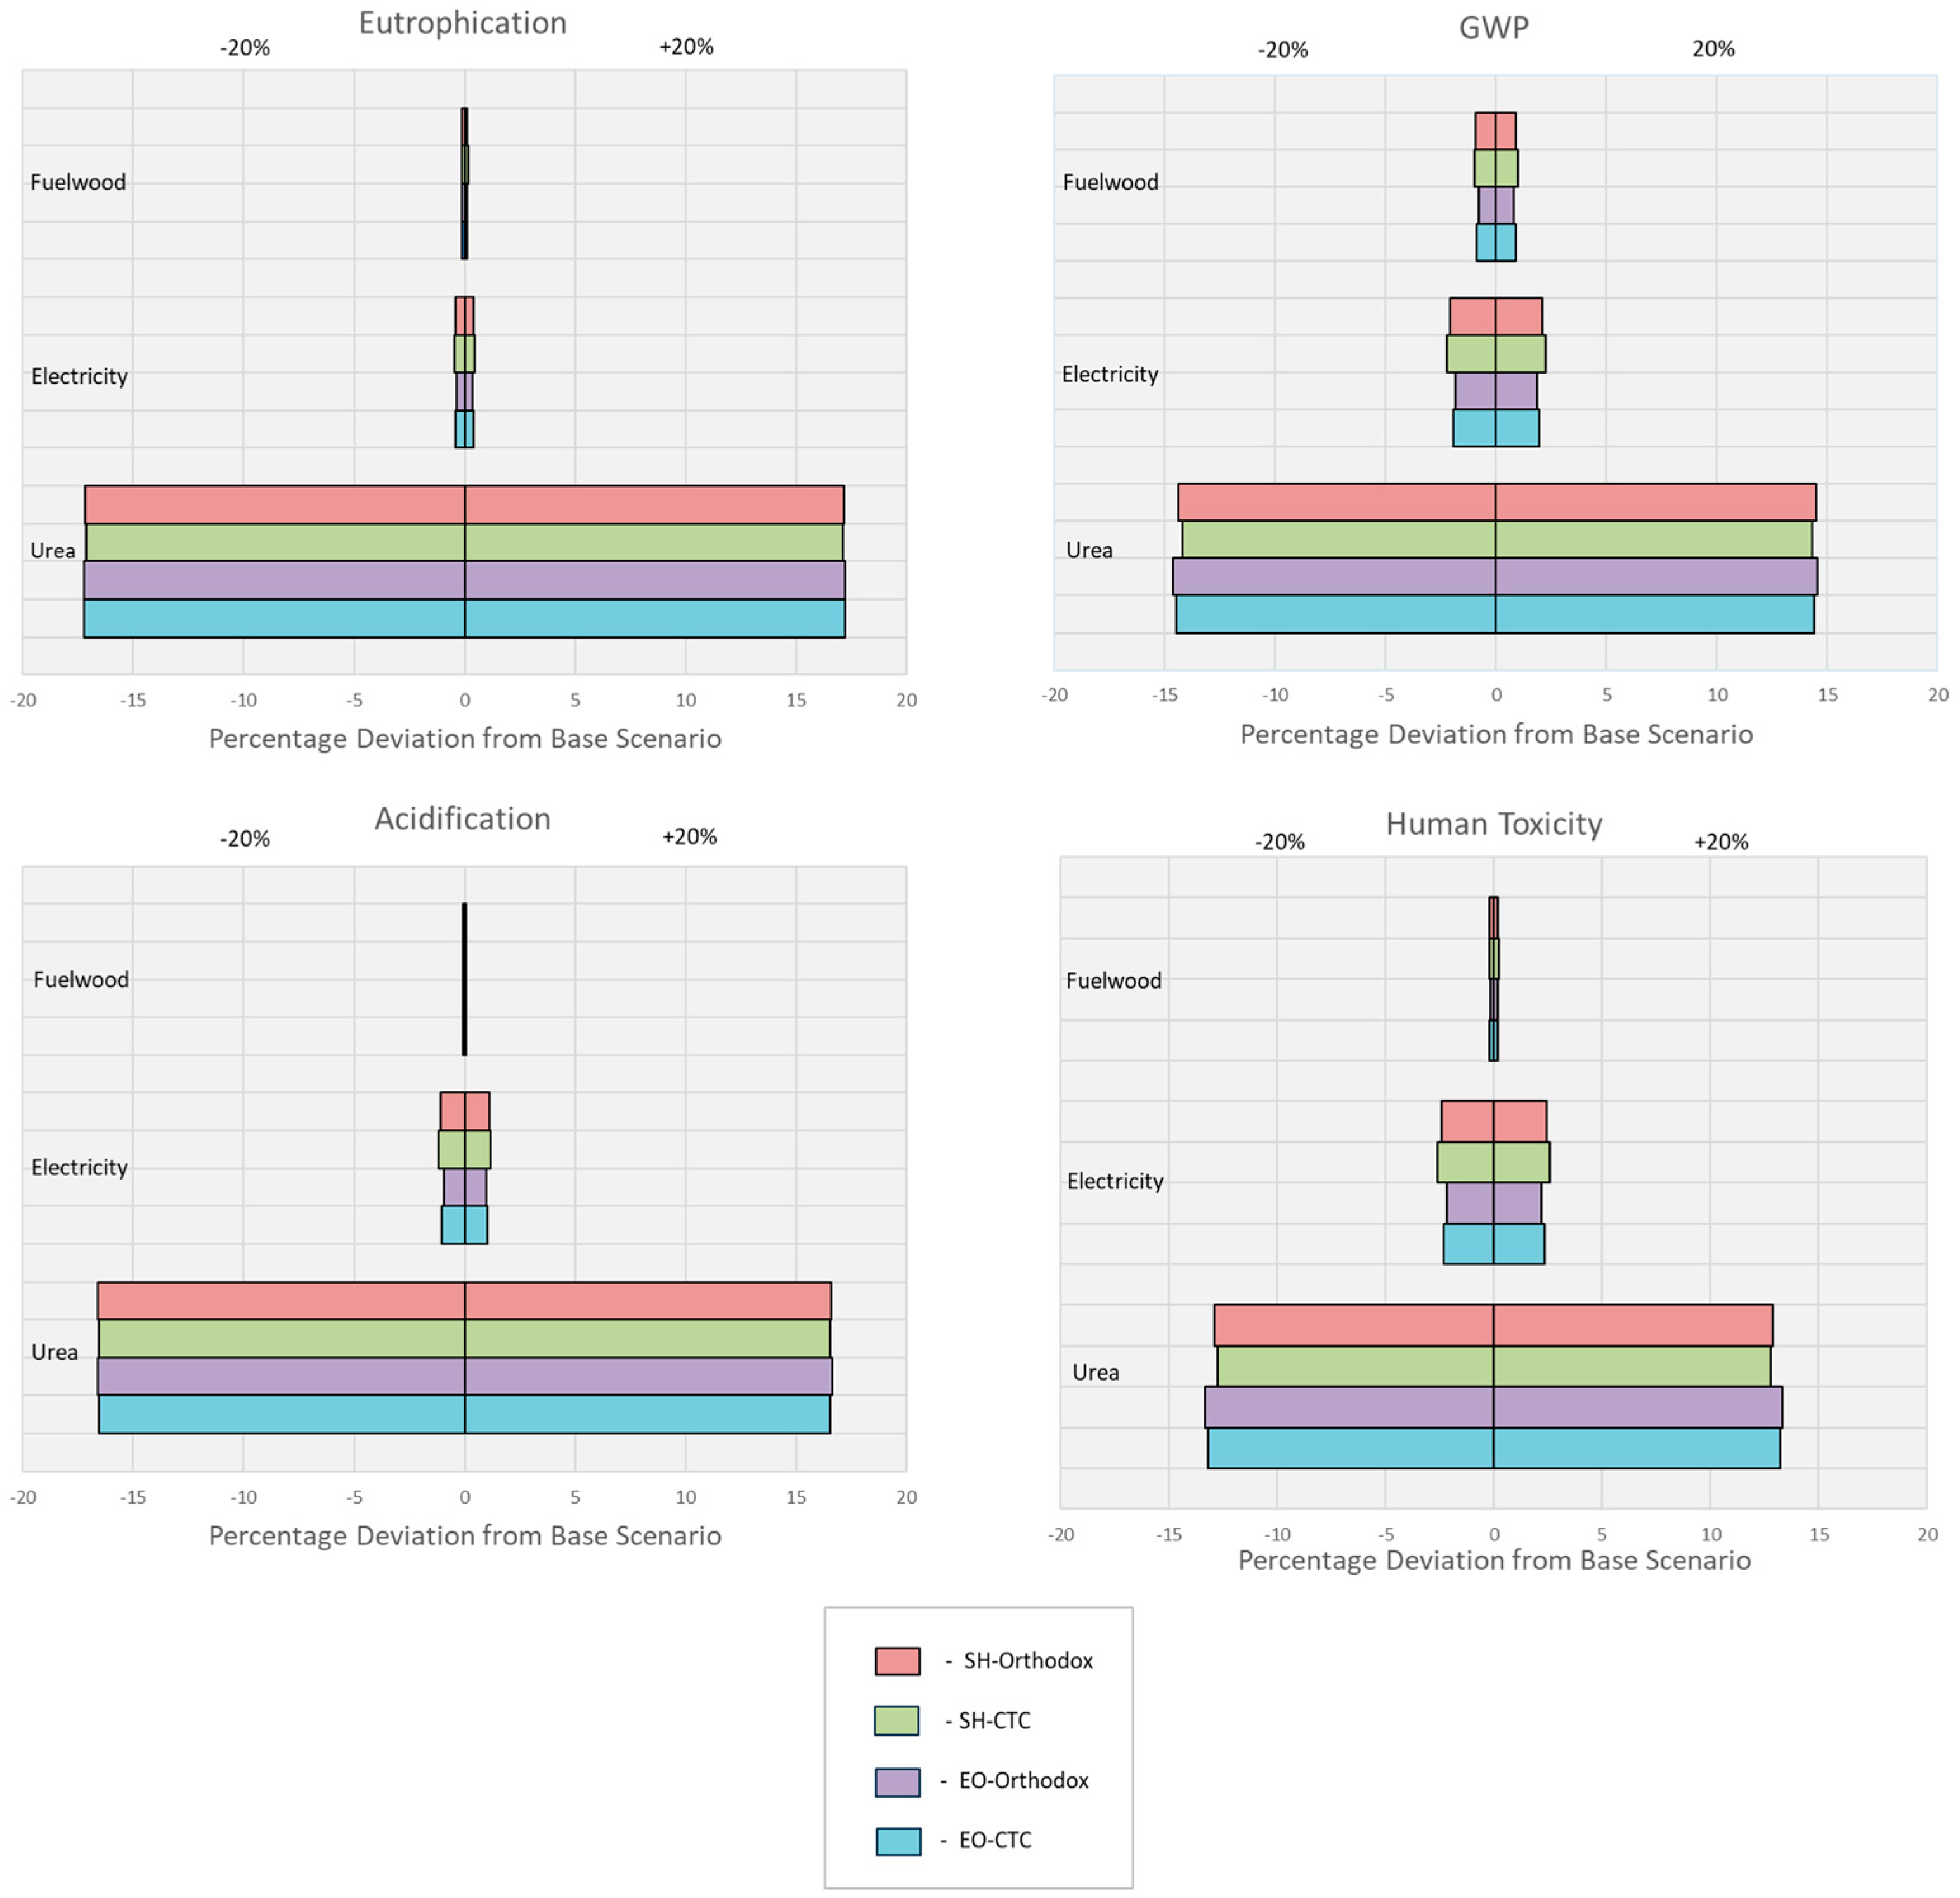
The sensitivity analysis was conducted to assess the effect of variations in key input parameters on the environmental impacts of tea production. A ± 20% change was applied to urea fertilizer, electricity consumption, and fuelwood, and the corresponding changes in human toxicity, acidification, and eutrophication were calculated for each production scenario. The results are presented as tornado plots (see Figure 6) showing the relative influence of each input factor on the selected impact categories across the four scenarios (Orthodox-SH, CTC-SH, Orthodox-EO, and CTC-EO). Figure 6 indicates that urea fertilizer has the strongest influence, particularly on acidification and eutrophication, while electricity shows a marked effect on human toxicity. Fuelwood contributed comparatively less, but its influence was still evident in energy-intensive scenarios. As a whole, the analysis highlights that improvements in fertilizer management and energy efficiency could substantially mitigate the environmental burden of tea production.
Figure 6.
Tornado plots illustrating the sensitivity of environmental impacts (eutrophication, GWP, acidification and human toxicity) to ±20% changes in urea fertilizer, electricity consumption, and fuelwood across the four tea production scenarios (Orthodox-SH, CTC-SH, Orthodox-EO, and CTC-EO).
3.8. Practical Implications
The following implications are drawn from the hotspots identified in this analysis and, where indicated, from supporting evidence in the wider literature. They are intended as directions for further investigation and policy consideration rather than as quantified outcomes of this study.
Because the plantation’s productive phase consistently accounts for the largest share of environmental impacts across all scenarios, this stage’s input efficiency is the most influential aspect for reducing per-tonne environmental burdens. Although smallholder plantations typically apply less fertilizer per hectare than estate-owned plantations, their lower yields translate into higher input use per tonne of processed tea, which is consistent with the higher per-tonne impacts observed here. Supporting smallholders in adopting agronomic practices that enhance yield efficiency, such as timely pruning, optimal plant spacing, and improved soil fertility management, could reduce per-unit environmental burdens. Extension services and targeted training may help align input use with crop demand and local conditions. Even though yields decline in later stages, farmers apply the same amount of fertilizer to plantations of all ages. This practice follows local advisory guidelines rather than a special agronomic need. Using fertilizer rates that match plantation age could make inputs more efficient and lower the environmental impact per tonne on older plantations.
Integrated pest and weed management could also be further encouraged, particularly in estate-owned systems where herbicide use tends to be higher. A shift toward mechanical or manual weed control, where feasible, may reduce the contribution of chemical inputs to ecotoxicity and human toxicity. Where chemical control remains necessary, careful application rate calibration and the use of less hazardous substances could help minimize environmental burdens.
Withering is the most energy-intensive operation at the factory stage and is the single largest contributor to processing related impacts. Therefore, where feasible, investments in energy-efficient technologies, such as improved air circulation, waste heat recovery, and renewable energy sources, may significantly reduce factory-level impacts. Regular maintenance and process optimization can also contribute. Government incentives or low-interest financing for energy audits and equipment upgrades could accelerate the adoption of such measures, particularly in smaller factories with limited capital.
Although packaging accounts for a smaller share of the overall footprint in the present cradle-to-gate system, the use of alternative packaging materials with lower embodied energy and reduced use of non-recyclable or composite materials may offer further improvement potential. To realize these practical implications, coordinated action among tea growers, factory operators, industry associations, and government agencies is required.
Prioritizing fertilizer and pesticide management at the plantation stage and energy efficiency at the processing stage appears to be most consistent with the hotspots identified in this study.
3.9. Limitations and Further Research
Although this study provides a foundation for understanding the environmental impacts of low-country tea production, there are several avenues for future research.
First, the geographic and agro-ecological scope of Life Cycle Assessments should be expanded to include mid- and high-country tea-growing regions in Sri Lanka. Production practices, yields, and environmental conditions vary significantly with altitude and region, and a broader dataset would enable more accurate national benchmarking, facilitate region-specific recommendations, and inform policy development for the entire Sri Lankan tea sector.
The use of convenience sampling for plantation and factory selection based on willingness to participate is a potential source of bias and may limit the generalizability of the findings beyond the Pasgoda DS area. However, the sampled plantations span a wide range of ages and include both smallholder and estate-owned systems, and the five factories represent approximately 25% of the factories in the study area, providing reasonable coverage of the main production configurations in the region. Extending this assessment to other tea-growing regions and agro-ecological zones in Sri Lanka would be necessary to confirm the broader applicability of the results.
The system boundary must be extended beyond the factory gate. A cradle-to-grave LCA, including distribution, retail, consumption, and end-of-life stages, would provide a more holistic picture of Sri Lankan tea’s environmental footprint, particularly for export markets. This would help identify additional environmental hotspots, such as international transportation and consumer packaging disposal, and support the development of more sustainable supply chains.
The development of local life cycle inventory databases would greatly improve the quality and relevance of environmental LCAs in Sri Lanka. Current studies, including this one, rely on international databases such as Ecoinvent for emission factors and background data, which may not fully reflect the conditions in Sri Lanka. Establishing Sri Lanka-specific emission factors, agricultural input profiles, and energy mixes would enhance the accuracy of future assessments and support decision-making by policy makers and industry stakeholders.
Finally, future research should investigate the environmental implications of climate adaptation strategies in tea cultivation. As climate change increasingly affects Sri Lanka’s tea sector, studies assessing the impacts of drought resistant cultivars, water-saving irrigation techniques, and other adaptive practices will be essential for ensuring both environmental sustainability and economic resilience [37].
4. Conclusions
This study presents a cradle-to-gate Environmental Life Cycle Assessment of tea production in Sri Lanka, comparing four scenarios that combine smallholder and estate-owned plantation management with Orthodox and CTC processing methods. By adopting a modular, phase-specific framework that explicitly accounts for the perennial nature of the tea crop, the assessment integrates nursery production, land preparation, the immature phase, and the full productive lifespan of the plantation, alongside factory-level processing.
The results indicate that the plantation’s productive phase is the dominant environmental hotspot, accounting for ca. 85–90% of plantation-related impacts across all scenarios, driven primarily by fertilizer and pesticide application. Within the factory stage, withering emerges as the single largest contributor, accounting for ca. 44–46% of processing-related impacts due to its high thermal energy demand.
Estate-owned plantations consistently show ca. 10–12% lower per-tonne impacts than smallholder systems across the eight impact categories assessed, while the choice of processing method (Orthodox versus CTC) produces a comparatively modest difference of ca. 1.8% in global warming potential within the same plantation management type. The Smallholder-Orthodox scenario exhibited the highest environmental burden across all categories, and the Estate-CTC scenario exhibited the lowest, confirming a consistent performance hierarchy across the four scenarios.
As a whole, these findings indicate that the plantation management scale exerts a stronger influence on environmental performance than processing technology, suggesting that the Sri Lankan tea sector’s sustainability efforts should prioritize input efficiency at the plantation stage, particularly fertilizer management, alongside thermal energy efficiency at the withering stage. The value of the modular, phase-specific LCA approach adopted here is also demonstrated, capturing the temporal dynamics and input variability of a perennial crop system that would be overlooked by conventional single-phase approaches.
Several directions for future research follow from this study. First, the geographic scope of the assessment should be extended to mid- and high-country tea-growing regions in Sri Lanka, where production practices and environmental conditions differ substantially from those in the low-country context studied here. Second, extending the system boundary to a full cradle-to-grave assessment, including distribution, retail, consumption, and end-of-life stages, would provide a more complete picture of the environmental footprint of Sri Lankan tea, particularly for export markets. Third, developing Sri Lanka-specific life cycle inventory data, including national emission factors, agricultural input profiles, and energy mixes, would improve the accuracy of future assessments. Finally, future research should examine the environmental implications of climate adaptation strategies in tea cultivation, including drought-resistant cultivars and water-saving irrigation techniques, which will become increasingly relevant as climate change continues to affect the sector.
Supplementary Materials
The following supporting information can be downloaded at: https://www.mdpi.com/article/10.3390/su18094245/s1, Table S1: Representative processes in eco invent v3.11; Table S2: Inputs and Outputs in the Nursery Phase for Smallholder and Estate-Owned Plantations per 1 tonne of Processed Tea; Table S3: Inputs and Outputs in the Land Preparation Phase for Smallholder Plantations per 1 tonne of Processed Tea; Table S4: Inputs and Outputs in the Unproductive Phase for Smallholder and Estate-Owned Plantations per 1 tonne of Processed Tea; Table S5: Inputs in the Productive Phase for Smallholder and Estate-Owned Plantations per 1 tonne of Processed Tea; Table S6: Outputs in the Productive Phase for Smallholder Plantations per 1 tonne of Processed Tea; Table S7: Outputs in the Productive Phase for Estate-Owned Plantations per 1 tonne of Processed Tea; Table S8: Inputs and Outputs per 1 tonne of processed tea, CTC processing method; Table S9: Inputs and outputs per 1 tonne of processed tea, Orthodox processing method Orthodox; Table S10: The percentage availability of N, P2O5 and K2O in each type of fertilizer; Table S11: Emission factors and constants.
Author Contributions
Conceptualization, A.L. and P.G.; methodology, A.L., P.D. and P.G.; software, A.L.; validation, A.L., P.G. and P.D.; formal analysis, A.L.; investigation, P.G.; resources, P.G. and P.D.; data curation, A.L.; writing—original draft preparation, A.L.; writing—review and editing, P.G., P.D., N.G.; supervision, P.G. and P.D.; funding acquisition, N.G. All authors have read and agreed to the published version of the manuscript.
Funding
This research received no external funding.
Institutional Review Board Statement
Not applicable.
Informed Consent Statement
Not applicable.
Data Availability Statement
Data are contained within the article and Supplementary Materials.
Acknowledgments
The authors would like to thank all the individuals involved in conducting this research.
Conflicts of Interest
The authors declare no conflicts of interest.
Abbreviations
The following abbreviations are used in this manuscript:
| E-LCA | Environmental Life Cycle Assessment |
| DS | Divisional Secretariat |
| CTC | Crush–Tear–Curl |
| kg | Kilogram |
| CML-IA | Centrum voor Milieukunde Leiden Impact Assessment |
| GWP | Global warming potential |
| CO2 eq | Carbon dioxide equivalent |
| SO2 eq | Sulfur dioxide equivalent |
| vs | versus |
| BC | Before Christ |
| USD | United States dollars |
| m | meter |
| GHGs | Greenhouse gases |
| LCA | Life Cycle Assessment |
| IPCC | Intergovernmental Panel on Climate Change |
| ISO | International Organization for Standardization |
| N2O | Nitrous oxide |
| MJ | Megajoule |
| Sb | Antimony |
| PO43− | Phosphate |
| DB eq | 1,4-Dichlorobenzene equivalent |
| EO | Estate-Owned |
References
- D’Auria, J.C.; Cohen, S.P.; Leung, J.; Glockzin, K.; Glockzin, K.M.; Gervay-Hague, J.; Zhang, D.; Meinhardt, L.W. United States tea: A synopsis of ongoing tea research and solutions to United States tea production issues. Front. Plant Sci. 2022, 13, 934651. [Google Scholar] [CrossRef] [Scilit]
- Statista. Global Tea Consumption 2018–2029. Available online: https://www.statista.com/statistics/940102/global-tea-consumption/ (accessed on 11 July 2025).
- Hayat, K.; Iqbal, H.; Malik, U.; Bilal, U.; Mushtaq, S. Tea and its consumption: Benefits and risks. Crit. Rev. Food Sci. Nutr. 2015, 55, 939–954. [Google Scholar] [CrossRef] [Scilit]
- Statista. Global Tea Market Size 2018–2030. Available online: https://www.statista.com/statistics/326384/global-tea-beverage-market-size/ (accessed on 23 July 2025).
- FAO. Current Global Market Situation and Medium-Term Outlook. Committee on Commodity Problems, Intergovernmental Group on Tea, Twenty-Fifth Session; FAO: Rome, Italy, 2024; Available online: https://www.fao.org/3/cc9417en/cc9417en.pdf (accessed on 10 January 2026).
- FAO. International Tea Market: Market Situation, Prospects and Emerging Issues; Food and Agriculture Organization of the United Nations: Rome, Italy, 2022; Available online: https://www.fao.org/3/cc0238en/cc0238en.pdf (accessed on 10 January 2026).
- Mohotti, K.M.; Hewasinghe, S. Economic and social evolutions of the tea industry in Sri Lanka: Lessons for sustainability in responsible business and way forward. In Responsible Business and Sustainability; Sri Lanka Economic Association: Colombo, Sri Lanka, 2024; pp. 154–170. Available online: https://www.researchgate.net/publication/388180645 (accessed on 10 January 2026).
- Sri Lanka Tea Board. Annual Report 2023; Sri Lanka Tea Board: Colombo, Sri Lanka, 2023; Available online: https://srilankateaboard.lk/wp-content/uploads/2025/04/English-AR-2023.pdf (accessed on 10 January 2026).
- Tubiello, F.N.; Karl, K.; Flammini, A.; Gütschow, J.; Obli-Laryea, G.; Conchedda, G.; Pan, X.; Qi, S.Y.; Heiðarsdóttir, H.H.; Wanner, N.; et al. Pre- and post-production processes increasingly dominate greenhouse gas emissions from agri-food systems. Earth Syst. Sci. Data 2022, 14, 1795–1809. [Google Scholar] [CrossRef] [Scilit]
- Nikkhah, A.; Khojastehpour, M.; Emadi, B.; Taheri-Rad, A.; Khorramdel, S. Environmental impacts of peanut production system using life cycle assessment methodology. J. Clean. Prod. 2015, 92, 84–90. [Google Scholar] [CrossRef] [Scilit]
- FAO. Greenhouse Gas Emissions from Agrifood Systems: Global, Regional and Country Trends, 2000–2020; FAO: Rome, Italy, 2022. [Google Scholar]
- Crippa, M.; Solazzo, E.; Guizzardi, D.; Monforti-Ferrario, F.; Tubiello, F.N.; Leip, A. Food systems are responsible for a third of global anthropogenic GHG emissions. Nat. Food 2021, 2, 198–209. [Google Scholar] [CrossRef] [Scilit] [PubMed]
- Tubiello, F.N.; Rosenzweig, C.; Conchedda, G.; Karl, K.; Gütschow, J.; Pan, X.; Obli-Laryea, G.; Wanner, N.; Qiu, S.Y.; De Barros, J.; et al. Greenhouse gas emissions from food systems: Building the evidence base. Environ. Res. Lett. 2021, 16, 065007. [Google Scholar] [CrossRef] [Scilit]
- Üçtuğ, F.G.; Ediger, V.Ş.; Küçüker, M.A.; Berk, İ.; İnan, A.; Tuğcu, M. Life cycle assessment of black tea production and cosumption in Türkiye: Insights from waste management scenarios. Environ. Dev. 2025, 55, 101176. [Google Scholar] [CrossRef] [Scilit]
- Xu, Q.; Yang, Y.; Hu, K.; Chen, J.; Djomo, S.N.; Yang, X.; Knudsen, M.T. Economic, environmental, and emergy analysis of China’s green tea production. Sustain. Prod. Consum. 2021, 28, 269–280. [Google Scholar] [CrossRef] [Scilit]
- Taulo, J.; Sebitosi, A. Material and energy flow analysis of the Malawian tea industry. Renew. Sustain. Energy Rev. 2016, 56, 1337–1350. [Google Scholar] [CrossRef] [Scilit]
- Cecchini, L.; Torquati, B.; Chiorri, M. Sustainable agri-food products: A review of consumer preference studies through experimental economics. Agric. Econ. 2018, 64, 554–565. [Google Scholar] [CrossRef] [Scilit]
- De Boer, I.J. Environmental impact assessment of conventional and organic milk production. Livest. Prod. Sci. 2003, 80, 69–77. [Google Scholar] [CrossRef] [Scilit]
- Saitone, T.L.; Sexton, R.J. Agri-food supply chain: Evolution and performance with conflicting consumer and societal demands. Eur. Rev. Agric. Econ. 2017, 44, 634–657. [Google Scholar] [CrossRef] [Scilit]
- Roy, P.; Nei, D.; Orikasa, T.; Xu, Q.; Okadome, H.; Nakamura, N.; Shiina, T. A review of life cycle assessment (LCA) on some food products. J. Food Eng. 2009, 90, 1–10. [Google Scholar] [CrossRef] [Scilit]
- Fan, J.; Liu, C.; Xie, J.; Han, L.; Zhang, C.; Guo, D.; Niu, J.; Jin, H.; McConkey, B.G. Life cycle assessment on agricultural production: A mini review on methodology, application, and challenges. Int. J. Environ. Res. Public Health 2022, 19, 9817. [Google Scholar] [CrossRef] [Scilit]
- Xu, Q.; Hu, K.; Wang, X.; Wang, D.; Knudsen, M.T. Carbon footprint and primary energy demand of organic tea in China using a life cycle assessment approach. J. Clean. Prod. 2019, 233, 782–792. [Google Scholar] [CrossRef] [Scilit]
- Sun, M.; Jia, X.; Yang, D.; Lu, B.; Han, F.; Shi, F. Life cycle environmental impact assessment of green tea production in China. J. Clean. Prod. 2023, 434, 140377. [Google Scholar] [CrossRef] [Scilit]
- Zhang, C.; Ye, X.; Zhang, H.; Xie, J.; Yang, X. Environmental footprint performance improvement of black tea using the life cycle assessment approach. J. Clean. Prod. 2023, 430, 139574. [Google Scholar] [CrossRef] [Scilit]
- He, M.; Li, Y.; Zong, S.; Li, K.; Han, X.; Zhao, M. Life cycle assessment of carbon footprint of green tea produced by smallholder farmers in Shaanxi Province of China. Agronomy 2023, 13, 364. [Google Scholar] [CrossRef] [Scilit]
- Azapagic, A.; Bore, J.; Cheserek, B.; Kamunya, S.; Elbehri, A. The global warming potential of production and consumption of Kenyan tea. J. Clean. Prod. 2016, 112, 4031–4040. [Google Scholar] [CrossRef] [Scilit]
- Cichorowski, G.; Joa, B.; Hottenroth, H.; Schmidt, M. Scenario analysis of life cycle greenhouse gas emissions of Darjeeling tea. Int. J. Life Cycle Assess. 2015, 20, 426–439. [Google Scholar] [CrossRef] [Scilit]
- Soheili-Fard, F.; Kouchaki-Penchah, H.; Raini, M.G.N.; Chen, G. Cradle-to-grave environmental-economic analysis of tea life cycle in Iran. J. Clean. Prod. 2018, 196, 953–960. [Google Scholar] [CrossRef] [Scilit]
- Munasinghe, M.; Deraniyagala, Y.; Dassanayake, N.; Karunarathna, H. Economic, social and environmental impacts and overall sustainability of the tea sector in Sri Lanka. Sustain. Prod. Consum. 2017, 12, 155–169. [Google Scholar] [CrossRef] [Scilit]
- Kassel, N.; Kamalakkannan, S.; Kulatunga, A. Environmental and social sustainability of the tea industry in the wake of global market challenges: A case study in Sri Lanka. Int. J. Sustain. Manuf. 2020, 4, 379. [Google Scholar] [CrossRef] [Scilit]
- Vidanagama, J.; Lokupitiya, E. Energy usage and greenhouse gas emissions associated with tea and rubber manufacturing processes in Sri Lanka. Environ. Dev. 2018, 26, 43–54. [Google Scholar] [CrossRef] [Scilit]
- Bessou, C.; Basset-Mens, C.; Tran, T.; Benoist, A. LCA applied to perennial cropping systems: A review focused on the farm stage. Int. J. Life Cycle Assess. 2013, 18, 340–361. [Google Scholar] [CrossRef] [Scilit]
- Pelvan, E.; Özilgen, M. Assessment of energy and exergy efficiencies and renewability of black tea, instant tea and ice tea production and waste valorization processes. Sustain. Prod. Consum. 2017, 12, 59–77. [Google Scholar] [CrossRef] [Scilit]
- ISO 14040:2006; Environmental Management—Life Cycle Assessment—Principles and Framework. ISO: Geneva, Switzerland, 2006.
- ISO 14044:2006; Environmental Management—Life Cycle Assessment—Requirements and Guidelines. ISO: Geneva, Switzerland, 2006.
- IPCC. 2006 IPCC Guidelines for National Greenhouse Gas Inventories. Available online: https://www.ipcc-nggip.iges.or.jp/public/2006gl/ (accessed on 10 January 2026).
- Guinée, J.B.; Gorrée, M.; Heijungs, R.; Huppes, G.; Kleijn, R.; de Koning, A.; van Oers, L.; Wegener Sleeswijk, A.; Suh, S.; Udo de Haes, H.A.; et al. Handbook on Life Cycle Assessment: Operational Guide to the ISO Standards; Kluwer Academic Publishers: Dordrecht, The Netherlands, 2002. [Google Scholar]
- Dunuwila, P.; Rodrigo, V.H.L.; Daigo, I.; Goto, N. Unveiling the Environmental Impacts of Concentrated Latex Manufacturing in Sri Lanka through a Life Cycle Assessment. Resources 2024, 13, 5. [Google Scholar] [CrossRef] [Scilit]
- Dunuwila, P.; Rodrigo, V.H.L.; Goto, N. Assessing the Financial and Environmental Sustainability in Raw Rubber Processing; a Case Study with Ribbed Smoked Sheet Manufacture in Sri Lanka. Indones. J. Life Cycle Assess. Sustain. 2017, 2, 1–7. [Google Scholar] [CrossRef] [Scilit]
- Dunuwila, P.; Munasinghe, E.; Rodrigo, V.H.L.; Gong, W.T.; Daigo, I.; Goto, N. Revealing the Environmental Footprint of Crepe Rubber Production: A Comprehensive Life Cycle Assessment of a Crepe Rubber Factory in Sri Lanka. Sustainability 2025, 17, 1239. [Google Scholar] [CrossRef] [Scilit]

Disclaimer/Publisher’s Note: The statements, opinions and data contained in all publications are solely those of the individual author(s) and contributor(s) and not of MDPI and/or the editor(s). MDPI and/or the editor(s) disclaim responsibility for any injury to people or property resulting from any ideas, methods, instructions or products referred to in the content. |
© 2026 by the authors. Licensee MDPI, Basel, Switzerland. This article is an open access article distributed under the terms and conditions of the Creative Commons Attribution (CC BY) license.