


Abstract
This study presents a comprehensive geochemical and isotopic investigation of urban stream sediments draining into the Keban Dam Lake in Eastern Türkiye. A total of 15 sediment samples were collected along a ~35 km transect, spanning rural-to-urban transition zones. PAAS-normalised REE patterns revealed coherent light REE behaviour and positive Eu anomalies (Eu/Eu* = 1.57–2.01), except sample K8 (Eu/Eu* = 0.91), indicating contributions from plagioclase-bearing lithologies. Enrichment Factor (EF) calculations based on scandium normalisation showed notable enrichment in Li, Zr, Nb, and REEs, reflecting felsic source rocks and mineralogical sorting. Multivariate statistical analyses (PCA and HCA) revealed distinct groupings of elements associated with lithogenic sources (Be, Sc, and Y) and anthropogenic inputs (Li, Sn, and Rb). Spatial clustering of samples into rural, transitional, and urban zones supported this differentiation, suggesting increasing anthropogenic influence downstream. Sr isotopic data (87Sr/86Sr = 0.7045–0.7057) and Pb isotope ratios (206Pb/204Pb = 18.914–18.947) suggest dominantly geogenic control, with slightly more radiogenic signatures in urban sediments. These integrated geochemical and isotopic results provide the provenance model for the Keban catchment, highlighting how natural lithological sources and urbanisation jointly shape sediment composition and metal distribution. The findings also provide a useful geochemical baseline for environmental monitoring, sediment quality assessment, and sustainable watershed management in the Keban Dam Lake basin.
1. Introduction
Rare earth elements (REEs) are widely recognised as robust geochemical tracers in sedimentary environments due to their consistent chemical behaviour, low mobility under surface conditions, and ability to retain signatures of source rocks [1,2]. Normalisation to Post-Archean Australian Shale (PAAS) and interpretation of Eu and Ce anomalies are standard practices in sediment provenance and diagenetic studies. Although chondrite normalisation can be useful for identifying mantle-related signatures in volcanic and ophiolitic settings, PAAS normalisation was adopted here to better reflect crustal sediment provenance.
Despite the utility of REEs, radiogenic isotope systems, especially strontium (87Sr/86Sr) and lead isotopes (206Pb/204Pb, 207Pb/204Pb, and 208Pb/204Pb), provide complementary and often higher-resolution constraints on sediment source regions and mixing processes. The 87Sr/86Sr ratio is sensitive to both lithological composition and geologic age, while Pb isotopic compositions help to distinguish crustal, mantle-derived, or anthropogenic inputs. In fluvial and estuarine settings, the combination of these isotope systems has successfully delineated natural inputs from anthropogenic contamination, particularly in mixed-use catchments [3].
In Türkiye, although several studies have investigated REEs in riverine and thermal waters [4,5,6,7,8,9,10,11], the application of Sr–Pb isotope geochemistry to sedimentary provenance and pollution source apportionment is still relatively scarce. The Keban Dam Lake watershed in Eastern Türkiye presents an ideal study area due to its lithological complexity, comprising volcanic, ophiolitic, and metamorphic terrains, and increasing anthropogenic pressures from agriculture, mining, and urban expansion.
This study aims to integrate REE geochemistry, enrichment factor (EF) analysis, multivariate statistical tools, and radiogenic isotope data to: (1) define the geochemical baseline of stream sediments; (2) differentiate between natural and anthropogenic influences; and (3) assess spatial variations across rural, transitional, and urban sub-basins within the Keban Dam Lake catchment. In this study, multivariate statistical analyses were applied primarily to explore geochemical associations and spatial patterns across the sampling transect.
This study provides a REE–Sr–Pb geochemical framework for Keban Dam Lake sediments and offers new insight into sediment provenance and environmental evolution in a tectonically active, mixed-use catchment.
2. Geological Setting
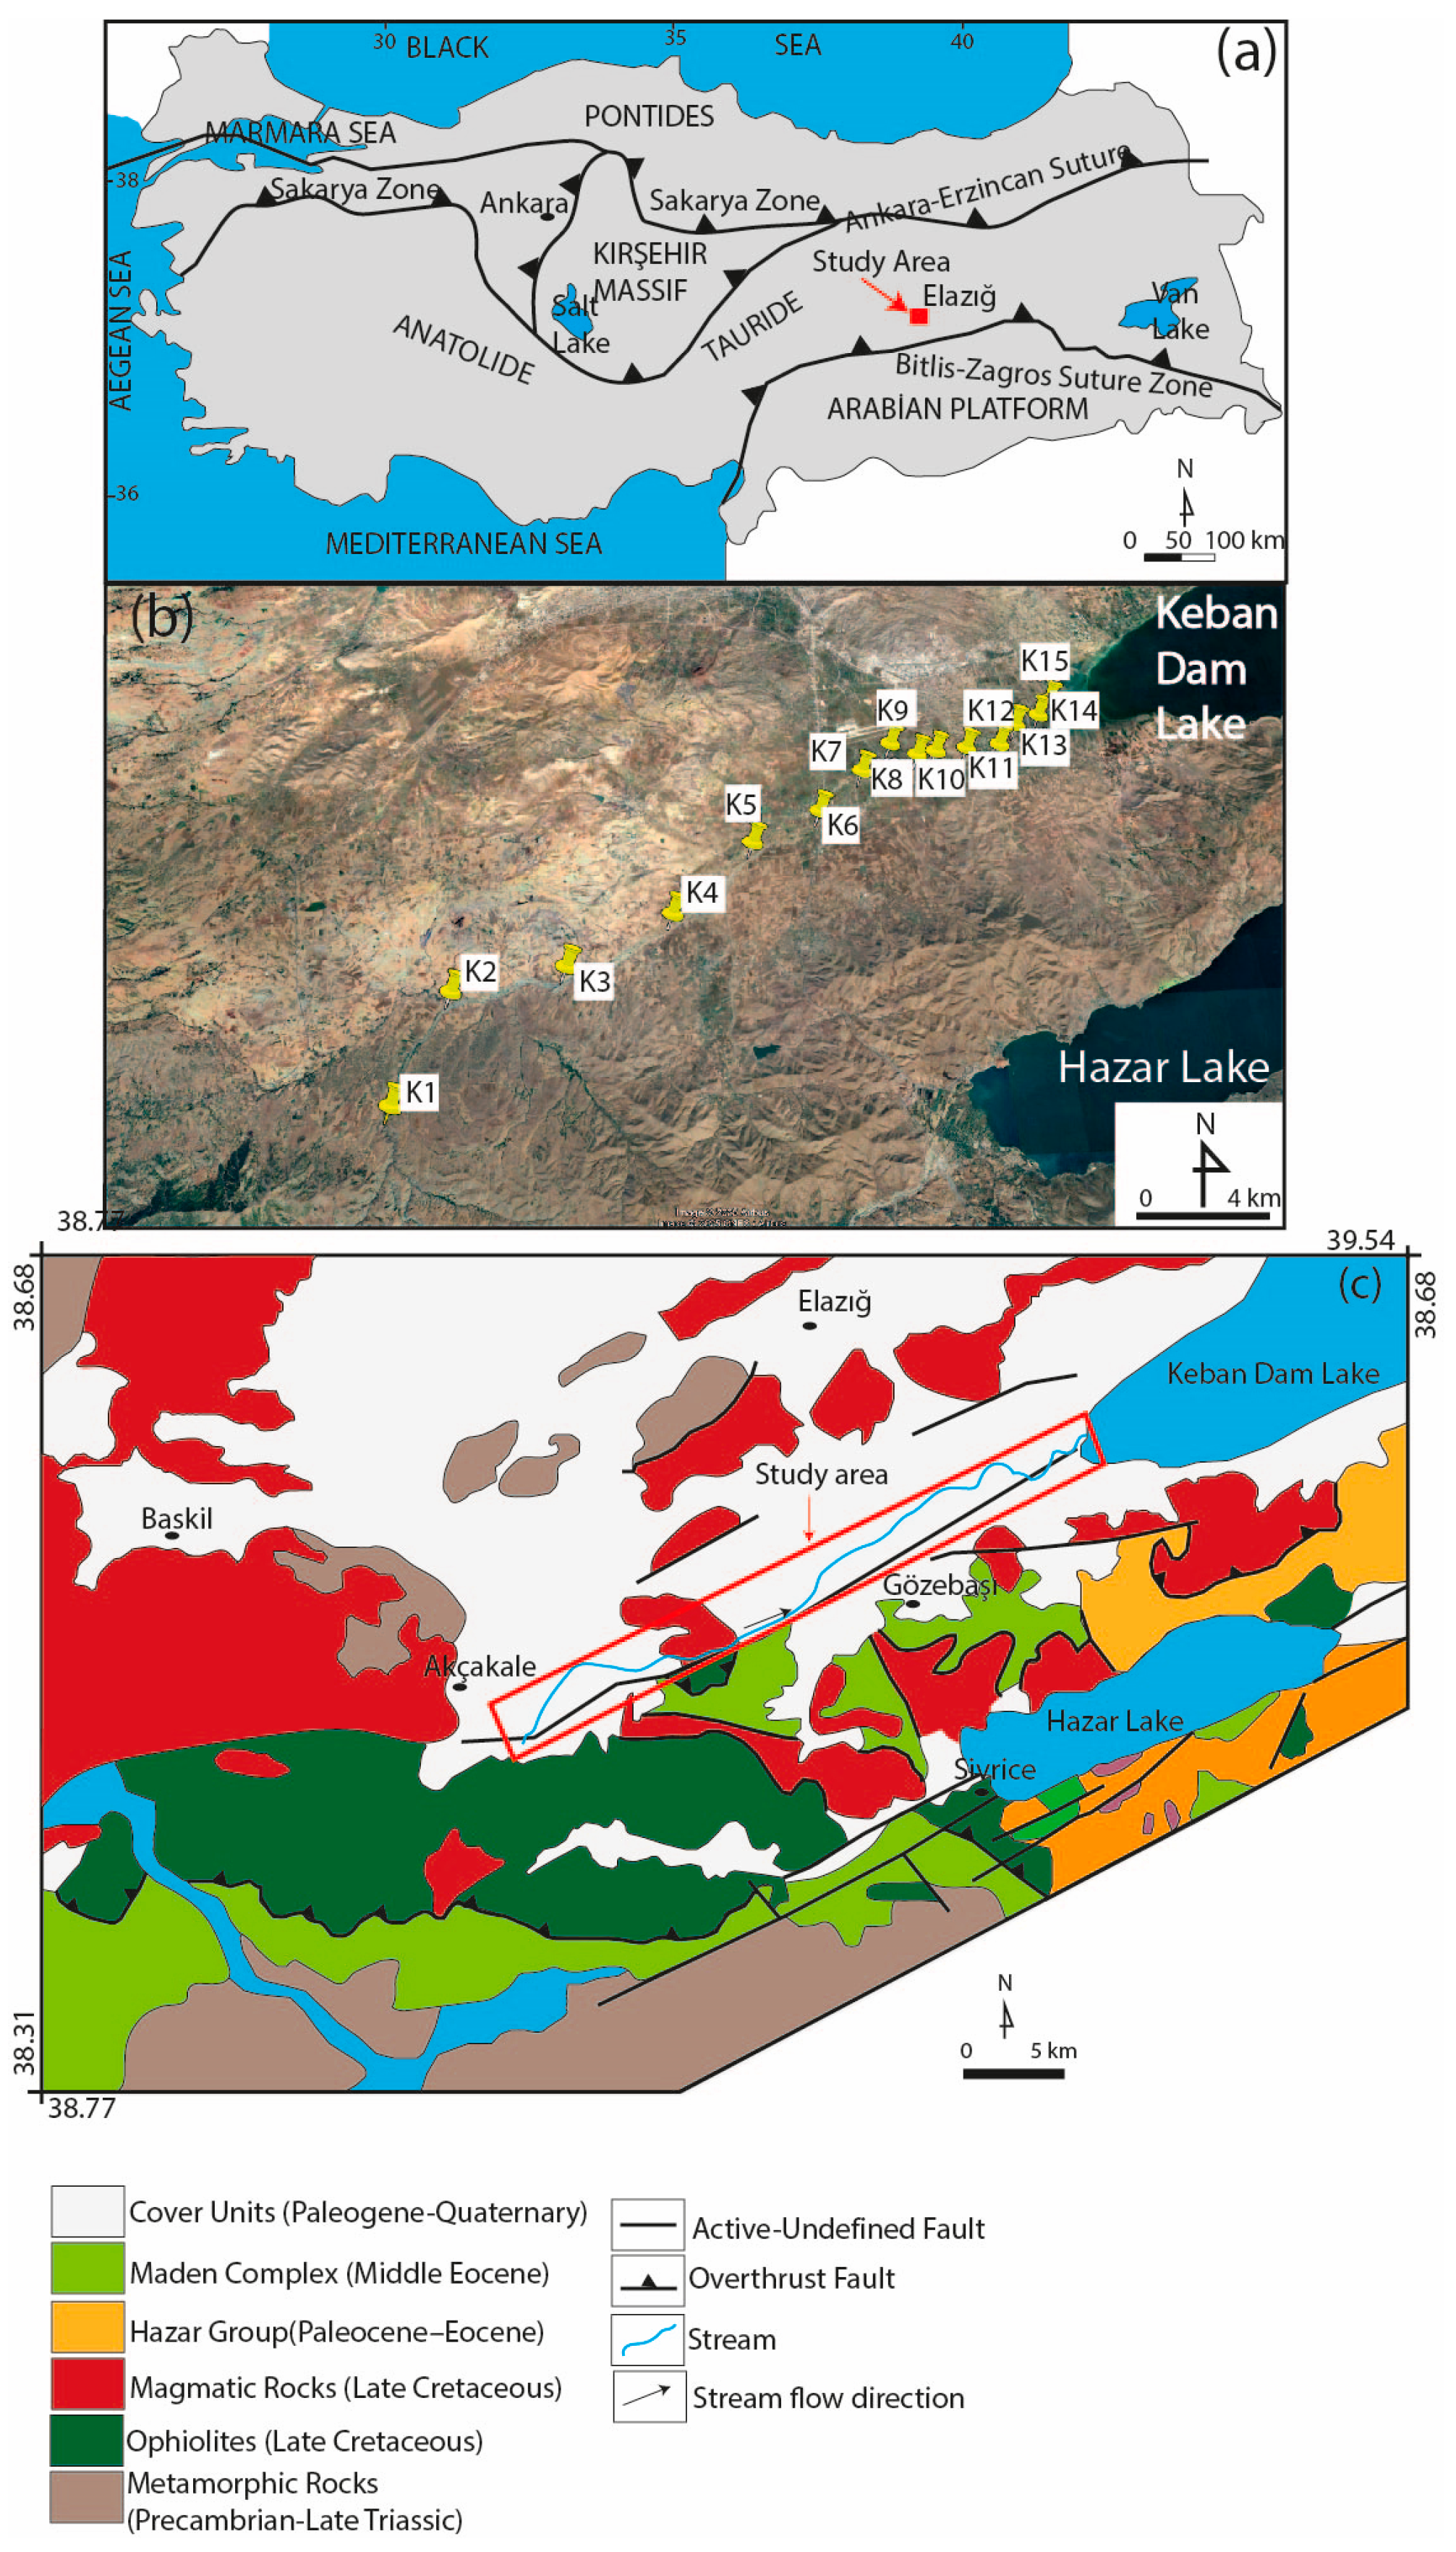
Türkiye lies within a geodynamically complex region shaped by the convergence of the Eurasian, African, and Arabian tectonic plates. The current tectonic framework of the country reflects a long and intricate geologic evolution involving subduction, accretion, and continental collision events that began in the Late Paleozoic and continued into the Cenozoic [12,13]. The study area is situated in eastern Anatolia, near Elazığ, between Keban Dam Lake and Hazar Lake (Figure 1a–c). Tectonically, the region is part of the Anatolian orogenic system, shaped by the closure of Neotethyan oceanic basins during the Alpine orogeny. On a regional scale, the main tectonic units of Türkiye include the Pontides to the north, the Kırşehir Massif and Sakarya Zone in Central Anatolia, and the Tauride Platform to the south. These units are bounded by major suture zones, notably the İzmir–Ankara–Erzincan Suture Zone and the Inner Tauride Suture, which mark the remnants of former Neotethyan oceanic domains.
Eastern Anatolia, particularly the Elazığ region, occupies a geologically strategic location within the Southeastern Anatolian Orogenic Belt (SAOB). This region displays a highly intricate lithotectonic framework, primarily governed by tectonic phases associated with the subduction and eventual closure of the southern arm of the Neotethys, followed by continental collisions [14,15]. The local stratigraphic sequence, from base to top, comprises the Keban–Malatya Metamorphics, ophiolitic assemblages, Late Cretaceous to Eocene magmatic units, the Hazar Group, the Maden Complex, and overlying unconsolidated deposits.
The Keban–Malatya Metamorphics, ranging in age from the Precambrian to the Triassic, form the basement of the area [16,17,18,19]. These high-grade metamorphic rocks, including gneisses, schists, and marbles, are regarded as fragments of the Arabian Plate’s northern margin and represent the most ancient exposed lithologies in the region [16,17,18,19]. Above this metamorphic basement lie Late Cretaceous ophiolitic sequences, which are remnants of Neotethyan oceanic lithosphere. These ophiolites, composed of serpentinized peridotites, layered gabbros, and sheeted dykes, are interpreted as the result of intra-oceanic subduction and subsequent obduction onto the continental margin during the Late Cretaceous period [20,21,22]. Another key geological feature is the Late Cretaceous Elazığ Magmatic Complex, consisting of intrusive igneous bodies that cut through both ophiolitic and surrounding sedimentary-volcanic sequences. This complex includes various plutonic rocks, such as gabbros, diorites, tonalites, and granodiorites, indicating a multiphase magmatic evolution [14,15]. Overlying parts of these magmatic and ophiolitic units is the Maden Complex, composed of Middle Eocene volcanic and pyroclastic rocks, including basalts, andesites, dacites, and intercalated sediments. From a provenance perspective, the Maden Complex plagioclase is likely an important rock-forming mineral in its mafic-to-intermediate volcanic members, whereas the more evolved lithologies may also contain accessory minerals such as zircon and apatite that can contribute to REE-bearing detritus. These units, which exhibit calc-alkaline to shoshonitic compositions, are believed to have formed in a post-collisional extensional environment influenced by asthenospheric upwelling and lithospheric delamination. Isotopic data (Sr-Nd) point to contributions from both depleted mantle sources and enriched continental crust [23].
Figure 1.
(a) Simplified tectonic map showing the tectonic units of Türkiye (simplified from [13]); (b) map of the study area with sampling point locations (adapted from Google Earth); and (c) geological map of the study area with the stream, stream flow direction (modified from [24]).
The Hazar Group, dated to the Paleocene–Eocene, comprises predominantly flysch-type sedimentary successions deposited within a foreland basin. In some areas, lateral facies transitions into synchronous volcanic rocks are observed, indicating episodic volcanic activity concurrent with sedimentation processes [25]. The Hazar Group may also contain detrital feldspar, along with resistant accessory minerals such as zircon and apatite, derived from volcanic input and the recycling of surrounding igneous and metamorphic rocks. These components may likewise contribute to the REE signatures observed in the stream sediments. Capping the sequence are unconsolidated Quaternary deposits (mainly alluvial sediments), which lie unconformably over the older bedrock and volcanic-sedimentary sequences. These deposits record erosional and depositional processes active during the post-orogenic phase that have helped shape the region’s contemporary topography.
3. Materials and Methods
3.1. Climatic Information of the Study Area
The study area lies within the Elazığ Province of Eastern Anatolia, Türkiye, characterised by a semi-arid continental climate with hot, dry summers and cold winters. According to long-term meteorological records (1991–2020; MGM), the region has an average annual temperature of 13.7 °C and 420 mm of precipitation. April is the wettest month (63 mm), while July and August are the driest (≤5 mm).
These climatic conditions influence sediment transport and geochemical variability within the catchment, particularly during low-flow summer conditions when sampling was performed.
3.2. Sampling of Sediments
The stream originates in the hills southwest of Elazığ province and flows generally northeast before emptying into Keban Dam Lake. From upstream station K1 (37° S 50′72.67″ E, 42°57′51.2″ N) to downstream station K15 (37° S 53′08.42″ E, 42°72′59.8″ N), the sampling transects covered roughly 35 km (Station K15). In July 2024, a single day during a dry period was chosen for sampling to limit the impact of runoff and ensure relatively stable hydrological conditions. However, because sampling was conducted during low-flow conditions in the dry season, the sediment dataset is likely biased toward coarser bedload material, with limited representation of fine suspended particulates. Based on field observations and spatial trends along the transect, the sampling locations can be broadly described as rural (K1–K5), transitional (K6–K10), and urban-influenced (K11–K15). These zones were distinguished based on field observations of dominant land use, settlement density, and proximity to the Elazığ urban boundary along the sampling transect. The creek passes through cultivated fields and communities on the edges of Elazığ city, as well as rural, agricultural, and peri-urban areas. Depending on local topography and seasonal flow conditions, field observations throughout the sampling process revealed an average stream width of 3–6 m and a depth of 0.3–0.8 m. Using a hand trowel, sediment samples were taken along the urban sediment stream (Figure 1b). Outside the city centre is where the stream begins. Fifteen river sediment samples, ranging in depth from 0 to 5 cm, were gathered. The 0–5 cm sampling depth mainly represents recent surface sediment deposition and may not capture historical contamination preserved in deeper layers, particularly at urban sites. Coordinates for each sampling location were captured using a portable global positioning device. Before analysis, the samples were stored in dark conditions at below 4 °C in polyethene bags and then brought to the lab. Before each usage, the hand trowel was cleaned with a detergent, rinsed, and dried to reduce contamination.
The samples were left to air-dry in the laboratory before analysis. Additionally, once the materials were homogenised and separated into subsamples, they were crushed in an agate mill to a size of roughly 0.075 mm (200 mesh).
3.3. Geochemical Analysis of Trace and Rare Earth Elements (REEs)
All geochemical analyses were performed at an accredited laboratory: Wuhan Sample Solution Analytical Technology Co., Ltd. (Wuhan, China). After acid digestion, Inductively Coupled Plasma Mass Spectrometry (ICP-MS) was used to quantify the concentrations of various elements, including trace elements and REEs. In a closed Teflon tank, 50 mg of each finely ground sediment sample was digested using a CEM Mars 6 (CEM Corporation, Matthews, NC, USA) microwave digestion system, which allows silicate-rich matrices to be broken down at high pressure and high temperature. The mixture included HNO3, HClO4, HF, and HCl. HClO4 was used to ensure complete digestion of resistant silicate phases, and all procedures were performed in accordance with appropriate laboratory safety protocols. USEPA Method 3052 (USEPA), a widely recognised process for preparing geological and environmental samples, served as the basis for the digestion technique. After digestion, an Agilent 7700x ICP-MS (Agilent Technologies, Santa Clara, CA, USA) instrument was used to analyse the solutions after dilution to the required level. Quality control was ensured by analysing procedural blanks, certified reference materials (GSR-1, GSR-3, and JA-2), and parallel samples. The measured values of the reference materials were in good agreement with the certified values, indicating acceptable analytical accuracy and precision.
Strontium (Sr) and lead (Pb) isotope analyses were carried out on five representative sediment samples (K5, K7, K9, K12, and K15), selected to represent the upstream, transitional, and downstream/urban-influenced sections of the stream. Sr and Pb isotope analyses were conducted on stream sediment samples at Wuhan Sample Solution Analytical Technology Co., Ltd. (Wuhan, China). The measurements were performed using multi-collector inductively coupled plasma mass spectrometry (MC-ICP-MS) on a Neptune Plus MC-ICP-MS (Thermo Fisher Scientific, Bremen, Germany) instrument. For isotope analysis, approximately 50 mg of each finely powdered sediment sample was digested using ultrapure HF, HNO3, and HCl acids, and Sr and Pb were subsequently purified by two-step chromatographic separation using Sr-Spec and Pb-Spec resins prior to MC-ICP-MS measurement. Before analysis, approximately 50 mg of each finely powdered sediment sample was digested in a clean laboratory environment using ultrapure concentrated HF, HNO3, and HCl acids. The resulting solutions underwent a two-step chromatographic separation using Sr-Spec and Pb-Spec resins to purify Sr and Pb from the matrix elements. For Sr isotope measurements, 87Sr/86Sr ratios were obtained and internally normalised to 86Sr/88Sr = 0.1194 to correct for instrumental mass bias. For Pb isotope analysis, 206Pb/204Pb, 207Pb/204Pb, and 208Pb/204Pb ratios were determined, and instrumental mass fractionation was corrected using thallium doping and normalisation to a 205Tl/203Tl ratio of 2.3875. Standard reference materials NIST SRM 987 (Sr) and NIST SRM 981 (Pb) were analysed alongside the samples to ensure data quality. Long-term external reproducibility was better than ±0.00002 (2SE) for 87Sr/86Sr and ±0.01% (2SE) for Pb isotope ratios. All isotopic data were blank-corrected before data reduction and processed using in-house reduction protocols under strict quality assurance procedures. For Sr isotope analysis, potential isobaric interference from 87Rb on 87Sr was monitored using the 85Rb signal after chromatographic separation, and no significant Rb interference was detected in the analysed samples.
3.4. Enrichment Factor (EF) Calculation
The Enrichment Factor (EF) is a widely used tool for assessing the degree of metal accumulation in river sediments. It is calculated using the following equation:
where Cref is the concentration of a reference (or conservative) element in the sediment sample as well as in the background or crustal material, and Cx is the concentration of the element of interest. Reference elements are those that are rarely impacted by anthropogenic activity and the concentrations of which are mostly determined by natural (lithogenic) sources. Low variability in natural abundance is usually what defines them. Although reference elements such as Ti, Ce, Sc, Mn, Zr, and Hf have been used [26], Al and Fe are most commonly chosen because of their reliable geochemical behaviour [27,28]. The background reference used for normalisation was the Post-Archean Australian Shale (PAAS) values. PAAS was adopted as a common reference to enable comparison with established sediment geochemical studies. In contrast, a single upstream sample was deemed insufficiently representative of local background conditions in this lithologically heterogeneous catchment.
EF = (Cx/Cref)sediment/(Cx/Cref)background
Because of its common association with fine-grained sediment particles, its geochemical behaviour is similar to that of many trace elements, and its natural concentration tends to be relatively uniform. Sc was chosen as the reference (or conservative) element for geochemical normalisation in this study [29]. Although Sc was preferred in this study, alternative normalisers such as Al or Ti may also be used to assess enrichment patterns in lithologically variable settings. The classification proposed by Sakan et al. [30] was used to interpret the EF values: EF < 1 indicates no enrichment, EF = 1–3 indicates minor enrichment, EF = 3–5 indicates moderate enrichment, EF = 5–10 indicates moderately severe enrichment, EF = 10–25 indicates severe enrichment, EF = 25–50 indicates very severe enrichment, and EF > 50 indicates extremely severe enrichment.
3.5. Statistical Analysis
Multivariate statistical techniques were applied to interpret geochemical data patterns and potential associations among elements. Before Principal Component Analysis (PCA) and Hierarchical Cluster Analysis (HCA), the data were standardised to minimise scale effects, and multivariate analyses were then applied to explore geochemical associations and patterns among the samples. PCA was conducted to reduce data dimensionality and identify elemental groupings that reflect common sources or geochemical behaviours. HCA was also performed to classify samples based on similarities in their elemental composition. All statistical analyses were conducted using Microsoft Excel (Microsoft Corporation, Redmond, WA, USA). Pearson correlation coefficients were evaluated at a significance level of p < 0.05. No correction for multiple comparisons was applied.
4. Results
4.1. Elemental Concentrations in Stream Sediments
The concentrations of selected REE and other trace elements in the 15 stream sediment samples (K1–K15) are presented in Table 1. Li concentrations range from 3.75 to 9.21 mg/kg, with the highest value observed in sample K10. Be concentrations are relatively consistent, varying slightly between 0.33 and 0.61 mg/kg. Sc shows a wider range, from 11.0 to 29.1 mg/kg, with notably lower concentrations in sample K8. Ga concentrations range from 8.38 to 18.8 mg/kg. Among the alkali elements, Rb varies from 3.56 to 13.3 mg/kg and Cs from 0.28 to 0.72 mg/kg. Sr and Ba, both commonly associated with feldspars and carbonates, range from 186 to 336 mg/kg and 55.0 to 129 mg/kg, respectively. Notably, sample K8 exhibits high Ba and Rb values, suggesting possible influence from felsic lithology and mineralogical variability.
Table 1.
Concentrations of trace elements and REEs in the stream sediment samples, including PAAS reference values (Taylor and McLennan [1]).
Y concentrations range from 14.9 to 35.0 mg/kg, with higher values in samples K4–K7. Zr concentrations are also elevated in the same samples, ranging from 39.0 to 105 mg/kg, consistent with zircon or other resistant heavy mineral inputs. Nb and tin Sn show moderate variability, with maximum concentrations of 4.23 and 2.30 mg/kg, respectively. Light rare earth elements (LREEs) such as La, Ce, Pr, and Nd exhibit distinct enrichment in samples K4–K7, with La ranging from 5.82 to 10.4 mg/kg and Ce ranging from 11.7 to 26.0 mg/kg. Similarly, middle and heavy REEs (Sm–Lu) show parallel enrichment trends. For instance, Gd ranges from 2.39 to 5.46 mg/kg, Dy ranges from 2.48 to 5.89 mg/kg, and Yb ranges from 1.52 to 3.54 mg/kg. The total REE (ΣREE) content varies markedly across the samples, with higher ΣREE values observed in K4, K5, and K6, suggesting potential influence from felsic source rocks or anthropogenic contributions such as industrial effluents or urban runoff. The elevated Eu (0.93–1.42 mg/kg) and Gd (2.39–5.46 mg/kg) concentrations in some samples may also indicate specific lithological controls or geochemical fractionation during transport.
4.2. Trace Element and Rare Earth Element Correlation in Stream Sediments
Pearson correlation analysis of elemental concentrations in the stream sediment samples revealed several significant relationships (Table 2). Strong positive correlations were observed among the LREE with correlation coefficients exceeding 0.95, indicating coherent geochemical behaviour. Li showed strong positive correlations with HFSE, with coefficients exceeding 0.8. Similarly, HFSEs such as Zr, Nb, Hf, and Ta exhibited strong inter-element correlations (r > 0.9). Ba, Sr, and Rb displayed moderate-to-strong positive correlations (r = 0.6–0.8). HFSEs also showed positive correlations (r > 0.7).
Table 2.
Pearson correlation matrix of trace elements and REE.
4.3. Enrichment Factor (EF) of REEs
The Enrichment Factor (EF) analysis provides a quantitative measure of the degree of enrichment or depletion of trace and REEs relative to a reference element (Sc in this study) and a background composition represented by PAAS (Table 3). This normalisation minimises the influence of natural variability and distinguishes anthropogenic or hydrothermal enrichments from natural crustal abundance [1,31]. Most elements show EF values close to or above unity, whereas Be and some individual values of Ta, Sr, Sn, and Eu are depleted relative to PAAS in selected samples.
Table 3.
Enrichment Factors (EFs) of trace and rare earth elements in stream sediments.
4.4. Isotopic Composition of Stream Sediments
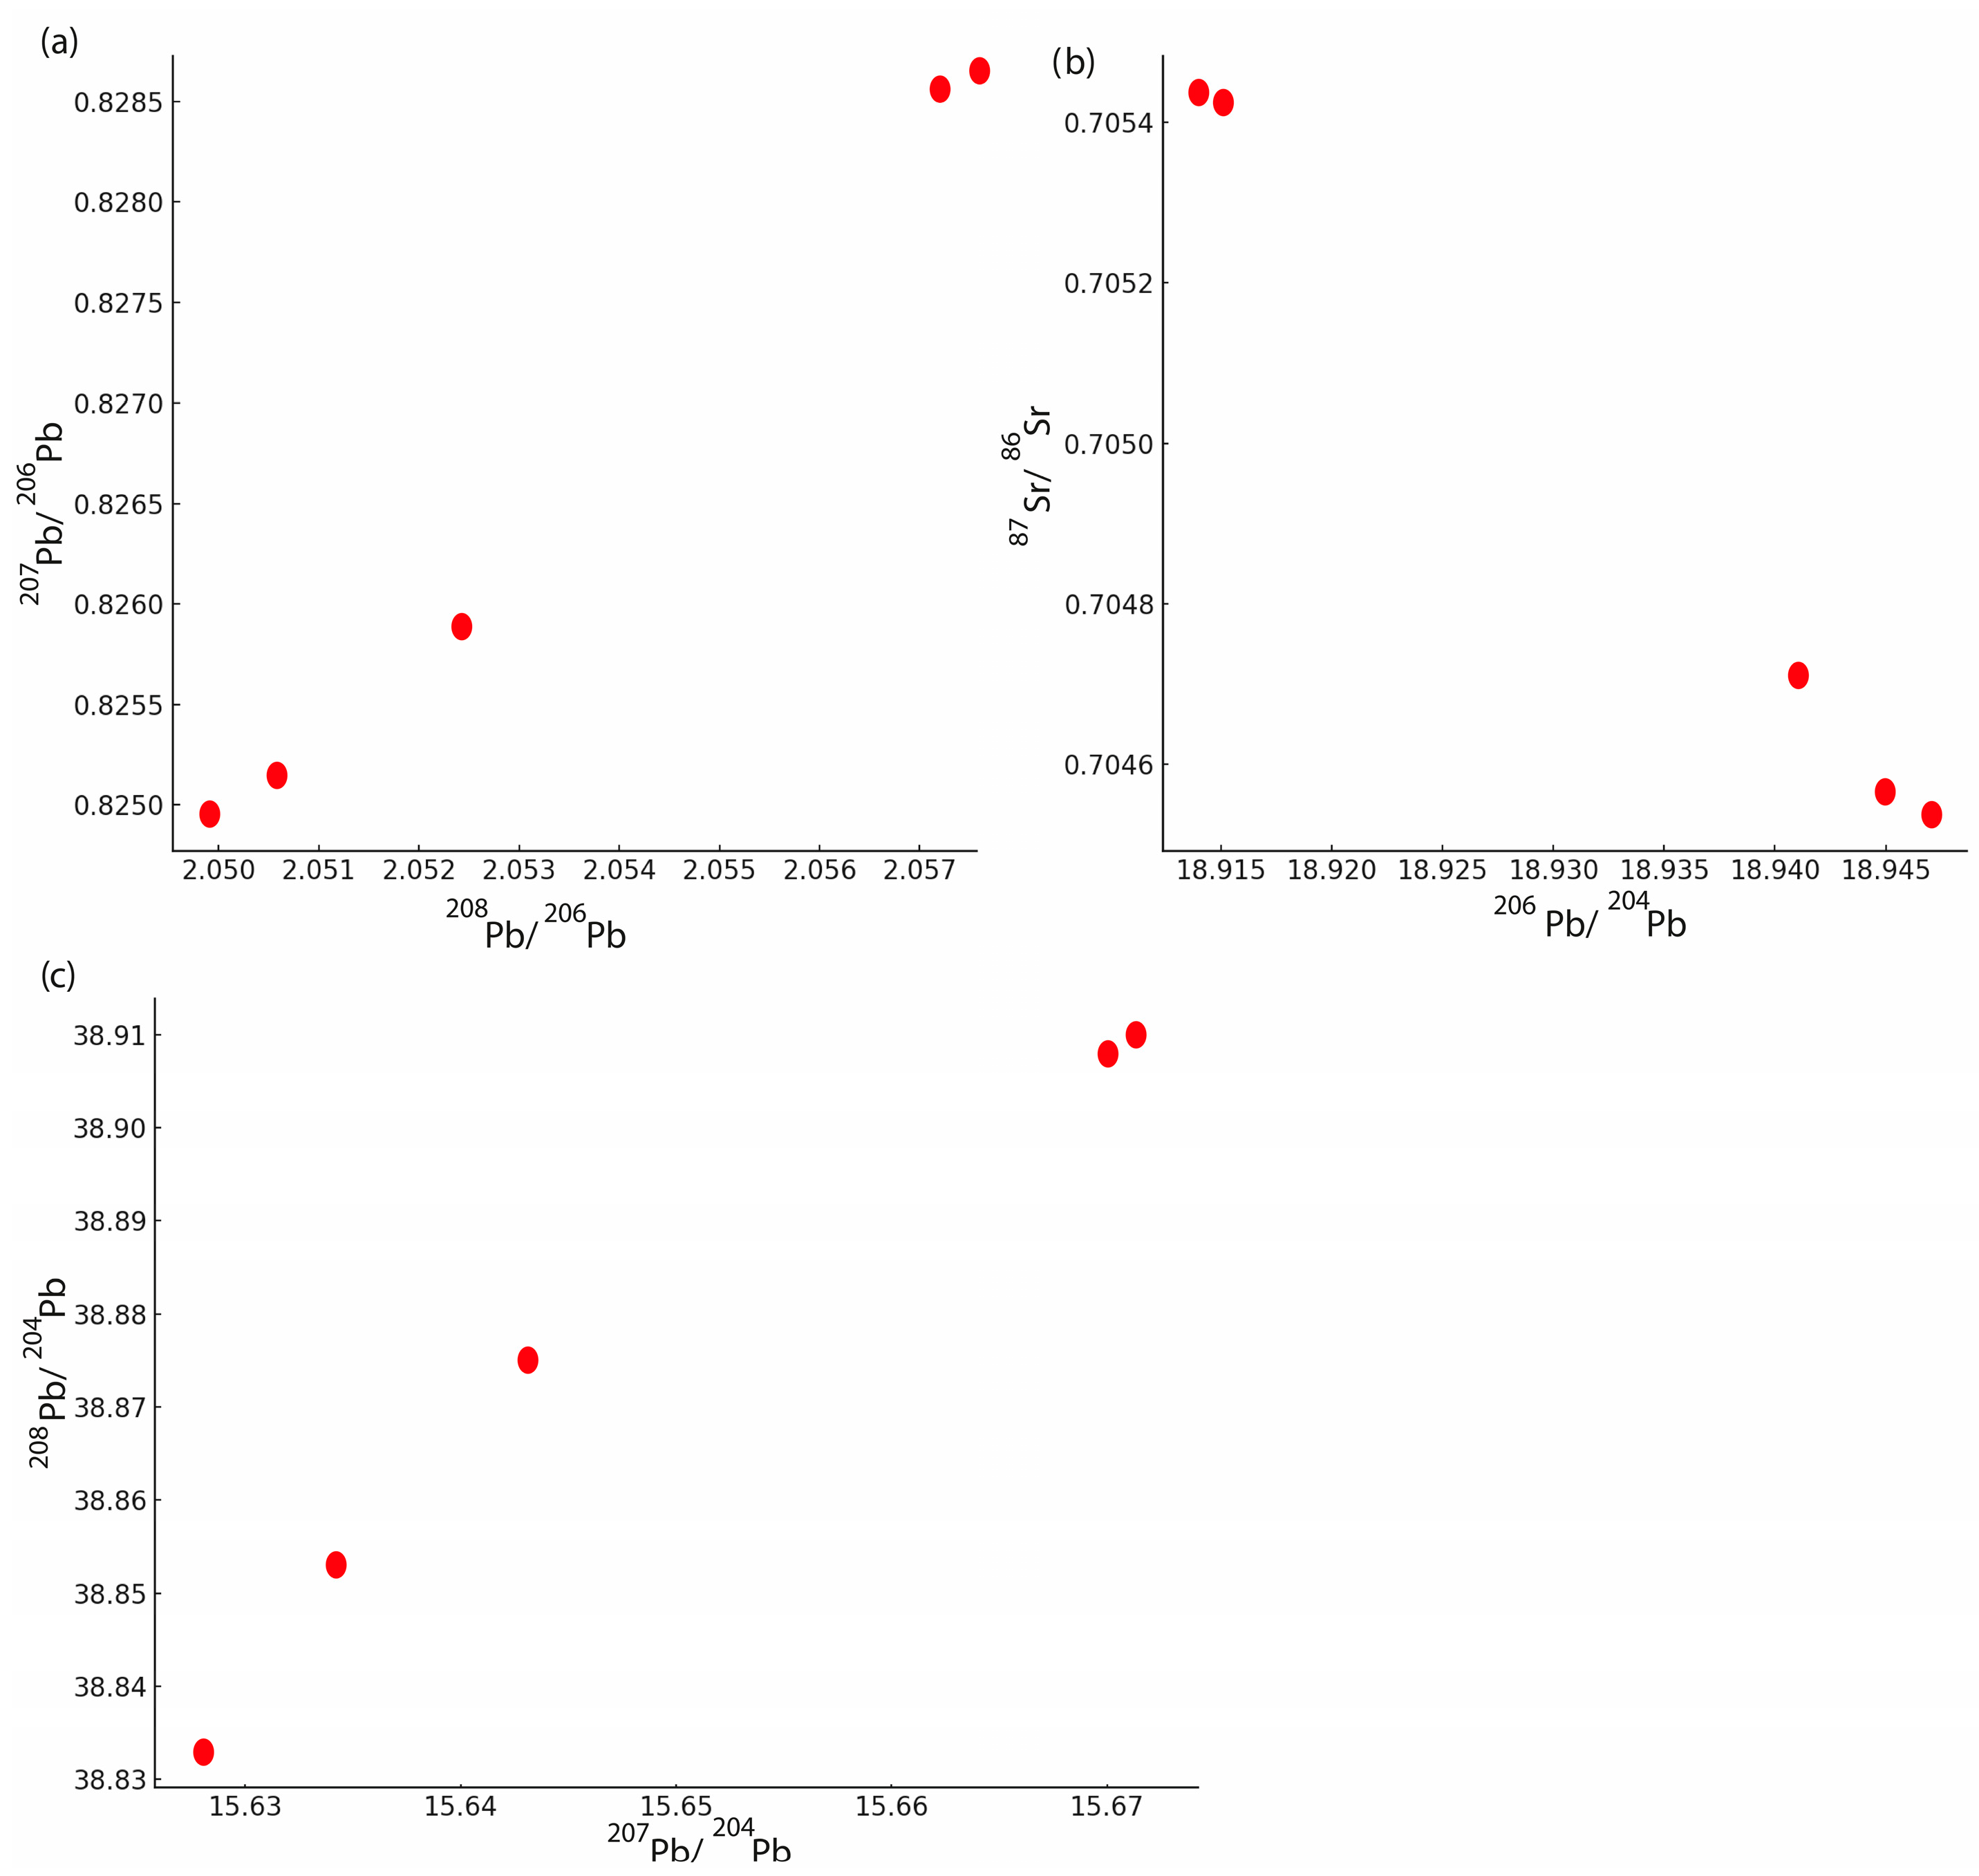
The strontium and lead isotope ratios of the stream sediment samples revealed minor but significant variations across the study area. The measured 87Sr/86Sr values ranged from 0.704537 to 0.705772, with consistent 84Sr/86Sr ratios (0.05646–0.05649) and stable ion signal intensities, indicating high analytical precision (Table 4). Lead isotopic ratios also showed a narrow range of variability, with 206Pb/204Pb values between 18.914 and 18.947, 207Pb/204Pb between 15.628 and 15.672, and 208Pb/204Pb between 38.833 and 38.910. Corresponding 207Pb/206Pb and 208Pb/206Pb ratios ranged from 0.82495 to 0.82855 and 2.0499 to 2.0572, respectively (Table 5).
Table 4.
Measured 87Sr/86Sr and corrected 84Sr/86Sr ratios, together with 88Sr signal intensities and two standard error (2SE) values, for the stream sediment samples.
Table 5.
208Pb/206Pb, 207Pb/206Pb, 208Pb/204Pb, 207Pb/204Pb, and 206Pb/204Pb ratios measured in the stream sediment samples.
The isotope data show that K12 has the highest 87Sr/86Sr ratio, whereas K15 is distinguished by comparatively less radiogenic Pb isotopic composition. Coupled Sr–Pb isotope plots revealed clustering among upstream samples and divergence in downstream locations. The isotopic data indicate spatial heterogeneity that may reflect differences in sediment sources or geochemical processes.
5. Discussion
5.1. Geochemical Implications of Trace Elements and Rare Earth Elements in Sediment Samples
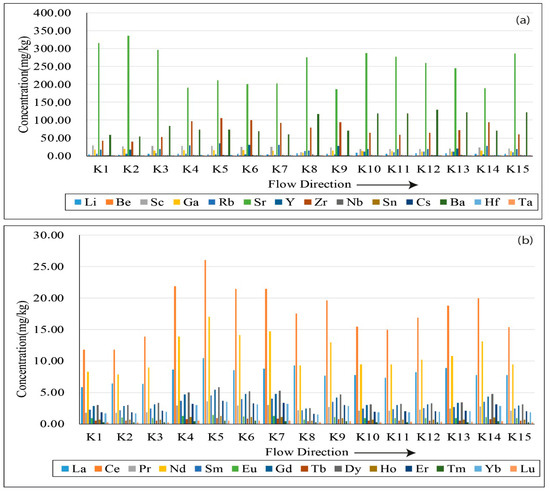
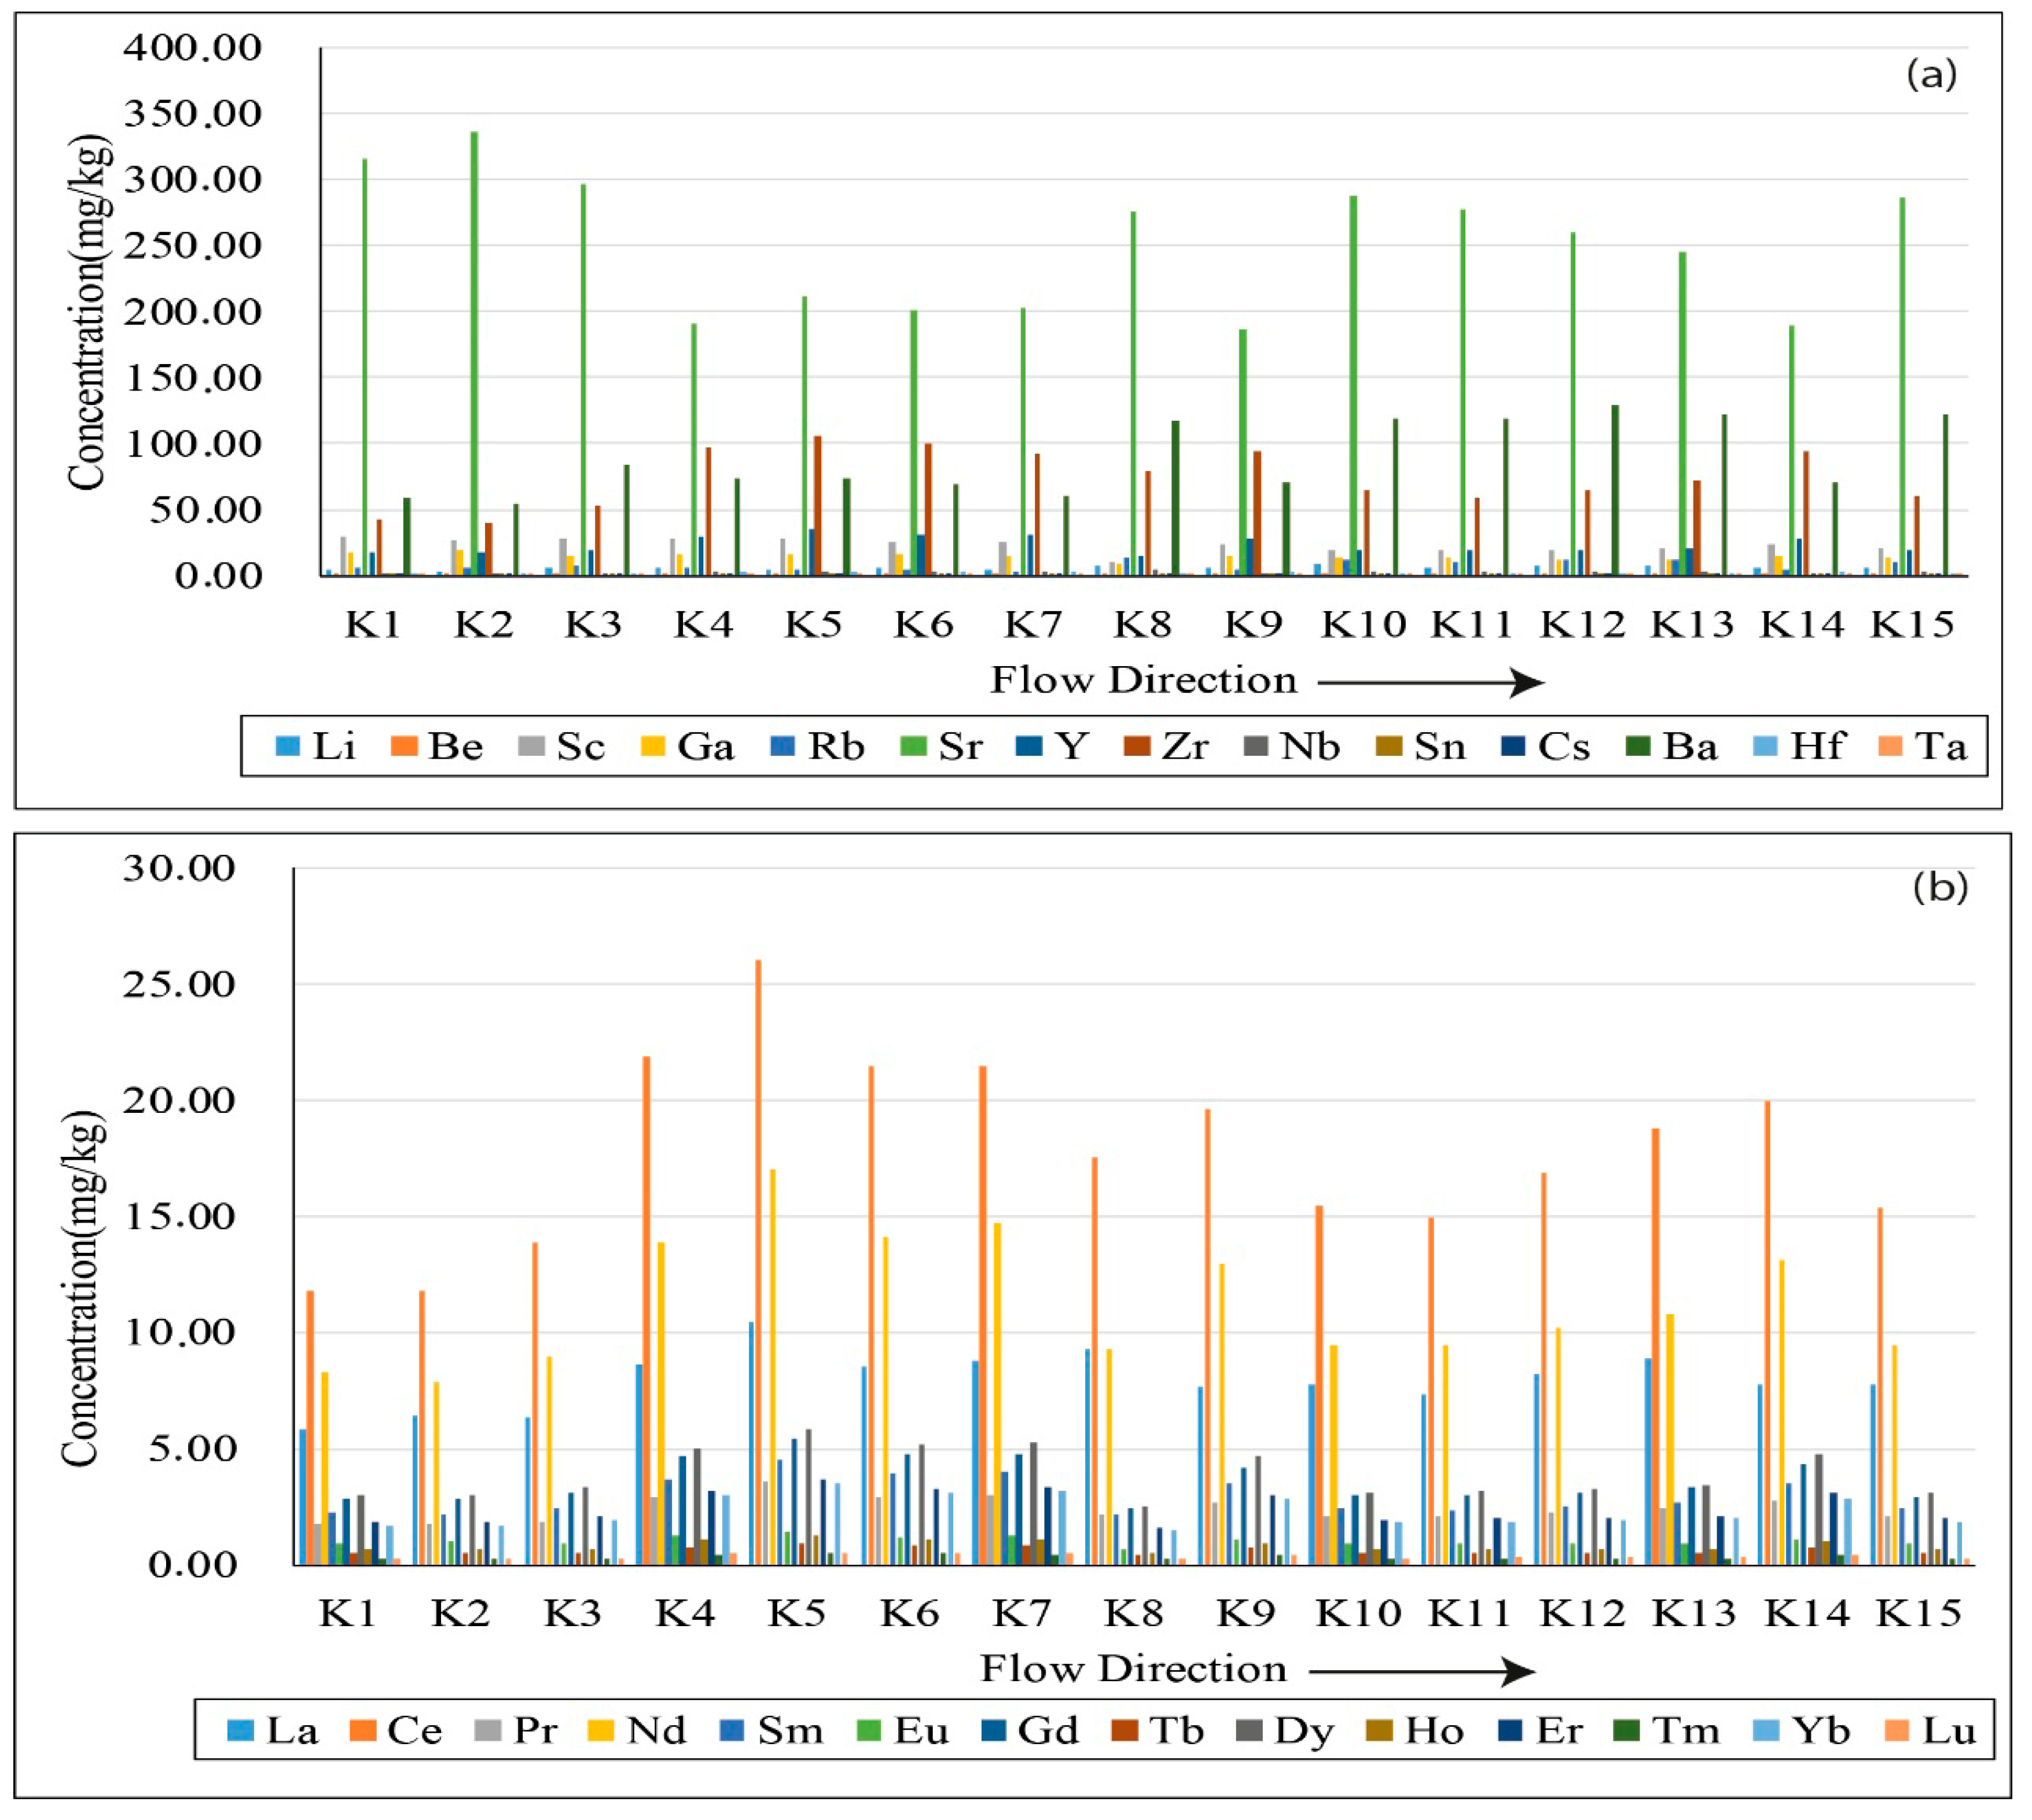
The levels of REEs and trace elements in stream sediment samples (K1 to K15) are shown in Figure 2, arranged in the direction of the downstream flow. In Figure 2a, Sr dominates the trace-element group, with markedly higher concentrations in most samples, particularly in K1, K2, K8, K10, and K11, exceeding 300 mg/kg. The elevated Sr concentrations are most plausibly attributed to the weathering of carbonate-rich lithologies in the catchment, although a minor contribution from agricultural inputs cannot be ruled out. Ba and Zr also exhibit relatively high concentrations, particularly in samples K8 and K13, suggesting input from felsic source rocks or heavy-mineral enrichment. Elements such as Li, Rb, Y, and Sc show moderate variability, whereas others, such as Be, Ga, Nb, and Hf, occur at much lower concentrations, typically below 10 mg/kg. Notably, the concentrations of several elements (Rb, Ba, and Zr) appear to increase slightly downstream (K8–K15), potentially indicating cumulative geogenic input or downstream enrichment.
Figure 2.
(a) Concentrations of trace elements. (b) Concentrations of rare earth elements in stream sediment samples (K1–K15) along the flow direction.
Figure 2b presents the distribution of rare earth elements. Light REEs are generally more enriched than heavy REEs, showing a typical LREE > HREE pattern consistent with upper continental crust signatures. Ce and Nd, in particular, exhibit the highest values among REEs, with peaks in samples K4–K6 and K13, indicating input of felsic material or anthropogenic REE sources such as industrial discharges. The relatively consistent pattern of REE concentrations across the samples (coupled with higher LREE values) suggests minimal fractionation during transport and a shared sediment source. However, local enrichment in some downstream samples may reflect lithological changes or external contributions.
The strong positive correlations among LREEs suggest a common mineralogical source, likely controlled by resistant accessory minerals such as monazite and allanite [32]. The high correlations between Li and HFSEs suggest that Li follows similar geochemical pathways and is hosted by minerals such as zircon and HFSE-enriched clay minerals [33,34]. The coherence of HFSEs further supports a detrital origin predominantly derived from felsic igneous or metamorphic source rocks [1]. Moderate correlations among alkaline earth elements and Rb suggest that these elements are primarily hosted in feldspar and mica and may have undergone similar geochemical processes, such as adsorption or ion exchange, during sediment transport [35]. The positive correlations among HREEs indicate uniform mineralogical sources or fractionation processes within the sediments. These elemental associations reflect the geochemical signature of the parent rocks with limited post-depositional mobility, providing insight into sediment provenance and depositional processes [36,37].
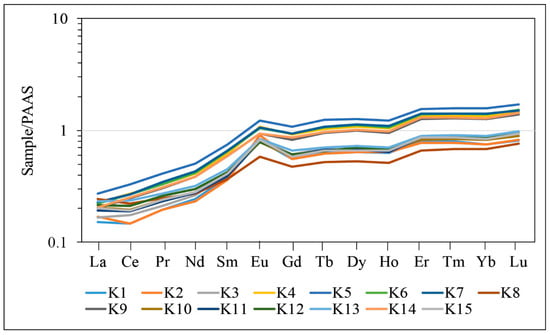
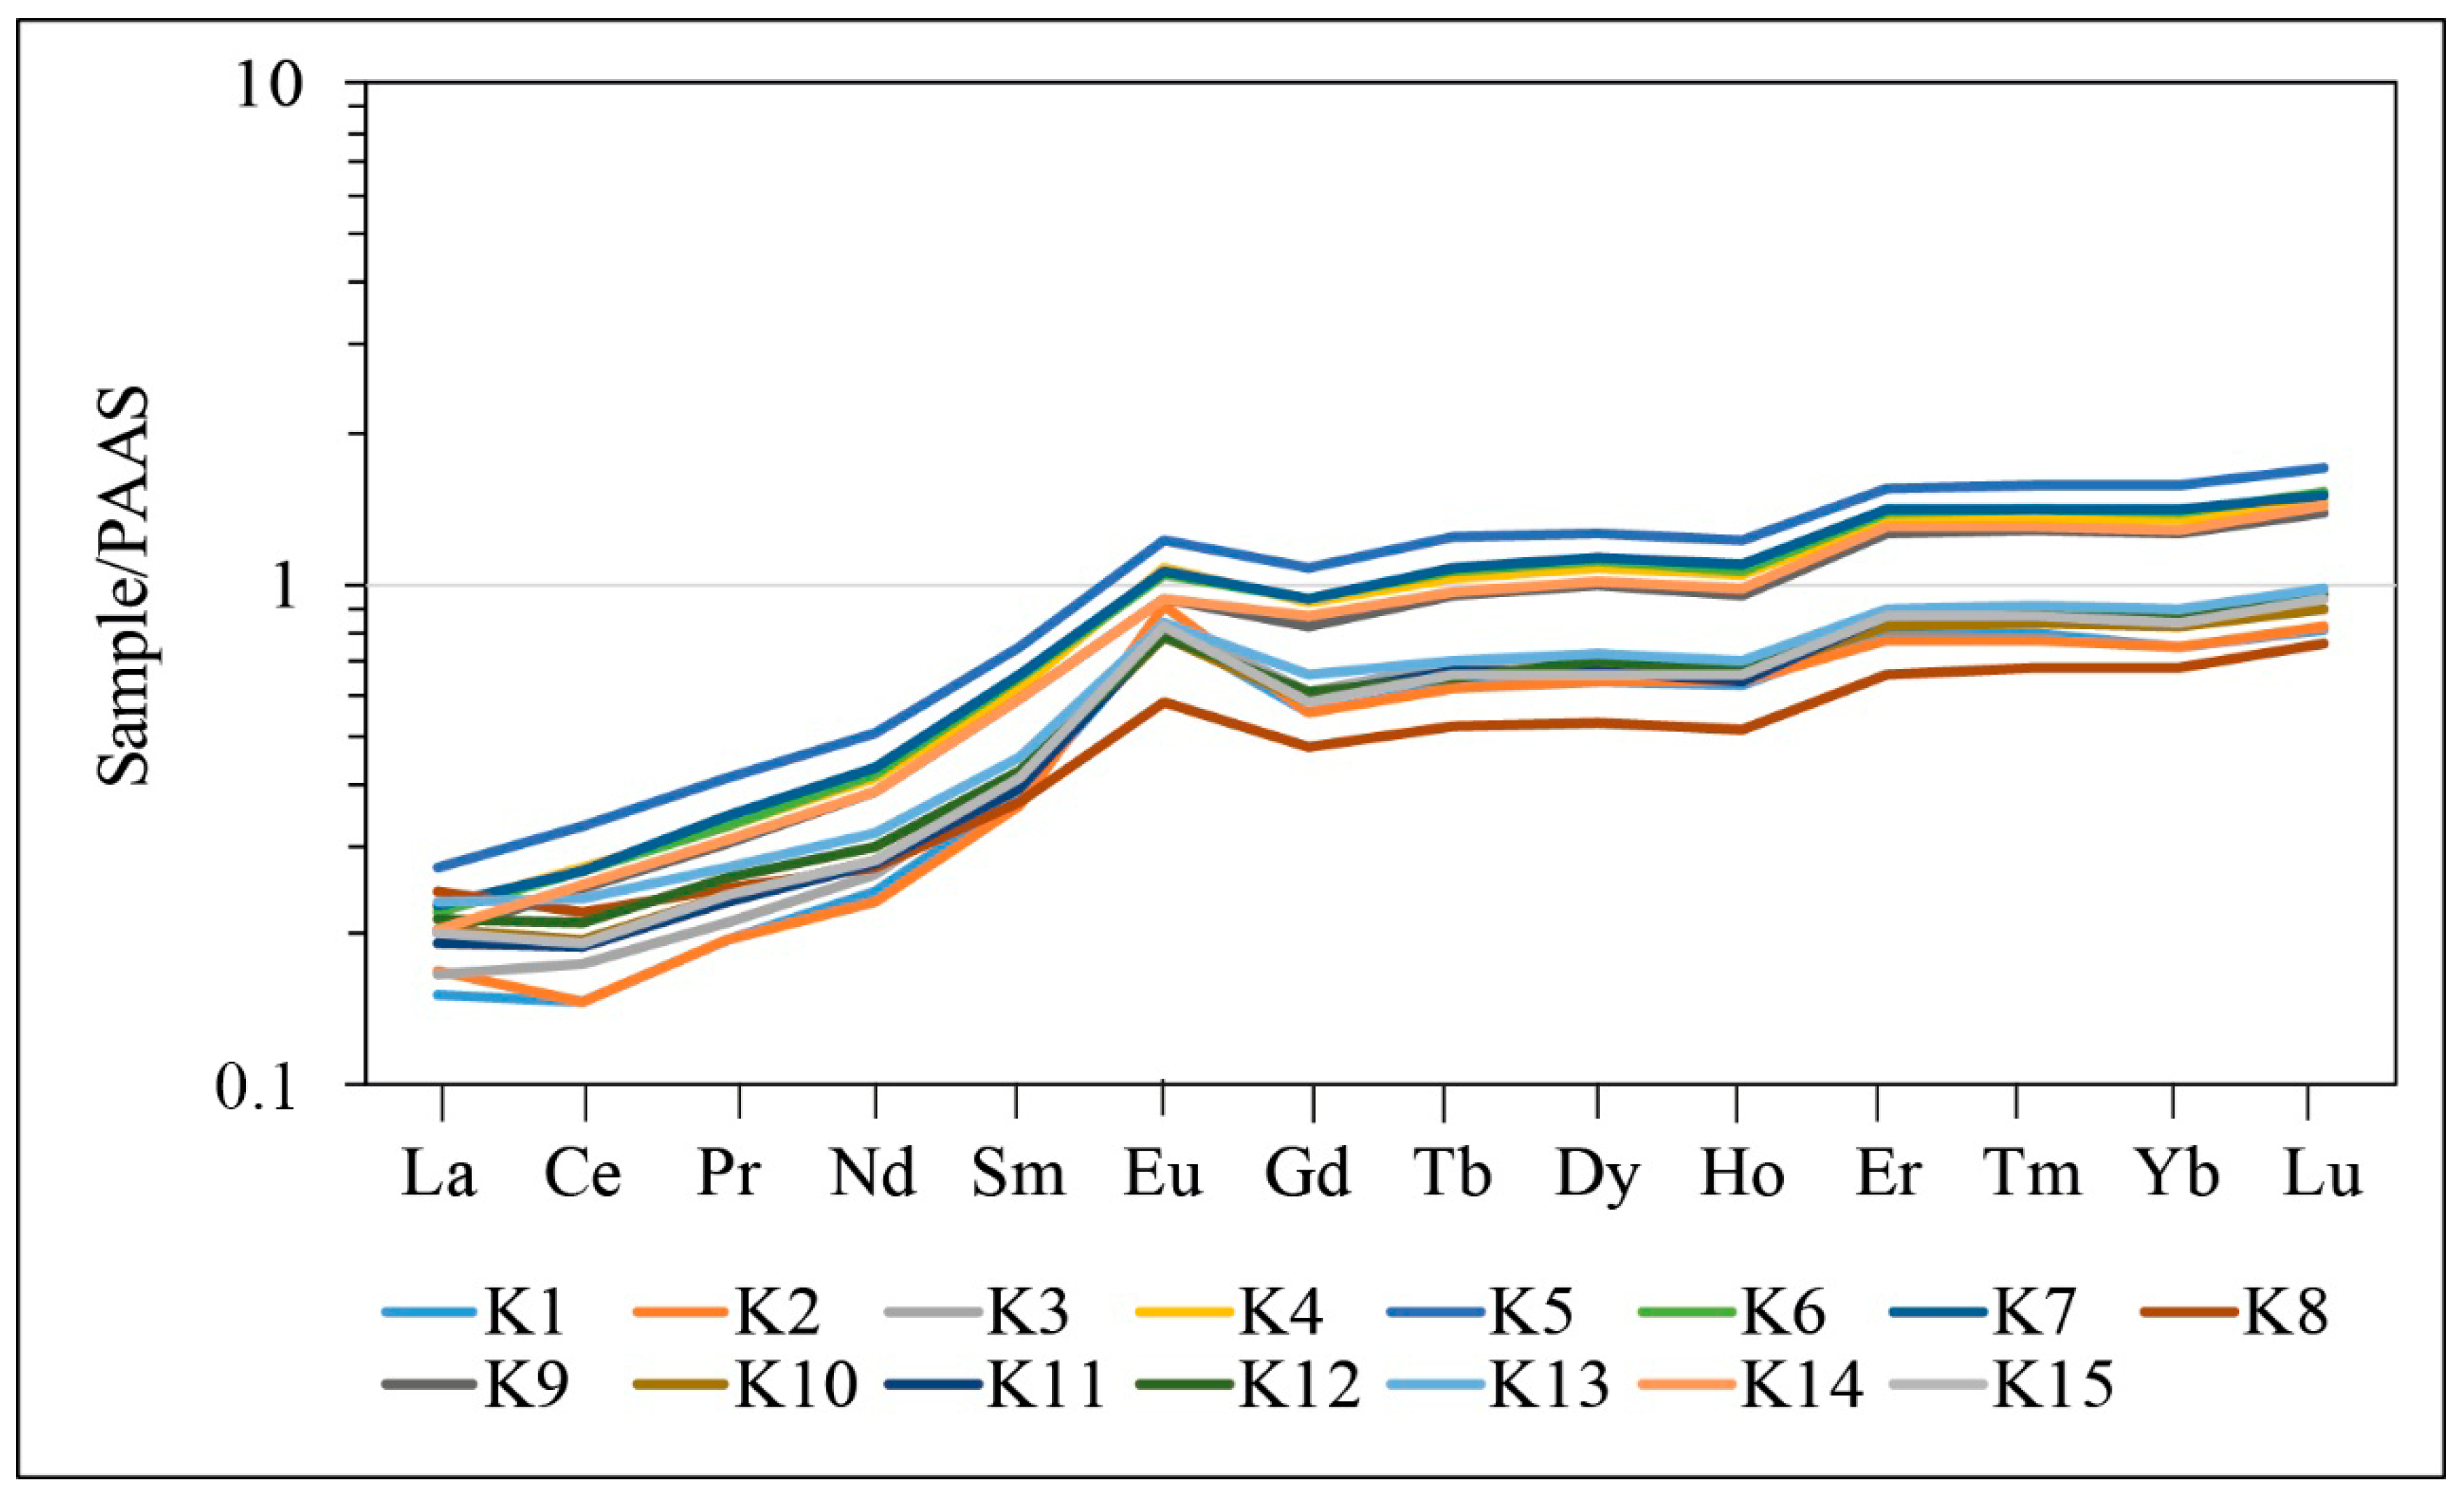
The Ce/Ce* and Eu/Eu* anomalies, calculated based on PAAS-normalised REE patterns, provide critical insights into the geochemical processes prevailing in the depositional environment (Figure 3). The Ce/Ce* anomaly reflects the redox sensitivity of Ce4+, commonly used to distinguish between oxic and anoxic conditions [2]. In this study, Ce/Ce* ratios range between 0.83 and 1.23, with most samples exhibiting values close to unity, suggesting minimal fractionation of Ce under predominantly oxidative conditions. The slight positive Ce anomalies observed in some samples may be related to Ce-bearing accessory minerals and possible analytical or normalisation effects, rather than to redox fluctuations alone [38].
Figure 3.
Rare Earth Element patterns normalised to PAAS.
Conversely, the Eu/Eu* anomaly is primarily influenced by the reduction in Eu3+ to Eu2+ under reducing conditions and its affinity for plagioclase and hydrothermal phases [39]. All samples display Eu/Eu* values greater than 1, indicating pronounced positive Eu anomalies. This suggests selective enrichment of Eu, possibly linked to plagioclase-derived detrital input and source-rock control. Sample K2 exhibits the highest Eu/Eu* ratio (2.01), implying a significant presence of Eu-rich phases at this stratigraphic level. Similarly, samples K1, K3, K6, and K10 also show elevated Eu anomalies (>1.6), supporting this interpretation.
In general, the Ce and Eu anomaly patterns suggest contributions from detrital and/or volcanic sources, as well as redox-related variations during sedimentation. The positive Eu anomalies most likely reflect feldspar-rich detrital input and source-rock control, whereas the subdued Ce anomalies indicate generally neutral to mildly reducing depositional conditions. In addition, Y/Ho ratios (26.92–28.87) are well below values typically associated with aqueous or hydrothermal fractionation (>36), indicating that the positive Eu anomalies are more consistent with lithological control and detrital input rather than hydrothermal processes [40]. In this context, the positive Eu anomalies may be attributable to contributions from plagioclase-bearing volcanic detritus, particularly from the mafic-to-intermediate rocks of the Maden Complex. Likewise, the LREE-enriched patterns may partly reflect the presence of accessory minerals such as zircon and apatite derived from more evolved lithologies and recycled sedimentary components of the Hazar Group. Thus, the observed REE signatures are consistent with the regional mineralogical framework of the main source units.
5.2. Enrichment Factor (EF) Evaluation and Geochemical Implications
Elements such as Li, Y, Zr, Nb, and the lanthanide series consistently exhibit EF values ranging approximately from 1.1 to above 2.5 across the K1–K15 samples (Table 3). This pattern suggests a significant deviation from average upper-continental crustal compositions, likely reflecting local geological processes such as volcanic input or selective mineralogical sorting during sediment deposition [41]. Li shows particularly high EF values (up to ~15 in sample K10), possibly related to weathering of Li-bearing minerals [42]. Elevated EF values for Zr and Nb also point toward input from felsic to intermediate igneous sources or heavy mineral concentration [43].
The consistent enrichment of the REE further supports a detrital contribution from REE-rich minerals such as monazite, xenotime, or allanite [44]. Positive Eu anomalies observed in EF values align with the presence of plagioclase feldspar and are consistent with prior isotope and geochemical studies in similar sedimentary environments [2,39].
The use of Sc as a reference element is appropriate given its typically low mobility and limited anthropogenic interference, providing a robust baseline for EF normalisation [1]. EF values below 1, as seen for Be and Cs in some samples. may indicate depletion relative to average shale or dilution effects from mineralogical variations.
5.3. Multivariate Statistical and Correlation Analysis
Correlation analysis was conducted to evaluate the relationships between trace elements and REE in the sediment samples (Table 2). Significant positive correlations (p < 0.05) among REEs such as La, Ce, and Nd suggest shared geochemical behaviour and common sources, likely associated with detrital accessory minerals such as monazite and allanite. Similarly, strong correlations among HFSEs, particularly Zr and Nb, indicate co-enrichment controlled by resistant heavy minerals such as zircon and rutile. In contrast, weak or negative correlations between certain trace elements and REEs may reflect differences in geochemical mobility or distinct sources influenced by local lithology or anthropogenic inputs [1,43].
5.4. Principal Component Analysis (PCA)
Principal Component Analysis (PCA) was applied to identify associations among elements. The first three principal components together explain approximately 85% of the total variance and are used here to interpret geochemical patterns descriptively. The PCA results highlight groupings of elements that may reflect common geochemical behaviour or source characteristics. High positive loadings of REEs and HFSEs characterise PC1. suggesting a common origin and similar geochemical control, likely linked to input from felsic igneous rocks and associated resistant mineral phases. PC2 exhibits strong loadings for Rb, Ba, and Sr, which may reflect a combination of clay-bound elements and possible surface inputs. PC3 is primarily influenced by Li and Cs, which may reflect localised mineralogical controls or site-specific geochemical conditions.
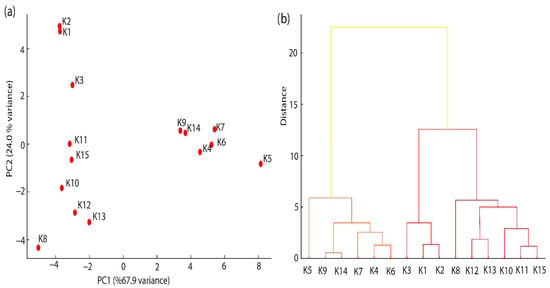
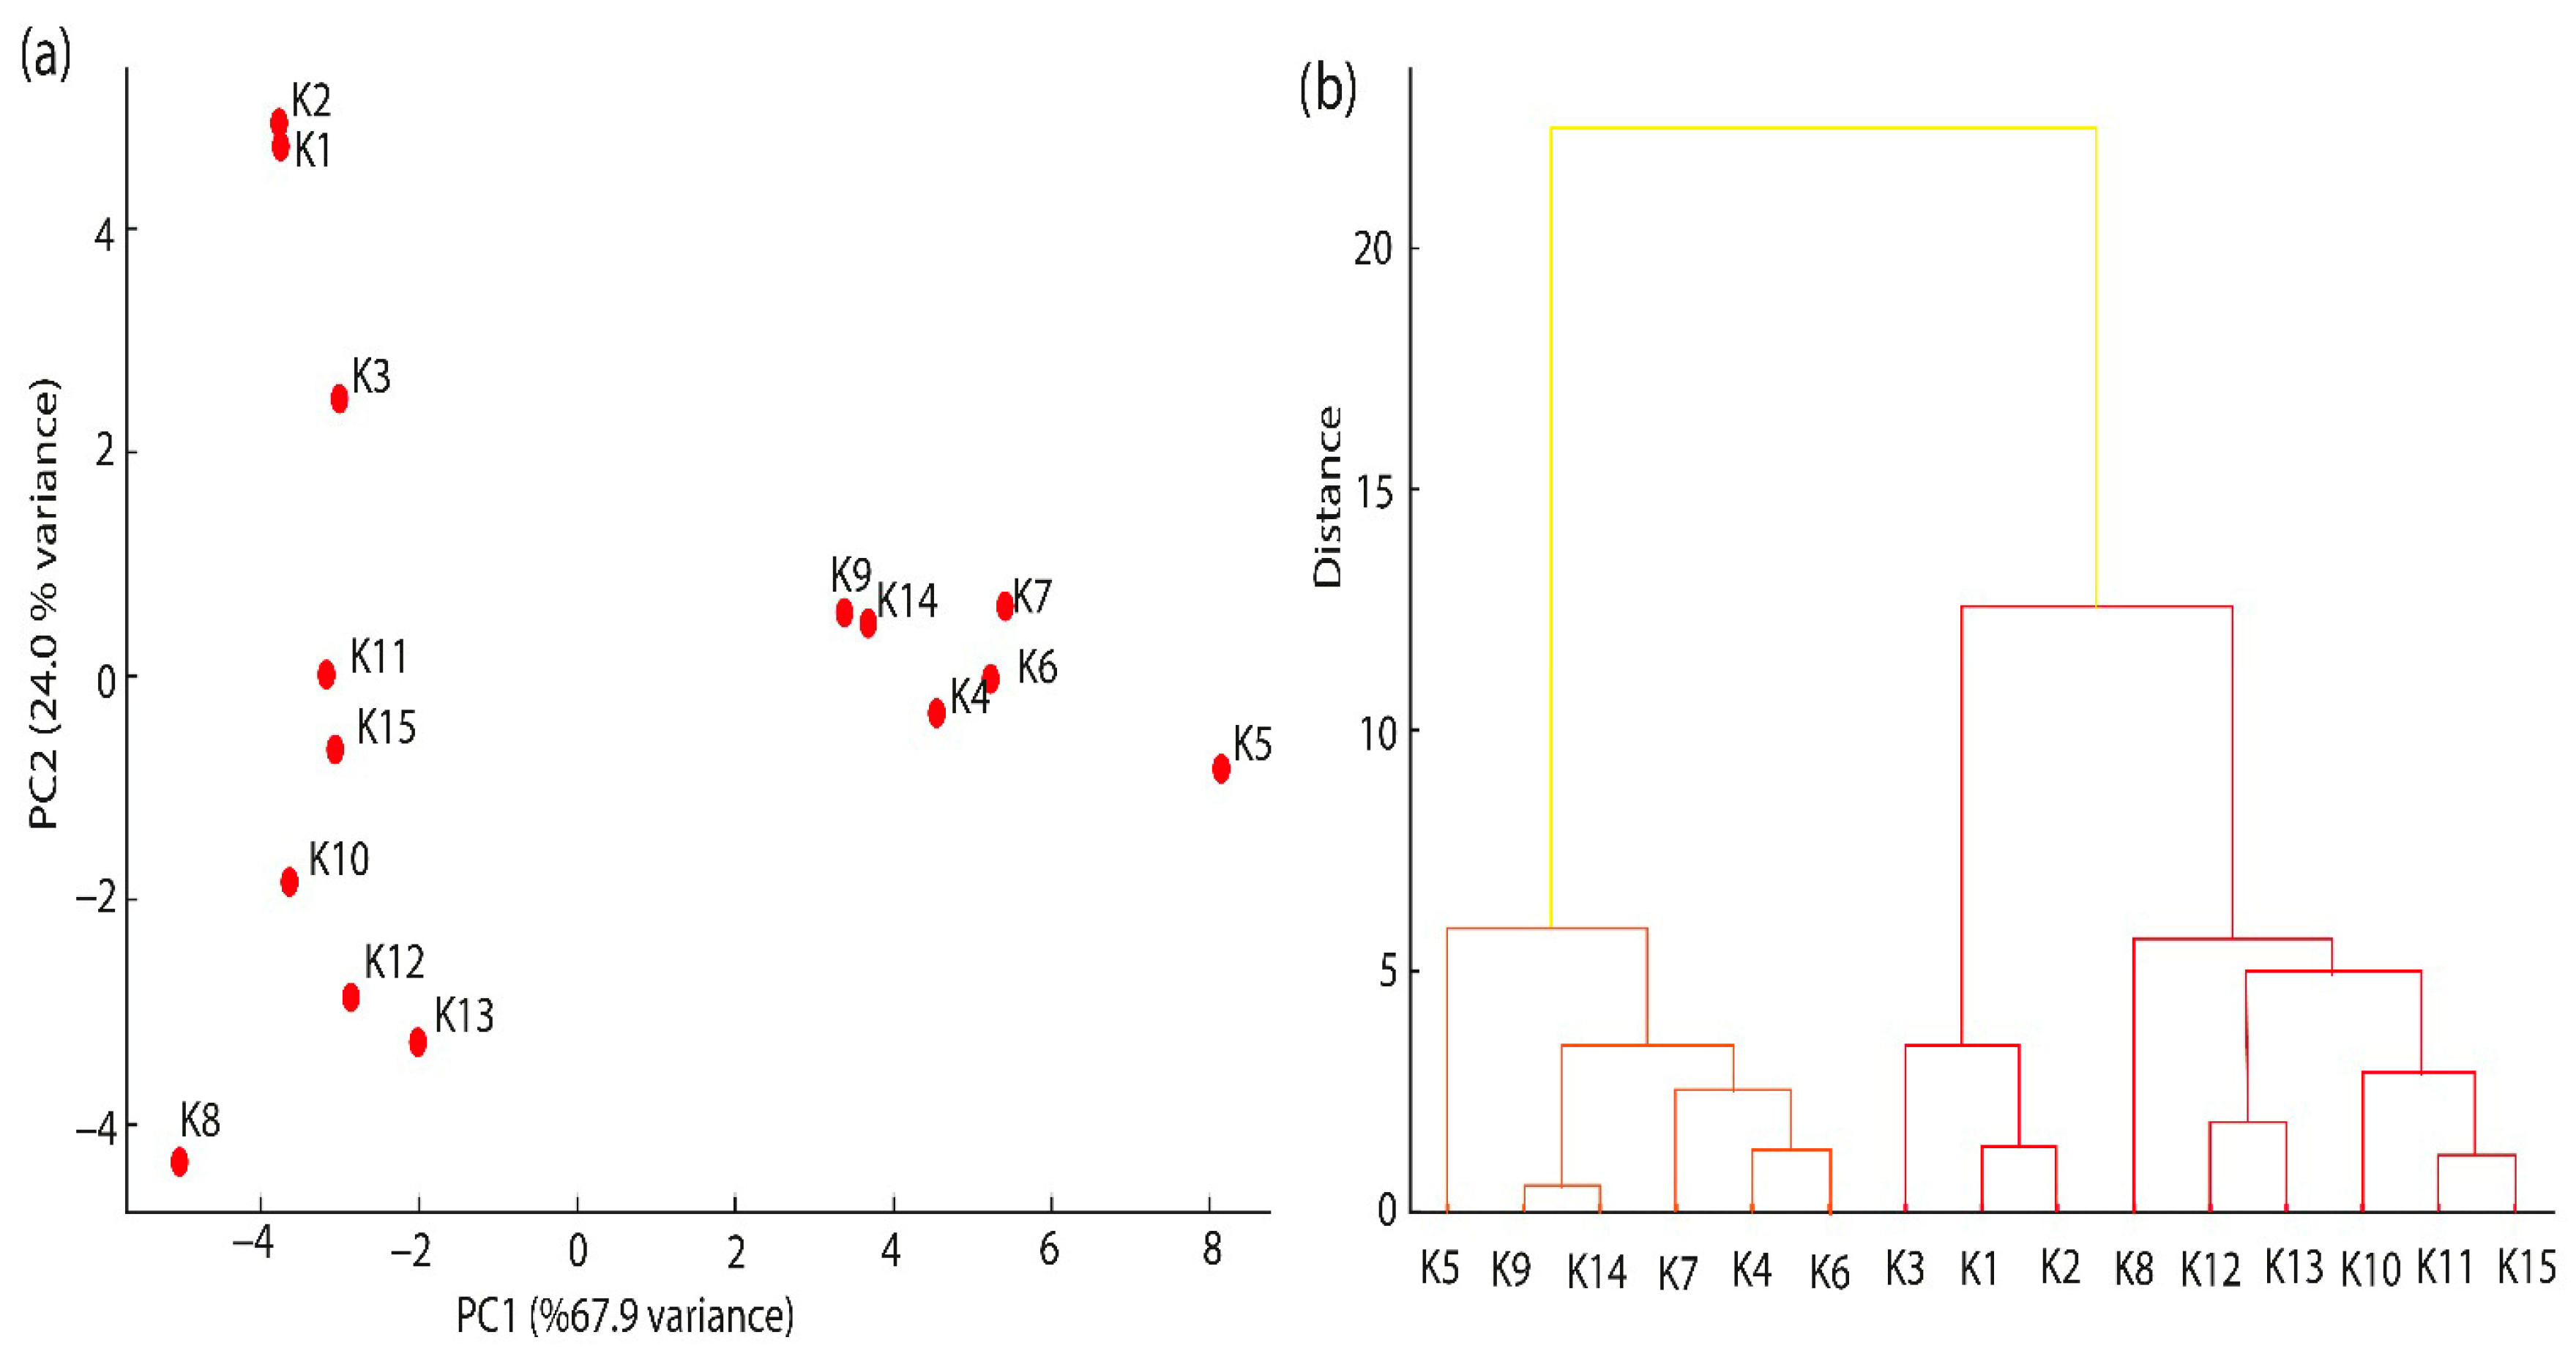
The PCA biplot (Figure 4a) shows the spatial grouping of elements along PC1 and PC2, highlighting distinct clusters composed of REEs-HFSEs and alkali–alkaline earth elements, respectively. These results align with previous studies that used PCA to differentiate natural from anthropogenic geochemical signatures.
Figure 4.
(a) PCA scatter plot showing the distribution of samples with respect to the first and second principal components (PC1 and PC2). (b) Dendrogram from hierarchical cluster analysis showing clustering of elements.
5.5. Hierarchical Cluster Analysis (HCA)
Hierarchical Cluster Analysis (HCA) was applied to the standardised elemental dataset to identify patterns in geochemical associations and sample groupings. The resulting dendrogram (Figure 4b) reveals two primary element clusters: Cluster 1 includes REEs and HFSEs, which are typically hosted in stable accessory minerals such as zircon and monazite. Cluster 2 comprises Rb, Ba, and Sr, elements commonly associated with clay fractions and mobile phases. indicative of different geochemical behaviour and potentially influenced by surface processes or pollution.
5.6. Strontium and Lead Isotope Geochemistry of Stream Sediments
5.6.1. Strontium Isotope Composition
The measured 87Sr/86Sr ratios of the stream sediment samples range from 0.704537 to 0.705772 (2SE, ±0.000007 to ±0.000010), indicating slight but meaningful isotopic heterogeneity among the sampling points (Table 4). The lowest ratio was observed in sample K7 (0.704537 ± 0.000008). The highest value was recorded in sample K12 (0.705772 ± 0.000007), suggesting a potential difference in lithological source or Sr mobility.
All samples exhibit relatively low 87Sr/86Sr ratios, which are characteristic of materials derived from mafic to intermediate volcanic rocks or young crustal sources, rather than older continental crusts that typically display more radiogenic Sr signatures (>0.710). Similar isotopic values have been reported in stream sediments of southern Kyushu, Japan, where samples derived from basaltic and andesitic rocks yielded 87Sr/86Sr ratios between 0.7040 and 0.7080 [43]. This supports the interpretation that the sediments in this study are predominantly sourced from less-evolved igneous lithologies, with minimal contributions from highly radiogenic continental crust.
Samples K5 (0.704565), K7 (0.704537), and K9 (0.704713) share very similar isotopic signatures, indicating a common source and minimal influence of chemical weathering. In contrast, samples K12 (0.705772) and K15 (0.705438) exhibit slightly more radiogenic compositions. This shift may reflect the presence of more evolved felsic lithologies in parts of the drainage basin, or it may indicate enhanced chemical weathering and leaching, which can preferentially remove radiogenic Sr from Rb-rich phases like feldspar and biotite [45].
The measured 84Sr/86Sr ratios remain stable across the dataset, ranging from 0.05646 to 0.05649, and confirm the analytical reliability and internal precision of the MC-ICP-MS measurements. Additionally, the ion signal intensities for 88Sr (ranging from 15.28 V to 21.77 V) reflect high-quality data acquisition and consistent Sr concentrations in the digested sediment samples.
In conclusion, the Sr isotope data suggest that the dominant source of Sr in the stream sediments is natural bedrock weathering, particularly of volcanic to intermediate lithologies. The absence of significantly radiogenic signatures (>0.710) points to a limited role for anthropogenic contamination. These findings align with recent studies of Sr isotopes in stream sediments and river waters across Europe and East Asia, which emphasise the effectiveness of Sr isotopes as provenance indicators and tracers of bedrock-sediment interactions [45,46].
5.6.2. Lead Isotope Composition and Source Characteristics
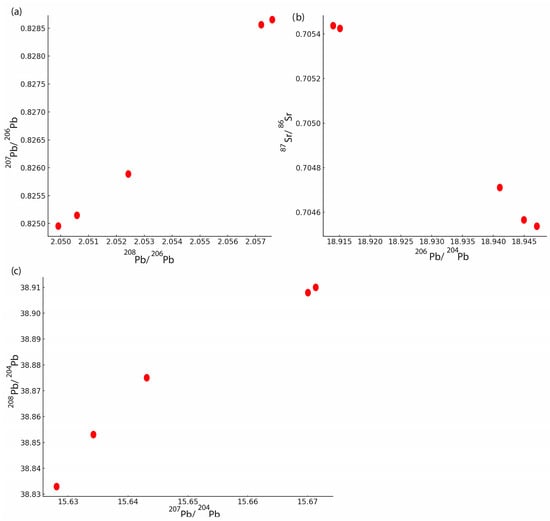
The Pb isotopic ratios of the stream sediment samples show limited but environmentally meaningful variation, with 206Pb/204Pb ranging from 18.914 to 18.947, 207Pb/204Pb ranging from 15.628 to 15.672, and 208Pb/204Pb ranging from 38.833 to 38.910 (Table 5). These values indicate a predominantly radiogenic Pb signature with subtle inter-sample differences that may reflect variations in source lithology or potential anthropogenic input. The 207Pb/206Pb ratios range between 0.82495 and 0.82855, and 208Pb/206Pb ratios between 2.0499 and 2.0572, showing a slight increase from samples K5 through K15 (Figure 5a). This trend could suggest the influence of multiple Pb sources, possibly including both geogenic and anthropogenic components. When compared with typical lead isotope fields from natural geogenic sources (crustal silicates or sulfide ores) and anthropogenic materials, the measured isotope ratios appear to be intermediate, which may indicate a mixed origin. In particular, the higher 208Pb/206Pb and 207Pb/206Pb values in sample K15 suggest limited downstream isotopic variation rather than a clearly identifiable anthropogenic Pb source. In general, the Pb isotopic composition of the stream sediments suggests a dominantly lithogenic origin with possible contributions from anthropogenic sources, particularly in downstream locations. These results highlight the importance of isotopic fingerprinting in tracing lead sources in complex environmental matrices.
Figure 5.
(a) 207Pb/206Pb vs. 208Pb/206Pb diagram of stream sediments; (b) 87Sr/86Sr vs. 206Pb/204Pb diagram of stream sediments; (c) 208Pb/204Pb vs. 207Pb/204Pb diagram of stream sediments.
Pb sources are further illustrated by the plot of 208Pb/204Pb versus 207Pb/204Pb, a well-established method for distinguishing Pb derived from thorogenic (232Th) and uranogenic (235U) decay chains [47,48]. The samples form a relatively tight linear array, which may reflect mixing between isotopically similar lithogenic and possibly non-lithogenic components. The position of sample K15, with the highest values for both 208Pb/204Pb and 207Pb/204Pb, suggests limited downstream isotopic variation in the urban-influenced sector. However, the absence of substantial deviation from a linear trend across all samples suggests either a well-mixed sediment system or isotopically similar sources. Regional transport and dilution processes may also contribute to homogenising the Pb isotopic signal (Figure 5c). The Pb isotope data indicate limited downstream isotopic variation in urban-influenced sediments, but do not allow definitive discrimination among specific Pb sources.
5.7. Coupled Sr–Pb Isotope Relationships
To further investigate source characteristics, a bivariate plot of 87Sr/86Sr versus 206Pb/204Pb was constructed (Figure 5b). This integrative approach leverages the lithological sensitivity of Sr isotopes and the source-tracing potential of Pb isotopes. Samples K5, K7, and K9 plot closely together, reinforcing the interpretation of a shared lithogenic origin, likely tied to mafic-to-intermediate volcanic or sedimentary source rocks.
In contrast, sample K15 shows a relatively high 87Sr/86Sr ratio (0.705438) but a comparatively less radiogenic 206Pb/204Pb ratio (18.914), suggesting isotopic decoupling. This decoupling may reflect mixing between isotopically distinct lithological sources and/or differential weathering of Sr- and Pb-hosting minerals during weathering and sediment transport. However, this interpretation remains tentative given the limited isotope dataset.
5.8. Integrated Interpretation of Isotopic and Elemental Geochemistry
The integration of Sr and Pb isotopic data with REE and trace-element concentrations provides a more comprehensive understanding of sediment provenance, geochemical behaviour, and potential non-lithogenic influences along the studied stream system.
Samples with relatively unradiogenic 87Sr/86Sr values (K5, K7, and K9, ranging between 0.704537 and 0.704713) are geochemically characterised by low-to-moderate EF values for Li, Zr, and REEs. These samples also exhibit subdued Ce/Ce* anomalies and moderate Eu/Eu* values, consistent with derivation from mafic-to-intermediate volcanic lithologies and limited post-depositional alteration. Their tight clustering in both PCA and Sr–Pb isotope biplots suggests a common, dominantly lithogenic source with limited evidence of non-lithogenic modification. These findings align with the local presence of basaltic to andesitic volcanic rocks within the regional geology.
In contrast, downstream samples such as K12 and K15 show slightly more radiogenic 87Sr/86Sr ratios (up to 0.705772) and elevated 208Pb/204Pb and 207Pb/204Pb ratios. These samples also correspond to the highest EF values for REEs (particularly Eu, Gd, and Tb) and for trace elements such as Li and Nb. Moreover, sample K15, located within the urban-influenced zone, exhibits the highest Eu/Eu* anomaly (1.89) and the strongest Li enrichment (EF~15), further supporting the presence of geochemically distinct inputs. This spatial and compositional pattern may reflect an increased contribution from evolved lithologies and prolonged weathering, rather than a clearly demonstrable anthropogenic input.
The decoupling observed in K15 between moderately radiogenic Sr (0.705438) and less radiogenic Pb (206Pb/204Pb = 18.914) may indicate mixing of isotopically distinct sources, such as felsic detritus and a possible non-lithogenic Pb contribution. Similar patterns have been reported in catchments where geological and anthropogenic Pb signatures co-occur. The positive correlation between Pb isotopic ratios and EF values of certain REEs and HFSEs further supports the idea of mixed origin.
Additionally, the linear array of Pb isotopic data in the 208Pb/204Pb vs. 207Pb/204Pb diagram implies binary mixing between two end-member sources: a radiogenic (possibly non-lithogenic) and a less radiogenic (crustal) component. The strong grouping of samples K5–K9 in both isotope and PCA space further confirms lithogenic dominance in upstream sectors, while divergence in downstream locations points to external inputs.
These integrated observations suggest that Sr–Pb isotopic systems primarily reflect bedrock lithology, while also recording limited geochemical variability when interpreted alongside EF data and REE behaviour. Such coupling of isotopic and elemental tracers enhances the discrimination of natural and anthropogenic sources in complex environmental matrices, reinforcing the importance of multi-proxy geochemical approaches for sediment provenance and pollution studies.
These interpretations should, however, be considered within the scope of the present dataset. Sampling was conducted on a single day in July 2024 under low-flow conditions and mainly reflects dry-season surface sediments, while the 0–5 cm sampling depth and the isotope subset (five representative samples) limit the results to first-order spatial interpretation.
The results address the main objectives of the study. First, the geochemical baseline of the stream sediments is characterised by the observed trace element, REE, and isotopic compositions, which largely reflect the lithological characteristics of the catchment. Second, the combined elemental, statistical, and isotopic data indicate that lithogenic control is dominant, with only limited evidence for possible local non-lithogenic influences. Third, the spatial variations observed along the rural–transitional–urban transect indicate downstream changes in sediment composition and element enrichment.
6. Conclusions
Integrated geochemical, statistical, and isotopic data indicate that the stream sediments draining into Keban Dam Lake are controlled predominantly by local lithology and bedrock weathering. Enrichment in Li, Zr, Nb, and REEs reflects contributions from felsic to intermediate source rocks and resistant accessory minerals such as zircon and monazite. Positive Eu anomalies in most samples are mainly associated with plagioclase-rich detrital input and lithological control. PCA and HCA reveal clear spatial geochemical variability and suggest that, although lithogenic processes dominate, limited non-lithogenic influences may occur locally. Sr and Pb isotope compositions support this interpretation and indicate that downstream sample K15 shows slight geochemical variation relative to the upstream sediments, while remaining consistent with dominant lithogenic control. The results also provide a useful basis for environmental management strategies focused on sediment monitoring, source control, and protecting water quality in the Keban Dam Lake catchment.
Funding
This work was funded by the Fırat University Scientific Research Projects Coordination Unit (FÜBAP) of Fırat University, Elazığ/Türkiye, for its financial support (No MF.26.07 and MF.25.137).
Institutional Review Board Statement
Not applicable.
Informed Consent Statement
Not applicable.
Data Availability Statement
The data presented in this study are available in the article.
Conflicts of Interest
The author declares no conflicts of interest.
References
- Taylor, S.R.; McLennan, S.M. The Continental Crust: Its Composition and Evolution; Blackwell Scientific Publications: Oxford, UK, 1985. [Google Scholar]
- Elderfield, H.; Upstill Goddard, R.; Sholkovitz, E.R. The rare earth elements in rivers, estuaries, and coastal seas and their significance to the composition of ocean waters. Geochim. Cosmochim. Acta 1990, 54, 1549–1555. [Google Scholar] [CrossRef] [Scilit]
- Saydam Eker, Ç.; Demirkol Kılıç, E. Geochemistry of Çoruh River bed sediments in NE Turkey: Implications in weath-ering–sedimentary cycle, provenance, and metal pollution. Geochem. Int. 2018, 56, 579–600. [Google Scholar] [CrossRef] [Scilit]
- Öztürk, H.; Hanilçi, N.; Altuncu, S.; Kasapçı, C. Rare earth element (REE) resources of Turkey: An overview of their characteristics and origin. Bull. Min. Res. Exp. 2019, 159, 129–143. [Google Scholar]
- Kalender, L.; Çiçek Uçar, S. Assessment of metal contamination in sediments in the tributaries of the Euphrates River using pollution indices and the determination of the pollution source, Turkey. J. Geochem. Explor. 2013, 134, 73–84. [Google Scholar] [CrossRef] [Scilit]
- Ouchir, N.; Ben Aissa, L.; Boughdiri, M.; Aydi, A.W. Assessment of heavy metal contamination status in sediments and identification of pollution source in Ichkeul Lake and rivers ecosystem, northern Tunisia. Arab. J. Geosci. 2016, 9, 539. [Google Scholar] [CrossRef] [Scilit]
- Kalender, L.; Aytimur, G. REE geochemistry of Euphrates River, Turkey. J. Chem. 2016, 2016, 1012021. [Google Scholar] [CrossRef] [Scilit]
- Hatipoğlu Temizel, E.; Gültekin, F.; Fırat Ersoy, A. Major, trace, and rare earth element geochemistry of the Ayder and İkizdere (Rize, NE Turkey) geothermal waters: Constraints for water–rock interactions. Geothermics 2020, 86, 101810. [Google Scholar] [CrossRef] [Scilit]
- Suroğlu, M.; Kalender, L.; Kara, H. Gorgu Pb-Zn Yatağı Civarındaki Maden Atıklarının Yuzey ve Yeraltı Sularına Etkisi (Malatya-Türkiye). Osman. Korkut Ata Univ. Fen Bilim. Enst. Derg. 2021, 4, 283–303. [Google Scholar] [CrossRef] [Scilit]
- Kalender, L.; Kara, H. Evaluation of metal contamination by natural background and average Earth’s crust values in the Inci Stream sediments around chromite deposits in Guleman (Alacakaya–Elazığ), Turkey. Afyon Kocatepe Univ. J. Sci. Eng. 2023, 23, 1056–1071. [Google Scholar]
- Kara, H. Geochemical assessment of potentially toxic elements in urban stream sediments draining into the Keban Dam Lake, Turkey. Appl. Sci. 2025, 15, 7565. [Google Scholar] [CrossRef] [Scilit]
- Şengör, A.M.C.; Yılmaz, Y. Tethyan evolution of Turkey: A plate tectonic approach. Tectonophysics 1981, 75, 181–204. [Google Scholar] [CrossRef] [Scilit]
- Robertson, A.H.F.; Ustaömer, T. Tectonic evolution of the eastern Mediterranean region: From subsidence to collision. In Sedimentary Basin Tectonics from the Black Sea and Caucasus to the Arabian Platform; Sosson, M., Kaymakçı, N., Stephenson, R.A., Bergerat, F., Eds.; Geological Society: London, UK, 2009; Volume 340, pp. 281–311. [Google Scholar]
- Sar, A.; Ertürk, M.A.; Rizeli, M.E. Genesis of Late Cretaceous intra-oceanic arc intrusions in the Pertek area of Tunceli Province, eastern Turkey, and implications for the geodynamic evolution of the southern Neo-Tethys: Results of zircon U–Pb geochronology and geochemical and Sr–Nd isotopic analyses. Lithos 2019, 350–351, 105263. [Google Scholar]
- Ertürk, M.A.; Sar, A.; Rizeli, M.E. Petrology, zircon U–Pb geochronology and tectonic implications of the A1-type intrusions: Keban region, eastern Turkey. Geochemistry 2022, 82, 125882. [Google Scholar] [CrossRef] [Scilit]
- Perinçek, D. The geology of Hazro–Korudağ–Çüngüş–Maden–Ergani–Hazar–Elazığ–Malatya area. In Guide Book; Türkiye Jeoloji Kurumu: Ankara, Turkey, 1979. [Google Scholar]
- Yılmaz, Y. Southeast Anatolian Orogenic Belt revisited (geology and evolution). Can. J. Earth Sci. 2019, 56, 1163–1180. [Google Scholar] [CrossRef] [Scilit]
- Kara, H.; Sağıroğlu, A. Keban ve Malatya Metamorfitleri’ne ait organik madde içeren kayaçların iz ve nadir toprak element jeokimyası. Fırat Univ. Fen Bilim. Derg. 2018, 30, 1–10. [Google Scholar]
- Ertürk, M.A.; Kara, H.; Sar, A.; Yilmaz, I.; Aysal, N. Geochronology and petrogenesis of the Early Miocene felsic dykes: New evidence for initiation of post-collisional magmatism in the SW Malatya–Eastern Anatolia (Turkey). Geol. Carpath. 2023, 74, 245–260. [Google Scholar] [CrossRef] [Scilit]
- Parlak, O.; Rızaoğlu, T.; Bağcı, U.; Karaoğlan, F.; Höck, V. Tectonic significance of the geochemistry and petrology of ophi-olites in Southeast Anatolia, Turkey. Tectonophysics 2009, 473, 173–187. [Google Scholar] [CrossRef] [Scilit]
- Bingöl, A.F.; Beyarslan, M.; Lin, Y.-C.; Lee, H.-Y. Geochronological and geochemical constraints on the origin of the South-east Anatolian ophiolites, Turkey. Arab. J. Geosci. 2018, 11, 569. [Google Scholar] [CrossRef] [Scilit]
- Ertürk, M.A. Geochronology and petrology of Late Cretaceous subduction-related volcanics from Elazığ, SE Türkiye: Insights into deciphering petrogenesis and magma generation processes. Geochemistry 2025, 85, 126234. [Google Scholar] [CrossRef] [Scilit]
- Ertürk, M.A.; Beyarslan, M.; Chung, S.-L.; Lin, T.-H. Eocene magmatism (Maden Complex) in the Southeast Anatolian Oro-genic Belt: Magma genesis and tectonic implications. Geosci. Front. 2018, 9, 1829–1847. [Google Scholar] [CrossRef] [Scilit]
- MTA. Magmatic Rocks Map of Turkey; General Directorate of Mineral Research and Exploration: Ankara, Turkey, 2013. [Google Scholar]
- Yazgan, E.; Chessex, R. Geology and tectonic evolution of the southeastern Taurides in the region of Malatya. Turk. Assoc. Petrol. Geol. Bull. 1991, 3, 1–42. [Google Scholar]
- Romero, A.; Gonzalez, I.; Galan, E. Trace elements absorption by citrus in a heavily polluted mining site. J. Geochem. Explor. 2012, 113, 76–85. [Google Scholar] [CrossRef] [Scilit]
- Sutherland, R.A. Bed sediment-associated trace metals in an urban stream, Oahu, Hawaii. Environ. Geol. 2000, 39, 611–627. [Google Scholar] [CrossRef] [Scilit]
- Sterckeman, T.; Douay, F.; Baize, D.; Fourrier, H.; Proix, N.; Schvartz, C. Trace elements in soil developed in sedimen-tary materials from Northern France. Geoderma 2006, 136, 912–929. [Google Scholar] [CrossRef] [Scilit]
- Buhiyan, M.A.H.; Parvez, L.; Islam, M.A.; Dampare, S.B.; Suzuki, S. Heavy metal pollution of coal mine affected agri-cultural soils in the northern part of Bangladesh. J. Hazard. Mater. 2010, 173, 384–392. [Google Scholar] [CrossRef] [Scilit]
- Sakan, S.M.; Djordjevic, D.S.; Manojlovic, D.D.; Polic, P.S. Assessment of heavy metal pollutants accumulation in the Ti-sza River sediments. J. Environ. Manag. 2009, 90, 3382–3390. [Google Scholar] [CrossRef] [Scilit] [PubMed]
- Wedepohl, K.H. The composition of the continental crust. Geochim. Cosmochim. Acta 1995, 59, 1217–1232. [Google Scholar] [CrossRef] [Scilit]
- Cullers, R.L.; Graf, J.L. Rare earth elements in igneous rocks of the continental crust: Intermediate and silicic rocks—Ore petrogenesis. In Developments in Geochemistry; Henderson, P., Ed.; Elsevier: Amsterdam, The Netherlands, 1984; Volume 2, pp. 275–316. [Google Scholar]
- Gromet, L.P.; Dymek, R.F.; Haskin, L.A.; Korotev, R.L. The “North American shale composite”: Its compilation, major and trace element characteristics. Geochim. Cosmochim. Acta 1984, 48, 2469–2482. [Google Scholar] [CrossRef] [Scilit]
- He, M.; Zheng, H.; Clift, P.D.; Tada, R.; Wu, W.; Luo, C. Geochemistry of fine-grained sediments in the Yangtze River and the implications for provenance and chemical weathering in East Asia. Prog. Earth Planet. Sci. 2015, 2, 32. [Google Scholar] [CrossRef] [Scilit]
- Nesbitt, H.W.; Young, G.M. Prediction of some weathering trends of plutonic and volcanic rocks based on thermodynamic and kinetic considerations. Geochim. Cosmochim. Acta 1984, 48, 1523–1534. [Google Scholar] [CrossRef] [Scilit]
- Man, L.; Han, G. Distribution and fractionation of rare earth elements in suspended particulate matter in a coastal river, Southeast China. PeerJ 2021, 9, e12414. [Google Scholar] [CrossRef] [Scilit]
- Chen, J.; Liu, P.; Sun, D.; Zhang, D.; Miao, B.; Chen, J. Riverine sediment geochemistry as provenance fingerprints along the eastern coast of China: Constraint, approach, and application. Minerals 2020, 10, 29. [Google Scholar] [CrossRef] [Scilit]
- Balaram, V. Rare earth elements: A review of applications, occurrence, exploration, analysis, recycling, and environ-mental impact. Geosci. Front. 2019, 10, 1285–1303. [Google Scholar] [CrossRef] [Scilit]
- Hoskin, P.W.O.; Black, L.P. Rare earth elements in zircon. Rev. Mineral. Geochem. 2000, 39, 273–303. [Google Scholar]
- Bau, M. Controls on the Fractionation of Isovalent Trace Elements in Magmatic and Aqueous Systems: Evidence from Y/Ho, Zr/Hf, and Lanthanide Tetrad Effect. Contrib. Mineral. Petrol. 1996, 123, 323–333. [Google Scholar] [CrossRef] [Scilit]
- Sun, N.; Brandon, A.D.; Forman, S.L.; Waters, M.R. Geochemical evidence for volcanic signatures in sediments of the Younger Dryas event. Geochim. Cosmochim. Acta 2021, 312, 57–74. [Google Scholar] [CrossRef] [Scilit]
- Dugamin, E.J.M.; Cathelineau, M.; Boiron, M.-C.; Richard, A.; Despinois, F. Lithium enrichment processes in sedimentary formation waters. Chem. Geol. 2023, 635, 121626. [Google Scholar] [CrossRef] [Scilit]
- Hoskin, P.W.O.; Schaltegger, U. The composition of zircon and igneous and metamorphic petrogenesis. Rev. Mineral. Geochem. 2003, 53, 27–62. [Google Scholar] [CrossRef] [Scilit]
- Sager, M.; Wiche, O. Rare Earth Elements (REE): Origins, Dispersion, and Environmental Implications—A Comprehensive Review. Environments 2024, 11, 24. [Google Scholar] [CrossRef] [Scilit]
- Ohta, A.; Goto, A.S.; Wakaki, S.; Minami, M. Strontium-isotope mapping of the Kyushu Islands, southwestern Japan, using stream sediments. Geochem. J. 2025, 59, 9–25. [Google Scholar] [CrossRef] [Scilit]
- Capo, R.C.; Stewart, B.W.; Chadwick, O.A. Strontium isotopes as tracers of soil mineral weathering and vegetation cy-cling in temperate catchments. Geoderma 1998, 82, 197–225. [Google Scholar] [CrossRef] [Scilit]
- Xu, D.; Gao, B. Lead isotopes combined with geochemical baseline in sediments: A novel tool to trace anthropogenic Pb sources. Int. J. Environ. Res. Public Health 2020, 17, 1112. [Google Scholar] [CrossRef] [Scilit] [PubMed]
- Dietrich, M.; Krekeler, M.P.S.; Kousehlar, M.; Widom, E. Quantification of Pb pollution sources in complex urban envi-ronments through a multi-source isotope mixing model based on Pb isotopes in lichens and road sediment. Environ. Pollut. 2021, 288, 117815. [Google Scholar] [CrossRef] [Scilit] [PubMed]

Disclaimer/Publisher’s Note: The statements, opinions and data contained in all publications are solely those of the individual author(s) and contributor(s) and not of MDPI and/or the editor(s). MDPI and/or the editor(s) disclaim responsibility for any injury to people or property resulting from any ideas, methods, instructions or products referred to in the content. |
© 2026 by the author. Licensee MDPI, Basel, Switzerland. This article is an open access article distributed under the terms and conditions of the Creative Commons Attribution (CC BY) license.