


Abstract
This study systematically examines the impacts of extreme temperatures on the digital economy development index and the underlying mechanisms based on panel data from 281 prefecture-level cities in China from 2012 to 2023. This study explicitly distinguishes the distinctive adaptive capacity of the digital economy in responding to climate risks. Through global and local spatial autocorrelation analysis, the study finds that both extreme temperatures and the digital economy exhibit significant spatial clustering. This study employs the spatial Durbin model (SDM) and effect decomposition and further incorporates the GS2SLS estimator alongside dual instrumental variables constructed from historical geographic characteristics to address endogeneity, thereby identifying the asymmetrical impacts of extreme heat and extreme cold on the digital economy with great rigor. Specifically, extreme heat fosters short-term local digital demand that is subsequently translated into long-term growth in IT human capital and infrastructure, thereby increasing the DEDI. However, its net spatial effect is inhibitory due to energy crowding out. Extreme cold, by contrast, primarily disrupts supply chains and intensifies energy consumption, with its impact largely confined to the local scope. Green technological innovation mitigates the impact of extreme heat on the digital economy through demand substitution, while, under extreme cold, it manifests as the physical protection of infrastructure. Meanwhile, an optimized industrial structure substantially reduces the economy’s dependence on supply chains, amplifying the promotional effect of extreme temperatures on the digital economy and reflecting the transformation capacity of regions under complex environmental conditions. Heterogeneity analysis demonstrates that the effects of extreme temperatures vary significantly across different urban agglomerations, economic zones, geographic regions and city types. This study not only extends the theoretical framework for the economic assessment of climate risks and spatial econometric analysis to the climate sensitivity of the digital economy but also provides empirical evidence for understanding the complex relationship between climate change and digital economy development and offers references for differentiated policies in a coordinated regional digital economy.
1. Introduction
Global climate change and extreme weather are among the most severe challenges [1]. Climate change is primarily driven by human activities [2], and the direct manifestation is the substantial increase in the frequency, intensity and duration of extreme temperature events [3,4]. These events pose comprehensive threats to multiple aspects of natural ecosystems and human socioeconomic systems [5]. They not only directly impact agricultural production [6] and energy systems [2] but also profoundly affect economic output and household welfare through pathways such as compromising labor health [7] and altering time allocation patterns [8]. Moreover, their negative impacts are unevenly distributed globally [7,9]. Meanwhile, the digital economy is fundamentally reshaping global economic growth patterns [10]. The digital economy uses data as a key production factor and digital technology as the core driving force. By promoting industrial transformation and new business formats, it has become a vital engine for high-quality economic and sustainable development [11]. Extensive research demonstrates that the digital economy can significantly enhance total factor productivity [12], facilitate green industrial transformation [13] and contribute to common prosperity [14]. Its development level requires comprehensive measurement through multi-dimensional indicators including digital infrastructure, industrial development and integrated applications [15,16,17].
Although existing research has separately confirmed the impact of extreme temperatures on traditional economies [6,18] and the development value of the digital economy [10,11], theoretical exploration of their interactive mechanisms remains insufficient. Specifically, existing research focuses on the symmetrical linear effects of extreme temperatures on traditional economic sectors [6,18], while rarely examining the digital economy. The digital economy possesses emerging-economy characteristics. The sensitivity of its hardware infrastructure, software services and human capital to temperature fluctuations may result in asymmetrical features in both direction and intensity between extreme heat and cold. Nonlinear threshold effects may also exist. Moreover, regarding transmission pathways, the adaptive capacity and resilience mechanisms of the digital economy against climate risks through digital infrastructure and industrial integration have not been systematically evaluated [15,16]. Additionally, as a critical climate risk [19], the spatial or sectoral spillover effects of extreme temperatures on digital economies in different development stages have not been thoroughly investigated. To effectively measure digital economy development, Guo et al. (2024) [17] define the digital economy development index (hereafter DEDI) as a composite index that integrates indicators including data resources, digital industrialization, industrial digitalization and development environment. This study draws on their approach to composite index construction but makes corresponding adjustments in dimension division, indicator selection and weight assignment to establish an evaluation system that fits the needs of this research.
Distinct from existing studies that focus on temperature shocks to traditional industries or aggregate GDP, the marginal contributions of this study are threefold. First, compared to Burke et al. (2015) [20] and the broader literature exploring the nonlinear shocks of temperature on agriculture, manufacturing or aggregate macroeconomic output, this study focuses on the digital economy with an asset-light, highly mobile economic form and examines how it is affected by extreme temperatures. Unlike studies that concentrate solely on macroeconomic aggregates, this study analyzes short-term demand substitution and the long-term structural impacts of extreme temperatures on the digital economy, which reveal the threshold-dependent asymmetry of the digital economy’s response to extreme temperatures, thereby enriching the literature on the climate sensitivity of the digital economy. Second, compared to existing spatial studies on China’s digital economy, prior literature has largely examined its spillover effects on regional carbon emissions or technological innovation, with limited attention to spatial transmission triggered by climate shocks. This study employs the SDM to investigate the spatial spillover effects of extreme temperatures on the digital economy and conducts the analysis in the context of China’s distinctive energy infrastructure. This paper distinguishes between the cross-regional power dispatching mechanism under extreme heat and the localized heating system transmission mechanism under extreme cold and provides specific explanations based on these transmission pathways. Third, this study extends the research on physical climate risks within the climate finance literature. Existing studies predominantly focus on the role of climate risks in capital reallocation. By contrast, this study demonstrates that climate risks can also drive market participants to undertake long-term investment targeting specific industrial structures, thereby providing new empirical evidence for the climate-adaptive transformation of the economy. Furthermore, to more robustly address endogeneity concerns, this study employs GS2SLS estimation under two-way fixed effects, constructing two instrumental variables based on initial climate conditions and lagged historical geographic characteristics to verify the effects of climate shocks. This approach effectively overcomes the limitations of traditional non-spatial models in addressing spatial omitted variable bias, offering new insights into the climate-adaptive transformation of the digital economy.
Therefore, this study conducts empirical testing of the asymmetrical relationship between extreme temperatures and DEDI based on data from 281 prefecture-level cities in China from 2012 to 2023. The research focuses on the following questions: As a persistent climate risk, what respective impacts do extreme heat and extreme cold have on digital economy development? Do statistically significant asymmetrical effects exist? Do extreme temperatures generate spatial or sectoral spillover effects? Answering these questions aims to reveal how the short-term physical shocks of extreme temperatures, as a persistent climate risk, prompt market participants to form long-term risk expectations and adaptive decisions, thereby influencing the structural development of regional digital economies. This will simultaneously provide theoretical and practical foundations for formulating differentiated response strategies to ensure the sustainable development of the digital economy under global warming conditions.
2. Literature Review
The economic impacts of extreme temperature events represent a frontier topic in current multidisciplinary research and can be summarized as occurring along four core pathways. First, extreme heat significantly reduces labor productivity in outdoor and non-air-conditioned environments by compromising the physiological health and cognitive abilities of workers [7,8]. Second, severe temperature fluctuations disrupt energy consumption patterns. Surging demand for cooling and heating directly increases both enterprise operating costs and household expenditures [2]. Third, extreme temperatures may damage critical physical infrastructure such as transportation and power grids, indirectly impeding economic circulation [21]. Finally, their impacts can further propagate through industrial chains by disrupting agricultural production [6]. Existing research has reached the consensus that the economic impacts of extreme temperatures are not simple linear relationships but rather exhibit significant nonlinear and asymmetrical characteristics [20]. This means that extreme heat and extreme cold differ fundamentally in their impact mechanisms and intensity, and effects often undergo abrupt changes after reaching critical thresholds [3]. There is obvious heterogeneity among different regions. For instance, losses in low-income tropical regions far exceed those in high-latitude developed areas, thereby exacerbating global economic inequality [7,9]. Therefore, scholars adopt methods such as event attribution to precisely quantify the economic costs of extreme events [22,23]. Chinese scholars also provide important research in this field by constructing comprehensive climate risk indices [19] and analyzing their impacts on different economic sectors [24,25].
Accurate measurement of the digital economy serves as a prerequisite for conducting empirical research. Academia has gradually shifted from single indicators toward comprehensive evaluation systems to fully reflect its development level [15]. Sidorov and Senchenko (2020) [26] propose a composite index that views the digital economy as a complex system composed of multiple subsystems, including information infrastructure, usage levels and skills, while Chinese scholars have designed measurement systems at the provincial and municipal levels in local contexts, which provide direct references for the dependent variable in this study [16,27]. Research demonstrates that the digital economy constitutes a core driver of high-quality economic development. At the macro level, it promotes sustainable growth [28,29] and inclusive development [14,30]. At the regional and industrial levels, it contributes to enhancing total factor productivity [12] and advancing green industrial transformation [13,19] and high-quality urban development [31]. Its mechanisms primarily stem from optimizing resource allocation, reducing transaction costs and stimulating technological innovation [11,16]. However, the digital economy simultaneously faces challenges such as the digital divide [32] and unclear mechanisms for deep integration with the real economy [33]. It is also deeply influenced by regional industrial foundations [34] and policy guidance [27].
The intersection of extreme climate and digital economy research constitutes an emerging academic frontier. Big data policies promote green development by facilitating industrial upgrading [19]. Ren et al. (2022) [35] find that climate risk affects corporate environmental performance, and Liu et al. (2022) [13] explore the impact of the digital economy on industrial ecological efficiency. Although climate risk and resilience issues have received broad attention [36,37], and Jeet et al.’s (2025) [38] sustainable development framework together with Sun et al.’s (2019) [24] sectoral research has offered methodological inspiration for this study, research directly examining the comprehensive impact of extreme temperatures on the digital economy remains scarce. More critically, when examining physical climate shocks, it is essential to test the inherent resilience of the digital economy. Conventional thinking tends to attribute a regional economy’s capacity to withstand shocks to macroeconomic factors such as local economic scale, industrial base or overall development level. The resilience of the digital economy, however, does not merely reflect these regional attributes but rather stems from its own intrinsic properties. Unlike traditional capital-intensive industries that depend heavily on spatial and physical supply chains, the digital sector possesses a distinctive recovery trajectory. On the one hand, data as a core production factor with high mobility and non-rivalry can effectively buffer production disruptions caused by physical climate shocks. On the other hand, the multi-layered network architecture underpinned by digital technologies can transcend geographic constraints, offering an elastic framework for absorbing and managing external vulnerability shocks [39]. Moreover, synergistic digital innovation not only facilitates efficient resource reallocation but also substantially strengthens firms’ organizational resilience, enabling them to adapt and recover from external environmental disruptions more effectively than their conventional counterparts [40]. The digital economy, thus, not only exhibits an inherent resilience against climate variability but also helps traditional industries hedge against climate risks through technological spillovers and network collaboration.
In summary, existing literature establishes a foundation for this research in three aspects. First, research on the economic impacts of extreme temperatures clarifies the necessity of asymmetrical analysis. Second, digital economy measurement and effectiveness research provides reliable methods for dependent variable assessment. Third, climate and digitalization intersection research offers preliminary evidence of associations. Currently, questions regarding how extreme temperatures affect digital economy development and whether significant asymmetrical and nonlinear characteristics exist remain to be further explored. This study intends to empirically test the asymmetrical impacts of extreme temperatures on the digital economy in the Chinese context, providing scientific evidence for climate-adaptive digital economy strategies.
3. Research Hypotheses
Based on the preceding analysis, the study constructs an analytical framework that integrates the temporal dimension to discuss the relationship between short-term fluctuations in extreme temperatures and long-term structural indicators of the digital economy. The components encompassed by DEDI include digital infrastructure, the proportion of IT personnel and digital finance penetration rates, which are essentially the results of long-term capital investment, human capital accumulation and policy support, with their annual changes reflecting the structural adjustments. Extreme temperature events initially function as short-term shocks, directly affecting current economic activity costs, production efficiency and consumption patterns [20]. However, when such shocks occur repeatedly or become predictable climate risks, market participants adjust their long-term expectations and decisions accordingly [41,42]. While current climate measures have proven effective in mitigating short-term shocks, these actions still fall short in terms of long-term strategic planning [43]. This suggests a potential lag or deficiency in long-term strategic investment aimed at addressing climate risks. Enterprises may locate digital infrastructure such as data centers in regions with more stable climates to avoid operational disruption risks and cooling costs, which exemplifies how climate risk influences corporate long-term investment and location choices. They may increase long-term investment in cloud computing services such as remote work and online services, which are catalyzed by extremely high temperatures. Meanwhile, investors may reduce long-term capital allocation to local digital industries due to high physical climate risks in certain regions [44]. Negative environmental information is rapidly perceived by markets and affects asset prices [45], because climate risk information guides capital away from high-risk regions by influencing investor and consumer expectations.
These long-term behavioral decisions based on risk expectations will ultimately manifest as structural changes in the DEDI. Therefore, this study empirically tests the gradual and sustained net effect that extreme temperatures exert on the structural development of the digital economy through the shaping of long-term expectations and decisions. Such long-term adjustment effects have received attention in the literature analyzing climate and economic growth [46]. Based on this framework, the study proposes the following hypotheses.
3.1. Asymmetrical Impacts of Extreme Temperatures on Digital Economy Development
The digital economy relies on information technology infrastructure, data elements and networked collaboration [47], which are constrained by the physical environment. Extreme heat and cold affect energy consumption, infrastructure stability and human capital efficiency through differentiated pathways, forming asymmetrical impacts. The impact of extreme heat on the digital economy is relatively complex. High temperatures directly drive up cooling costs for core facilities such as data centers and servers [48] while simultaneously reducing labor productivity in non-air-conditioned environments, forming a negative shock. However, this climate pressure simultaneously triggers powerful adaptation mechanisms. To avoid the constraints that high temperatures impose on offline activities, the societal demand for digital services such as remote work, online education and instant delivery rises in the short term. This adaptive behavior driven by climate events [49] may partially offset the inhibitory effect of high temperatures. More importantly, this adaptive demand not only offsets the negative shocks but also compels firms to cross the fixed-cost threshold of digital transformation, converting short-term online heat-avoidance behavior into long-term investment in IT human capital and infrastructure. The impact of extreme cold is dominated by unidirectional negative shocks. The pathways are more direct and destructive. First, low temperatures damage communication fiber optic cables and base stations through physical effects such as freezing and snow, directly disrupting digital network connectivity [50]. Second, low temperatures interrupt transportation and logistics, causing supply chain disruptions for hardware such as chips and servers and impacting the production side of the digital industry. Third, surging heating demand intensifies the pressure on energy systems, threatening stable power supply for digital infrastructure [26]. Fourth, the asymmetrical impacts of extreme temperatures on the digital economy arise not only because extreme temperatures have different short-term effects on infrastructure but also because market participants adopt different long-term adaptation strategies and investment directions in response to these two types of shocks.
In summary, the impacts of extreme temperatures on the digital economy are not monolithic. Short-term demand substitution and long-term structural adjustment must be tested separately. Their transmission mechanisms differ, and the outcomes transmitted by extreme cold and extreme heat also diverge [51]. Accordingly, this study proposes the following hypotheses:
H1a:
In the short term, both extreme heat and extreme cold exert a positive stimulating effect on the local digital economy. However, in terms of magnitude, the positive stimulating effect of extreme heat is significantly greater than that of extreme cold.
H1b:
In the long term, extreme heat exerts a significantly positive promoting effect on the digital economy. Conversely, extreme cold exerts a significantly negative inhibiting effect.
3.2. Spatial Spillover Effects of Extreme Temperatures on the Digital Economy
The network and collaboration of the digital economy enable extreme temperature shocks to transmit through spatial linkages [52]. Wang et al. (2016) [53] confirm that the economic impacts of extreme climate events exhibit cross-regional transmission. Nevertheless, the asymmetrical spatial transmission of extreme heat and cold requires careful consideration of the physical and institutional characteristics of China’s energy infrastructure. The spillover effects of extreme heat stem from the dual superposition of energy competition and industrial chain transmission. The surge in cooling demand triggered by extreme summer heat is highly electricity-intensive. Given that China’s power system features high interconnectivity and real-time cross-regional dispatch, high local temperatures trigger emergency cross-regional grid reallocation or ordered electricity consumption policies, thereby crowding out power resources in surrounding areas and threatening the stable operation of energy-intensive digital infrastructure, such as data centers and 5G base stations in neighboring regions. Meanwhile, high temperatures reduce local production efficiency, which dampens the demand for digital services from upstream and downstream regions or delays product supply, generating negative spillovers through the division of labor in the industrial chain. By contrast, the spillover effects of extreme cold are constrained by the localized closed loop of physical shocks and energy supply. Winter heating in China relies on centralized district heating networks, where energy consumption is largely sourced from the local direct combustion of primary fuels such as coal and natural gas or from combined heat and power generation [54]. This physical pipe-based thermal system weakens the cross-city spillover of energy consumption. Transportation interruptions and infrastructure damage caused by low temperatures primarily affect disaster-affected areas. Although they may affect external areas through supply chains, the transmission chains are short, and the scope is limited [50].
Consequently, extreme heat generates persistent negative spillovers through cross-regional power dispatching and industrial chains, while extreme cold primarily results in localized physical damage. These two exhibit significant asymmetry in their spatial transmission and spillover. Accordingly, this study proposes the below hypotheses:
H2a:
Extreme heat generates significantly negative spatial spillover effects on the digital economy of neighboring cities.
H2b:
Extreme cold also generates spatial spillover effects, but the magnitude and spatial reach of its spillovers are significantly smaller than those of extreme heat.
3.3. Moderating Effect of Green Technological Innovation
Under extreme heat conditions, green technological innovation attenuates the positive effect of high temperatures on the digital economy. This moderating mechanism originates from the substitution between different climate adaptation strategies. Confronted with extreme heat shocks, socioeconomic systems typically face two adaptation pathways: a digital substitution strategy involving the migration of activities online, and a physical retrofitting strategy that improves the built environment through technological upgrading. When a region widely adopts innovations such as low-energy cooling technologies and smart grids [52], its thermal resilience is substantially enhanced and the energy costs required to sustain operations are markedly reduced. Such improvements in the physical environment effectively alleviate the pressure on residents and firms to shift economic activities online under high temperatures. In other words, a higher regional adaptive capacity to extreme heat reduces the degree of digital substitution, thereby dampening the short-term surge effect of extreme heat on the digital economy. Moreover, in regions with higher levels of green technology, digital economy growth relies more heavily on endogenous technological progress, such as algorithmic optimization and hardware upgrading [55], rather than passive adaptive demand driven by climate stress. However, the moderating effect of green innovation exhibits significant asymmetry under extreme heat and extreme cold. The shock from extreme heat is demand-driven, and green innovation primarily serves to smooth demand. By contrast, the shock from extreme cold primarily operates through infrastructure damage.
In extreme cold scenarios, green technological innovation mitigates negative shocks by enhancing infrastructure resilience. Stavytskyy et al. (2019) [47] emphasize that infrastructure reliability is a prerequisite for digital development. The research and development of low-temperature-resistant materials and optimization of energy storage technologies can reduce physical damage to base stations and servers. Smart logistics systems avoid transportation interruptions to maintain unimpeded hardware supply chains. Resilient power grids balance electricity demand between heating and digital facilities, reducing the risk of energy allocation conflicts. The root of the differences between these two types of moderation directions lies in the fact that high-temperature impacts are primarily demand-driven, while low-temperature impacts are dominated by direct destruction. Importantly, this physical protection is theoretically nonlinear and exhibits a significant critical mass effect. Studies show that green technological innovation often displays a nonlinear threshold when exerting macro-level effects [56]. A limited number of green patent applications and localized technology adoption cannot provide comprehensive protection for an entire region. Only when green technological innovation becomes widespread within a region and crosses a specific threshold can a qualitative transformation occur, thereby reducing the damage that extreme temperatures inflict on infrastructure. Therefore, based on the above analysis, this study proposes the following hypothesis:
H3:
Green technological innovation exhibits an asymmetrical moderating direction. For extreme heat, it plays a negative moderating role. For extreme cold, it plays a positive moderating role after crossing a specific high-level threshold.
3.4. Moderating Effect of Industrial Structure
Industrial structure moderates the transmission pathways and intensity of extreme temperature shocks by altering economic dependence on resources and physical supply chains. However, this moderating effect is not linear but rather exhibits strong stage-specific characteristics.
For extreme heat, the moderating role of industrial structure manifests as a linkage between the service sector share and digital demand. Regions dominated by secondary industry face surging electricity demand and energy competition due to high temperatures, which intensify the crowding-out effect on digital infrastructure and amplify the negative impacts of high temperatures. When the tertiary sector share is higher, the economy becomes less dependent on the physical environment and more readily transforms high-temperature challenges into long-term demand through digital means such as online consumption and remote collaboration [48]. This may strengthen the short-term stimulation of high temperatures on the digital economy or weaken their negative impacts. For extreme cold, different regions possess different resilience advantages. Therefore, the impacts of industrial structure also differ. Regions dominated by secondary industry suffer greater shocks from low-temperature transportation interruptions due to a dependence on stable logistics and physical supply chains. With asset-light operations and a heavy reliance on information and data flows, regions dominated by the tertiary sector exhibit strong economic resilience. Additionally, Wang and Shi (2021) [57] point out that climate pressure prompts resource transfer toward industries with lower climate sensitivity. Sustained low temperatures may drive the economic structure toward service industries supported by digital technology, further optimizing resource allocation and reducing overall damage. In summary, industrial structure moderates the impact of extreme temperatures on the digital economy by altering the degree of economic dependence on energy and physical supply chains.
Moreover, according to regional economic resilience theory [58], this moderating effect exhibits a stage-specific structure. When confronted with extreme temperature impacts, regions at an intermediate level of industrial structure often face structural transition pains and a dual disadvantage. On the one hand, they are undergoing deindustrialization but have not yet fully shed their dependence on physical logistics and supply chains. On the other hand, regional digital and data development remains insufficient to absorb extreme temperature shocks. Consequently, regions in the intermediate transition phase remain vulnerable under extreme temperatures. Only when the industrial structure undergoes comprehensive upgrading that crosses the transition threshold and the tertiary sector assumes absolute dominance with asset-light operations and information-data flows can a region activate its economic resilience. Therefore, based on the above analysis, this study proposes the following hypothesis:
H4:
Industrial structure upgrading plays a nonlinear moderating role. For extreme heat, it continuously produces a positive amplifying effect. For extreme cold, its moderating direction is negative during the mid-stage of transformation and only reverses to a positive mitigating effect upon entering the advanced stage.
4. Research Design
4.1. Model Specification
To test these theoretical hypotheses, the paper constructs the spatial Durbin model (SDM) as shown in Equation (1):
where represents province and represents year. represents DEDI. represents the development level of extreme heat. represents the development level of extreme cold. represents the set of control variables. and represent individual fixed effects and time fixed effects, respectively. is the random disturbance term. , and are parameters to be estimated. If , this indicates that extreme temperatures can enhance DEDI. In Model (2), represents the spatial weight matrix. , , and represent the spatial lag terms of DEDI, extreme heat, extreme cold and control variables, respectively. , and are the corresponding coefficients.
The application of the spatial economic geography matrix in SDM possesses significant advantages. Compared with traditional spatial weight matrices that rely solely on geographic distance, this matrix more precisely characterizes the spatial dependence by considering the interactive effects of inter-regional economic linkages and geographic proximity. It can not only capture the decay boundaries of economic interactions such as knowledge spillovers and technology diffusion but also effectively distinguish between direct and indirect spatial spillover effects. This specification effectively avoids the risk of model misspecification. Therefore, this study adopts the spatial economic geography matrix of 281 prefecture-level cities in China as the core weight matrix in SDM [59,60].
4.2. Extreme Temperature Measurement
This study adopts the relative threshold method to determine the criteria for extreme heat events [61]. Compared with the use of uniform absolute meteorological temperatures, the relative threshold approach effectively controls for the geographic and climatic heterogeneity arising from China’s vast territory and precisely captures the disruptions that temperature anomalies impose on local economic activity. It is noteworthy that Li et al. (2025) [62] adopt the 80th percentile as the threshold for identifying extreme events. To identify extreme climate events and preserve the statistical variability required by econometric models, this study tightens the baseline threshold to the 85th-percentile relative threshold for defining city-specific extreme temperature cutoffs. This choice exceeds the stringency of prior studies while ensuring adequate variance in climate shocks within the panel data.
Daily data for each city in this study are sourced from GSOD meteorological station data. Meteorological station data are interpolated into 0.1 × 0.1 resolution grid data using the inverse distance weighting method (IDW) and then regionally averaged to obtain data for each city, thereby enabling statistical analysis of annual extreme heat events from 2012 to 2023. Daily maximum temperature data for corresponding dates within the climate baseline period are first extracted and arranged in ascending order. The 85th-percentile value serves as the extreme heat threshold. The 15th-percentile value serves as the extreme cold threshold. When the maximum temperature recorded in a specific city on a particular date exceeds the preset threshold, that day is identified as an extreme heat event. The identification of cold events follows the same principle. To systematically analyze such events, daily collected data are aggregated into annual totals to calculate the annual number of days experiencing extreme heat weather (Htemp) and extreme cold weather (Ltemp). This method provides a clear number of days that extreme temperature events occur within a year and offers the regional climate patterns and trends. The specific calculation formulas are as follows:
- (1)
- Data Preprocessing Formula
Baseline period filtering:
Study period filtering:
where is the city code, is the month, is the date, and represents the -th percentile.
- (2)
- Threshold Calculation Function
High temperature threshold calculation:
Low temperature threshold calculation:
- (3)
- Extreme Event Marking Function
Extreme heat days (Htemp15):
Extreme cold days (Ltemp15):
where L represents the set of leap years.
4.3. Construction of DEDI
Currently, specific measurements of the digital economy remain limited, with existing literature mostly concentrated at the provincial level. Many scholars have constructed evaluation indicators for China’s provincial digital economy from three dimensions: digital infrastructure, digital industry development and digital integration [15,16,38,57]. At the city level, the unavailability of micro-level data on corporate digital transformation makes it difficult to observe the digital activities of all individual agents. Therefore, this study draws on the city-level measurements widely adopted in recent international literature [48,63], taking internet development as the core dimension and complementing it with digital finance-related indicators for composite measurement. Although these indicators incorporate elements of urban infrastructure, they by no means simply represent the macroeconomy of a city. Rather, they constitute the prerequisite conditions under which digital economic activities take place. When confronted with extreme climate shocks, both corporate remote work and household online consumption depend on the local internet penetration and digital finance. These indicators are, therefore, central to the digital economy.
To precisely isolate the distinctive features of the digital economy from conventional macroeconomic activities, this study draws on the standard city-level assessment framework established by Luo et al. (2022) [48] and Ding et al. (2022) [63] and selects four indicators to measure city internet development: internet penetration rate (internet users per hundred people), scale of related practitioners (proportion of computer services and software industry practitioners among urban unit practitioners), related output level (per capita telecommunications business volume) and mobile phone penetration rate (mobile phone users per hundred people). Original data are all sourced from the China City Statistical Yearbook. The digital finance indicator in this study adopts the China Digital Financial Inclusion Index jointly compiled by the Institute of Digital Finance at Peking University and Ant Financial Services Group. Furthermore, this study calculates the information entropy of each indicator through the entropy weight method to measure its degree of dispersion. Based on this, weights are determined. Indicators with larger degrees of dispersion carry more information and are assigned higher weights in comprehensive evaluation. Finally, through weighted summation of normalized values of each indicator with their corresponding entropy weights, DEDI is obtained, denoted as Digi (Table 1). The indicator calculation formulas are as follows:
Table 1.
DEDI Construction.
Let there be n samples and m indicators. Then, represents the original value of the j-th indicator for the i-th sample.
- (1)
- Indicator Standardization. Because different indicators have different dimensions and units, standardization processing is required:
- (2)
- Normalization Processing
To avoid errors, when , it is forcibly replaced with .
- (3)
- Calculate Entropy Value
- (4)
- Calculate Coefficient of Variation
- (5)
- Calculate Indicator Weight
- (6)
- Calculate Composite Score
The indicator construction in this study is primarily based on the availability and uniformity of existing publicly available data at the city level and cannot fully cover all potential dimensions of the digital economy, such as the depth of enterprise digital transformation. Future research can further incorporate micro-level enterprise data or subdivided industry indicators, when data conditions permit.
5. Empirical Analysis
5.1. Evolution of Extreme Temperature Days and DEDI
Comparative analysis of Figure 1 reveals the distinct evolution of extreme temperature events in China. Extreme heat days have exhibited widespread and substantial increases nationwide, with nearly all cities experiencing multi-fold growth. This trend indicates that both the scope and intensity of extreme heat events continue to expand and strengthen in climate warming. The distribution of annual extreme heat days across cities spans a wide range, reflecting significant baseline differences attributable to geographic location and climatic conditions. The numerical range of extreme cold days is smaller than that of extreme heat days, with their color distribution appearing patchy across the matrix, showing no clear or consistent temporal gradient pattern. This indicates that cold days are strongly influenced by interannual climate fluctuations and geographic factors. Extreme cold days exhibited no detectable significant linear trend during the observation period, with changes primarily manifesting as strong interannual volatility and substantial spatial heterogeneity, which reflect the complexity and regionality of cold climate event occurrence.
Figure 1.
Matrix Map of Extreme Temperature Days and DEDI in 2012 and 2023.
Based on the time series data of the DEDI for major Chinese cities from 2012 to 2023 shown in Figure 2, the evolution process exhibits two distinct stages. The first stage spans from 2012 to 2020, during which the DEDI values for most cities in most years are concentrated in the 20 to 40 range, indicating limited overall development levels. High index values appeared only sporadically, concentrated in individual cities, confirming the imbalanced nature of digital economy development. The turning point between the two stages occurred in 2020, when the DEDI experienced substantial fluctuations. The mean DEDI for all sample cities declined dramatically, indicating that pandemic control measures imposed systemic shocks on digital economy activities. Meanwhile, extreme heat days exhibited volatile increases, suggesting the frequent occurrence of high-temperature events against the backdrop of climate warming. Extreme cold days fluctuated without obvious long-term trends.
Figure 2.
Annual Trends in Digital Economy and Extreme Temperatures.
5.2. Overall Trends and Correlation Analysis
Figure 3 presents the comparison of digital economy indices across seven major regions in China from 2012 to 2023, exhibiting an overall pattern of initial stability followed by a substantial decline. While the seven regions experienced fluctuations from 2012 to 2019, their overall DEDI remained relatively high. However, in 2020, due to the impact of the novel coronavirus, the DEDI declined sharply, with the overall level of the seven regions experiencing substantial drops compared to previous years. The digital economy experienced a significant recession during this period, and these changes reflect the differentiated temporal evolution patterns of economic and climate indicators.
Figure 3.
Regional DEDI.
Figure 4 displays the time series changes in DEDI, extreme heat days and extreme cold days across seven geographic regions in China from 2012 to 2023. The upper subplot shows that the DEDI across regions exhibited an overall upward trend during the observation period, though some regions experienced fluctuations between 2018 and 2020, and differences exist among regions in development levels and growth rates. The middle subplot indicates that extreme heat days in the vast majority of regions demonstrate clear upward trends, reflecting the universal climate warming. The lower subplot shows that extreme cold days across regions fluctuate over time but do not exhibit consistent upward or downward trends as seen with heat days, with substantial variation in the fluctuation patterns among regions.
Figure 4.
Time Series of Digital Economy and Extreme Temperatures.
As shown in Figure 5, the correlation coefficient between DEDI and heat days is −0.31, presenting a moderate negative correlation, which suggests that increases in heat days may be statistically associated with declines in DEDI. The correlation coefficient between DEDI and cold days is weak, indicating that cold days have a limited impact on DEDI. Heat days and cold days exhibit a weak negative correlation, consistent with the inverse relationship between high- and low-temperature events against the background of temperature extremes. In the argumentation process, trend analysis shows the coexistence of declining digital economy indices and rising heat days, while correlation analysis further quantifies this negative relationship. However, correlation does not imply causation; thus, further empirical analysis is required to establish causality.
Figure 5.
Correlation Matrix of Digital Economy and Extreme Temperatures.
Figure 6 analyzes the multi-dimensional relationships between the digital economy and extreme weather. The upper-left scatter plot displays the relationship between DEDI and extreme heat days, with the data point distribution showing a negative correlation trend and negative fitted line slope, which indicates that the regions with higher digital economy development levels experience relatively fewer extreme heat days within the observed data range. The upper-right scatter plot analyzes the association between DEDI and extreme cold days, with a more dispersed data point distribution and nearly horizontal fitted line, indicating only an extremely weak negative correlation between the two. The lower-left heatmap presents the normalized means of the three core indicators across seven geographic regions in China, with colors ranging from light yellow to deep red representing values from low to high, which intuitively compares the indicators across regions, such as the northwest region displaying high values in both digital economy and heat days. The lower-right box plot displays the specific distribution of DEDI across regions, including median, interquartile range and outliers, revealing developmental imbalances within regions, such as the East China region exhibiting a high median but wide distribution range, while the northeast region shows a concentrated distribution but lower overall levels. Overall, this combination of charts depicts the complex relationship pattern between the digital economy and climate extremes from multiple perspectives.
Figure 6.
Relationship Between Digital Economy and Extreme Weather.
5.3. Impact of Extreme Heat/Cold on DEDI
5.3.1. Global Spatial Autocorrelation Analysis
Table 2 presents the spatial autocorrelation analysis results for extreme heat days, extreme cold days and DEDI from 2012 to 2023. Moran’s I index calculations show that the p values for all years pass the 1% significance level, which indicates that extreme heat days, extreme cold days and DEDI in prefecture-level cities across China exhibit significant positive spatial dependence. There are obvious spatial clustering relationships existing among neighboring provinces. This spatial association has important implications in the coordinated regional development of extreme weather and the digital economy.
Table 2.
Moran’s I Index and p Values for DEDI and Extreme Temperatures.
5.3.2. Preliminary Tests
Based on the above results, this study uses Stata 18.0 to conduct model specification tests. Both the Lagrange Multiplier test and robust Lagrange Multiplier test are significant at the 1% level, rejecting the null hypothesis of no spatial lag or spatial error terms, indicating the necessity of establishing a spatial econometric model. Further likelihood ratio tests and Wald tests find that the SDM cannot be simplified to a spatial autoregressive model (SAR) or spatial error model (SEM) at the 1% level, indicating that the SDM possesses a general functional form and fitting performance. The Hausman test results support the use of fixed effects models. Additionally, the likelihood ratio test under individual and time dual fixed effects strongly rejects the null hypothesis of no time fixed effects but does not reject the null hypothesis of no individual fixed effects. Therefore, this study ultimately selects the SDM with only time fixed effects for estimation.
Furthermore, the likelihood ratio test strongly rejects the null hypothesis of no time fixed effects, indicating the necessity of controlling for aggregate time trends. Regarding the choice to exclude individual fixed effects in the baseline model, this paper provides explanations from the two perspectives of statistical testing and econometric theory. First, in the statistical tests, the likelihood ratio test yields a negative test statistic, which cannot reject the null hypothesis, indicating that the inclusion of individual fixed effects does not significantly improve model fit. Second, at the econometric level, the distribution of extreme temperatures represents geographic endowment, exhibiting spatial clustering during the sample period, with cross-sectional variation far exceeding time-series variation. According to the spatial econometrics literature [64], incorporating individual fixed effects into spatial panel models absorbs the majority of the cross-sectional variation. For climate variables that change slowly over time, this transformation not only strips away the inter-city cross-sectional differences that this study aims to capture but also severely exacerbates multicollinearity, compresses degrees of freedom, and leads to efficiency losses in parameter estimation [65]. Therefore, to preserve the crucial identifying variation across different climate zones and ensure the statistical power of the baseline estimates, this study adopts an SDM with time fixed effects only in the baseline estimation. This study recognizes that controlling solely for time fixed effects may leave time-invariant regional heterogeneity unaccounted for, potentially introducing omitted variable bias and endogeneity. This study addresses the endogeneity concern rigorously by constructing instrumental variables based on historical and geographic climate, employing the GS2SLS estimator under two-way fixed effects to conduct rigorous causal identification and endogeneity purging, thereby ensuring the reliability of the core findings (Table 3).
Table 3.
Preliminary Test Results.
5.3.3. Baseline Regression
The impact of extreme temperatures on DEDI and its spatial spillover effects is evaluated based on the SDM. Fixed effects control adopts time fixed effects and individual fixed effects. This study also provides regression results for an SAR and SEM containing only time fixed effects. As shown in Table 4, regardless of model specification, extreme heat has a significantly positive impact on DEDI, and this impact holds at the 1% significance level, which indicates that extreme heat significantly promotes regional digital economy development. But extreme cold shows no significant impact in the SAR, SEM or SDM models. The estimation results of the SAR, SEM and SDM models all indicate that the coefficient of the spatial lag term W × Digi of the DEDI is significantly positive. This result further confirms the existence of positive spatial autocorrelation in this index. In the SDM estimation with time fixed effects, the coefficient of WLtemp15 is significantly negative at the 1% level. This result indicates that the regional DEDI is not only affected by the local weather but is also significantly affected by negative spatial spillover shocks from extreme cold in surrounding areas. By contrast, WHtemp15 is not significant, which reflects asymmetry in the impacts of extreme heat and extreme cold on DEDI.
Table 4.
Baseline Regression Results.
The baseline regression results above reveal the overall effects of extreme temperatures on the digital economy but do not yet distinguish between short-term demand responses and long-term structural changes. To examine whether and how short-term climate shocks translate into the long-term structural transformation of the digital economy, this study further decomposes DEDI along its constituent elements and introduces lagged terms for testing. Table 5 reports the heterogeneous effects of extreme temperatures on the four elements of the digital economy. The results show that both extreme heat and extreme cold significantly increase internet penetration rates and mobile internet subscriber counts, suggesting that residents in both hot and cold extremes engage in increased online activity in the short run, generating adaptive demand. This empirical result validates hypothesis H1a regarding short-term demand substitution. However, with respect to the number of internet-related employees, which is an indicator reflecting long-term structural investment, extreme heat exerts a significant positive effect, while the effect of extreme cold is statistically insignificant. This divergence indicates that extreme heat not only promotes short-term consumption substitution but, more importantly, also drives firms to pursue digital transformation and expand IT human capital investment, thereby generating long-term structural change. By contrast, extreme cold triggers only short-term adaptive responses, without human capital accumulation. The results in Table 6 support hypothesis H1b, confirming that extreme heat is successfully converted into long-term structural investment, whereas extreme cold lacks such a persistent promotional effect.
Table 5.
Extreme Temperature Effects on Decomposed Elements of the Digital Economy.
Table 6.
Dynamic and Lagged Effects of Extreme Temperature Shocks.
Table 6 further reveals the temporal dynamics and spatial spillover of extreme temperature shocks. In the time element, the coefficients on both one-period and two-period lagged extreme heat are significantly positive for DEDI, confirming that the positive effect is persistent over time. Notably, one-period lagged heat retains a promotional effect of 0.145 on internet-related employment, confirming that prior extreme weather disrupts firms’ status quo. That is, extreme heat elevates market participants’ expectations regarding climate risk, which, in turn, translates into digital infrastructure investment in subsequent years. By contrast, all lagged terms for extreme cold are statistically insignificant, confirming that its effects are confined to short-term adaptive responses and lack long-term structural influence. In the spatial element, the contemporaneous and one-period lagged spatial interaction terms for extreme heat are significantly negative, while those for extreme cold are statistically insignificant. This heat–cold asymmetry precisely reflects the physical realities of China’s energy dispatch system. Cooling demand relies on cross-regional unified grid scheduling. Local extreme heat triggers inter-city power transfers that crowd out electricity loads in neighboring areas, generating an energy crowding-out effect on energy-intensive digital infrastructure in surrounding regions. Heating demand under extreme cold, by contrast, largely depends on local closed-loop systems and does not generate cross-regional power competition, producing no significant negative spatial spillover. Taken together, short-term extreme heat successfully converts climate shocks into long-term structural changes in the digital economy by stimulating firms’ long-term human capital investment, sustained expectation updating and cross-regional energy competition, while extreme cold remains confined to short-term adaptive responses. This provides robust empirical evidence for understanding how climate risks shape the long-term trajectory of the digital economy and corroborates the specific predictions in H1 and H2 from the dual perspectives of long-run–short-run heterogeneity and spatial asymmetry.
5.3.4. Effect Decomposition
To more precisely explore the impact of extreme temperatures on DEDI, this study adopts the spatial effect decomposition of spatial econometric models. The total effect is decomposed into direct effects and indirect effects. Direct effects are used to examine the impact of extreme temperatures on the local DEDI. Indirect effects, namely, spatial spillover effects, are used to analyze the transmission effect of extreme temperatures on the DEDI of neighboring prefecture-level cities. Table 7 displays the effect decomposition results for columns (5) and (6) in Table 4. However, the indirect effect of extreme heat is significantly negative. This negative spatial spillover corroborates the cross-regional energy crowding-out mechanism. The surge in local cooling demand triggered by extreme heat depends heavily on the unified power grid, which triggers cross-regional electricity dispatch and thereby crowds out power loads in neighboring cities, suppressing the digital infrastructure of surrounding areas that relies critically on a stable energy supply. This confirms hypothesis H2a. Because the absolute magnitude of the negative indirect effect exceeds that of the positive direct effect, the total effect of extreme heat is ultimately significantly negative, implying that at the regional level, the net impact of extreme heat on the digital economy manifests as inhibition.
Table 7.
Effect Decomposition Results.
By contrast, the effects of extreme cold exhibit markedly different characteristics. For extreme cold, only the direct effect is significantly positive. Both its indirect effect and total effect are not significant. This asymmetrical result precisely mirrors the physical realities of China’s energy system in responding to extreme cold. Winter centralized heating relies heavily on local thermal pipe networks and fossil fuels. This energy consumption pattern weakens cross-city resource competition and, thus, generates no significant negative spatial externalities on neighboring cities. Given the negligible indirect effect, the total effect of extreme cold is also statistically insignificant, indicating that its positive influence is confined to the local scope. This confirms hypothesis H2b, verifying that the spatial spillover of extreme cold is strictly confined to the local scope and does not trigger cross-regional energy competition. To verify the robustness of the above effect decomposition results, and, in particular, the asymmetry in spatial spillovers, this study adjusts the statistical thresholds for extreme temperatures. Specifically, the extreme heat threshold is set at the 90th percentile, and the extreme cold threshold is set at the 10th percentile. Subsequently, new extreme-temperature-day variables Htemp10 and Ltemp10 are constructed accordingly. The results in Table 7 show that the estimation results obtained based on the new thresholds are consistent with the conclusions based on the original thresholds for Htemp15 and Ltemp15. This consistency further supports the robustness of the research results.
5.3.5. Robustness Tests
To verify the robustness of the baseline regression results, this study adopts three methods. First, winsorization treatment is applied to extreme temperatures and DEDI. Second, explanatory variables are replaced. Third, samples during the COVID-19 pandemic period are excluded. Fourth, the dependent variable is replaced.
Table 8 reports the estimation results for the first three statistical adjustment approaches. Specifically, columns (1) and (2) present the results after winsorizing extreme temperatures and DEDI at the 1st and 99th percentiles. Columns (3) and (4) show the results after adjusting the extreme heat threshold to the 90th percentile and the extreme cold threshold to the 10th percentile, and columns (5) and (6) report the results after excluding the COVID-19 sample years (2020 to 2022). As shown in Table 8, across all three alternative sample and parameter specifications, the direct coefficient of extreme heat remains significantly positive for local digital economy development, while the direct coefficient of extreme cold remains statistically insignificant. These results further validate the core finding of heat–cold asymmetry in the direct effects of extreme temperatures on the digital economy.
Table 8.
Robustness Test Results.
To rule out the possibility that the composite DEDI merely proxies for general urban economic wealth or aggregate macroeconomic resilience, this study selects the level of economic development (log per capita GDP) and economic density (log GDP per unit area) as proxy variables for conventional macroeconomic conditions. If the positive shock of extreme temperatures on the digital economy were simply a by-product of the overall economic prosperity in wealthier cities, extreme temperatures should likewise generate significant improvements in these conventional macroeconomic indicators. Table 9 reports the robustness checks using conventional macroeconomic indicators as alternative dependent variables. The results show that extreme heat exerts no statistically significant effect on either local economic development level or economic density. This indicates that short-term extreme heat shocks do not translate into growth in aggregate urban wealth or improvements in the physical economy. This finding confirms that the significant increase in DEDI observed in the baseline regression does not reflect the general economic resilience of prosperous cities but rather the temperature sensitivity and substitution resilience that the digital economy exhibits as a new form of economic activity when confronted with extreme climate shocks. This provides further corroboration for H1.
Table 9.
Robustness Checks with Conventional Macroeconomic Indicators.
5.3.6. Endogeneity Tests
Although the preceding analysis has verified the asymmetrical impacts of extreme temperatures on the digital economy through the SDM and a series of robustness checks, the model may still be subject to endogeneity arising from omitted variables or reverse causality. For instance, regions with developed digital economies may possess greater infrastructure investment capacity and environmental adaptability, which could artificially alter local microclimate exposure. Addressing endogeneity solely through conventional non-spatial IV models would leave spatial omitted variable bias unresolved. To thoroughly purge the above endogeneity, this study employs the generalized spatial two-stage least squares (GS2SLS) estimator [66] to conduct rigorous causal inference. To satisfy the strict exogeneity requirements, this study constructs two instrumental variables (IVs) based on historical and geographic climate variables. First, drawing on the shift-share method of Bartik (1991) [67], this IV is constructed as the interaction between a city’s initial climate endowment and aggregate national climate fluctuations. A region’s baseline climate determines its long-term climate evolution patterns. In terms of exogeneity, the historical climate in 2012 constitutes predetermined variables, and aggregate national climate fluctuations are purely natural phenomena. The interaction of these two components severs any reverse causality running from contemporaneous local digital economy development to extreme temperatures [68]. Second, this study constructs a deep-lag historical IV. Given the serial autocorrelation of geographic and meteorological characteristics, extreme temperatures three years prior effectively predict current climate conditions, satisfying the relevance condition. The irreversibility of time provides a natural exclusion restriction. Compared to a one-period lag, the three-period deep historical shock introduces sufficient temporal distance to entirely preclude the influence of current digital economy policies and short-term infrastructure investment, thereby ensuring its strict exogeneity.
Table 10 reports the GS2SLS endogeneity test results. In Table 10, the predictive coefficients of the instrumental variables on the endogenous extreme temperature variables are all highly significant, and the first-stage Cragg–Donald Wald F-statistics are extremely high, far exceeding the Stock–Yogo critical values at the 10% level, demonstrating strong explanatory power and ruling out the possibility of weak instruments. Meanwhile, to test whether the model suffers from under-identification, Table 10 further reports the Kleibergen–Paap rk LM statistic. The results show that across all model specifications, the values of this statistic are large, and the corresponding p-values are all significant at the 1% level. This strongly rejects the null hypothesis of under-identification at the 1% significance level, further confirming that the instrumental variables constructed in this study are closely correlated with the endogenous explanatory variables and that the selection of instrumental variables and model identification are fully valid and reliable. More critically, to accommodate the heteroskedasticity present in the model, this paper employs the more rigorous Wooldridge robust score test to identify variable endogeneity. The results show that the p-values of the robust endogeneity tests all exceed 0.1, statistically failing to reject the null hypothesis that extreme temperatures are exogenous variables. This statistically confirms the exogeneity of extreme temperature shocks, thereby providing robust evidence for the unbiasedness and high reliability of the preceding baseline regression results. Although the endogeneity tests do not diagnose severe endogeneity, given the complexity of omitted variables in spatial panel data, this paper retains GS2SLS as a supplementary double-insurance verification to preclude potential spatial omitted variable bias.
Table 10.
Endogeneity Test Results.
In the second-stage regression, because the model simultaneously incorporates two-way fixed effects, instrumental variables and spatial lag terms, the statistical significance of the core explanatory variables exhibits a certain degree of attenuation. To enhance the transparency of the empirical results and characterize the sources of causal identification, this paper estimates the residual variation of the model based on the Frisch–Waugh–Lovell theorem. The results indicate that after partialing out city fixed effects, year fixed effects and all control variables, the residual variation retained by extreme heat and extreme cold accounts for 17.76% and 22.76%, respectively. This implies that approximately 80% of the systematic error and macro-level confounders in the data have been removed by the two-way fixed effects, and GS2SLS strictly exploits the remaining approximately 20% of extreme meteorological anomaly shocks. Therefore, the attenuation in significance represents the statistical cost of obtaining unbiased causal estimates after absorbing a large share of effective variation through multiple fixed effects [64], rather than a failure of the model itself.
However, even under these stringent conditions, the asymmetry in the impact of extreme temperatures on the digital economy continues to hold. The estimated coefficient for extreme heat consistently remains positive, and the estimated coefficient for extreme cold consistently remains negative, with no sign reversal occurring in either case. This indicates that the baseline regression conclusions that extreme heat promotes development while extreme cold is destructive are not driven by endogeneity or statistical coincidence but instead reflect objective physical mechanisms. Furthermore, the spatial lag terms remain robustly negative in the main models, confirming the validity of the spatial spillover effects. Overall, the GS2SLS-based estimates further validate the reliability of the core causal conclusions.
Furthermore, regarding the exclusion restriction for the instrumental variables, each specific model specification in this study employs a single instrumental variable to estimate a single endogenous explanatory variable, placing the model in a just-identified state. The Sargan–Hansen over-identification test is applicable only to over-identified models where the number of instrumental variables strictly exceeds the number of endogenous variables and is, therefore, not statistically applicable in this study. Consequently, the exogeneity and validity of the instrumental variables in this paper primarily rely on the theoretical mechanism analysis presented earlier, which logically rules out the possibility that they affect digital economy development through alternative channels.
5.3.7. Mechanism Testing
Based on the above analysis, the paper concludes that extreme temperatures have significant asymmetrical impacts on the DEDI of local and surrounding provinces. Specifically, extreme heat exhibits a significant promoting effect on the local DEDI. A set of moderating effect testing models is constructed based on Equation (1) to verify the moderating mechanisms of extreme temperatures on DEDI, thereby testing H3 and H4:
Specifically, this study introduces two moderating variables through Equations (15)–(18). In Equations (15) and (16), respectively, extreme heat days and extreme cold days are core explanatory variables and interaction terms Interact1 and Interact2 are introduced to test the moderating effect of green technological innovation between extreme heat and the digital economy. It is defined as:
In Equations (17) and (18), interaction terms Interact1 and Interact2 are introduced, respectively, to test the moderating effect of industrial structure between extreme heat and the digital economy.
Overall, Equations (15) and (16) are jointly used to test the moderating effect of green technological innovation, as shown in Table 11. Equations (17) and (18) are used to analyze the moderating effect of industrial structure, as shown in Table 12. This study uses the number of green utility model patent applications and authorizations as measurement indicators for green technological innovation. Meanwhile, industrial structure (the ratio of tertiary industry added value to regional GDP) and industrial structure upgrading (the ratio of tertiary industry to secondary industry added value) are used to measure regional industrial structure.
Table 11.
Moderating Effect Results of Green Innovation.
Table 12.
Moderating Effect Results of Industrial Structure.
Table 11 displays the moderating role of regional green technological innovation in the impact of extreme temperatures on digital economy development, where Interact1 and Interact2 are interaction terms between extreme temperatures and green technological innovation.
First, under extreme heat conditions, the coefficient on Interact1 is significantly negative in both columns (1) and (3). This indicates that green technological innovation significantly attenuates the positive effect of extreme heat on digital economy development. While extreme heat itself may be associated with a higher DEDI, a higher regional level of green innovation weakens this positive association. This empirical result validates the substitution effect proposed above. Higher levels of green technological innovation enhance the thermal resilience of the built environment and reduce operating costs, thereby alleviating market participants’ incentive to migrate activities to the online digital space. This physical adaptation substitutes for digital adaptation, which at the aggregate level manifests as green innovation dampening the latent positive impact of extreme heat. Second, under extreme cold conditions, the coefficient on Interact2 is significantly positive in both columns (2) and (4). Combined with the significantly negative direct effect of Ltemp15 on the digital economy in column (4), the significantly positive interaction coefficient indicates that green technological innovation mitigates the adverse impact of extreme cold on digital economy development. The higher a region’s level of green innovation, the smaller the damage that extreme cold inflicts on the digital economy. In column (2), although the direct effect of Ltemp15 is statistically insignificant, the positive moderating role of green innovation persists, which suggests that green innovation can improve the sensitivity of digital economy development to cold weather conditions. This confirms the critical role of green technological innovation in terms of physical protection. Green innovation reduces the physical damage that extreme cold inflicts on communication base stations and hardware supply chains, providing a solid hardware and energy foundation for the stable operation of the digital economy.
In sum, green technological innovation manifests as demand substitution under heat shocks and as physical protection under cold shocks. This differentiated moderating pathway fully reflects the complexity and asymmetry of the impacts of extreme climate events.
According to the results in Table 12, in columns (1) and (3), the coefficients of interaction term Interact1 are both positively significant, which indicates that industrial structure has a significant positive moderating effect on the impact of extreme heat on DEDI. Specifically, when the industrial structure ratio is higher, the positive promoting effect of extreme heat on DEDI becomes increasingly enhanced. In the verification of the replaced moderating variables in columns (2) and (4), the interaction term Interact2 remains positively significant, further proving that industrial structure has a significant positive moderating effect on the impact of extreme heat on DEDI. Whether extreme heat or extreme cold, the moderating effect has significant positive impacts on the digital economy. Regional economic resilience theory holds that short-term external shocks can trigger long-term structural transformation [58]. The mediation effect results indicate that an optimized industrial structure serves as the critical nexus from short-term shocks to long-term optimization. It can smoothly convert the constraints triggered by extreme temperatures into immediate digitalization demand in the short term by reducing economic dependence on the physical environment [69]. In regions with advanced industrial structure, when responding to extreme temperatures, markets and policymakers are inclined to transform short-term adaptive behaviors into long-term resource reallocation, driving the concentration of capital and labor toward the digital economy, which achieves the upgrading of the industrial structure [70]. Therefore, the industrial structure functions in transforming short-term extreme temperature shocks into long-term structural impacts on the digital economy, ultimately contributing to a higher DEDI. Hypothesis H4 is supported.
In summary, mechanism testing indicates that green technological innovation primarily influences the DEDI by promoting short-term infrastructure recovery capacity and long-term technological investment, whereas the industrial structure strengthens the impact of extreme temperatures on the DEDI by improving adaptive capacity and resource allocation. These two pathways jointly reveal the intrinsic mechanisms through which short-term climate shocks shape the long-term development pattern of the digital economy through different intermediary channels.
To verify the asymmetry and thresholds of the moderating effects posited in the theoretical framework, this paper further employs a categorical interaction approach to overcome the limitation whereby continuous linear interaction terms may mask heterogeneity across different levels. Given that technology accumulation and industrial leapfrogging often require crossing relatively high thresholds, this paper divides green technological innovation and industrial structure into four groups by quartile (q1 to q4), focusing on the threshold-breaking effect while controlling for intercept differences across groups. The regression results are presented in Table 13 and Table 14.
Table 13.
Threshold Moderating Effects of Green Technological Innovation.
Table 14.
Threshold Moderating Effects of Industrial Structure.
The results in Table 13 confirm the asymmetrical moderating and threshold effects of green innovation. Under extreme heat, the interaction coefficients for the low-to-middle groups are significantly positive, whereas when green innovation crosses the highest threshold, the interaction coefficient becomes significantly negative. This indicates that only high-level green technology can improve the resilience of the physical environment, thereby attenuating the surge in digital demand induced by extreme heat. Under extreme cold, the coefficients for the low-to-middle groups are negative or significant at the 10% significance level, and only the coefficient for the highest group is significantly positive at the 1% significance level. This confirms that the physical defense mechanism against extreme cold is subject to a strict theoretical threshold. Sporadic technology accumulation cannot provide protection, and only by crossing the high-level threshold can the impact of extreme cold be effectively reversed. Hypothesis H3 is, thus, validated.
Table 14 presents the regression results for industrial structure at different levels. Under extreme heat shocks, the interaction coefficients for the low-to-middle groups are all significantly positive, whereas when the industrial structure crosses the highest threshold, the significance of the interaction coefficient declines. This indicates that during the industrial structure transition period, regions are able to convert the impact of extreme heat into digital demand, thereby amplifying the digital economy dividend. When the industrial structure reaches the highest-level threshold, however, because the regional economic form is already highly digitalized, the digital substitution demand generated by extreme heat stabilizes, leading to a decline in coefficient significance. Under extreme cold shocks, the results reveal the existence of a dual disadvantage. The interaction coefficients for regions with low-to-middle industrial structure levels are mostly insignificant or even negative. This confirms that regions in the early-to-middle stages of transition, having not yet fully shed their dependence on physical supply chains, remain unable to effectively withstand extreme cold shocks. Importantly, only when the industrial structure enters the advanced stage does the interaction coefficient turn significantly positive. This nonlinear finding complements the limitations of the linear baseline model, confirming that the dominance of advanced industrial structure constitutes a necessary threshold condition for withstanding extreme cold. Based on the above analysis, hypothesis H4 is validated.
5.3.8. Heterogeneity Analysis
To further explore the impact of extreme temperatures on the DEDI in terms of regional differences, this study adopts classification methods to conduct heterogeneity analyses of regions with different backgrounds [24]. First, we conducted classification by urban agglomeration. Whether they are world-class urban agglomerations such as New York, London and Tokyo or regional urban agglomerations in developing countries, all play pivotal roles in the national economy and spatial layout through factor agglomeration and functional coordination. This study selects five representative Chinese urban agglomerations for analysis. The results shown in Table 15 indicate that in the Beijing–Tianjin–Hebei urban agglomeration, the positive impact of extreme cold on DEDI is more significant than that of extreme heat. In the Yangtze River Delta and Chengdu–Chongqing urban agglomerations, extreme cold suppresses digital economy development. In the Pearl River Delta and Middle Yangtze River urban agglomerations, the impacts of extreme temperatures are not significant.
Table 15.
Heterogeneity Analysis Results of Urban Agglomeration.
Second, we divided by economic zones. Heterogeneity analysis of prefecture-level cities by economic zones helps identify structural differences in resource endowments, policy environments and development stages across regions. The results in Table 16 show that in the Northern Coastal Economic Zone, both extreme heat and extreme cold produce significantly positive impacts on DEDI. In the Middle Yangtze River Economic Zone, extreme temperature impacts exhibit asymmetry, with extreme heat showing significant positive effects. In the Eastern Coastal and Southern Coastal Economic Zones, extreme temperature impacts are not significant. It is worth noting that the Middle Yellow River Economic Zone does not show spatial spillover effects on the digital economy, but extreme cold has a suppressive effect on digital economy development in this region.
Table 16.
Heterogeneity Analysis Results of Economic Zone.
Third, we divided by geographic location. Based on national macro strategies and natural geographic boundaries, 281 prefecture-level cities are divided into eastern, central, western and northeast regions, as well as southern and northern regions. The results in Table 17 show that in the eastern and central regions, extreme temperature impacts exhibit asymmetry. Extreme heat has significant positive effects, but the central region does not exhibit spatial spillovers. In the northeast region, extreme heat promotes digital economy development, while extreme cold produces suppression. In the southern region, extreme heat has significant positive impacts, while extreme cold produces suppression. The impacts in the northern region are not significant.
Table 17.
Heterogeneity Analysis Results of Geographic Location.
Fourth, we classified by city characteristics. Cities are divided into resource-based and non-resource-based, central and peripheral cities, and coastal and inland cities. The results in Table 18 show that whether in resource-based or non-resource-based cities, extreme heat produces significantly positive impacts on DEDI. In central cities, peripheral cities and coastal cities, extreme heat also exhibits significant promoting effects. Extreme cold in central cities also promotes digital economy development, but inland cities show no significant impacts from extreme temperatures.
Table 18.
Heterogeneity Analysis Results of Characteristic Classification.
Finally, we classified by specific attributes. Classifications include environmental protection key and non-key cities, old industrial base and non-old industrial base cities, and regions north of, on and south of the Hu Huanyong Line. The results in Table 19 show that in both environmental protection key and non-key cities, extreme heat has significantly positive impacts on DEDI. In old industrial base cities, extreme heat promotes development while extreme cold produces suppression. In non-old industrial base cities, only extreme heat has promoting effects. When divided by the Hu Huanyong Line, regions north of and on the line consistently show extreme cold suppressing digital economy development, while regions south of the line show extreme heat having promoting effects.
Table 19.
Heterogeneity Analysis Results of Specific Classification.
6. Further Analysis
This study employs the long-difference model [71] to investigate the long-term impact of extreme temperatures on DEDI:
where represents the difference in DEDI; and are the differences in extreme temperature days; are the difference in the control variables and their quadratic terms; is the time period dummy variable and is the error term.
Table 20 displays the estimated long-term difference results, revealing the medium-term impacts of extreme temperatures on DEDI. The research finds that the negative impact of extreme heat on DEDI is more significant than the short-term effects, showing sustained medium-term impacts, which further proves that the asymmetry of extreme temperature impacts on DEDI also exists in the medium term.
Table 20.
Long-Difference Results.
7. Conclusions and Implications
This study employs a sample of 281 prefecture-level cities in China from 2012 to 2023, aiming to reveal how short-term shocks from extreme temperatures ultimately influence the development of regional digital economies by affecting the long-term expectations and decisions of market participants, and it provides policy references to promote digital economy development.
First, extreme temperature days exhibit significant evolution and regional differentiation. Extreme heat days nationwide increase substantially in China. Almost all cities experience exponential growth, with northern cities showing particularly pronounced increases. Extreme cold days exhibit regional differences. Cold events decrease significantly in eastern and southern coastal areas, while extreme cold days in some central and western inland cities actually increase. This phenomenon indicates that cold temperature response possesses geographic heterogeneity. Second, the DEDI shows a three-stage evolution. From 2012 to 2019, this index steadily rose. In 2020, it experienced a cliff-like decline due to the COVID-19 pandemic shock. By 2023, the index slowly recovered with further widening regional disparities.
Third, DEDI exhibits significant spatial autocorrelation and clustering effects. Moran’s I calculated using global spatial autocorrelation analysis shows that extreme heat, extreme cold and DEDI all exhibit positive spatial dependence. This indicates that obvious spatial clustering relationships exist among neighboring regions. Local spatial analysis shows that the digital economy pattern underwent a structural evolution from 2012 to 2023. Extreme heat shifted from the pattern of widespread Low–Low clusters and sporadic High–High clusters to the pattern of contiguous High–High clusters and dissipating Low–Low clusters. Extreme cold trended from the pattern of coexisting Low–Low and High–High clusters toward the pattern dominated by dissipating Low–Low and High–High clusters and homogenization.
Fourth, the regression analysis employs a spatial Durbin model with time fixed effects only to preserve crucial climate–geographic cross-sectional variation. To address potential endogeneity in the spatial econometric model, this study introduces two sets of instrumental variables as initial climate shift-share and deeply lagged historical instruments and employs GS2SLS regression to rigorously eliminate endogeneity bias. After partialing out approximately 80% of fixed effects confounders, the results from the baseline regression, robustness checks and endogeneity tests collectively demonstrate that extreme temperatures exert asymmetrical impacts on digital economy development.
Fifth, the spatial effects decomposition and temporal dynamic tests reveal differences between direct and indirect effects and between short-term and long-term mechanisms. In the temporal dimension, extreme heat not only triggers digital substitution demand in the short term but also translates into IT human capital and infrastructure investment in the long term. By contrast, extreme cold remains confined to short-term emergency responses and lacks long-term structural effects. In the spatial dimension, the net effect of extreme heat suppresses digital economy development, driven primarily by the crowding-out effect of cross-city power dispatching. The direct effect of extreme cold is significant, but its indirect and total effects are insignificant, which indicates that the impact of extreme cold is constrained by local heating systems and largely confined to the local scope.
Sixth, the mechanism tests demonstrate that both green technological innovation and industrial structure play critical moderating roles, exhibiting significant asymmetry and nonlinear threshold characteristics. Green technological innovation attenuates the positive effect of extreme heat by enhancing environmental resilience and mitigates the negative impact of extreme cold through physical protection. More critically, this physical protection is subject to a critical mass effect. Only when green innovation crosses a high threshold can it effectively withstand extreme cold shocks. For industrial structure, its moderating role exhibits stage-specific characteristics. Regions in the intermediate transition phase face a dual disadvantage and vulnerability. Only when the industrial structure undergoes comprehensive upgrading and crosses the advanced-stage threshold can regional economic resilience be activated, amplifying the promotional effect of extreme temperatures on the digital economy or mitigating their negative impact.
Seventh, the impact of extreme temperatures on the digital economy exhibits significant regional heterogeneity and asymmetry. Overall, extreme heat demonstrates positive driving effects in most regions. The impact of extreme cold has bidirectional effects, exhibiting promoting effects in Beijing–Tianjin–Hebei and central cities but significantly suppressing digital economy development in the Yangtze River Delta, Northeast China and regions north of the Hu Huanyong Line. Additionally, economically developed coastal regions show relatively low sensitivity to temperature fluctuations.
Based on the above conclusions, this study proposes three policy recommendations to address the complex relationship between extreme temperatures and digital economy development.
First, given that extreme heat inhibits digital economy development primarily through the energy crowding-out indirect effect, while the impact of extreme cold is largely confined to the local level, cross-regional coordinated dispatch mechanisms integrating climate response and digital computing power should be established. Drawing on the EU Emissions Trading System’s experience in compensating for cross-regional environmental spillovers, regional mutual aid funds could be established to provide digital infrastructure upgrade subsidies to areas indirectly harmed by cross-regional electricity dispatch triggered by extreme heat. Simultaneously, local early warning and emergency response systems for extreme cold events should be strengthened.
Second, given the threshold effects of green technological innovation and industrial structure upgrading, investment in green technology R&D should be expanded to ensure that technology accumulation crosses the critical mass capable of substantive physical protection, as exemplified by the Copenhagen model in Denmark. Concurrently, efforts should be directed toward advancing industrial structure optimization. In particular, for regions in the intermediate stage of industrial structure transition, governments should provide targeted digital infrastructure subsidies to help them navigate the vulnerable dual-disadvantage phase, thereby enhancing the regional capacity to convert the short-term shocks of extreme temperatures into the long-term structural development of the digital economy, which could draw on the successful practice of Germany’s Ruhr region in addressing environmental pressures through industrial transformation and upgrading.
Third, considering the significant regional heterogeneity of the impacts, differentiated regional policies need to be implemented. For the Beijing–Tianjin–Hebei urban agglomeration, guidance should strengthen the positive effects of extreme cold. The Yangtze River Delta and Chengdu–Chongqing urban agglomerations should focus on suppressing the negative impacts of extreme cold. The Northern Coastal Economic Zone and Middle Yangtze River Economic Zone should leverage the positive effects of extreme heat. Regions north of and on the Hu Huanyong Line should focus on alleviating the suppressive effects of extreme cold, while regions south of the line should utilize extreme heat to promote digital economy development.
Author Contributions
Writing–original draft, Y.Y., Y.R. and J.W.; Writing–review & editing, Y.Y., Y.R., J.W. and R.S. All authors have read and agreed to the published version of the manuscript.
Funding
This research was funded by Guangxi Social Sciences Foundation grant number [25XWF520].
Institutional Review Board Statement
Not applicable.
Informed Consent Statement
Not applicable.
Data Availability Statement
The raw data supporting the conclusions of this article will be made available by the authors on request.
Conflicts of Interest
The authors declare no conflict of interest.
References
- Hoegh-Guldberg, O.; Jacob, D.; Taylor, M.; Bolaños, T.G.; Bindi, M.; Brown, S.; Camilloni, I.A.; Diedhiou, A.; Djalante, R.; Ebi, K.; et al. The human imperative of stabilizing global climate change at 1.5 °C. Science 2019, 365, eaaw6974. [Google Scholar] [CrossRef] [Scilit]
- Karl, T.R.; Trenberth, K.E. Modern Global Climate Change. Science 2003, 302, 1719–1723. [Google Scholar] [CrossRef] [Scilit] [PubMed]
- Brown, S.J.; Caesar, J.; Ferro, C.A.T. Global changes in extreme daily temperature since 1950. J. Geophys. Res. Atmos. 2008, 113, D05115. [Google Scholar] [CrossRef] [Scilit]
- Kim, Y.-H.; Min, S.-K.; Zhang, X.; Zwiers, F.; Alexander, L.V.; Donat, M.G.; Tung, Y.-S. Attribution of extreme temperature changes during 1951–2010. Clim. Dyn. 2016, 46, 1769–1782. [Google Scholar] [CrossRef] [Scilit]
- Stott, P. How climate change affects extreme weather events. Science 2016, 352, 1517–1518. [Google Scholar] [CrossRef] [Scilit]
- Hsiang, S.M. Temperatures and cyclones strongly associated with economic production in the Caribbean and Central America. Proc. Natl. Acad. Sci. USA 2010, 107, 15367–15372. [Google Scholar] [CrossRef] [Scilit] [PubMed]
- Callahan, C.W.; Mankin, J.S. Globally unequal effect of extreme heat on economic growth. Sci. Adv. 2022, 8, eadd3726. [Google Scholar] [CrossRef] [Scilit]
- Garg, T.; Gibson, M.; Sun, F. Extreme temperatures and time use in China. J. Econ. Behav. Organ. 2020, 180, 309–324. [Google Scholar] [CrossRef] [Scilit]
- Walsh, J.E.; Ballinger, T.J.; Euskirchen, E.S.; Hanna, E.; Mård, J.; Overland, J.E.; Tangen, H.; Vihma, T. Extreme weather and climate events in northern areas: A review. Earth-Sci. Rev. 2020, 209, 103324. [Google Scholar] [CrossRef] [Scilit]
- Boar, A.; Bastida, R.; Marimon, F. A Systematic Literature Review. Relationships between the Sharing Economy, Sustainability and Sustainable Development Goals. Sustainability 2020, 12, 6744. [Google Scholar] [CrossRef] [Scilit]
- Aivazidou, E.; Tsolakis, N.; Mollona, E. Circular Economy 5.0 on Its Way: A Digital Sustainability Transition. Acad. Manag. Perspect. 2025, amp.2023.0161. [Google Scholar] [CrossRef] [Scilit]
- Yu, D.; Yang, L.; Xu, Y. The Impact of the Digital Economy on High-Quality Development: An Analysis Based on the National Big Data Comprehensive Test Area. Sustainability 2022, 14, 14468. [Google Scholar] [CrossRef] [Scilit]
- Liu, L.; Liu, M. How does the digital economy affect industrial eco-efficiency? Empirical evidence from China. Data Sci. Financ. Econ. 2022, 2, 371–390. [Google Scholar] [CrossRef] [Scilit]
- Zhou, M.; Guo, F. Mechanism and spatial spillover effect of digital economy on common prosperity in the Yellow River Basin of China. Sci. Rep. 2024, 14, 23086. [Google Scholar] [CrossRef] [Scilit]
- Xia, Z.; Tianhua, L.; Suzhen, W.; Binyue, C. The Index System of Comprehensive Evaluation of Digital Economic. In 2021 16th International Conference on Computer Science & Education (ICCSE); IEEE: Houston, TX, USA, 2021; pp. 534–539. [Google Scholar] [CrossRef] [Scilit]
- Zhang, W.; Zhao, S.; Wan, X.; Yao, Y. Study on the effect of digital economy on high-quality economic development in China. PLoS ONE 2021, 16, e0257365. [Google Scholar] [CrossRef] [Scilit] [PubMed]
- Guo, C.; Song, Q.; Yu, M.-M.; Zhang, J. A digital economy development index based on an improved hierarchical data envelopment analysis approach. Eur. J. Oper. Res. 2024, 316, 1146–1157. [Google Scholar] [CrossRef] [Scilit]
- Chen, F.; Zhang, J.; Chen, Z. Assessment of the effects of extreme temperature on economic activity. Ecol. Econ. 2024, 222, 108225. [Google Scholar] [CrossRef] [Scilit]
- Wang, Y.; Song, L.; Ye, D.; Wang, Z.; Gao, R.; Li, X.; Yin, Y.; Wang, Z.; Liao, Y. Construction and Application of a Climate Risk Index for China. J. Meteorol. Res. 2018, 32, 937–949. [Google Scholar] [CrossRef] [Scilit]
- Burke, M.; Hsiang, S.M.; Miguel, E. Global non-linear effect of temperature on economic production. Nature 2015, 527, 235–239. [Google Scholar] [CrossRef] [Scilit]
- Grotjahn, R.; Black, R.; Leung, R.; Wehner, M.F.; Barlow, M.; Bosilovich, M.; Gershunov, A.; Gutowski, W.J.; Gyakum, J.R.; Katz, R.W.; et al. North American extreme temperature events and related large scale meteorological patterns: A review of statistical methods, dynamics, modeling, and trends. Clim. Dyn. 2016, 46, 1151–1184. [Google Scholar] [CrossRef] [Scilit]
- Kron, W.; Löw, P.; Kundzewicz, Z.W. Changes in risk of extreme weather events in Europe. Environ. Sci. Policy 2019, 100, 74–83. [Google Scholar] [CrossRef] [Scilit]
- Titley, D.; Hegerl, G.; Jacobs, K.; Mote, P.W.; Paciorek, C.J.; Shepherd, J.M.; Shepherd, T.G.; Sobel, A.H.; Walsh, J.; Zwiers, F.W. Attribution of Extreme Weather Events in the Context of Climate Change; National Academies Press: Washington, DC, USA, 2016. [Google Scholar]
- Sun, Y.; Zou, X.; Shi, X.; Zhang, P. The economic impact of climate risks in China: Evidence from 47-sector panel data, 2000–2014. Nat. Hazards 2019, 95, 289–308. [Google Scholar] [CrossRef] [Scilit]
- Feng, A.; Chao, Q. An overview of assessment methods and analysis for climate change risk in China. Phys. Chem. Earth Parts A/B/C 2020, 117, 102861. [Google Scholar] [CrossRef] [Scilit]
- Sidorov, A.; Senchenko, P. Regional Digital Economy: Assessment of Development Levels. Mathematics 2020, 8, 2143. [Google Scholar] [CrossRef] [Scilit]
- Hu, X.; Jiang, Y.; Guo, P.; Li, M. How does China’s big data policy affect the digital economy of cities? Evidence from national big data comprehensive pilot zones. Heliyon 2024, 10, e24638. [Google Scholar] [CrossRef] [Scilit]
- Anand, S.; Sen, A. Human Development and Economic Sustainability. World Dev. 2000, 28, 2029–2049. [Google Scholar] [CrossRef] [Scilit]
- Spangenberg, J.H. Economic sustainability of the economy: Concepts and indicators. Int. J. Sustain. Dev. 2005, 8, 47. [Google Scholar] [CrossRef] [Scilit]
- Olofin, O.P. Digital economy, institutional quality and economic growth in selected countries. CBN J. Appl. Stat. 2023, 14, 25–46. [Google Scholar] [CrossRef] [Scilit]
- Li, Y.; Xu, B.; Wan, Y.; Li, Y.; Li, H. Digital Economy, Spatial Imbalance, and Coordinated Growth: Evidence from Urban Agglomerations in the Middle and Lower Reaches of the Yellow River Basin. Sustainability 2025, 17, 9743. [Google Scholar] [CrossRef] [Scilit]
- Dridi, A.; Telmoudi, F. Digital Economy and Digital Maturity: A Comprehensive Review. In Digital Economy. Emerging Technologies and Business Innovation; Springer Nature: Cham, Switzerland, 2025; pp. 73–82. [Google Scholar] [CrossRef] [Scilit]
- Xie, F.; Peng, P.; Li, D.; Xu, Y.; Wu, M. Uncovering the evolution of digital economy investment networks: A county-level perspective. Comput. Urban Sci. 2025, 5, 19. [Google Scholar] [CrossRef] [Scilit]
- Demin, S.; Mikhaylova, A.; Pyankova, S. Digitalization and its impact on regional economy transformation mechanisms. Int. J. Syst. Assur. Eng. Manag. 2023, 14, 377–390. [Google Scholar] [CrossRef] [Scilit]
- Ren, X.; Li, Y.; Shahbaz, M.; Dong, K.; Lu, Z. Climate risk and corporate environmental performance: Empirical evidence from China. Sustain. Prod. Consum. 2022, 30, 467–477. [Google Scholar] [CrossRef] [Scilit]
- Nadin, R.; Opitz-Stapleton, S.; Xu, Y. (Eds.) Climate Risk and Resilience in China, 1st ed.; Routledge: Abingdon, UK, 2015. [Google Scholar]
- Simpson, M.J. Global Climate Change Impacts in the United States. J. Environ. Qual. 2011, 40, 279. [Google Scholar] [CrossRef] [Scilit]
- Jeet, D.; Mohanty, S.N.; Basa, S.S. (Eds.) Sustainability and Sustainable Development: From Vision to Reality; Apple Academic Press: Waretown, NJ, USA, 2025. [Google Scholar] [CrossRef] [Scilit]
- Zhang, H.; Liu, H.; Chen, R. Multilayer innovation network resilience: A framework for digital economy vulnerability assessment. iScience 2026, 29. [Google Scholar] [CrossRef] [Scilit] [PubMed]
- Wang, X.; Sun, M. How does digital innovation synergy improve the organisational resilience of ‘specialized, refined, differentiated, and innovative’ SMEs? Technol. Anal. Strateg. Manag. 2025, 37, 3021–3035. [Google Scholar] [CrossRef] [Scilit]
- Stern, N. The Economics of Climate Change: The Stern Review; Cambridge University Press: Cambridge, UK, 2007. [Google Scholar]
- Nordhaus, W. The Climate Casino: Risk, Uncertainty, and Economics for a Warming World; Yale University Press: New Haven, CT, USA, 2013. [Google Scholar]
- Magnan, A.K.; Bell, R.; Duvat, V.K.E.; Ford, J.D.; Garschagen, M.; Haasnoot, M.; Lacambra, C.; Losada, I.J.; Mach, K.J.; Noblet, M.; et al. Status of global coastal adaptation. Nat. Clim. Change 2023, 13, 1213–1221. [Google Scholar] [CrossRef] [Scilit]
- Hong, H.; Karolyi, G.A.; Scheinkman, J.A. Climate finance. Rev. Financ. Stud. 2020, 33, 1011–1023. [Google Scholar] [CrossRef] [Scilit]
- Agarwal, S.; Ding, Y.; Kuang, W.; Zhu, X. Are environmental punishments good news or bad news? Evidence from China. J. Environ. Econ. Manag. 2023, 120, 102847. [Google Scholar] [CrossRef] [Scilit]
- Colacito, R.; Hoffmann, B.; Phan, T. Temperature and growth: A panel analysis of the United States. J. Money Credit. Bank. 2019, 51, 313–368. [Google Scholar] [CrossRef] [Scilit]
- Stavytskyy, A.; Kharlamova, G.; Stoica, E.A. The Analysis of the Digital Economy and Society Index in the EU. TalTech J. Eur. Stud. 2019, 9, 245–261. [Google Scholar] [CrossRef] [Scilit]
- Luo, K.; Liu, Y.; Chen, P.-F.; Zeng, M. Assessing the impact of digital economy on green development efficiency in the Yangtze River Economic Belt. Energy Econ. 2022, 112, 106127. [Google Scholar] [CrossRef] [Scilit]
- Weisheimer, A.; Palmer, T.N. Changing frequency of occurrence of extreme seasonal temperatures under global warming. Geophys. Res. Lett. 2005, 32. [Google Scholar] [CrossRef] [Scilit]
- Zhang, P.; Ren, G.; Qin, Y.; Zhai, Y.; Zhai, T.; Tysa, S.K.; Xue, X.; Yang, G.; Sun, X. Urbanization Effects on Estimates of Global Trends in Mean and Extreme Air Temperature. J. Clim. 2021, 34, 1923–1945. [Google Scholar] [CrossRef] [Scilit]
- Zhongwei, Y.; Chi, Y.; Jones, P. Influence of inhomogeneity on the estimation of mean and extreme temperature trends in Beijing and Shanghai. Adv. Atmos. Sci. 2001, 18, 309–322. [Google Scholar] [CrossRef] [Scilit]
- Imran, M.; Liu, X.; Wang, R.; Saud, S.; Zhao, Y.; Khan, M.J. The Influence of Digital Economy and Society Index on Sustainable Development Indicators: The Case of European Union. Sustainability 2022, 14, 11130. [Google Scholar] [CrossRef] [Scilit]
- Wang, J.; Han, Y.; Stein, M.L.; Kotamarthi, V.R.; Huang, W.K. Evaluation of dynamically downscaled extreme temperature using a spatially-aggregated generalized extreme value (GEV) model. Clim. Dyn. 2016, 47, 2833–2849. [Google Scholar] [CrossRef] [Scilit]
- Chen, Y.; Ebenstein, A.; Greenstone, M.; Li, H. Evidence on the impact of sustained exposure to air pollution on life expectancy from China’s Huai River policy. Proc. Natl. Acad. Sci. USA 2013, 110, 12936–12941. [Google Scholar] [CrossRef] [Scilit] [PubMed]
- Pan, W.; Xie, T.; Wang, Z.; Ma, L. Digital economy: An innovation driver for total factor productivity. J. Bus. Res. 2022, 139, 303–311. [Google Scholar] [CrossRef] [Scilit]
- Du, K.; Li, P.; Yan, Z. Do green technology innovations contribute to carbon dioxide emission reduction? Empirical evidence from patent data. Technol. Forecast. Soc. Change 2019, 146, 297–303. [Google Scholar] [CrossRef] [Scilit]
- Wang, Z.; Shi, P. Research and Analysis on the Index System of Digital Economy in Anhui Province. Complexity 2021, 2021, 5535864. [Google Scholar] [CrossRef] [Scilit]
- Martin, R.; Sunley, P. On the notion of regional economic resilience: Conceptualization and explanation. J. Econ. Geogr. 2015, 15, 1–42. [Google Scholar] [CrossRef] [Scilit]
- Ren, X.; Lu, Q.; Gozgor, G.; Fu, H. Natural gas and the battle of carbon emissions: Interpreting the spatial effects of provincial carbon emissions in China. Int. Rev. Econ. Financ. 2025, 97, 103835. [Google Scholar] [CrossRef] [Scilit]
- Liu, Y.; Lian, X. The spatial spillover effect of digital economy on regional tax Revenue: An empirical study based on the decay boundary and spillover path. Int. Rev. Econ. Financ. 2025, 102, 104352. [Google Scholar] [CrossRef] [Scilit]
- Pankratz, N.; Bauer, R.; Derwall, J. Climate Change, Firm Performance, and Investor Surprises. Manag. Sci. 2023, 69, 7352–7398. [Google Scholar] [CrossRef] [Scilit]
- Li, M.; Zhang, J.; Leng, T. Extreme high temperatures and corporate green innovation: Evidence from China. Pac.-Basin Financ. J. 2025, 93, 102824. [Google Scholar] [CrossRef] [Scilit]
- Ding, C.; Liu, C.; Zheng, C.; Li, F. Digital economy, technological innovation and high-quality economic development: Based on spatial effect and mediation effect. Sustainability 2022, 14, 216. [Google Scholar] [CrossRef] [Scilit]
- Elhorst, J.P. Spatial Econometrics: From Cross-Sectional Data to Spatial Panels; Springer: Berlin, Germany, 2014. [Google Scholar]
- Wooldridge, J.M. Econometric Analysis of Cross Section and Panel Data, 2nd ed.; MIT Press: Cambridge, MA, USA, 2010. [Google Scholar]
- Kelejian, H.H.; Prucha, I.R. A generalized spatial two-stage least squares procedure for estimating a spatial autoregressive model with autoregressive disturbances. J. Real Estate Financ. Econ. 1998, 17, 99–121. [Google Scholar] [CrossRef] [Scilit]
- Bartik, T.J. Who Benefits from State and Local Economic Development Policies? W.E. Upjohn Institute: Kalamazoo, MI, USA, 1991. [Google Scholar]
- Goldsmith-Pinkham, P.; Sorkin, I.; Swift, H. Bartik instruments: What, when, and why. Am. Econ. Rev. 2020, 110, 2586–2624. [Google Scholar] [CrossRef] [Scilit]
- Niu, N.; Ma, J.; Zheng, D.; Lu, Y.; Zhang, B. Assessing the green transition of energy firms. J. Environ. Manag. 2025, 365, 121457. [Google Scholar] [CrossRef] [Scilit]
- Chang, H.; Ding, Q.; Zhao, W.; Hou, N.; Liu, W. The digital economy, industrial structure upgrading, and carbon emission intensity—Empirical evidence from China’s provinces. Energy Strategy Rev. 2023, 50, 101218. [Google Scholar] [CrossRef] [Scilit]
- Ma, X.; Zhao, Y.; Zhang, N. The effects of extreme temperatures on carbon total factor productivity: Evidence from China. J. Clean. Prod. 2024, 479, 144019. [Google Scholar] [CrossRef] [Scilit]
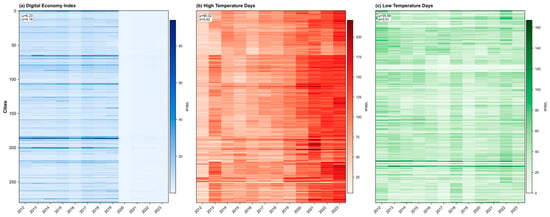
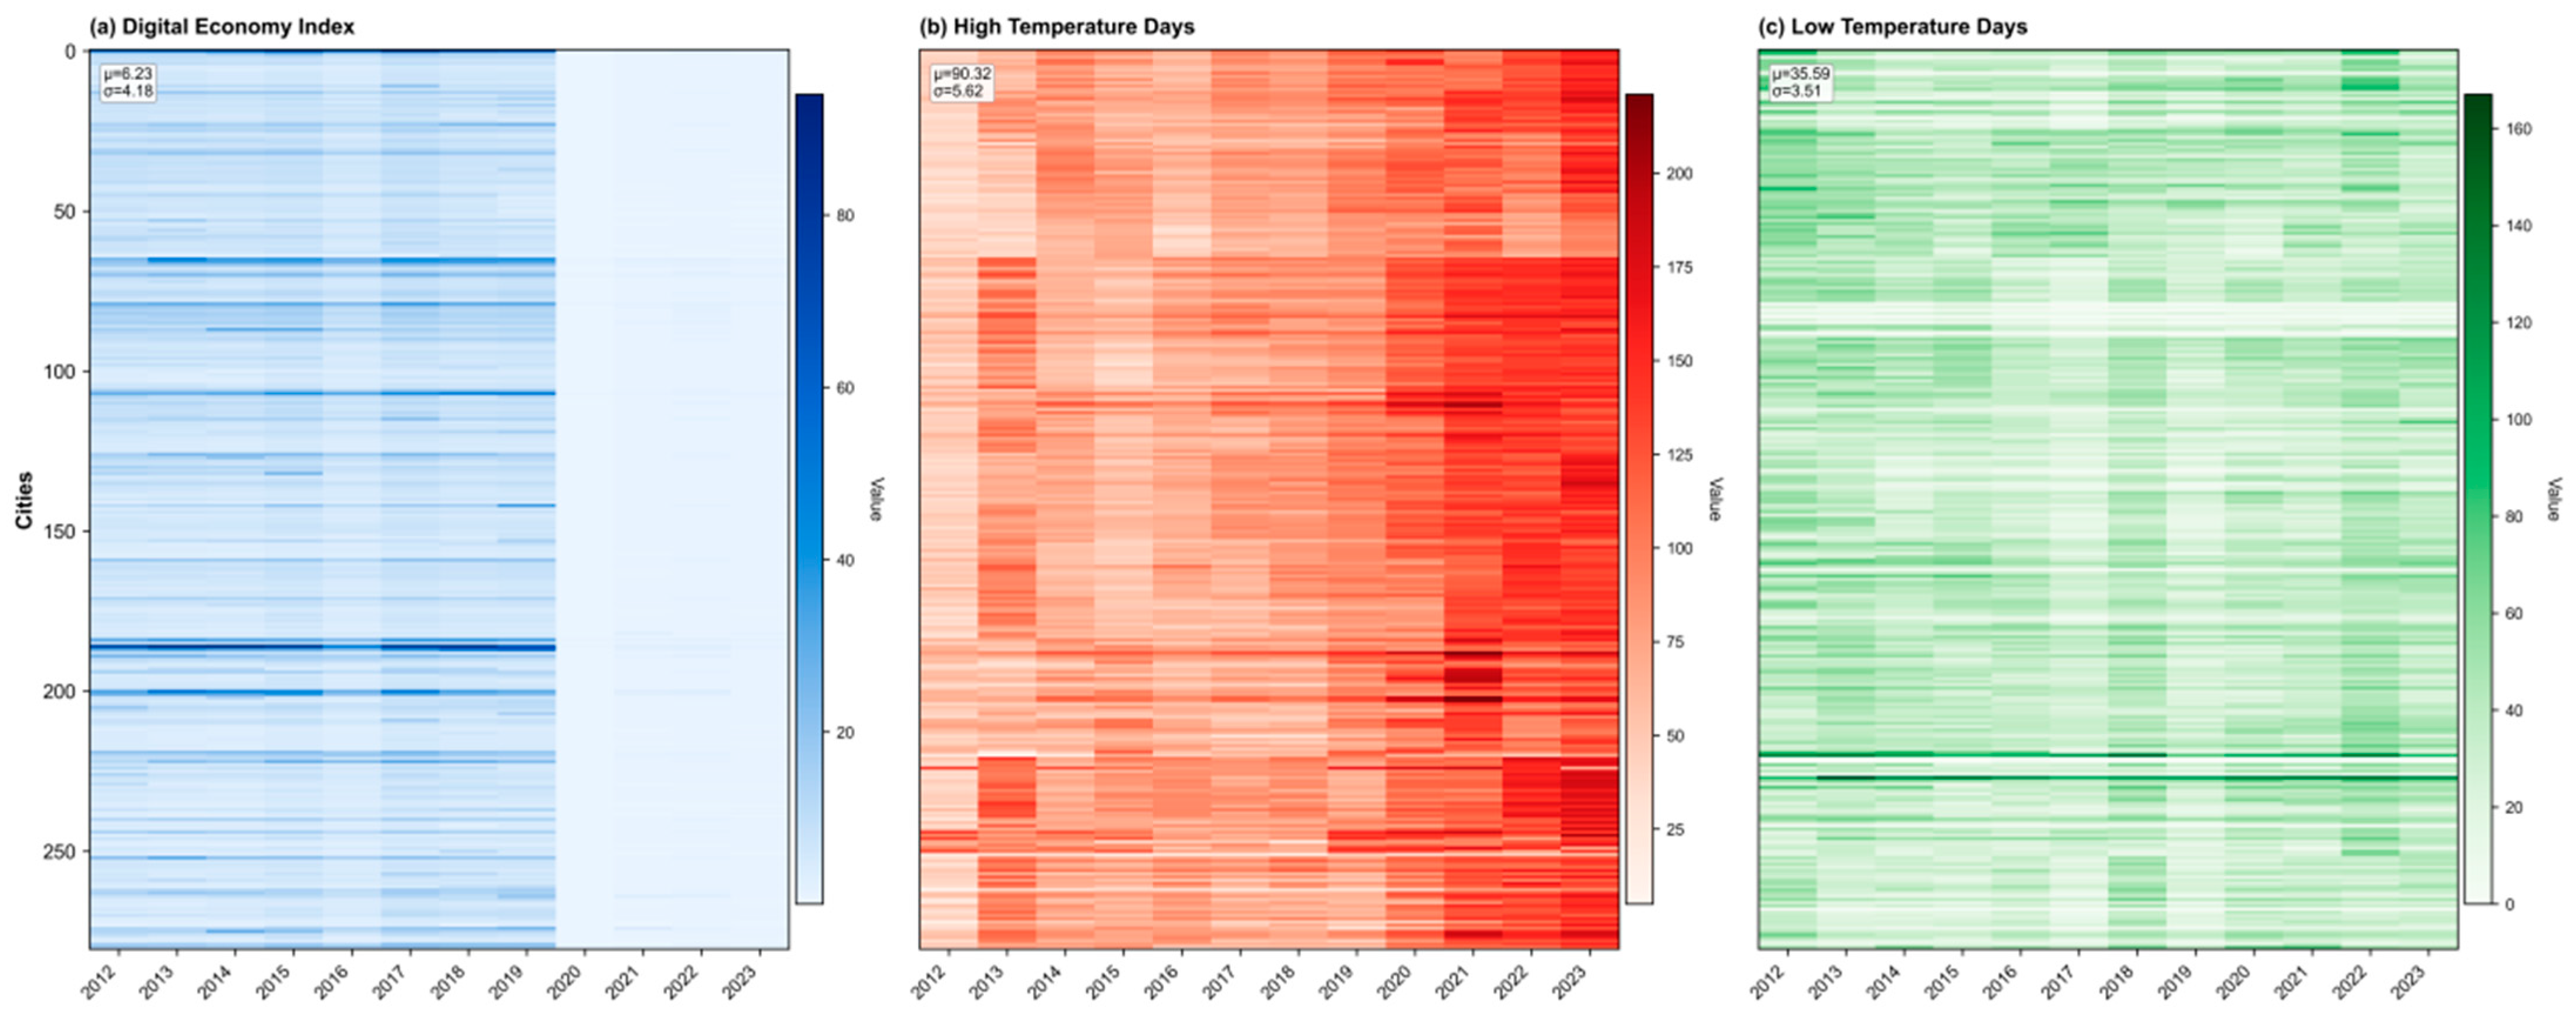
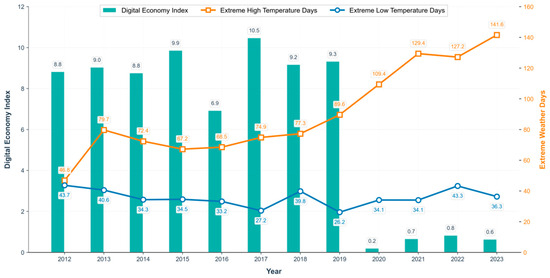
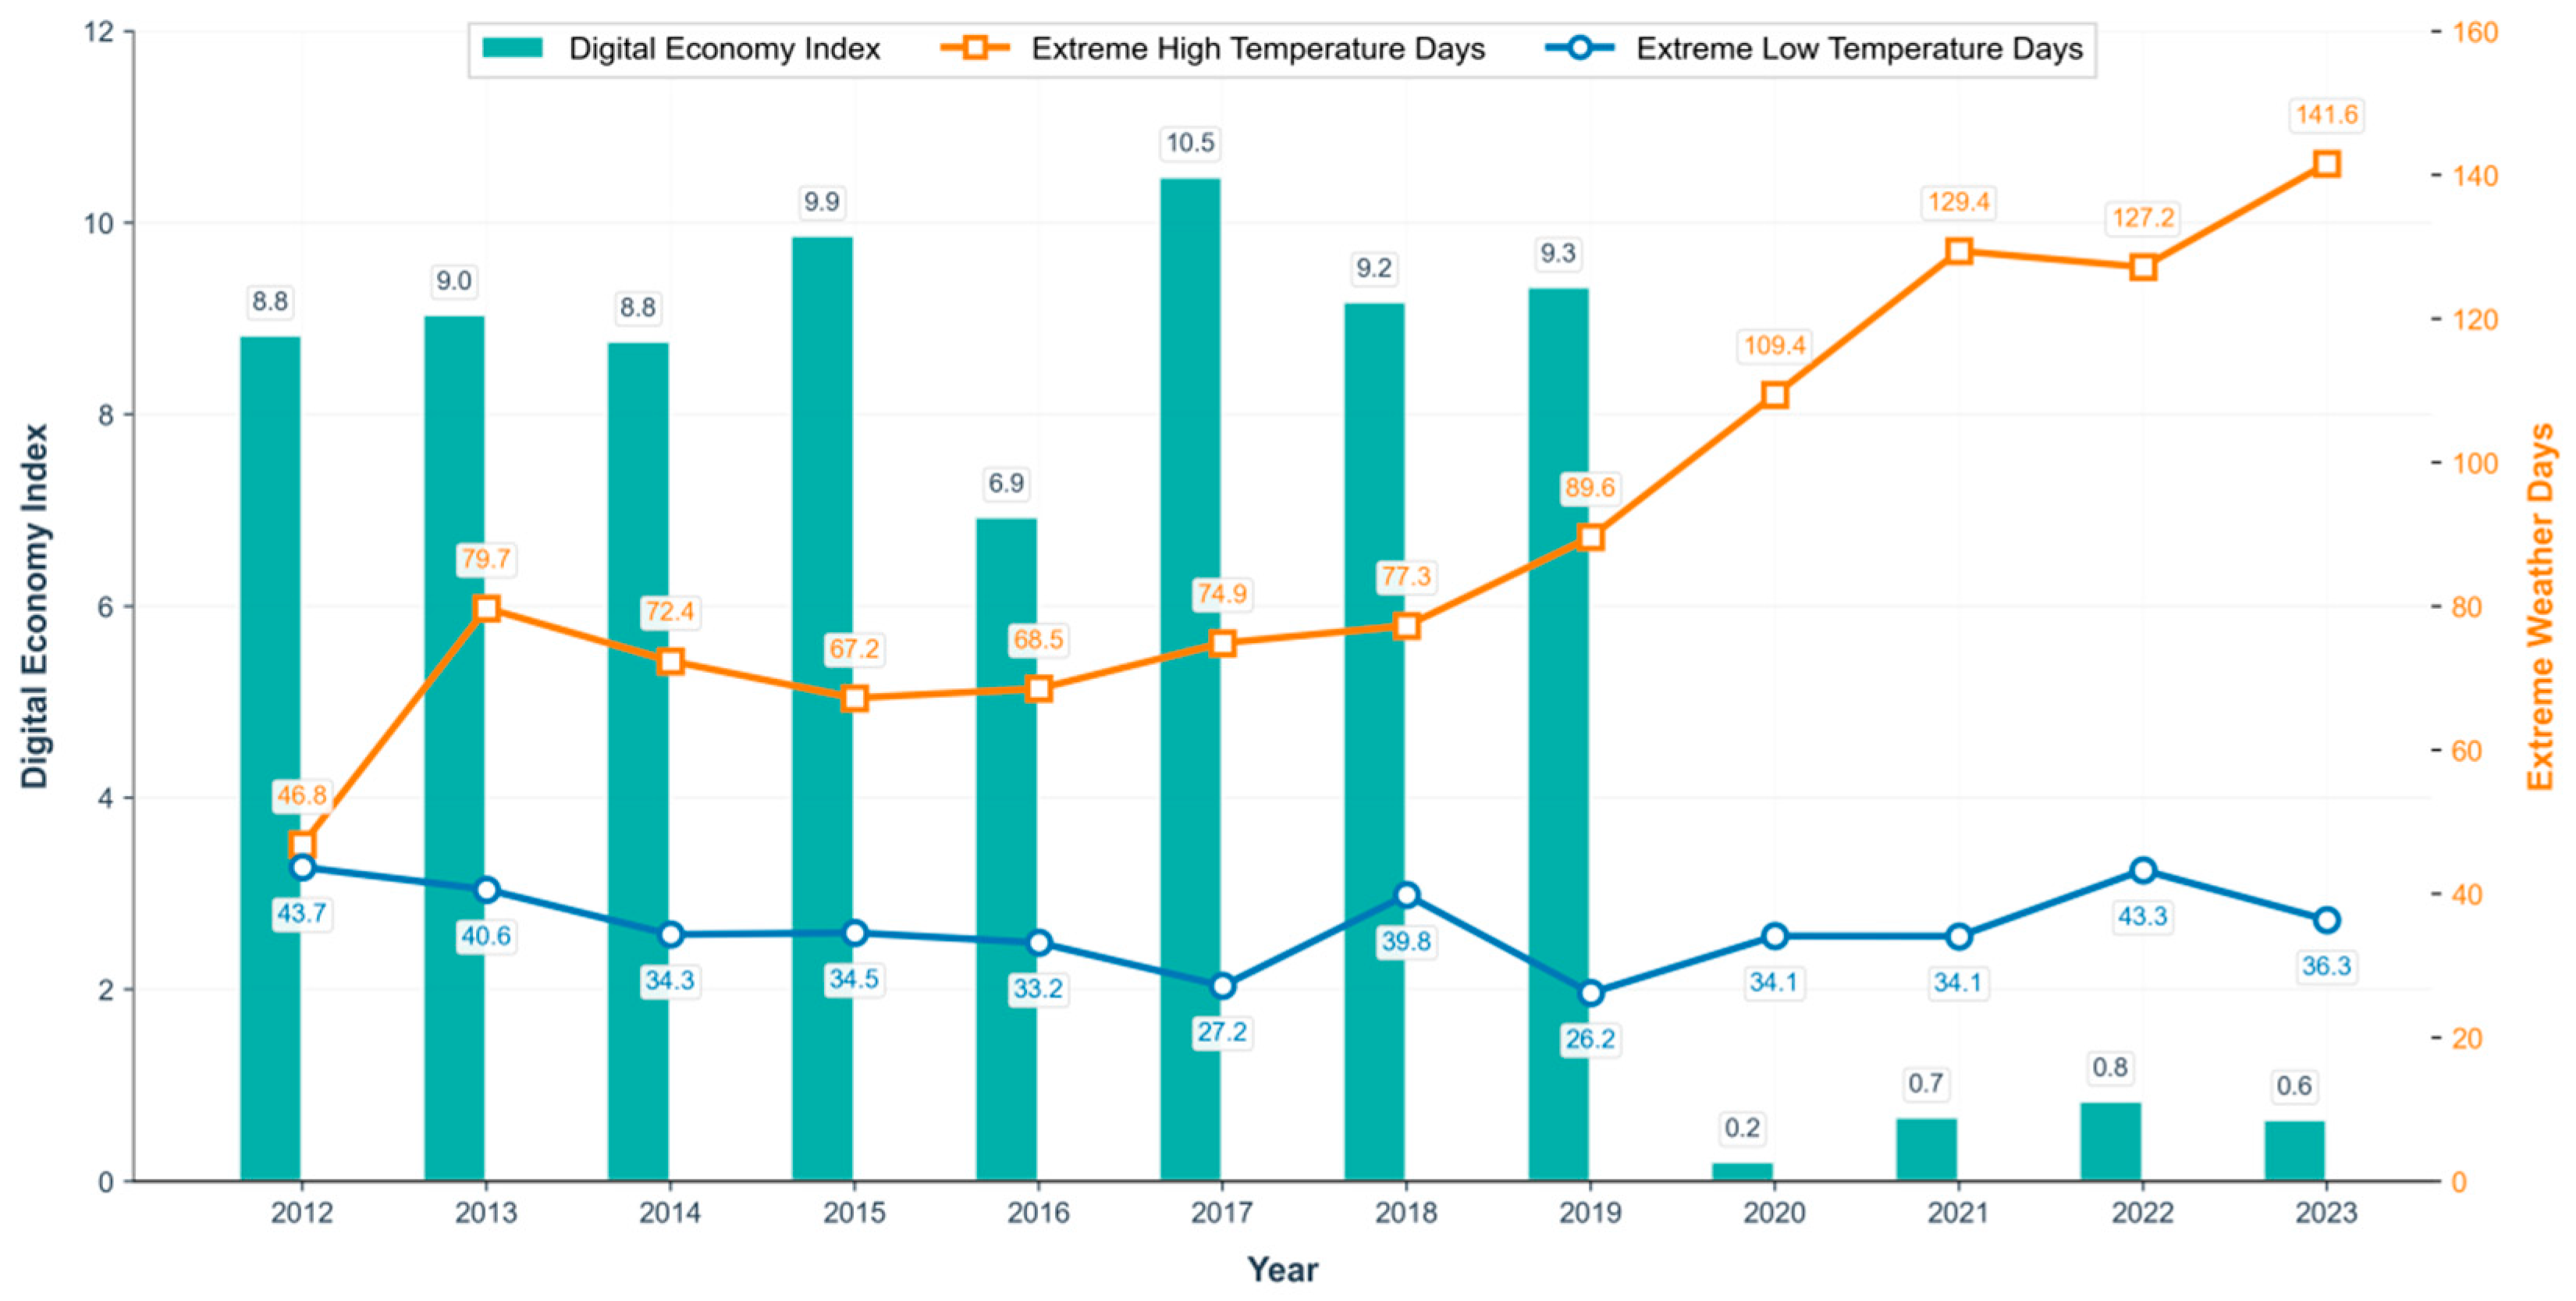
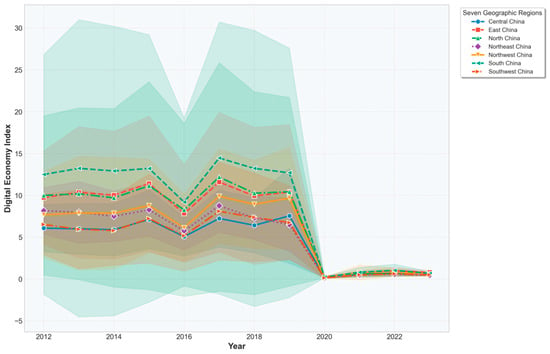
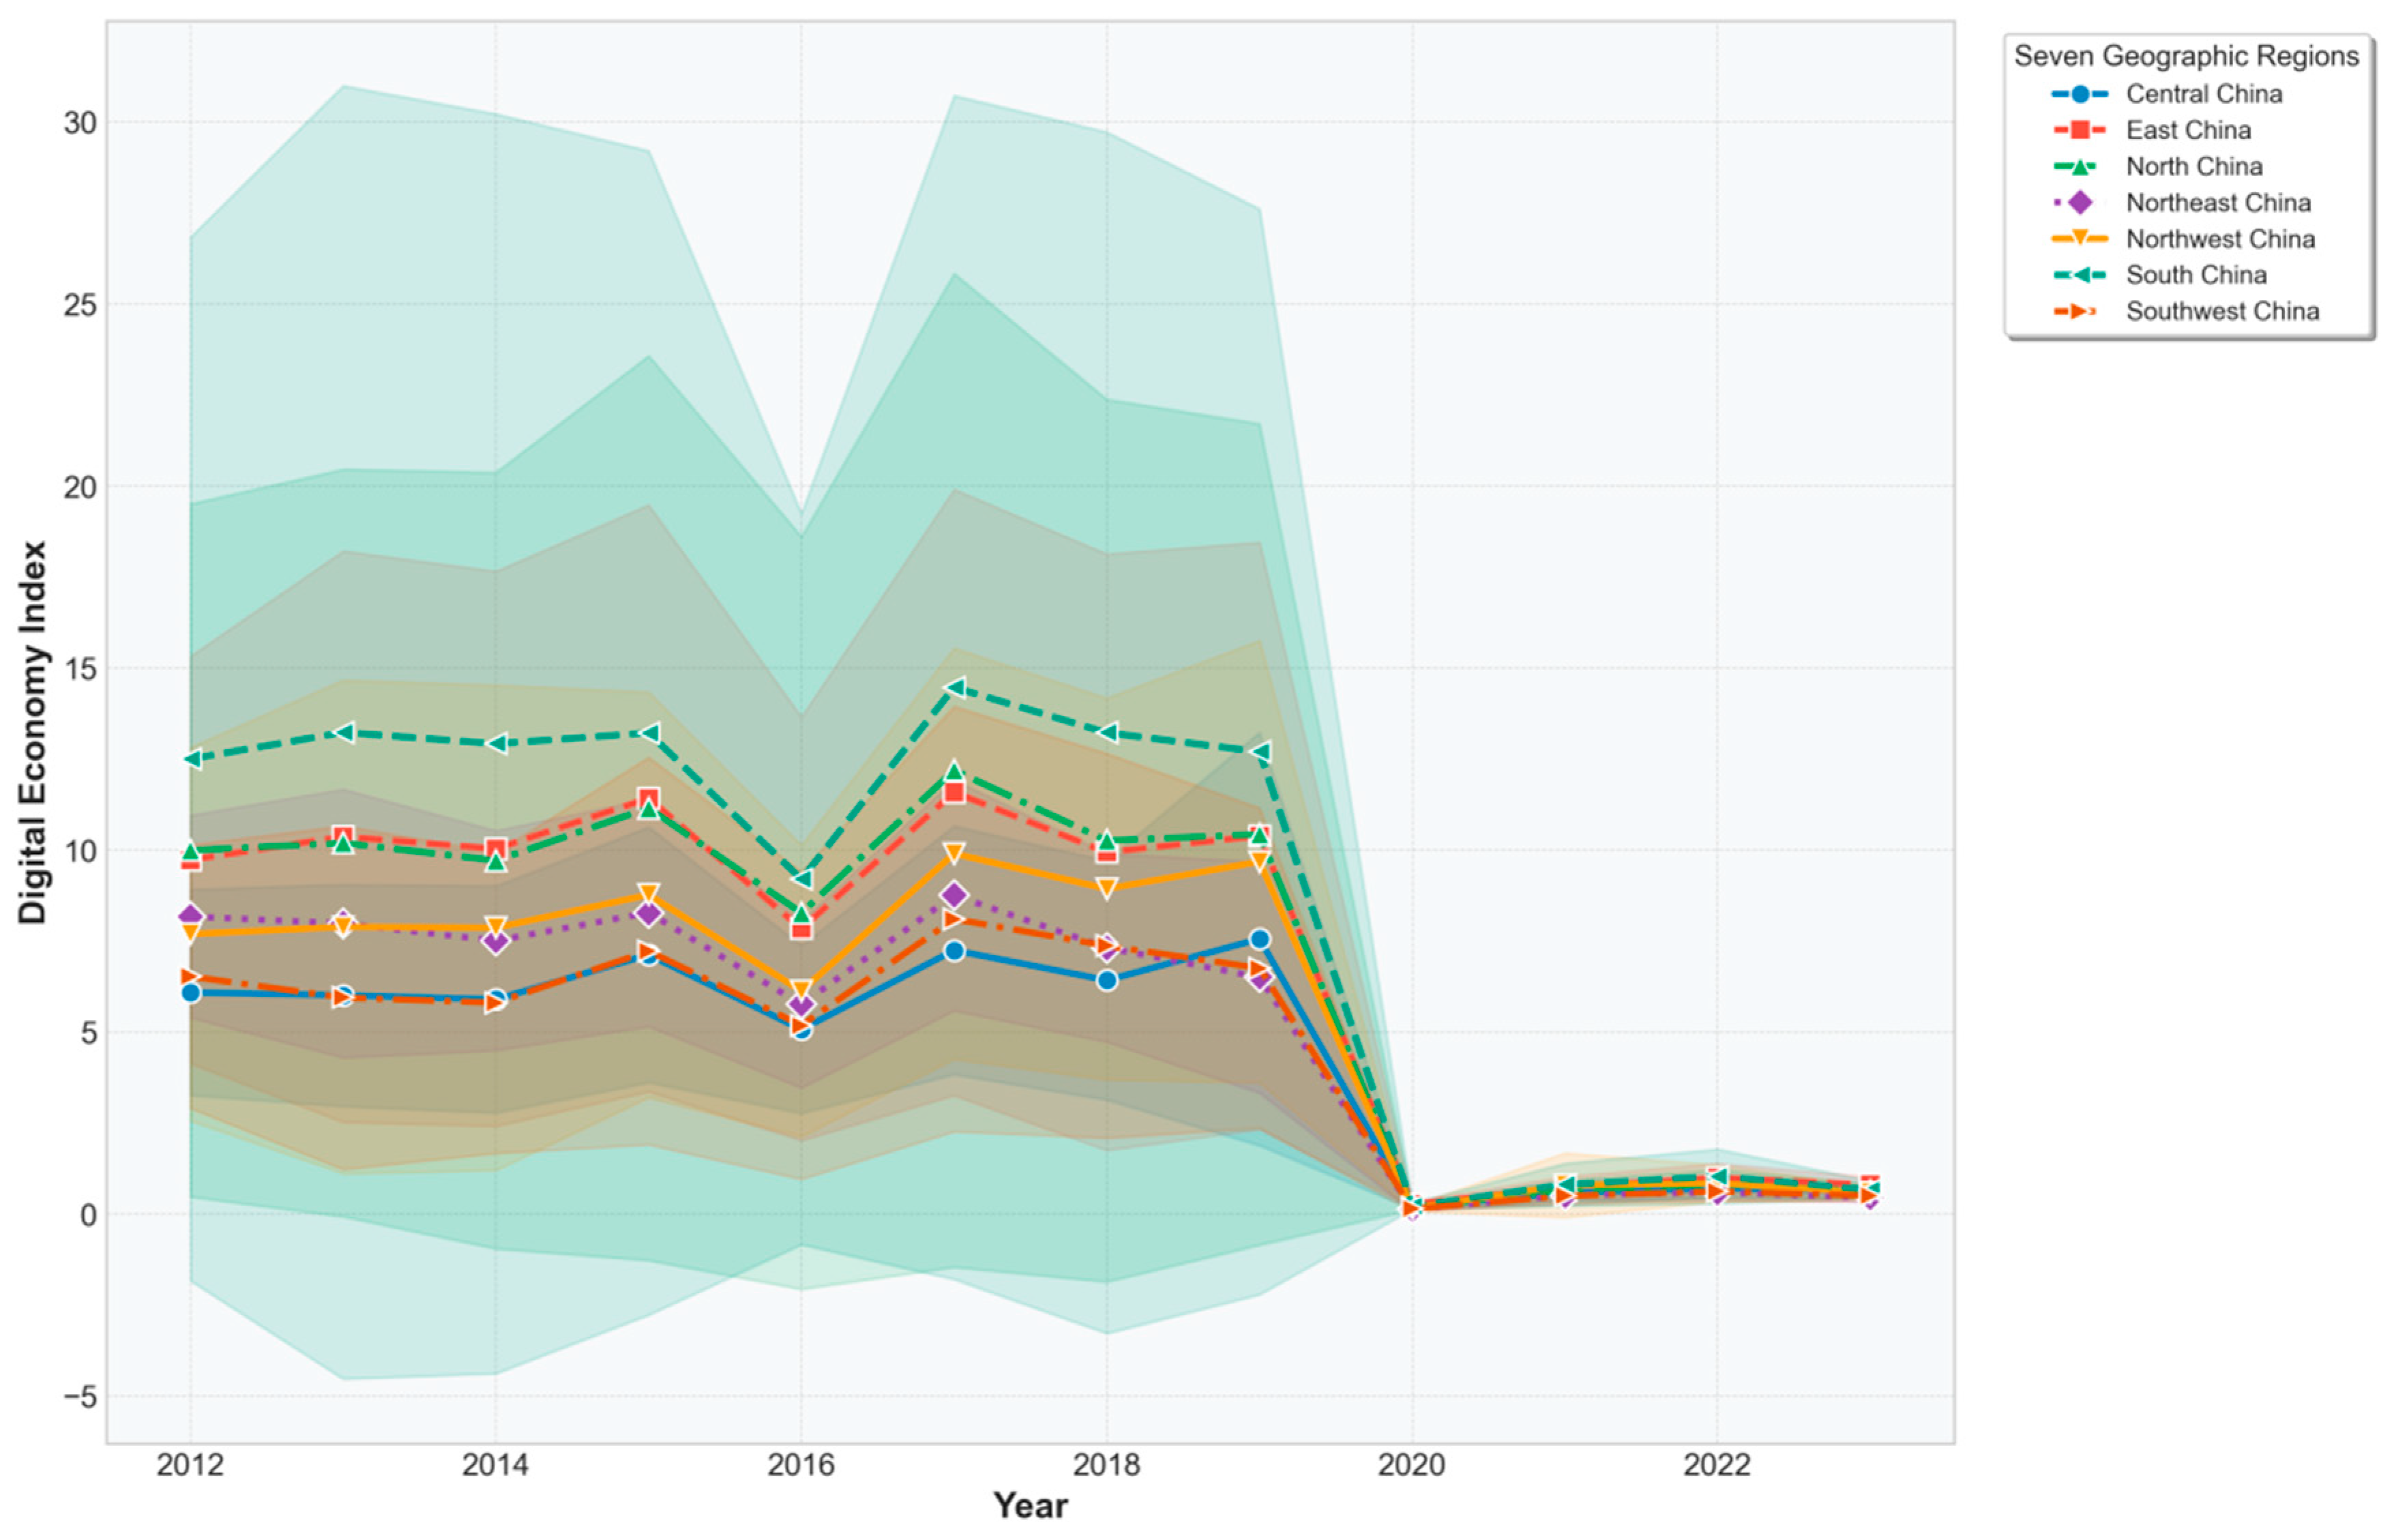
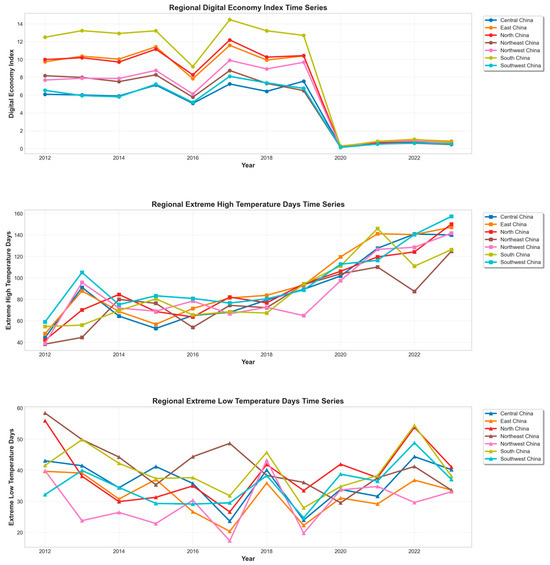
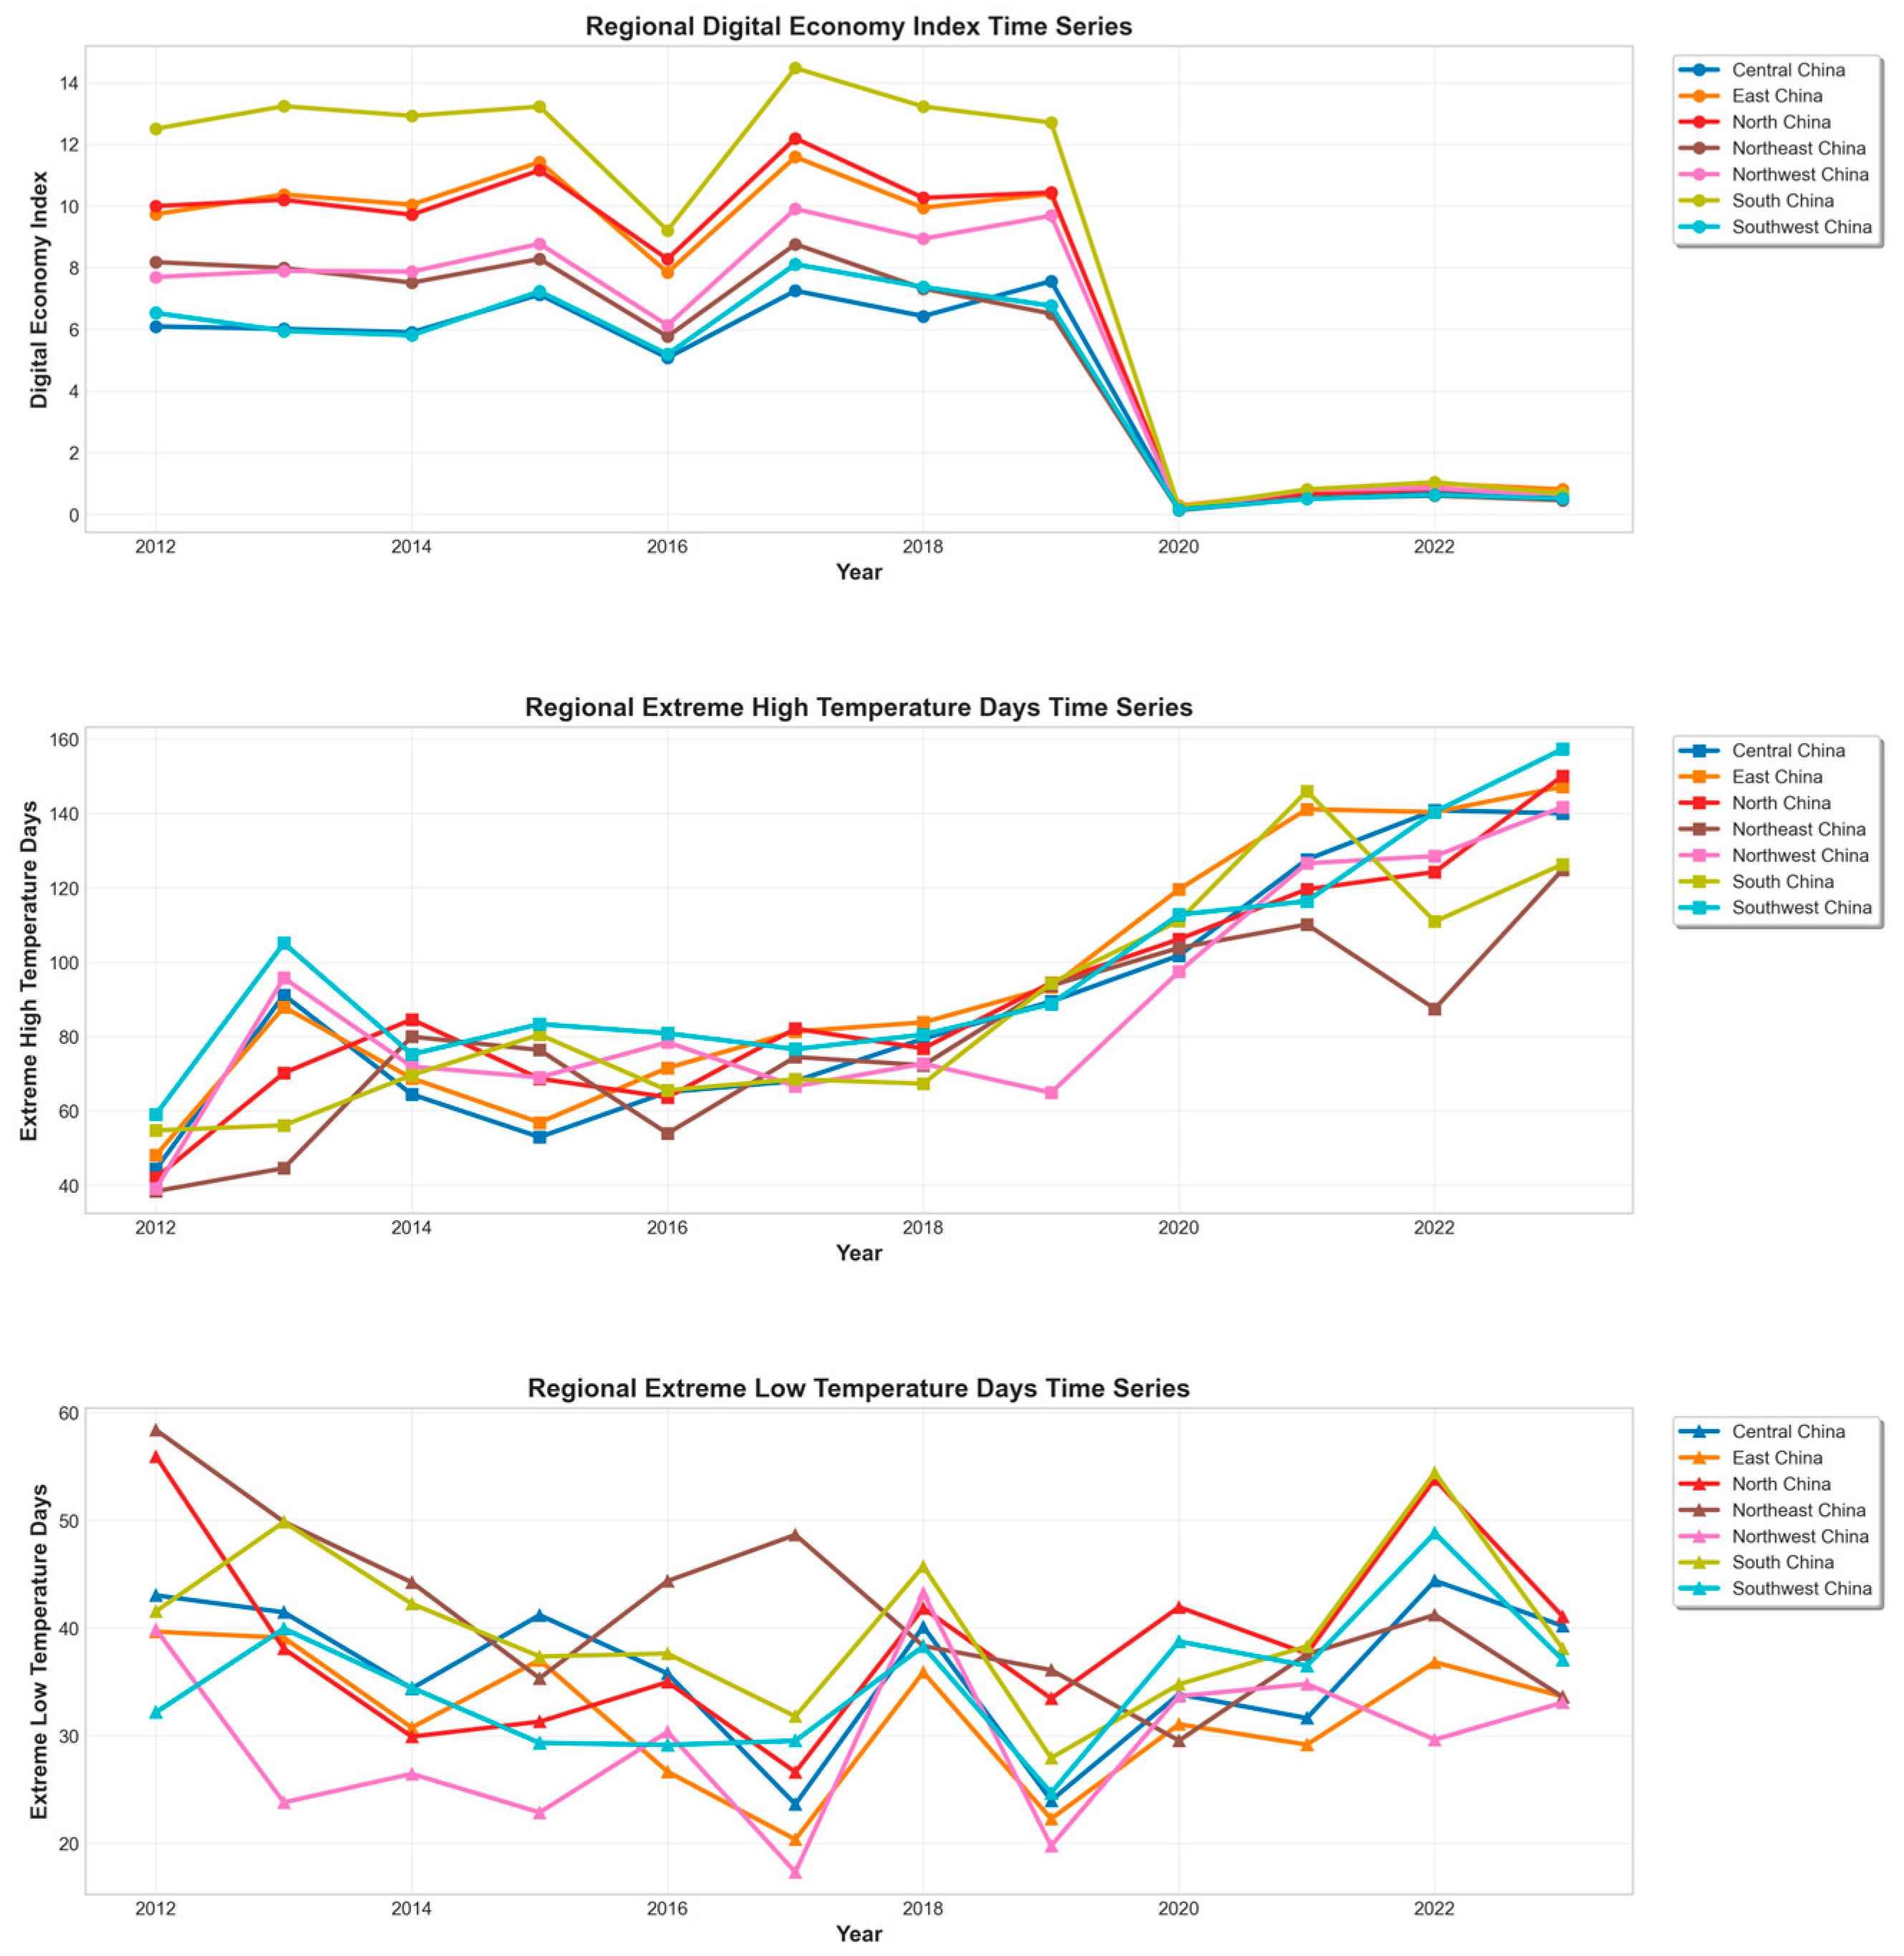
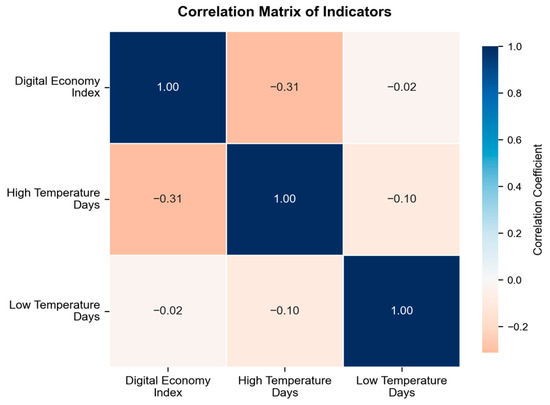
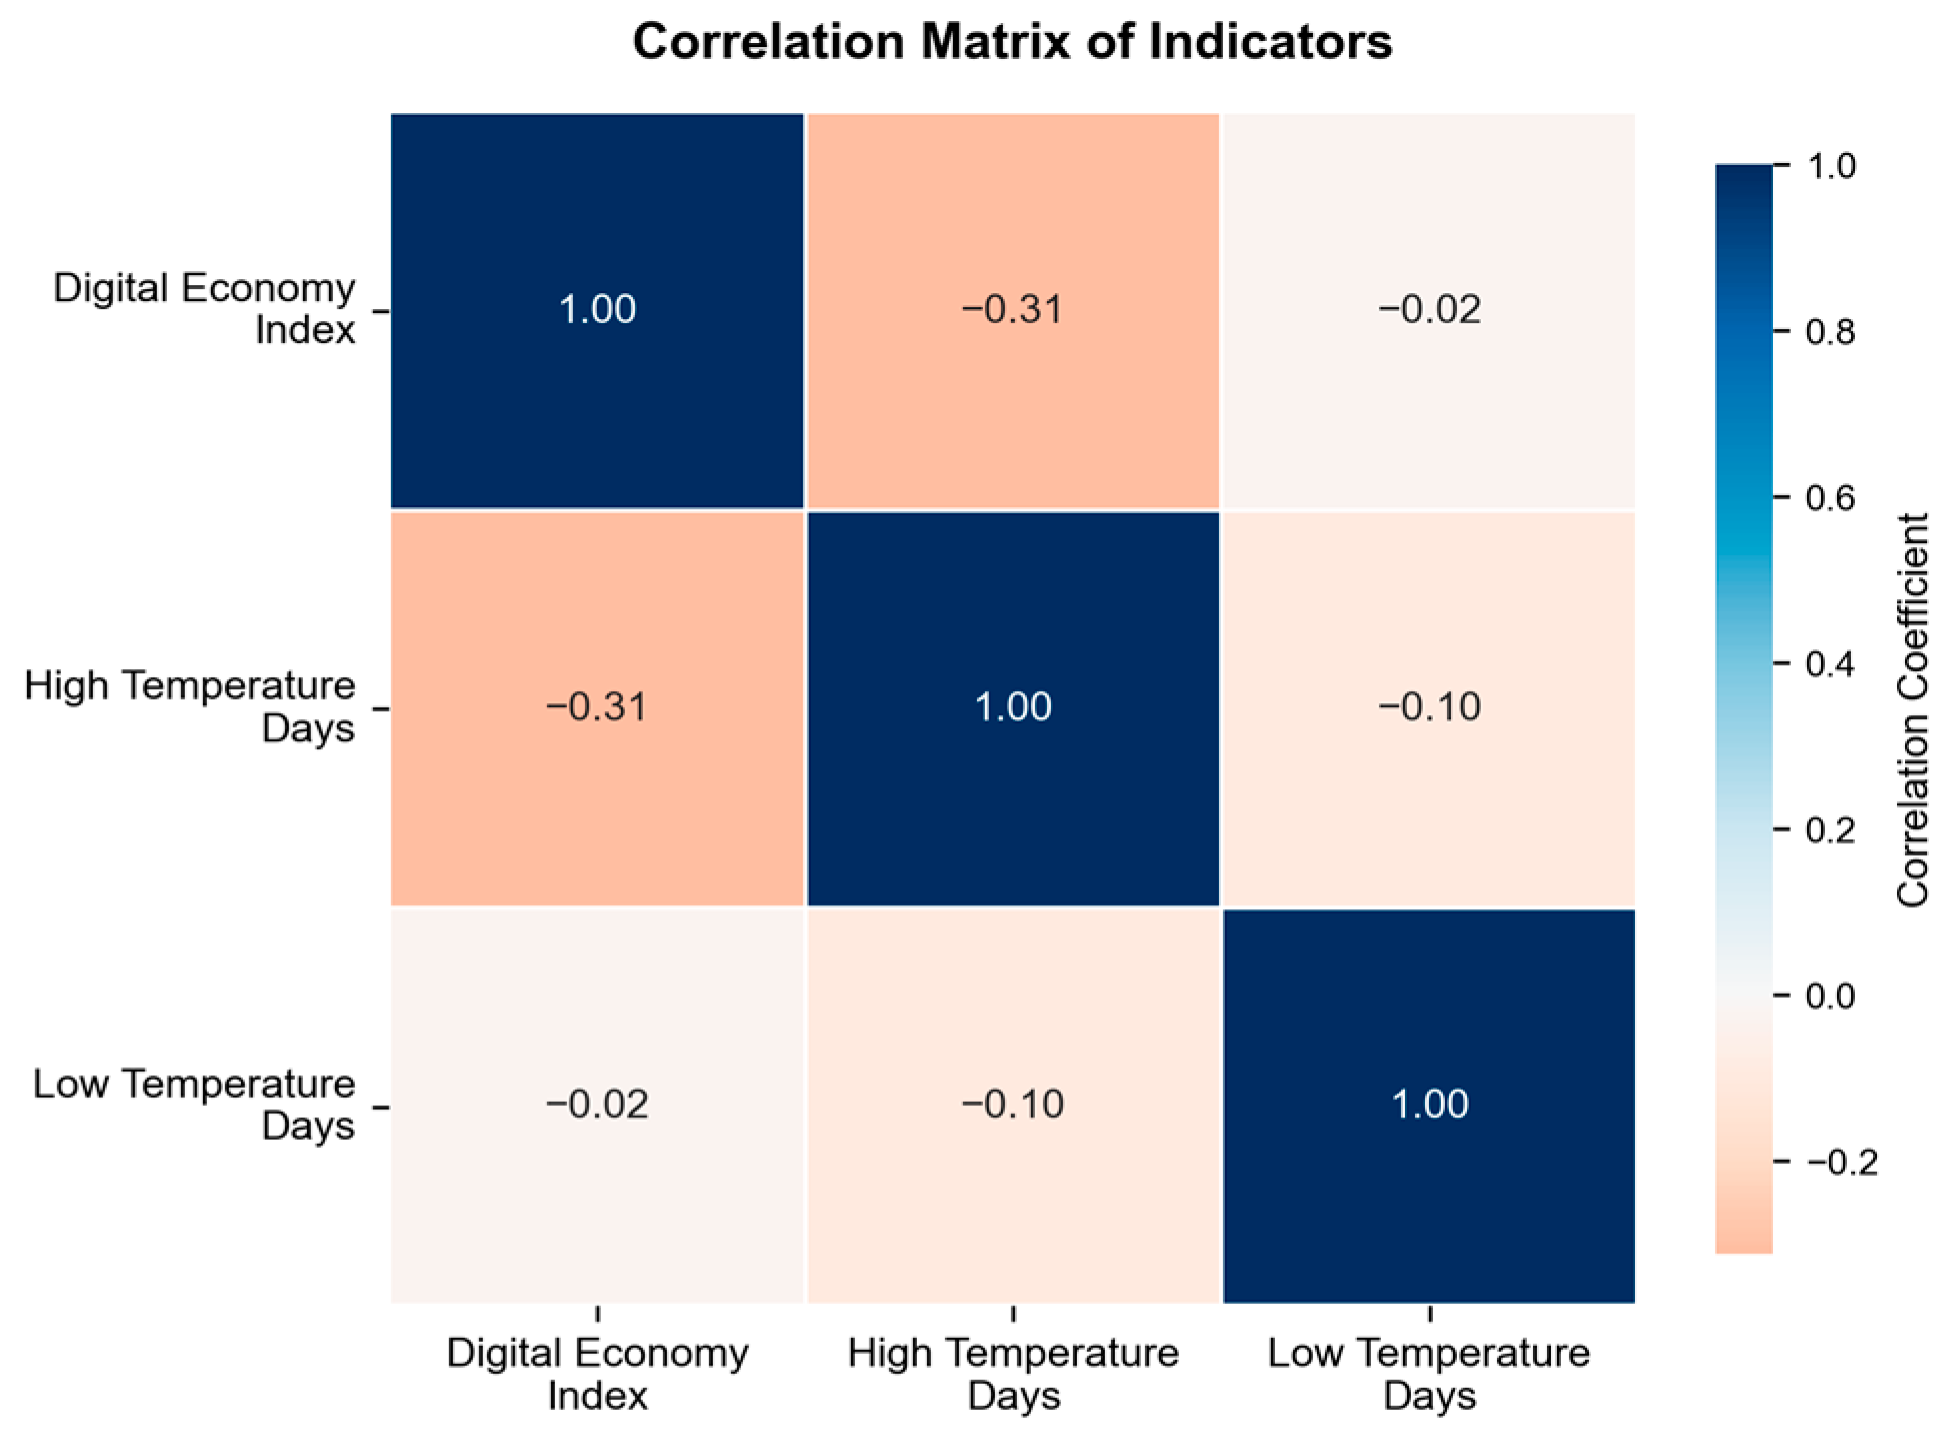
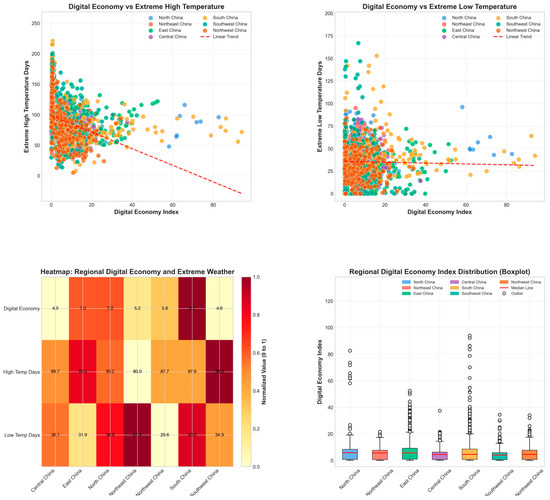
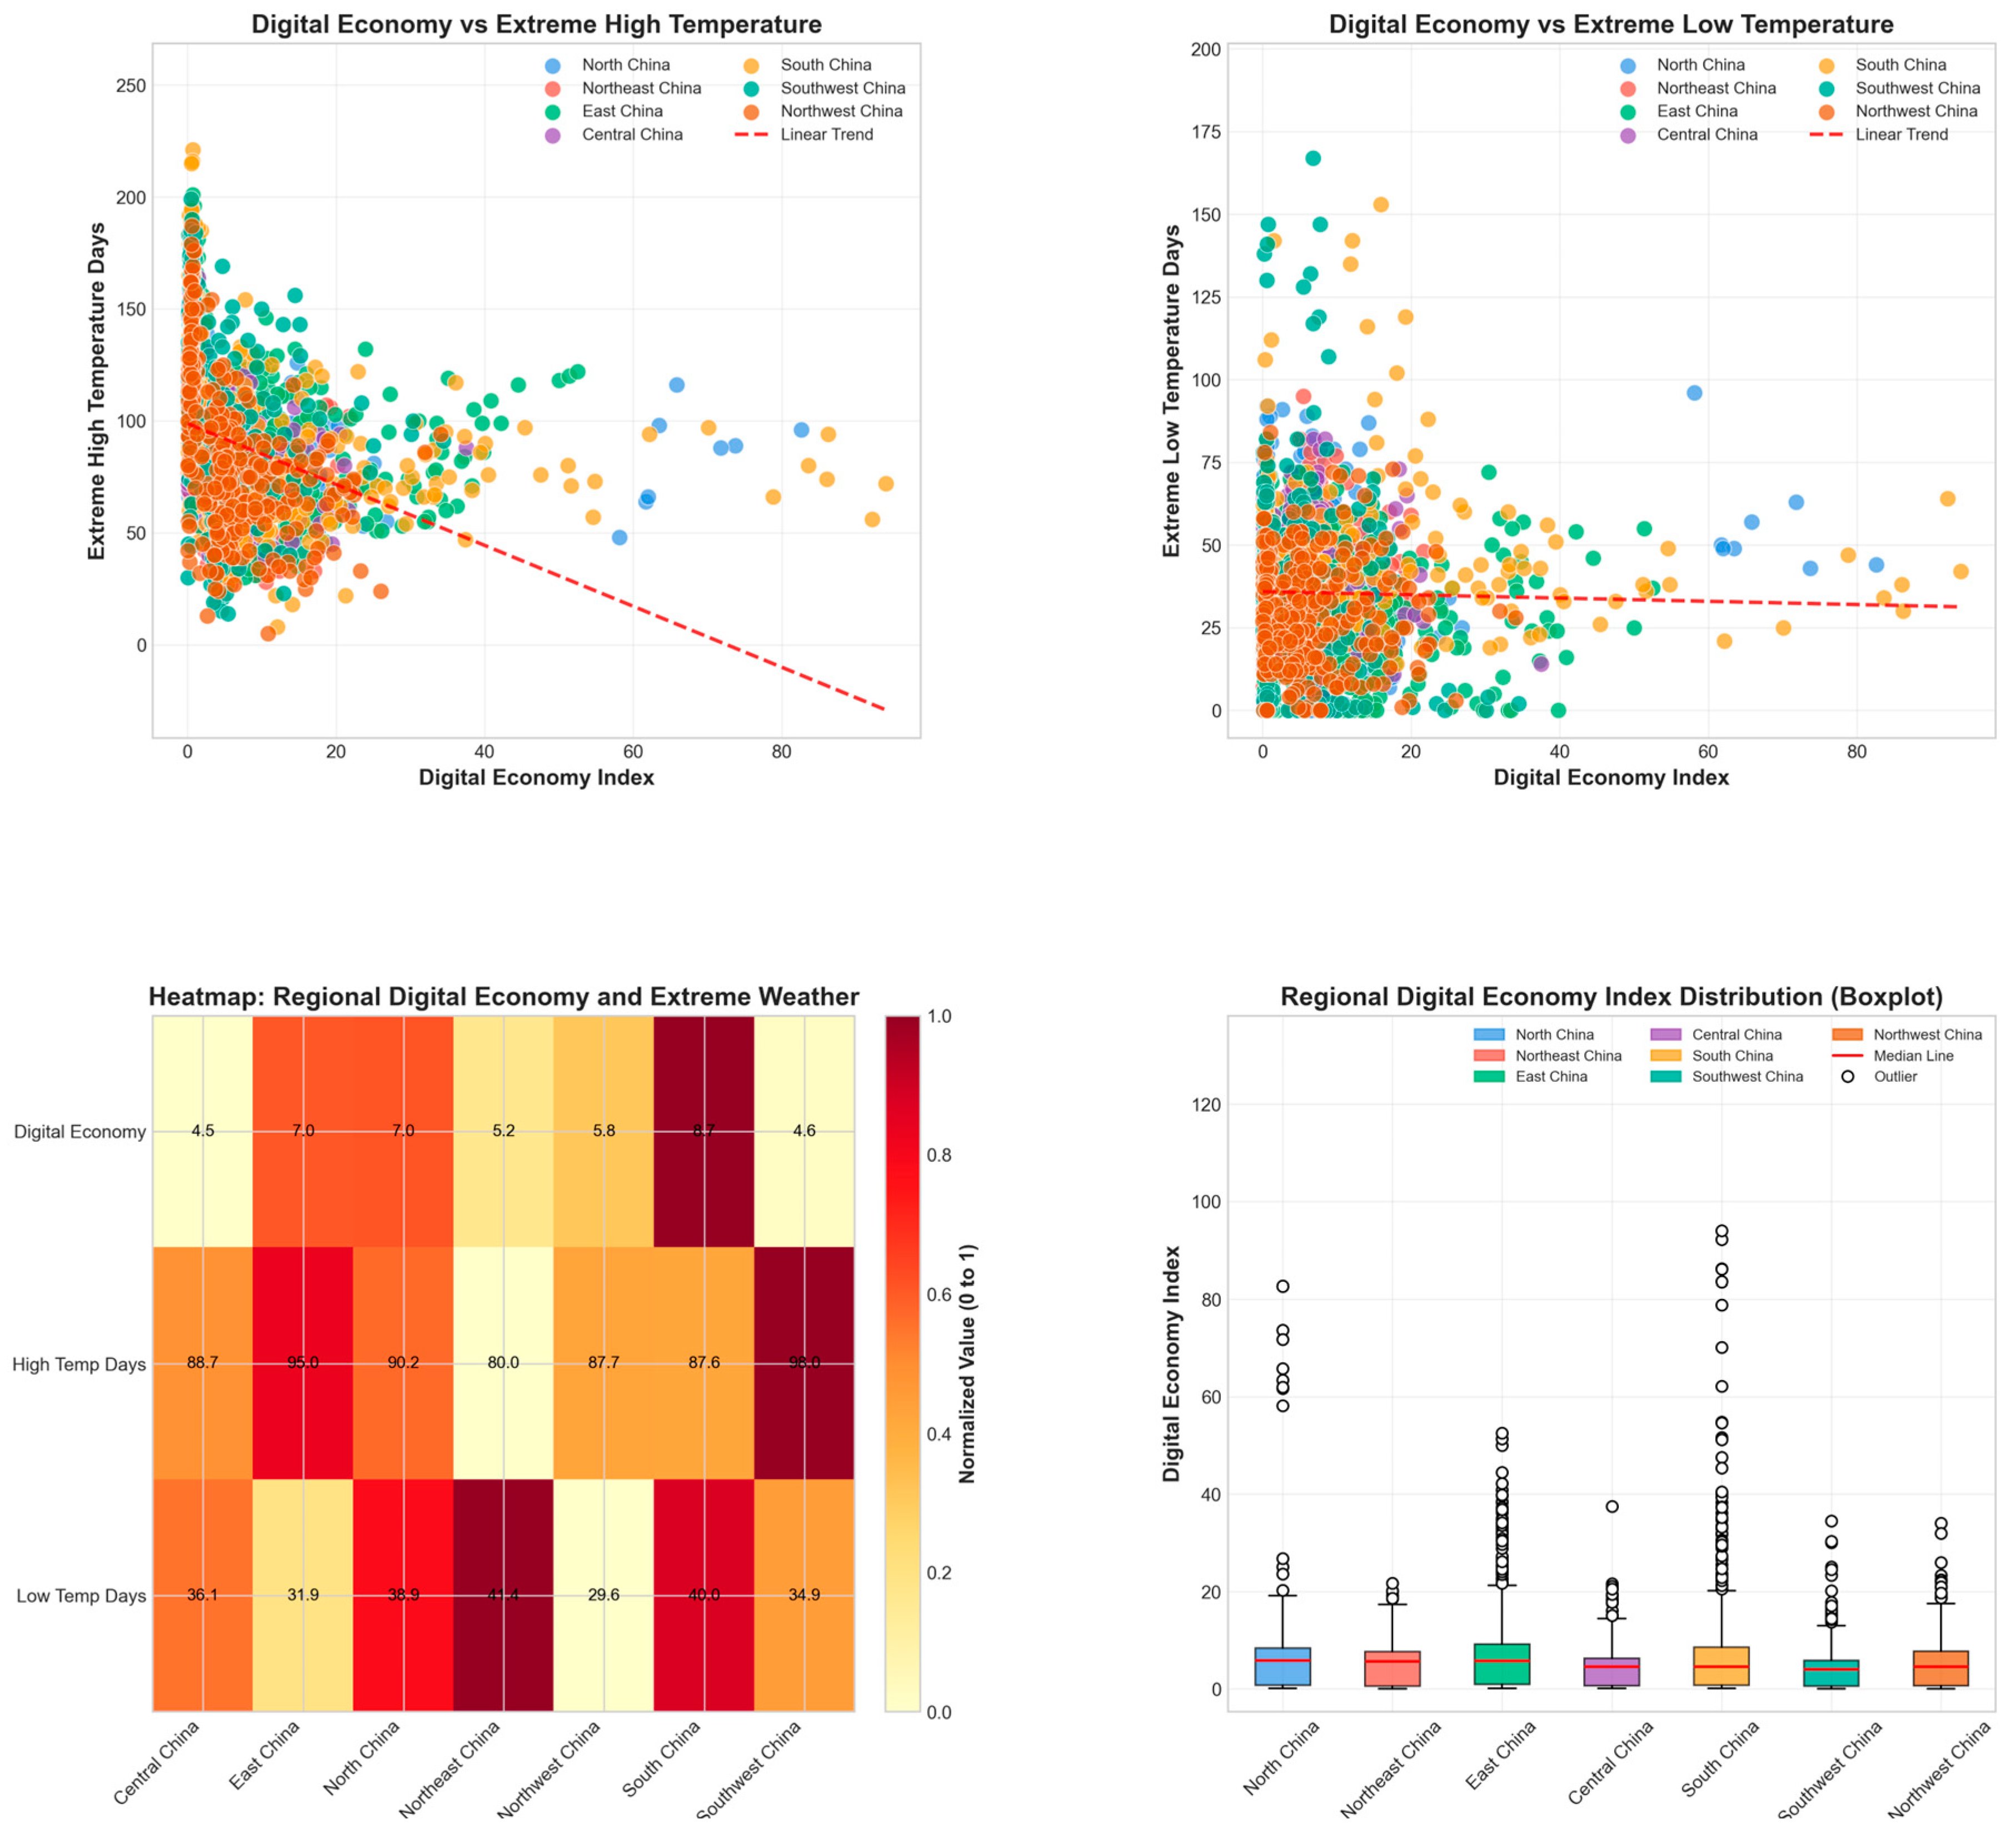

Disclaimer/Publisher’s Note: The statements, opinions and data contained in all publications are solely those of the individual author(s) and contributor(s) and not of MDPI and/or the editor(s). MDPI and/or the editor(s) disclaim responsibility for any injury to people or property resulting from any ideas, methods, instructions or products referred to in the content. |
© 2026 by the authors. Licensee MDPI, Basel, Switzerland. This article is an open access article distributed under the terms and conditions of the Creative Commons Attribution (CC BY) license.