


Abstract
Leveraging artificial intelligence (AI)―a cutting-edge technological tool―to drive the new quality transformation of Chinese manufacturing is a crucial foundation for China’s steady advancement of the new real economy, as well as an inevitable requirement for China to align with contemporary economic and technological trends. This study constructs a multi-sectoral equilibrium model to theoretically analyze the focal points of the new quality transformation in Chinese manufacturing and the impact AI has on it, followed by corresponding empirical tests. The results indicate that (1) AI has a positive impact on the qualitative transformation of China’s manufacturing sector; a one-unit increase in a firm’s AI level leads to a 0.171-unit increase in the sector’s qualitative transformation level. (2) This impact exhibits heterogeneity at the firm, industry, and regional levels. At the firm level, the impact varies depending on firm size, digitalization level, operational performance, internal control strength, and governance quality. At the industry level, the impact varies depending on technology intensity, industrial structure, strategic importance, and green development level. At the regional level, heterogeneity is reflected in geographical location, natural resource endowments, and the degree of urban agglomeration. (3) Artificial intelligence promotes the new quality transformation of Chinese manufacturing through the following mechanisms: reducing time lag costs and transaction costs in market penetration mechanisms; enhancing the quality of cutting-edge factor combinations and key core technologies in advanced innovation mechanisms; and improving resource utilization and operational management efficiency in lean production mechanisms.
1. Introduction
China has consistently adhered to the principle that “science and technology are the primary productive forces, talent is the primary resource, and innovation is the primary driving force,” embarking on a new journey and actively exploring new pathways for economic development. In September 2023, following a scientific assessment of China’s current developmental stage, social contradictions, and societal drivers, the concept of “new quality productive forces” was first introduced at the Symposium on Promoting the Comprehensive Revitalization of Northeast China in the New Era [1]. Against this backdrop, scientific and technological innovation and industrial restructuring are undergoing profound adjustments and transformations, giving rise to the new quality transformation of Chinese manufacturing [2,3]. The transformation of the manufacturing into a new quality model refers to a systematic process of transformation in which the sector, driven by scientific and technological innovation, achieves a qualitative upgrade from traditional resource-dependent growth to an advanced form of productive forces characterized by high technology, high efficiency, and high quality through disruptive technological breakthroughs, the restructuring of production factors, and a paradigm shift in the industry. However, the triple pressures of finite resources, outdated traditional factors, and international uncertainties present formidable challenges to the new quality transformation in Chinese manufacturing [4]. This transformation urgently requires new drivers, new models, and new pathways to support its development [5].
China places high importance on the development of artificial intelligence, fostering and expanding the intelligent industry while accelerating the growth of new productive forces to provide fresh momentum for new quality development [6]. Artificial intelligence, as a tool characterized by integration and spillover effects, exerts a leading influence [7]. It continuously drives the upgrading of traditional industries and the convergence of application scenarios, giving rise to a group of strategically dominant “AI+” industries [8]. The formidable characteristics of AI are further demonstrated through its spillover effects [7,9]. The resulting “imitation effect” and “catch-up effect” enhance overall efficiency across related industries [10,11]. AI has emerged as a new “singularity” in national comprehensive strength growth [12]. China demonstrates robust momentum in this field, achieving a transition from R&D to application and a leap in industrial cultivation [13]. Against the backdrop of developing new-quality productive forces, how does AI influence the new quality transformation of Chinese manufacturing? What are its focal points and operational mechanisms? Does this influence exhibit heterogeneity across different levels of enterprises, industries, and regions? Answering these questions can clarify the impact mechanisms and future development directions of AI on the new quality transformation of Chinese manufacturing from multiple perspectives [14].
A review of the relevant literature reveals that artificial intelligence exerts a dual impact on the new quality transformation of Chinese manufacturing. On the one hand, Chen et al. (2025) argue that AI represents a crucial manifestation in the formation and leap of new productive forces, demonstrating its positive influence on enterprises’ new productive capacity through innovation channels [15]. Wang (2023) asserts that AI is a key driver for Chinese new quality manufacturing development, demonstrating its role in integrating cutting-edge technologies with traditional manufacturing to achieve profound restructuring and advancement [16]. Hu et al. (2025) argue that AI applications facilitate intelligent transformation in manufacturing enterprises, propelling the sector’s new quality development [3]. Zhang et al. (2024), utilizing Chinese manufacturing enterprise data, further revealed that AI facilitates corporate green transformation, bolstering China’s new quality manufacturing development [17]. Furthermore, total factor productivity (TFP) partially reflects the development level of new quality productive forces. Lei et al. (2025) found that artificial intelligence technology significantly enhances total factor productivity in enterprises by optimizing production processes and improving the efficiency of managerial decision-making, with human capital playing a crucial mediating role in this process [18]. Conversely, AI adoption may not always yield positive productivity effects, giving rise to the “AI productivity paradox” [19]. Khalil et al. (2025) examined the root causes of the AI productivity paradox across organizational levels and its multifaceted impacts on employees, teams, and organizations [20]. Bonsay et al. (2021) found that whether AI can drive GDP growth hinges on appropriate institutional frameworks and supporting R&D efforts, with trade openness and a flexible institutional environment serving as key enablers [21].
Reviews of the relevant literature have indicated that artificial intelligence may exert complex influences on the new quality transformation of Chinese manufacturing across various dimensions. However, several issues remain: First, measurement methodologies for both artificial intelligence and the new quality transformation of Chinese manufacturing lack uniformity and exhibit significant shortcomings, potentially affecting empirical findings. Second, the specific mechanisms through which artificial intelligence drives this transformation remain unclear, particularly regarding the pathways at the firm level and analyses of heterogeneity, which are still the subject of significant debate. Third, research on the spillover effects of AI on the new quality transformation of Chinese manufacturing remains incomplete. Therefore, this paper employs machine learning and text analysis methods to measure AI development at the enterprise level, enhancing objectivity and scientific rigor. This paper also constructs a manufacturing transformation indicator system at the enterprise level, enhancing the precision and practicality of the measurement results. Furthermore, using data from Chinese A-share listed manufacturing companies from 2000 to 2022, this study conducts an intensive investigation at the enterprise level, performing systematic analyses of heterogeneity and impact mechanisms.
Therefore, this paper makes the following contributions: First, it advances research on the theoretical framework of the new quality of Chinese manufacturing. Building upon the classic task model represented by Acemoglu, this study incorporates the new quality of Chinese manufacturing into the model, constructing a multi-sectoral equilibrium model that includes the production sector (final products), the intermediate inputs sector, and the task production sector, and analyzes the impact of factors such as artificial intelligence technology on the new quality of Chinese manufacturing. The model categorizes the new quality of Chinese manufacturing into three dimensions: novelty, penetration and matching. This enhances the accuracy and scientific rigor with which this phenomenon can be measured at the firm level. Second, it deepens research on the impact of artificial intelligence on the new quality of Chinese manufacturing. Based on these definitions, this paper measures enterprise AI and the new quality of Chinese manufacturing more scientifically and objectively at the firm level. Building on this foundation, it examines the actual impact of the former on the latter and conducts heterogeneity analyses from the perspectives of firms, industries, and regions, providing insights on how to leverage AI to promote the development of the new quality of Chinese manufacturing. Third, this paper explores the mechanisms through which penetration costs, cutting-edge innovation, and lean production play a role in the process of AI promoting the new quality transformation of Chinese manufacturing, from both theoretical and empirical perspectives.
The remainder of this paper is structured as follows: Section 2 presents the theoretical model and hypotheses, formally deriving the relationship between artificial intelligence and the qualitative transformation of manufacturing, along with the underlying mechanisms of influence. Section 3 details the empirical strategy, data sources, and econometric analysis results. Finally, Section 4 summarizes key findings, discusses policy implications, and outlines future research directions.
2. Theoretical Foundations and Research Hypotheses
This paper draws upon Acemoglu and Restrepo’s (2018) model, exploring how artificial intelligence impacts the labor share [22] and constructing a multi-sector equilibrium model. This model encompasses the production sector (final products), intermediate input sector, and task production sector, incorporating artificial intelligence technology, capital, and labor. Through equilibrium analysis, it derives the new qualitative transformation of Chinese manufacturing. Based on this framework, the paper investigates the theoretical mechanisms influencing artificial intelligence and the new qualitative transformation of Chinese manufacturing.
2.1. Production Function Model Specification
Assuming perfect competition in both markets and task production, with the final product price fixed at 1, the production function is defined as follows:
Here, Y represents the final output of the product, represents the intermediate inputs of the intermediate sector, N represents the number of intermediate sectors, and denotes the substitution elasticity of intermediate inputs.
Competition in the intermediate input market is fully open. Assuming the price of intermediate inputs is , and various intermediate sectors sequentially complete tasks to form the production of the intermediate input sector, with all tasks in intermediate production ranging from [0,], the production utility function for the intermediate sector is as follows:
Here, represents the final output of intermediate goods; is the input of the task in sector j; is the number of tasks in the intermediate sector; and [0,].
Assuming is the price of product j in task , this study categorizes the task production sector into “AI-enabled production” and “non-AI-enabled production” based on research by Aghion et al. (2018) and Aghion et al. (2023) [23,24]. The distinction lies in whether artificial intelligence is employed for automated production. If AI implementation enables task automation, the degree of AI adoption can be represented by the proportion of automated tasks, , ranging from [0,]. Despite AI’s strong penetration potential, imperfect matching between technology and skills leads to economic losses and penetration costs, denoted by the loss function . Considering practical economic development needs, this study adopts a previous scholars’ approach by assuming tasks are distributed from low to high complexity. This reflects how AI typically replaces traditional labor, starting from less complex tasks. Thus, the production function for the task sector is defined as follows:
Here, represents the input for task in sector j. , , and denote the AI productivity input, capital productivity input, and labor productivity input, respectively, for the production of task in sector j. Since represents the degree of artificial intelligence and lies within [0,], the interval [0,] constitutes the automated portion of artificial intelligence, while the interval [] represents the non-automated portion. Here, denotes the capital share and denotes the labor share. Assuming factor supply is inelastic, with the supply quantities of artificial intelligence M, capital K, and labor L being exogenous, the market clearing conditions are as follows:
The factor market clearing condition that department j must satisfy is:
Furthermore, we can assume the AI cost rate, capital rent rate, and labor wage rate are , , and , respectively.
2.2. Seeking a New Quality-Based Equilibrium for Chinese Manufacturing
Assuming the final product price is given, the profit of the production department can be maximized by selecting the optimal quantities of intermediate inputs. Therefore, first, we define the following profit maximization function, then substitute Equation (1) into it and use the derivative to obtain the demand function for the intermediate good:
As can be seen, intermediate product varies inversely with price and directly with output . That is, demand for intermediate goods is negatively correlated with their own price and positively correlated with total final output, consistent with the law of demand. Now, we construct the profit maximization function for intermediate inputs, then substitute Equations (2) and (7) into it to obtain the demand function for the production department responsible for task j:
It can be seen that the price of the task, the elasticity of substitution for intermediate goods, and the final output of the product all influence the demand for the task-producing sector. Assuming factor prices are known, and optimal factor inputs are given, solving for profit maximization in the task production sector yields:
When utilizing artificial intelligence, governments often provide subsidies to enterprises, . Due to institutional and environmental influences, market friction arises, introducing capital distortions and price distortions into the system, and . Therefore, for AI-related tasks, costs should be calculated net of government subsidies, while for non-AI-related tasks, costs should be calculated gross of the higher factor costs resulting from distortions in the capital and labor markets.
Then, from Equation (9), we can deduce that . Combining this with Equation (3) yields a solution for the price , which in turn allows us to derive the demand functions for each factor:
From Equation (11), within the AI automation range [], the demand for AI is proportional to subsidies and output quantity , proportional to price , and influenced by the combined effects of intermediate input and substitution elasticity . In the non-AI automation range, capital and labor are inversely proportional to the capital rate and wage rate , as well as factor price distortions and , while being directly proportional to output quantity . This relationship is further influenced by intermediate input and substitution elasticity . Then, using Equation (5), we can further calculate the total demand for sector j to determine the market clearing condition. Combining Equations (2), (3) and (11), we obtain the output of sector j at market equilibrium:
Here, . This reflects the impact of technological progress in sector j on output. This can be simplified as follows:
Taking the natural logarithm of Equation (13) and evaluating the total differential yields the following change in Chinese manufacturing productivity under equilibrium:
It encompasses changes in productivity within traditional manufacturing and the transformation of the manufacturing sector. Specifically, represents changes in productivity inputs within traditional manufacturing. By excluding this component, we arrive at the transformation of the Chinese manufacturing sector:
From Equation (15), the transformation of Chinese manufacturing into a new quality can be decomposed into the following focal points: , , and . Here, represents factor compatibility, which refers to the degree of compatibility and synergy between artificial intelligence technology and a company’s existing capital stock, production processes, organizational workflows, and human capital. It reflects the frictional costs and allocation efficiency involved in the process of technological penetration; represents data factor penetration, which refers to the process by which data transforms from an informational form into a standardized, tradable, and priceable factor of production that is embedded across the entire chain of R&D, production, supply chain, and services. This marks the transition of the manufacturing sector from a “factor-driven” to a “data-driven” stage; represents new technology penetration, which refers to the deep substitution and paradigm restructuring of production tasks by disruptive and general-purpose technologies, generating economies of scale as the scope of tasks expands; and represents new quality factors, which are a series of advanced elements that underpin the new quality mode of production, such as new quality workers and new quality objects of labor. It emphasizes improving the quality of production factors and enhancing synergies among them as the microfoundation for the new quality transformation. The specific expressions are as follows:
where , , indicating that factor matching and the new quality factors are driving the new quality transformation of Chinese manufacturing. The signs of and remain undetermined. Furthermore, we will focus on the impact of artificial intelligence on the new quality transformation of Chinese manufacturing.
2.3. Balanced Analysis of Artificial Intelligence’s Impact on the New Quality Transformation of Chinese Manufacturing
Combining Equations (13), (15) and (16) yields the following AI-based partial derivative formula for the qualitative transformation of Chinese manufacturing:
Using cost minimization to determine the marginal costs of both AI-automated tasks and non-automated tasks, the cost minimization function for AI-automated tasks is constructed as follows:
Substituting constraint into total cost , we obtain the total cost function . From this, we derive the marginal cost with respect to :
The cost minimization function for non-intelligent automated tasks is as follows:
Using the Lagrange multiplier method and substituting the constraint yields the following demand functions for the factors of production, capital and labor:
Substituting both Equations (21) and (22) into the total cost , and replacing and yields the marginal cost for non-AI tasks:
Finally, substituting Equations (23) and (28) into Equation (21) yields:
As can be seen from Equation (24), as the level of artificial intelligence continues to improve, the marginal cost of AI-automated tasks decreases and becomes lower than that of non-AI tasks, with . In this case, , indicating that there is a positive correlation between the level of artificial intelligence and the qualitative transformation of Chinese manufacturing.
Therefore, this paper proposes the following hypotheses:
Hypothesis 1:
AI has a positive impact on the new quality transformation of Chinese manufacturing.
2.4. Analysis of the Mechanisms Through Which Artificial Intelligence Influences the New Quality of Manufacturing
Theoretical analysis indicates that artificial intelligence possesses characteristics such as pervasiveness and spillover effects, which can drive cutting-edge innovation and lean production within enterprises. It may influence the transformation of manufacturing through three mechanisms: cost penetration, cutting-edge innovation, and lean production.
2.4.1. Penetration Costs
Artificial intelligence may promote the new quality of manufacturing by reducing enterprises’ penetration costs. AI exhibits strong pervasiveness and high versatility, enabling seamless integration with various traditional industries and playing a significant role in production, consumption, exchange, and distribution [25,26,27].
Enterprises face penetration costs when integrating AI into existing traditional technologies. These are the additional time and financial expenses incurred during the integration of AI with legacy systems and infrastructure [28,29]. Financial costs encompass technology conversion fees and replacement expenses for traditional assets, while time costs include implementation duration and lag costs [30]. These costs may strain corporate cash flow and impose operational burdens [31]. However, when developing AI, enterprises can leverage machine learning, random forests, and neural network technologies to break through mental barriers, accelerate penetration and restructuring, reduce financial and time lag costs, mitigate cash flow risks and operational burdens, and promote the new quality transformation of manufacturing [32]. Therefore, the following hypothesis is proposed:
Hypothesis 2:
The cost of penetration may be a channel mechanism through which AI influences the new quality transformation of Chinese manufacturing.
2.4.2. Cutting-Edge Innovation
AI may also influence new quality manufacturing through cutting-edge innovation, specifically by enhancing the quality of advanced factor combinations and driving breakthroughs in core technologies [33]. On the one hand, AI can precisely acquire external data and process it through machine learning, facilitating cutting-edge knowledge creation by providing enterprises with numerous research directions and new factor combination possibilities [34]. Moreover, the introduction of AI technology fundamentally alters the factor combination structure, increasing the share of cutting-edge technological factors, ultimately advancing the new quality transformation of manufacturing [19]. On the other hand, AI decomposes complex key technology tasks into multiple subtasks. Through techniques like algorithm sharing and open source code, it connects enterprises to form key core technology ecosystems. This enhances corporate R&D efficiency for key core technologies, drives technological advancement, and propels new quality manufacturing development [35]. Therefore, we propose the following hypothesis:
Hypothesis 3:
Cutting-edge technology may be a channel mechanism through which AI influences the new quality transformation of Chinese manufacturing.
2.4.3. Lean Production
AI enhances operational management efficiency and resource utilization through lean production [36], serving as a crucial pathway for advancing new quality manufacturing. First, AI technologies like virtual reality enable real-time internal communication, resolving issues of information distortion and bottlenecks, thereby improving operational efficiency and achieving lean production. Second, AI facilitates the free flow of traditional factors within enterprises [37], improving the efficiency of factor resource allocation and achieving effective resource distribution. Third, AI applications strengthen connections between upstream and downstream enterprises in industrial chains, improving division of labor and collaboration efficiency [38]. This enables lean production and accelerates the pace of new quality manufacturing development. Finally, the strong pervasiveness and high spillover characteristics of AI drive cross-industry convergence. The emerging new business models reflect lean production principles, benefiting the development of new quality manufacturing. Therefore, this paper proposes the following hypothesis:
Hypothesis 4:
Lean production may be a channel mechanism through which AI influences the new quality transformation of Chinese manufacturing.
3. Selection of Variables, Data Sources and Modeling for Materials and Methods
3.1. Selection of Variables
3.1.1. Explained Variables
The dependent variable is new quality manufacturing. The foundation of new quality manufacturing lies in the leap toward an optimal combination of labor and the objects of labor. Drawing on the research methodology of Chu et al. (2025), this paper constructs the following indicator system to measure new quality manufacturing [39]. We apply the Topsis model based on the entropy method to assign weights to the indicators, as detailed in Table 1 below. Proxy variables for some key indicators rely on keyword frequency statistics from corporate annual reports. However, text frequencies in annual reports are susceptible to the influence of reporting standards, regulatory language requirements, and strategic impression management, leading to potential measurement errors. Nevertheless, these text-based proxy variables remain highly valid due to their source in publicly available documents, enabling continuous measurement across companies and years. They offer data availability and reflect companies’ new qualitative strategic positioning and willingness to transform, capturing soft information that traditional quantitative indicators struggle to cover.
Table 1.
Measurement methods for new quality manufacturing.
3.1.2. Explanatory Variables
The explanatory variable is artificial intelligence. Drawing on the methods of Chen et al. (2024) and Zhong et al. (2024), this study employs machine learning techniques to generate an AI lexicon [40,41]. Annual reports and patent-related data from listed companies are collected and refined to construct an AI indicator. Step one involves creating the AI lexicon [42]. First, AI-related terms and vocabulary lists from industry research reports were manually extracted [43]. The Skip-gram model was then applied to identify 52 seed words, including “artificial intelligence,” “cloud computing,” and “machine learning.” Subsequently, the Skip-gram model and Word2vec technology were applied to process text from annual reports and patent materials as training data. Cosine similarity between seed words and output words was used to select 10 semantically similar terms. Finally, low-frequency and irrelevant terms were manually filtered to generate the AI lexicon. Step 2: Obtain AI word frequencies from listed companies’ annual reports. In this study, we used the open-source “jieba” module in Python 3.11 to perform batch processing on the annual report texts, and subsequently utilized an AI dictionary to accurately identify the frequency of AI-related terms in the annual reports of listed companies. Step 3: Use the logarithm of AI keywords from A-share listed companies’ annual reports as the AI indicator. The process for constructing the corporate AI indicator is illustrated in Figure 1 below.
Figure 1.
Enterprise artificial intelligence metrics development process.
Due to limitations in data availability, this study employs text statistical methods to measure the level of artificial intelligence. Compared to traditional text analysis methods, the approach used in this paper to measure the level of AI technology application offers the following two advantages. First, it overcomes the limitations of traditional text analysis in long-term technology tracking, enhancing the foresight and sensitivity of the measurement. By constructing diachronic semantic mappings in the Wikipedia and annual report corpora using the Skip-gram model, it effectively captures the semantic evolution of terms. Second, it ensures the comparability of long-term measurements. Setting the calculation window for inverse document frequency as a rolling time window prevents early low-frequency terms from being unduly suppressed. Furthermore, since the final metric represents the relative level of AI technology compared to the overall technological intensity of enterprises rather than absolute word frequency, it eliminates the systematic bias caused by annual reports becoming longer over time.
3.1.3. Control Variables
This study adopts the following control variables, primarily selected from previous scholarly research: firm size (size), represented by the logarithm of total assets; firm age (age), denoting the number of years since the firm’s establishment; debt-to-asset ratio (lev), primarily calculated as the logarithm of the ratio of total liabilities to total assets; board size (bs), primarily indicated by the number of board members; shareholding concentration (sc), measured by the sum of the circulating shareholding ratios of the company’s top five shareholders; duality (duality) is a dummy variable indicating whether the chairman and general manager positions are held by the same individual (duality = 1 if dual, otherwise 0); and revenue growth rate (grow), calculated as: (Current-year revenue − Previous-year revenue)/Previous-year revenue.
3.2. Sample Selection and Data Sources
Due to data availability constraints, the sample period for this study is limited to 2022, thus spanning from 2000 to 2022. New quality manufacturing serves as the core indicator in this research. Following previous scholarly practices, data were obtained from the CSMAR database, the National Intellectual Property Administration, and annual reports of listed companies. Partial missing values were imputed using linear interpolation [43]. AI data sources are derived from listed companies’ annual reports. Additionally, patent technology data for AI is obtained from the IRPDB intellectual property database. Control variables are sourced from the Guotai An database. To mitigate the impact of heteroskedasticity on sample robustness, the data undergoes the following treatments: (1) exclusion of firms established after 2012 and bankrupt firms; (2) exclusion of samples with three consecutive years of missing data within the timeframe to facilitate observation of corporate changes; (3) exclusions of samples with obvious errors or missing values in key variables, such as negative or zero company age; and (4) trimmed tailing of samples at the 1% and 99% levels. Descriptive statistics for each variable are presented in Table 2.
Table 2.
Descriptive tests.
3.3. Model Construction
This paper constructs the following regression model to examine the impact of artificial intelligence on the new quality transformation of manufacturing:
Here, denotes the dependent variable, with subscripts i and t representing firm and year, respectively; represents the coefficients of each variable, with being the primary focus of this study; is the core explanatory variable, namely, artificial intelligence; indicates a set of control variables; and represents the fixed effects of firm and year; and is the random disturbance term. Additionally, this study employs firm-level robust standard errors.
4. Empirical Analysis
4.1. Benchmark Regression Results
Table 3 presents the benchmark regression results examining the impact of artificial intelligence on the new quality transformation of manufacturing. Columns (1) and (2) display regression results without controlling for additional variables; Column (1) does not fix firm and year effects, while Column (2) fixes firm and year effects. Columns (3) and (4) incorporate additional control variables, with Column (3) omitting fixed effects for firm and year and Column (4) including fixed effects for firm and year. The results indicate that, regardless of whether firm and year fixed effects are included or control variables are added, artificial intelligence exhibits a statistically significant positive impact on the new quality transformation of manufacturing. This confirms that artificial intelligence significantly promotes the new quality transformation of manufacturing, thereby validating Hypothesis 1.
Table 3.
Benchmark assessment of artificial intelligence in transforming manufacturing.
4.2. Robustness and Endogeneity Tests
This paper employs multiple methods to conduct robustness and endogeneity tests, ensuring the reliability and validity of its research conclusions.
4.2.1. Robustness Tests
Replacing AI measurement methods. First, following Chen et al. (2024) and Zhong et al. (2024), we remeasure AI levels using the logarithm of AI-related terms in MD&A sections (lnmda) extracted from annual reports [40,41]. Subsequently, we re-measure AI levels using the logarithm of corporate AI patent counts (lnpatent). The regression results are presented in Table 4, Columns (1) and (2), indicating that the benchmark regression results are robust.
Table 4.
Robustness tests: changing core variable measurement approaches.
Replacing the measurement approach for manufacturing transformation. This study selects indicators related to enterprise total factor productivity (TFP) as a proxy variable for manufacturing transformation and upgrading. To address sample selection bias and coincidence bias inherent in the OLS method, this study employs the improved OP method, LP method, and ACF method to measure enterprise-level TFP. The regression results are presented in columns (3) to (5) of Table 4, indicating that the benchmark regression results are robust.
Exclude samples from future industries and strategic emerging industries. Artificial intelligence serves as the primary business and strategic focus in these sectors, inherently exhibiting capital-intensive characteristics that may distort AI metric measurements. Therefore, all enterprises overlapping in these two cross-industry categories are excluded. [Based on the Implementation Opinions on Promoting the Innovative Development of Future Industries issued by the Ministry of Industry and Information Technology and six other departments. The identification of enterprises in strategic emerging industries and future industries was conducted by matching the industry codes of the enterprises (classified according to the “Guidelines for the Classification of Listed Companies by Industry (2012 Revision)”) with the industry codes in the “Classification of Strategic Emerging Industries (2018)” as defined by the State Council’s “Decision on Accelerating the Cultivation and Development of Strategic Emerging Industries” and the National Bureau of Statistics’ “Classification of Strategic Emerging Industries (2018)”]. The regression results are shown in Column (1) of Table 5, indicating that the benchmark regression results are robust.
Table 5.
Robustness tests: accounting for industry characteristics, exogenous factors, and policy shocks.
Excluding samples from certain years. Public health security after 2019 has exerted a certain impact on the qualitative development of manufacturing. Therefore, samples from 2019 onwards are excluded. The regression results are shown in Column (2) of Table 5, indicating that the benchmark regression results are robust.
To account for the impact of policy shocks, robustness tests were conducted using parallel trend tests. The 2016 “Smart Manufacturing Development Plan (2016–2020)” emphasized the importance of intelligent transformation in key industries, providing strong support and safeguards for AI development. Therefore, this paper treats the Plan as a quasi-natural experiment, reconducting robustness tests via parallel trend tests to construct the following double difference model:
Here, represents the dependent variable, with subscripts i and t representing firm and year, respectively; represents the coefficients of each variable, with being the primary focus of this study; and represents the fixed effects of firm and year; and is the random disturbance term. Additionally, this study employs firm-level robust standard errors; is the core explanatory variable, which is a dummy variable. The key industries outlined in the Plan primarily include the aerospace sector, high-end CNC machine tools, marine engineering, industrial robots, and high-tech vessels. This study designates enterprises in these industries as the experimental group (where ), while other enterprises form the control group (where ). The Plan was issued in 2016; thus, for samples prior to 2016, post = 0, and for samples after 2016, post = 1. The regression results are shown in Column (3) of Table 5, which remain robust. Additionally, a parallel trends test was conducted by including the period immediately preceding the policy and listing the dynamic effects of the policy across the four periods before and after its implementation. The results of the parallel trends test are presented in Table 6. China’s policymaking process features an open, transparent, and institutionalized communication channel between the government and businesses. The government releases official signals in advance, allowing enterprises to obtain policy information before the policies are officially enacted. Consequently, enterprises adjust their strategic objectives and alter their decisions and actions even before the government formally enacts the policies. Consequently, many policies in China begin to exert influence before they are officially enacted, leading to a significant lead time for policy effects. This is also reflected in the results of the parallel trend test in this paper, where the coefficients for the pre-treatment period (pre_4 to pre_2) are statistically significant at the 1% level. While this represents a limitation of the parallel trend test in this study, it is consistent with the actual conditions in China. Therefore, the policy shock remains to some extent effective, and the results of the difference-in-differences estimation are also reasonably reliable.
Table 6.
Parallel trend test.
Additionally, this study employs the PSM-DID method to mitigate self-selection bias. A logit regression model is constructed based on propensity scores, and matching values are calculated. Firms with matching values are then designated as the experimental group, thereby reducing inter-group differences and systematic variations among firms and alleviating the bias inherent in the DID approach. The regression analysis employs a 1:1 with replacement propensity score matching approach, with results presented in Column (4) of Table 5. Findings indicate that the benchmark regression conclusions remain robust.
4.2.2. Testing for Endogeneity
To address endogeneity issues arising from reverse causality, omitted variables, and other factors, this study adopts methods from prior research. We employ the industry average instrumental variables [30] and Bartik instrumental variables to address endogeneity [44]. The Bartik instrumental variable is defined as the product of the industry average level of AI (not lagged by one period) and the first-order time difference of the AI level (iv). The regression results are presented in Table 7. In the Bartik instrumental variable approach, the Cragg-Donald Wald F statistic (22.032) exceeds the critical value (16.38), and the Anderson LM test value is 27.34, indicating no issues of weak instrumentality or underidentification. The regression results confirm that the benchmark regression conclusions remain robust. In the industry average instrument method, the Cragg-Donald Wald F statistic (21.60) exceeds the critical value, and the Anderson LM test yields p < 0.01, confirming no issues of weak instruments or underidentification. The regression results also indicate that the benchmark regression conclusions remain robust.
Table 7.
Endogeneity tests: estimation results using bartik instrument variables and industry mean instrument variables.
4.3. Heterogeneity Analysis
Due to their inherent characteristics, geographical locations, and industry sectors, enterprises exhibit varying levels of artificial intelligence (AI) adoption and manufacturing transformation. This paper will therefore further examine the differing impacts of AI on manufacturing transformation across distinct enterprises, industries, and regions to deepen our understanding of AI’s practical role in this transformation.
4.3.1. Enterprise Level
At the enterprise level, internal characteristics of companies themselves may exert significant influence on the development of artificial intelligence capabilities and the transformation of manufacturing toward new quality. Differences in enterprise scale, operational performance, internal control rigor, governance standards, and digitalization levels can lead to divergent internal development trajectories, thereby causing variations in AI’s impact on manufacturing transformation. Therefore, the following regression model is constructed to conduct group-specific regression analysis for testing enterprise-level heterogeneity:
Here, the superscript h represents heterogeneity characteristics such as enterprise scale, operational status, internal control level, governance level, and digitalization level. This study continues to employ robust standard errors based on clustering at the enterprise level. Results are presented in Table 8 and Table 9. It is evident that AI significantly enhances manufacturing innovation for enterprises of all scales and digitalization levels, although with slight variations in significance and coefficient values. Notably, the positive impact of AI is smaller for large-scale enterprises or those with high digitalization levels compared to smaller, less digitalized firms. This may be due to recent national strategies, such as the Manufacturing Power Strategy and the Science and Education Revitalisation Strategy, which have accelerated the development of AI. Consequently, large enterprises or those with advanced digitalization already exhibit higher innovation levels, where AI serves primarily as an enhancement to their existing new quality development. Conversely, for smaller enterprises with lower digitalization levels, AI compensates for existing deficiencies and plays a more substantial role in their new quality transformation. Furthermore, AI exerts a significant positive effect only on enterprises with sound operational performance, effective internal controls, and high governance standards. It does not yield significant results for enterprises with poor operational performance, ineffective internal controls, and low governance levels. The underlying reason may be that the development of AI within enterprises requires substantial funding and support from senior management. Consequently, AI plays a significant role in enterprises with sound operations, effective internal controls, and high governance standards. Conversely, for enterprises with poor operations, ineffective internal controls, and low governance standards, AI technology may exacerbate operational deterioration, hindering their new quality transformation.
Table 8.
Heterogeneity analysis of enterprise size, enterprise ownership structure, and enterprise operational performance.
Table 9.
Heterogeneity analysis of enterprise control level, enterprise governance level, and enterprise digitalization level.
4.3.2. Industry Level
Differences in industry categories, structures, statuses, and sustainable development levels may lead to variations in the impact of artificial intelligence on manufacturing transformation. Therefore, this paper will further explore the influence of AI on manufacturing transformation from the perspective of industry heterogeneity.
Category Heterogeneity. Corporate AI transformation and R&D investment exhibit a certain correlation with industry category characteristics. This may stem from varying degrees of AI penetration across different categories. Industries with robust foundations in intelligence and automation achieve higher AI penetration rates, creating strong complementarities that ultimately enhance new quality manufacturing. To examine the heterogeneous impact of AI on new quality manufacturing development across different sectors, this paper categorizes industries into high-end, mid-end, and low-end manufacturing based on OECD classification standards. As shown in Table 10, mid-end and high-end manufacturing exhibit highly significant positive effects, with high-end manufacturing demonstrating a greater positive impact than mid-end manufacturing. Conversely, low-end manufacturing shows no significant effect, indicating sectoral heterogeneity. This phenomenon stems from China’s current AI development being in a transitional phase between its initial and developmental stages. AI’s strong penetrative power has not yet reached all sectors, instead prioritizing industries with robust foundations in intelligence and automation.
Table 10.
Impact of artificial intelligence on the new quality transformation of manufacturing from a sub-industry perspective.
Industrial Structure Heterogeneity. When adjusting industrial structures, governments often classify technology-intensive industries that play a vital role in the economy and support sustainable development as encouraged industries; industries with relatively backward technology that pose safety risks or hinder carbon neutrality goals but are amenable to rectification as restricted industries; and industries that severely waste resources, pollute the environment, or violate laws and regulations as eliminated industries. This approach may lead to industrial structure heterogeneity. This study grouped industries into encouraged, restricted, and phased-out categories based on classification standards and conducted regression analysis. The results are presented in Table 11. Findings indicate that artificial intelligence significantly promotes the new quality transformation of manufacturing within encouraged and restricted industries, whereas regression results for phased-out industries are insignificant, revealing industrial structure heterogeneity.
Table 11.
Impact of artificial intelligence on the new quality transformation of manufacturing from other industrial perspectives.
Heterogeneity in Industrial Strategic Position. Within industrial strategic positioning, strategic emerging industries serve as pioneering sectors for AI development. Their adoption of innovative AI technologies may generate greater manufacturing transformation. Therefore, this study investigates whether AI impacts manufacturing transformation differently across industries based on their strategic status as strategic emerging industries. As shown in Table 11 (4) and (5), AI significantly positively impacts the new quality of manufacturing in both non-strategic emerging industries and strategic emerging industries. However, the positive effect is significantly greater in strategic emerging industries than in non-strategic emerging industries, indicating heterogeneity in industrial strategic status.
Heterogeneity in Industrial Green Development. To implement the spirit of the 20th CPC National Congress and accelerate the achievement of the “dual carbon” goals, China’s National Development and Reform Commission (NDRC) and eight other ministries jointly revised the Green Industry Guidance Catalog (2023 Edition), promoting industrial green development across multiple dimensions. Therefore, this study divides the sample into two groups based on whether they belong to green industries to explore the heterogeneity of industrial green development. As shown in Table 11 columns (6) and (7), the application of artificial intelligence by manufacturing enterprises in green industries has a significant positive impact on manufacturing transformation and upgrading, whereas this effect is insignificant in non-green industries, indicating pronounced heterogeneity in industrial green development.
4.3.3. Regional Level
The transformation and development of artificial intelligence require support in areas such as technology, funding, infrastructure, and talent. These factors vary across regional spatial dimensions, potentially leading to regional heterogeneity in AI’s impact on manufacturing transformation. Therefore, this paper will also focus on analyzing regional heterogeneity in AI’s influence on manufacturing transformation in the context of geographical location, urban clusters, and regional resource endowments.
Regional Geographical Heterogeneity. Uneven development across regions results in varying degrees of AI advancement, which in turn affects the development of new quality manufacturing. Eastern and central regions possess more developed AI infrastructure, well-established information and communications industries, and stronger R&D capabilities. They host significantly more research institutes, high-tech enterprises, and universities than western regions, thereby promoting the clustering of talent, capital, and technological resources. As these factors cluster, industrial agglomeration occurs, potentially widening the gap between western regions and their eastern/central counterparts. However, the strong spillover effects of AI may flow from eastern to western regions, thereby elevating the economic, technological and human capital quality of the latter and driving their development. Consequently, AI’s impact on new quality manufacturing may exhibit regional geographical heterogeneity. This study divides the sample into eastern, central, and western regions for analysis. As shown in columns (1) to (3) of Table 12, the eastern region exhibits the strongest positive effect, significant at the 1% level, followed by the central region, while the western region shows no significant effect. This indicates that AI levels in the eastern and central regions exert a stronger influence on manufacturing transformation than in the western region, confirming geographical heterogeneity.
Table 12.
Regional geographical location and natural resource endowment heterogeneity.
Regional Heterogeneity in Natural Resource Endowments. The State Council’s “National Sustainable Development Plan for Resource-Based Cities” categorizes China’s 262 resource-based cities into growth-stage, mature-stage, declining-stage, and regenerating-stage cities. The plan aims to strengthen the development of growth-stage cities, optimize the structure of mature-stage cities, encourage the transformation of declining-stage cities, and enhance governance in regenerating-stage cities. This promotes ecological construction, environmental protection, resource compensation, economic development, and common prosperity. Currently, China’s AI and new quality manufacturing development still relies on natural resource endowments, which may lead to regional disparities in their advancement. Therefore, this paper conducts grouped tests based on samples classified into the four resource-based city categories. Columns (4) to (7) in Table 12 report the results of regional natural resource endowment heterogeneity on AI’s impact on manufacturing transformation. Findings indicate that AI adoption by manufacturing enterprises in growing, mature, and regenerating cities significantly promotes manufacturing transformation, with diminishing positive effects across these categories. In contrast, no significant effect is observed in declining cities, confirming the existence of heterogeneity in natural resource endowments.
Heterogeneity of Urban Agglomerations. The development of urban agglomerations also significantly impacts the advancement of artificial intelligence and the transformation of manufacturing. Based on the Opinions of the Central Committee of the Communist Party of China and the State Council on Establishing a More Effective New Mechanism for Coordinated Regional Development issued by the State Council, this paper categorizes urban agglomerations into 11 groups: the Beijing-Tianjin-Hebei Urban Agglomeration, the Yangtze River Delta Urban Agglomeration, the Pearl River Delta Urban Agglomeration, the Chengdu-Chongqing Urban Agglomeration, the Middle Yangtze River Urban Agglomeration, the Guangdong-Hong Kong-Macao Greater Bay Area Urban Agglomeration, Shandong Peninsula Urban Agglomeration, Liaoning Central-Southern Urban Agglomeration, Central Plains Urban Agglomeration, Guanzhong Plain Urban Agglomeration, and West Coast of Taiwan Strait Urban Agglomeration. Table 13 and Table 14 present the results of the grouped regression analysis. Findings indicate that the application of artificial intelligence by manufacturing enterprises in all urban agglomerations significantly promotes the development of new quality manufacturing, but this impact exhibits urban agglomeration heterogeneity. The Shandong Peninsula Urban Agglomeration exhibits the strongest promotional effect, while the Middle Yangtze River Urban Agglomeration, Central Plains Urban Agglomeration, and Guanzhong Plain Urban Agglomeration show the weakest effects, with AI coefficients below 0.1. Other urban agglomerations demonstrate moderate promotional effects, with AI impact coefficients ranging between 0.1 and 0.2, confirming the presence of urban agglomeration heterogeneity.
Table 13.
Impact of artificial intelligence on the new quality transformation of manufacturing under urban cluster heterogeneity.
Table 14.
Test results for the cost penetration mechanism.
4.4. Mechanism Testing
Artificial intelligence may directly influence the New Quality Transformation of Manufacturing through cost penetration, cutting-edge innovation, and lean production. Therefore, building upon existing benchmark regression models, this paper constructs the following mediation regression model to empirically examine the impact mechanism of artificial intelligence on manufacturing transformation:
Here, represents penetration costs, represents cutting-edge innovation mechanisms, and represents lean production mechanisms. The principle of the three-step mediation test is as follows: First, examine the effect of the independent variable on the dependent variable. If significant, the total effect is significant. Second, examine the effect of the independent variable on the mediating variable. If significant, proceed to the next step. Finally, simultaneously include the independent variable, mediating variable, and dependent variable in the model. If the mediating variable coefficient is significant, the mediation mechanism is validated. If the independent variable coefficient is insignificant at this stage, it indicates full mediation; otherwise, it indicates partial mediation. Additionally, to verify the existence and robustness of the mediating effect, this paper will employ Sobel tests and 1000-sample bootstrap tests for further validation.
4.4.1. Penetration Costs
When new technologies penetrate traditional technologies and existing infrastructure, they incur additional time-related costs and fee-related costs. Given that enterprise time lag costs significantly impact the operating cycle, this paper selects the logarithm of the enterprise operating cycle as the proxy variable for time lag costs. Concurrently, the logarithm of new technology R&D expenditures serves as the proxy variable for expense costs, as new technology R&D expenditures constitute a substantial proportion of expense costs [45,46].
Table 14 sequentially reports the test results for the time lag cost (time) and fee cost (fee) mechanisms within the penetration cost (perm). Columns (2) and (3) report the results for the time lag cost mechanism, while columns (4) and (5) present the results for the fee cost mechanism. It can be observed that AI exerts a significant negative effect (p < 0.05) on both time lag costs and fee costs. For every 1 percentage point increase in AI adoption, time lag costs and fee costs decrease by 3.2 and 1.4 percentage points, respectively. Including both the mediator and independent variables in the equation maintains statistical significance, indicating that AI mitigates the adverse effects of penetration costs on new quality manufacturing by reducing both time delay and fee-based components. Furthermore, to address robustness concerns, this study employed Sobel tests and 1000-sample bootstrap tests. The Z-statistics yielded values of 4.824 and 4.387, respectively, both significant at the 1% level. Similarly, bootstrap abstract tests revealed that the 95% confidence interval for the mediating effect spans [0.000229, 0.000518] and [0.000356, 0.000784], respectively, neither of which included zero, indicating that the conclusions remain robust. This confirms that the mechanism whereby AI enhances manufacturing innovation by reducing penetration costs holds true, thereby validating Hypothesis 2.
4.4.2. Cutting-Edge Innovation
The cutting-edge innovation mechanism encompasses enhancing the quality of the cutting-edge factor combination structure (ele) and key core technologies (key). The combination of cutting-edge capital and cutting-edge labor significantly influences the cutting-edge factor combination structure. Therefore, this paper uses the product of R&D personnel per unit and R&D output per unit as the proxy variable for the quality of the cutting-edge factor combination structure (ele). Given the difficulty in measuring key core technology indicators, this paper uses the proportion of utility model patents to total patent applications as a proxy variable for key core technology indicators (key) [47].
Table 15 sequentially reports the test results for the cutting-edge factor combination structure quality (ele) and key core technology (key) mechanisms within the cutting-edge innovation mechanism (cut). Columns (2) and (3) report the mechanism verification results for cutting-edge factor combination structure quality, while columns (4) and (5) present those for key core technology. Findings indicate that artificial intelligence exerts a significant positive effect (p < 0.05) on both cutting-edge factor combination structure quality and key core technology. For every 1 percentage point increase in AI, cutting-edge factor combination structure quality and key core technology rise by 17.1 and 2.7 percentage points, respectively. When both the mediating variable and independent variable are included in the equation, the results remain significant. This indicates that AI further promotes the qualitative transformation of manufacturing by enhancing the quality of cutting-edge factor combination structures and key core technologies within the cutting-edge innovation mechanism. Furthermore, to address robustness concerns, this study employed Sobel tests and 1000-sample bootstrap tests. The Z-statistics yielded values of 90.148 and 12.975, respectively, both significant at the 1% level. Similarly, bootstrap abstract tests revealed that the 95% confidence interval for the mediating effect spans [0.0193052, 0.0271263] and [0.0029211, 0.0038227], respectively, neither of which included zero, indicating that the conclusions remain robust. This confirms that the mechanism through which AI enhances the new quality of manufacturing via cutting-edge innovation is valid, thereby validating Hypothesis 3.
Table 15.
Test results for corporate cutting-edge innovation mechanisms.
4.4.3. Lean Production
The lean production mechanism primarily encompasses enhancing resource utilization (UTI) and operational management efficiency (MAN). This paper employs the production function method to measure the resource utilization efficiency (UTI) of listed companies [48]. Subsequently, it utilizes the total asset turnover ratio—defined as the ratio of a company’s sales revenue to its total assets—from operational capability metrics to assess the operational management efficiency (MAN) of listed companies [49].
Table 16 sequentially reports the test results for the mechanisms of enhancing resource utilization efficiency (uti) and corporate operational management efficiency (man) within the lean production mechanism. Columns (2) and (3) present the results for the resource utilization enhancement mechanism, while columns (4) and (5) show the results for the operational management efficiency mechanism. Findings indicate that AI exerts a significant positive effect (p < 0.05) on both the quality of cutting-edge factor combination structures and key core technologies. For every 1 percentage point increase in AI, resource utilization and operational management efficiency rise by 0.9 and 4.4 percentage points, respectively. When both the mediating variable and independent variable are simultaneously included in the equation, the results remain significant. This indicates that AI promotes the qualitative transformation of manufacturing by enhancing resource utilization and operational management efficiency within the lean production mechanism. Furthermore, to address robustness concerns, this study employed Sobel tests and 1000-sample bootstrap tests. The Z-statistics yielded values of 10.321 and 2.336, respectively, both significant at the 1% level. Bootstrap abstraction tests show that the 95% confidence intervals for the mediation effect are [0.000215, 0.028387] and [0.032207, 0.047816], both excluding zero, confirming the robustness of the conclusions. This indicates that AI promotes the qualitative transformation of manufacturing through lean production mechanisms, thereby validating Hypothesis 4.
Table 16.
Enterprise lean mechanism verification results.
5. Discussion and Conclusions
5.1. Discussion
Manufacturing serves as the core of national economic development. Its new quality transformation requires manufacturing enterprises to harness innovation as the engine, transitioning from traditional factor-driven growth to innovation-driven growth, and fundamentally breaking free from path dependencies rooted in resource scale. The new quality transformation of manufacturing serves as the core pillar for a nation to advance industrial system upgrades, enhance core competitiveness, and achieve high-quality economic growth. Artificial intelligence fundamentally transforms traditional manufacturing production methods, helping enterprises shift from “factor-driven” to “innovation-driven” models. It resolves the transformation dilemma of “unwillingness to transform” and “inability to transform,” strengthening corporate core competitiveness and endogenous innovation momentum. AI represents the core force enabling a nation to achieve new quality manufacturing, lead industrial transformation, and elevate national competitiveness. This study constructs a multisectoral equilibrium model based on existing literature and theoretical frameworks to theoretically derive and elaborate on AI’s impact on the new quality transformation of Chinese manufacturing. Empirical testing confirms AI’s positive influence: manufacturing enterprises with higher AI development levels exhibit greater new quality transformation. These findings resonate with prior research, underscoring AI as a crucial enabler for enterprises to achieve new quality transformation.
Due to differences in industrial categories, structures, status, and sustainability, AI’s impact on the new quality transformation of Chinese manufacturing exhibits significant heterogeneity at the industry level. Regarding category heterogeneity, AI adoption by mid-tier and high-end manufacturing enterprises has a highly significant positive effect on the new quality transformation of Chinese manufacturing, whereas low-end manufacturing shows no significant effect. Thus, this impact exhibits industrial category heterogeneity. Regarding industrial structure heterogeneity, AI adoption by manufacturing enterprises in encouraged and restricted industries significantly promotes new quality transformation, whereas it is insignificant in phased-out industries. Thus, this impact exhibits industrial structure heterogeneity. Regarding strategic industrial status heterogeneity, AI adoption by manufacturing enterprises in both non-strategic emerging industries and strategic emerging industries positively impacts new quality transformation. However, the positive effect is significantly greater for strategic emerging industries than for non-strategic emerging industries, indicating strategic industrial status heterogeneity. Regarding industrial green development heterogeneity, AI adoption by manufacturing enterprises in green industries significantly promotes new quality transformation, while non-green industries show no significant effect. Thus, this impact exhibits industrial green development heterogeneity.
Due to regional differences in geographical location, urban clusters, and resource endowments, AI’s influence on the new quality transformation of Chinese manufacturing exhibits distinct regional heterogeneity. Regarding regional geographic location heterogeneity, regions are divided into eastern, central, and western parts based on geographic position. AI adoption by manufacturing enterprises in eastern and central regions significantly promotes the new quality transformation of Chinese manufacturing, with eastern regions showing a greater positive effect than central regions, while western regions show no significant effect. Thus, this impact exhibits geographic location heterogeneity. Regarding regional natural resource endowment heterogeneity. Cities are categorized as growth-stage, mature-stage, declining-stage, or regenerating-stage based on natural resource endowment. Manufacturing enterprises in growth-stage, mature-stage, and regenerating-stage cities all significantly promote new quality transformation through AI adoption, with diminishing positive effects across these stages. No significant effect is observed in declining-stage cities, indicating resource endowment heterogeneity. Regarding agglomeration heterogeneity, China’s official policy documents classify urban agglomerations into 11 clusters: Beijing-Tianjin-Hebei, Yangtze River Delta, Pearl River Delta, Chengdu-Chongqing, Middle Yangtze River, Guangdong-Hong Kong-Macao Greater Bay Area, Shandong Peninsula, Liaoning Central-Southern, Central Plains, Guanzhong Plain, and West Coast of Taiwan Strait. The study finds that AI adoption by manufacturing enterprises significantly promotes the new quality transformation of manufacturing across all urban agglomerations. The Shandong Peninsula Urban Agglomeration exhibits the strongest promotional effect, with an AI coefficient exceeding 0.2. Conversely, the Middle Yangtze River Urban Agglomeration, Central Plains Urban Agglomeration, and Guanzhong Plain Urban Agglomeration demonstrate the weakest effects, with AI coefficients below 0.1. Other agglomerations show moderate promotional effects, with coefficients ranging between 0.1 and 0.2, indicating urban agglomeration heterogeneity in this influence.
Regarding pathway mechanisms, AI influences the new quality transformation of manufacturing through three key intermediary channels: penetration costs, cutting-edge innovation, and lean production. This study theoretically elucidates and empirically validates these three independent transmission channels. Firstly, AI effectively reduces time lag and expense costs to promote qualitative transformation, thereby reducing penetration costs. When manufacturing enterprises develop AI, they can leverage technologies like machine learning and random forests to break through mental barriers, accelerate penetration and restructuring, reduce transaction and time lag costs, mitigate cash flow risks and operational burdens, achieve simultaneous growth in scale and quality, and enhance efficiency while cutting costs, thereby promoting the new quality transformation of manufacturing enterprises. Second, cutting-edge innovation: AI effectively enhances the quality of cutting-edge factor combinations and key core technological innovations to advance manufacturing transformation. The widespread adoption of AI reduces the proportion of traditional factors while increasing the share of cutting-edge technological factors. This enhances the quality of cutting-edge factor combinations within innovation mechanisms, driving the new quality transformation. Simultaneously, AI’s widespread application boosts the efficiency of R&D for key core technologies, advancing their progress and thereby propelling the new quality transformation. Thirdly, lean production: AI effectively improves resource utilization and operational management efficiency to foster new quality manufacturing. AI further optimizes factor resource allocation efficiency, enabling lean production and thereby advancing new quality manufacturing. Simultaneously, AI technologies like virtual reality facilitate real-time internal communication within enterprises, enhancing operational management efficiency and achieving lean production. It also improves division of labor and collaboration efficiency among upstream and downstream enterprises in industrial chains, promoting lean production and thus driving the new quality transformation. This study contributes to the literature by revealing how manufacturing enterprises leverage AI through these three channels to build a triple advantage of low-cost, cutting-edge innovation, and lean production, thereby enhancing international competitiveness and achieving the new quality transformation.
5.2. Limitations and Future Research Directions
Despite its contributions to the existing literature, this study has limitations. Regarding sample selection, data acquisition constraints led to a bias toward listed companies, limiting discussions and empirical analyses of non-listed firms. Regarding scope, the study focuses solely on the impact of AI adoption by Chinese manufacturing enterprises on the new quality transformation, with this narrow perspective limiting external validity. In model specification, while the empirical model incorporates most key determinants of the new quality transformation as control variables, numerous other factors may still influence manufacturing transformation, posing risks of omitted variable bias. Despite these limitations, the robustness of the findings is unlikely to be substantially undermined. Future research will strive to systematically address these issues.
To enhance the rigor and breadth of subsequent studies, this paper proposes several research directions: First, expanding the sample size by collecting data from a more diverse range of enterprises (including non-listed companies) can improve sample representativeness and strengthen the reliability of research conclusions. Second, conducting cross-country comparative analyses across different institutional environments will help examine the stability and heterogeneity of the relationship between AI and new quality manufacturing. Finally, integrating qualitative case studies with existing theoretical and empirical frameworks can provide deeper insights into the underlying mechanisms of this relationship. Through multi-method triangulation, researchers can conduct more comprehensive validation of the findings. These research initiatives will deepen our understanding of the role of artificial intelligence in the transformation of the manufacturing sector and provide practical guidance for local government policy formulation and corporate strategic decisions. Through the mutual empowerment of technological innovation and industrial integration, AI is poised to become an indispensable core force in achieving manufacturing transformation, driving industrial change, and enhancing national competitiveness. Intensive exploration in this field holds significant practical and theoretical value.
5.3. Conclusion
This paper first constructs a multi-sector equilibrium model to theoretically derive the focal points of AI’s contribution to the qualitative transformation of Chinese manufacturing. It then conducts an equilibrium analysis of AI’s impact on this transformation. Subsequently, AI’s influence and mechanisms are measured at the firm, industry, and regional levels, with empirical tests conducted to verify their effects on the qualitative transformation of Chinese manufacturing. The findings reveal that (1) AI significantly promotes the new-quality transformation of Chinese manufacturing. (2) This impact exhibits heterogeneity. At the firm level, the effect shows heterogeneity in firm performance, internal control intensity, and governance quality, while no significant heterogeneity is observed in firm size, ownership structure, or digitalization level. At the industry level, the impact exhibits heterogeneity in technological intensity, industrial structure, strategic importance, and green development. At the regional level, the impact varies across geographic location, natural resource endowment, and urban agglomeration. (3) AI enhances the new quality of Chinese manufacturing by reducing time lag and cost-related barriers to penetration; strengthening the quality of cutting-edge factor combinations and core technologies within advanced innovation mechanisms; and improving resource utilization and operational efficiency through lean production mechanisms.
5.4. Policy Recommendations
The test results and research data give rise to the following conclusions and policy recommendations:
First, establish a multi-stakeholder coordination mechanism to fully leverage the core enabling role of artificial intelligence. Government departments must strengthen cross-departmental coordination and central–local collaboration to form a cohesive policy force. This will maximize the core enabling role of AI, facilitate the transition from “Made in China” to “Intelligent Manufacturing in China,” and provide a solid material and technological foundation for building a modern socialist country in all respects. This should be pursued through three key approaches: First, unlock the value of data as a key factor by cultivating high-quality manufacturing datasets nationwide. Implement incentives for manufacturing data conversion and establish industry-specific data spaces and trading mechanisms to solidify the foundation for AI empowerment. Second, deepen the integration of AI with manufacturing technologies. Drive AI penetration across the entire manufacturing value chain through scenario-based applications, transitioning from isolated smart solutions to systemic intelligence to achieve intelligent manufacturing upgrades. Third, build a digital-intelligent industrial chain ecosystem to drive “chain-based” collaborative transformation. Use AI to reshape industrial chain collaboration models and enhance value creation across the entire chain.
Second, identify key pathways and mechanisms to promote efficient AI empowerment. AI is driving qualitative transformation in manufacturing by reducing penetration costs and enhancing cutting-edge innovation and lean production effects. Support enterprises in integrating AI by boosting innovation awareness and lowering transformation costs to address the issues of “hesitation to transform” and “inability to transform.” Specifically, focus on three areas: First, improve infrastructure to lower AI industry penetration costs and boost production efficiency and scale. Second, strengthen cutting-edge innovation by increasing R&D investment in robotics logistics, virtual reality, and other fields, with government funding subsidies and tax incentives complemented by refined corporate evaluation mechanisms. Third, advance lean production by leveraging remote monitoring and intelligent analytics to optimize processes, achieve efficient production management, and drive sustainable corporate development.
Third, emphasize the transition from quantitative to qualitative change by addressing deficiencies in “new-quality labor objects and means.” AI’s enhancement of manufacturing quality faces shortcomings in “new-quality labor objects” (raw material supply, new energy levels) and “new-quality labor means” (infrastructure, production tools). Specifically, focus on three areas. First, enhance new-quality means of production by developing next-generation infrastructure such as smart transportation logistics and industrial internet, promoting domestically produced intelligent industrial software, and cultivating low-carbon, high-efficiency new-quality production tools. Second, strengthen new-quality objects of labor by establishing industrial chain supply-demand platforms to stabilize raw material supply, advancing renewable energy development (wind/solar), improving policy support systems, and optimizing energy structures. Third, adhere to case-by-case analysis by implementing differentiated development strategies. At the enterprise level, implement targeted measures for different foundational enterprises: incentivize rapid transformation upgrades for agile enterprises, and assist “unable to transform” or “unskilled in transformation” enterprises in reducing transition costs through flexible, low-cost strategies. At the industry level, provide categorized guidance: support the expansion of “AI+” friendly industries, assist industries with limited impact on transformation, strictly limit approvals for restricted industries, and phase out outdated production capacity. Focus on strategic emerging industries, strengthen international cooperation, and enhance global competitiveness. Simultaneously, prioritize risk prevention: establish cross-industry governance models for non-strategic emerging industries, set “bottom lines” and “red lines,” and improve risk mitigation mechanisms. At the regional level, eastern and central regions should advance deep integration of AI with local industries while avoiding blind investment. Western regions should optimize business environments to attract high-tech enterprises and talent, strengthening industry–academia–research collaboration. Resource-based cities should refine sustainable development policies, while growing and mature cities should accelerate transformation and upgrading. Declining cities require greater fiscal support to break resource dependency.
Author Contributions
Conceptualization, S.D. and H.C.; methodology, S.D. and H.C.; software, S.D.; validation, S.D. and H.C.; formal analysis, S.D. and and L.L.; investigation, S.D.; resources, S.D.; data curation, S.D.; writing—original draft preparation, S.D. and H.C.; writing—review and editing, S.D., L.L. and H.C.; visualization, S.D. and and L.L.; supervision, S.D. and and L.L.; project administration, S.D. and H.C. All authors have read and agreed to the published version of the manuscript.
Funding
There are currently no supporting funds.
Institutional Review Board Statement
Not applicable.
Informed Consent Statement
Not applicable.
Data Availability Statement
The original contributions presented in this study are included in the article. Further inquiries can be directed to the corresponding author.
Conflicts of Interest
The authors declare no conflict of interest.
References
- Xie, F.; Jiang, N.; Kuang, X. Towards an accurate understanding of ‘new quality productive forces’. Econ. Political Stud. 2025, 13, 1–15. [Google Scholar] [CrossRef] [Scilit]
- Liu, Y.; He, Z. Synergistic industrial agglomeration, new quality productive forces and high-quality development of the manufacturing industry. Int. Rev. Econ. Financ. 2024, 94, 103373. [Google Scholar] [CrossRef] [Scilit]
- Hu, Y.; Jia, X. Empowering the Intelligent Transformation of the Manufacturing Sector Through New Quality Productive Forces: Value Implications, Theoretical Analysis, and Empirical Examination. Sustainability 2025, 17, 7006. [Google Scholar] [CrossRef] [Scilit]
- Luo, Z.; Hu, P. New Quality Productive Forces to Promote the Transformation and Upgrading of Guangdong Manufacturing Industry: Logical Mechanism, Realistic Dilemma and Development Strategy. J. Eng. 2024, 2, 53. [Google Scholar] [CrossRef] [Scilit]
- Zhou, J.; Wen, X. Research on influencing factors and multiple driving paths of intelligent transformation in China’s manufacturing industry. J. Comput. Methods Sci. Eng. 2021, 21, 1561–1573. [Google Scholar] [CrossRef] [Scilit]
- Piao, Y. The Promotion of Artificial Intelligence and the Formation of New Quality Productivity. Adv. Econ. Manag. Res. 2024, 12, 74. [Google Scholar] [CrossRef] [Scilit]
- Wang, Q.; Sun, T.; Li, R. Does artificial intelligence promote green innovation? An assessment based on direct, indirect, spillover, and heterogeneity effects. Energy Environ. 2025, 36, 1005–1037. [Google Scholar] [CrossRef] [Scilit]
- Farayola, O.A.; Abdul, A.A.; Irabor, B.O.; Okeleke, E.C. Innovative Business Models Driven by AI Technologies: A Review. Comput. Sci. IT Res. J. 2023, 4, 85–110. [Google Scholar] [CrossRef] [Scilit]
- Bounfour, A.; Nonnis, A.; Le, P.; Sternberger, C. Knowledge diffusion and new technologies: A spillover analysis on the artificial intelligence case. Int. J. Intellect. Prop. Manag. 2025, 15, 1–19. [Google Scholar] [CrossRef] [Scilit]
- Liu, Z.; Ma, X.; Gong, J. AI-Powered Carbon Mitigation: Charting the Green Inflection Point of Manufacturing in the Intelligent Economy Era. Sustainability 2026, 18, 1971. [Google Scholar] [CrossRef] [Scilit]
- Chang, J. Digital technology, innovation resource misallocation, and green technology innovation efficiency: Evidence from China. Environ. Dev. Sustain. 2025, 27, 1–33. [Google Scholar] [CrossRef] [Scilit]
- Radanliev, P.; De Roure, D.; Maple, C.; Ani, U. Super-forecasting the ‘technological singularity’ risks from artificial intelligence. Evol. Syst. 2022, 13, 747–757. [Google Scholar] [CrossRef] [Scilit]
- Li, L. China’s manufacturing locus in 2025: With a comparison of “Made-in-China 2025” and “Industry 4.0”. Technol. Forecast. Soc. Chang. 2018, 135, 66–74. [Google Scholar] [CrossRef] [Scilit]
- Liu, J.; Chang, H.; Forrest, J.Y.-L.; Yang, B. Influence of artificial intelligence on technological innovation: Evidence from the panel data of china’s manufacturing sectors. Technol. Forecast. Soc. Change 2020, 158, 120142. [Google Scholar] [CrossRef] [Scilit]
- Chen, X.; Liu, L.; Li, D.; Han, Y.; Liu, X. The impact of artificial intelligence on the new quality productive forces of enterprises. J. Digit. Manag. 2025, 1, 3. [Google Scholar] [CrossRef] [Scilit]
- Wang, F. Research on the application of artificial intelligence technology to promote the high-quality development path of manufacturing industry. SHS Web Conf. 2023, 154, 03001. [Google Scholar] [CrossRef] [Scilit]
- Zhang, Z.; Li, P.; Huang, L.; Kang, Y. The impact of artificial intelligence on green transformation of manufacturing enterprises: Evidence from China. Econ. Change Restruct. 2024, 57, 146. [Google Scholar] [CrossRef] [Scilit]
- Lei, L.; Feng, H.; Ren, J. Artificial intelligence, human capital and firm-level total factor productivity. Financ. Res. Lett. 2025, 85, 107897. [Google Scholar] [CrossRef] [Scilit]
- Brynjolfsson, E.; Rock, D.; Syverson, C. Artificial Intelligence and the Modern Productivity Paradox: A Clash of Expectations and Statistics; National Bureau of Economic Research: Cambridge, MA, USA, 2017; pp. 23–57. [Google Scholar]
- Khalil, A.; Agarwal, R.; Yaqub, M.Z.; Papa, A. Unlocking the AI-Productivity paradox in HR: Qualitative insights across organizational levels. J. Bus. Res. 2025, 199, 115456. [Google Scholar] [CrossRef] [Scilit]
- Bonsay, J.O.; Cruz, A.P.; Firozi, H.C.; Camaro, P.J.C. Artificial Intelligence and Labor Productivity Paradox: The Economic Impact of AI in China, India, Japan, and Singapore. J. Econ. Financ. Account. Stud. 2021, 3, 120–139. [Google Scholar] [CrossRef] [Scilit]
- Acemoglu, D.; Restrepo, P. Low-Skill and High-Skill Automation. J. Hum. Cap. 2018, 12, 204–232. [Google Scholar] [CrossRef] [Scilit]
- Aghion, P.; Bechtold, S.; Cassar, L.; Herz, H. The Causal Effects of Competition on Innovation: Experimental Evidence. J. Law Econ. Organ. 2018, 34, 162–195. [Google Scholar] [CrossRef] [Scilit]
- Aghion, P.; Bénabou, R.; Martin, R.; Roulet, A. Environmental Preferences and Technological Choices: Is Market Competition Clean or Dirty? Am. Econ. Rev. Insights 2023, 5, 1–19. [Google Scholar] [CrossRef] [Scilit]
- Olan, F.; Arakpogun, E.O.; Suklan, J.; Nakpodia, F.; Damij, N.; Jayawickrama, U. Artificial intelligence and knowledge sharing: Contributing factors to organizational performance. J. Bus. Res. 2022, 145, 605–615. [Google Scholar] [CrossRef] [Scilit]
- Malik, S.; Muhammad, K.; Waheed, Y. Artificial intelligence and industrial applications-A revolution in modern industries. Ain Shams Eng. J. 2024, 15, 102886. [Google Scholar] [CrossRef] [Scilit]
- Lee, J.; Davari, H.; Singh, J.; Pandhare, V. Industrial Artificial Intelligence for industry 4.0-based manufacturing systems. Manuf. Lett. 2018, 18, 20–23. [Google Scholar] [CrossRef] [Scilit]
- Iyelolu, T.V.; Agu, E.E.; Idemudia, C.; Ijomah, T.I. Driving SME innovation with AI solutions: Overcoming adoption barriers and future growth opportunities. Int. J. Sci. Technol. Res. Arch. 2024, 7, 036–054. [Google Scholar] [CrossRef] [Scilit]
- Agrawal, A.; Gans, J.S.; Goldfarb, A. Artificial intelligence adoption and system-wide change. J. Econ. Manag. Strat. 2024, 33, 327–337. [Google Scholar] [CrossRef] [Scilit]
- Hangl, J.; Krause, S.; Behrens, V.J. Drivers, barriers and social considerations for AI adoption in SCM. Technol. Soc. 2023, 74, 102299. [Google Scholar] [CrossRef] [Scilit]
- Cubric, M. Drivers, barriers and social considerations for AI adoption in business and management: A tertiary study. Technol. Soc. 2020, 62, 101257. [Google Scholar] [CrossRef] [Scilit]
- Umeorah, S.C.; Adelaja, A.O.; Ayodele, O.F.; Abikoye, B.E. Artificial Intelligence (AI) in working capital management: Practices and future potential. World J. Adv. Res. Rev. 2024, 23, 1436–1451. [Google Scholar] [CrossRef] [Scilit]
- Varriale, V.; Cammarano, A.; Michelino, F.; Caputo, M. Critical analysis of the impact of artificial intelligence integration with cutting-edge technologies for production systems. J. Intell. Manuf. 2025, 36, 61–93. [Google Scholar] [CrossRef] [Scilit]
- Zohuri, B.; Rahmani, F.M. Artificial intelligence driven resiliency with machine learning and deep learning components. Int. J. Nanotechnol. Nanomed. 2019, 4, 1–8. [Google Scholar] [CrossRef] [Scilit]
- Platania, F.; Hernandez, C.T.; El Ouadghiri, I.; Peillex, J. Bridging AI innovation and sustainable Development: The effect of AI technological progress on SDG investment performance. Technovation 2025, 146, 103279. [Google Scholar] [CrossRef] [Scilit]
- Lewis, M.A. Lean production and sustainable competitive advantage. Int. J. Oper. Prod. Manag. 2000, 20, 959–978. [Google Scholar] [CrossRef] [Scilit]
- Burström, T.; Parida, V.; Lahti, T.; Wincent, J. AI-enabled business-model innovation and transformation in industrial ecosystems: A framework, model and outline for further research. J. Bus. Res. 2021, 127, 85–95. [Google Scholar] [CrossRef] [Scilit]
- Nagy, M.; Lăzăroiu, G.; Valaskova, K. Machine Intelligence and Autonomous Robotic Technologies in the Corporate Context of SMEs: Deep Learning and Virtual Simulation Algorithms, Cyber-Physical Production Networks, and Industry 4.0-Based Manufacturing Systems. Appl. Sci. 2023, 13, 1681. [Google Scholar] [CrossRef] [Scilit]
- Chu, H.; Niu, X.; Li, M.; Wei, L. Research on the impact of new quality productivity on enterprise ESG performance. Int. Rev. Econ. Financ. 2025, 99, 104009. [Google Scholar] [CrossRef] [Scilit]
- Chen, K.; Chen, X.; Wang, Z.-A.; Zvarych, R. Does artificial intelligence promote common prosperity within enterprises? —Evidence from Chinese-listed companies in the service industry. Technol. Forecast. Soc. Change 2024, 200, 123180. [Google Scholar] [CrossRef] [Scilit]
- Zhong, Y.; Xu, F.; Zhang, L. Influence of artificial intelligence applications on total factor productivity of enterprises—Evidence from textual analysis of annual reports of Chinese-listed companies. Appl. Econ. 2024, 56, 5205–5223. [Google Scholar] [CrossRef] [Scilit]
- Zhao, C.; Wang, W.; Li, X. How digital transformation affects enterprises’ total factor productivity. Financ. Trade Econ. 2021, 42, 114–129. [Google Scholar]
- Chen, W.; Srinivasan, S. Going digital: Implications for firm value and performance. Rev. Account. Stud. 2024, 29, 1619–1665. [Google Scholar] [CrossRef] [Scilit]
- Goldsmith-Pinkham, P.; Sorkin, I.; Swift, H. Bartik Instruments: What, When, Why, and How. Am. Econ. Rev. 2020, 110, 2586–2624. [Google Scholar] [CrossRef] [Scilit]
- Huang, Y.; Sun, Z.; Huang, Y. Exploring the effect of VAT carryforward and refund policy on enhancing innovation efficiency among China’s A-share listed firms. Financ. Res. Lett. 2025, 72, 106568. [Google Scholar] [CrossRef] [Scilit]
- Bao, J.; Li, F. On the impacts of R&D expense deduction policies on innovation output of high-tech enterprises. Tax. Res. 2024, 4, 32–41. [Google Scholar]
- Chen, X.; Ji, Z.; Xing, X. Functional division of urban value chain and enterprise innovation: Evidence from enterprise patents. J. World Econ. 2024, 47, 94–123. [Google Scholar]
- Hulten, C.R. Productivity change, capacity utilization, and the sources of efficiency growth. J. Econ. 1986, 33, 31–50. [Google Scholar] [CrossRef] [Scilit]
- Patin, J.-C.; Rahman, M.; Mustafa, M. Impact of total asset turnover ratios on equity returns: Dynamic panel data analyses. J. Account. Bus. Manag. 2020, 27, 19–29. [Google Scholar]
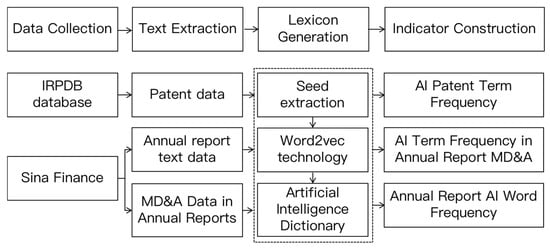

Disclaimer/Publisher’s Note: The statements, opinions and data contained in all publications are solely those of the individual author(s) and contributor(s) and not of MDPI and/or the editor(s). MDPI and/or the editor(s) disclaim responsibility for any injury to people or property resulting from any ideas, methods, instructions or products referred to in the content. |
© 2026 by the authors. Licensee MDPI, Basel, Switzerland. This article is an open access article distributed under the terms and conditions of the Creative Commons Attribution (CC BY) license.