


Abstract
Carbon emission regulations and customers’ green preferences require ports and shipping companies to develop green services, but green investments entail significant costs. Vertical alliance cooperation between ports and shipping companies through sharing costs can address this issue. Most studies use non-cooperative game to analyze the competitive relationship between ports and shipping companies. Although such research can capture price competition, they struggle to address the distribution of cooperative benefits within an alliance. They also fail to simultaneously reflect the coexistence of competition and cooperation. So, we constructed a non-cooperative–cooperative biform game to analyze green investment under vertical alliance. In the non-cooperative stage, the model captures vertical price competition between ports and shipping companies, as well as horizontal competition among supply chains. In the cooperative stage, the Shapley value is used to allocate the coalition profits from green investment cooperation. The results indicate that alliance cooperation can promote the green development of shipping. Moderate green competition can promote the green development of shipping. Route substitution competition will increase service prices and green investment level and reduce the cost-sharing ratio for shipping companies. Port congestion prompts ports to increase green investment level. These findings offer references for the green collaborative development of ports and shipping companies across different countries, thereby enriching the research framework for global sustainable development in shipping.
1. Introduction
Shipping is an important part of international trade, accounting for approximately 90% of global cargo transport [1]. However, as international trade grows slowly, shipping is facing fierce competition and severe challenges. According to the United Nations Conference on Trade and Development (UNCTAD) Review of Maritime Transport 2025, the growth rate of global maritime trade volume is projected to slow significantly from 2.2% in 2024 to 0.5% in 2025, representing the slowest growth in recent years. Against this background, ports are an important component of the maritime supply chain and serve as key logistics nodes connecting land and sea transport. Their competitive landscape is undergoing profound changes. Competition among ports is gradually evolving into competition among supply chains centered around ports [2]. Most of the functional services provided by ports are related to loading, unloading, warehousing, and transshipment, and there is relatively little differentiation among these services [3]. For the purpose of optimal berthing, shipping companies tend to allocate more vessels to the specific dedicated terminal [4]. Although ports can use preferential policies to attract shipping companies to cross-berthing, this also intensifies route competition among different shipping companies. Ultimately, competing shipping companies may be unwilling to berth at the same port, which affects the performance of the port [5,6,7,8]. Therefore, ports have begun to establish vertical cooperation with shipping companies. These strategies include vertical integration and port-shipping alliances [9].
However, vertical integration cannot ensure the stability of cooperation between ports and shipping companies [10]. This model solely facilitates the shipping companies’ transport operations. Since shipping companies do not invest in or hold equity stakes in ports, cooperation is easy to break. Therefore, port and shipping company alliances through joint investments or cross-shareholdings have become more widespread. The vertical alliance between ports and shipping companies enhances the port’s service differentiation and helps the ports cope with increasingly intense market competition. Furthermore, it enhances added functions such as warehousing, distribution, packaging, and other services. Meanwhile, it also reduces the transaction costs of port selection and horizontal competition. Shipping companies are willing to form vertical alliances with ports. Their main purpose is to obtain priority berthing rights and higher handling efficiency. At the same time, they hope to use the port to expand into new business markets. In 2015, Maersk formed a venture with Qingdao Port Group to jointly invest in the construction of a terminal in the Dongjiakou area of Qingdao Port, aiming to enter China’s rapidly growing food import market. Currently, Maersk holds interests in more than ten port terminals in China. This accounts for approximately one-seventh of its global port terminal portfolio.
Meanwhile, ports and shipping companies are facing increasingly urgent environmental pressures. The International Maritime Organization (IMO) has set a target of reducing emissions by 50% by 2050. Shipping has been incorporated into the regulatory framework by the European Union Emissions Trading System (EU ETS). All passenger and cargo vessels exceeding 5000 tons that enter EU ports are required to monitor and report their emissions. They must also pay the corresponding carbon emission fee for each ton of CO2 equivalent. Compared to other transportation, shipping has higher energy efficiency. But people have realized that shipping has a significant impact on the environment [11].
Ports play a major role in carbon emissions. When berthed at the port, ships are usually powered by diesel auxiliary engines. It releases a substantial amount of pollutants, including CO, NOx, and SOx, into the atmosphere. These emissions account for between 55.0% and 77.0% of the port’s total emissions [12]. Furthermore, extreme weather and security situations have contributed to the accumulation of containers at the ports, resulting in congestion. The frequent occurrence of port congestion has greatly affected the fleet scheduling of shipping companies, causing ships to gather and berth at the port. During the congestion period, a large amount of carbon emissions will be produced, which further exacerbates the environmental burden. Based on this, shippers’ low-carbon preference has become a key factor in shipping corporate decision-making. According to the survey on consumer demand for carbon-neutral delivery published by FreightAmigo in 2025, 78% of consumers prefer carbon-neutral delivery. And 65% of consumers are willing to pay a premium of 10% to 20% for environmentally friendly transport. Meanwhile, multinational shippers such as Amazon, IKEA, and Lenovo generally put forward requirements for low-carbon logistics and zero-carbon supply chains. They prioritize shipping companies and routes with low carbon emissions.
Facing policy pressure and shippers’ low-carbon preference, green investment has become a major pathway to reduce carbon emissions. However, high costs, long payback periods, and high investment risks make it difficult for enterprises to pursue such investments independently. Vertical alliances provide an effective solution to this dilemma through a cost-sharing mechanism. Shipping companies share the green investment costs of ports, which can help ports build differentiated green advantages. In return, ports provide shipping companies with green infrastructure and clean energy supply. In reality, there are also many examples of port and shipping green investment cooperation. For instance, in March 2025, the Maersk Group invested USD 500 million in the Elizabeth Terminal at the Port of New York and New Jersey. This investment aims to enhance port services through initiatives including the upgrade of automated equipment and the transition to green energy. In May 2025, the Zhejiang Port Group of China entered into a cooperation agreement with the French HAROPA Port Alliance. The agreement focuses on the development of green and low-carbon ports, with both parties committing to sharing and promoting relevant experiences, strengthening the application of new energy, and reducing carbon emissions. Vertical alliances not only mitigate the investment pressure and risk but also foster green synergy. Furthermore, it enhances the efficiency of green investment, achieves a win–win for ports and shipping companies, and promotes the green development of shipping.
Although practical progress has been rapid, existing research has not yet systematically explored the issue of green investment decision-making in vertical alliances between ports and shipping companies. Based on this, we propose the following research questions of this paper: (1) Can vertical alliances between ports and shipping companies improve port green levels? (2) How do the members in vertical alliances determine the optimal green investment level and cost-sharing ratio? (3) How do ports and shipping companies set their optimal service price? (4) How do factors such as route substitution competition, green competition, and port congestion affect the equilibrium strategies of both parties?
To answer these questions, this paper introduces a non-cooperative–cooperative biform game. It analyzes green investment issues under vertical alliances in two competing port-shipping supply chains. In the non-cooperative stage, the port acts as the leader and sets the service price. The shipping company acts as the follower and sets the freight rate. This process captures both horizontal and vertical price competition. In the cooperative stage, the port and shipping company within each supply chain jointly determine the port’s green investment level and the cost-sharing ratio. They form a vertical alliance. The Shapley value is then used to allocate the profits. This biform game not only retains the realistic depiction of market competition from non-cooperative games but also introduces profit distribution from cooperative games to maintain alliance stability.
The main contributions of our study are as follows: (1) Unlike previous studies that only considered horizontal competition either among ports or among shipping companies, this paper establishes a non-cooperative–cooperative biform game model. It simultaneously captures both price competition and green investment cooperation in the port-shipping supply chain, making the research more aligned with practical conditions. (2) This study reveals the mechanisms through which green competition intensity, route substitution effect, and port congestion coefficient affect port service prices, shipping company freight rates, green investment levels, and cost-sharing ratios. These findings provide a theoretical basis for green investment decisions of port and shipping enterprises. (3) This paper yields novel and practically relevant conclusions: vertical alliance cooperation can achieve a Pareto improvement in the green level of the supply chain; moderate green competition benefits the green development of shipping, while excessive competition reduces port service prices and green investment levels; a stronger route substitution effect raises service prices and green investment levels but lowers the shipping company’s cost-sharing ratio; increased port congestion encourages the port to raise its green investment level.
This study on port green investment can effectively promote the sustainable development of shipping. From an environmental perspective, the cost-sharing mechanism leads to a higher level of green investment. This directly reduces carbon emissions from port operations and vessels at berth. From an economic perspective, vertical alliances enhance the profitability of ports and shipping companies through service differentiation and market expansion. At the same time, they avoid destructive price competition. From a social perspective, the port’s green level improvement reduces negative externalities such as air pollution and noise impacts on adjacent port communities. Therefore, the non-cooperative–cooperative biform game not only captures the interaction between competition and cooperation, but also provides a decision-support tool for aligning maritime supply chain strategies with global sustainability goals.
The remainder of this paper is organized as follows: Section 2 reviews the relevant literature on competition and cooperation in shipping, as well as green investment in ports. Section 3 describes the research problem and presents the basic assumptions. Section 4 demonstrates the construction and solution of the non-cooperative–cooperative biform game model. Section 5 provides numerical analysis results of the optimal strategies and optimal profits for ports and shipping companies. Section 6 concludes the paper.
2. Literature Review
In this section, we review the existing literature from two perspectives: competition and cooperation between ports and shipping companies, and green investment. This review establishes a methodological foundation for the present study.
As cooperation between ports and shipping companies increases, scholars have conducted extensive research on the relationship between competition and cooperation among them. Liying Song et al. established a two-stage non-cooperative game model, using the Bertrand model to simulate horizontal competition between two ports and between two shipping companies, while employing a logit model to capture the vertical cooperative relationship between a port and a shipping company when the shipping company berths at a port [13]. Do et al. developed a two-stage non-cooperative game-theoretic model with two ports and multiple identical shipping companies to examine the impact of changes in the number of shipping companies on port charges and profits, finding that a decrease in the number of shipping companies may force ports to increase handling fees while enabling shipping companies to transport more cargo through the port at lower costs [14]. Xiaowen Zhao and Zhuo Sun constructed a two-stage game model involving a port and a shipping company, and summarized the conditions under which the shipping company invests in different ports. They found that, under the no-investment condition, the shipping company chooses to berth at the high-capacity port [15]. Junjin Wang et al. researched three typical vertical structural modes in the shipping supply chain and analyzed their differentiated effects, which are port-shipping alliance, vertical integration, and cross-berthing. They are finding that, while port-shipping alliances can achieve low freight rates and high throughput, cross-berthing can enhance port pricing power and throughput levels [10]. Regarding the study of competition and cooperation between ports and shipping companies, current scholars primarily use non-cooperative models for analysis. Although this approach can effectively reveal the strategy choices of both parties based on their respective profit maximization under certain conditions, it fails to fully capture the complex relationship of both competition and cooperation that exists between ports and shipping companies in the real world.
With the development and innovation of game theory, research on the non-cooperative–cooperative biform game model has gradually increased. This model integrates non-cooperative and cooperative games, providing a more comprehensive analytical tool for strategic decision-making and profit sharing among firms [16,17]. Initially, this type of research was mainly used between suppliers and retailers in traditional supply chains [18,19]. However, as research has continued to deepen, it has been widely applied in areas such as recycling and processing [20,21], network activities [22,23], and green transformation [24,25]. Wang et al. first introduced the non-cooperative–cooperative biform game model to the shipping field to study information investment in a shipping supply chain consisting of ports, carriers, and shippers, and found that this model, under a restricted communication structure, can effectively solve the game strategy optimization problem of information investment among the three parties [26]. With the acceleration of global economic integration and intensified competition in shipping, cooperation between ports and shipping companies has become increasingly important. Therefore, this paper applies the non-cooperative–cooperative biform game model, which can more accurately characterize and analyze the complex relationship between ports and shipping companies. It also enriches the practical application of the biform game.
Under global low-carbon targets and the emission reduction regulations of the International Maritime Organization (IMO), the ports and shipping companies are a core link in international trade and a key area for carbon emission reduction. Its low-carbon transition has therefore become an inevitable choice for industry development. Currently, many scholars have conducted research on port emission reduction and green transition. Jiaguo Liu et al. incorporated both customer low-carbon preference and knowledge sharing into the green shipping model parameters, finding that the joint effect of these two factors contributes to mutual benefits for ports and shipping companies [27]. Yan Zhou and Haiying Zhou researched whether shore power (SP) or low-sulfur fuel oil (LSFO) is more effective for carbon emission reduction in the port-shipping supply chain under different customer low-carbon preferences [28]. Haiying Zhou and Wenjing Zhang incorporated customer low-carbon preferences to construct a carbon emission reduction technology decision-making model for the port-shipping supply chain under different power structures [29]. The study finds that, when the carbon trading price, customer low-carbon preference, and environmental concern are all either low or all high, low-sulfur fuel oil is the optimal emission reduction technology choice. Conversely, shore power becomes the optimal decision for the port supply chain. Li et al. further found that both government subsidies and shippers’ low-carbon preference significantly influence green technology investment decisions of ports and shipping companies. Moreover, under certain conditions, these two factors can be substitutes for each other [30]. Lijuan Yang et al. considered the impact of dual price and service competition among shipping companies and shippers’ low-carbon preferences on the green transition of shipping companies. They found that the intensified low-carbon preferences of shippers and service competition among shipping companies, along with the implementation of government subsidies, contribute significantly to carbon emission reduction [31]. Regarding green investment in shipping, most scholars consider factors such as price competition and shippers’ low-carbon preferences.
Some scholars further incorporate factors like government carbon tax policies and subsidies into their analysis of green investment decisions in port-shipping supply chains. Jingyao Song et al. analyzed the mechanism of carbon tax policy on the shipping supply chain and found that imposing a carbon tax reduces port container throughput, which in turn leads to a decline in the profits of both the port and the shipping company [32]. Taking into account the government carbon tax, Kanto Takebayashi analyzed the vertical integration behavior of shipping companies and ports and confirmed that vertical integration can improve port service quality and reduce carbon emissions per unit of service [33]. Yuemei Xue et al. studied key issues in port operation decisions under a carbon cap-and-trade mechanism, advising that port operators need to focus on carbon allowance prices and shipping companies must consider shippers’ sensitivity to low-carbon levels [34]. Based on a dual policy mechanism of subsidies and carbon taxes, Zhuoqi Teng et al. derived the optimal carbon tax rate, optimal emission reduction subsidy rate, optimal carbon emission level, and optimal social welfare level under different scenarios, providing a reference for governments to formulate environmental policies with the goal of maximizing social welfare [35].
In the past two years, scholars have further explored other types of government policies. Chen et al. compared unit subsidy and investment subsidy and pointed out that the government’s optimal choice depends on the impact of port congestion loss and investment cost on unit cost [36]. Xie and Zhou analyzed the effects of regulation and subsidy policies, finding that subsidies promote port green investment and output growth, while regulation restricts output, yet both policies outperform non-intervention [37]. Rodrigues et al.’s approach emphasizes that green technologies, such as low-carbon fuels, energy-saving systems, and smart ships, require cross-border coordination and clear incentives to be effectively promoted [38]. However, most existing studies focus only on decision-making within a single supply chain. They do not consider inter-chain competition between two competing supply chains. To address this issue, this paper constructs a non-cooperative–cooperative biform game model that includes two competing port-shipping supply chains. The model incorporates both inter-chain green competition and price competition into the analytical framework. It aims to reveal how these competitive factors affect the green investment levels and cost-sharing decisions of both parties.
3. Basic Assumptions
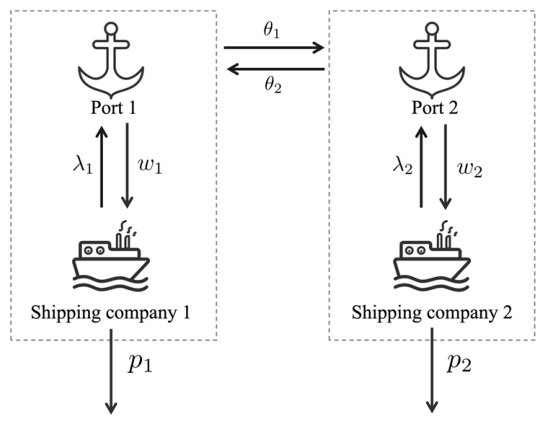
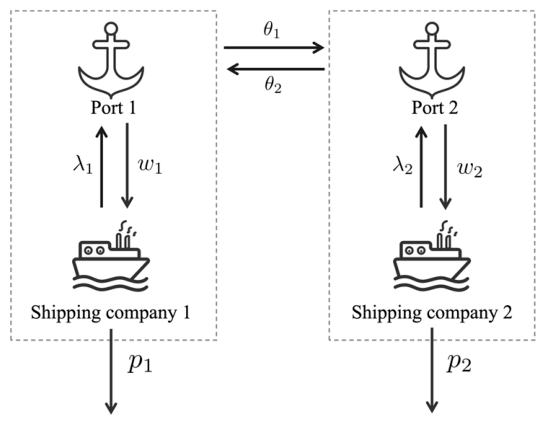
Consider a region with two ports and two shipping companies, thereby forming two supply chains with substitutable shipping routes. As the leaders of supply chains, ports charge service prices to shipping companies, and shipping companies determine freight rates. To reduce carbon emissions, ports and shipping companies cooperate to invest in green port construction. By optimizing the port’s green investment level and the cost-sharing ratio of shipping companies, they establish vertical cooperation within their respective supply chains, thereby enhancing supply chains’ green services level. The port service fees and freight rates interact with investment levels and cost-sharing ratios, reflecting the process of competition and cooperation. This paper constructs a biform game integrating both non-cooperative and cooperative games to describe and analyze this competitive and cooperative interaction, as shown in Figure 1.
Figure 1.
Group logic diagram of the game.
In Figure 1, the model assumes that Port 1 (P1) charges its downstream shipping company a service fee and incurs a unit operating cost for handling cargo. The downstream shipping company 1 (S1) provides freight services to shippers and sets the corresponding shipping price. Similarly, Port 2 (P2) charges its downstream shipping company a service fee and bears a unit handling cost. The downstream shipping company 2 (S2) provides freight services and determines the shipping price. Further model parameters are summarized in Table 1.
Table 1.
Model parameters.
Hypothesis 1.
When port handling capacity is insufficient or external uncertainties cause congestion, the waiting time of ships at anchorage increases significantly. The dwell time of cargo and containers at the port far exceeds expectations. This directly leads to issues such as extended storage and transportation delays. Consequently, shippers suffer delay losses and additional costs. Meanwhile, carbon emissions also increase. Considering environmental protection and service timeliness, shippers will turn to other ports or shipping companies for cargo transport. This eventually reduces the market demand for that shipping supply chain. Following Meng et al. [39] and Zhu et al. [9], port congestion level is expressed by the maximum waiting time of ships . The impact of congestion on demand is expressed by the congestion coefficient .
Hypothesis 2.
Port green technology investments include the construction of shore power systems, the automation of equipment, the substitution of liquefied natural gas (LNG), the application of hydrogen energy and renewable energy, and the implementation of intelligent dispatching systems. These investments can reduce carbon emissions and enhance the port’s green service capability. Due to shippers’ low-carbon preference, the improvement in the port’s green level can increase the supply chain demand. Fallowing Liu et al. [40], Qian et al. [41], and Zhou et al. [29], the supply chain demand is linearly correlated with the green level. The maximum level of green investment in the port is expressed by . The port’s green investment level is expressed by . The shippers’ low-carbon preference is expressed by . To simplify the model calculation, it is set to .
Hypothesis 3.
Supply chains compete on green services. This competition positively affects a supply chain’s demand based on its own green level and negatively affects it based on the green levels of its competitors. The combined effect determines market demand for each supply chain. Green competition intensity
is defined as the green level of rival supply chains affecting the demand of this supply chain. A higher intensity indicates more intense green competition and amplifies this negative effect. Considering congestion effects and green investment, the demand function for the shipping supply chain can be described as follows.
The demand function can be expressed as
Hypothesis 4.
Ports’ investment in green technology has to pay investment costs. In reality, the port’s green investment cost increases marginally as the green level rises. In the early stage of port green investment, ports can adopt low-cost measures such as energy-saving lamps and intelligent dispatching. But as the green level improves, expensive technologies such as shore power and electrified equipment need to be deployed. When reaching high standards, hydrogen energy and carbon capture must be introduced, which increase marginal investment costs. Therefore, following the assumption in Liu et al. [42] that the cost of technology investment has a quadratic relationship with the green level, this paper uses to denote the unit green investment cost coefficient. The port’s green investment cost is assumed to be .
Hypothesis 5.
The shipping company shares the port’s green investment cost at a ratio
. This sharing ratio is determined through negotiation within the vertical alliance between the two parties. For example, the Hamburg port and Hapag-Lloyd signed a joint construction agreement for shore power facilities in 2020. Under the agreement, the port is responsible for grid connection. The shipping company is responsible for retrofitting vessels with shore power receiving equipment. The two parties jointly share the installation costs of shore power piles at berths. It shows that shipping companies actively participate in port green infrastructure investment. They share high costs and obtain better berthing conditions and service guarantees. Therefore, reflects the actual contractual arrangement for sharing green investment costs within the vertical alliance.
Green investment in ports incurs costs, and the investment cost is a quadratic function of the green level. Consequently, the port’s profit can be expressed as
The profit of the shipping company can be expressed as
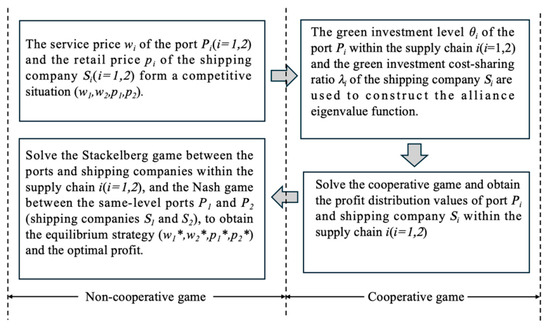
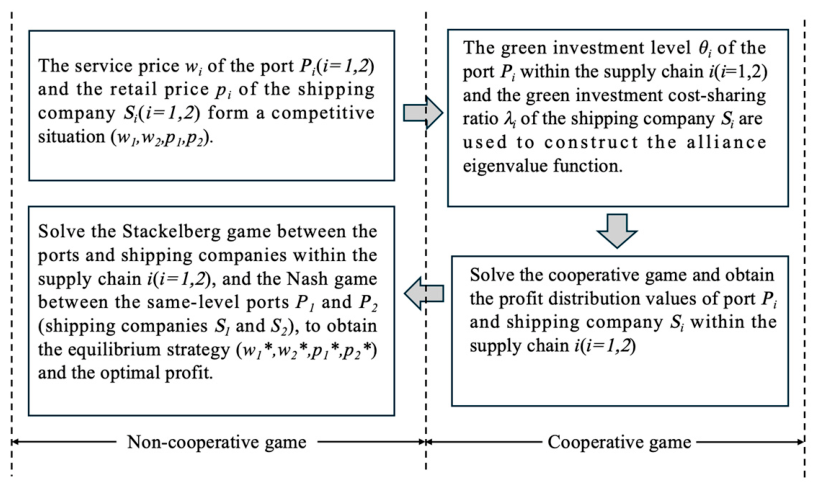
This study adopted a non-cooperative–cooperative biform game approach. In the non-cooperative game stage, the port acts as the leader and sets service fees for the downstream shipping companies. Based on these port service fees, each shipping company then determines its own freight rate in order to maximize its profit. Port service fees and shipping companies’ freight rates together constitute the pricing strategies, thereby shaping the competitive landscape in the non-cooperative game stage. The cooperative game stage primarily examines coalition formation and benefit distribution. In a competitive environment, ports choose the optimal level of green investment within the framework of the alliance characteristic function to maximize their own profits while minimizing those of their rivals. Meanwhile, the shipping company determines the optimal cost-sharing ratio within the alliance characteristic function to maximize its own profit. The setting of port service charges and freight rates, the choice of green investment level, and the determination of cost-sharing ratios all influence one another. In other words, the processes of competition and cooperation are interrelated and integrated. The sequence of the game is illustrated in Figure 2.
Figure 2.
Game sequence diagram.
In Figure 2, the first step occurs in the non-cooperative game part. The two ports, as leaders of their respective supply chains, each play a Stackelberg game with the downstream shipping company within their own chain. Simultaneously, members at the same level across the two supply chains engage in horizontal market competition, which constitutes a Nash game. The port and the shipping company each determine their own service price, resulting in a competitive scenario . Second, within the cooperative game stage under any competitive scenario , the port and the shipping company determine the green investment level and the cost-sharing ratio . Subsequently, the characteristic values of each alliance are obtained. The Shapley value has a unique solution and allocates profits fairly based on marginal contributions, which ensure the stability of vertical alliances. Therefore, this paper adopted the Shapley value to calculate the profit distribution between the port and the shipping company. Next, the obtained profit allocation value is used as the payoff function in the non-cooperative game stage to derive the optimal service price and . Finally, by incorporating the optimal service price into the cooperative game phase, we obtained the optimal investment strategies and , as well as the optimal sales profit and .
4. Game Solution
Because of fierce competition in shipping, the stability of the vertical alliance between a port and a shipping company depends on whether the cooperation profits exceed non-cooperation profits for ports and shipping companies. To describe the vertical alliance cooperation more precisely, this paper constructed a cooperative game to formulate the profit values of the alliances in the two supply chains.
4.1. Cooperative Game Solution
In Supply Chain 1, four alliance structures can be formed: the empty alliance, the port 1 acting alone, the shipping company 1 acting alone, and the cooperative alliance between the port 1 and the shipping company 1. When the set is empty, the value of the characteristic function is 0.
When Port 1 does not cooperate with Shipping Company 1, Port 1 and Shipping Company 1 compete simultaneously with Port 2 and Shipping Company 2. By applying the minimax theorem, the characteristic function of the alliance is obtained, expressed as
When Shipping Company 1 does not cooperate with Port 1, it will compete simultaneously with Port 1, Port 2, and Shipping Company 2. Therefore, by combining the minimax theorem, the characteristic function of the alliance can be expressed as
When Port 1 and Shipping Company 1 cooperate, they form a cooperative alliance. At this point, within the supply chain, the port and the shipping company optimize the port’s green investment level and the cost-sharing ratio, respectively, thereby engaging in inter-chain competition with the port and shipping company in the other supply chain. The characteristic function of the alliance is
Similarly, in Supply Chain 2, composed of Port 2 and Shipping Company 2, four alliance structures can be formed: the empty set, Port 2 acting alone, Shipping Company 2 acting alone, and the alliance between Port 2 and Shipping Company 2. When the set is empty, the value of the characteristic function is 0.
When Port 2 does not cooperate with Shipping Company 2, Port 2 and Shipping Company 2 compete simultaneously with Port 1 and Shipping Company 1. By applying the minimax theorem, the characteristic function of the alliance is obtained and expressed as
When Shipping Company 2 does not cooperate with Port 2, it will compete simultaneously with Port 1, Port 2, and Shipping Company 1. Therefore, by combining the minimax theorem, the characteristic function of the alliance can be expressed as
When Port 2 and Shipping Company 2 cooperate, they form a cooperative alliance. Within this supply chain, Port 2 and Shipping Company 2 optimize the port’s green investment level and the cost-sharing ratio, respectively, thereby competing with the supply chain formed by Port 1 and Shipping Company 1. The characteristic function of the alliance is expressed as
By comparing the profits of ports and shipping companies under non-cooperation with their respective alliance profits under cooperation, we can examine the stability conditions of the vertical alliance.
Proposition 1.
When a port invests independently, its optimal green investment level is expressed by
. When a shipping company and a port invest cooperatively, the optimal green investment level for the port is expressed by . Under any competitive scenario , the optimal level of green investment for ports satisfies that .
Proposition 1 indicates that, under any competitive scenario , when ports and shipping companies form a vertical alliance, the optimal green investment level for the port is higher than when they invest independently. Therefore, cooperation is conducive to enhancing green port construction.
Proposition 2.
The cooperative game is a convex game, and the characteristic function satisfies:
. Therefore, the Shapley value of the cooperative game lies within the core solution, satisfying individual rationality. The Shapley value can thus be used to determine the profit allocation in the cooperative game.
4.2. Profit Allocation in Cooperative Games
According to the Shapley value formula, the alliance profit derived from the cooperative game part is allocated, resulting in the allocated profits for Port 1 and Shipping Company 1 being, respectively:
Similarly, the alliance profit derived from the cooperative game part is allocated, resulting in the allocated profits for Port 2 and Shipping Company 2 being, respectively:
Comparing the profit allocation values of ports and shipping companies after cooperation with their profit characteristic values under non-cooperation respectively, we can find that:
Proposition 3.
Under any competitive scenario
, the profit allocation between ports and shipping companies satisfies that and .
Proposition 3 indicates that, after cooperation, the profit of each member within the supply chain is greater than that under non-cooperation. Therefore, each member within the supply chain has sufficient incentive to pursue a stable cooperative relationship, jointly bear port investment costs, and thereby enhance their own profitability.
4.3. Non-Cooperative Game Solution
For any given competitive scenario, the profit allocation derived from the cooperative game part constitutes the payoff functions for the two ports and two shipping companies in the non-cooperative game part.
In the non-cooperative game part, based on the profits obtained from the cooperative game part, the two ports determine the service fees they charge to the shipping companies with the objective of maximizing their respective profits. As followers, the two shipping companies determine their respective freight rates based on the service fees charged by the port within their own supply chain. Using backward induction, the response function of shipping companies’ profits for the non-cooperative game part is derived. Since the mathematical expressions for the equilibrium solution are complicated, we simplified these expressions to make it easier for readers to understand. For details, please refer to Appendix A.
Proposition 4.
The ports optimal service charges
and
can be obtained by taking the first-order partial derivatives of
and
with respect to and, respectively, and solving the resulting system of equations
. Based on the results, the optimal service charges for ports are follows:
Proposition 5.
When
, the second derivative of the profit distribution value function of port 1 with respect to service charges is less than 0; then, is the point of maximum value. When , the second derivative of the profit distribution value function of Port 2 with respect to service charges is less than 0; then, is the point of maximum value.
By substituting Equations (16) and (17) into Equations (14) and (15), the optimal transportation price for shipping companies can be obtained as follows:
By substituting and into the mathematical expressions for optimal green investment for ports , the optimal level of green investment for ports can be derived as follows:
Substituting the above equilibrium solution into the profit function and combining with , satisfying , we can obtain the optimal ratio for cost sharing among shipping companies as follows:
By constructing and solving the game model, expressions for the optimal port service price, optimal port green investment level, optimal shipping freight rate, and optimal cost-sharing ratio were derived, and the optimal profits for ports and shipping companies were simultaneously obtained. Given the complexity of the expressions derived above, it is difficult to analytically examine the equilibrium solutions with respect to parameters such as unit investment cost, green competition intensity, substitution effect coefficient, and congestion effect coefficient. Therefore, the subsequent section will conduct a simulation analysis of the equilibrium solutions using specific numerical values.
5. Numerical Analysis
This section employs MATLAB R2018a and simplified numerical calculations to conduct a comparative analysis on the degree of influence exerted by competition intensity, substitution effect coefficient, and port congestion coefficient on the strategic choices and optimal profits of shipping supply chain members. The cost of green investment for ports is enormous. According to an empirical study by Fengjue Xie [43] on shore power application at Shanghai Port, taking the high-voltage shore power retrofit of a 150,000 DWT berth as an example, the total equipment and material cost for a berth approximately USD 695,000. Including civil construction and labor costs, the total project cost reaches about USD 1,042,500. To facilitate the comparative analysis, we set the parameters as follows: , , , , , and . These are based on the reference [44,45,46] and average anchorage waiting time of vessels data from the VesselBot report.
5.1. The Impact of Competition Intensity
Based on the model analysis, it is found that competition intensity exerts a certain influence on the optimal decisions and optimal profits of the port-shipping supply chain alliance. Therefore, parameters were set for numerical simulation and graphical analysis to further verify the specific impact of competition intensity on the optimal decision and optimal profit of the port and shipping supply chain. Based on satisfying the model assumptions, the basic parameters were set as follows: , , , , , , , and . The trends of optimal decisions and optimal profits for the ports and shipping companies in the two port-shipping supply chains are illustrated in Figure 3, Figure 4, Figure 5 and Figure 6.
Figure 3.
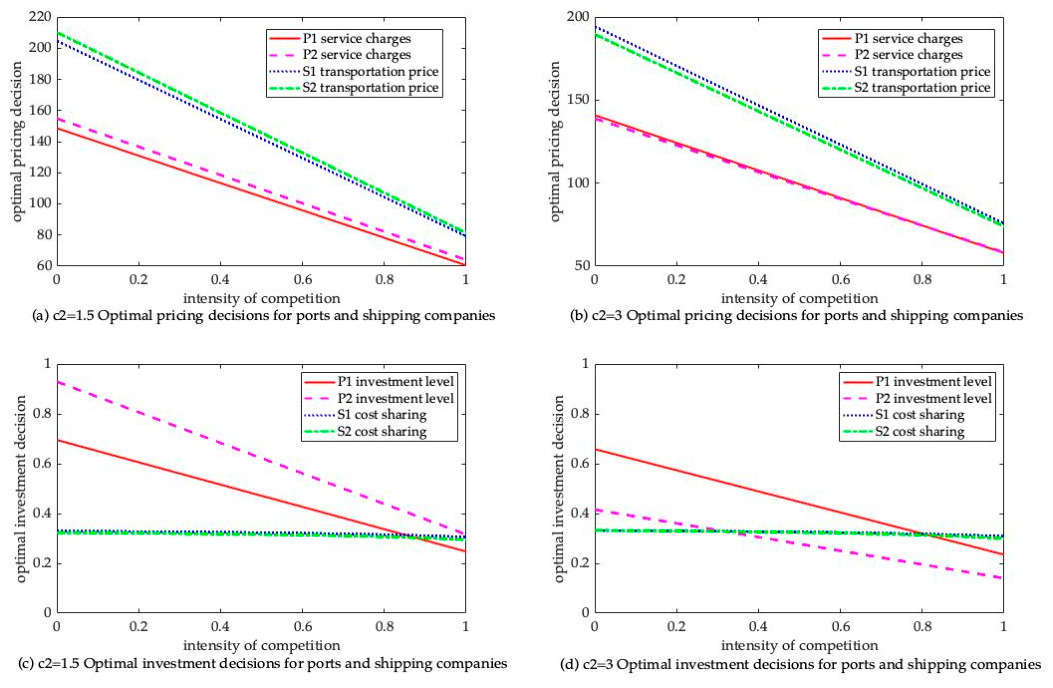
The impact of competition intensity on the optimal decision with different costs.
Figure 4.
The impact of competition intensity on the optimal decision with different congestion.
Figure 5.
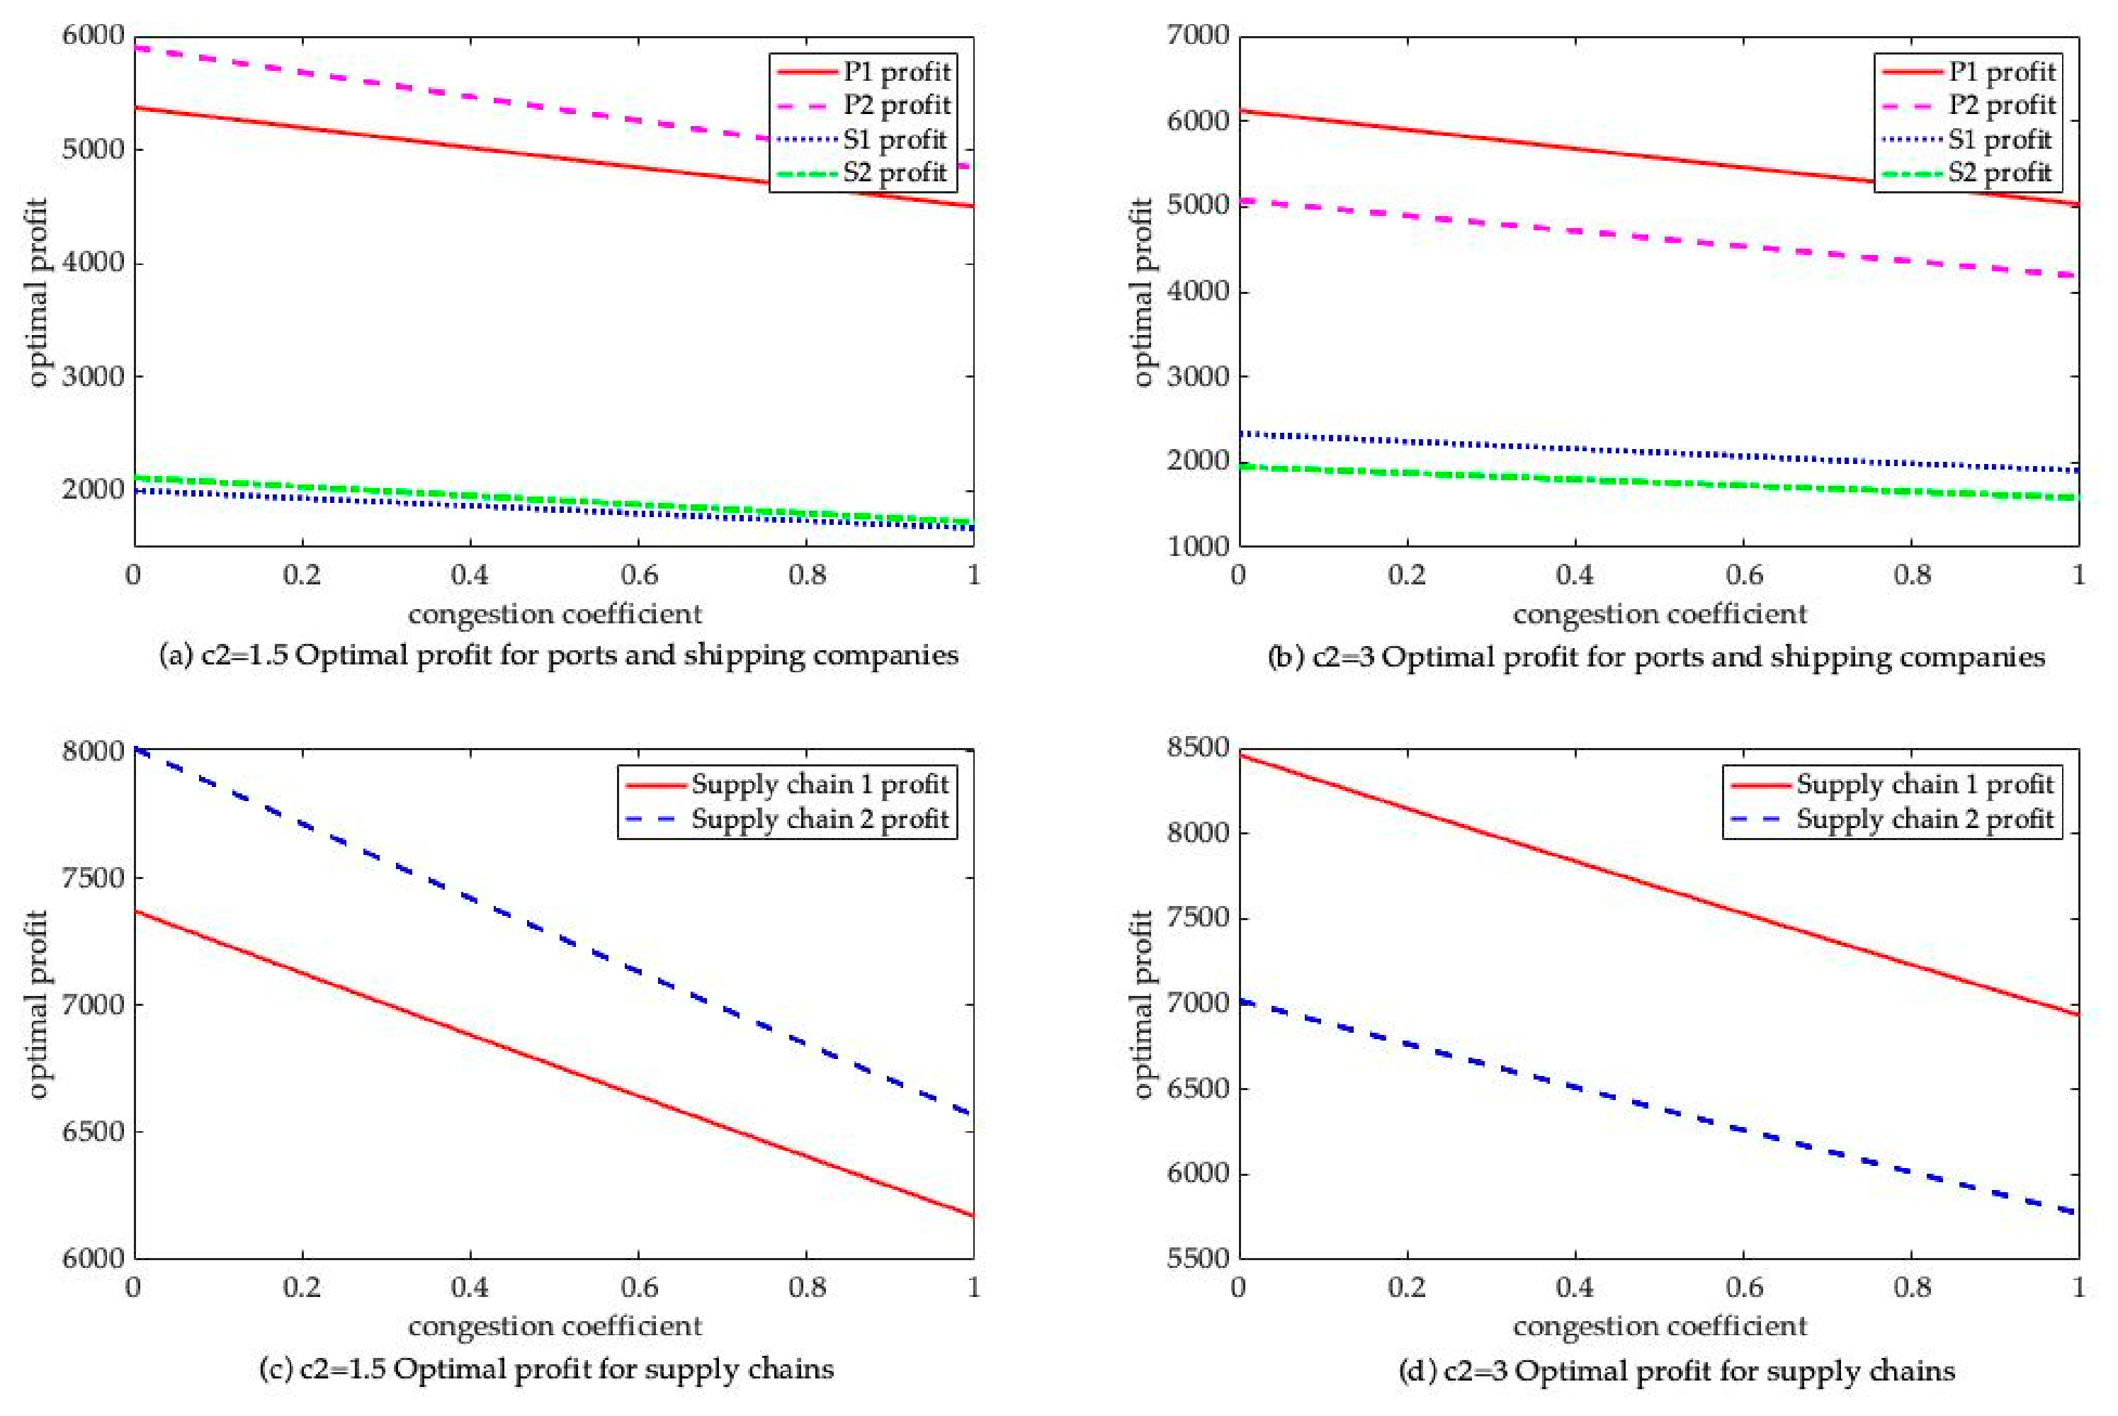
The impact of competition intensity on the optimal profit with different costs.
Figure 6.
The impact of competition intensity on the optimal profit with different congestion.
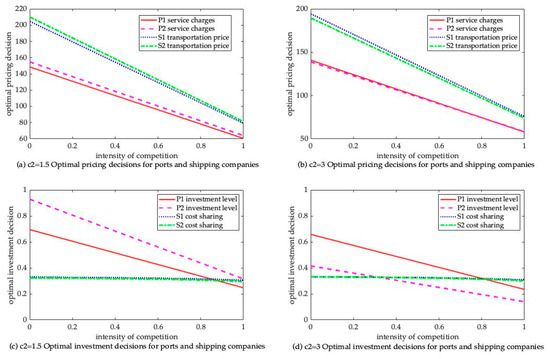
Figure 3 and Figure 4 illustrate the impact of competition intensity on the optimal decisions of port and shipping companies. From Figure 3 and Figure 4, ports’ service prices and shipping companies’ freight rates show a declining trend as competition intensity increases. The level of ports’ green investment decreases as competition intensity increases, while the cost-sharing ratio of shipping companies remains. Because, when green competition intensifies, if a shipping company maintains a high transportation price, shippers will quickly switch to a competing supply chain with a comparable green level but a lower price, leading to a loss of market share. Therefore, the shipping company will reduce its transportation price to maintain market shares. When the intensity of green competition is low, the port can charge a premium for green services. However, when green competition intensifies, the port is unable to bear the high cost of green technology investment. In that case, it will reduce its green investment level. The shipping company’s cost-sharing ratio remains unchanged. Because this ratio is typically determined based on long-term strategic contracts. Adjusting it involves complex renegotiation costs and trust mechanisms. Therefore, it does not fluctuate with short-term changes in competition intensity.
Under the supply chain competition, the supply chain with a higher unit green investment cost chooses a lower price. To avoid being eliminated in the market, the ports and shipping companies in such supply chains will reduce their prices at a faster rate. Congestion also affects pricing decisions. A supply chain with a higher congestion level has weaker competitiveness. So, these shipping supply chain members will adopt more aggressive price reduction strategies. Investment cost negatively affects the port’s green investment level. As competition intensifies, the green investment level declines at an accelerated rate. Based on this, the supply chain with a higher unit investment cost reduces its green investment level at a faster speed. Furthermore, if the port is congested, it lowers green investment at an even faster rate.
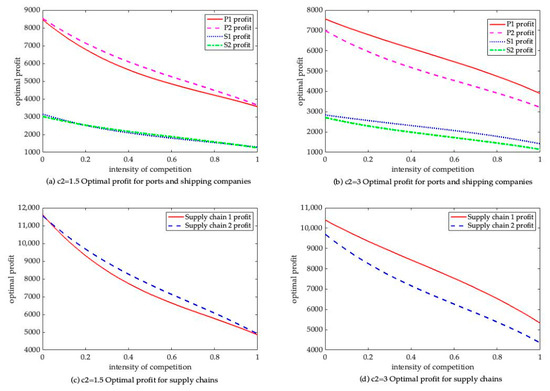
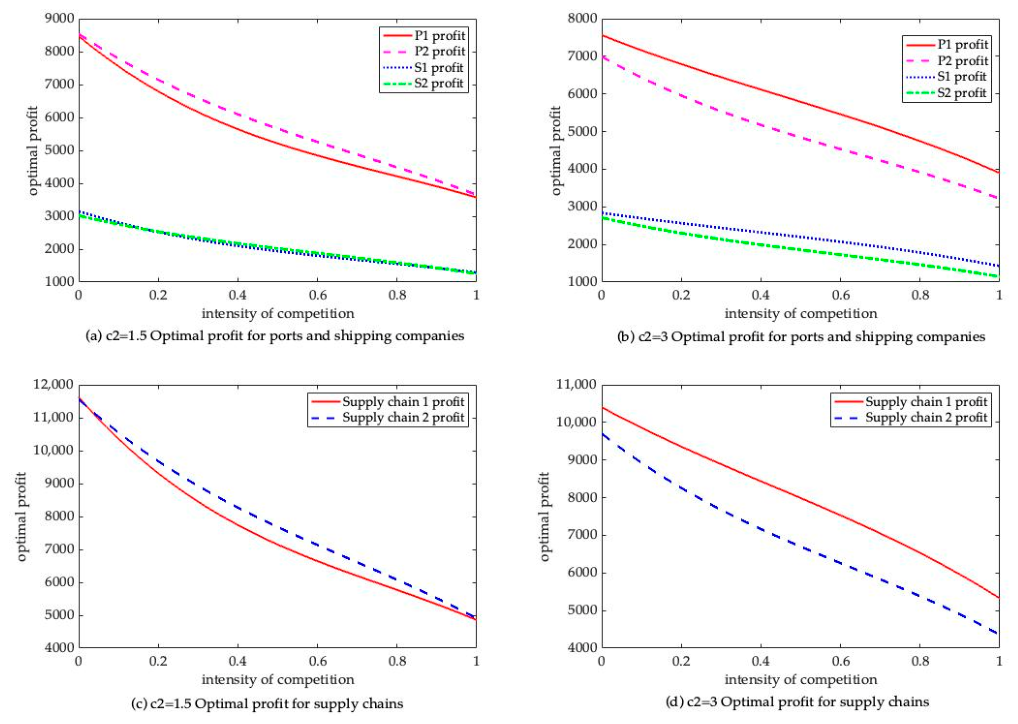
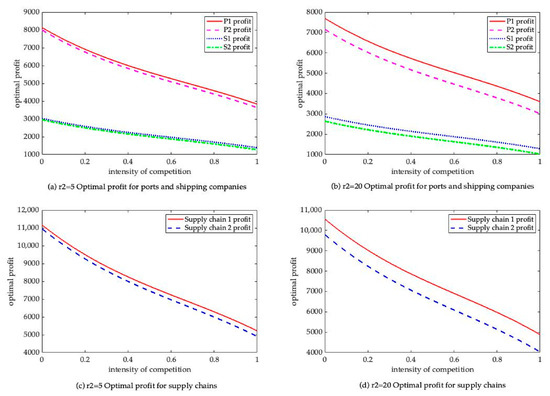
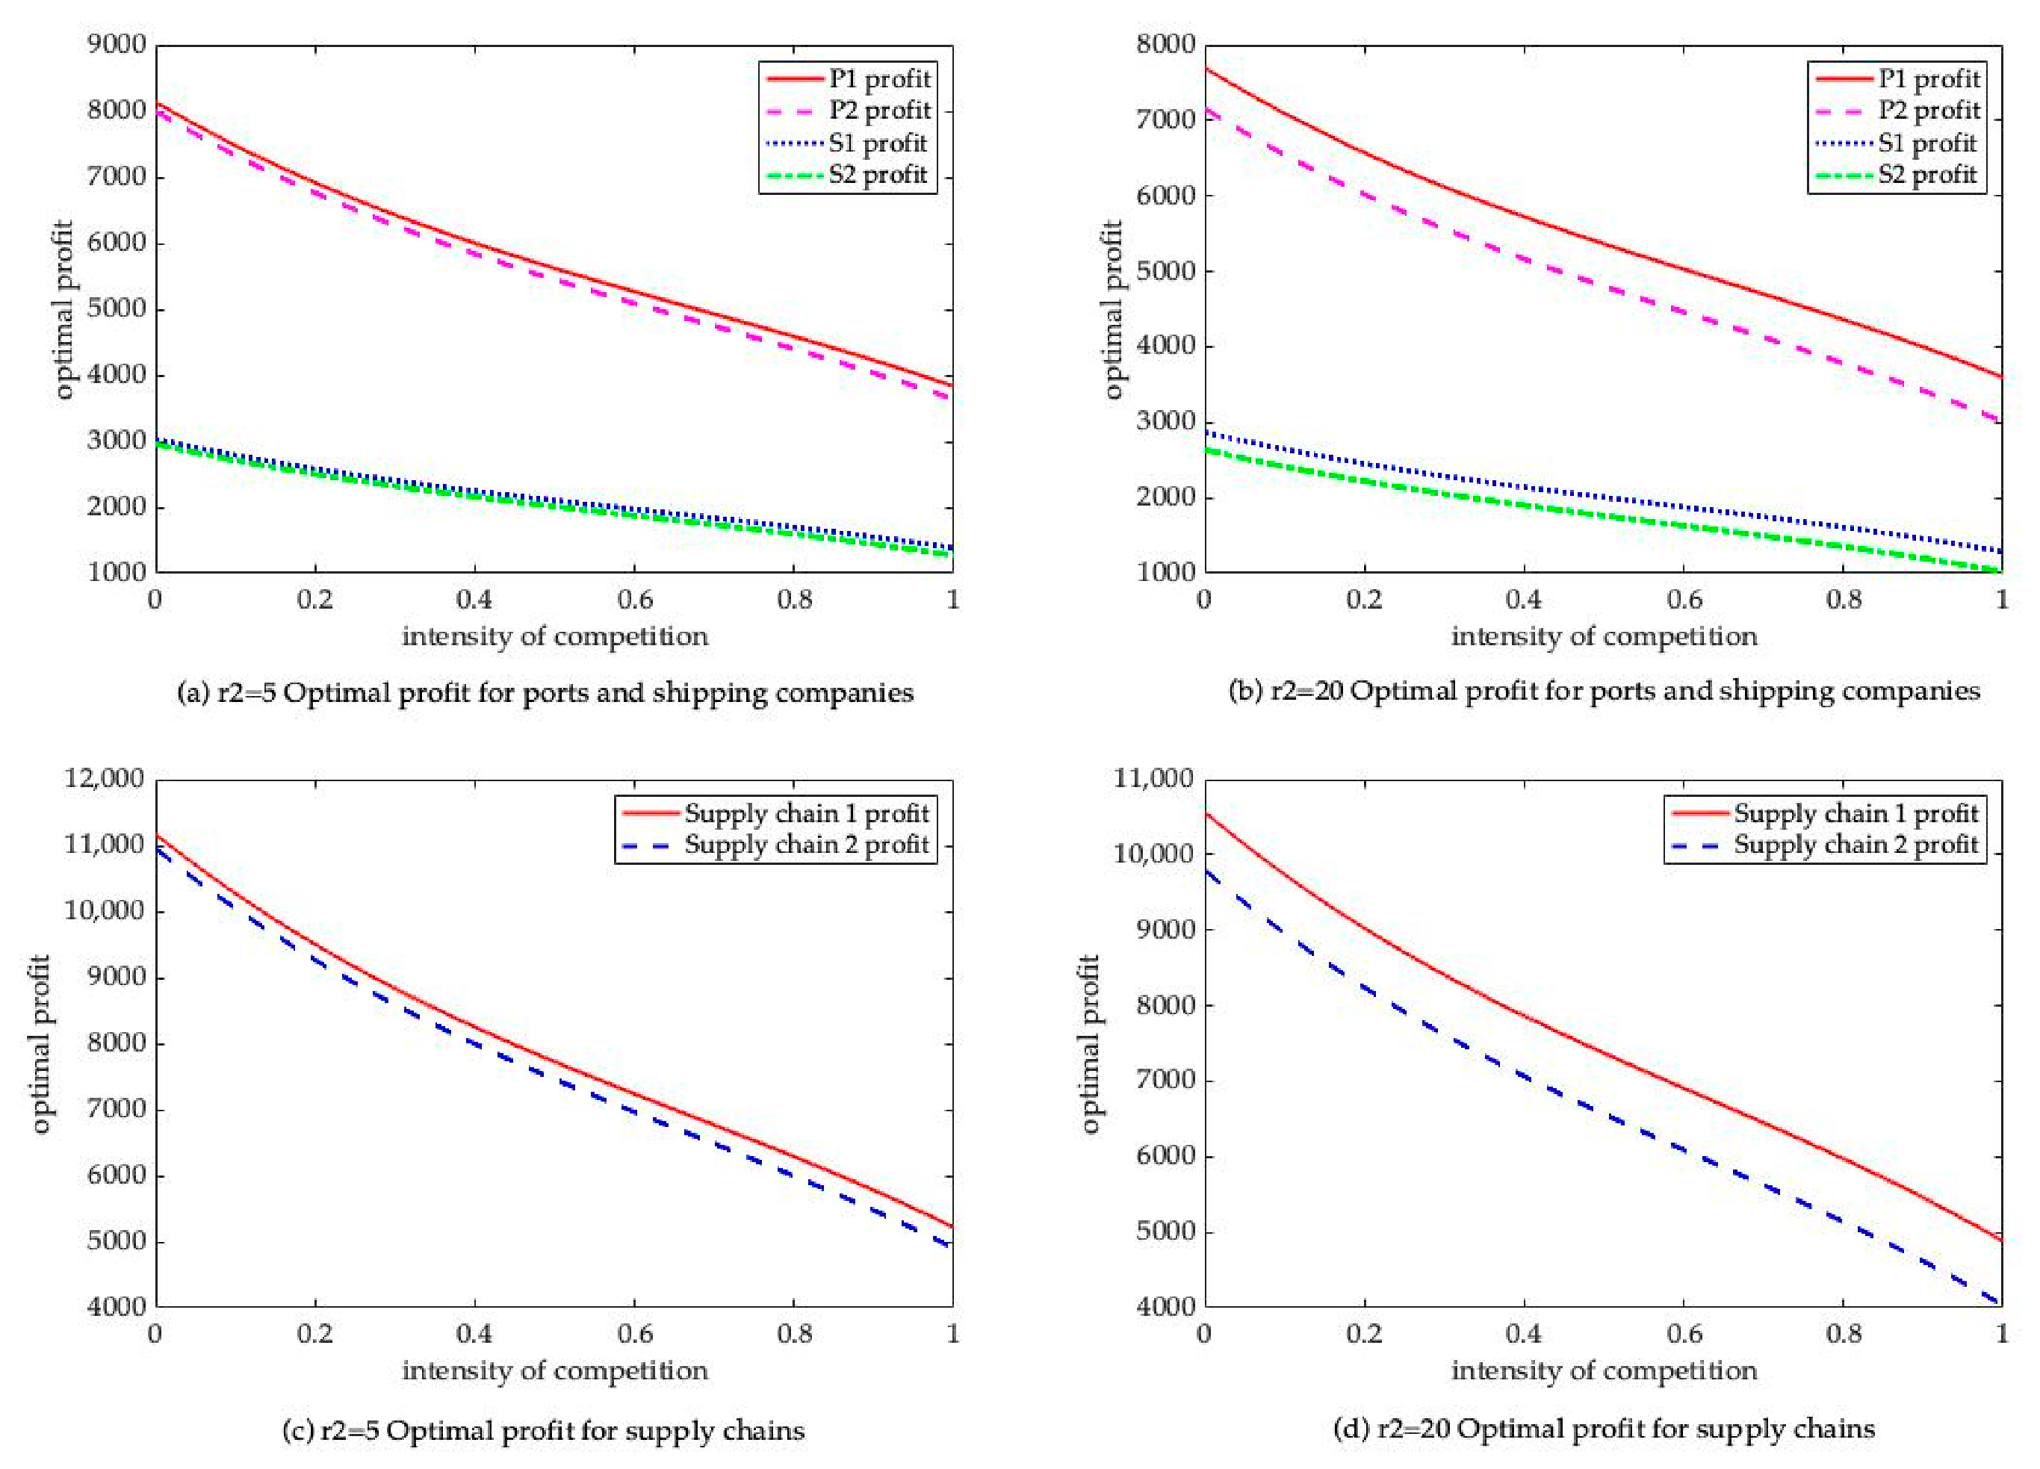
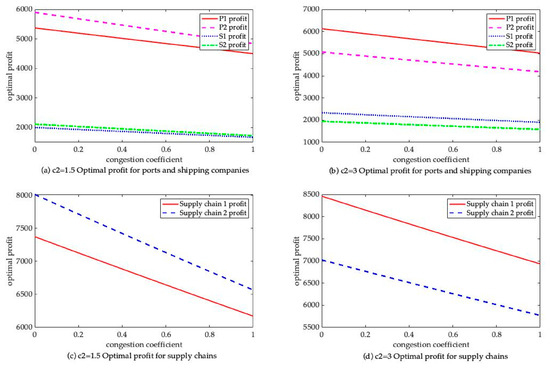
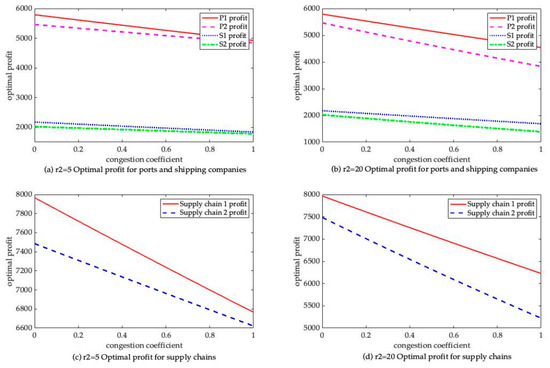
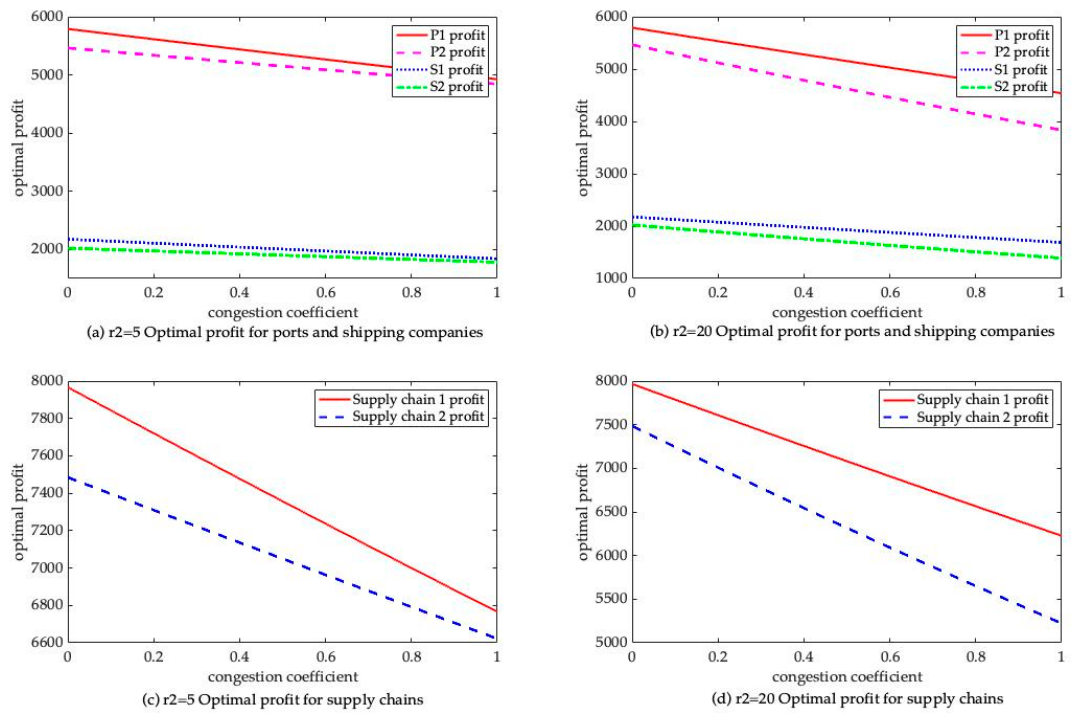
Figure 5 and Figure 6 illustrate the impact of competition intensity on the optimal profits of the port and the shipping company. As shown in these figures, as competition intensity increases, the profits of the port, the shipping company, and the overall supply chain all exhibit a declining trend. To maintain the green competitive advantage, the port needs to continuously invest in green technology. The shipping company also needs to share the costs. Therefore, moderate green competition inspire innovation. However, when competition exceeds a threshold, price wars and a decline in the return on investment jointly harm profits.
Under supply chain competition, the supply chain with a higher unit cost of green investment has a faster decline in profit. To alleviate cost pressure, ports and shipping companies in such supply chains reduce prices at a faster rate, leading to accelerated profit loss. In addition, in a supply chain with a higher congestion level to maintain market share, its members are forced to reduce prices more significantly. So, their profits decline at a faster rate. As competition intensity increases, the decline in profits is faster for supply chains with a higher unit investment cost or a more severe congestion.
5.2. The Impact of Substitution Effect
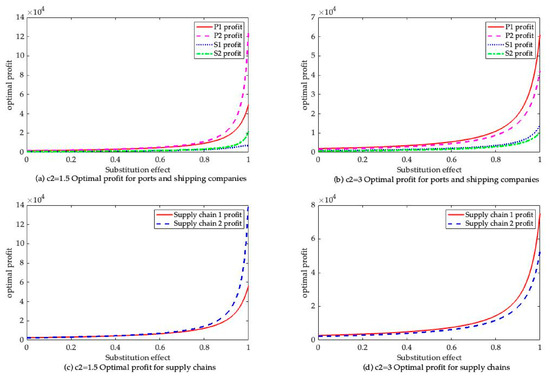
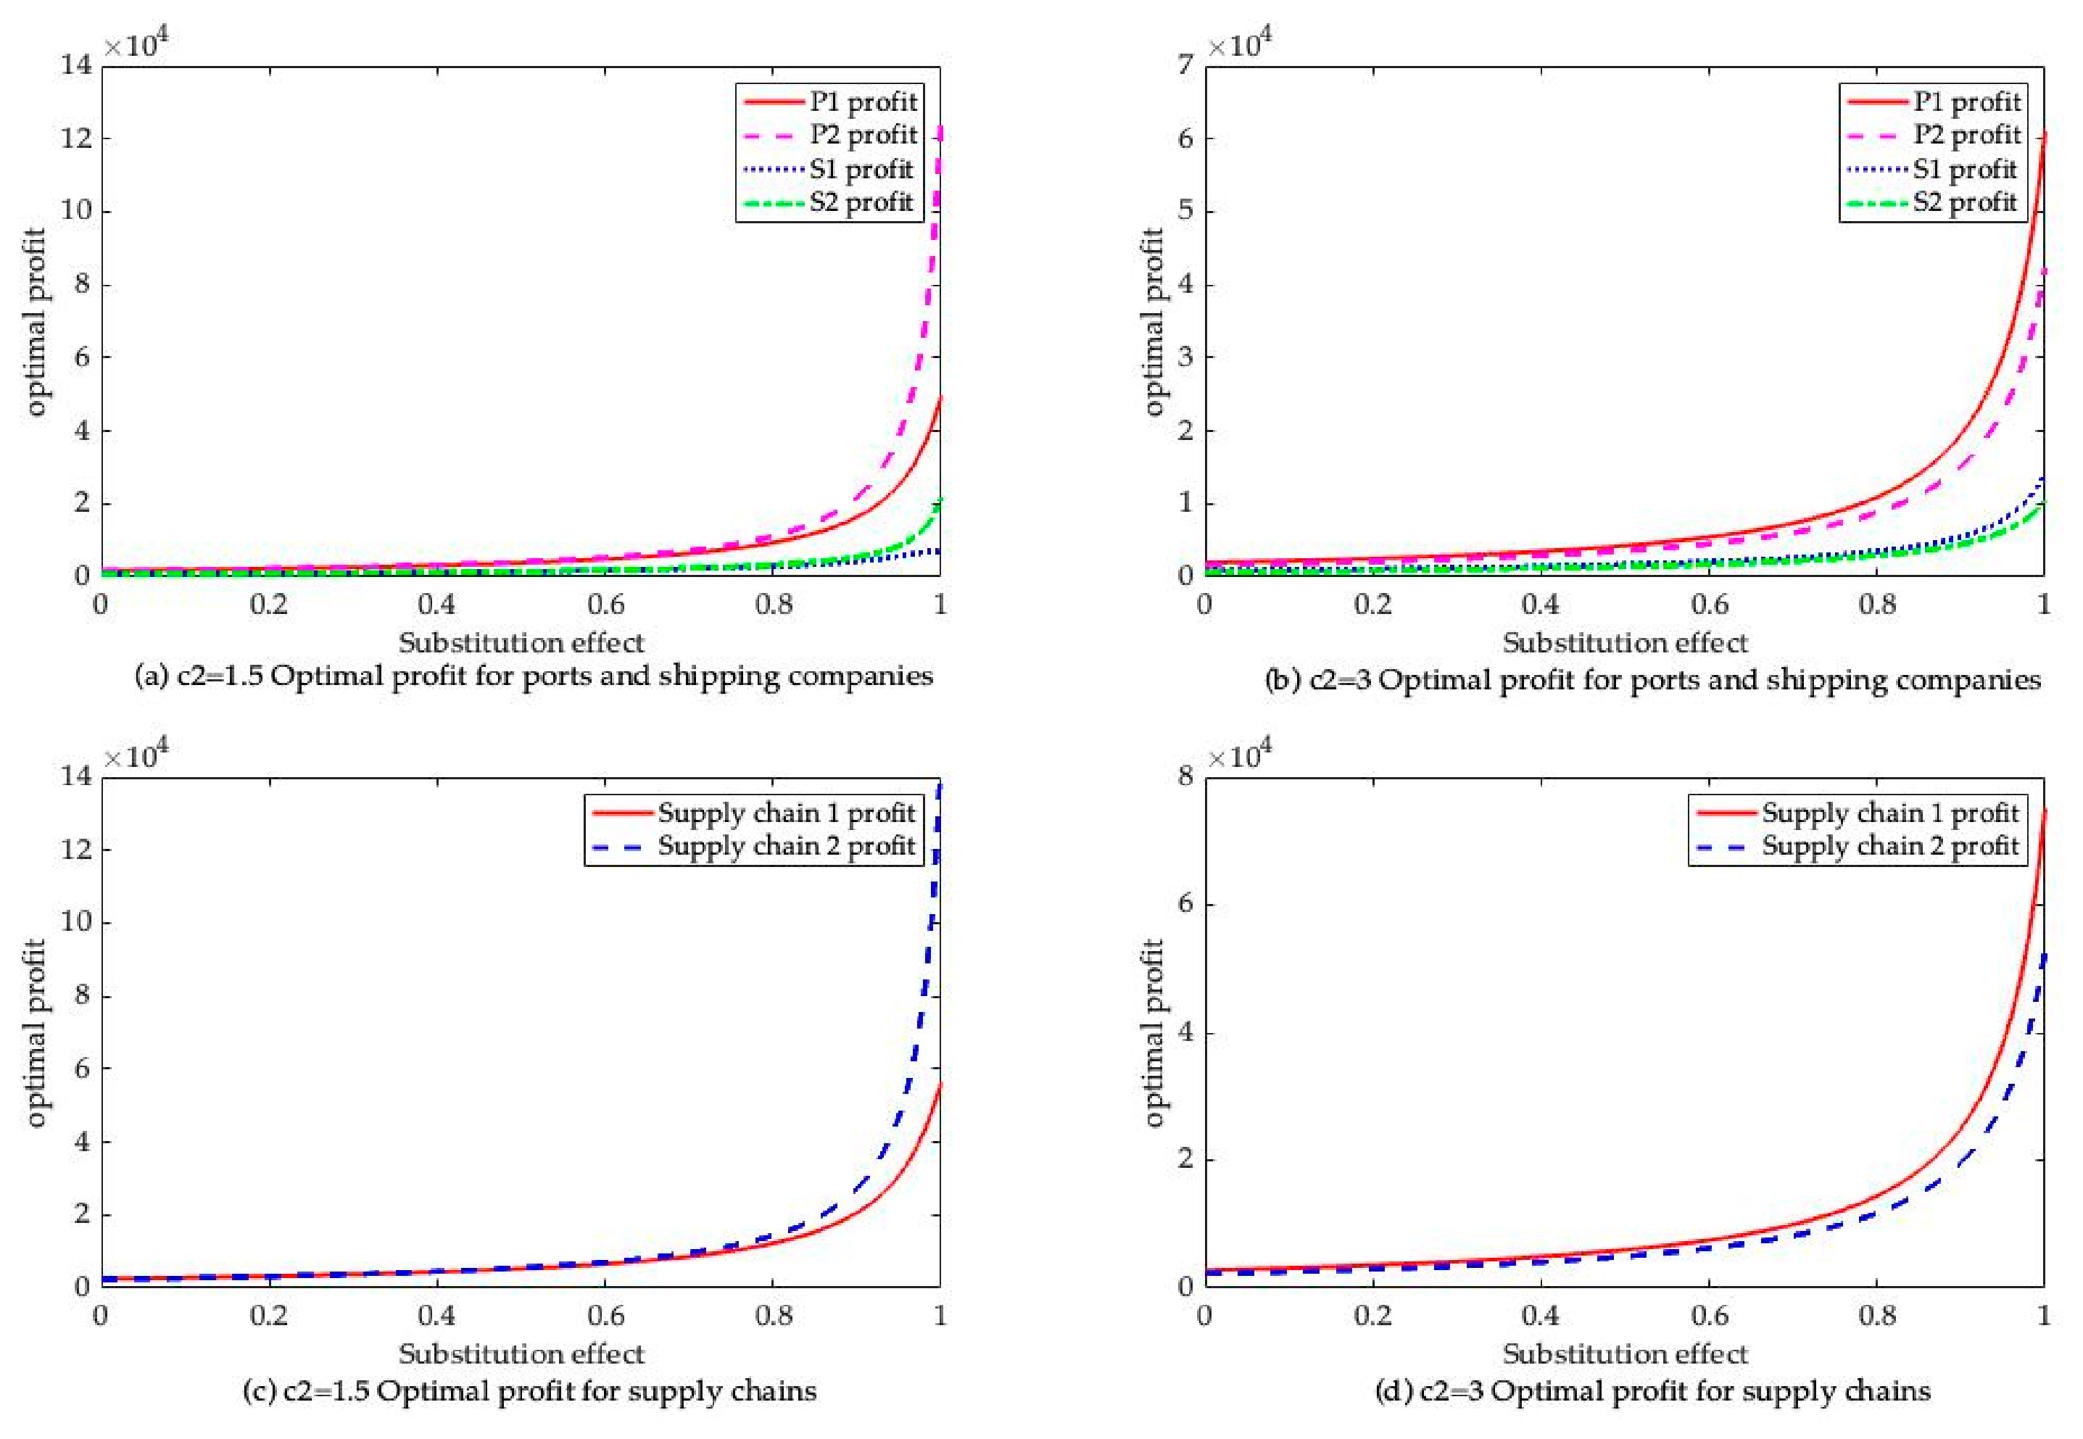
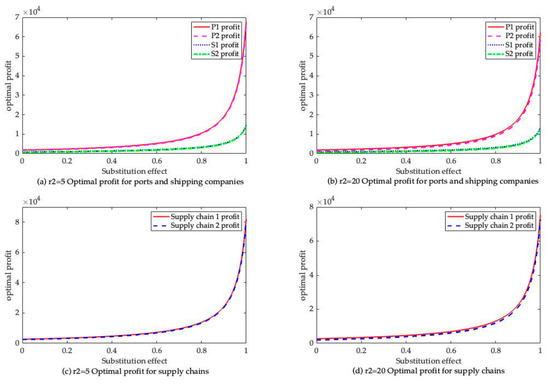
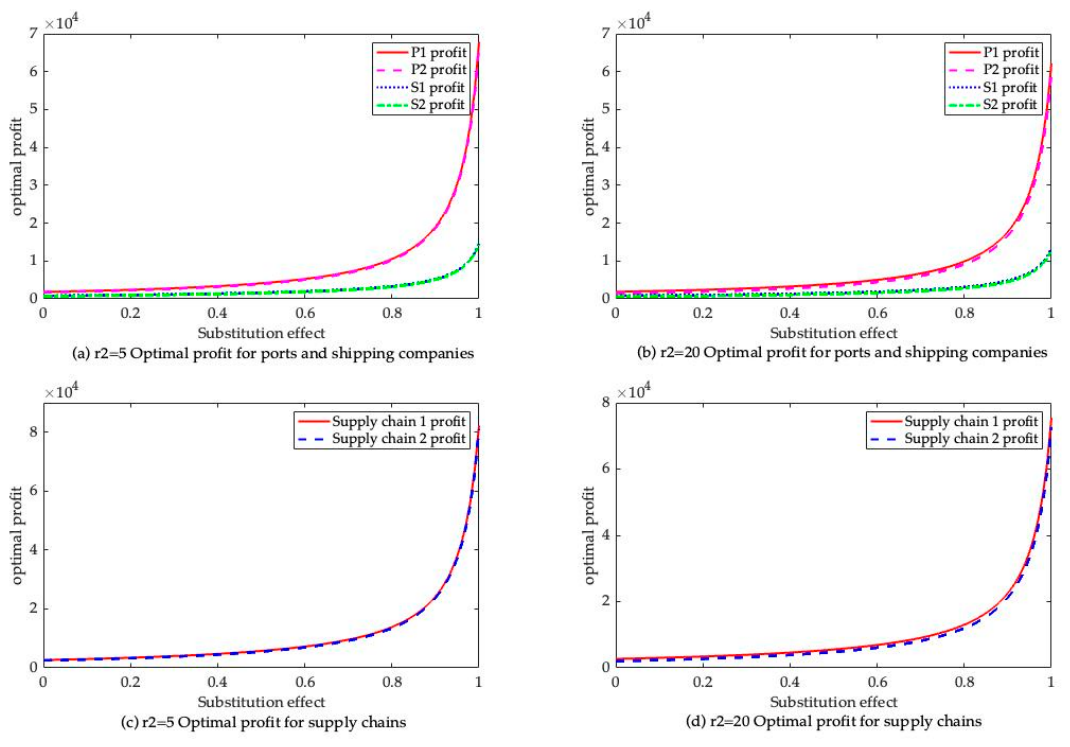
Based on the model analysis, it is found that the substitution effect exerts a certain influence on the optimal decisions and optimal profits of the port-shipping supply chain alliance. The basic parameters were set as follows: , , , , , , , and . The trends of optimal decisions and optimal profits for the ports and shipping companies in the two port-shipping supply chains are illustrated in Figure 7, Figure 8, Figure 9 and Figure 10.
Figure 7.
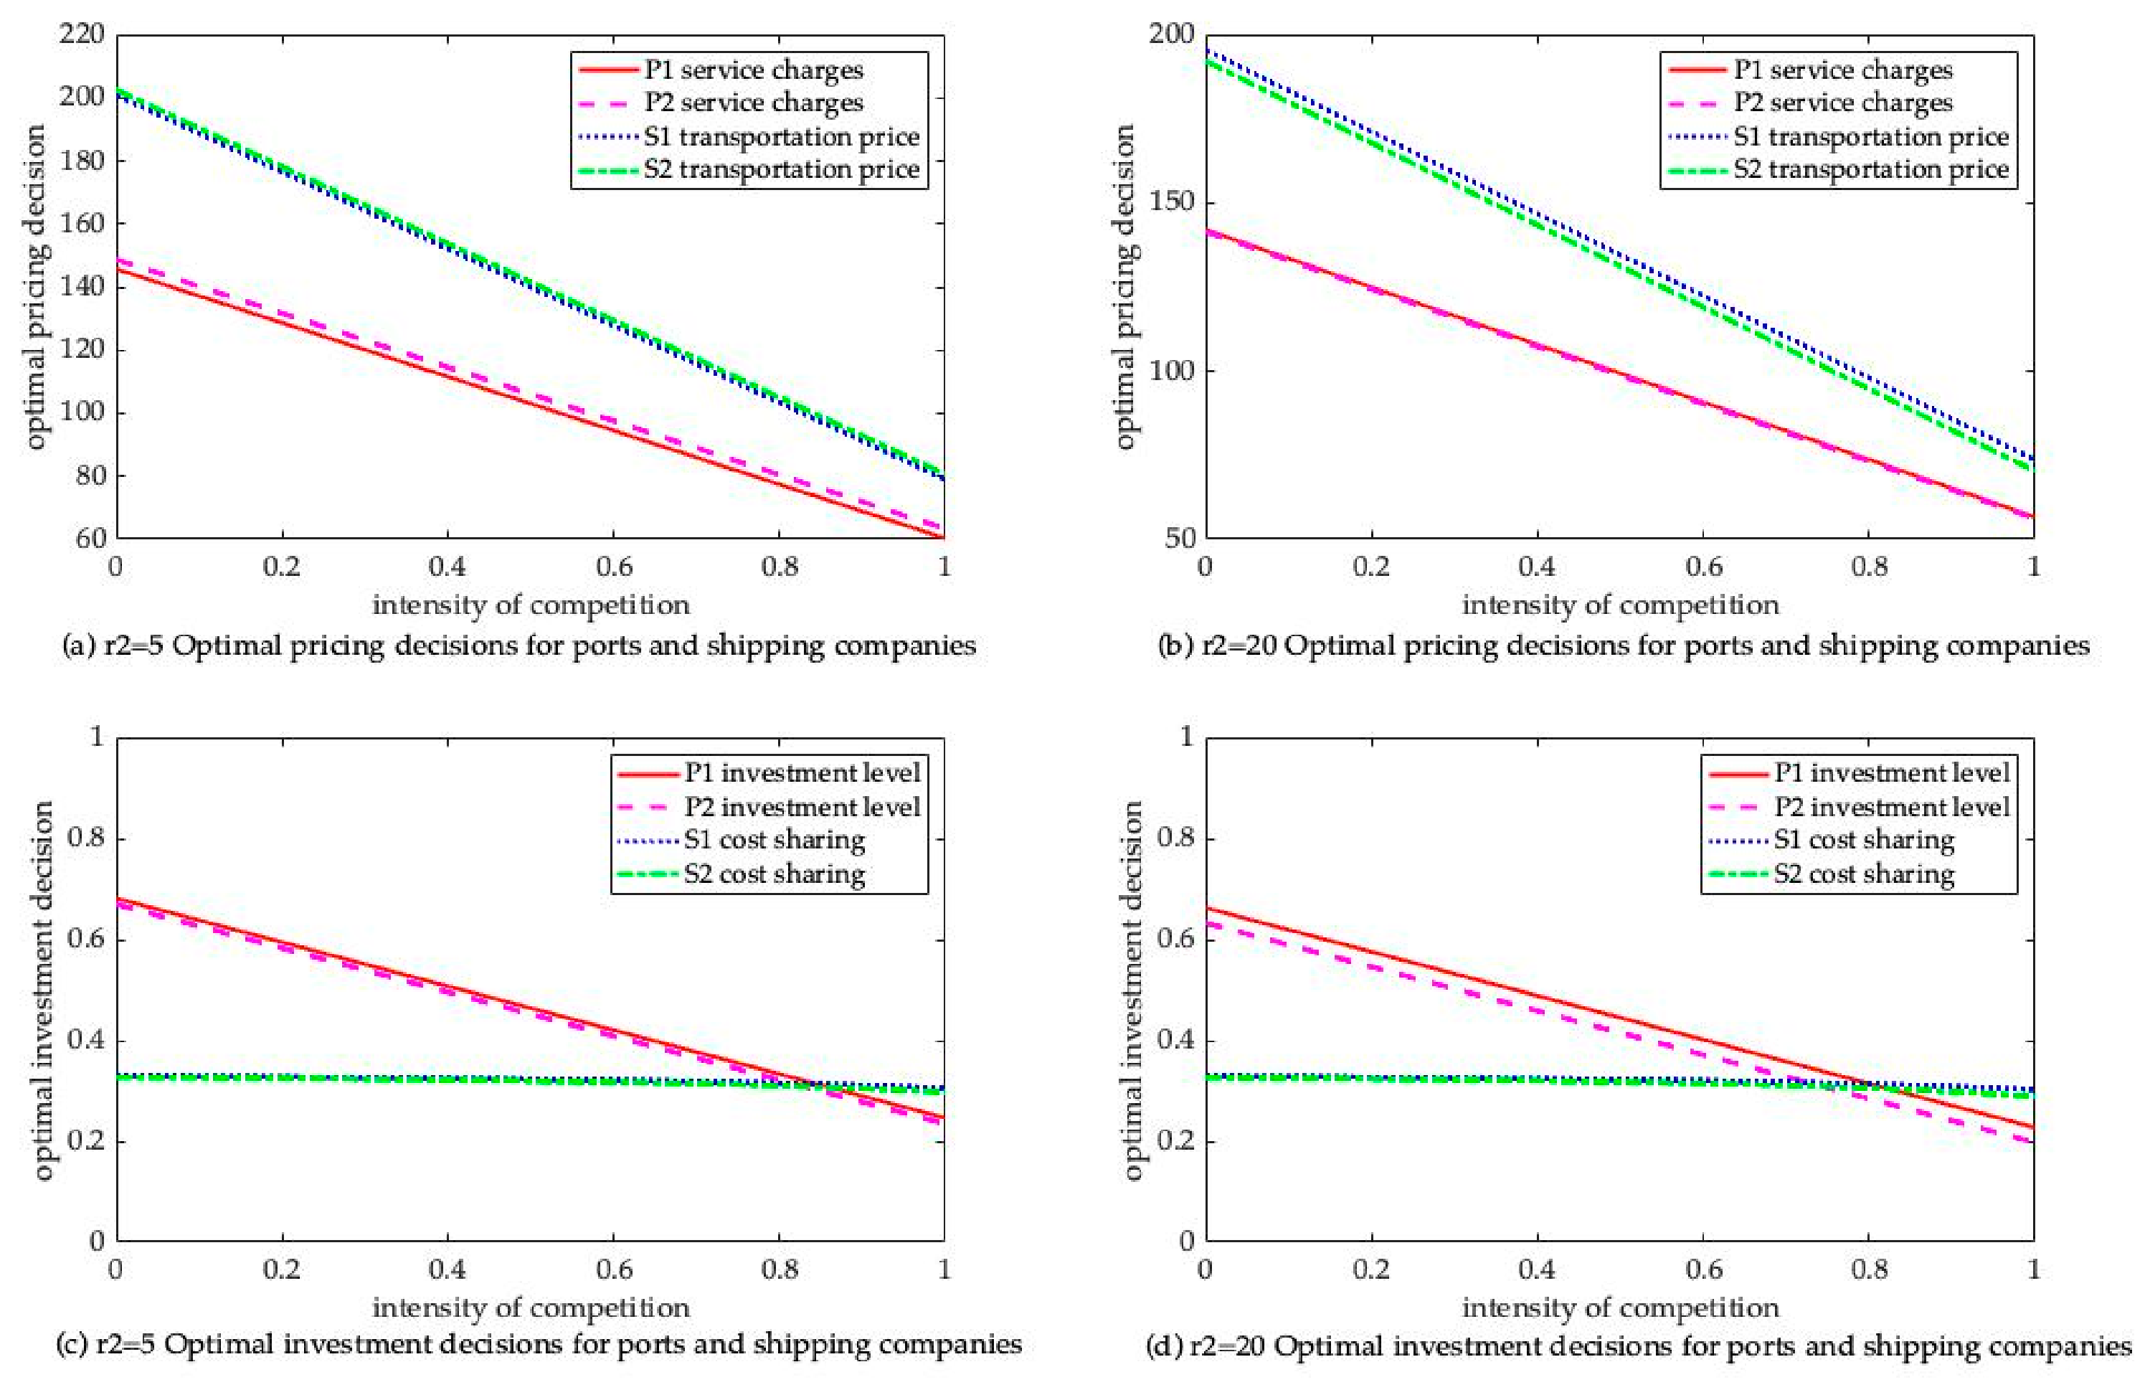
The impact of substitution effect on the optimal decision under different costs.
Figure 8.
The impact of substitution effect on the optimal decision with different congestion.
Figure 9.
The impact of substitution effect on the optimal profit with different costs.
Figure 10.
The impact of substitution effect on the optimal profit with different congestion.
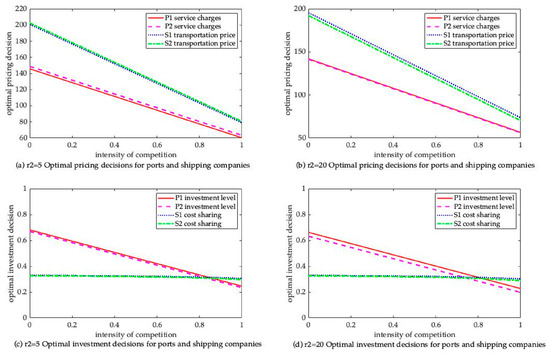
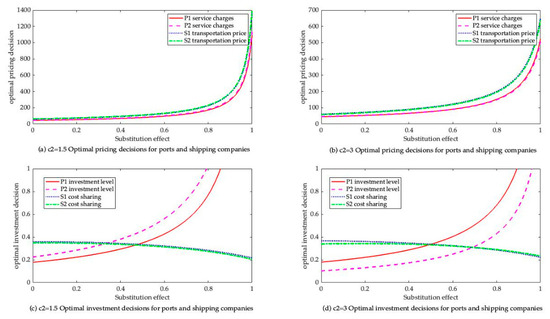
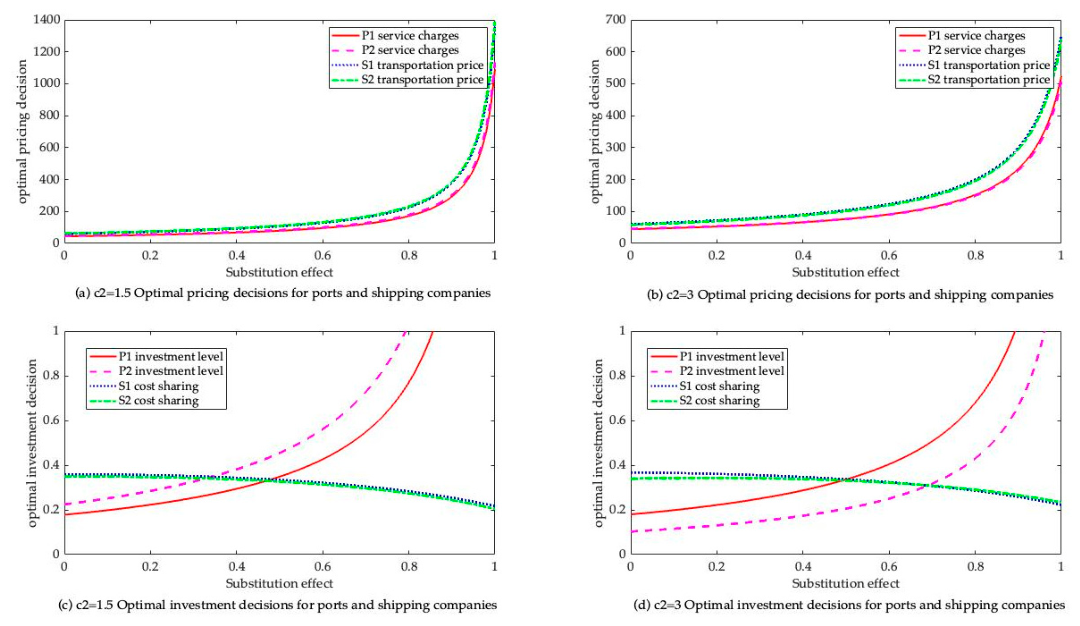
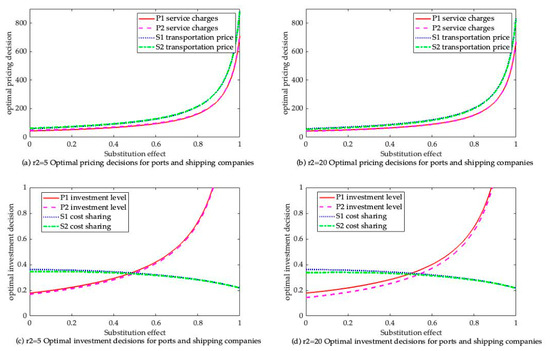
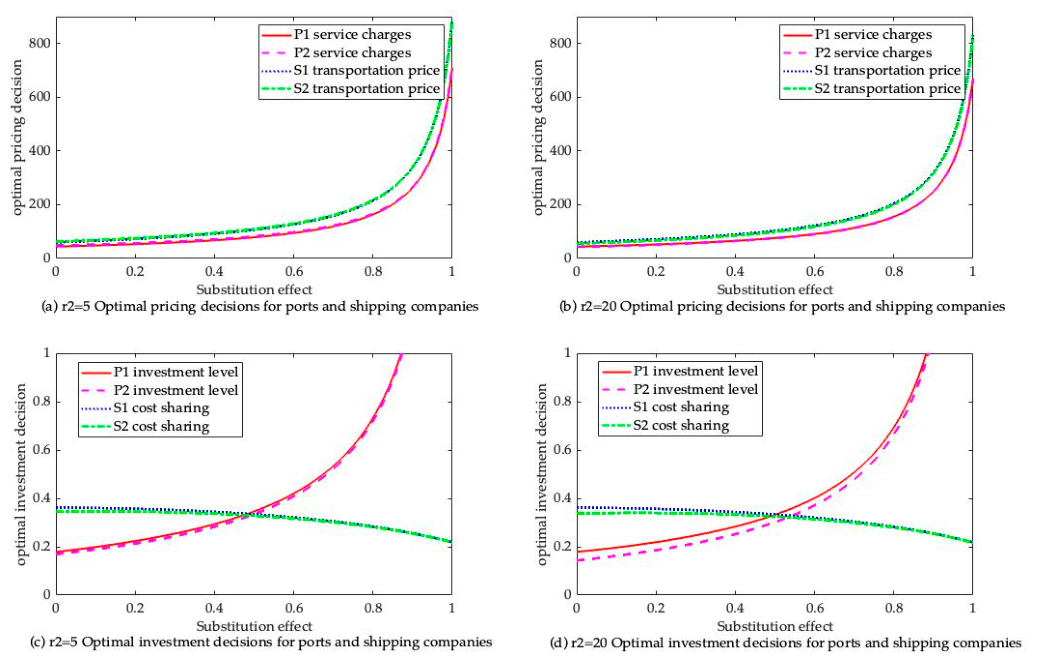
Figure 7 and Figure 8 illustrate the impact of the route substitution effect on the optimal decisions of ports and shipping companies. In the figures, as the substitution effect rises, port service charges and the shipping company transportation price exhibit an upward trend. The port’s green investment level rises, while the shipping company’s cost-sharing ratio declines. When the substitution effect is strong, if any party unilaterally lowers its price, competitors will quickly follow suit. This leads to a price war across shipping. Ultimately, the profits of all supply chains are harmed. Rational members of the supply chain tacitly choose to raise prices to protect their profit margins. At this point, the port enhances service differentiation by increasing the level of green investment, thereby supporting a higher price. Similarly, ports and shipping companies with lower unit green investment costs can form differentiation more easily to charge higher prices.
The reason for the decline in the shipping company’s cost-sharing ratio should be distinguished from the situation when competition intensity increases. When competition intensity increases, all supply chains face green investment pressure. Shipping companies lack attractive external alternatives. They form an interdependent relationship with the port. The cost-sharing ratio remains stable as a long-term contract term. But when the substitution effect intensifies, shipping companies can easily switch to other ports on alternative routes. Therefore, they require the port to bear a larger share of the green investment cost. As a result, the cost-sharing ratio shows a declining trend.
Figure 8 illustrates the trends of optimal decisions for supply chain members under different levels of port congestion as the substitution effect coefficient varies. Ports with lower congestion levels and their downstream shipping companies charge higher fees. As shown in Figure 8, when the substitution effect intensifies, ports with higher congestion levels invest in green construction at a higher rate.
Figure 9 illustrates the trends of optimal profits for supply chain members under different port investment costs as the substitution effect coefficient varies. As shown in Figure 9, the optimal profits of ports, shipping companies, and the overall supply chain are all positively correlated with the substitution effect coefficient. Moreover, when the green investment cost increases, the optimal profits of both the overall supply chain and its individual members show a significant declining trend.
Figure 10 illustrates the trends of optimal profits for supply chain members under different levels of port congestion as the substitution effect coefficient varies. As shown in Figure 10, ports with lower congestion levels and their downstream shipping companies achieve higher optimal profits, and the overall supply chain also attains higher optimal profits.
This phenomenon occurs because the supply chain responds to the intensifying substitution effect by increasing the green investment level to achieve service differentiation. It can help them attract more shippers with low-carbon preferences and expand market demand. At the same time, higher prices further amplify ports’ and shipping companies’ profit margins. The effects of green investment cost and congestion level on supply chain members’ profit are the same as those analyzed above. A supply chain with a lower unit cost of green investment obtains more profit and rises at a faster rate. For a supply chain with a lower congestion level, its port and shipping company make more profit. Moreover, as the substitution effect intensifies, their profit increases by a larger margin.
5.3. The Impact of Congestion Coefficient
Based on the model analysis, it is found that the congestion coefficient exerts a certain influence on the optimal decisions and optimal profits of the port-shipping supply chain alliance. The basic parameters were set as follows: , , , , , , , and . The trends of optimal decisions and optimal profits for the ports and shipping companies in the two port-shipping supply chains are illustrated in Figure 11, Figure 12, Figure 13 and Figure 14.
Figure 11.
The impact of congestion coefficient on the optimal decision with different costs.
Figure 12.
The impact of congestion coefficient on the optimal decision with different congestion.
Figure 13.
The impact of congestion coefficient on the optimal profit with different costs.
Figure 14.
The impact of congestion coefficient on the optimal profit with different congestion.
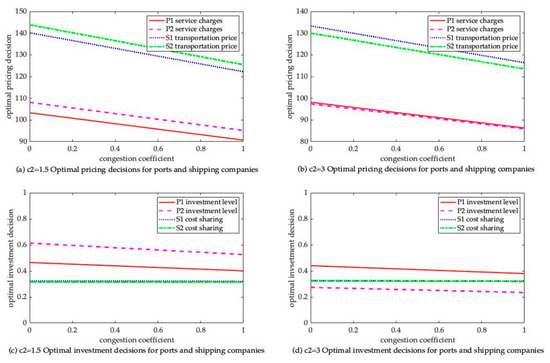
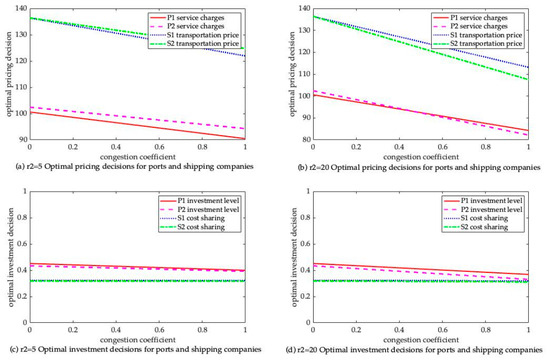
Figure 11 illustrates the trends of optimal decisions for shipping supply chain members under different unit investment costs of ports as the congestion coefficient varies. From Figure 11, as the congestion coefficient increases, both the ports’ service prices and the shipping companies’ freight rates decrease. This phenomenon occurs because congestion reduces port operational efficiency and prolongs vessel waiting time at the port. Shipping companies may reduce calls or switch to other ports. Considering environmental protection and service timeliness, shippers’ willingness to pay will decrease. Therefore, the port must lower prices to compensate for the loss in demand, and the shipping company also reduces freight rates to attract shippers. Furthermore, the supply chain with lower unit investment costs charges higher prices. The level of port investment increases with the congestion coefficient. While the cost-sharing ratio of shipping companies remains unaffected by the congestion coefficient. Congestion increases the port’s operational pressure, which becomes unable to bear the high cost of green investment. So, it proactively reduces its green investment. Similarly, the shipping company’s cost-sharing ratio is determined by long-term strategic contracts. It does not adjust to short-term fluctuations in congestion. When the congestion coefficient increases, ports with higher congestion levels reduce their investment levels at a higher rate.
Figure 12 illustrates the trends of optimal decisions for supply chain members under different levels of port congestion as the congestion coefficient varies. As shown in Figure 12, as the congestion coefficient increases, ports with lower congestion levels and their downstream shipping companies choose to maintain higher price levels. As the congestion coefficient increases, ports with higher congestion levels reduce their investment levels at a higher rate. When the congestion coefficient is relatively small, ports with higher congestion levels tend to maintain higher green investment. However, as the congestion coefficient increases, the port’s operational capacity becomes insufficient. It is unable to maintain a high level of green investment; so, it will reduce investment at a faster rate to cut costs.
Figure 13 illustrates the trends of optimal profits for supply chain members under different port investment costs as the congestion coefficient varies. As shown in Figure 13, the optimal profits of ports, shipping companies, and the overall supply chain are all negatively correlated with the congestion coefficient. Congestion lowers shippers’ evaluation of service reliability; so, their willingness to pay decreases. The supply chain is forced to lower prices to maintain demand. Meanwhile, the return on green investment declines because congestion weakens the value of green services. As a result, profit margins are compressed from both sides. Moreover, when the investment cost increases, the optimal profits of supply chain and its members show a significant declining trend.
Figure 14 illustrates the trend in profit optimization for various supply chain participants under different port congestion levels as the congestion coefficient varies. As shown in Figure 14, the profits of ports and shipping companies decline as the congestion coefficient increases. Because the supply chain with a higher congestion level will choose to reduce prices more significantly to stimulate demand. As the congestion coefficient increases, the supply chain with a higher unit investment cost and a more severe congestion level experiences the most pronounced decline in profit.
6. Conclusions
In this study, we construct a non-cooperative–cooperative biform game to explore the impact of vertical alliances on green investment strategies in shipping supply chains. We considered two supply chains, each consisting of a port and a shipping company. These two supply chains are competitive in route with one another. Within each supply chain, the ports play the role of leaders, while the shipping companies play the role of followers. Based on equilibrium solutions and the numerical simulations, we found relevant conclusions.
This study reached the following four conclusions. The vertical alliances between ports and shipping companies through sharing green investment costs enable improved shipping service capacity and green level. It demonstrates the Pareto improvement achieved by the vertical alliance cooperation. Consequently, cooperation benefits both ports and shipping companies. Second, as green competition intensifies, ports will lower the service prices and reduce their green investments. Shipping companies will choose to lower freight rates, but the cost-sharing ratio will not change. In other words, fierce competition is detrimental to the green development of shipping. A relatively low level of green competition benefits all supply chain members, as it enables them to achieve higher profits and promotes the green development of shipping. Furthermore, as the substitution effect strengthens, ports’ service prices and shipping companies’ freight rates will increase. The level of ports’ green investment will rise, while shipping companies’ cost-sharing ratio will decrease. Finally, as congestion effects intensify, ports’ service prices and shipping companies’ freight rates will decline. The level of ports’ green investment increases as the congestion coefficient does, whereas the cost-sharing rate of shipping companies remains. It indicates that the port becomes more proactive in cooperating with shipping companies and increases its green investment. From the perspective of the entire shipping supply chain, the cooperation between ports and shipping companies in green investment not only reduces carbon emissions but also generates mutually beneficial outcomes.
Compared with non-cooperative games, this biform game can simultaneously capture price competition among supply chains and the distribution of cooperative benefits within alliances. Thus, it explains the internal mechanism of cooperation in competition. Moreover, this paper found that intense green competition reduces green investment, the route substitution effect increases green investment, and the congestion effect forces ports to invest proactively. These findings revise the simplified assumption in the existing literature that competition always promotes green transformation. They also extend the green investment theory for port and shipping supply chains under competition and cooperation.
Based on these findings, this paper provides three managerial implications, as follows. Ports and shipping companies should proactively establish vertical green investment alliances. Through a cost-sharing mechanism, they can enhance the green level while achieving dual growth in profits. This means that, for ports and shipping companies, green investment pursued in isolation can hardly achieve the optimum attainable. Therefore, it is recommended that port managers initiate vertical cooperation negotiations. They should propose clear cost-sharing plans for green investment to long-term cooperative shipping companies. For example, in areas such as shore power facilities, clean energy refueling facilities, and automated energy-saving retrofits, the shipping company can be required to share a certain proportion of the initial investment or maintenance costs based on cargo volume or call frequency. Shipping companies should recognize that sharing the port’s green investment cost is not a pure expenditure. Instead, by improving port operational efficiency and green service capability, it indirectly reduces their own carbon tax costs, fuel consumption, even and congestion-related delay losses in route operations. Ports and shipping companies should specify quantitative targets for the green investment in their cooperation agreement. Examples include the carbon emission reduction ratio and the shore power utilization rate. They should also define a dynamic adjustment mechanism for cost sharing. Furthermore, it is recommended that they establish a regular joint evaluation mechanism for green performance. Cooperation in green investment should be incorporated into the core clauses of long-term strategic partnerships in the supply chain. It should not be treated as a short-term transaction.
When facing green competition among routes, enterprises should avoid falling into a vicious cycle of price wars and investment reduction. Instead, they should adopt differentiated green service strategies. They should seek to optimize profits and green levels through moderate competition. First, it is recommended that port enterprises provide differentiated green services such as priority berthing, green channels, and carbon credit exchange for different routes, vessel types, and carbon emission intensities. Second, ports can also build brand premium through green certification and environmental rating. Port and shipping enterprises coordinate through industry associations or regional port clusters. They should establish a reference range of minimum standards for green services together to prevent insufficient green investment caused by excessive price reductions.
Ports should dynamically adjust green investment and pricing strategies based on changes in the substitution effect and congestion effect. When congestion intensifies, ports should actively increase green investment to enhance their attractiveness for cooperation. Shipping companies, in turn, should flexibly adjust their cost-sharing ratio to respond to the threat of substitution competition from alternative routes. Therefore, port managers should establish a dynamic monitoring mechanism that assesses the port’s congestion index in real time. When congestion intensifies, the port should increase its green investment, such as upgrading automation equipment, optimizing collection and distribution systems, and expanding shore power capacity. These measures not only directly alleviate congestion but also send a positive cooperation signal to shipping companies. On the other hand, shipping companies should flexibly adjust their cost-sharing strategies according to the degree of congestion and the competitive situation of substitution. In return, they obtain more reliable berthing efficiency and lower delay risks. Only in this way can both parties achieve dynamic coordination in a complex and volatile market environment and promote the green transformation of the shipping supply chain. Overall, this research contributes directly to the sustainable development of the shipping industry, enabling ports and shipping companies to achieve emission reduction targets, maintain profitability under competition, and reduce congestion-related social costs.
This paper considered only a two-echelon shipping supply chain composed of ports and shipping companies. It did not account for multi-tier supply chain networks or interactions with other logistics participants. In addition, the model assumes that ports and shipping companies cooperate only within their respective supply chains. In practice, ports and shipping companies may exhibit complex structures involving multiple horizontal and vertical cooperative arrangements. For example, shipping companies may form horizontal alliances across multiple ports. Such horizontal cooperation among shipping companies may affect the outcomes of cost-sharing ratios and green investment levels. Moreover, this study used linear functions to capture the effects of green preference and port congestion on demand. While this approach is common in the literature, it may oversimplify the nonlinear relationships that exist in real-world settings. This paper focused solely on analyzing the form of vertical alliance cooperation between ports and shipping companies. It is hoped that future research will consider more complex shipping supply chain networks, adopt more flexible functional forms for green and congestion effects, and explore the impact of cooperation among ports and shipping alliances on green shipping development.
Author Contributions
Conceptualization, Q.Z. and Z.B.; methodology, Q.Z., and S.H.; software, S.H.; validation, S.H.; formal analysis, S.H.; investigation, S.H.; resources, S.H.; writing—original draft preparation, S.H.; writing—review and editing, Q.Z. and Z.B. All authors have read and agreed to the published version of the manuscript.
Funding
This research was funded by the National Social Science Foundation of China (Key Program, No. 22ATJ007).
Institutional Review Board Statement
Not applicable.
Informed Consent Statement
Not applicable.
Data Availability Statement
The data that are presented in this study are available within the figures and tables.
Acknowledgments
The authors are grateful to the editor and reviewers for their helpful comments.
Conflicts of Interest
The authors declare no conflicts of interest.
Appendix A
The appendix provides supplementary parameters for the article.
References
- Liu, J.G.; Wang, J.J. Carrier alliance incentive analysis and coordination in a maritime transport chain based on service competition. Transp. Res. Part E Logist. Transp. Rev. 2019, 128, 333–355. [Google Scholar] [CrossRef] [Scilit]
- Song, D.P.; Lyons, A.; Li, D.; Sharifi, H. Modeling port competition from a transport chain perspective. Transp. Res. Part E-Logist. Transp. Rev. 2016, 87, 75–96. [Google Scholar] [CrossRef] [Scilit]
- Chen, H.C.; Liu, S.M. Should ports expand their facilities under congestion and uncertainty? Transp. Res. Part B Methodol. 2016, 85, 109–131. [Google Scholar] [CrossRef] [Scilit]
- Cariou, P. Vertical integration within the logistic chain: Does “regulation” play rational? The case for dedicated container terminals. Transp. Eur. 2001, 7, 37–41. [Google Scholar]
- Yip, T.L.; Liu, J.J.; Fu, X.W.; Feng, J.J. Modeling the effects of competition on seaport terminal awarding. Transp. Policy 2014, 35, 341–349. [Google Scholar] [CrossRef] [Scilit]
- Sheng, D.; Li, Z.C.; Fu, X.W.; Gillen, D. Modeling the effects of unilateral and uniform emission regulations under shipping company and port competition. Transp. Res. Part E Logist. Transp. Rev. 2017, 101, 99–114. [Google Scholar] [CrossRef] [Scilit]
- Wang, J.J.; Liu, J.G.; Wang, F.; Yue, X.H. Blockchain technology for port logistics capability: Exclusive or sharing. Transp. Res. Part B-Methodol. 2021, 149, 347–392. [Google Scholar] [CrossRef] [Scilit]
- Song, Z.Z.; Tang, W.S.; Zhao, R.Q. Cooperation mode for a liner company with heterogeneous ports: Business cooperation vs. port investment. Transp. Res. Part E Logist. Transp. Rev. 2018, 118, 513–533. [Google Scholar] [CrossRef] [Scilit]
- Zhu, S.D.; Zheng, S.Y.; Ge, Y.E.; Fu, X.W.; Sampaio, B.; Jiang, C.M. Vertical integration and its implications to port expansion. Marit. Policy Manag. 2019, 46, 920–938. [Google Scholar] [CrossRef] [Scilit]
- Wang, J.J.; Zhang, B.Y.; Dai, Q.; Kong, Y.D. Vertical structure selection and evolution in shipping supply chains under bilateral bargaining. Expert Syst. Appl. 2024, 238, 122032. [Google Scholar] [CrossRef] [Scilit]
- Moldanová, J.; Hassellöv, I.M.; Matthias, V.; Fridell, E.; Jalkanen, J.P.; Ytreberg, E.; Quante, M.; Tröltzsch, J.; Maljutenko, I.; Raudsepp, U.; et al. Framework for the environmental impact assessment of operational shipping. Ambio 2022, 51, 754–769. [Google Scholar] [CrossRef] [Scilit]
- Hulskotte, J.H.J.; van der Gon, H. Fuel consumption and associated emissions from seagoing ships at berth derived from an on-board survey. Atmos. Environ. 2010, 44, 1229–1236. [Google Scholar] [CrossRef] [Scilit]
- Song, L.Y.; Yang, D.; Chin, A.T.H.; Zhang, G.Z.; He, Z.B.; Guan, W.; Mao, B.H. A game-theoretical approach for modeling competitions in a maritime supply chain. Marit. Policy Manag. 2016, 43, 976–991. [Google Scholar] [CrossRef] [Scilit]
- Do, M.; Arthanari, T.; Olsen, T.L.; Shalpegin, T.; Wang, S.A. Impact of number of shipping lines on ports’ charges and profits: A game-theoretic model. Nav. Res. Logist. 2023, 70, 131–144. [Google Scholar] [CrossRef] [Scilit]
- Zhao, X.W.; Sun, Z. Cooperation and investment decisions of one shipping liner to multiple ports under differential pricing. Comput. Ind. Eng. 2023, 186, 109744. [Google Scholar] [CrossRef] [Scilit]
- Brandenburger, A.; Stuart, H. Biform games. Manag. Sci. 2007, 53, 537–549. [Google Scholar] [CrossRef] [Scilit]
- Wang, X.R.; Li, Y.Z.; Ma, C.X.; Cao, S.R. Biform Game Approach to Strategy Optimization of Autonomous Vehicle Lane Changes on Highway Ramps. Appl. Sci. 2025, 15, 2568. [Google Scholar] [CrossRef] [Scilit]
- Zheng, X.X.; Zhang, S.Y.; Jia, F.; Lin, X. A new biform game-based coordination mechanism for a carbon complementary supply chain under hybrid carbon regulations. Transp. Res. Part E-Logist. Transp. Rev. 2024, 187, 103592. [Google Scholar] [CrossRef] [Scilit]
- Li, M.Q.; Li, D.F.; Wei, L.X. Manufacturing Platform’s Pricing and Green R&D With Technology Spillovers Under Supply Chain Co-opetition. IEEE Trans. Eng. Manag. 2025, 72, 3849–3863. [Google Scholar]
- Jia, F.; Zhang, S.Y.; Zheng, X.X.; Choi, T.M. A novel coordination mechanism to coordinate the multi-agent reverse supply chain with fairness concerns. Int. J. Prod. Econ. 2023, 265, 108973. [Google Scholar] [CrossRef] [Scilit]
- Shu, B.C.; Wei, J.; Cao, H. Optimal pricing and collection decisions in a two-period closed-loop supply chain considering channel inconvenience. Transp. Res. Part E Logist. Transp. Rev. 2025, 194, 103869. [Google Scholar] [CrossRef] [Scilit]
- Nguyen, T.D. Game of banks- biform game theoretical framework for ATM network cost sharing. Eur. J. Oper. Res. 2024, 316, 1158–1178. [Google Scholar] [CrossRef] [Scilit]
- Tang, J.; Li, Z.J.; Meng, F.Y.; Gong, Z.W.; Pedrycz, W. Biform game consensus analysis of group decision making with unconnected social network. Eur. J. Oper. Res. 2025, 324, 259–275. [Google Scholar] [CrossRef] [Scilit]
- Zhang, S.Y.; Zheng, X.X.; Jia, F. Balancing collaborative investment with opportunity costs in a carbon complementary supply chain. Ind. Manag. Data Syst. 2025, 125, 575–603. [Google Scholar] [CrossRef] [Scilit]
- Wang, L.; Yang, Z.M.; Chen, T.Q.; Xu, T.; Xiao, B.Q. The Mechanism of Green Transition of Energy Enterprises Applying Noncooperative-Cooperative Biform Game Model. Systems 2025, 13, 942. [Google Scholar] [CrossRef] [Scilit]
- Wang, G.; Liu, C.; Chen, J. Optimization study of non-cooperative-cooperative two-type game strategies of port tripartite informatization investment under restricted exchange structure. J. Henan Inst. Sci. Technol. Nat. Sci. Ed. 2025, 53, 84–100. [Google Scholar]
- Liu, J.G.; Xu, H.A.; Lyu, Y. Emission reduction technologies for shipping supply chains under carbon tax with knowledge sharing. Ocean. Coast. Manag. 2023, 246, 106869. [Google Scholar] [CrossRef] [Scilit]
- Zhou, Y.; Zhou, H.Y. The Emission Reduction Technology Decision of the Port Supply Chain. Mathematics 2024, 12, 848. [Google Scholar] [CrossRef] [Scilit]
- Zhou, H.Y.; Zhang, W.J. Choice of Emission Control Technology in Port Areas with Customers’ Low-Carbon Preference. Sustainability 2022, 14, 13816. [Google Scholar] [CrossRef] [Scilit]
- Li, M.J.; Luan, J.L.; Li, X.D.; Jia, P. An Analysis of the Impact of Government Subsidies on Emission Reduction Technology Investment Strategies in Low-Carbon Port Operations. Systems 2024, 12, 134. [Google Scholar] [CrossRef] [Scilit]
- Yang, L.J.; Chen, D.Y.; Chen, Y.Y.; Zhang, Z.F. Analyzing the Impact of Government Subsidies on Carbon Emission Mitigation Considering Carriers’ Price-and-Service Competition and Green Shippers. Systems 2025, 13, 249. [Google Scholar] [CrossRef] [Scilit]
- Song, J.Y.; Xu, C.Y.; Wang, C.X. Impacts of the carbon tax on green shipping supply chain under the port competition. Expert Syst. 2024, 41, e13229. [Google Scholar] [CrossRef] [Scilit]
- Takebayashi, K. The effects of vertical integration and carbon tax on supply chain performance and economic welfare in the maritime industry. Marit. Policy Manag. 2025, 52, 208–228. [Google Scholar] [CrossRef] [Scilit]
- Xue, Y.M.; Lai, K.H.; Wang, C.Y. How to invest decarbonization technology in shipping operations? Evidence from a game-theoretic investigation. Ocean. Coast. Manag. 2024, 251, 107076. [Google Scholar] [CrossRef] [Scilit]
- Teng, Z.Q.; Li, X.L.; Fang, Y.T.; Fu, H.L. Will Port Integration Help Reduce Carbon Emissions and Improve Social Welfare? Discret. Dyn. Nat. Soc. 2021, 2021, 5208046. [Google Scholar]
- Chen, J.H.; Lin, X.L.; Ye, J.; Wang, S.H.; Liu, J.T. Decarbonising the maritime supply chain: Per-unit subsidies or investment support? Int. J. Logist. Res. Appl. 2025, 1–24. [Google Scholar] [CrossRef] [Scilit]
- Xie, F.J.; Zhou, Z.Y. Port green investment strategy under government subsidization and regulation policy. Front. Mar. Sci. 2025, 12, 1661382. [Google Scholar] [CrossRef] [Scilit]
- Rodrigues, J.N.; Bhattacharya, S.; Sachdev, B.K.; Cabete, D.C.R. Policy frameworks for green innovation in maritime trade and sustainable development. Marit. Policy Manag. 2025, 1–27. [Google Scholar] [CrossRef] [Scilit]
- Meng, L.P.; Ge, H.; Wang, X.D.; Yan, W.; Han, C.F. Optimization of ship routing and allocation in a container transport network considering port congestion: A variational inequality model. Ocean. Coast. Manag. 2023, 244, 106798. [Google Scholar] [CrossRef] [Scilit]
- Liu, Z.G.; Anderson, T.D.; Cruz, J.M. Consumer environmental awareness and competition in two-stage supply chains. Eur. J. Oper. Res. 2012, 218, 602–613. [Google Scholar] [CrossRef] [Scilit]
- Qian, X.D.; Liu, W.; Yang, J.Q. Game theory analysis of technology adoption timing and pricing decision in supply chain system under asymmetric nash equilibrium. J. Intell. Fuzzy Syst. 2018, 35, 3101–3111. [Google Scholar] [CrossRef] [Scilit]
- Liu, J.; Zhao, H.; Li, J. Research on Investment Strategy of Maritime Supply Chain Based on Green Investment Efficiency. Chin. J. Manag. Sci. 2021, 29, 33–44. [Google Scholar] [CrossRef] [Scilit]
- Xie, F. A Study on Green Investment Strategy of Port and Shipping Company in Competitive and Cooperative Environment. Ph.D. Thesis, Shanghai Maritime University, Shanghai, China, 2023. [Google Scholar]
- Li, M.; Li, D.; Nan, J. Competition of Green Supply Chain and R&D Cost-sharing within a Chain-Based on Noncooperative-Cooperative Biform Game Approach. Chin. J. Manag. Sci. 2025, 33, 339–349. [Google Scholar]
- Li, J. The Two-Level Game About Co-Operation and Competition Between Dedicated Terminals-Shipping Companies in the Regional Port System. Master’s Thesis, Shenzhen University, Shenzhen, China, 2016. [Google Scholar]
- Zheng, S.Y.; Negenborn, R.R. Centralization or decentralization: A comparative analysis of port regulation modes. Transp. Res. Part E Logist. Transp. Rev. 2014, 69, 21–40. [Google Scholar] [CrossRef] [Scilit]

Disclaimer/Publisher’s Note: The statements, opinions and data contained in all publications are solely those of the individual author(s) and contributor(s) and not of MDPI and/or the editor(s). MDPI and/or the editor(s) disclaim responsibility for any injury to people or property resulting from any ideas, methods, instructions or products referred to in the content. |
© 2026 by the authors. Licensee MDPI, Basel, Switzerland. This article is an open access article distributed under the terms and conditions of the Creative Commons Attribution (CC BY) license.