


Abstract
Transformers are key devices in the new electricity system, and the entire life cycle is associated with a considerable resource consumption and carbon footprint (CF). Understanding CF is essential for accelerating the low-carbon transition of the industry. Therefore, a systematic CF model for transformers is constructed in this study based on life cycle assessment (LCA). The results indicate that the operation stage is the overwhelmingly dominant phase for CF of transformer, with electricity acting as the main carbon source. The CF at the raw-material stage mainly originates from steel and copper. Through analysis, eight key impact factors were identified, leading to the formulation of three-dimensional carbon reduction pathways. It was observed that a 10% reduction in total losses of a transformer results in an approximate 10% decline in CF. At the same time, the transition of the electricity grid to clean energy helps reduce CF during operation. In addition, the effectiveness of a multi-factor carbon reduction pathway was examined. The results showed that, under this integrated pathway, the CF across all transformer rated voltages could be reduced by 9.75%. Based on this, a system pathway centered on enhancing operational energy efficiency is proposed, supported by green materials and processes, and coordinated through smart operation and maintenance, and circular recycling. This provides quantitative evidence and decision support for the green transition of transformers, contributing to the broader goals of sustainability development in electricity system.
1. Introduction
Transformers are key equipment in the electricity system, and losses of operation account for about 40% of transmission and distribution electricity losses [1]. In recent years, mandatory standards for “Minimum allowable values of energy efficiency and the energy efficiency grades for electricity transformers” have been updated and issued in China, substantially raising the energy efficiency limit levels and reflecting the country’s strong focus on energy conservation and loss reduction in transformers [2]. At the same time, transformers involve substantial resource consumption and carbon footprint (CF) across the life cycle [3]. Therefore, systematic evaluation of the CF of transformers helps identify critical emission points and provides a scientific basis for optimizing product design, improving production processes, and boosting operational energy efficiency, thus promoting the green and low-carbon transformation of the transformer industry and the electricity system.
CF assessments of transformers have been widely carried out based on life cycle assessment (LCA) [4,5,6], which quantifies resource use and emissions across the product life cycle. At present, CF assessment of transformers mainly includes the following three aspects.
1.1. CF of Typical Transformer
Studies have shown that different types of transformers exhibit significant differences in the composition of CFs during the production phase. Taking 10 kV oil-immersed and dry-type transformers as examples, the CFs of both are dominated by material production; however, the CF during the production phase of oil-immersed transformers accounts for approximately 4% of the total, whereas for dry-type transformers, this proportion reaches about 18% [7]. Existing research consistently identifies the operation stage as the dominant source of CF, contributing substantially more than other stages. The CF of 110 kV (50 MVA) and 220 kV (240 MVA) transformers, with a 40-year service life, showed that power loss during the operation stage is the primary CF source, contributing over 96% [1]. A comparative LCA of 300 kVA oil-filled distribution transformers, assuming a 30-year lifetime and 50% average load, indicated that CF during the operation stage accounts for 88.5% (30.92 kt CO2-eq), with electricity being the dominant contributor [8]. Furthermore, LCA conducted by ABB on 10 MVA (rated voltage 20 kV) and 20 MVA (rated voltage 66 kV) transformers indicated that, under the assumption of a 30-year service life and 50% average load, the contribution of the operation stage to CF reaches 98.7% [9,10], confirming its dominant role across different transformer capacities.
The transportation stage also has a considerable impact on the CF of transformers, with emissions influenced by transportation distance, mode, and production origin. Research showed that for a 1414 kg transformer, imported transformers transported approximately 14,000 km by ship and truck have a CF of 607.79 kg CO2-eq, whereas locally manufactured transformers transported about 600 km by truck have a CF of 455.28 kg CO2-eq. Moreover, shipping (0.02 kg CO2-eq/t·km) offers a stronger carbon reduction advantage than air transport (0.539 kg CO2-eq/t·km) [8]. These findings highlight the importance of optimizing transportation modes and distances to reduce the overall life cycle carbon emissions of transformers, particularly in cross-regional or international transport scenarios.
1.2. CF Assessment Focusing on Key Factors Such as Materials and Processes
In CF assessments of transformers, manufacturing materials and production processes are critical factors influencing CF in the production stage. By calculating the CF of key materials such as oriented silicon steel across stages, a quantitative basis for overall CF accounting of transformers can be established [11]. A comparison of the CF of dry-type and oil-immersed distribution transformers using amorphous metal cores versus standard silicon steel cores indicated that, although amorphous metal core transformers raise initial material usage, their no-load loss is reduced by 50–70%, which significantly lowers CF [12].
In addition, the selection of insulating media has a notable impact on CF. Using vegetable ester oil as an alternative to traditional mineral oil as the insulating medium can lower CF while improving safety performance [13,14]. Burger Mansilha et al. [15] assessed the CF of copper and aluminum materials during the manufacturing process of a 75 kVA transformer, providing quantitative support for material optimization and emission reduction strategies. From a manufacturing process perspective, Serres [16] suggested that by improving manufacturing processes and extending the equipment lifespan, the CF of a transformer can be reduced by 28%, with an economic benefit improvement of about 20%. These findings indicate that material selection and process optimization play a significant role in reducing the CF of transformers.
1.3. Green and Low-Carbon Assessment of Transformers
Existing studies have proposed various green and low-carbon evaluation methods to guide emission reduction strategies in the design, manufacturing, and operation stages. For example, a green assessment model for the high-end transformer manufacturing process indicates that through manufacturing process optimization, resource and energy consumption can be markedly reduced, thereby improving production efficiency and economic benefits [17].
Low-carbon design models based on functional structure extension enable systematic analysis of component materials, functional characteristics, and process routes at the design stage, facilitating the achievement of emission reduction targets [18,19]. Additionally, low-carbon assessment approaches are often integrated with multi-criteria weighting methods, such as combining the analytical hierarchy process with the entropy weight method, or integrating LCA with a single-factor assessment method to quantify the carbon emission contributions of key indicators, including load losses [20,21].
While a series of studies have been conducted on the CF of transformers, significant research gaps remain. (1) Existing studies predominantly focus on typical transformers, lacking systematic analyses covering multiple voltage levels. This limitation leads to weak generalizability and comparability of the results. (2) Quantitative analysis of the key factors driving carbon reduction is still insufficient, resulting in unclear emission mitigation pathways. These gaps hinder a comprehensive understanding of the CF of transformers and constrain the formulation of effective industry-wide carbon reduction strategies.
To address these challenges, this study develops a systematic CF model for transformers based on LCA. For the first time, the CF of transformers at 10 kV, 35 kV, 110 kV, 220 kV, 330 kV, 500 kV, 750 kV, and 1000 kV is analyzed. Furthermore, an in-depth investigation is conducted into the relationship between eight parameters and their carbon reduction effects. Based on these analyses, a comprehensive carbon reduction pathway for transformers throughout the entire life cycle is proposed. This pathway identifies promising strategies for mitigating carbon emissions, thereby providing a more actionable decision-making basis for the green and low-carbon design and operational optimization of transformers.
2. Method
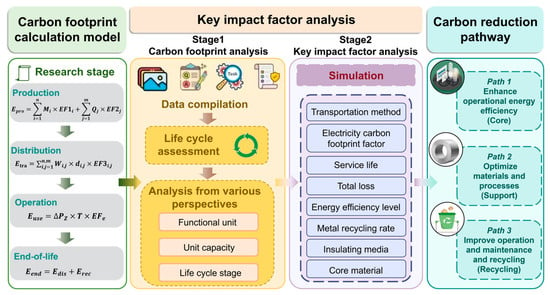
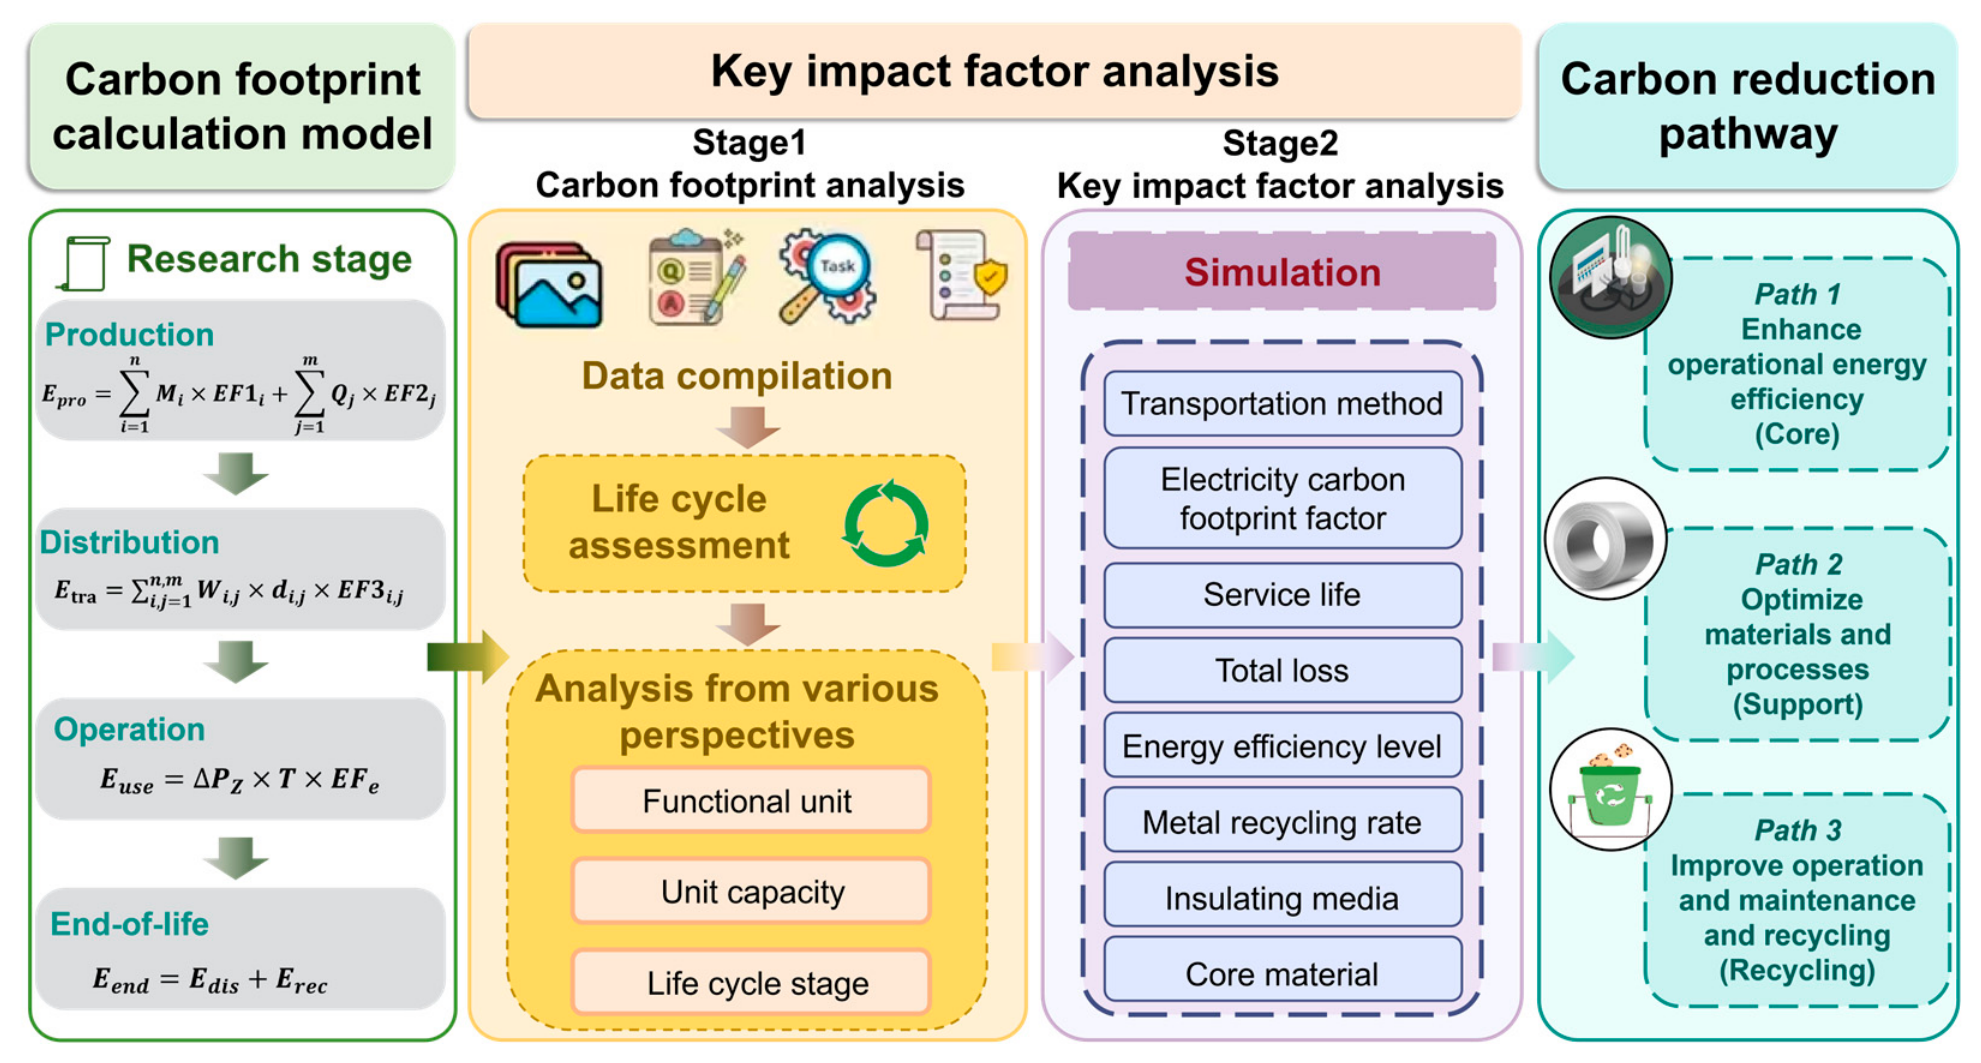
A CF model is established and key impact factors, such as service life, material selection, etc., are identified and quantitatively assessed through parametric simulation. Finally, this process supports the formulation of actionable carbon reduction pathways, highlighting potential for promoting sustainability within the transformer industry (Figure 1).
Figure 1.
Technology roadmap.
2.1. Functional Unit and System Boundary
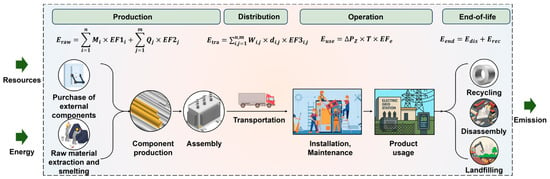
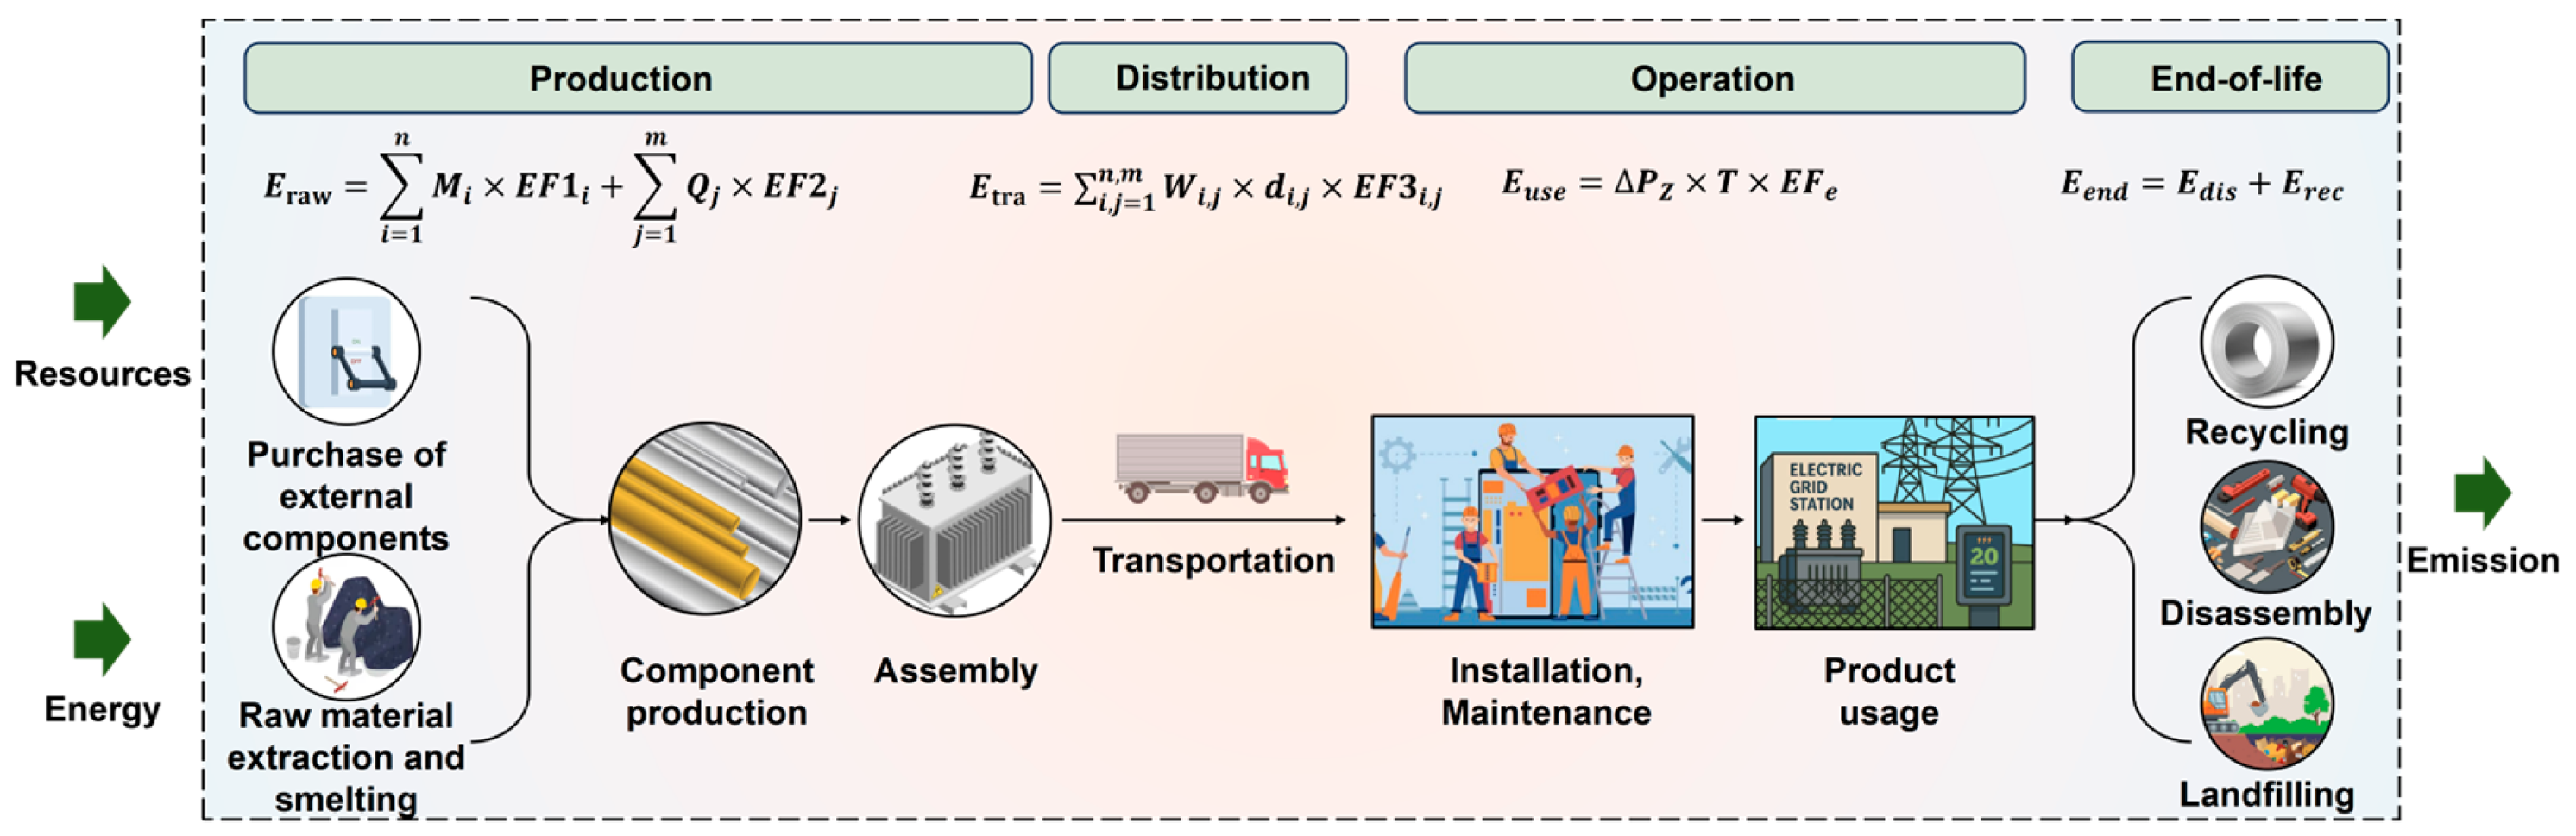
The LCA methodology is employed in this study, with one transformer defined as the functional unit. To ensure comparability across different rated voltages and capacities, the functional unit is normalized to a “1 MVA” rated capacity basis. The CF per MVA is calculated by dividing the CF under the functional unit by the rated capacity. The system boundary covering all relevant life cycle stages is established (Figure 2), including production, distribution, operation, and end-of-life.
Figure 2.
System boundary.
2.2. CF Model of Transformer
The formula for the CF of a transformer is as follows:
In the formula, E is the total CF of the transformer, t CO2-eq per unit; Epro is the CF during the production stage, t CO2-eq; Etra is the CF during the distribution stage, t CO2-eq; Euse is the CF during the operation stage, t CO2-eq; and Eend is the CF during the end-of-life stage, t CO2-eq.
2.2.1. The Production Stage
The production stage covers the raw-material acquisition and the manufacturing and assembly stages. In the raw-material acquisition stage, all raw materials required for a transformer should be considered, including steel, insulating paper, insulating oil, and aluminum, etc. The calculation of CF at this stage mainly considers the amount of raw materials used [1]. It is worth noting that this stage is calculated based on the obtained composition of raw materials, such as whether the insulating media is traditional mineral oil or bio-based vegetable oil, and whether the core material is amorphous alloy or silicon steel sheets. To estimate CF at this stage, the following calculation model is developed [1]:
In the formula, Mi is the amount of raw materials used in category i in t; and EF1i is the CF factor of raw materials i in t CO2-eq/t.
The manufacturing and assembly stage mainly involves the manufacturing of all components and assembly activities, such as core stacking and winding fabrication [7]. It is worth noting that this stage is mainly calculated based on the energy (electricity) consumption data during the manufacturing and processing, and the CF factor of electricity at the processing location should be considered for accurate accounting. To estimate CF at this stage, the following calculation model is developed [1]:
In the formula, Qj represents the mass of energy source used in category j in kWh; and EF2j is the CF factor of the energy source j in t CO2-eq/kWh.
2.2.2. The Distribution Stage
The CF during the distribution stage mainly considers transportation distance, equipment weight, and transportation method. It is assumed that diesel trucks are the transportation method for all transformers. For comparison purposes, based on literature information, the transportation distance for all transformers is assumed to be 500 km [22]. The calculation formula is as follows:
In the formula, Wi,j represents the transportation weight of the resource i or energy source j in t; di,j represents the transportation distance of the resource i or energy source j in km; and EF3i is the CF factor for the transportation method in t CO2-eq/(t·km).
2.2.3. The Operation Stage
The calculation method during the operation stage is given in Equation (4) [23]:
In the formula, ΔPz represents the total loss in kW; T is the operating time in h; and EF3e is the CF factor of the operating local electricity in kg CO2-eq/kWh. The calculation method for loss power during the operation stage of the transformer is provided in Equations (6)–(10).
where ΔP represents the active power loss in kW; P0 is the no-load loss in kW; β is the annual average load of the transformer, dimensionless; and Pk is the rated load loss in kW.
In the formula, ΔQ represents the reactive power loss in kW; Q0 is the no-load reactive power loss in kvar; KQ is the reactive power economic equivalent in kW/kvar; and Qk is the rated load leakage magnetic power in kvar.
In the formula, I0 indicates the no-load current percentage of the transformer, %; and SN is the rated capacity of the transformer in kVA.
In the formula, Uk represents the percentage of short-circuit impedance (%).
2.2.4. The End-of-Life Stage
This stage includes transformer dismantling, recycling and disposal of dismantled components, and waste disposal, along with transportation, sorting, and separation activities during these processes. The calculation method is given in Equation (11) [1]:
In the formula, Edis represents the CF from the transformer dismantling process in t CO2-eq, and Erec represents the CF generated during the collection, transportation, sorting, and separation of recyclable parts of the transformer, as well as the carbon offset from recycled materials, t CO2-eq.
During the dismantling stage, about 0.28 kWh of electricity and about 8.30 kg of water are consumed for each ton of transformer dismantled [22]. In the end-of-life stage, the recovery rate for copper is assumed to be 40%, and that for steel is 75% [24,25,26,27]. Steel is recovered using an electric arc furnace, and copper is recovered through refining followed by electrolysis [28,29,30,31]. The main non-metallic materials in waste transformers, such as cardboard, wood, ceramics, and plastics, account for less than 5% of the total transformer weight. Therefore, after the transformer becomes waste, non-metallic materials are directly landfilled.
2.3. Data Sources
The primary data used in this study are sourced from the literature and corporate surveys, as listed in Supplementary Data Tables S1–S11. A targeted survey of relevant companies was conducted to collect a life cycle inventory for various types of transformers. Among them, the 750 kV and 1000 kV transformers are single-phase models. Other auxiliary data were obtained from the authoritative published literature. Background data for LCA were derived from the China-localized LCA database CAS RCEES 2023, developed by the Research Center for Eco-Environmental Sciences, Chinese Academy of Sciences [32,33,34,35,36,37]. The computational software employed in this study is the LCA software SimaPro, version 10.2. Table 1 lists the sources of the data used in this study.
Table 1.
Data sources.
3. Result
3.1. CF of Transformer
3.1.1. CF Under the Functional Unit
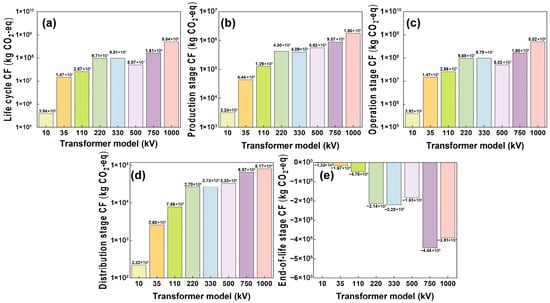
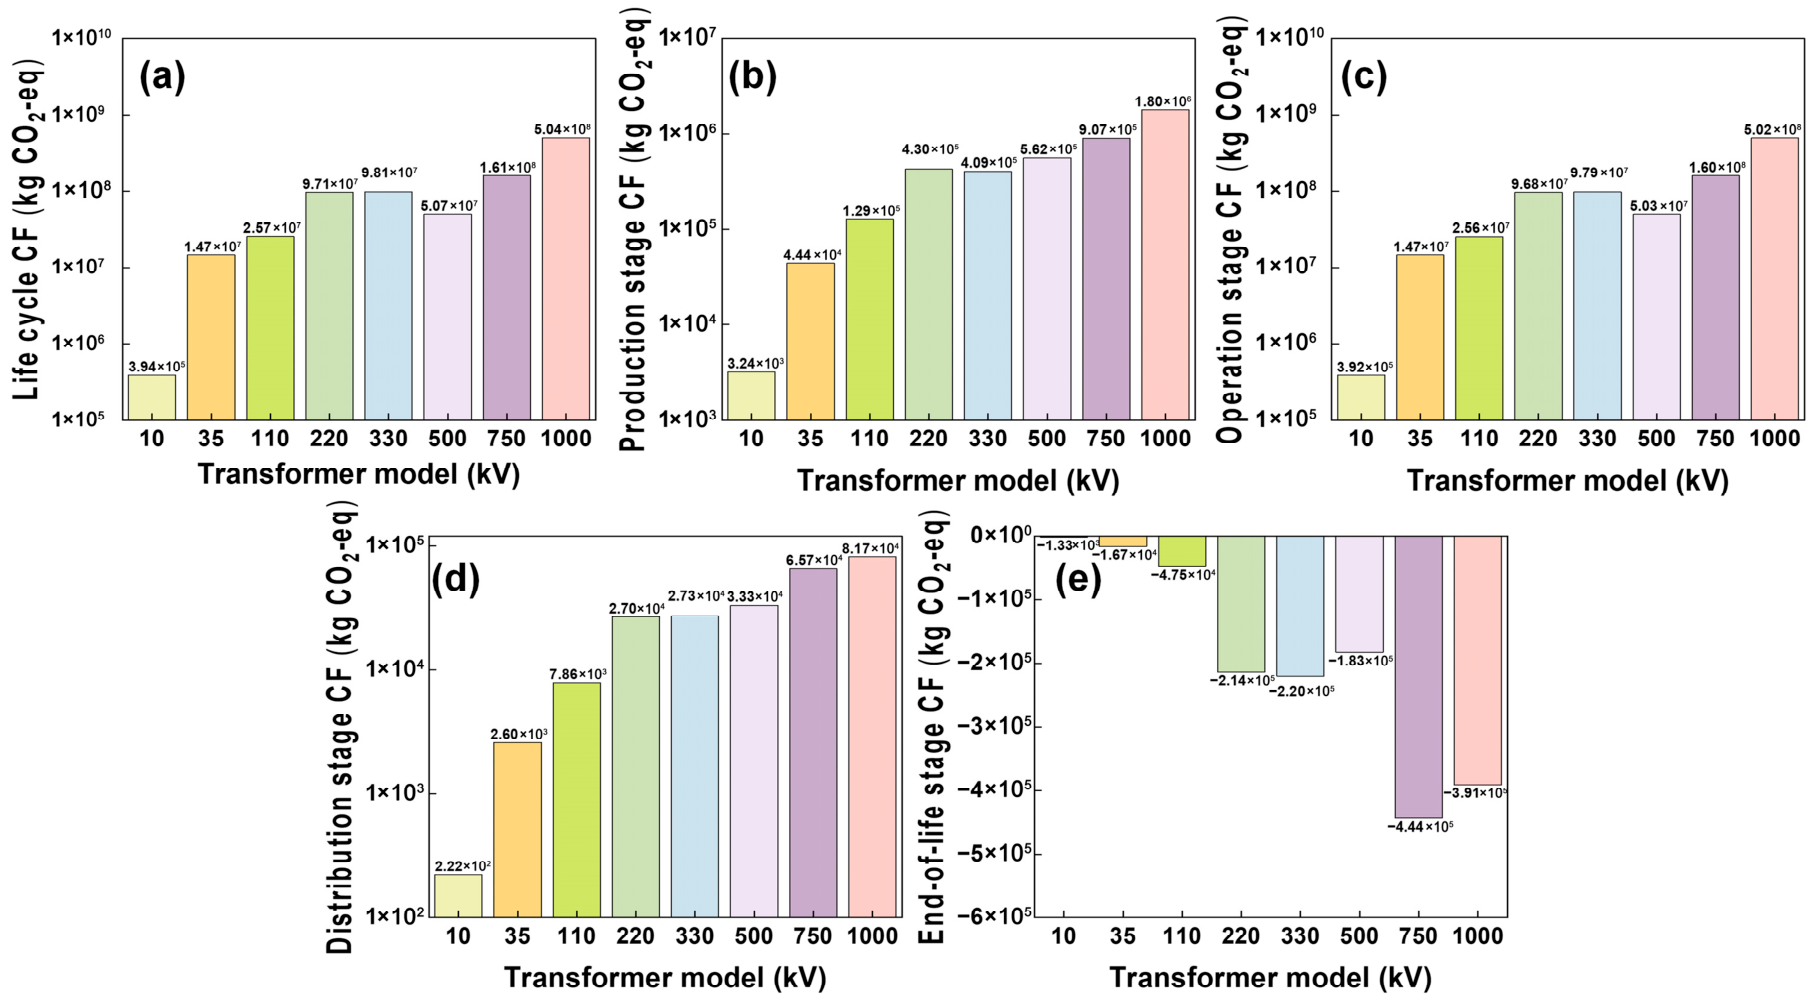
The CF of one transformer at different rated voltages is presented in Figure 3. The overall trend indicates a nonlinear increase in CF as the rated voltage level rises. The CF increases from 0.39 kt CO2-eq/unit for a 10 kV transformer to 503.79 kt CO2-eq/unit for a 1000 kV ultra-high-voltage transformer, representing an increase of three orders of magnitude. This increase is mainly driven by the sharp rise in rated capacity and physical size of high-voltage transformers, leading to higher material usage (especially copper and silicon steel) and greater total electricity losses.
Figure 3.
CF at each stage of transformer life cycle (kg CO2-eq/unit). (a) Full life cycle stage; (b) production stage; (c) operation stage; (d) distribution stage; (e) end-of-life stage.
3.1.2. CF per MVA
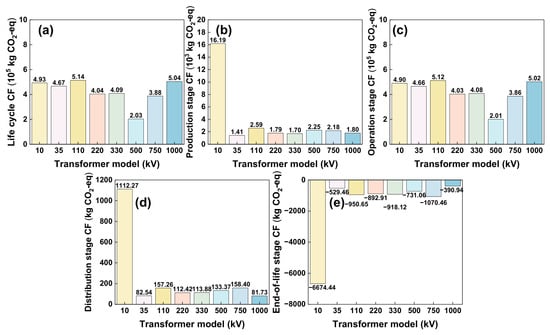
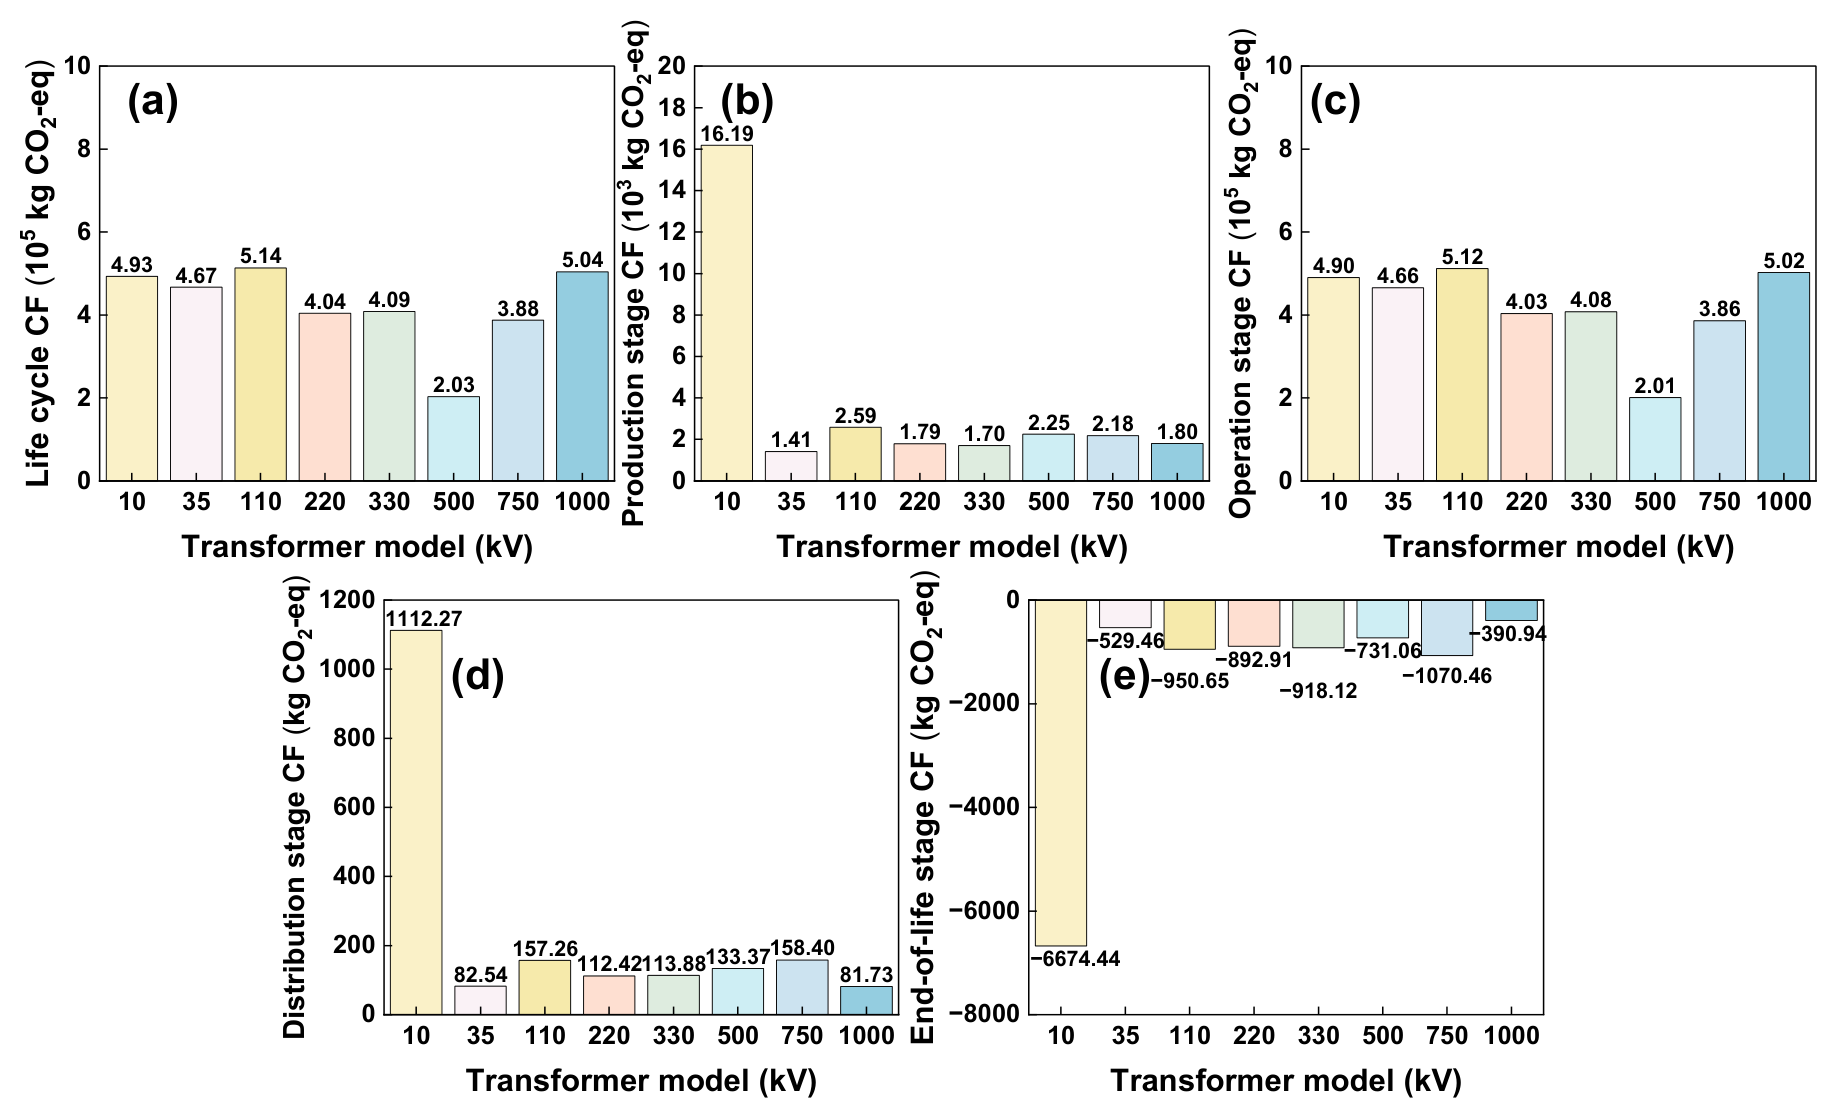
After standardization, the unit capacity CF of 1 MVA remains relatively stable within the 10 kV to 1000 kV range, between 0.20 and 0.51 kt CO2-eq/MVA (Figure 4). CF per MVA at each stage does not increase monotonically with rated voltage level, reflecting the combined effects of design differences, material usage, and manufacturing processes. This indicates that CF at different rated voltages is mainly influenced by rated capacity. Among all voltage levels, the 10 kV transformer has the highest CF per MVA during the production, transportation, and end-of-life stages, which is primarily due to higher material usage per unit capacity (especially silicon steel, copper, and insulating materials). This phenomenon stems from the design constraints inherent in low-voltage, small-capacity transformers.
Figure 4.
CF at each stage of transformer life cycle per MVA (kg CO2-eq/MVA). (a) Full life cycle stage; (b) production stage; (c) operation stage; (d) distribution stage; (e) end-of-life stage.
3.1.3. The Composition Analysis of CF
- (1)
- Contribution during the life cycle stages
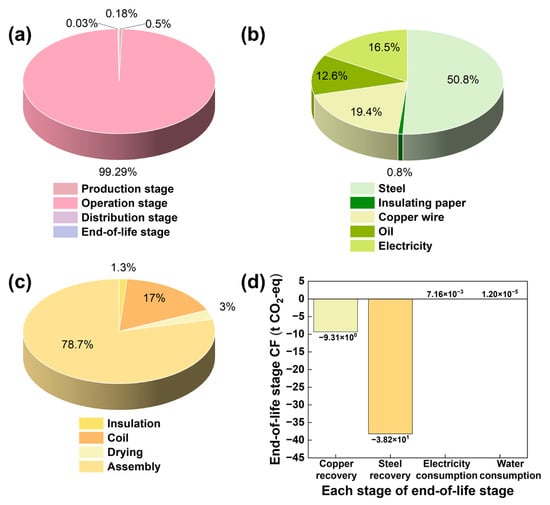
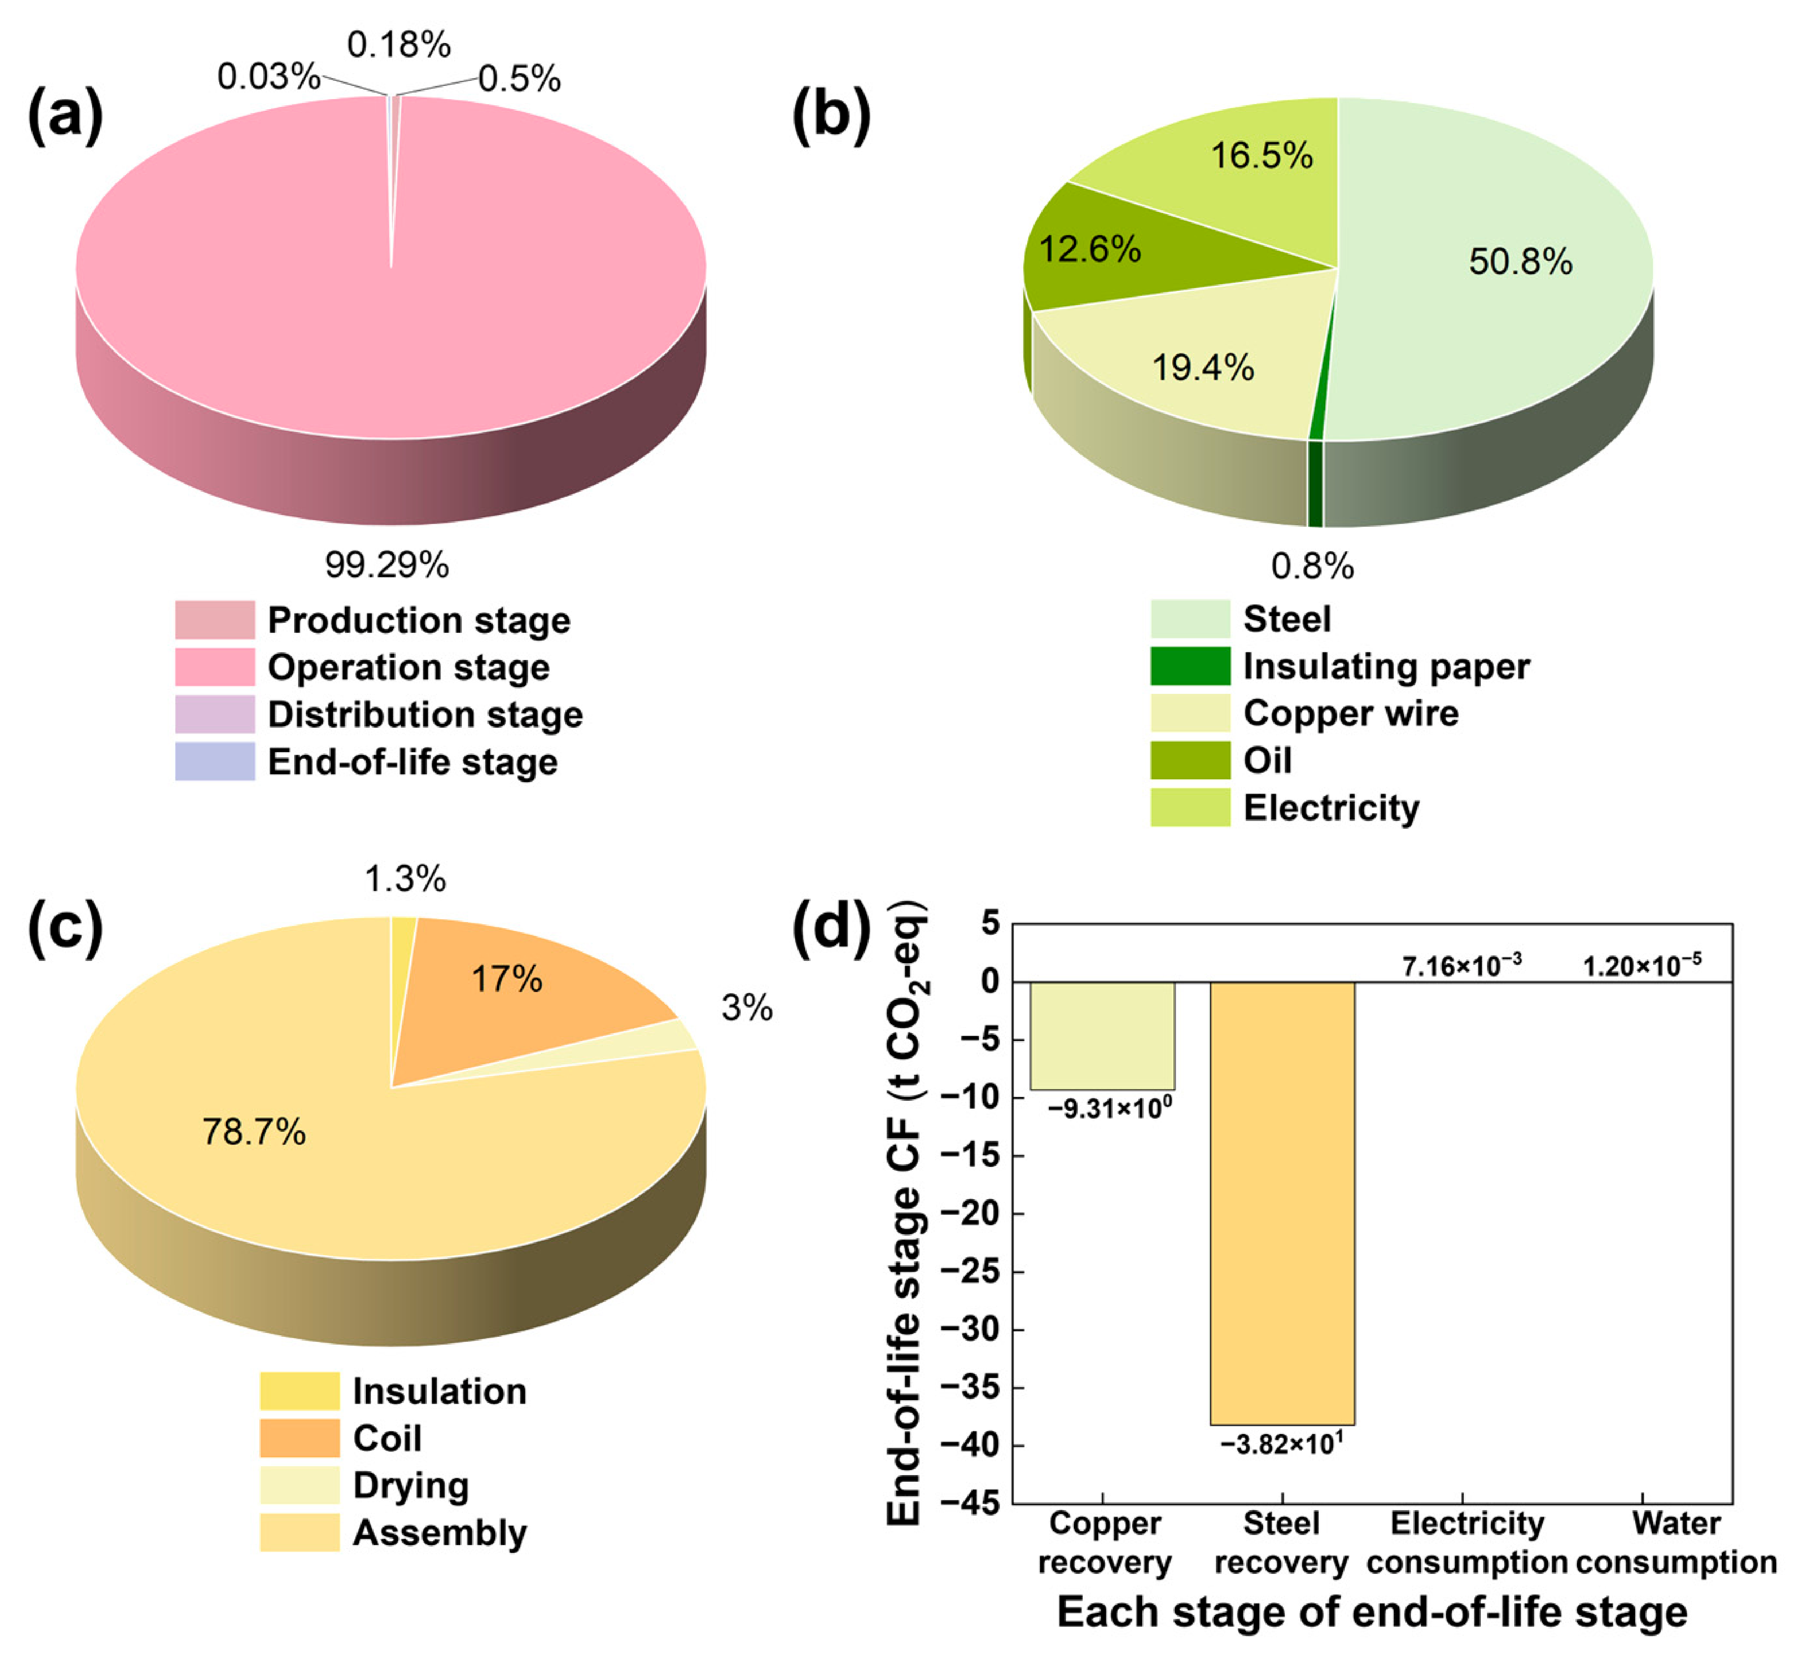
CF during the operation stage dominates, accounting for over 99.0% across all rated voltage levels (Figure 5a). This confirms that operational energy efficiency is the most critical factor. CF during the production stage increases with voltage level, reaching 1.80 kt CO2-eq/unit at 1000 kV, but the share of the total remains below 1.0%. CF during the distribution stage is mainly affected by transformer weight and transportation distance. Although the absolute value increases with voltage level, its proportion remains negligible. In the end-of-life stage, recycling of metals (copper and steel) produces a carbon offset effect, with net CF being negative. At 750 kV, this reaches a peak value of –0.44 kt CO2-eq/unit, indicating notable carbon reduction benefits from material recycling in large transformers.
Figure 5.
The composition analysis of the CF of a 110 kV transformer per MVA. (a) Full life cycle stage; (b) transformer production stage; (c) process contribution in the production stage; (d) end-of-life stage.
- (2)
- Material contribution in the stage of raw-material production.
An analysis of CF caused by different materials during the raw-material production stage indicates that the main sources are the core (silicon steel), conductors (copper), transformer oil, and steel plates (Figure 5b). Among these, the core and steel plates contribute the most, accounting for 32.14% to 60.55%. The contribution of conductors ranges from 8.71% to 38.57%, while transformer oil contributes 5.49% to 16.94%. This can be achieved through optimized material selection, improved material utilization, and the introduction of low-carbon smelting processes to reduce CF in the raw-material stage, while also considering the synergistic emission reduction potential of key materials such as conductors and transformer oil.
- (3)
- Process contribution in the production stage
During the production stage, the CF of the assembly phase mainly originates from electricity consumption, contributing 0.71% to 18.04% of the CF in the production stage (Figure 5c). Taking the 110 kV transformer as an example, the assembly accounts for the highest share (78.70%), far exceeding the winding (17.05%), drying (2.95%), and insulation (1.31%). This is mainly because the assembly, as the final integration and testing stage, involves high-energy-consumption processes such as hoisting, vacuum oil injection, and prolonged high-voltage testing. High equipment electricity and long operating hours result in higher unit energy consumption and CF compared with other component preparation. Therefore, improving assembly process efficiency and adopting energy-saving equipment are key directions for reducing CF at this stage.
- (4)
- Material recycling contribution in end-of-life stage
Taking the 110 kV transformer as an example, waste steel recycling achieves a reduction of 38.2 t CO2-eq/unit, whereas copper recycling results in a smaller reduction of 9.28 t CO2-eq/unit (Figure 5d). This difference is mainly due to the high-energy refining process required for copper recycling, which limits its net reduction potential. Therefore, end-of-life management should focus on efficient recycling and resource utilization of steel and copper components.
3.2. Simulation of Key Impact Factor
Considering factors such as the stock, waste amount, and resource recovery potential of different transformers, the 110 kV transformer was found to have a high stock, large waste amount, and notable resource recovery potential [22]. Therefore, the 110 kV transformer is selected as a representative case to analyze key impact factors, including the distribution transportation method, CF factor of electricity, service life, total transformer loss, and metal recovery rate. In addition, to further clarify the influence of material and technology choices, mineral oil transformers are compared with vegetable oil transformers; amorphous alloy transformers are also compared with silicon steel sheet transformers at 10 kV voltage.
3.2.1. Distribution Transportation Method
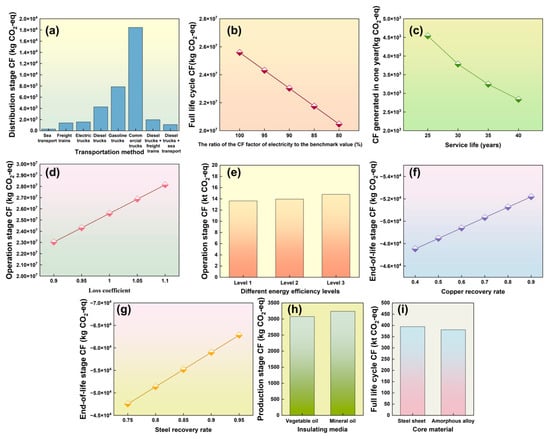
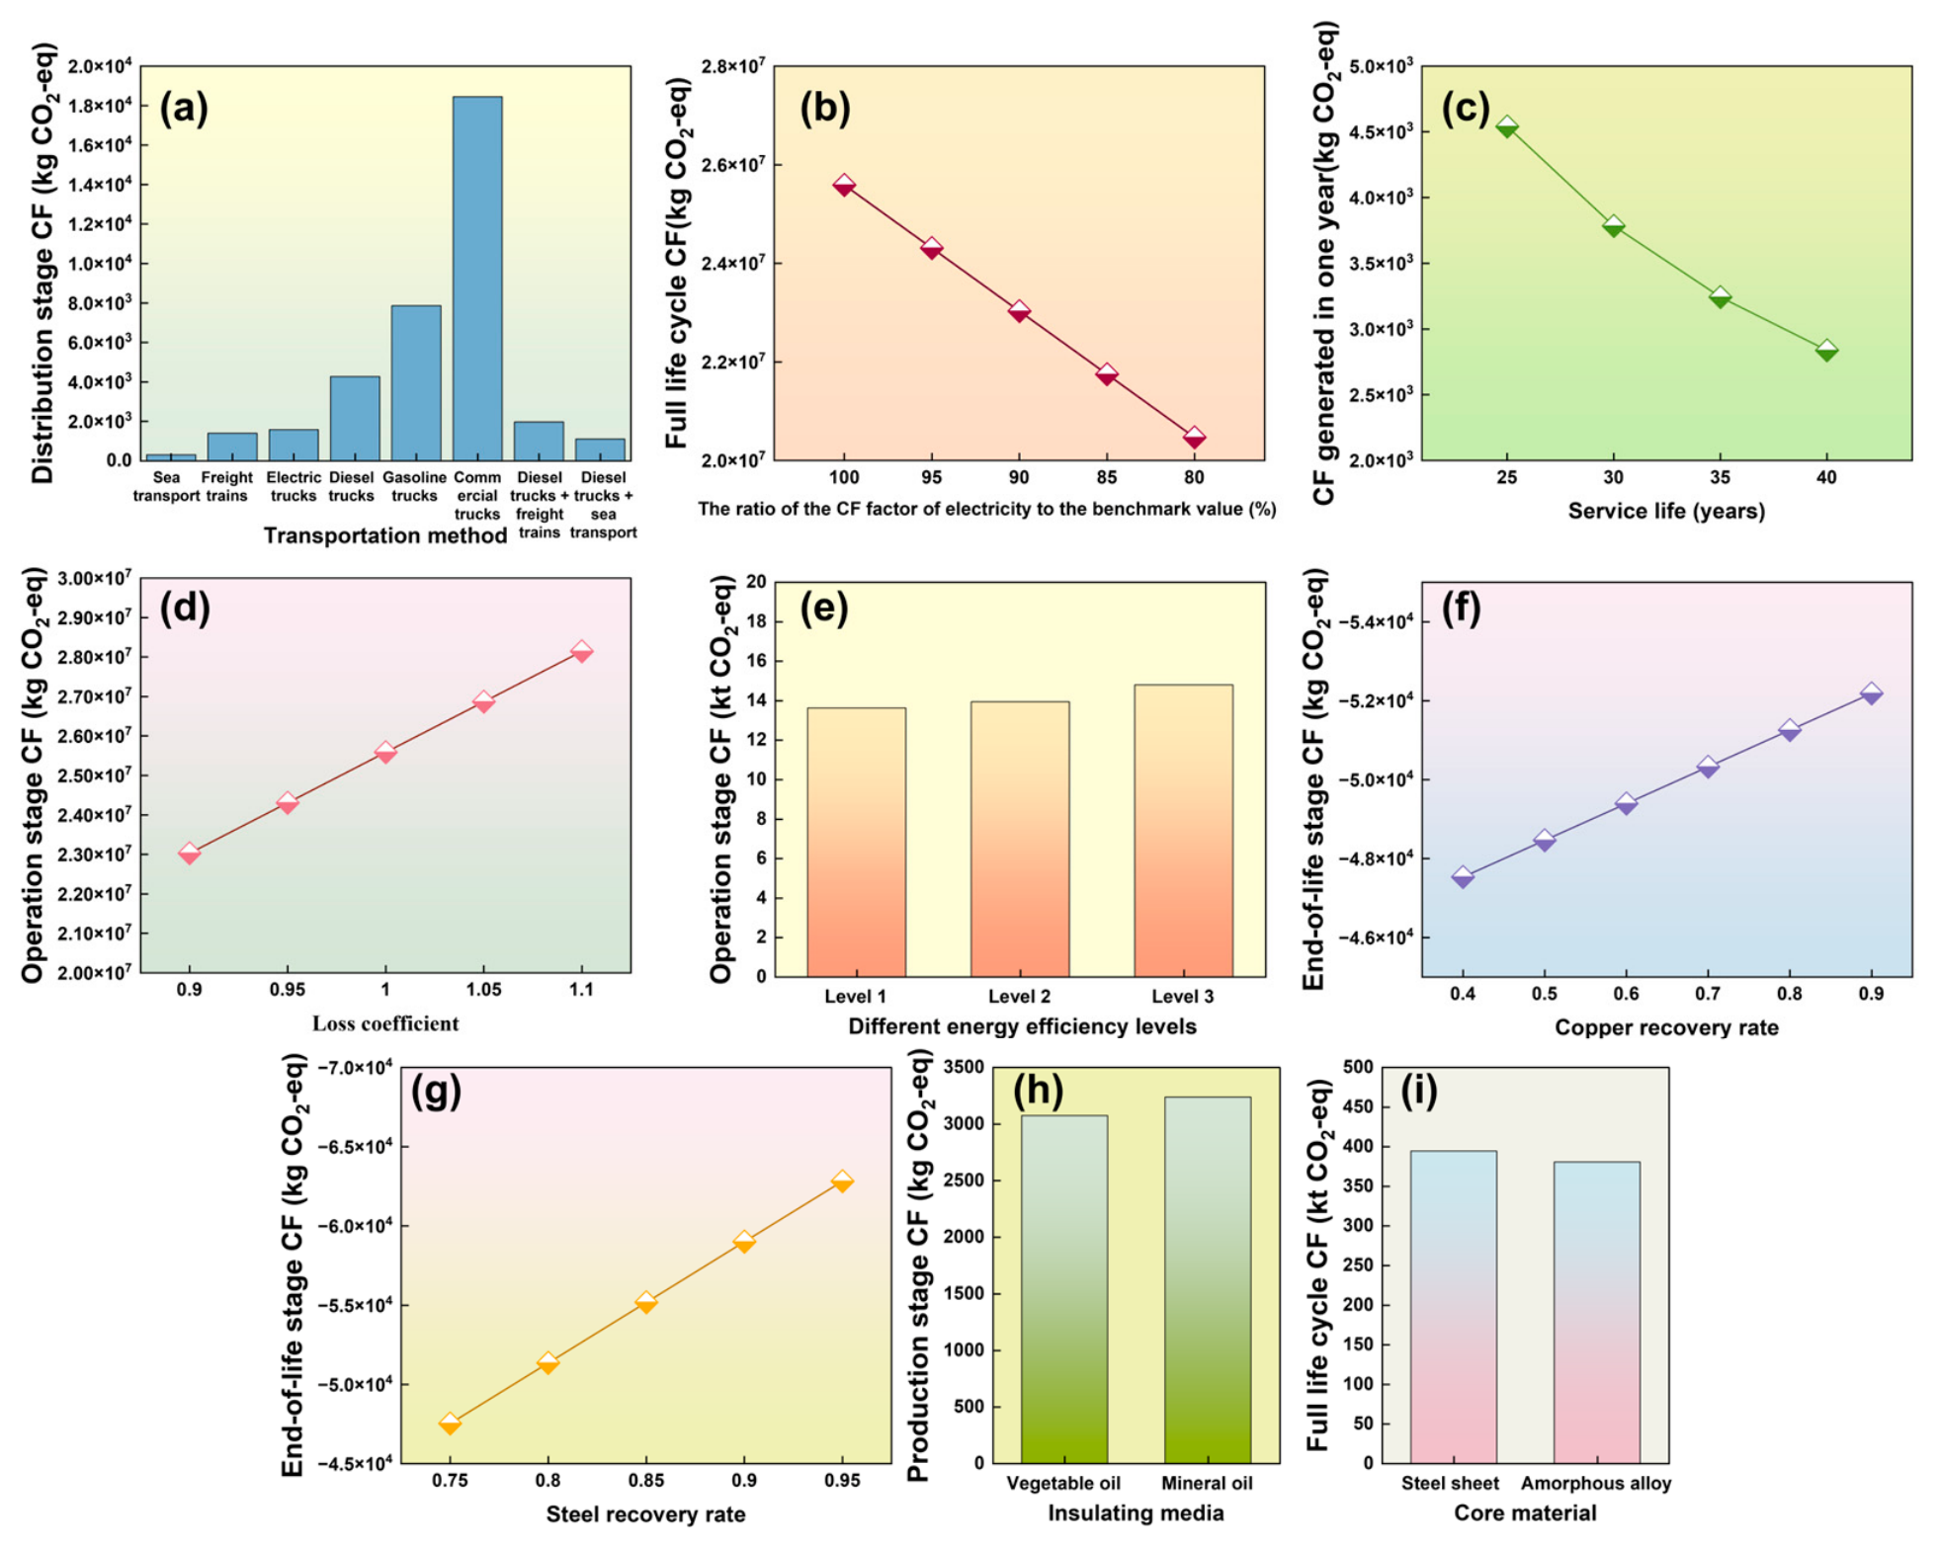
With transportation distance and weight assumed to remain constant, the impact of different transportation methods on the CF of the transformer is analyzed. Using diesel trucks as the baseline scenario, the CF of different transportation methods, including commercial trucks, gasoline trucks, electric trucks, freight trains, sea transport, diesel trucks + freight trains (transportation distances of 100 km by diesel trucks and 400 km by freight trains), and diesel trucks + sea transport (transportation distances of 100 km by sea transport and 400 km by sea transport) is evaluated [40]. The results indicate clear differences in CF across transportation modes (Figure 6a). Sea transport has the lowest CF (312.80 kg CO2-eq/unit), followed by freight trains (1397.55 kg CO2-eq/unit). Electric trucks and diesel trucks are next, as commonly applied transportation options, and both are substantially lower than commercial trucks. The transportation method from diesel trucks to electric trucks can reduce the CF by 79.88%. The combined transport modes of diesel trucks + freight trains and diesel trucks + sea transport record lower CFs of 1973.27 and 1105.47 kg CO2-eq/unit, respectively, representing reductions of 74.15% and 53.85% compared to diesel trucks. In transformer supply chain management, prioritization of intermodal transportation, increasing the share of rail and sea transport, road vehicle selection optimization, and expansion of electric-truck use are key pathways for effectively reducing CF in the distribution phase.
Figure 6.
The CF analysis of the key impact factors. (a) Transportation method; (b) change in CF factor of electricity; (c) change in service life; (d) total loss of the transformer; (e) energy efficiency levels of transformer; (f) copper recovery rate; (g) steel recovery rate; (h) insulating media; (i) core material technology paths.
3.2.2. CF Factor of Electricity
This study quantitatively analyzes the impact of reductions in the CF factor of electricity on the CF of transformers. The baseline CF factor of electricity is 0.577 kg CO2-eq/kWh [41], and scenarios with reductions of 5%, 10%, 15%, and 20% are simulated (Figure 6b). The CF of a transformer decreases linearly as the CF factor of electricity declines. When the reduction reaches 20%, the CF decreases to 20.54 kt CO2-eq/unit. For each 1 percentage point reduction in the CF factor of electricity, about 255.87 t CO2-eq/unit is reduced, representing a decrease of 1%. Therefore, the greening of the electricity grid has significant carbon reduction benefits for the CF of transformers. Improvements in the energy efficiency of equipment and decarbonization of the electricity system are two essential pathways for achieving deep carbon reductions.
3.2.3. Service Life of Transformer
At present, service life generally varies between 25 and 40 years [22]. The baseline scenario is set at 30 years, and scenarios of 25, 35, and 40 years are evaluated. The CF of the production phase is converted to an annual average for comparison. The results indicate that extending service life from 25 years to 40 years reduces the annual average CF of the production phase from 5175.65 kg CO2-eq/year to 3234.78 kg CO2-eq/year, a decrease of 37.5% (Figure 6c). This highlights the importance of improving material durability and product lifespan in transformer design and manufacturing to control CF from the starting point of the life cycle.
3.2.4. Transformer Total Loss
Based on the range of current standards, loss coefficient scenarios of 0.9, 0.95, 1.05, and 1.10 are set, as well as a baseline loss coefficient (set to 1), for simulation analysis [42]. The results indicate that CF during the operation stage is positively correlated with the loss coefficient (Figure 6d). When the loss coefficient decreases by 10%, the CF decreases to 23.10 kt CO2-eq/unit, representing a decrease of 10%; whereas when the loss coefficient increases by 10%, the CF increases to 28.22 kt CO2-eq/unit. This linear response relationship indicates that total power loss is the most critical factor for controlling CF during the operation phase. Even a 1% reduction can yield a carbon reduction of 0.26 kt CO2-eq/unit.
3.2.5. Energy Efficiency Levels of Transformer
To assess the carbon reduction of transformer energy efficiency improvements, a quantitative analysis of operation-stage CF at different energy efficiency levels is conducted (Figure 6e) [2]. The results indicate that energy efficiency level directly affects CF during the operation stage: the CF of a Level 1-energy-efficiency transformer is 13.63 kt CO2-eq/unit, while the CF of Level 2 and Level 3 transformers increases to 13.94 kt CO2-eq/unit and 14.80 kt CO2-eq/unit, respectively. Compared with Level 3, a Level 1-energy-efficiency transformer can reduce CF by 7.86%. Therefore, in transformer procurement and renewal decisions, prioritization of higher-energy-efficiency products is a key measure that offers notable carbon benefits across the life cycle. This provides direct quantitative evidence for implementing mandatory energy efficiency standards and policies such as old-for-new subsidies.
3.2.6. The Rate of Metal Recycling
Different recycling rate scenarios were set for key metals (copper recycling rate increased from 40% to 90%, steel recycling rate increased from 75% to 95%) [22], with results being presented in Figure 6f,g. An increased metal recycling rate has a clear positive effect on reducing CF, but carbon reduction differs substantially among materials. Although the copper recycling rate contributes to carbon reduction, its direct influence on the overall CF remains relatively limited. When the steel recycling rate increases from 75% to 95%, CF decreases markedly from −47.53 kt CO2-eq/unit to −60.21 kt CO2-eq/unit, resulting in a 26.67% reduction in CF.
3.2.7. Insulating Media
For the 10 kV transformer, scenario simulations were conducted for traditional mineral oil and bio-based vegetable oil (Figure 6h) [14]. The CF of the production stage for vegetable oil transformers is 3075.73 kg CO2-eq/unit, which is about 4.99% lower than that of mineral oil transformers (3237.43 kg CO2-eq/unit). This difference is mainly attributed to the carbon sequestration effect during raw-material cultivation and the renewable characteristics of vegetable oil during the production phase. The results suggest that replacing mineral oil with vegetable oil is a feasible technology pathway.
3.2.8. Core Material Technology Paths
To compare the CFs of transformers with different core materials, a 10 kV silicon steel sheet transformer and an amorphous alloy transformer were simulated (Figure 6i) [3]. The total CF of the amorphous alloy transformer is slightly lower than that of the silicon steel sheet transformer, with a reduction of about 3.45%. Although amorphous alloy has a slightly higher CF during the production phase, notable carbon reduction benefits are achieved during the operation phase due to lower no-load loss, accounting for 121.29% of the total difference, and the recycling benefits are better. This confirms that amorphous alloy materials, through improved operational energy efficiency, can offset the high energy consumption impact during the production phase, supporting the strategic value of investing in operational energy efficiency for long-term carbon reductions.
4. Discussion
4.1. Comparative Analysis
The results indicate that the CF of a transformer mainly originates from the operation stage, which is consistent with the conclusions of previous studies [1,4,43], further confirming that improved operational energy efficiency is the core direction for carbon reduction of transformers. In the raw-material stage, steel represents the main source of CF, accounting for 32.14% to 60.55%, followed by conductors, which aligns with the material contribution analysis reported by Li et al. [44]. During the assembly stage, electricity consumption is the major driver of CF. Gao et al. [45] reported that CF in this stage is mainly affected by energy consumption, accounting for over 90%. In the operation stage, a 10% total electricity loss reduction leads to 10% reduction in CF. Other studies have also reported that the operation stage contributes up to 98.7% of CF [9,10].
Despite the overall trend being consistent, more refined data are provided in this study for quantifying contributions. For example, during the distribution stage, it is quantified that, compared with diesel trucks, rail or sea transport can reduce transportation CF by 82.25% and 96.02%, respectively. This systematic comparison helps address gaps in previous analyses of transportation modes [3]. In terms of material recycling benefits, increasing the steel recycling rate from 75% to 95% yields a much higher carbon reduction benefit than the same increase in copper recycling rate. This finding provides quantitative evidence for prioritizing improvements in specific material recycling rates and strengthens the general qualitative descriptions of recycling processes in other studies [11].
4.2. Data Quality and Uncertainty Analysis
In order to cover various rated voltage levels of transformers as comprehensively as possible, the data utilized in this study were derived from multiple sources, including the literature and corporate surveys. This multi-source approach enhances the completeness and diversity of the dataset, while also improving the practical applicability of the findings. All CF calculations were conducted using SimaPro software version 10.2, ensuring the accuracy and consistency of the CF factors employed.
By integrating literature data and survey data, the representativeness of the analysis has been enhanced, although this also introduces some uncertainties. Nevertheless, the diversity of data sources and the integration of information have provided a more comprehensive perspective for the analysis, further improving the depth and reliability of the research. Sensitivity analyses were performed for key parameters—such as the CF factor of electricity, material recovery rates, and transportation methods—to evaluate the robustness of the results. The findings indicate that while values may shift within a reasonable range, the relative contributions and identified trends remain stable.
For certain emerging technologies, such as amorphous alloy transformers, the availability of comprehensive life cycle inventory data is presently more established at the 10 kV rated voltage. Consequently, the scenario analyses for this technology were conducted at this voltage level, where data consistency and comparability could be assured. Future research endeavors could usefully extend the data coverage for such technologies across higher rated voltage levels, thereby facilitating more systematic cross-comparisons and further refining the assessment of technology pathway options.
In addition, although amorphous alloy technology offers certain advantages in reducing no-load losses in transformers, its practical application is currently limited by high material costs and production process constraints. Particularly in high voltage transformers, the use of amorphous alloys is relatively limited, and there is currently insufficient life cycle data to accurately assess the carbon emissions. Therefore, the actual application scope and carbon reduction potential of this technology remain unclear and further research is needed to expand its application to higher voltage levels.
Regarding transportation modes, sea transport is considered to have a significant advantage in carbon reduction compared with other transport methods, especially for long-distance bulk cargo transportation. However, the carbon reduction potential of sea transport is influenced by several factors, such as transportation distance, fuel efficiency of ships, and port handling processes. In some cases, sea transport may not be the optimal choice, particularly for short-distance transport or when port handling efficiency is low. Therefore, when evaluating the carbon reduction effects of sea transport, its limitations must be considered and compared with other alternatives (such as rail or road transport) to more accurately assess its actual contribution.
4.3. Multi-Dimensional Synergistic Carbon Reduction Pathways
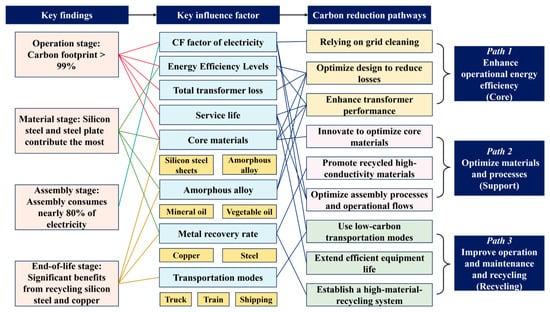
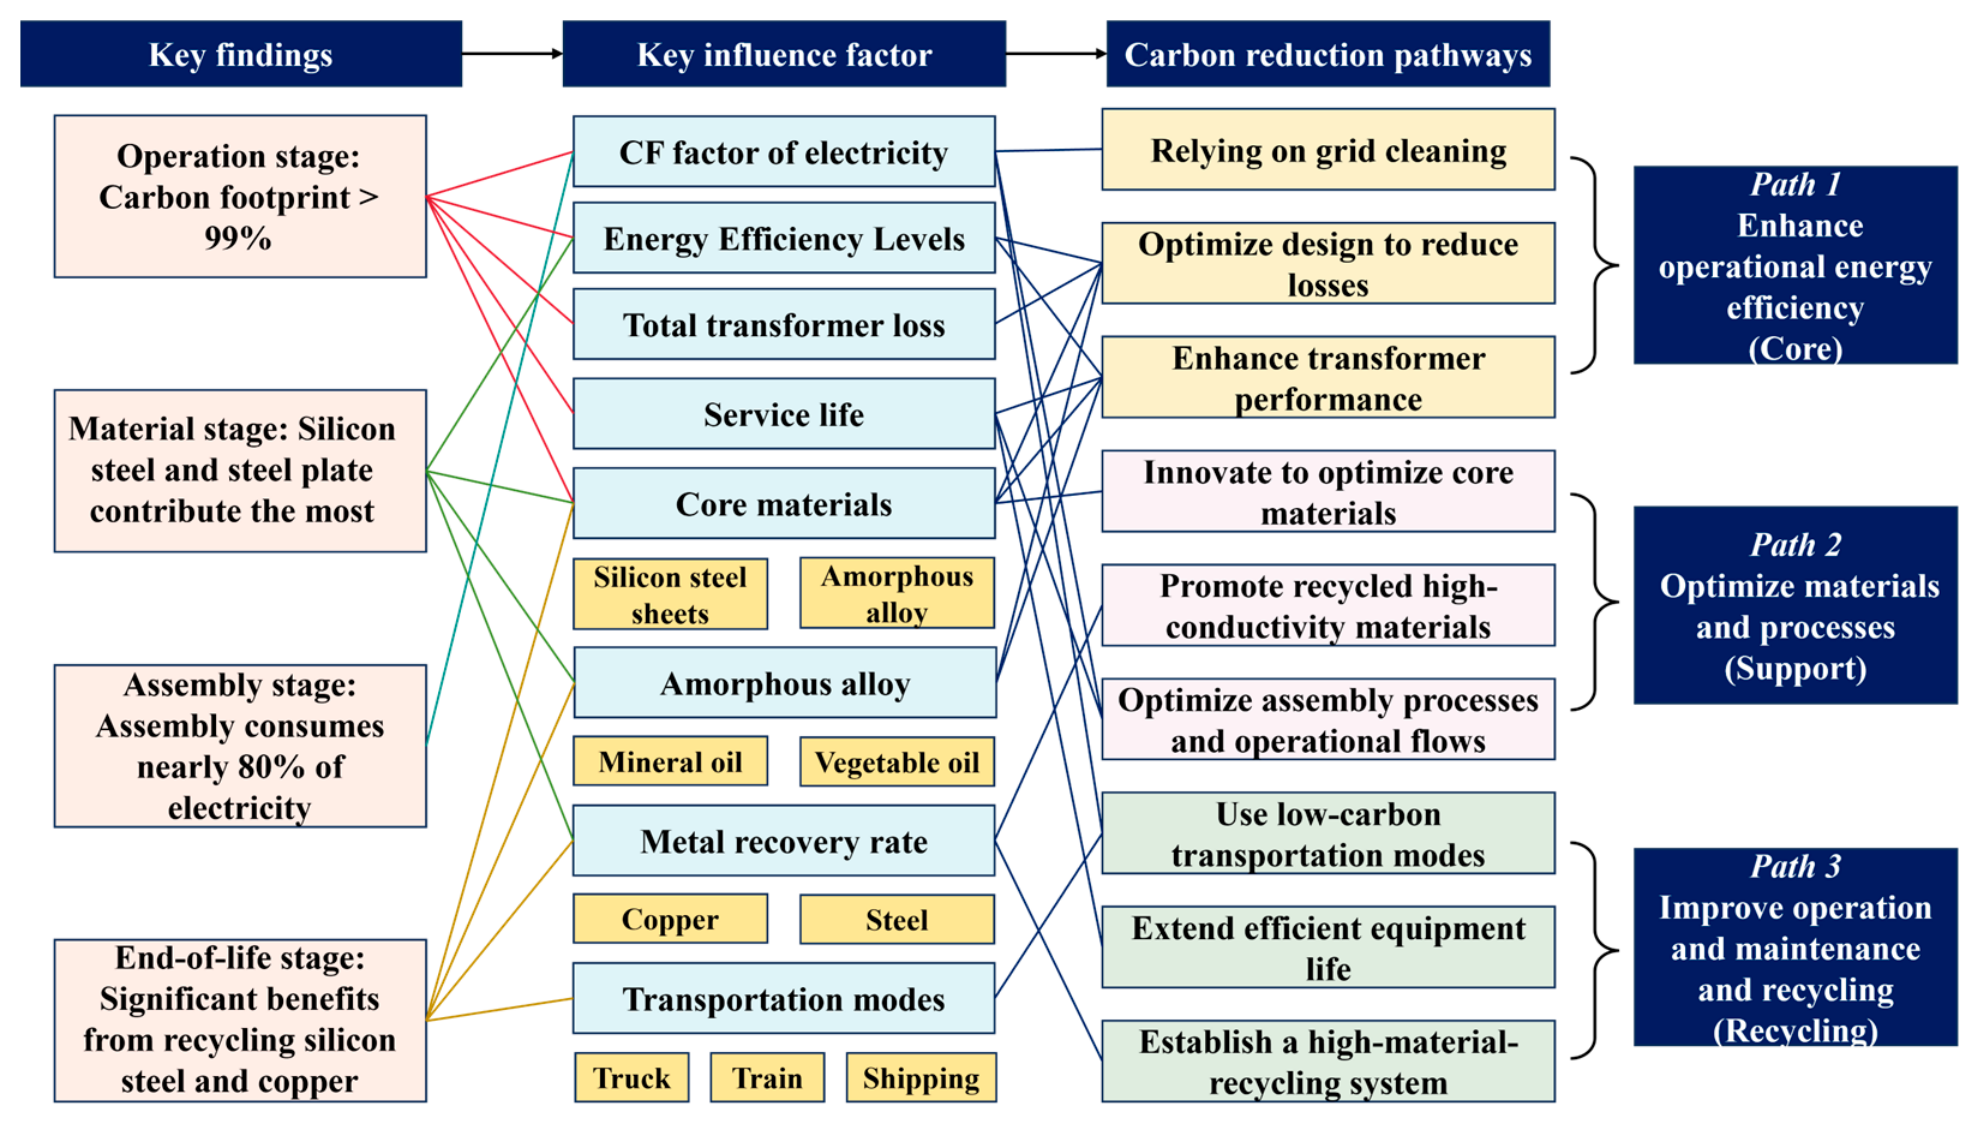
Based on the results, electricity is identified as the predominant driver of the CF of transformers. Although transportation mode optimization has a limited effect on overall CF, a certain reduction potential remains under the promotion of intermodal transportation and cleaner transportation tools. In addition, metal recycling (especially steel and copper) at end-of-life produces a significant carbon reduction benefit, and an increased recycling rate can further strengthen this benefit. The CF difference analysis for insulating media and core materials shows that vegetable oil and amorphous alloy materials present advantages in specific scenarios, but the carbon reduction magnitude and cost-effectiveness should be evaluated together with the specific application context. Based on the above analysis, this study integrates and constructs an association diagram of key impact factors and carbon reduction pathways (Figure 7), thereby systematically proposing a multi-dimensional collaborative carbon reduction pathway system, including core, supporting, and recycling measures, is derived.
Figure 7.
Correlation diagram of key impact factors of transformers and carbon reduction pathways.
Deep carbon reduction for transformers cannot be achieved through a single technological breakthrough, but requires a multi-dimensional synergistic system spanning the full process of design, manufacturing, operation, and recycling. This system is centered on achieving optimal energy efficiency as the core engine, coupled with electricity grid carbon reduction as an external driver, and supported by long-life design and efficient recycling. In this way, a key transition of the transformer industry can be promoted, shifting toward low-carbon transformation
4.4. Carbon Reduction Potential Under an Integrated Multi-Factor Scenario
To evaluate carbon reduction benefits under combined multi-factor effects and to quantify implementation outcomes of carbon reduction pathways, a 110 kV transformer is used as the baseline case. An integrated scenario incorporating multiple factors simultaneously is constructed, including the following conditions: electric trucks as the transportation mode, a 5% reduction in the CF factor of electricity, a transformer service life of 35 years, a total loss coefficient of 0.95, an increase in copper recycling rate from 40% to 50%, and an increase in steel recycling rate from 75% to 80%. The results indicate that the CF is 129.39 t CO2-eq/unit for the production stage, 1.58 t CO2-eq/unit for the distribution stage, 23.09 kt CO2-eq/unit for the operation stage, and −52.3 t CO2-eq/unit for the end-of-life stage, yielding a total CF of 23.15 kt CO2-eq/unit. Compared with the baseline scenario, this corresponds to a reduction of 2.50 kt CO2-eq/unit, representing a decrease of 9.76%.
The results indicate that the majority of emission reductions are achieved during the operation stage, particularly through reductions in power losses and the CF factor of electricity. However, while the emission reduction contributions from production, transportation, and material recycling are relatively limited, the carbon reduction measures proposed in these stages still play an important role. Specifically, measures such as technological upgrades, enhanced material recycling, and the transition to low-carbon energy not only further improve overall emission reduction but also help promote the sustainable transformation of the power equipment sector.
4.5. National Comprehensive Carbon Reduction Potential
To quantify the impact of carbon reduction pathways across the electricity industry, the CF in the operational stage of 35–1000 kV transformers in China is estimated. It is projected that by 2025, the installed capacities of transformers at different voltage levels will reach the following: 35 kV (64,886 MVA), 110 kV (287,574 MVA), 220 kV (277,424 MVA), 330 kV (17,601 MVA), 500 kV (157,639 MVA), 750 kV (22,394 MVA) and 1000 kV (17,458 MVA) [20]. Under a multi-factor carbon reduction pathway, the total CF of operational transformers at these voltage levels is estimated as follows: 27.28 Mt CO2-eq (35 kV), 132.82 Mt CO2-eq (110 kV), 101.02 Mt CO2-eq (220 kV), 6.48 Mt CO2-eq (330 kV), 28.62 Mt CO2-eq (500 kV), 7.81 Mt CO2-eq (750 kV), and 7.91 Mt CO2-eq (1000 kV). The cumulative operational CF across all voltage levels is 311.94 Mt CO2-eq, representing a 9.75% reduction relative to the baseline scenario total of 345.64 Mt CO2-eq. This substantial reduction demonstrates significant carbon reduction potential within China’s electricity grid, underscoring the international relevance of integrated strategies that combine efficiency upgrades, enhanced material recycling, and cleaner-energy adoption.
5. Conclusions
Based on the LCA method, a CF model applicable to the full range of transformers is developed in this study, and CF characteristics and eight key impact factors of transformers are systematically evaluated. Three-dimensional carbon reduction pathways are established, and the carbon reduction effectiveness of a multi-factor pathway is further investigated.
Based on the CF of a transformer, the operation stage is the absolutely dominant phase for the CF of a transformer, with electricity being the core CF source. Therefore, improvement of operational energy efficiency is the most critical pathway for CF reduction. Steel and copper are the main contributors to CF during the raw-material stage. Material selection and supply chain management exert a notable influence on CF.
From the analysis of key impact factors, optimized transportation mode and material selection, and improved material utilization can effectively reduce implicit CF. Rail and sea transport present markedly lower CF than road transport. Increased recycling rates of steel and copper can substantially enhance carbon reduction benefits. Amorphous alloy transformers can offset higher material CF through efficient operation. Vegetable oil insulating media provides certain carbon reduction advantages in transformers.
The carbon reduction efficacy of a multi-factor carbon reduction pathway is further evaluated. Implementation of the multi-factor pathway for a 110 kV transformer yields a total CF of 23.15 kt CO2-eq, representing a reduction of 9.76% compared with the baseline scenario. Under this integrated pathway, CF of operational transformer voltage levels could be reduced by 9.75%.
In conclusion, carbon reduction of transformers should establish a multi-dimensional pathway system centered on “improving operational energy efficiency, supported by material and process optimization, and strengthened by the synergy of transportation and recycling.” In future work, emphasis should be placed on promoting the application of high-efficiency transformers, strengthening green supply chain construction, and improving the waste transformer recycling system. In this way, the green and low-carbon transformation of the transformer industry can be systematically advanced, supporting the construction of long-term sustainable development of the electricity grid system.
Supplementary Materials
The following supporting information can be downloaded at: https://www.mdpi.com/article/10.3390/su18084032/s1, Table S1: Main life cycle inventory analysis for the 10 kV amorphous alloy transformers; Table S2: Main life cycle inventory analysis for the 10 kV silicon steel sheet transformers; Table S3: Main life cycle inventory analysis for the 35 kV silicon steel sheet transformers; Table S4: Main life cycle inventory analysis for the 110 kV silicon steel sheet transformers; Table S5: Main life cycle inventory analysis for the 220 kV silicon steel sheet transformers; Table S6: Main life cycle inventory analysis for the 330 kV silicon steel sheet transformers; Table S7: Main life cycle inventory analysis for the 500 kV silicon steel sheet transformers; Table S8: Main life cycle inventory analysis for the 750 kV silicon steel sheet transformers; Table S9: Main life cycle inventory analysis for the 1000 kV silicon steel sheet transformers; Table S10: Carbon emission factors adopted in the life cycle assessment of this study; Table S11: Calculation parameters for 10–1000 kV transformers during the operation stage.
Author Contributions
Supervision, Writing—original draft, L.Y.; Visualization, Investigation, Writing—review and editing, H.Z., K.W. and H.C.; Visualization, Investigation, D.Z.; Supervision, X.Z. and Y.Z.; Investigation, Supervision, N.D. All authors have read and agreed to the published version of the manuscript.
Funding
This paper is supported by the State Grid (Suzhou) City & Energy Research Institute Co., Ltd. (grant numbers SGCERI25KY040, research on Carbon Footprint Assessment Theory and Database Construction Methods for Electrical Equipment).
Institutional Review Board Statement
Not applicable.
Informed Consent Statement
Not applicable.
Data Availability Statement
The data that support the findings of this study are available from the corresponding author upon reasonable request.
Conflicts of Interest
Author Linfang Yan, Heng Zhou, Kaibin Weng, Di Zhu, Xingyang Zhu and Yong Zhou were employed by the company State Grid (Suzhou) City & Energy Research Institute Co., Ltd. The remaining authors declare that the research was conducted in the absence of any commercial or financial relationships that could be construed as a potential conflict of interest.
Abbreviations
The following abbreviations are used in this manuscript:
| CF | Carbon footprint |
| LCA | Life cycle assessment |
References
- Guo, H.; Gao, Y.; Li, J. The greenhouse gas emissions of power transformers based on life cycle analysis. Energy Rep. 2022, 8, 413–419. [Google Scholar] [CrossRef] [Scilit]
- GB 20052-2024; Minimum Allowable Values of Energy Efficiency and the Energy Efficiency Grades for Power Transformers. State Administration for Market Regulation. Standardization Administration of China: Beijing, China, 2024.
- Zhang, Y.; Zhu, C.; Wu, M.; Chen, N.; Li, T.; Ma, Y.; Tang, J. Research and analysis of carbon footprint of transformer based on full life cycle assessment. High Volt. Appar. 2024, 60, 57–67. [Google Scholar] [CrossRef]
- Wang, Y.; Zhang, H.; Zhou, E.; Xie, L.; Li, J. Carbon footprint analysis of distribution network transformers based on life cycle assessment. Energies 2025, 18, 600. [Google Scholar] [CrossRef] [Scilit]
- Piotrowski, T.; Markowska, D. Carbon footprint of power transformers evaluated through life cycle analysis. Energies 2025, 18, 1373. [Google Scholar] [CrossRef] [Scilit]
- Liu, C.; Miao, B.; Li, S.; Yu, W.; Yuan, Q.; Cao, Y.; Yu, Y.; Yang, Q. Life cycle CO2 emissions of various transformers under different scenarios with multiple functional units. Adv. Clim. Change Res. 2025, 16, 651–662. [Google Scholar] [CrossRef] [Scilit]
- Bi, Z.; Liu, Z.; Xu, Y.; Liu, Y.; Li, X. Research on carbon footprint model of transformer based on life cycle assessment. Environ. Technol. 2023, 41, 108–113. [Google Scholar] [CrossRef]
- Das, B.P.; Kablouti, G. Environmental impact assessment of transportation in distribution transformer life cycle analysis. Transform. Mag. 2023, 10, 54–65. [Google Scholar]
- ABB. Environmental Product Declaration: Large Distribution Transformer 10 MVA (ONAN). Certified Environmental Product Declaration S-P-00055; ABB T&D S.p.A: Monselice, Italy, 2003; Available online: https://library.e.abb.com/public/57c1d5721712c65fc1256de9003d9401/10%20MVA.pdf (accessed on 5 January 2026).
- ABB. Environmental Product Declaration: Large Distribution Transformer 16/20 Mva (ONAN). Certified Environmental Product Declaration S-P-00056; ABB T&D S.p.A: Monselice, Italy, 2003; Available online: https://library.e.abb.com/public/f9d61dec5a651b81c1256de9003e870d/16-20%20MVA.pdf (accessed on 5 January 2026).
- Xu, J. Exploration on the carbon footprint of the full life cycle of grain-oriented silicon steel and its transformer. Electr. Steel 2023, 5, 1–4. [Google Scholar]
- Carlen, M.; Överstam, U.; Ramanan, V.R.V.; Tepper, J.; Swanström, L.; Klys, P.; Stryken, E. Life cycle assessment of dry-type and oil-immersed distribution transformers with amorphous metal core. In Proceedings of the 21st International Conference on Electricity Distribution, Frankfurt, Germany, 6–9 June 2011. [Google Scholar]
- Dotelli, G.; Viganò, E.; Pertot, C.; Reboldi, R. A case study of green design in electrical engineering: An integrated LCA/LCC analysis of an Italian manufactured HV/MV power transformer. In Life Cycle Thinking in Decision-Making for Sustainability: From Public Policies to Private Businesses; ENEA-Agenzia Nazionale per le Nuove Tecnologie, L’energia e lo Sviluppo Economico Sostenibile: Roma, Italy, 2018; pp. 112–119. [Google Scholar]
- Hitachi Energy Italy S.p.A. Environmental Product Declaration: Mineral and Vegetable Oil Immersed Transformers (40 MVA). Certified Environmental Product Declaration EPD-GST002-40MVA-01; Hitachi Energy Italy Spa: Monselice, Italy, 2022; Available online: https://www.epditaly.it (accessed on 5 January 2026).
- Burger Mansilha, M.; Brondani, M.; Farret, F.A.; Cantorski da Rosa, L.; Hoffmann, R. Life cycle assessment of electrical distribution transformers: Comparative study between aluminum and copper coils. Environ. Eng. Sci. 2019, 36, 114–135. [Google Scholar] [CrossRef] [Scilit]
- Serres, H. Life Cycle Assessment of Typical Projects of the Distribution power network: Assessment, Improvement & Recommendations. Master’s Thesis, KTH Royal Institute of Technology, Stockholm, Sweden, 2022; 338p. [Google Scholar]
- Ding, H.; Li, M.; Yuan, Y. Research on evaluation model of high-end transformer machining process based on green manufacturing. Modul. Mach. Tool Autom. Manuf. Tech. 2019, 08, 157–160. [Google Scholar] [CrossRef]
- Xu, F.; Gu, X.; Ji, Y.; Qi, G. The method of product conceptual design based on low-carbon constraint. J. Mech. Eng. 2013, 49, 58–65. [Google Scholar] [CrossRef] [Scilit]
- Lu, F.; Zhang, L.; Lu, Y.; Huang, Z. Transformer carbon emission measurement, evaluation research framework and application prospect based on whole process chain of power grid. Hubei Electr. Power 2022, 46, 113–119. [Google Scholar] [CrossRef]
- Zhao, S.; Chen, Y.; Yang, J.; Ding, N. Integrated multi-dimensional assessment of red mud recycling technologies: Insights from industrial waste treatment and life-cycle management. J. Environ. Chem. Eng. 2024, 12, 114052. [Google Scholar] [CrossRef] [Scilit]
- Bai, D.; Wang, X.; Yang, Z.; Fu, Y.; Wang, C. Study on full life circle assessment system of green e&m equipment in civil buildings. Archit. Electr. 2023, 42, 20–23. [Google Scholar] [CrossRef]
- Ding, N.; Cui, H.; Gao, M.; Chen, Q.; Zhao, S.; Zhuo, R. Assessment of the resource recovery potential, pollution control, and carbon reduction effects of waste transformers. Resour. Conserv. Recycl. 2026, 227, 108704. [Google Scholar] [CrossRef] [Scilit]
- GB/T 40093-2021; Life Cycle Assessment Method for Transformer. Standards Press of China: Beijing, China, 2021.
- Bai, R.; Cai, G.; Chen, Y.; Chen, X.; Gao, L.; Nie, S.; Wang, W.; Liu, G. The material implications and embodied emissions of clean power transition in Guangdong, China from 1978 to 2050. J. Clean. Prod. 2023, 422, 138512. [Google Scholar] [CrossRef] [Scilit]
- Li, C.; Zhou, W.; Wu, H.; Zhou, Z.; Ding, L. Recycling of power grid waste: Carbon footprint of cables and transformers. J. Phys. Conf. Ser. 2025, 2956, 012032. [Google Scholar] [CrossRef] [Scilit]
- Martin, M.; Devaux, F. End of life management of high-voltage transformers. In Proceedings of the MELECON 2008—The 14th IEEE Mediterranean Electrotechnical Conference, Ajaccio, France, 5–7 May 2008; pp. 700–706. [Google Scholar] [CrossRef] [Scilit]
- Zhang, L.; Wu, S.; Lu, H. Secondary recycling and utilization of transformers. Electron. Prod. 2021, 14, 64–65+60. [Google Scholar] [CrossRef]
- Wang, T.; Yue, B.; Meng, B.; Liu, B.; Gao, H. A life cycle assessment of secondary copper production. Environ. Eng. 2024, 42, 225–232. [Google Scholar] [CrossRef]
- Na, H.; Qiu, Z.; Sun, J.; Yuan, Y.; Zhang, L.; Du, T. Revealing cradle-to-gate CO2 emissions for steel product producing by different technological pathways based on material flow analysis. Resour. Conserv. Recycl. 2024, 203, 107416. [Google Scholar] [CrossRef] [Scilit]
- Ding, N.; Gao, F.; Wang, Z.; Gong, X. Comparative analysis of primary aluminum and recycled aluminum on energy consumption and greenhouse gas emission. Chin. J. Nonferrous Met. 2012, 22, 2908–2915. [Google Scholar]
- Burchart-Korol, D. Life cycle assessment of steel production in Poland: A case study. J. Clean. Prod. 2013, 54, 235–243. [Google Scholar] [CrossRef] [Scilit]
- Ding, N.; Liu, J.; Kong, Z.; Yan, L.; Yang, J. Life cycle greenhouse gas emissions of Chinese urban household consumption based on process life cycle assessment: Exploring the critical influencing factors. J. Clean. Prod. 2019, 210, 898–906. [Google Scholar] [CrossRef] [Scilit]
- Ding, N.; Liu, J.; Yang, J.; Yang, D. Comparative life cycle assessment of regional electricity supplies in China. Resour. Conserv. Recycl. 2017, 119, 47–59. [Google Scholar] [CrossRef] [Scilit]
- Ding, N.; Pan, J.; Zhang, Z.; Yang, J. Life cycle assessment of car sharing models and the effect on GWP of urban transportation: A case study of Beijing. Sci. Total Environ. 2019, 688, 1137–1144. [Google Scholar] [CrossRef] [Scilit] [PubMed]
- Luo, X.; Ding, N.; Yang, J.; Lu, B.; Ma, J. Potential environmental benefits assessment of recycling based on multi-LCA and SFA. J. Clean. Prod. 2024, 457, 142370. [Google Scholar] [CrossRef] [Scilit]
- Zhang, Z.; Sun, X.; Ding, N.; Yang, J. Life cycle environmental assessment of charging infrastructure for electric vehicles in China. J. Clean. Prod. 2019, 227, 932–941. [Google Scholar] [CrossRef] [Scilit]
- Zhao, S.; Xin, C.; Chen, H.; Jiang, X.; Yu, Z.; Wang, S.; Zhang, R. Low-carbon evaluation system and solution optimization of transmission and transformation project based on AHP-EWM. Guangdong Electr. Power 2024, 37, 8–17. [Google Scholar] [CrossRef]
- Chen, Y.; Xie, W.; Yu, X.; Wu, C. Optimization index analysis of UHV converter transformer design based on low carbon economy. In Proceedings of the 2021 8th International Forum on Electrical Engineering and Automation, Xi’an, China, 3–5 September 2021; pp. 293–297. [Google Scholar]
- Zheng, H.; Wang, D.; Fang, L. A new carbon footprint analysis model of mechanical and electrical products from the perspective of life cycle assessment. J. Tianjin Univ. Sci. Technol. 2017, 32, 65–72. [Google Scholar] [CrossRef]
- Xu, X.; Xu, X.; Li, S.; Zhang, X.; Xu, Z.; Ma, T.; Guo, W.; Xiong, Z. Simulation and optimization of hybrid renewable energy system to achieve a net-zero and flexible-interconnected service area for highways. Energy Sustain. Dev. 2025, 87, 101740. [Google Scholar] [CrossRef] [Scilit]
- Ministry of Ecology and Environment, National Bureau of Statistics, National Energy Administration. Announcement on the Release of the 2024 National Electricity Carbon Footprint Factor Data. 2025. Available online: https://www.mee.gov.cn/xxgk2018/xxgk/xxgk01/202510/t20251024_1130734.html (accessed on 5 January 2026).
- GB/T 6451-2023; Technical Parameters and Requirements for Oil-Immersed Power Transformers. State Administration for Market Regulation. Standardization Administration of China: Beijing, China, 2023.
- Li, S.; Jiang, Y.; Yi, J.; Miao, B.; Liu, C.; Ling, Z.; Zhang, G. Life cycle carbon emissions and mitigation strategies of electrical equipment: A comprehensive review. Processes 2026, 14, 40. [Google Scholar] [CrossRef] [Scilit]
- Li, S.; Liu, C.; Jiang, J.; Zhang, F.; Li, J. Research on carbon footprint model of transformer products based on life cycle. In Proceedings of the 2024 2nd International Conference on Mechatronics, IoT and Industrial Informatics (ICMIII), Melbourne, Australia, 12–14 June 2024; pp. 40–46. [Google Scholar] [CrossRef] [Scilit]
- Gao, M.; Fu, M.; Zhuo, R.; Jia, L.; La, Y.; Zhong, L. Carbon footprint of power transformer by life cycle assessment. In Proceedings of the 2022 IEEE International Conference on High Voltage Engineering and Applications (ICHVE), Chongqing, China, 25–29 September 2022; pp. 1–4. [Google Scholar] [CrossRef] [Scilit]

Disclaimer/Publisher’s Note: The statements, opinions and data contained in all publications are solely those of the individual author(s) and contributor(s) and not of MDPI and/or the editor(s). MDPI and/or the editor(s) disclaim responsibility for any injury to people or property resulting from any ideas, methods, instructions or products referred to in the content. |
© 2026 by the authors. Licensee MDPI, Basel, Switzerland. This article is an open access article distributed under the terms and conditions of the Creative Commons Attribution (CC BY) license.