


Abstract
Accurate wind power forecasting is essential for efficient wind farm operation and reliable grid dispatch. This study proposes a site-adaptive forecasting framework that integrates machine learning, Tree-structured Parzen Estimator (TPE)-based Bayesian hyperparameter optimization, and SHapley Additive exPlanations (SHAP) for interpretability. Using real-world meteorological and power generation data from two wind farms, we first perform joint-distribution feature analysis to characterize statistical relationships between key inputs and power output, supporting model development and interpretation. TPE optimization is then applied to six benchmark models (CatBoost, Extra Trees, GBM, LightGBM, TabNet, and XGBoost). The optimized Extra Trees model achieves the best performance at Site 1 (R2 = 0.965, RMSE = 3.872 kW, MAE = 2.333 kW), whereas the optimized XGBoost model performs best at Site 2 (R2 = 0.921, RMSE = 3.049 kW, MAE = 1.382 kW), demonstrating the effectiveness of TPE tuning and the strong predictive capability of tree-ensemble learners. SHAP analysis further reveals heterogeneous drivers across sites: Site 1 benefits from synergistic wind-speed contributions across multiple heights, while Site 2 is primarily governed by hub-height wind speed. Overall, the proposed framework achieves both high accuracy and robust interpretability for multi-site wind power forecasting.
1. Introduction
Amid the ongoing transition toward low-carbon energy systems, wind power—an abundant and emissions-free renewable resource—has become an increasingly important contributor to electricity generation worldwide. Accordingly, its installed capacity and penetration in modern power systems have grown rapidly in recent years [1,2]. However, wind resources are inherently intermittent and highly variable, leading to substantial uncertainty in wind power output. Such uncertainty complicates system balancing and reserve scheduling, poses challenges to secure and reliable grid operation [3,4,5], and can reduce the efficiency of wind power integration and utilization. Consequently, wind power forecasting methods with high accuracy and strong robustness are essential for supporting operational decision-making, improving resource allocation and dispatch efficiency, and enhancing the techno-economic performance of wind energy systems [6,7,8]. These capabilities are therefore of both scientific and practical importance for enabling large-scale wind power deployment.
From the standpoint of energy transition, accurate wind power forecasting is a key enabler for integrating higher shares of variable renewable energy into power systems. Scenario analyses by the International Energy Agency (IEA) suggest that, toward 2050, wind power—together with solar photovoltaics—will account for an increasing proportion of global electricity generation, progressively displacing conventional fossil-based sources [9]. Achieving such trajectories requires forecasting capabilities that are both accurate and operationally reliable. From a system-operation perspective, improved wind power forecasts support day-ahead and intra-day scheduling decisions, including unit commitment, reserve procurement, energy storage dispatch, and inter-regional power exchanges. These functions help mitigate the operational impacts of wind variability and uncertainty, thereby enhancing overall system reliability and stability [10]. From an economic perspective, reliable forecasts facilitate optimized wind farm operation and maintenance planning, reduce imbalance and balancing costs, and improve market participation strategies, ultimately strengthening the competitiveness of wind power in electricity markets and increasing operator revenues [11,12]. In addition, wind resource assessment and wind farm planning can also benefit from modeling tools that characterize site-specific production patterns [13].
Wind power forecasting methods have evolved from traditional statistical techniques to increasingly data-driven and intelligent approaches. Early studies predominantly employed physics-based and statistical models. Physics-based approaches, typically built upon atmospheric dynamics and turbine aerodynamics, integrate numerical weather prediction (NWP) outputs with site-specific information (e.g., terrain and surface characteristics) to produce power forecasts. Although these models offer clear physical interpretability, they often require substantial modeling effort and computational resources, and their performance can be sensitive to the quality of NWP inputs and local micro-meteorological effects, which may limit their effectiveness for short-term applications [14,15]. In contrast, statistical models—such as autoregressive integrated moving average (ARIMA), Kalman filtering, and exponential smoothing—forecast power by exploiting temporal dependencies in historical observations. These methods are generally simple to implement and computationally efficient; however, their capacity to represent complex nonlinear interactions between wind power and multiple driving variables is limited. As a result, their accuracy may deteriorate under highly variable or rapidly changing meteorological conditions [16].
With advances in artificial intelligence, machine learning (ML) has been increasingly adopted for wind power forecasting because of its ability to learn nonlinear mappings and capture complex dependencies from data, often yielding improved predictive performance compared with conventional statistical models [17]. The methodological landscape has progressed from early support vector machines and feedforward neural networks to more recent ensemble learners and modern tabular-data architectures that incorporate attention mechanisms, reflecting a steady evolution in modeling capacity and forecasting accuracy [18,19]. For example, Zhang et al. developed a bidirectional LSTM ensemble framework with joint metaheuristic optimization (Sparrow Search and Firefly algorithms) for feature selection and hyperparameter tuning, reporting notable gains in forecasting accuracy and computational efficiency on their experimental setup [20]. Abdulaziz and Omar proposed an interval forecasting approach that integrates lower–upper bound estimation (LUBE) with LSTM, and further incorporates fuzzy-set concepts and collective decision optimization to adaptively adjust model parameters, thereby improving the sharpness and coverage of prediction intervals and enabling uncertainty quantification [21]. Hybrid strategies have also been explored. Krevnevičiūtė et al. reported competitive performance using an LTC + XGBoost hybrid model [22], while Salcedo-Sanz et al. combined wavelet transforms with neural networks to better represent nonstationary and multi-scale temporal patterns [23]. Overall, ML-based methods can exploit richer feature representations and nonlinear interactions in multi-source data, offering a practical complement to traditional approaches when modeling wind power under complex and rapidly varying meteorological conditions [24].
Despite the progress in machine learning-based wind power forecasting, several methodological gaps remain that may limit reproducibility, model transferability across sites, and practical deployment. First, systematic model benchmarking is often insufficient. Many studies evaluate one or a small set of models under specific datasets and settings, while comprehensive comparisons across heterogeneous model families and architectures are less common. This makes it challenging to derive generalizable guidance on model selection for different operating conditions and application requirements [25]. Second, hyperparameter tuning is frequently under-explored or conducted with limited efficiency. Forecasting performance can be sensitive to hyperparameter choices, yet conventional strategies such as grid search and random search are typically computationally expensive and may provide limited coverage of the search space, especially for high-dimensional configurations [26,27]. Although recent efforts have investigated more advanced optimization strategies, their scope is often restricted—for example, Bergstra et al. focused on deep-learning-oriented tuning without spanning diverse ML model classes [28]; Guan et al. adopted TPE for wind power forecasting but within a single model architecture [29]; and Lu et al. highlighted the need for more systematic evaluation of meta-heuristic approaches for hyperparameter optimization in this domain [30]. Third, model interpretability remains an active challenge. Many ML predictors operate as “black boxes,” offering limited insight into how input variables drive the forecasts. SHAP has been introduced to improve post hoc explanation in wind power forecasting (e.g., Khattak et al. [31]), supported by the Shapley-value-based theoretical framework formalized by Lundberg et al. [32]. Nevertheless, broader validation of explanation consistency and practical interpretability under varying sites and conditions is still needed. In addition, automated modeling techniques such as neural architecture search (NAS) are increasingly studied in related fields, but their application to wind power forecasting is still at an early stage, and mature solutions for multi-model, multi-site adaptation have yet to be established [33,34,35].
The current research frameworks for wind power forecasting still leave substantial room for improvement in terms of the comprehensive alignment between systematic technical design and engineering applications, representing a key motivation for this study. Existing work primarily focuses on enhancing the performance of individual models, typically emphasizing deep learning architectures such as LSTM and Transformer or single tree-ensemble models [36,37]. While these approaches can achieve modest improvements in predictive accuracy under specific datasets and scenarios, the lack of unified cross-architecture comparison and multi-site adaptability assessments often precludes the establishment of transferable model-selection criteria for different wind farm sites. Some studies have attempted to integrate efficient hyperparameter optimization strategies into wind power forecasting. However, their applicability remains limited, as most approaches focus exclusively on parameter tuning for a single model category (e.g., only deep learning models or a single tree-ensemble model). A systematic optimization workflow encompassing multiple machine learning models has yet to be developed, thereby constraining the full realization of the performance potential of diverse models [38]. A limited number of studies have adopted interpretability tools such as SHAP to partially address the “black-box” issue of machine learning models. Nevertheless, interpretability analysis is rarely integrated within a collaborative framework alongside hyperparameter optimization and multi-model adaptation [39,40]. Moreover, existing studies seldom consider the physical consistency of power output driving mechanisms across multiple sites, limiting their ability to provide mechanistically informed guidance for multi-wind-farm forecasting. Overall, current research has yet to deliver a unified framework that simultaneously integrates multi-model selection, efficient hyperparameter optimization, and physically interpretable outputs, thereby addressing the comprehensive engineering requirements for practical deployment [41].
The wind power forecasting framework proposed in this study integrates Tree-structured Parzen Estimator (TPE)-based hyperparameter optimization with model interpretability analysis. By exploiting the high training and inference efficiency of ensemble learning models, the proposed framework satisfies the practical requirements of real-time wind power forecasting in engineering applications [42,43]. The incorporation of TPE significantly improves hyperparameter search efficiency and facilitates rapid convergence toward near-optimal solutions. Meanwhile, SHAP-based interpretability analysis, combined with the physical characteristics of wind power generation, mitigates the black-box nature of the model and enhances the reliability and engineering credibility of the forecasting results [44]. Furthermore, the framework enables site-specific personalized modeling according to the characteristics of different wind farms, thereby demonstrating strong adaptability in multi-site forecasting scenarios [45]. Despite these advantages, several limitations should be acknowledged. First, compared with deep learning approaches such as LSTM and Transformer, the proposed framework exhibits a relatively limited capability in capturing highly complex nonlinear relationships in ultra-long-term forecasting tasks [46,47]. Second, the predictive performance of the model is strongly dependent on the quality and completeness of the observed data, and substantial missing values may lead to a deterioration in forecasting accuracy [48]. In addition, the current framework does not explicitly consider abrupt disturbances induced by extreme weather events, and thus its robustness under such extreme operating conditions remains to be further improved [49]. In general, existing wind power forecasting methods still face challenges in simultaneously achieving lightweight engineering deployment, multi-site adaptability, and physical interpretability. The proposed framework helps address this gap and provides a cost-effective and reliable solution for accurate wind power forecasting across multiple wind farms.
Building on the above context, this study develops a wind power forecasting framework that integrates TPE-based hyperparameter optimization with model interpretability analysis. The main contributions are threefold:
- (1)
- Comprehensive benchmarking across diverse model families. We construct a unified modeling suite covering both widely used and emerging architectures, including five ensemble learners (XGBoost, LightGBM, CatBoost, GBM, and Extra Trees) and one attention-based tabular model (TabNet). Through systematic comparative experiments, the framework provides empirical evidence on performance differences across models and offers practical guidance for model selection under different forecasting settings.
- (2)
- Unified TPE optimization for multiple models. We apply the Tree-structured Parzen Estimator (TPE) in a consistent manner to tune the hyperparameters of all six models. By leveraging probabilistic surrogate modeling, TPE enables more efficient exploration of the hyperparameter space than conventional search strategies, leading to improved forecasting performance under comparable evaluation protocols.
- (3)
- Interpretable analysis for feature-driven insights. We establish an explainability workflow for wind power forecasting to analyze model behavior and quantify feature contributions. This approach provides insights into the factors driving predictions and supports more transparent decision-making, thereby alleviating the “black-box” concern commonly associated with ML-based forecasting models.
The remainder of this paper is organized as follows. Section 2 presents the overall technical framework for wind power forecasting. Section 3 describes the theoretical foundations of wind power forecasting, machine learning modeling, TPE-based hyperparameter optimization, and SHAP-based interpretability analysis. Section 4 introduces the experimental datasets, details the preprocessing procedures, and analyzes the joint distributions of key variables. Section 5 validates the effectiveness of TPE optimization through comparative experiments, evaluates the predictive performance of different models, and provides interpretability analyses. Finally, Section 6 summarizes the main findings and practical implications, and outlines directions for future research.
2. Methodological Framework
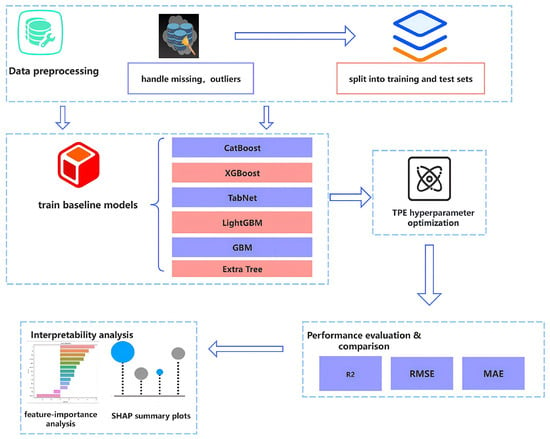
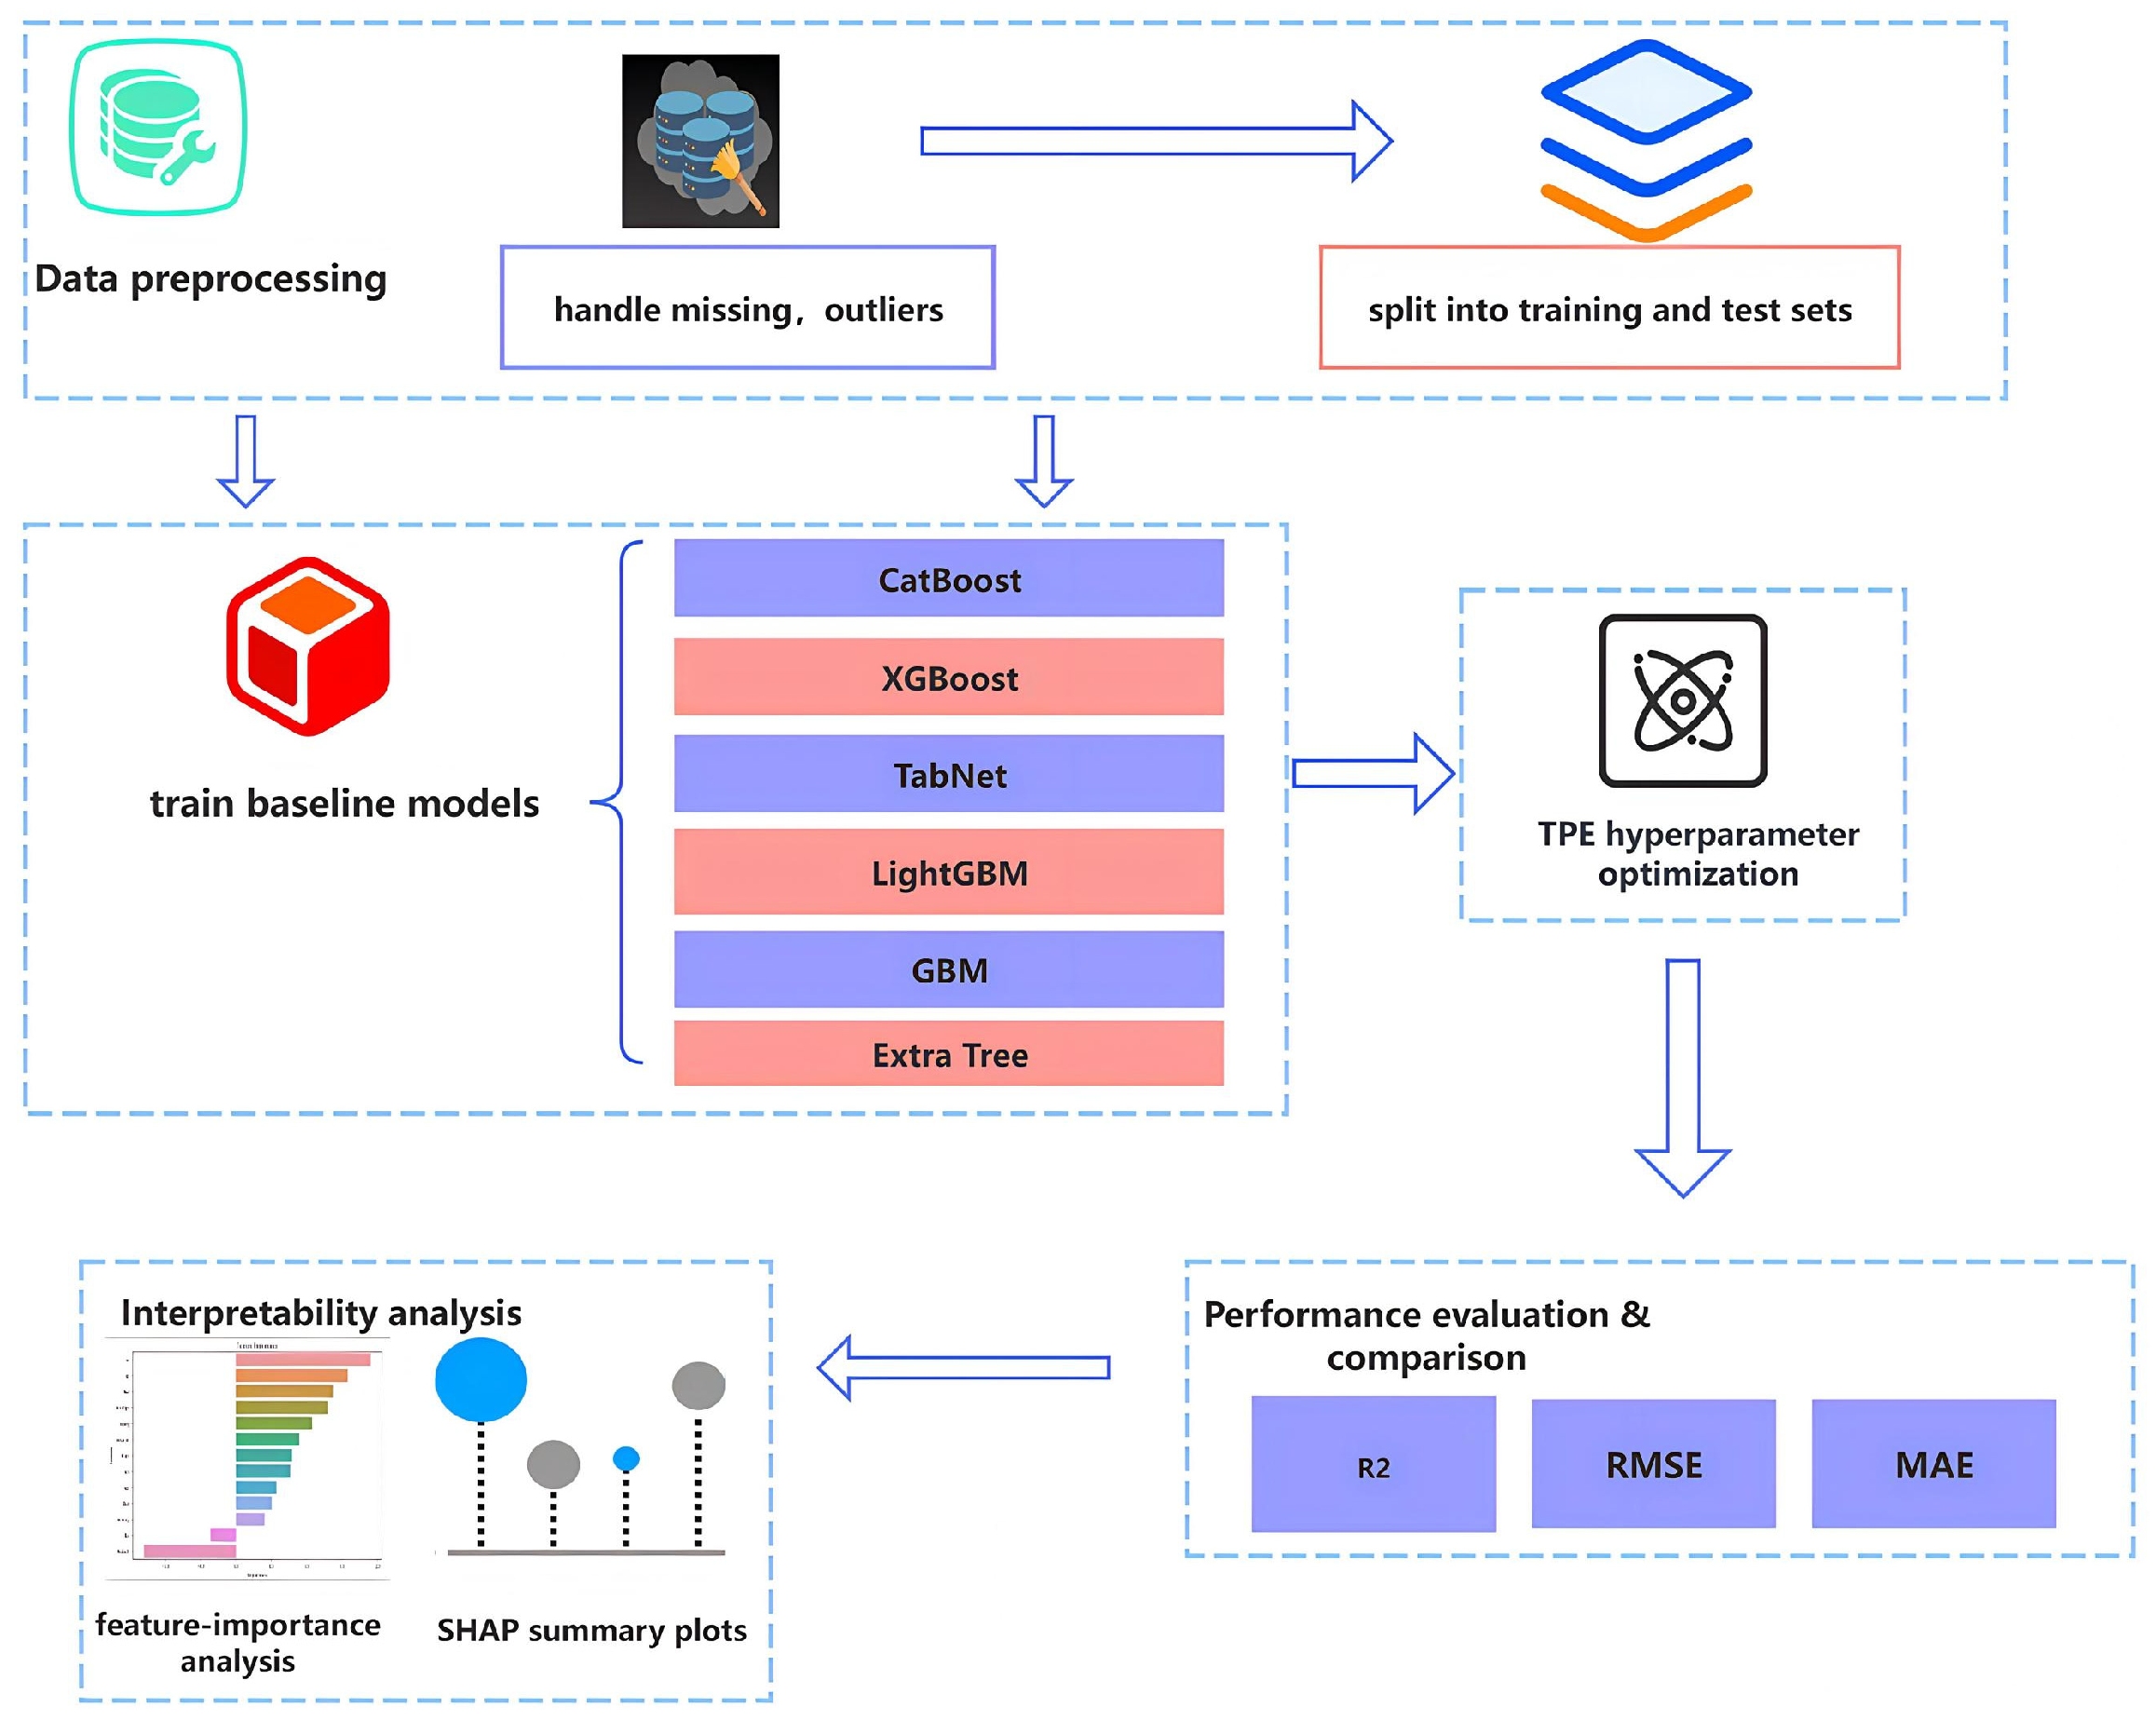
This study develops a wind power forecasting framework that integrates TPE-based hyperparameter optimization with post hoc interpretability analysis. At the data layer, joint-distribution analysis is conducted on raw wind farm monitoring records to characterize the statistical relationships and data structure linking key predictors to power output, thereby informing subsequent modeling and interpretation. At the modeling layer, six baseline learners—CatBoost, XGBoost, Extra Trees, TabNet, GBM, and LightGBM—are trained, after which the Tree-structured Parzen Estimator (TPE) is applied to tune model hyperparameters and obtain optimized configurations for each learner. All tuned models are then evaluated and benchmarked on a held-out test set using the coefficient of determination (R2), root mean square error (RMSE), and mean absolute error (MAE), and the best-performing model is selected according to these metrics. Finally, interpretability analysis is performed for the selected model. By combining global feature-importance rankings with SHAP summary plots, we quantify the contributions of key features, including their directional effects and relative influence on the predicted power output. This workflow provides a transparent account of model behavior and supports consistency checks between predictive performance and feature-driven explanations (Figure 1).
Figure 1.
Overall Framework.
3. Methodology
3.1. Wind Power Forecasting
The core objective of wind power forecasting is to learn an accurate nonlinear mapping from meteorological conditions to power output. Forecasting performance depends on how well the model captures the underlying wind energy conversion process and the key factors that govern power production. In a wind turbine, energy conversion can be viewed as a staged transformation from kinetic energy in the wind to mechanical power and ultimately to electrical power. Under the classical actuator-disk formulation (often referred to as Betz theory), the extracted mechanical power can be expressed as:
where denotes the air density, which is influenced by ambient temperature, pressure, and humidity; is the rotor swept area; is the wind speed at hub height; and is the power coefficient.
In practical engineering applications, wind turbine power output P is constrained by the physical characteristics of the unit and typically exhibits a representative S-shaped curve. Specifically, when the wind speed is below the cut-in speed , the output power is 0; when lies between the cut-in speed and the rated wind speed , the power increases approximately with the cube of wind speed; once exceeds , the turbine maintains the rated power by adjusting the blade pitch angle; and when reaches the cut-out speed , shutdown protection is triggered. Moreover, the stochastic nature of wind speed, together with dynamic variations in air density and the power coefficient , causes wind power output to exhibit pronounced nonlinearity and non-stationarity, which constitutes a central challenge for accurate forecasting.
Improving forecasting accuracy requires quantifying several interacting drivers that influence wind power output. From a meteorological perspective, wind speed and wind direction are primary forcing variables; air density affects the available wind energy and conversion efficiency; and turbulence intensity can amplify short-term power variability. From a geographical perspective, complex terrain, surface roughness, and wake interactions modify the local wind field, thereby shaping the production of wind farm clusters. From an operational perspective, turbine conditions (e.g., faults or derating) and curtailment instructions may cause actual output to depart from the idealized power curve, introducing additional forecasting uncertainty and error.
Wind power forecasting is commonly classified by prediction horizon, with each time scale corresponding to distinct operational needs and modeling requirements. Ultra-short-term forecasting (seconds to ~15 min) is primarily used for real-time control and ancillary services (e.g., frequency regulation) and is often driven by high-resolution historical measurements. Short-term forecasting (~15 min to 4 h) supports operational scheduling decisions such as ramp management and market participation; it typically benefits from combining numerical weather prediction (NWP) information with recent historical data and remains a major focus of current research. Medium-term forecasting (4–72 h) is relevant for maintenance planning and system scheduling over longer horizons and is more strongly influenced by the quality of NWP inputs. Long-term forecasting (months to years) is mainly used for wind resource assessment, site evaluation, and investment analysis, and is generally based on long-term climatological statistics. This paper concentrates on short-term forecasting and investigates machine learning models that fuse multi-source inputs to better capture nonlinear relationships, with the goal of supporting dispatch decision-making and improving the operational efficiency of wind power integration.
3.2. Model Selection Criteria and Scope
In this study, CatBoost, XGBoost, LightGBM, GBM, Extra Trees, and TabNet were selected as benchmark models based on a comprehensive consideration of data characteristics and engineering application requirements. Inputs for wind power forecasting typically consist of multidimensional meteorological observations and historical power outputs, which are essentially organized as time-indexed tabular data without explicit spatial grid structures. For such structured data, tree-based ensemble models have established a solid foundation in engineering applications, as they are capable of effectively capturing nonlinear relationships and feature interactions while maintaining high training and inference efficiency and relatively stable hyperparameter optimization performance. In addition, TabNet, as an attention-based architecture specifically designed for tabular learning, was introduced to complement the representation of non-tree-based methods in tabular prediction tasks, thereby enabling a unified benchmark comparison across different modeling paradigms.
This study did not further extend the comparison to other commonly used learning paradigms, primarily due to considerations of engineering practicality and reproducibility that are consistent with the objectives of this work. For example, convolutional neural networks (CNNs) are generally more suitable for data with explicit spatial structures or local neighborhood dependencies. When applied to tabular time-series scenarios, CNN-based approaches often require additional time-window construction, together with dedicated network architecture design and hyperparameter tuning. Such requirements would not only increase modeling flexibility and experimental complexity, but also introduce greater computational overhead, thereby weakening the emphasis of this study on lightweight deployment and unified benchmark evaluation. Similarly, support vector machines (SVMs), particularly kernel-based variants, often entail substantially higher training and tuning costs when dealing with relatively large sample sizes or high-dimensional features, and their predictive performance is highly sensitive to kernel selection and parameter configuration. Moreover, if model-agnostic interpretability methods were employed for feature attribution, the associated computational burden could be further increased. For these reasons, the present work focuses on model families that are more suitable for structured tabular data, more amenable to systematic comparison under a unified experimental protocol, and naturally compatible with the TPE-based hyperparameter optimization and SHAP-based interpretability framework. This strategy helps ensure the reproducibility of the evaluation results and the practical feasibility of engineering deployment.
3.3. TPE Hyperparameter Optimization
TPE (Tree-structured Parzen Estimator) is a Bayesian optimization method for efficient hyperparameter tuning. Unlike exhaustive grid search or uninformed random search, TPE builds a probabilistic surrogate model that characterizes the relationship between hyperparameter configurations and an objective metric. It then updates the sampling distribution based on previously evaluated trials, biasing future proposals toward regions of the search space that are more likely to yield improved performance. This strategy can substantially improve search efficiency under limited computational budgets.
The core idea of the TPE algorithm is based on nonparametric density estimation. It partitions the historical hyperparameter trials according to model performance, measured by the objective value, into a “good” set with superior performance and a “bad” set with inferior performance. Two separate density models, commonly implemented using Gaussian mixture models (GMM) or kernel density estimators (KDE), are then fitted to these two sets, yielding the conditional distributions and . The optimization objective of TPE is to maximize the ratio of these posterior probabilities, given by:
In this expression, denotes the expected improvement criterion, which measures how likely a candidate hyperparameter configuration is to yield an objective value better than a specified threshold, based on the fitted density models. At each iteration, TPE proposes configurations that maximize this criterion and evaluates them, thereby steering the search toward regions of the hyperparameter space that are more likely to produce improved performance.
During sampling, candidate hyperparameter configurations can be generated from the fitted posterior density using Markov chain Monte Carlo techniques, such as the Metropolis–Hastings algorithm. The corresponding acceptance probability is given by:
In this expression, denotes the newly proposed hyperparameter configuration, is the current configuration, and is the acceptance probability. This acceptance rule favors proposals that improve the objective value, while still allowing occasional acceptance of inferior proposals with nonzero probability. Such a mechanism helps maintain exploration and can reduce the risk of premature convergence during the search process.
3.4. SHAP-Based Interpretability Method
Model interpretability analysis seeks to quantify and visualize how input features contribute to a model’s predictions. In wind power forecasting, where outputs are governed by complex physical processes and multi-source data are often fused, interpretability can provide insight into the drivers of model behavior and support plausibility checks against known wind energy conversion mechanisms, thereby improving confidence in the forecasting results. SHAP (SHapley Additive exPlanations) is a widely used post hoc interpretability framework grounded in Shapley values from cooperative game theory. It attributes to each feature a contribution score that reflects its marginal impact on the model prediction, enabling consistent feature-attribution analysis across different model classes.
SHAP is grounded in the Shapley value formulation from cooperative game theory, which attributes the difference between a model prediction and a reference baseline to individual input features in a principled and additive manner. Specifically, it distributes the prediction deviation across features according to their average marginal contributions over all possible feature coalitions. The corresponding definition can be written as:
In this formulation, denotes the SHAP value of the feature, and is an arbitrary subset of features selected from the full feature set after excluding feature . Here, is the total number of features, and represents the model output when only the features in subset are provided. The SHAP value is obtained by enumerating all possible feature coalitions and computing the marginal change in the prediction when feature is added to each subset. The weighted average of these marginal contributions yields the global attribution of feature to the model prediction.
Based on the above theory, SHAP values satisfy the additive feature attribution property. Specifically, for any sample, the model prediction can be decomposed into a baseline value plus the linear sum of the SHAP contributions from all features. The decomposition can be written as:
In this expression, denotes the model’s average prediction over the dataset, and represents the aggregated contributions of all features to the prediction. A positive SHAP value indicates that the corresponding feature increases the prediction relative to the baseline, whereas a negative value indicates a decreasing effect. This additive decomposition enables intuitive interpretation through SHAP visualizations such as the summary plot and dependence plot, which illustrate the directional impacts of meteorological variables (e.g., wind speed, wind direction, and temperature) on wind power output and their potential nonlinear interactions. Such analyses support a more transparent understanding of model behavior and facilitate physically plausible interpretation of complex machine learning forecasts.
4. Data and Methods
4.1. Dataset Description
This study uses an open-access dataset collected from two wind farm sites, comprising continuous measurements from 2019 to 2020 at a 15 min sampling interval. The dataset includes wind power output and a set of multidimensional meteorological variables. The nominal installed capacities of the two wind farms range from 36 MW to 200 MW, and their average power outputs span 6.7–72.7 MW, indicating site-to-site differences in wind resource conditions and operational characteristics. The specific dataset descriptions are shown in Table 1 and Table 2.
Table 1.
Site 1: Descriptive Statistics of the Dataset.
Table 2.
Site 2: Descriptive Statistics of the Dataset.
4.2. Data Preprocessing
To ensure reliable model training and comparability of results, this study applies a unified time-series preprocessing workflow to the two wind farm datasets. The workflow includes timestamp parsing and chronological ordering, time-feature reconstruction, numerical conversion, and missing-value handling. Feature scaling is performed in a model-dependent manner to account for differences in sensitivity to input scales. Notably, no explicit outlier detection, removal, or correction is performed throughout the preprocessing pipeline. The detailed procedures are described as follows.
First, timestamps are parsed into a datetime format. Samples with missing values or parsing failures in either the time column or the target power column are removed, and the remaining records are sorted in ascending chronological order. The dataset is then split chronologically, with the first 80% of samples used for training and the remaining 20% used for testing, in order to preserve temporal causality and avoid information leakage. This split ratio was chosen to ensure sufficient historical samples for model training while reserving an adequately sized and temporally independent test set for reliable evaluation of generalization performance. Temporal features (year, month, day, hour, minute, and day of week) are then extracted from the timestamps, and corresponding periodic cosine encodings are constructed. The original time column is subsequently removed to avoid introducing non-numeric fields into model training. All input features are uniformly converted to numeric types, with ±inf values treated as missing. After time-series splitting, missing values are imputed using statistics computed exclusively from the training set, and the same imputation strategy is applied to the test set to prevent information leakage. No explicit outlier detection or correction is performed. This decision is motivated by two considerations. First, after basic cleaning, we did not observe extreme anomalies that would violate the physical constraints of wind power generation. Second, tree-based ensemble models are inherently robust to a small number of outliers. Regarding feature scaling, normalization is not required for tree-based models. In contrast, for TabNet, features are standardized using a StandardScaler fitted on the training set after splitting, and all inputs are cast to float32 to improve numerical stability, convergence behavior, and training efficiency.
Additionally, this study did not perform further quantitative diagnostics for multicollinearity, such as correlation matrix analysis or variance inflation factor evaluation, nor did it conduct explicit redundant feature screening during the preprocessing stage. Instead, joint distribution analysis was adopted as an exploratory visualization tool to characterize feature relationships and potential dependencies. Given that some variables, particularly wind speeds measured at multiple heights, may exhibit strong intercorrelations, systematic collinearity quantification and feature selection or fusion will be further investigated and refined in future work. Moreover, SHAP-based interpretability analysis is subsequently employed in this paper to quantify feature contributions and to facilitate a clearer understanding of their roles in model predictions.
4.3. Joint Feature Distributions
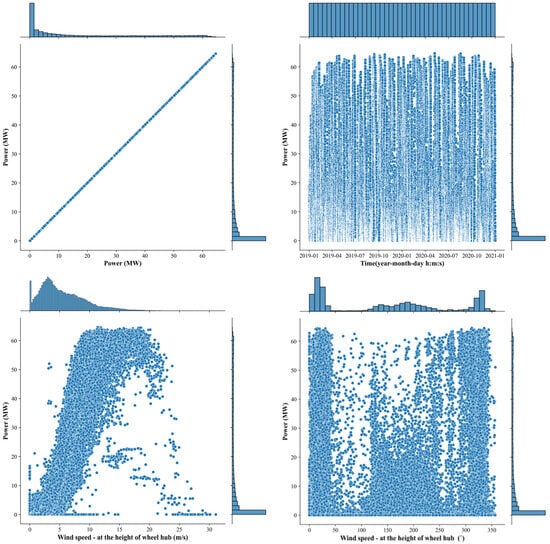
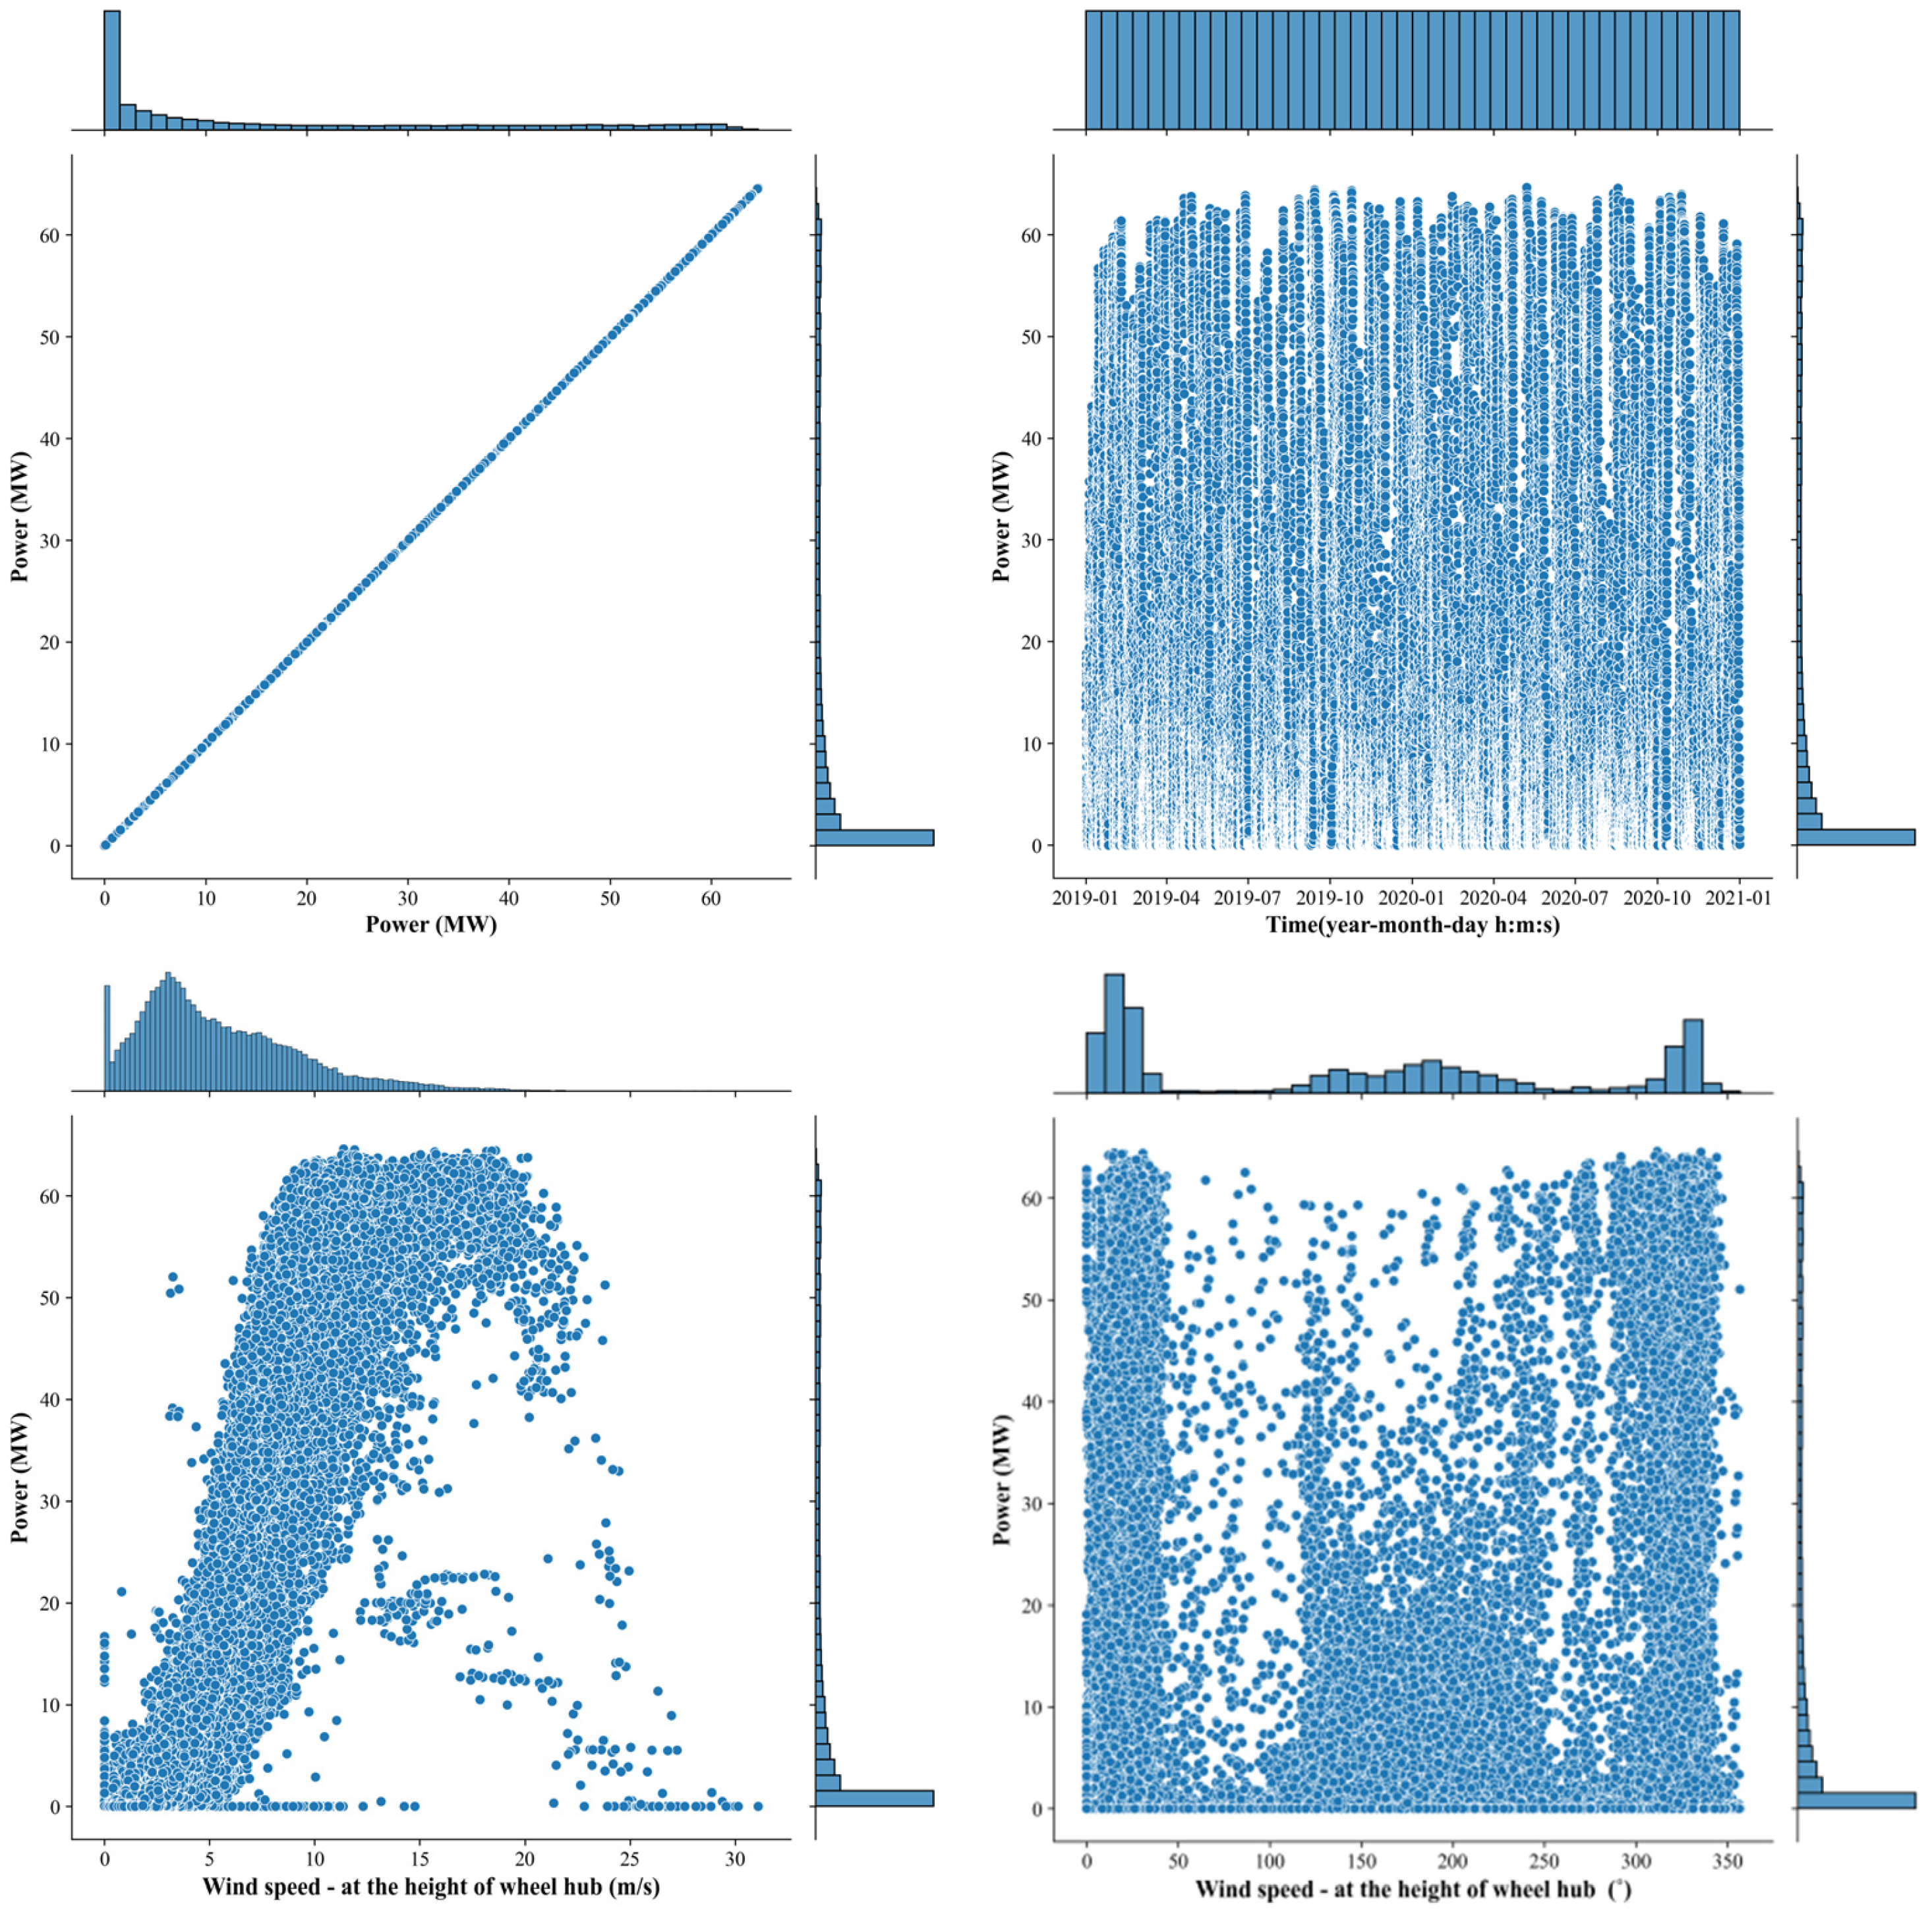
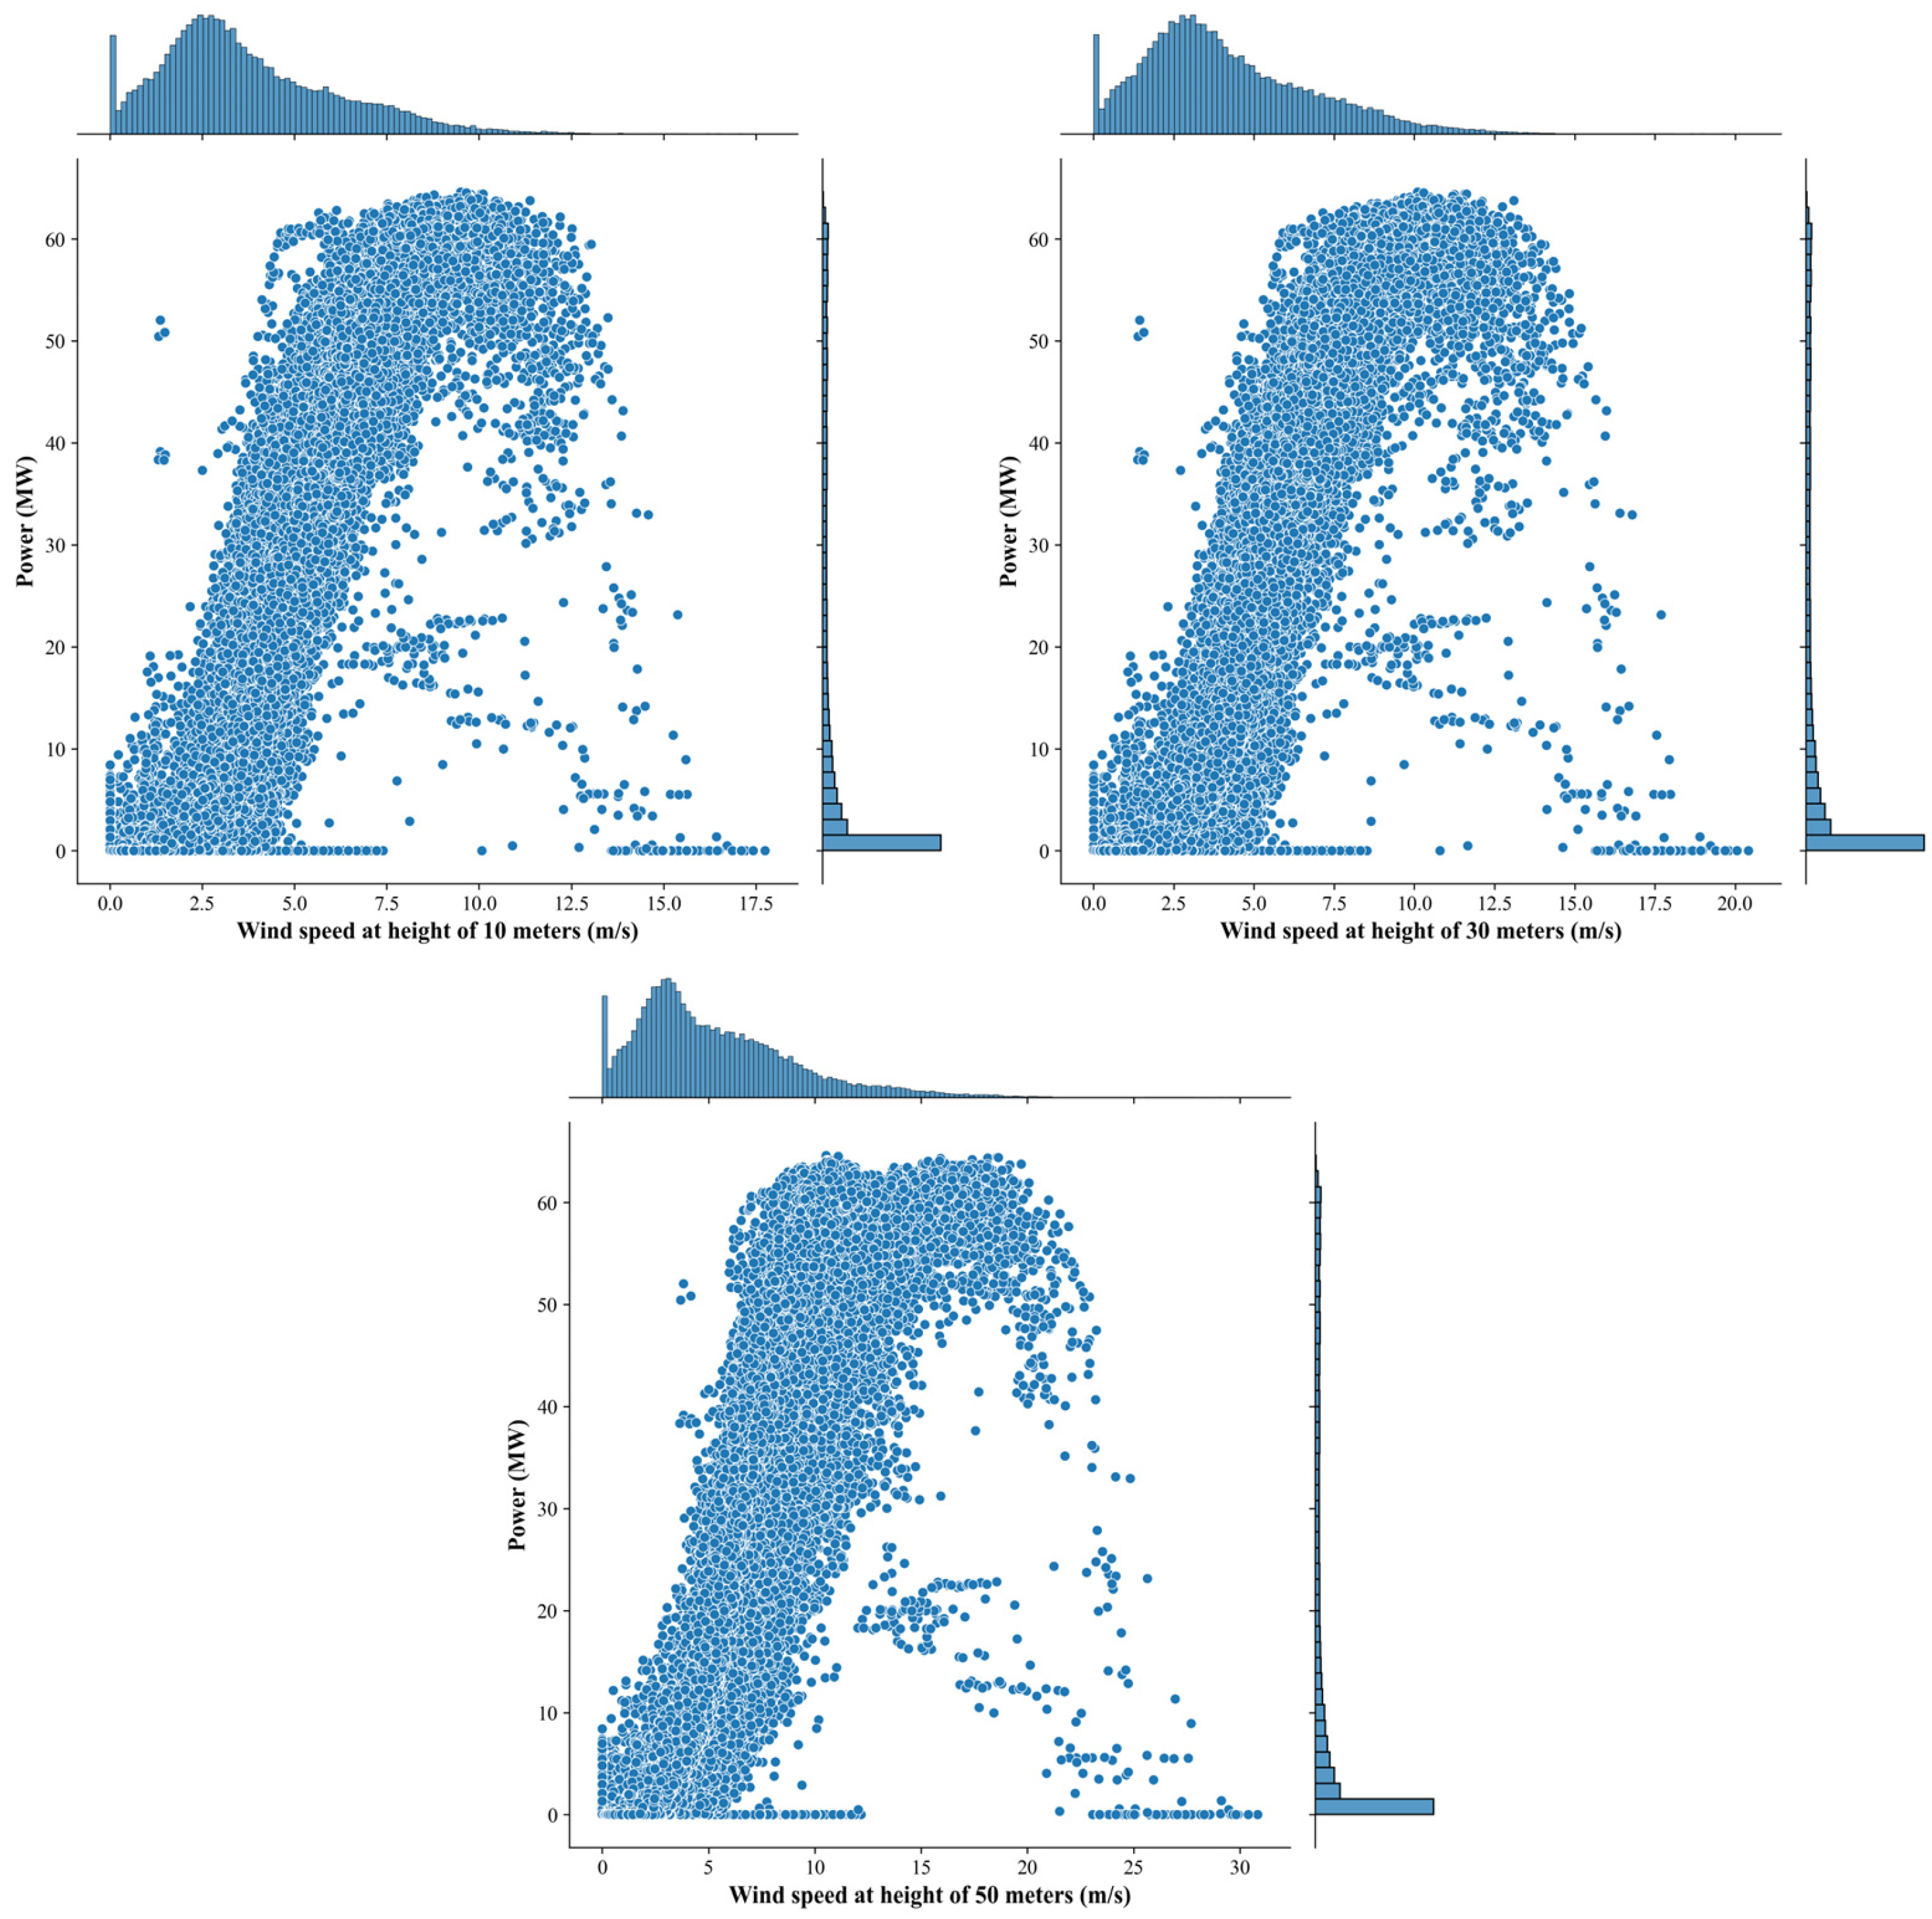
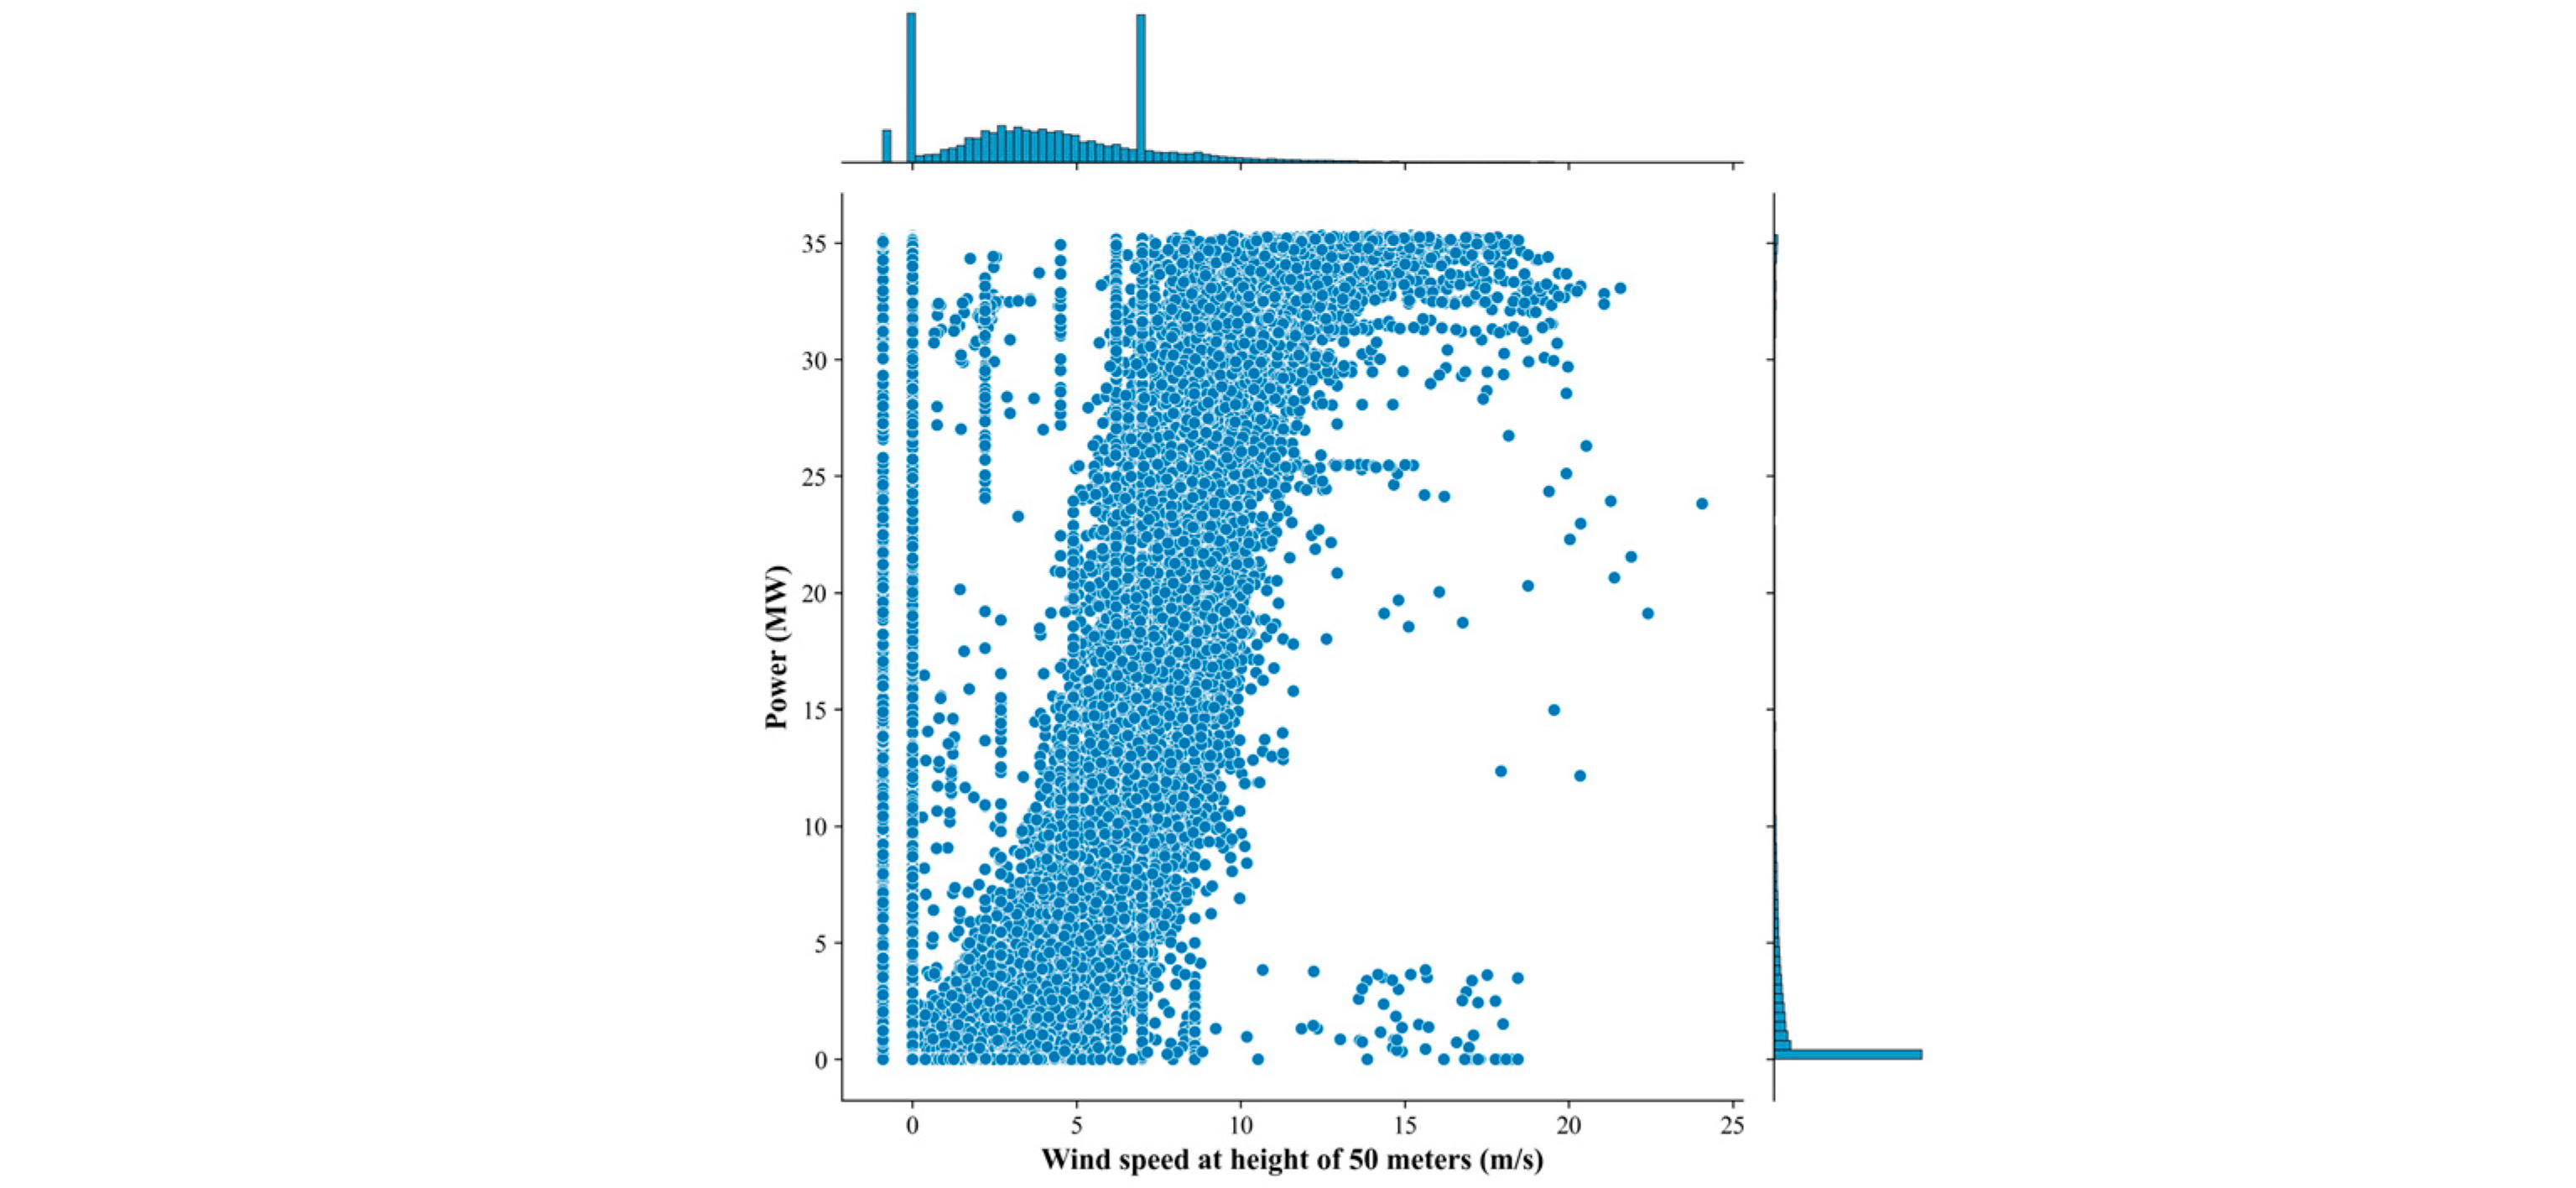
The joint distribution of core features at Site 1 is presented in Figure 2, providing direct guidance for feature selection in subsequent modeling. Analysis of power autocorrelation and time series dynamics not only validates the reliability of the dataset but also demonstrates that wind power exhibits distinct temporal dependencies, offering critical insight for selecting temporal features in the model. Wind speeds and power output across different heights display pronounced nonlinear correlations, indicating that multi-height wind speeds constitute key drivers of wind power generation. Accordingly, wind speeds at all measured heights are incorporated as core input features to comprehensively capture the vertical wind profile of the wind farm. Additionally, hub-height wind direction exerts a supplementary influence on power output and is included as a complementary feature in the modeling process.
Figure 2.
Joint Distribution Plot of Core Features and Wind Power at Site 1 (Only Features Contributing >5% Shown).
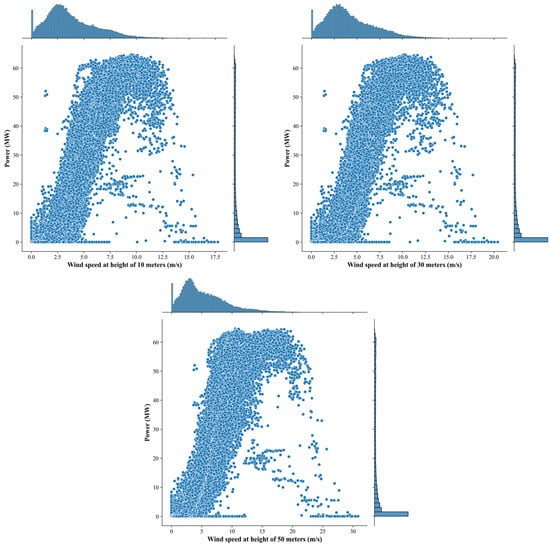
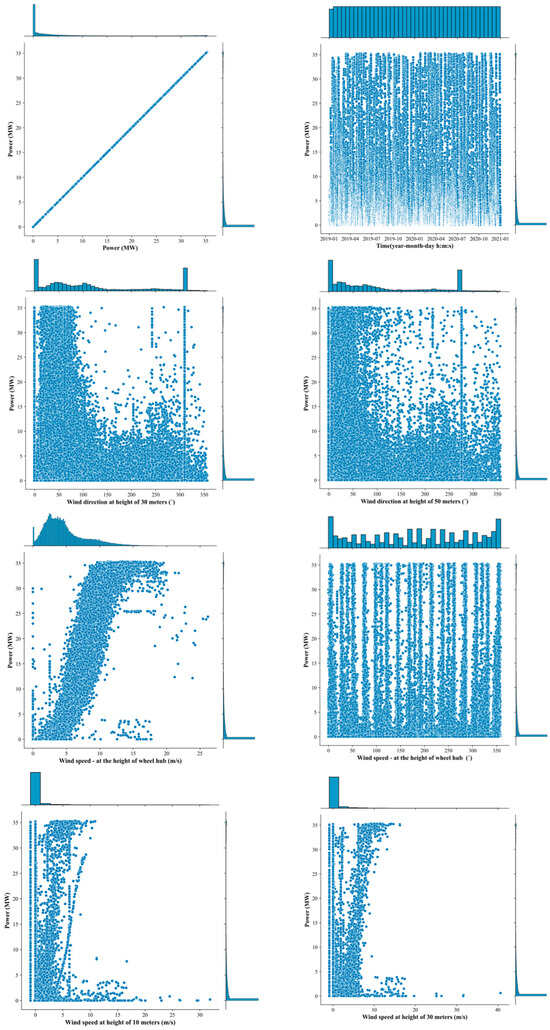
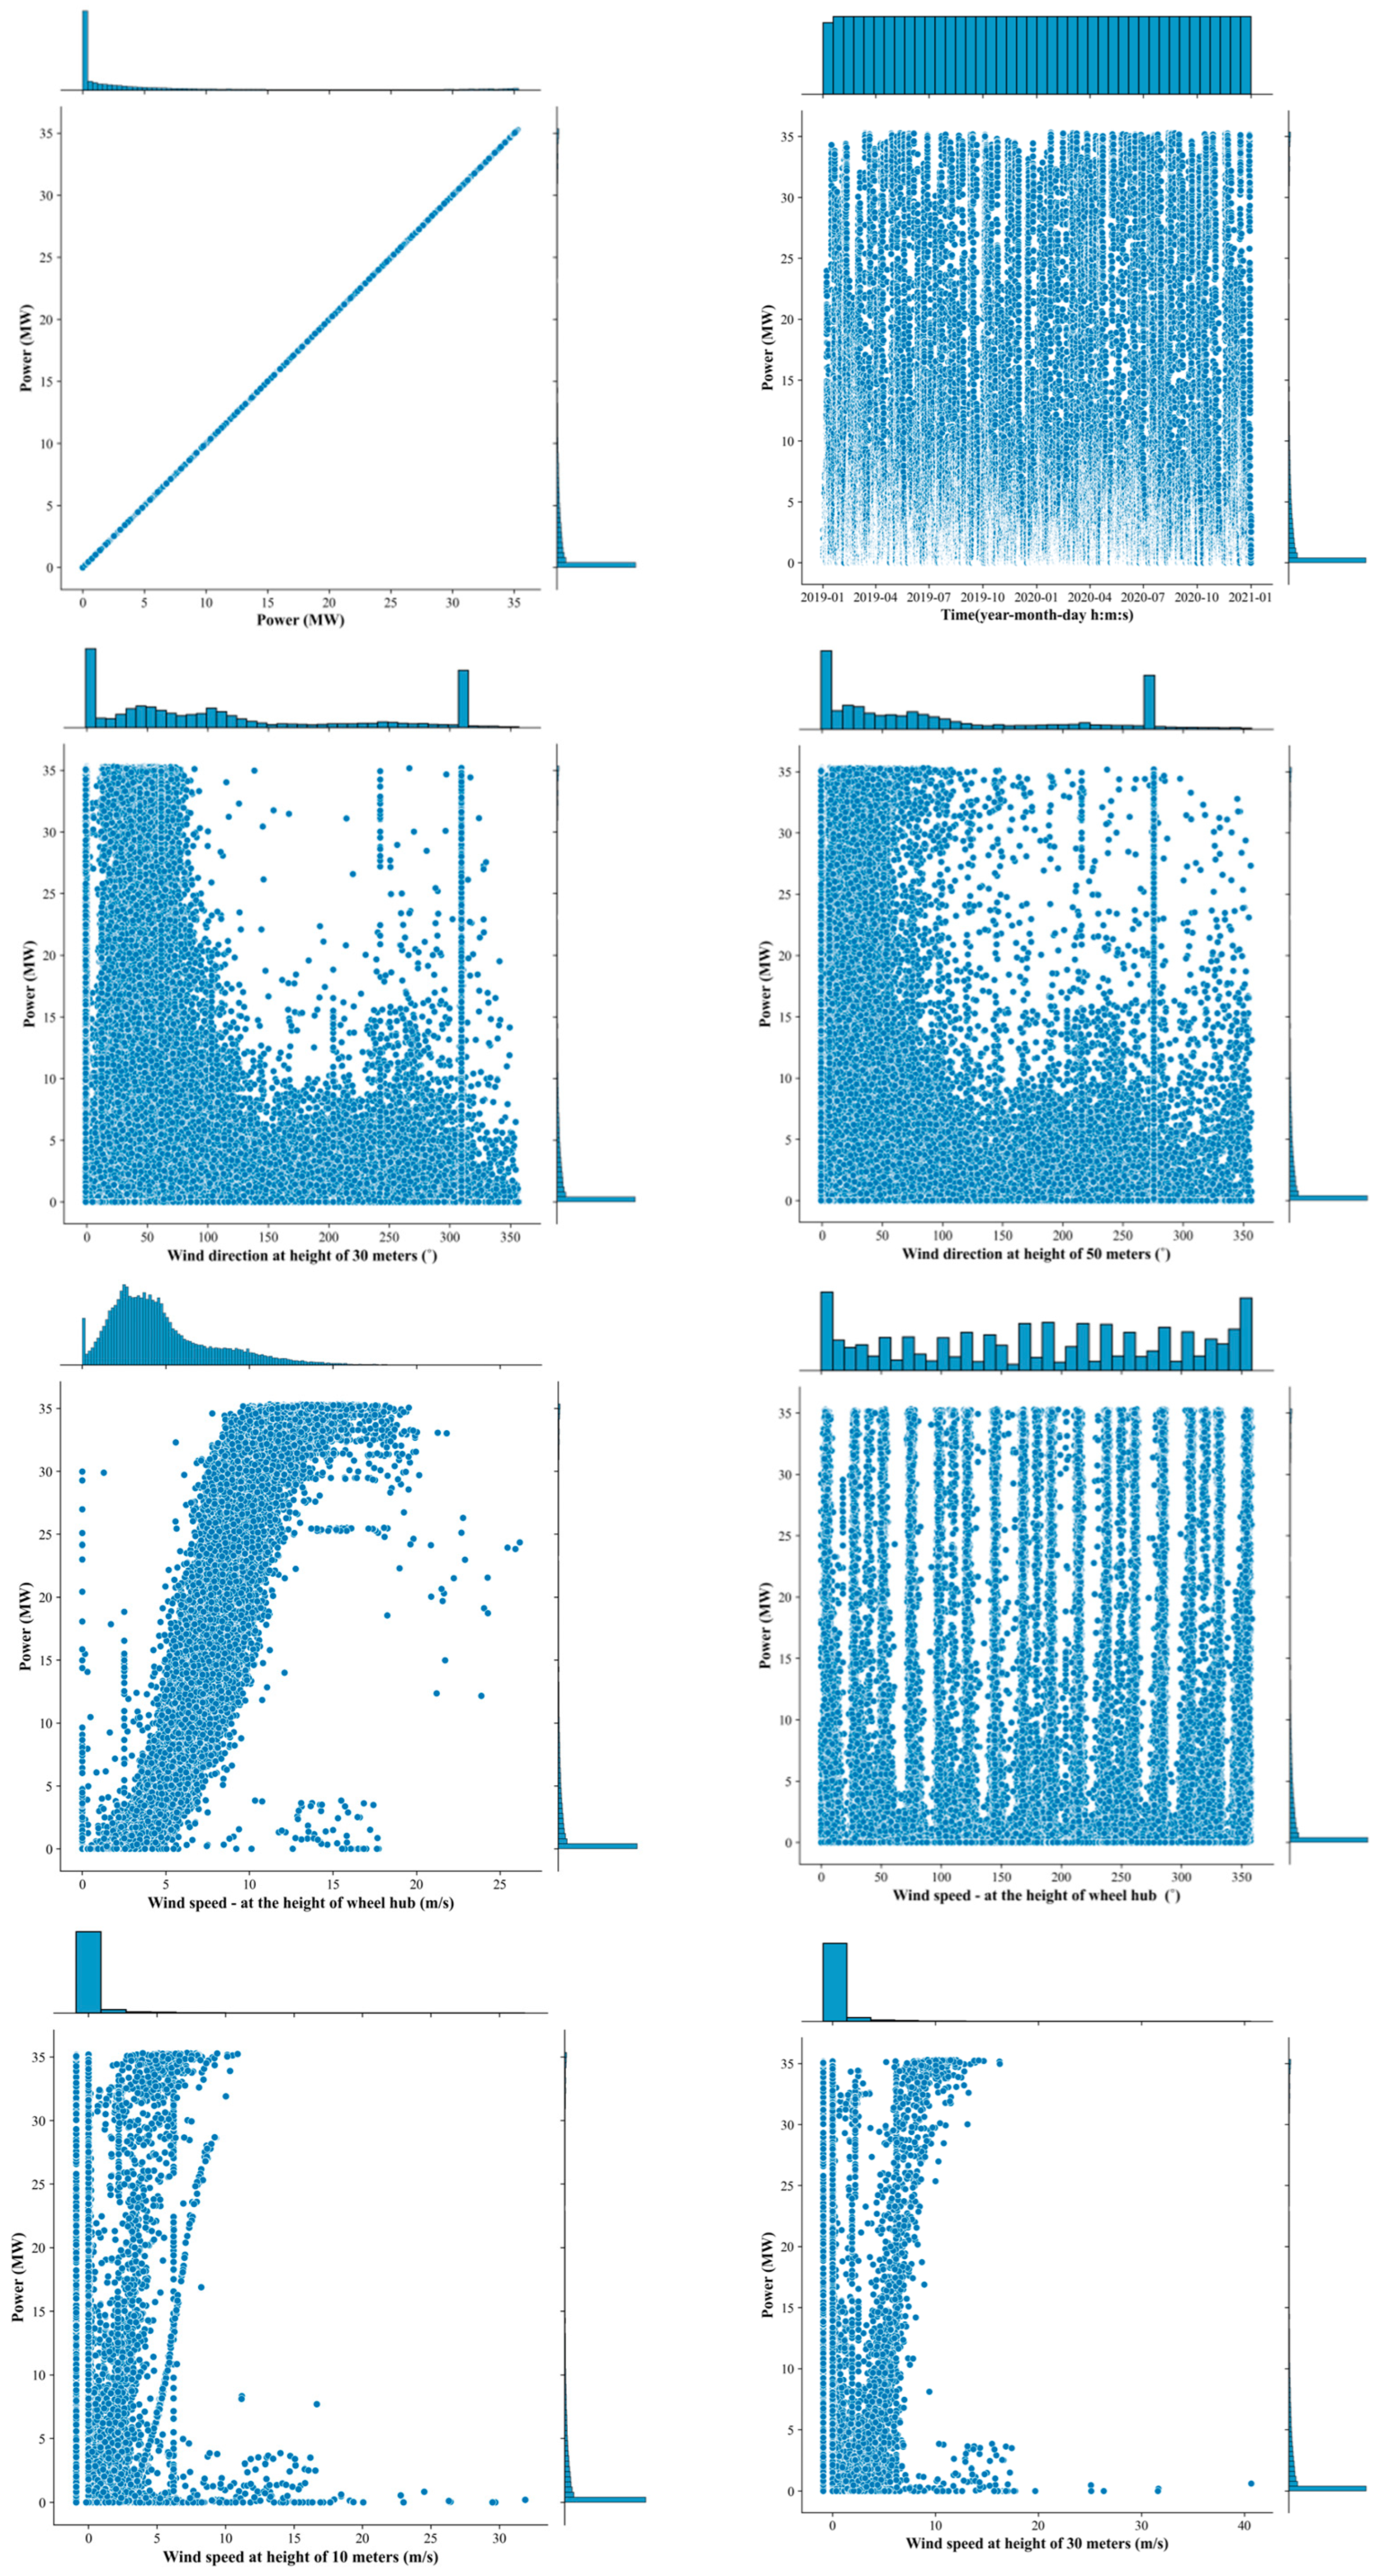
The joint distribution of core features at Site 2 is presented in Figure 3, providing intuitive guidance for feature selection. Analysis of power autocorrelation and time series patterns not only confirms the quality of the dataset but also reveals the temporal variation characteristics of power output. Wind speeds at different heights exhibit distinct nonlinear correlations with power, indicating that multi-height wind speeds constitute key variables for determining wind power levels. Consequently, wind speeds at all measured heights are retained as primary inputs in the modeling process. In addition, the distribution characteristics of wind direction at 30 m and 50 m heights relative to power output reflect the influence of terrain on wind conditions, serving as auxiliary features to enhance the model’s capacity to capture local wind dynamics. This analysis clarifies the role and relative importance of each input variable across sites from a data distribution perspective, providing a robust foundation for subsequent feature selection and model structural design.
Figure 3.
Joint Distribution Plot of Core Features and Wind Power at Site 2 (Only Features Contributing >5% Shown).
Cross-site comparative analysis indicates that the core factors influencing wind power patterns are consistent across both sites. Wind speeds at multiple heights act as the primary drivers of power fluctuations, while time-dependent power characteristics are shared between sites. These findings provide a unified rationale for retaining core wind speed variables and coarse-grained temporal features in subsequent modeling. At the same time, notable differences are observed in the influence of wind direction characteristics. At Site 1, only hub-height wind direction exerts a marginal auxiliary effect. In contrast, at Site 2, topographical influences render wind directions at 30 m and 50 m heights more informative. This disparity offers a data-driven basis for site-specific feature selection strategies, ensuring that subsequent modeling aligns closely with the wind field characteristics of each site.
5. Results
5.1. Comparative Performance Analysis
To quantitatively assess the performance differences between traditional statistical models and machine learning approaches in wind power forecasting, this study employs multiple linear regression (MLR) as a classical statistical benchmark. A foundational comparison experiment, conducted without hyperparameter optimization, was performed using identical data partitions, feature sets, and evaluation metrics (R2, RMSE, and MAE) across six machine learning models. This provides a baseline reference for subsequent model analyses. The baseline forecasting performance is summarized in Table 3. In the following sections, the predictive performance of the six machine learning baseline models is systematically evaluated and analyzed for Site 1 and Site 2, respectively.
Table 3.
Comparison of MLR Prediction Performance Results for Two Site Reference Models.
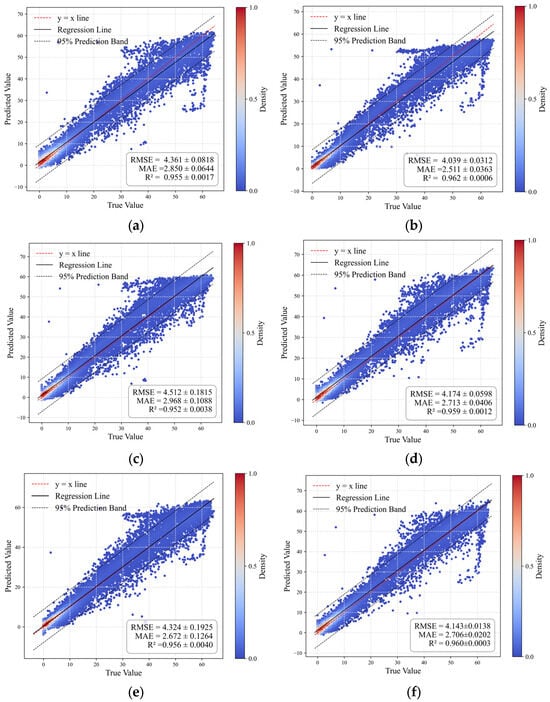
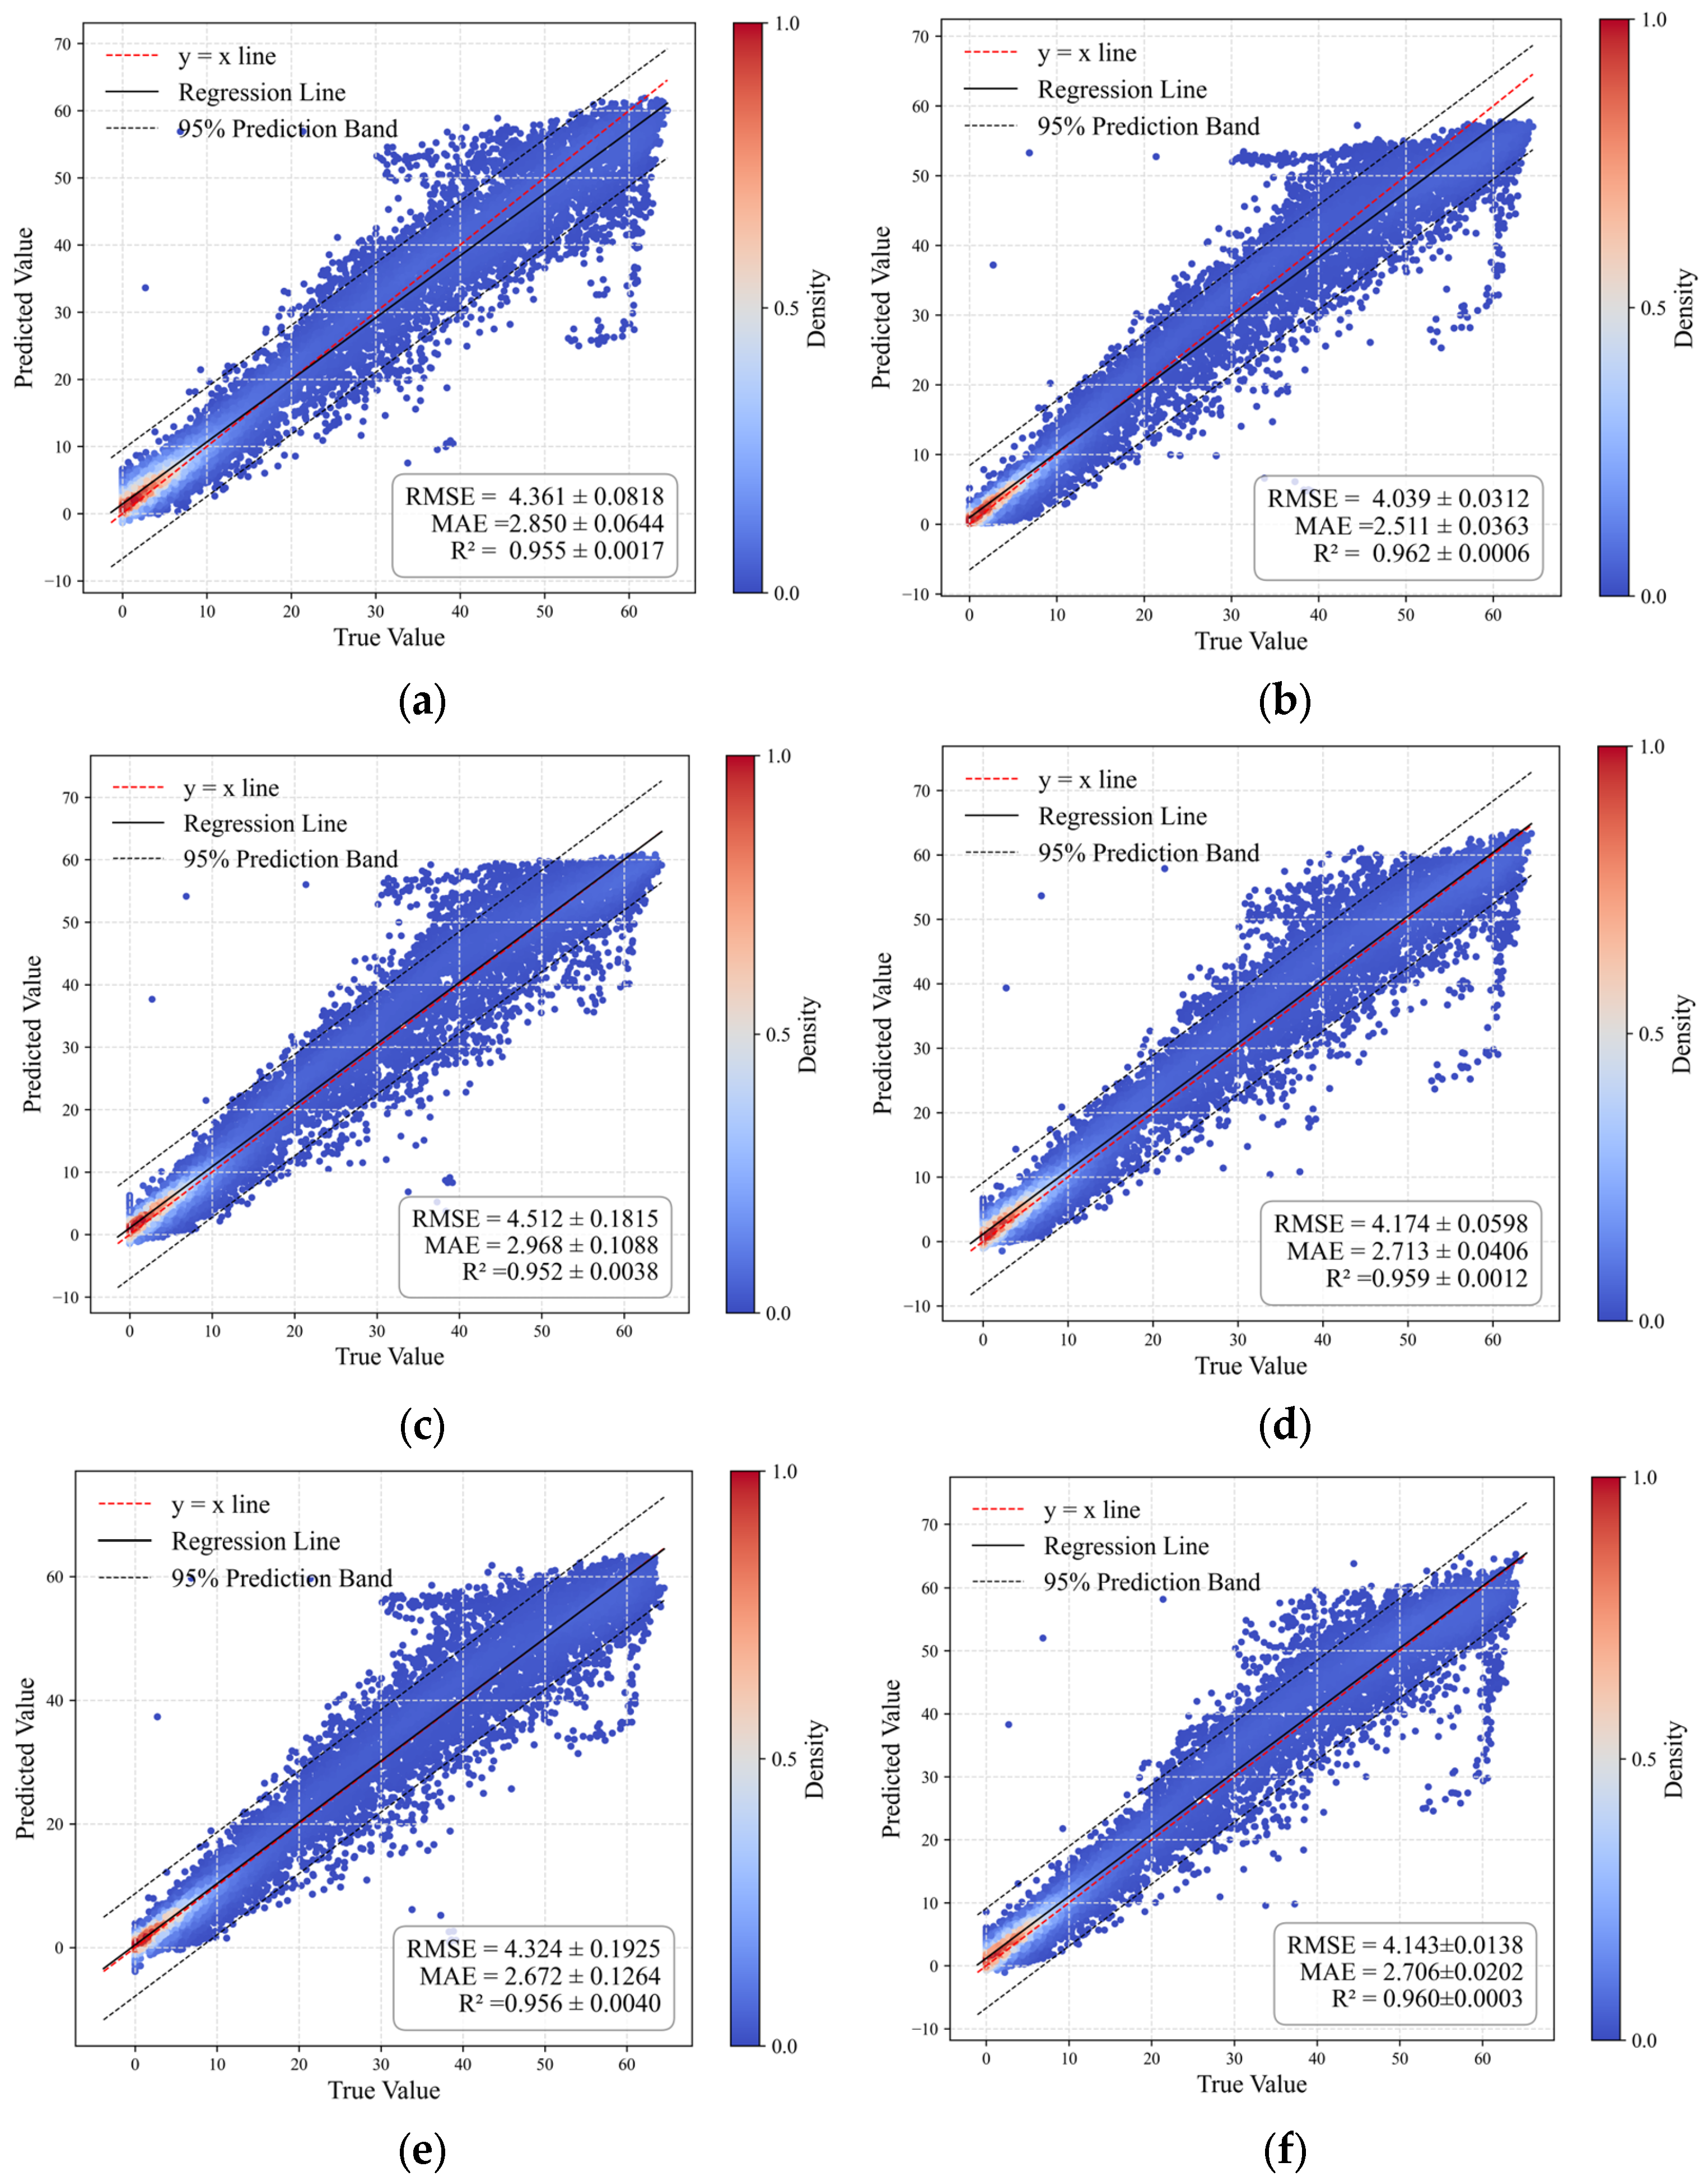
Predictive performance was evaluated for six baseline machine learning models (CatBoost, Extra Trees, GBM, LightGBM, TabNet, and XGBoost) on Site 1, and the results are shown in Figure 4. Across all models, the predicted values show strong agreement with the observations: scatter points are concentrated near the (y = x) reference line and the fitted regression lines closely follow this diagonal, indicating that the models capture the dominant input–output relationships in the data. For the baseline models, RMSE ranges from 4.039 ± 0.0312 to 4.512 ± 0.1815, MAE ranges from 2.511 ± 0.0363 to 2.968 ± 0.1088, and the coefficient of determination R2 is consistently above 0.952 ± 0.0038 for all models, suggesting overall competitive accuracy. Across the full power range, the scatter distributions remain relatively uniform. The 95% prediction interval bands are broadly stable, with only modest widening at higher power levels, implying that predictive uncertainty and generalization performance are reasonably consistent across different output regimes. Compared with the classical statistical benchmark MLR model shown in Table 3, all six machine learning baseline models at Site 1 exhibited a clear improvement in predictive accuracy, highlighting the inherent advantage of machine learning approaches in capturing the complex nonlinear relationships underlying wind power output.
Figure 4.
Baseline model performance at Site 1: (a) CatBoost; (b) Extra Trees; (c) GBM; (d) LightGBM; (e) TabNet; (f) XGBoost.
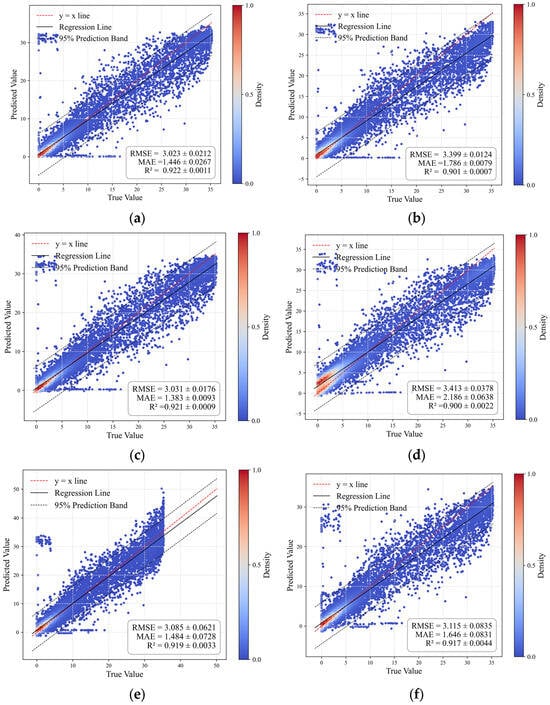
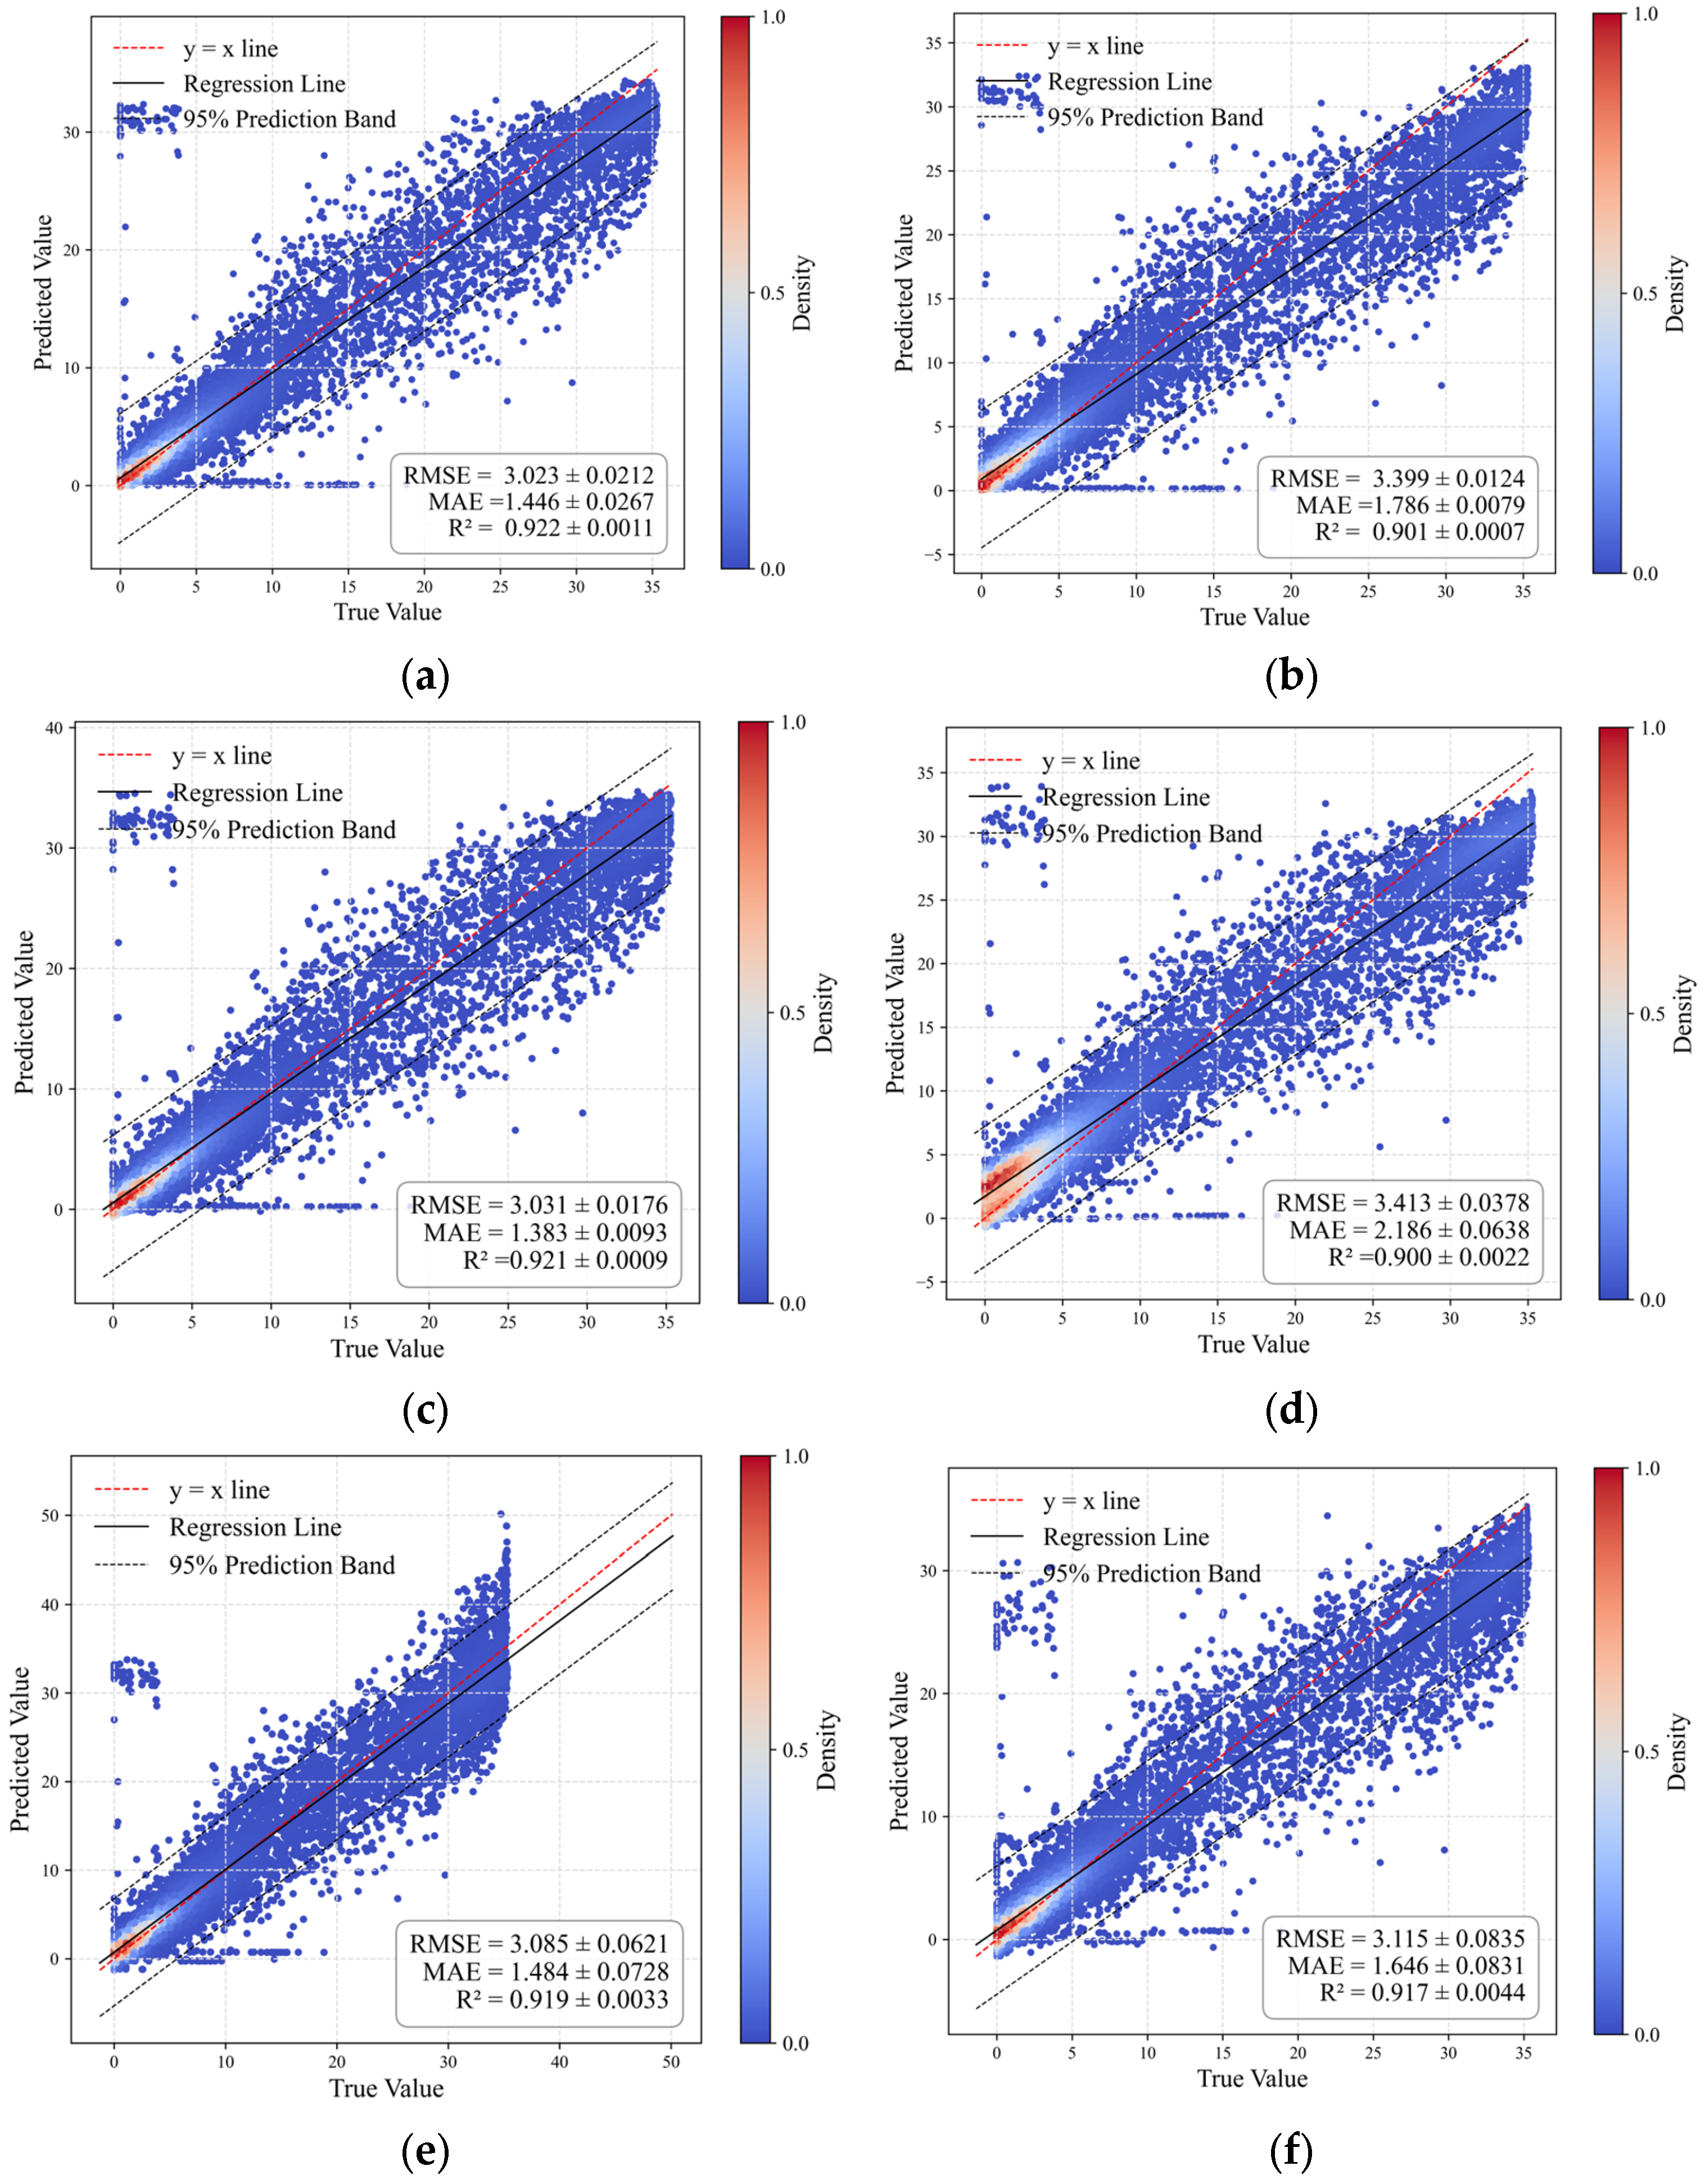
Predictive performance was evaluated for six baseline machine learning models (CatBoost, Extra Trees, GBM, LightGBM, TabNet, and XGBoost) on Site 2, and the results are shown in Figure 5. For all models, the predictions agree well with the observations: scatter points are distributed closely around the (y = x) reference line, and the fitted regression lines largely overlap with the diagonal, indicating that the models capture the main input–output relationships at this site. The baseline RMSE values range from 2.987 ± 0.0417 to 3.413 ± 0.0378, MAE values range from 1.383 ± 0.0093 to 2.186 ± 0.0638, and the coefficient of determination R2 is above 0.900 ± 0.0022 for all models. Across the full power range, the scatter distributions are relatively concentrated, and the 95% prediction interval bands remain narrow. Only a small number of points deviate noticeably in the low-power regime, suggesting that the models maintain stable generalization performance across different output levels. Compared with the MLR benchmark model presented in Table 3, all six machine learning baseline models at Site 2 exhibited notable performance improvements, further confirming the applicability and superiority of machine learning approaches over traditional linear statistical models in wind power forecasting.
Figure 5.
Baseline model performance at Site 2: (a) CatBoost; (b) Extra Trees; (c) GBM; (d) LightGBM; (e) TabNet; (f) XGBoost.
5.2. Multi-Model Performance Comparison
Following the visual assessment of baseline prediction performance at the two sites, we further applied TPE-based hyperparameter optimization to six baseline models (LightGBM, XGBoost, GBM, CatBoost, Extra Trees, and TabNet) for each site. The optimized models were then evaluated using three standard metrics: the coefficient of determination R2, root mean square error RMSE, and mean absolute error MAE.
5.2.1. Performance After TPE Optimization at Site 1
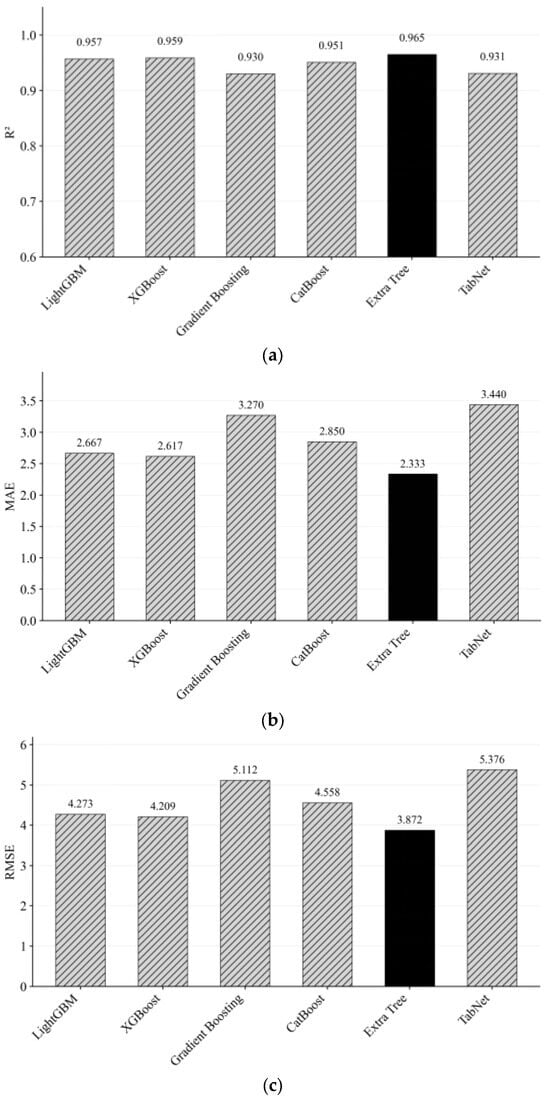
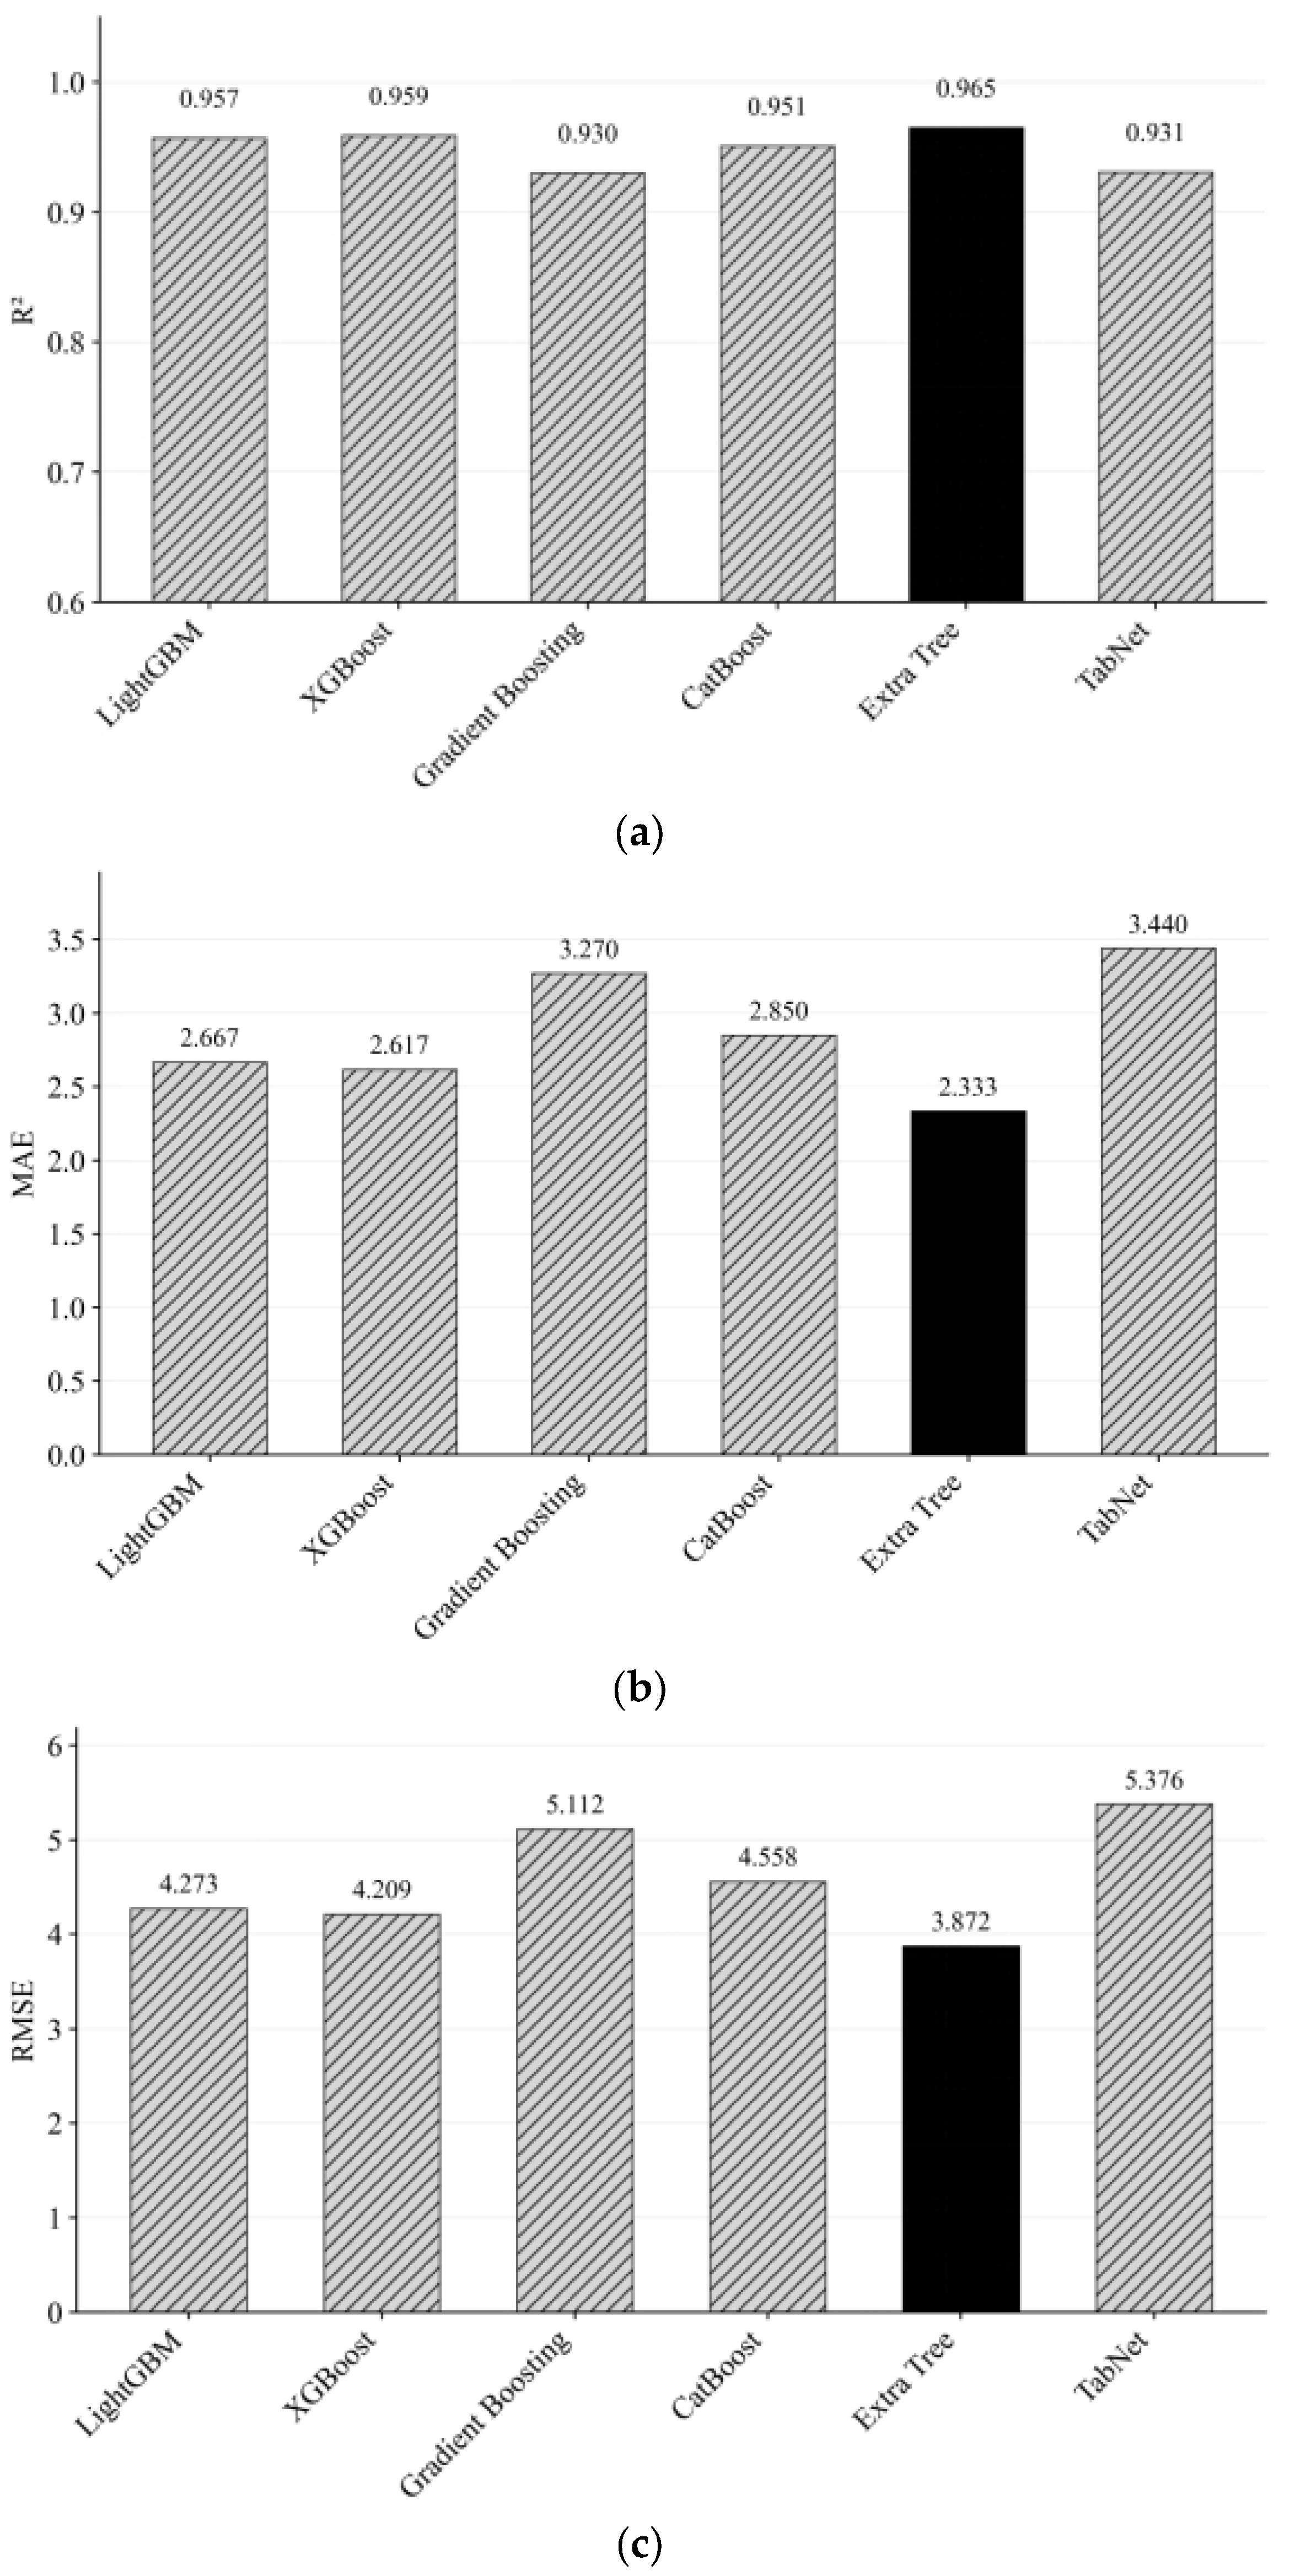
The comparative results of the optimized models for Site 1 are presented in Figure 6. Among the six candidates, the Extra Trees model achieves the best predictive performance.
Figure 6.
Comparison of Wind Power Forecasting Performance Among Models After TPE Optimization at Site 1: (a) (R2); (b) MAE; (c) RMSE. In each subplot, the black bar highlights the best-performing model, while the hatched bars represent the other compared models.
In terms of R2, the TPE-optimized models achieved values ranging from 0.930 to 0.965, indicating strong explanatory power for the variability in wind power output. Among them, Extra Trees attained the highest R2 of 0.965, whereas Gradient Boosting and TabNet yielded relatively lower R2 values of 0.930 and 0.931, respectively. LightGBM, XGBoost, and CatBoost achieved R2 values of 0.957, 0.959, and 0.951, respectively. Overall, these results suggest that the TPE-optimized tree-based ensemble models exhibit slightly stronger explanatory capability for output variability than the deep neural network model considered in this study.
In terms of RMSE, the TPE-optimized models achieved values ranging from 3.872 to 5.376. Extra Trees yielded the lowest RMSE of 3.872, whereas TabNet recorded the highest RMSE of 5.376. LightGBM, XGBoost, CatBoost, and Gradient Boosting produced RMSE values of 4.273, 4.209, 4.558, and 5.112, respectively. Overall, these results indicate that TPE optimization improved error control to varying extents across models, while maintaining errors within a manageable range.
In terms of MAE, the TPE-optimized models produced values ranging from 2.333 to 3.440. Extra Trees achieved the lowest MAE of 2.333, whereas TabNet recorded the highest MAE of 3.440. LightGBM, XGBoost, Gradient Boosting, and CatBoost yielded MAE values of 2.667, 2.617, 3.270, and 2.850, respectively. These results further suggest that tree-based ensemble models exhibit a stability advantage in error control following TPE optimization.
Regarding model complexity, the TPE-optimized Extra Trees model at Site 1 has core hyperparameters of n_estimators = 1000, max_depth = 15, and max_features = 0.689. The model exhibits a simple and compact structure, with a parameter count substantially lower than that of deep learning models such as TabNet. This lightweight design offers clear advantages and provides a solid foundation for engineering deployment.
5.2.2. Performance After TPE Optimization at Site 2
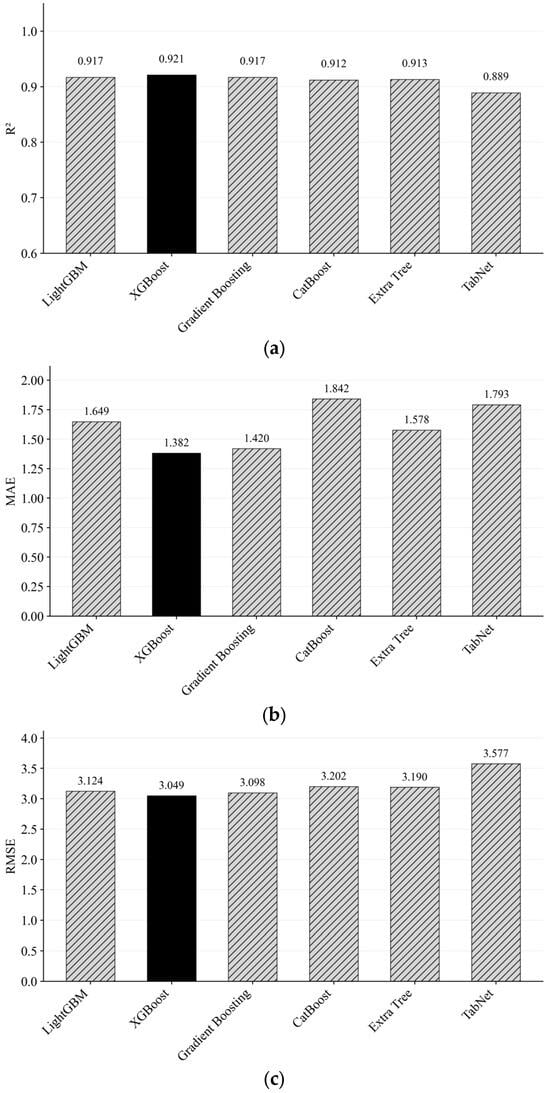
The post-optimization performance results for Site 2 are presented in Figure 7. Among the six models, XGBoost achieves the best predictive performance.
Figure 7.
Comparison of Wind Power Forecasting Performance Among Models After TPE Optimization at Site 2: (a) (R2); (b) MAE; (c) RMSE. In each subplot, the black bar highlights the best-performing model, while the hatched bars represent the other compared models.
In terms of R2, the TPE-optimized models achieved values ranging from 0.884 to 0.921, indicating that they explain at least 88% of the variance in wind power output and thus exhibit strong overall goodness of fit. XGBoost achieved the highest R2 of 0.921, whereas TabNet yielded the lowest R2 of 0.889. LightGBM and Gradient Boosting both achieved R2 values of 0.917, while Extra Trees and CatBoost attained R2 values of 0.913 and 0.912, respectively. Overall, these results suggest that the TPE-optimized tree-based ensemble models provide slightly stronger explanatory capability for output variability than the deep neural network model considered in this study.
In terms of RMSE, the TPE-optimized models achieved values ranging from 3.049 to 3.667. XGBoost yielded the lowest RMSE of 3.049, whereas TabNet recorded the highest RMSE of 3.577. Gradient Boosting, LightGBM, Extra Trees, and CatBoost attained RMSE values of 3.098, 3.124, 3.190, and 3.202, respectively. Overall, these results indicate that TPE optimization improved error control to varying extents across models, while keeping prediction errors within a relatively narrow and manageable range.
In terms of MAE, the TPE-optimized models produced values ranging from 1.382 to 1.842. XGBoost achieved the lowest MAE of 1.382, whereas CatBoost recorded the highest MAE of 1.842. Gradient Boosting, Extra Trees, LightGBM, and TabNet yielded MAE values of 1.420, 1.578, 1.649, and 1.793, respectively. Overall, these results suggest that tree-based ensemble models tend to provide more stable error control following TPE optimization.
Regarding model complexity, the TPE-optimized XGBoost model for Site 2 has core hyperparameters of n_estimators = 595, max_depth = 3, and subsample = 0.781. It demonstrates low computational overhead and stable generalization. Compared with the parameter scale of TabNet, this model is better suited for deployment on embedded devices in wind farms.
5.3. Pre- and Post-TPE Performance Comparison for the Best-Performing Model
For the selected best-performing models at Site 1 and Site 2, we further compare predictive performance before and after TPE-based hyperparameter tuning to quantify the impact of the optimization strategy.
The comparative results for the Site 1 dataset are summarized in Table 4, where Extra Trees is identified as the best-performing model. The baseline model achieved R2 values of 0.950 and 0.961 on the training and test sets, respectively, indicating strong fitting performance. After TPE-based hyperparameter optimization, the training R2 increased to 0.968 and the test R2 rose to 0.965, suggesting that the optimized configuration further improved the model’s ability to capture variations in wind power output. In terms of error metrics, the baseline model yielded a test-set RMSE of 4.039 and an MAE of 2.511. After optimization, the test-set RMSE decreased to 3.872 and the MAE to 2.333, demonstrating a clear reduction in prediction errors. Overall, these results confirm the effectiveness of TPE optimization in enhancing predictive accuracy and reducing forecasting error.
Table 4.
Performance Comparison of the Optimal Model Extra Tree After TPE Optimization at Site 1.
The comparative results for the Site 2 dataset are summarized in Table 5, with XGBoost identified as the best-performing model. The baseline model achieved R2 values of 0.950 and 0.920 on the training and test sets, respectively, indicating strong generalization performance. After TPE-based optimization, the training R2 remained essentially unchanged at 0.950, while the test R2 increased marginally to 0.921, suggesting a comparable and slightly improved overall fit relative to the baseline. In terms of error metrics, the baseline model yielded a test-set RMSE of 3.065 and an MAE of 1.425. After optimization, the test-set RMSE decreased to 3.049 and the MAE to 1.382, indicating that TPE optimization primarily delivered more stable improvements in error control, particularly in MAE.
Table 5.
Performance Comparison of the Optimal Model XGBoost After TPE Optimization at Site 2.
Overall, TPE-based hyperparameter tuning improves the performance of the selected models on both datasets, as reflected by better goodness of fit and reduced prediction errors. These results indicate that TPE provides a generally effective optimization strategy for enhancing wind power forecasting performance under the studied settings.
5.4. Model Interpretability Analysis
To better understand how input features contribute to model predictions, we apply SHAP (SHapley Additive exPlanations) to the selected best-performing model, conducting feature-attribution analysis and interpretability visualizations.
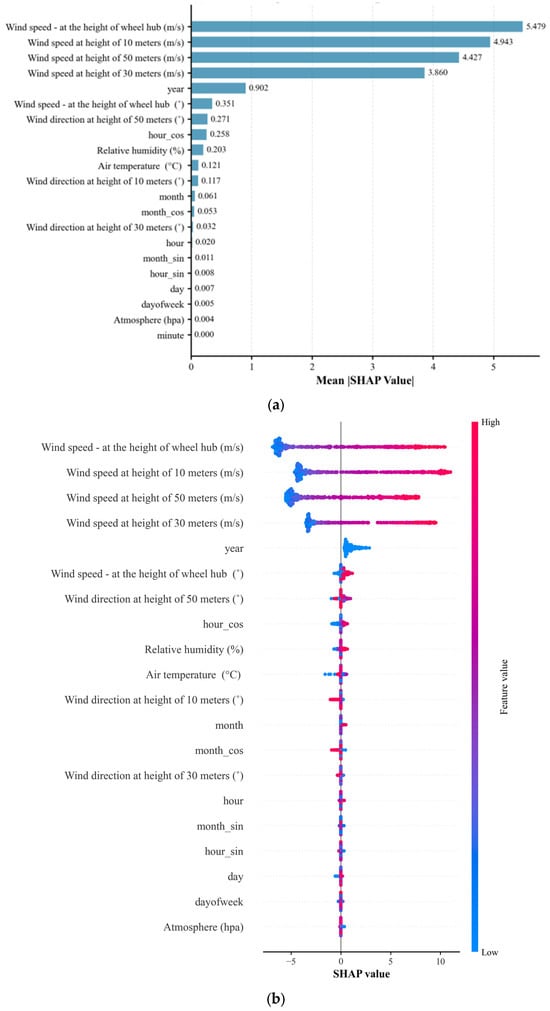
5.4.1. Feature Importance and SHAP Analysis for Site 1
The feature importance ranking based on the average absolute SHAP values is presented in Figure 8a. Wind speed-related features constitute the primary drivers of wind power forecasting at Site 1, with hub-height wind speed exhibiting the highest average SHAP value. Wind speeds at 10 m, 30 m, and 50 m heights also demonstrate high and comparable importance, indicating that the model effectively captures variations in wind resources by integrating multi-height wind speed information to characterize the vertical wind profile in the near-surface layer. Long-term temporal variables, such as year, exhibit moderate importance, reflecting the model’s ability to extract long-term temporal trends in wind power output. In contrast, features such as air temperature, relative humidity, barometric pressure, and minute-level short-term temporal variables contribute substantially less, providing minimal marginal information for the model’s predictions.
Figure 8.
Feature importance and SHAP summary plots for Site 1: (a) feature importance based on mean absolute SHAP values; (b) SHAP summary plot.
The SHAP summary scatter plot for Site 1 (Figure 8b) shows that the distribution of SHAP values for wind speed features substantially exceeds that of other features. Samples with high wind speeds correspond to positive SHAP contributions, whereas samples with low wind speeds cluster around negative or near-zero values. The SHAP values for each wind speed feature exhibit a stable, monotonically positive relationship with power output. This pattern aligns closely with the fundamental aerodynamic principles governing wind energy conversion, thereby validating the physical plausibility of the model’s learning outcomes and the reliability of its decision logic.
5.4.2. Feature Importance and SHAP Analysis for Site 2
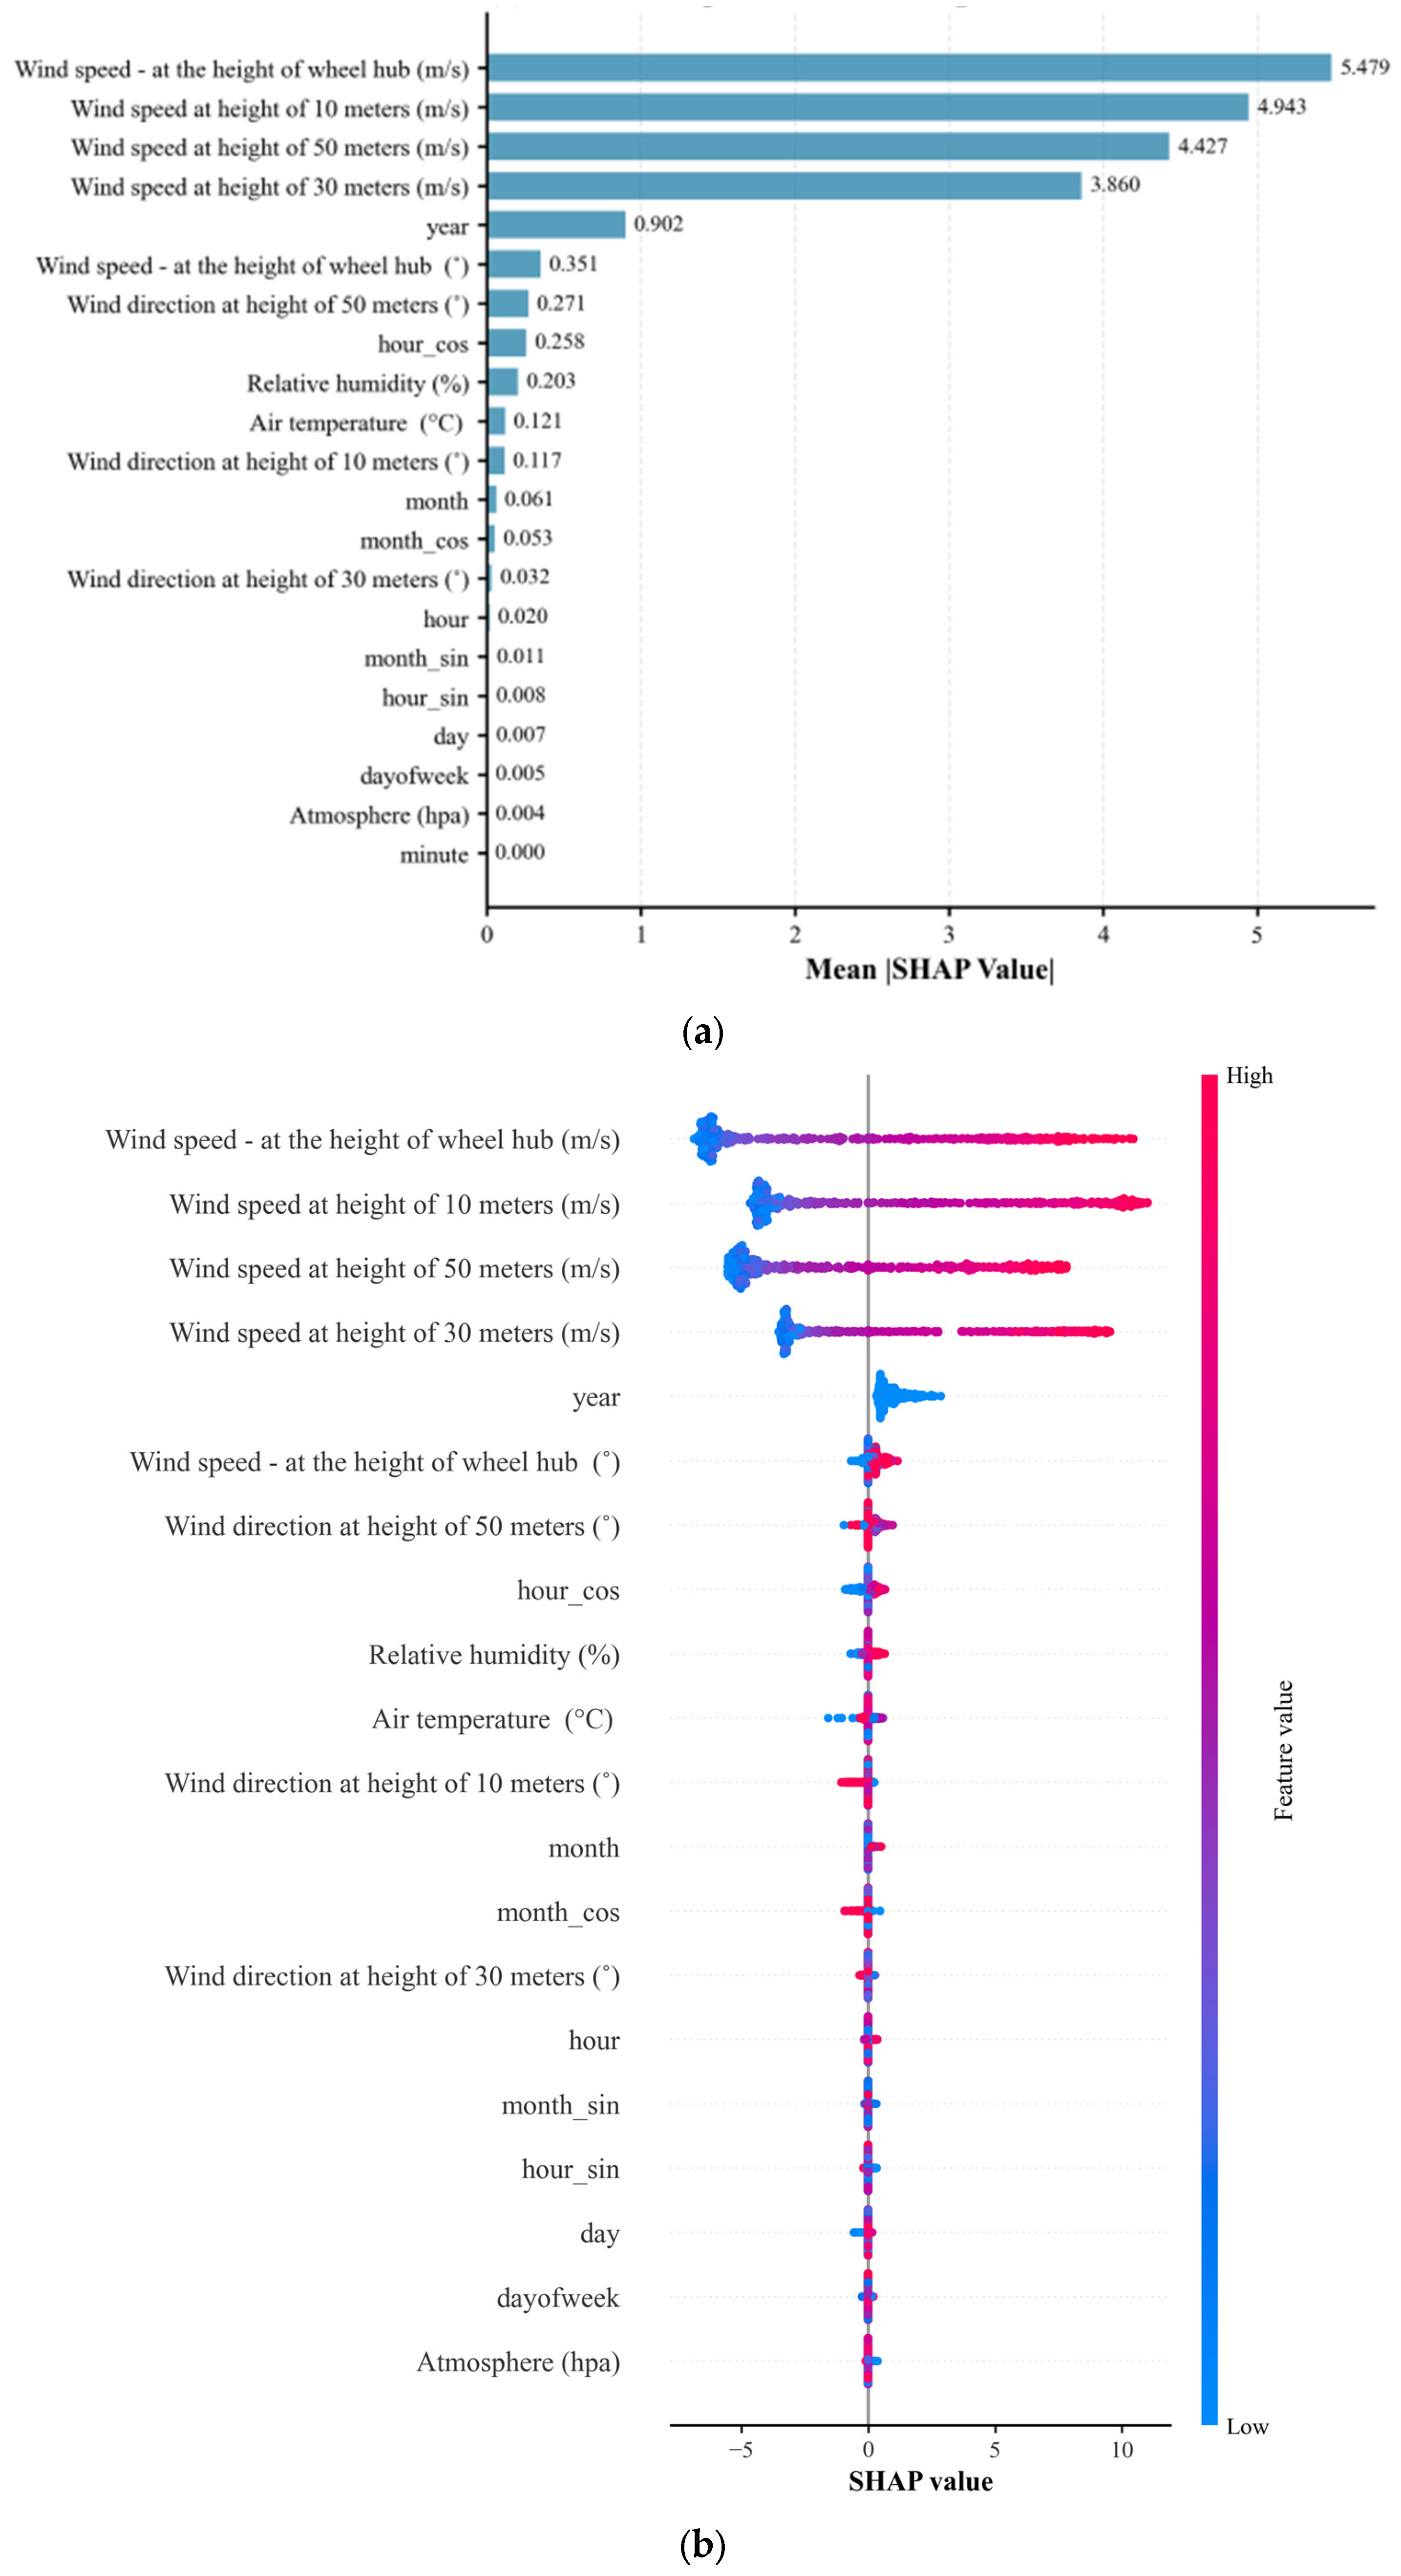
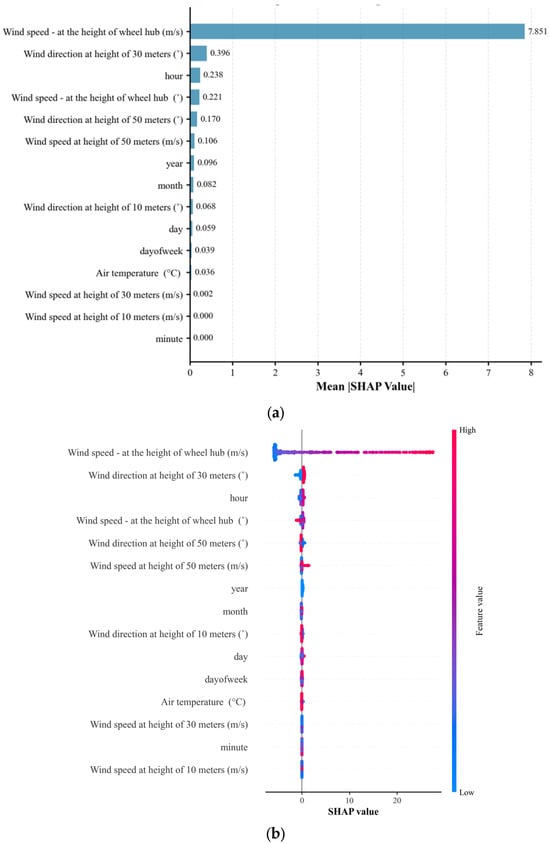
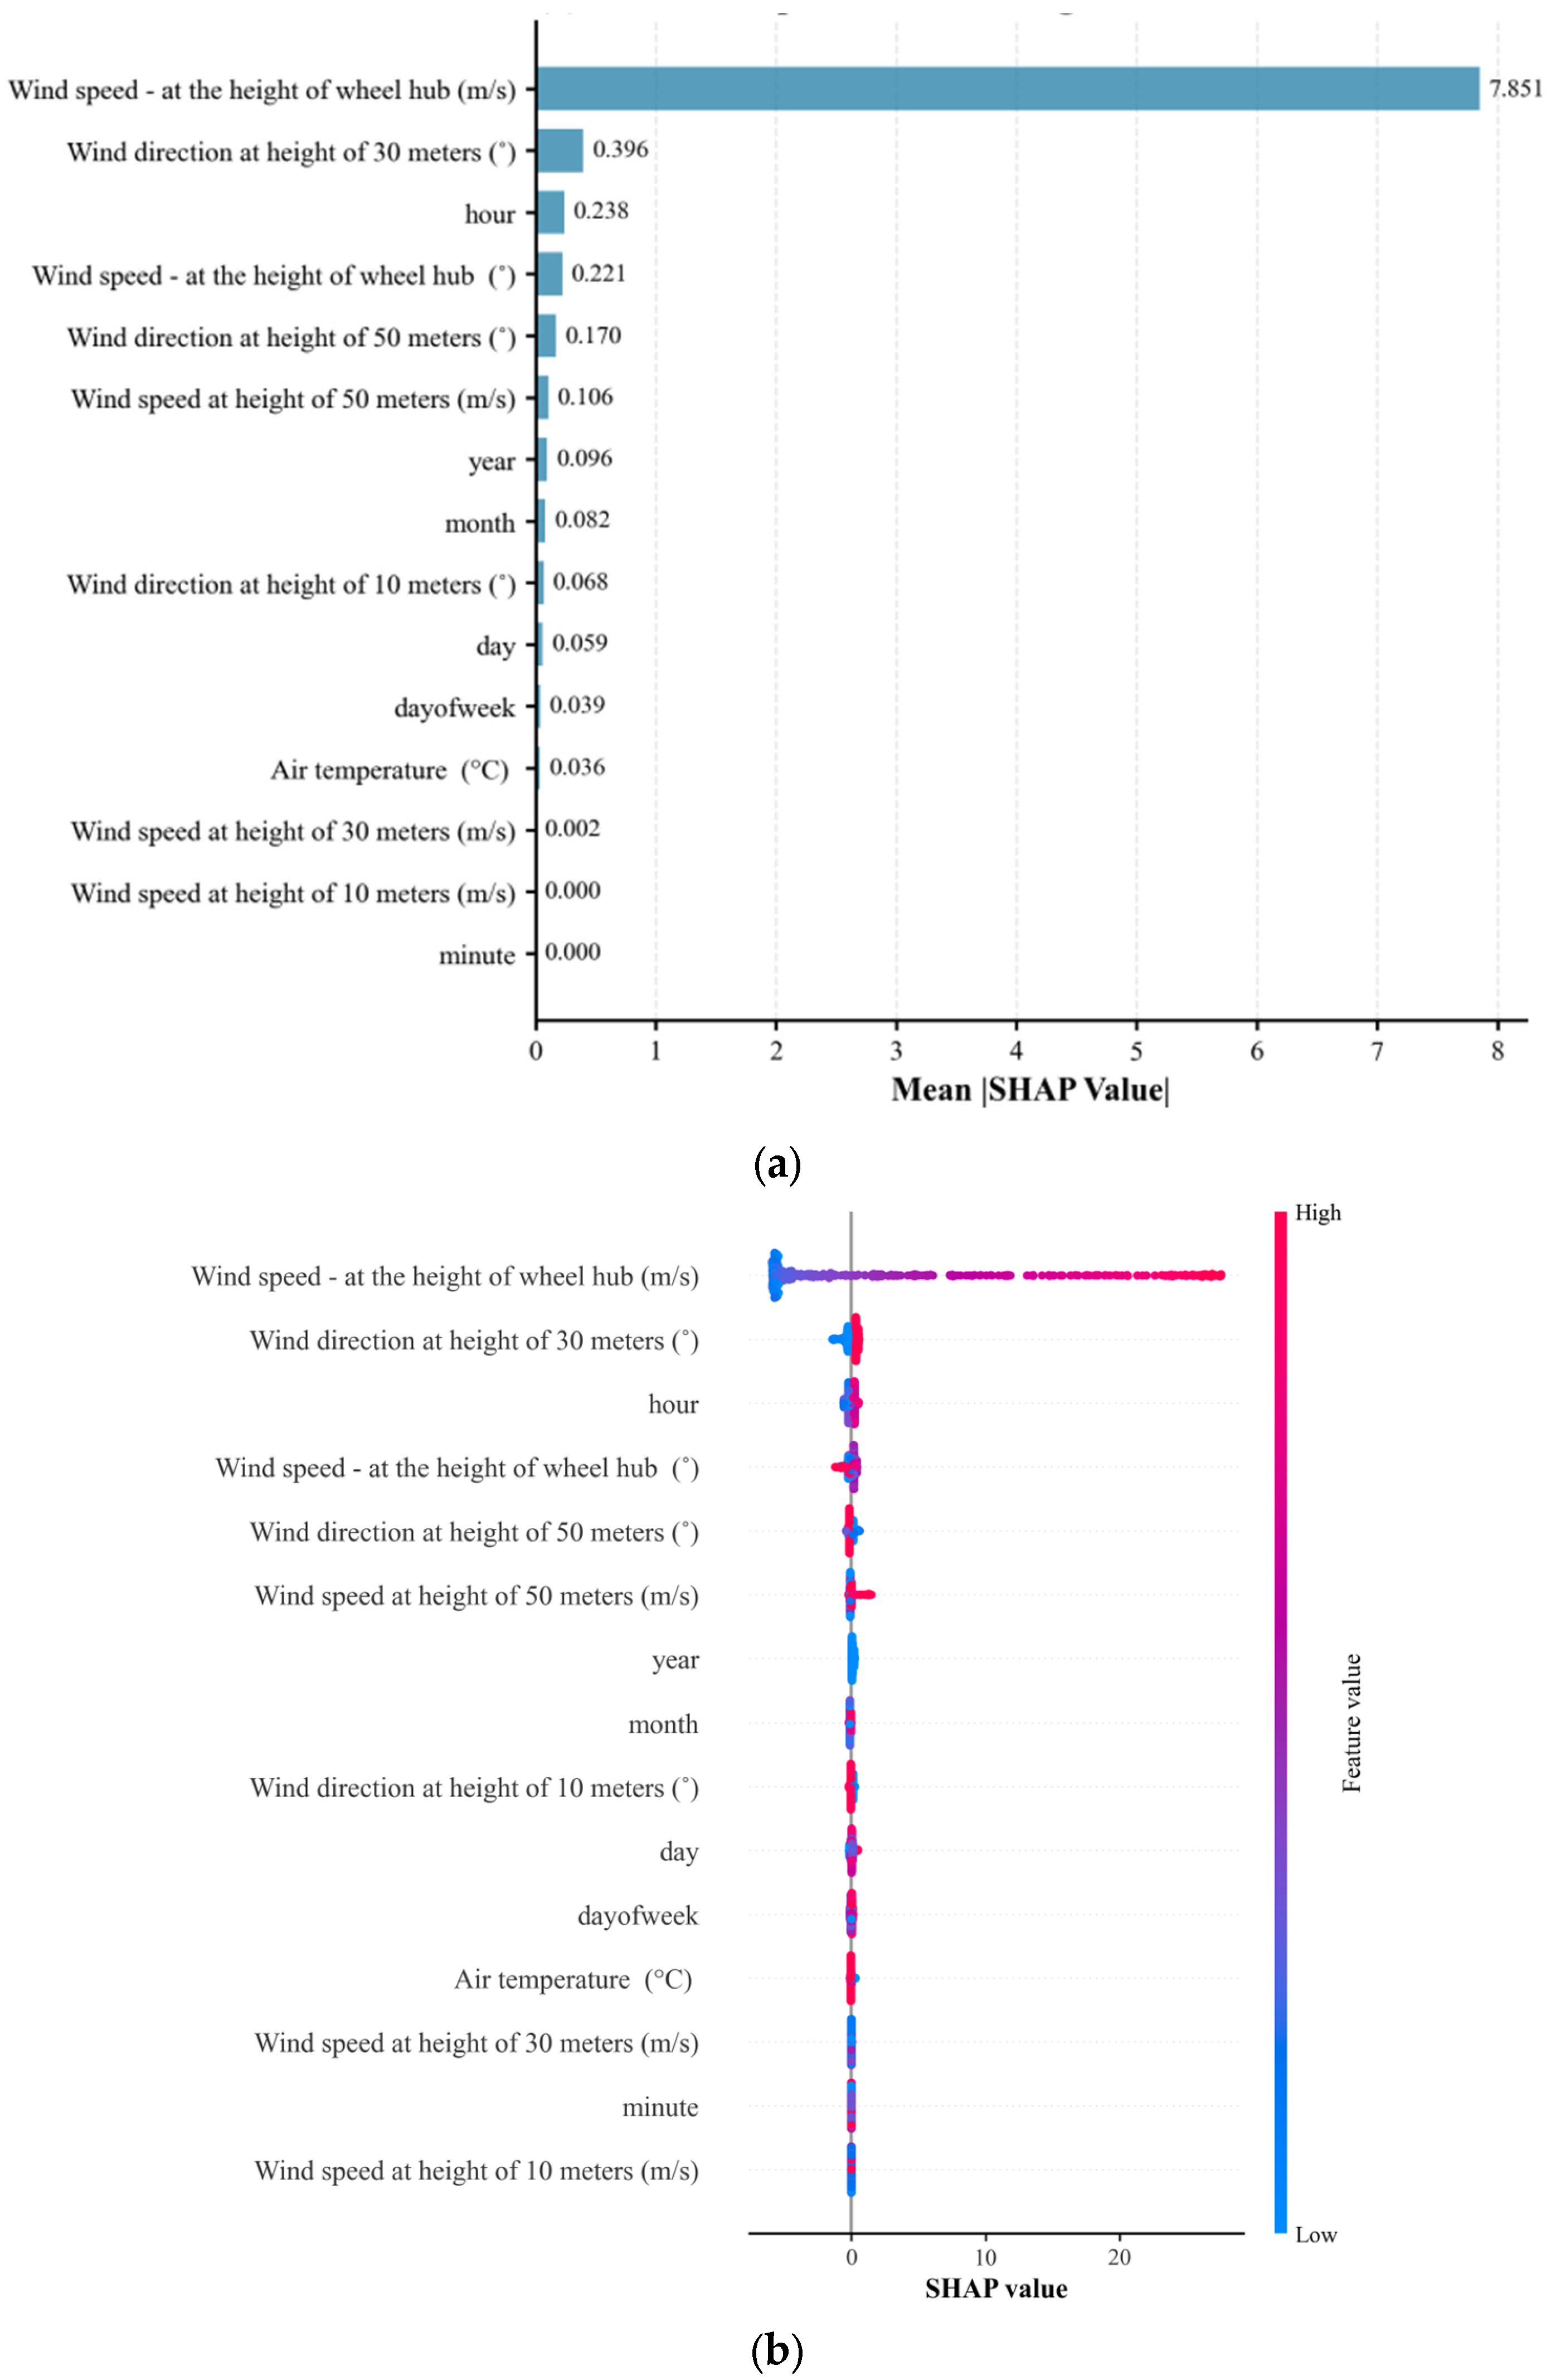
The feature importance ranking for Site 2 is presented in Figure 9a, revealing a pronounced single-feature dominance. The average SHAP value for hub-height wind speed substantially exceeds those of all other input features, establishing it as the primary driver of wind power forecasting. The SHAP contributions of wind speeds at other heights, wind direction, temporal variables, and auxiliary meteorological features remain comparatively low, providing only limited auxiliary information that is overshadowed by hub-height wind speed. The SHAP summary scatter plot for Site 2 (Figure 9b) corroborates this feature contribution pattern at the sample level. The SHAP value distribution for hub-height wind speed spans the widest range among all features and exhibits a highly stable, monotonically positive relationship with power output. Samples with high wind speeds correspond to pronounced positive contributions, whereas samples with low wind speeds correspond to negative or near-zero contributions. The distribution shows no noticeable non-physical reversals, consistent with the physical mechanisms of the wind turbine power curve. In contrast, the SHAP values for all other features cluster near zero, with only minor fluctuations observed in a few local samples, indicating that their influence on prediction outcomes is negligible.
Figure 9.
Feature importance and SHAP summary plots for Site 2: (a) feature importance based on mean absolute SHAP values; (b) SHAP summary plot.
The feature importance analysis for both sites is consistent with the findings from the joint feature distribution analysis, further corroborating the rationale and effectiveness of identifying core and auxiliary features based on data distribution. A systematic comparison of SHAP analysis results across the two sites reveals pronounced site-specific differences in the feature dependency patterns and driving mechanisms underlying wind power forecasting. These variations are influenced by factors such as wind farm topography and vertical wind shear intensity, manifesting in divergent feature contribution structures. At Site 1, complex topography gives rise to pronounced vertical wind shear effects, with wind speeds at different heights exhibiting strong independence and complementarity. As a result, wind speed at a single height is insufficient to fully characterize the wind resource, leading to a synergistic driving pattern across multiple heights. Accurate forecasting therefore requires models to integrate multi-height wind speed information. In contrast, Site 2, characterized by relatively flat terrain and weaker vertical wind shear, shows a high correlation among wind speeds at different heights. Hub-height wind speed alone can capture the core variations in wind resources, while measurements at other heights provide largely redundant information, resulting in a single-dominant driving pattern centered on hub-height wind speed. This cross-site divergence in driving mechanisms not only underscores the utility of SHAP-based interpretability analysis for multi-site wind power forecasting but also provides a practical engineering basis for personalized modeling of wind farms and the optimization of wind measurement systems. For wind farms in complex terrain, maintaining multi-height measurement equipment and incorporating full-dimensional wind speed features into modeling is essential. Conversely, for flat terrain wind farms, measurement systems can be simplified and redundant wind speed features omitted, thereby reducing engineering costs while maintaining forecasting accuracy. This site-specific analysis further demonstrates the adaptability of the proposed prediction framework across multiple wind farms, enabling precise identification of core driving patterns at different sites, avoiding accuracy degradation associated with uniform modeling approaches, and providing a scientific foundation for personalized multi-site power modeling.
5.5. Model Robustness Analysis
To evaluate the robustness of the proposed method, noise perturbation tests were performed on the optimal models from both sites. As summarized in Table 6, the predictive performance of the optimal model at Site 1 gradually declined with increasing noise levels. Specifically, the coefficient of determination (R2) decreased from 0.965 to 0.955, while the root mean square error (RMSE) and mean absolute error (MAE) increased from 3.856 and 2.319 to 4.407 and 2.813, respectively. Overall, the model maintains high predictive accuracy even under 15% noise perturbation, demonstrating its stability and robustness when the input data are subject to disturbances.
Table 6.
Noise Disturbance Test Results.
The optimal model for Site 2 was evaluated under varying intensities of Gaussian noise applied to the input features. The results indicate that predictive performance gradually declined with increasing noise levels. At a 5% noise level, the coefficient of determination (R2) on the test set decreased by only approximately 0.9%, reflecting strong robustness against minor measurement errors. Even at a 10% noise level, the model maintained an R2 value above 0.88, demonstrating excellent resistance to interference. When the noise level increased to 15%, model performance declined further; however, the test set R2 remained above 0.83, indicating that the proposed model preserves substantial predictive stability and generalization capability even under high-noise conditions.
6. Conclusions
This study investigates machine learning-based wind power forecasting in a multi-site setting, with emphasis on model development, hyperparameter tuning, and interpretability analysis. A unified forecasting framework is established to support site-adaptive modeling and to examine differences in the drivers of power output across wind farms. The findings provide methodological insights and practical evidence that may inform wind farm operational planning and power system dispatch. The main conclusions are summarized as follows:
- (1)
- This study develops a wind power forecasting framework that integrates TPE-based hyperparameter optimization with interpretability analysis, utilizing actual meteorological and power data. Through joint feature distribution and cross-site comparative analyses, the framework enables efficient site-specific feature selection, substantially enhancing the physical plausibility and interpretability of the modeling process. Further validation via SHAP analysis demonstrates that multi-height wind speeds constitute the primary driving variables for wind power forecasting, accounting for over 80% of the average absolute SHAP value. In contrast, redundant features, including minute-level time, barometric pressure, and relative humidity, contribute less than 5%. These findings provide a quantitative basis and methodological guidance for feature engineering in wind power forecasting.
- (2)
- This study optimized six baseline machine learning models using TPE-based hyperparameter tuning. After optimization, Extra Trees was identified as the optimal model for Site 1, achieving a test-set R2 of 0.965, with RMSE reduced to 3.872 and MAE reduced to 2.333. Relative to its baseline counterpart, this corresponds to a 4.1% decrease in RMSE and a 7.1% decrease in MAE. Compared with the MLR benchmark, the optimized model achieves substantially larger improvements, with RMSE and MAE reduced by 53.6% and 64.2%, respectively. For Site 2, XGBoost was selected as the optimal model, achieving a test-set R2 of 0.921, with RMSE reduced to 3.049 and MAE reduced to 1.382. Relative to the baseline model, this corresponds to a 0.5% reduction in RMSE and a 3.0% reduction in MAE. Compared with the MLR benchmark, RMSE and MAE are reduced by 34.2% and 57.9%, respectively. Overall, these results demonstrate the effectiveness of the TPE-based optimization strategy in improving predictive performance.
- (3)
- SHAP interpretability analysis revealed the heterogeneity of the driving mechanisms across multiple sites, thereby enhancing the reliability of machine learning models in forecasting wind power output. At Site 1, wind speeds at multiple heights exhibited a synergistic effect, reflecting the complex vertical wind shear characteristics, while at Site 2, wind speeds at hub height were the dominant driving factor. Furthermore, noise perturbation tests confirmed the robustness of the models. The optimal models for both sites maintained high predictive accuracy under 15% noise disturbance: Site 1 retained an R2 value above 0.955, while Site 2 maintained an R2 above 0.83, demonstrating strong resistance to interference and stability. Additionally, the optimal models for both sites exhibit a streamlined structure and low computational complexity. The Extra Trees model at Site 1 employs core hyperparameters of n_estimators = 1000 and max_depth = 15, while the XGBoost model at Site 2 uses n_estimators = 595 and max_depth = 3, further highlighting the practical engineering advantages of the proposed approach. The observed differences in driving mechanisms and robustness highlight the importance of multi-site personalized modeling, providing a core mechanistic explanation and further reinforcing the engineering credibility and practical applicability of machine learning model predictions.
While this study demonstrates high-precision forecasting and provides interpretable analysis of multi-site wind power output, several limitations remain. Based on existing research gaps and the evolving needs of wind power forecasting, the following directions for future research are proposed:
- (1)
- A systematic quantitative analysis and optimization of multicollinearity among features across multiple sites were conducted. Highly collinear features were identified using metrics such as correlation coefficient matrices and variance inflation factors (VIFs). Based on the results of this analysis, personalized feature selection and fusion strategies were developed to further enhance model training efficiency and prediction robustness. This approach provides a rigorous quantitative foundation for feature engineering in wind power forecasting.
- (2)
- By integrating numerical weather prediction (NWP) data with extreme weather labels, we develop a robust prediction model for extreme operating conditions. For extreme weather events, such as typhoons, cold waves, and severe convective storms, we incorporate meteorological extreme value features along with an operating condition classification module. This approach enhances the model’s predictive reliability under sudden disturbances, providing valuable support for power grid scheduling during extreme operating conditions.
- (3)
- To enhance the engineering and lightweight capabilities of the framework, the predictive model is encapsulated into a deployable software interface. The model inference speed is optimized to facilitate an end-to-end process that enables real-time data input and prediction output, thereby meeting the engineering requirements for real-time dispatch at wind farms.
Author Contributions
Methodology, X.L. and J.G.; software, X.L.; validation, X.L., Y.Z. and Y.W.; formal analysis, X.L. and J.G.; investigation, X.L., F.W., R.Z. and Y.W.; data curation, X.L.; writing—original draft preparation, X.L.; writing—review and editing, Z.W., J.G., Y.Z., F.W., R.Z. and Y.W.; visualization, X.L.; supervision, Z.W. and J.G.; funding acquisition, J.G. All authors have read and agreed to the published version of the manuscript.
Funding
This work was supported by the Key Program of National Social Science Foundation of China (Grant No. 23AGL039); the Foundation of the Shaanxi Province Key Research and Development under Grant 2021GY-341; and the Shaanxi Key Laboratory of Integrated and Intelligent Navigation under Grant SKLIIN-20190102.
Institutional Review Board Statement
Not applicable.
Informed Consent Statement
Not applicable.
Data Availability Statement
The data that support the findings of this study are available from the corresponding author upon reasonable request.
Conflicts of Interest
The authors declare no conflicts of interest.
References
- Qin, B.; Wang, H.; Liao, Y.; Li, H.; Ding, T.; Wang, Z.; Li, F.; Liu, D. Challenges and Opportunities for Long-Distance Renewable Energy Transmission in China. Sustain. Energy Technol. Assess. 2024, 69, 103925. [Google Scholar] [CrossRef] [Scilit]
- Qin, B.; Li, H.; Wang, Z.; Jiang, Y.; Lu, D.; Du, X.; Qian, Q. New Framework of Low-Carbon City Development of China: Underground Space Based Integrated Energy Systems. Undergr. Space 2024, 14, 300–318. [Google Scholar] [CrossRef] [Scilit]
- Liu, W.; Ge, R.; Li, H.; Ge, J. Impact of Large-Scale Wind Power Integration on Small Signal Stability Based on Stability Region Boundary. Sustainability 2014, 6, 7921–7944. [Google Scholar] [CrossRef] [Scilit]
- Zhang, Z.; Qin, B.; Ding, T.; Gao, X.; Zhang, Y. CBAM-CNN Based Transient Overvoltage Preventive Control Considering Piecewise Linear Control Sensitivity. IEEE Trans. Power Syst. 2025, 40, 3645–3656. [Google Scholar] [CrossRef] [Scilit]
- Wang, H.; Qin, B.; Su, Y.; Li, F.; Hong, S.; Wang, Y.; Ding, T. Dynamic Carbon Market Driven Multi-Stage Scheduling Strategy for Hydrogen Integrated Energy Systems. Renew. Energy 2026, 266, 125652. [Google Scholar] [CrossRef] [Scilit]
- Sun, K.; Yang, D.; Wang, D.; Zhang, F. Development of a Physics-Guided Bidirectional Long Short-Term Memory for Wind Power Forecasting. Eng. Appl. Artif. Intell. 2026, 167, 113798. [Google Scholar] [CrossRef] [Scilit]
- Qin, B.; Chen, P.; Zhang, Z.; Wang, H.; Ding, T. Coordinated Preventive Control Strategy for Transient Overvoltage Suppression in Hybrid AC/DC Sending-Side Systems. Int. J. Electr. Power Energy Syst. 2025, 171, 111017. [Google Scholar] [CrossRef] [Scilit]
- Li, H.; Qin, B.; Wang, S.; Ding, T.; Liu, J.; Wang, H. Aggregate Power Flexibility of Multi-Energy Systems Supported by Dynamic Networks. Appl. Energy 2025, 377, 124565. [Google Scholar] [CrossRef] [Scilit]
- World Energy Outlook 2023—Analysis. Available online: https://www.iea.org/reports/world-energy-outlook-2023 (accessed on 27 January 2026).
- Wang, H.; Qin, B.; Su, Y.; Li, F.; Hong, S.; Ding, T. Coordinated Planning of Mobile Electric-hydrogen Energy Storage for Remote Power System Resilience Enhancement. J. Energy Storage 2026, 147, 120160. [Google Scholar] [CrossRef] [Scilit]
- Qin, B.; Hong, S.; Wang, H.; Zhao, J.; Li, H.; Chen, P.; Ding, T. Non-Isothermal Dynamic Model and Collaborative Optimization for Multi-Energy System Considering Pipeline Energy Storage. J. Energy Storage 2026, 141, 119083. [Google Scholar] [CrossRef] [Scilit]
- Amarasinghe, A.G.; Perera, E.N.C. Modeling Predictive Suitability to Determine Potential Areas for Establishing Wind Power Plants in Sri Lanka. Model. Earth Syst. Environ. 2021, 7, 443–454. [Google Scholar] [CrossRef] [Scilit]
- Guo, N.; Zheng, H.; Zhou, Q.; Yin, X. A Novel Combination Forecasting Model for Short-Term Wind Power. J. Atmos. Sol.-Terr. Phys. 2026, 279, 106731. [Google Scholar] [CrossRef] [Scilit]
- Wang, H.; Qin, B.; Hong, S.; Cai, Q.; Li, F.; Ding, T.; Li, H. Optimal Planning of Hybrid Hydrogen and Battery Energy Storage for Resilience Enhancement Using Bi-Layer Decomposition Algorithm. J. Energy Storage 2025, 110, 115367. [Google Scholar] [CrossRef] [Scilit]
- Qin, B.; Wang, H.; Li, F.; Liu, D.; Liao, Y.; Li, H. Towards Zero Carbon Hydrogen: Co-Production of Photovoltaic Electrolysis and Natural Gas Reforming with CCS. Int. J. Hydrogen Energy 2024, 78, 604–609. [Google Scholar] [CrossRef] [Scilit]
- Jia, L.; Wang, G.; Pang, X. A Short-Term Wind Power Forecasting Approach Based on Model Configuration Optimization via Prequential-Cross Cooperative Validation Estimation. Sustainability 2025, 17, 9929. [Google Scholar] [CrossRef] [Scilit]
- Yu, S.; Vautard, R. A Transfer Method to Estimate Hub-Height Wind Speed from 10 Meters Wind Speed Based on Machine Learning. Renew. Sustain. Energy Rev. 2022, 169, 112897. [Google Scholar] [CrossRef] [Scilit]
- Jiang, R.; Fang, F.; Rodríguez-Andina, J.J.; Song, Z.; Liu, J.; Chen, Y.; Wang, H. Artificial Intelligence in Wind Turbine Fault Diagnosis: A Systematic Knowledge Mapping and Trend Analysis. Renew. Sustain. Energy Rev. 2026, 226, 116321. [Google Scholar] [CrossRef] [Scilit]
- Guo, X.; Zeng, P.; Xiong, X.; Wang, G.; Cui, Y. Short-Term Wind Power Forecasting Methods Based on Machine Learning: A Review and Case Study. Energy Rep. 2025, 14, 3753–3782. [Google Scholar] [CrossRef] [Scilit]
- Zhang, W.; Yan, H.; Xiang, L.; Shao, L. Wind Power Generation Prediction Using LSTM Model Optimized by Sparrow Search Algorithm and Firefly Algorithm. Energy Inf. 2025, 8, 35. [Google Scholar] [CrossRef] [Scilit]
- Almutairi, A.; Alrumayh, O. An Intelligent Deep Learning Based Prediction Model for Wind Power Generation. Comput. Electr. Eng. 2022, 101, 108000. [Google Scholar] [CrossRef] [Scilit]
- Krevnevičiūtė, J.; Mitkevičius, A.; Naujokaitis, D.; Lagzdinytė-Budnikė, I.; Marčiukaitis, M. The Forecast of the Wind Turbine Generated Power Using Hybrid (LTC + XGBoost) Model. Appl. Sci. 2025, 15, 7615. [Google Scholar] [CrossRef] [Scilit]
- Salcedo-Sanz, S.; Cornejo-Bueno, L.; Prieto, L.; Paredes, D.; García-Herrera, R. Feature Selection in Machine Learning Prediction Systems for Renewable Energy Applications. Renew. Sustain. Energy Rev. 2018, 90, 728–741. [Google Scholar] [CrossRef] [Scilit]
- Baitureyeva, A.; Yang, T.; Wang, H.S. Development of Machine Learning-Aided Rapid CFD Prediction for Optimal Urban Wind Environment Design. Sustain. Cities Soc. 2025, 121, 106208. [Google Scholar] [CrossRef] [Scilit]
- Wang, H.; Qin, B.; Hong, S.; Xu, X.; Su, Y.; Lu, T.; Ding, T. Enhanced GAN-Based Joint Wind-Solar-Load Scenario Generation With Extreme Weather Labelling. IEEE Trans. Smart Grid 2025, 16, 4213–4224. [Google Scholar] [CrossRef] [Scilit]
- Li, M.; Yang, M.; Yu, Y. Short-Term Regional Wind Power Forecast Method Based on Hierarchical Graph Neural Network and Extreme Value Theory. Energy Convers. Manag. 2025, 341, 120002. [Google Scholar] [CrossRef] [Scilit]
- Qin, B.; Liu, J.; Wang, H.; Wang, Z.; Xiong, Z.; Wang, M.; Qian, Q. Energy-Efficient and Reliable Urban Rail Transit: A New Framework Incorporating Underground Energy Storage Systems. iEnergy 2025, 4, 86–97. [Google Scholar] [CrossRef] [Scilit]
- Bergstra, J.; Bardenet, R.; Bengio, Y.; Kégl, B. Algorithms for Hyper-Parameter Optimization. Adv. Neural Inf. Process. Syst. 2011, 24, 2546–2554. [Google Scholar]
- Guan, X.; Li, Y.; Shao, Y. Short-Term Wind Power Prediction Based on TPE-VMD-Transformer-GRU. In Proceedings of the 2025 IEEE 26th China Conference on System Simulation Technology and Its Applications (CCSSTA), Shenzhen, China, 11–13 July 2025; pp. 893–898. [Google Scholar]
- Lu, P.; Ye, L.; Zhao, Y.; Dai, B.; Pei, M.; Tang, Y. Review of Meta-Heuristic Algorithms for Wind Power Prediction: Methodologies, Applications and Challenges. Appl. Energy 2021, 301, 117446. [Google Scholar] [CrossRef] [Scilit]
- Khattak, A.; Chan, P.-W.; Chen, F.; Peng, H. Prediction and Interpretation of Low-Level Wind Shear Criticality Based on Its Altitude above Runway Level: Application of Bayesian Optimization–Ensemble Learning Classifiers and SHapley Additive exPlanations. Atmosphere 2022, 13, 2102. [Google Scholar] [CrossRef] [Scilit]
- Lundberg, S.M.; Lee, S.-I. A Unified Approach to Interpreting Model Predictions. In Proceedings of the 31st International Conference on Neural Information Processing Systems; Curran Associates Inc.: Red Hook, NY, USA, 2017; pp. 4768–4777. [Google Scholar]
- White, C.; Safari, M.; Sukthanker, R.; Ru, B.; Elsken, T.; Zela, A.; Dey, D.; Hutter, F. Neural Architecture Search: Insights from 1000 Papers 2023. arXiv 2023, arXiv:2301.08727. [Google Scholar]
- Renewables 2023—Analysis. Available online: https://www.iea.org/reports/renewables-2023 (accessed on 27 January 2026).
- Sarangi, S.; Dash, P.K.; Bisoi, R. Short-Term Prediction of Wind Power Using an Improved Kernel Based Optimized Deep Belief Network. Energy Convers. Manag. 2024, 316, 118821. [Google Scholar] [CrossRef] [Scilit]
- Habtemariam, E.T.; Kekeba, K.; Martínez-Ballesteros, M.; Martínez-Álvarez, F. A Bayesian Optimization-Based LSTM Model for Wind Power Forecasting in the Adama District, Ethiopia. Energies 2023, 16, 2317. [Google Scholar] [CrossRef] [Scilit]
- Huang, S.; Yan, C.; Qu, Y. Deep Learning Model-Transformer Based Wind Power Forecasting Approach. Front. Energy Res. 2023, 10, 1055683. [Google Scholar] [CrossRef] [Scilit]
- Hanifi, S.; Cammarono, A.; Zare-Behtash, H. Advanced Hyperparameter Optimization of Deep Learning Models for Wind Power Prediction. Renew. Energy 2024, 221, 119700. [Google Scholar] [CrossRef] [Scilit]
- Yassen, M.A.; El-Kenawy, E.-S.M.; Abdel-Fattah, M.G.; Ismail, I.; Mostafa, H.E.-D.S. Explainable Artificial Intelligence for Wind Power Forecasting Model Based on Long Short-Term Memory. Neural. Comput. Appl. 2025, 37, 14589–14611. [Google Scholar] [CrossRef] [Scilit]
- Ruan, S.; Chen, Y.; Lu, G.; Li, Z.; Chen, S.; Wang, C.; Li, T. Multifactor Interpretability Method for Offshore Wind Power Output Prediction Based on TPE-CatBoost-SHAP. Comput. Electr. Eng. 2025, 123, 110081. [Google Scholar] [CrossRef] [Scilit]
- Wang, Y.; Zou, R.; Liu, F.; Zhang, L.; Liu, Q. A Review of Wind Speed and Wind Power Forecasting with Deep Neural Networks. Appl. Energy 2021, 304, 117766. [Google Scholar] [CrossRef] [Scilit]
- Suárez-Cetrulo, A.; Haughton, D.; Burnham-King, L.; Carbajo, R. Wind Power Forecasting Using Ensemble Learning for Day-Ahead Energy Trading. Renew. Energy 2022, 191, 685–698. [Google Scholar] [CrossRef] [Scilit]
- Wang, X.; Hao, Y.; Yang, W. Novel Wind Power Ensemble Forecasting System Based on Mixed-Frequency Modeling and Interpretable Base Model Selection Strategy. Energy 2024, 297, 131142. [Google Scholar] [CrossRef] [Scilit]
- Tian, C.; Niu, T.; Li, T. Developing an Interpretable Wind Power Forecasting System Using a Transformer Network and Transfer Learning. Energy Convers. Manag. 2025, 323, 119155. [Google Scholar] [CrossRef] [Scilit]
- Verdone, A.; Panella, M.; De Santis, E.; Rizzi, A. A Review of Solar and Wind Energy Forecasting: From Single-Site to Multi-Site Paradigm. Appl. Energy 2025, 392, 126016. [Google Scholar] [CrossRef] [Scilit]
- Al-Qaness, M.A.A.; Ewees, A.A.; Aseeri, A.O.; Abd Elaziz, M. Wind Power Forecasting Using Optimized LSTM by Attraction–Repulsion Optimization Algorithm. Ain Shams Eng. J. 2024, 15, 103150. [Google Scholar] [CrossRef] [Scilit]
- Yin, L.; Sun, Y. BiLSTM-InceptionV3-Transformer-Fully-Connected Model for Short-Term Wind Power Forecasting. Energy Convers. Manag. 2024, 321, 119094. [Google Scholar] [CrossRef] [Scilit]
- Wen, H.; Pinson, P.; Gu, J.; Jin, Z. Wind Energy Forecasting with Missing Values within a Fully Conditional Specification Framework. Int. J. Forecast. 2024, 40, 77–95. [Google Scholar] [CrossRef] [Scilit]
- Wang, S.; Liu, H.; Yu, G. Short-Term Wind Power Combination Forecasting Method Based on Wind Speed Correction of Numerical Weather Prediction. Front. Energy Res. 2024, 12, 1391692. [Google Scholar] [CrossRef] [Scilit]

Disclaimer/Publisher’s Note: The statements, opinions and data contained in all publications are solely those of the individual author(s) and contributor(s) and not of MDPI and/or the editor(s). MDPI and/or the editor(s) disclaim responsibility for any injury to people or property resulting from any ideas, methods, instructions or products referred to in the content. |
© 2026 by the authors. Licensee MDPI, Basel, Switzerland. This article is an open access article distributed under the terms and conditions of the Creative Commons Attribution (CC BY) license.