


Abstract
Green and Sustainable Remediation (GSR) has gained widespread recognition in contaminated site remediation. Several countries and international organizations have issued standards and guidelines for GSR frameworks, such as ISO 18504:2017 and the guideline developed by the Sustainable Remediation Forum UK. However, these frameworks remain largely qualitative and lack quantitative, operational tools for comparing remediation technologies, such as chemical oxidation, thermal desorption, and biopiles. To address this gap, this study develops a prospective decision-making model based on GSR. The model selects three environmental indicators, two economic indicators, and one social indicator, determines their weights using the entropy weight method, and adopts VIsekriterijumska optimizacija i KOmpromisno Resenje (VIKOR) for compromise ranking under conflicting criteria. Applied to a petroleum hydrocarbon-contaminated site in the Yangtze River Delta region of China, the model yields a stable ranking of biopiles > chemical oxidation > thermal desorption across different compromise scenarios, and sensitivity analysis confirms its robustness. A complementary Life Cycle Assessment (LCA) using SimaPro 9.6.0.1 further identifies environmental impact sources and supports GSR improvement recommendations. The results indicate that the environmental impacts of thermal desorption are dominated by tail-gas treatment and backfilling, whereas those of biopiles mainly originate from nutrient and material inputs.
1. Introduction
Green and Sustainable Remediation (GSR) of contaminated sites has become an international consensus in the site remediation industry, focusing not only on characteristic pollutant removal but also on the environmental, economic, and social impacts of the remediation process. Several representative frameworks and standards have been developed to guide the practical implementation of GSR. The U.S. Sustainable Restoration Forum (SURF) has proposed a framework for implementing sustainable principles throughout the restoration process [1] and continues to update its indicators and tool resources. The UK Sustainable Remediation Forum (SuRF-UK) proposed a tiered sustainability assessment approach in 2010 [2]. It encourages the selection of a strategy based on predictive data and scenario analysis prior to remediation. The American Society for Testing and Materials (ASTM) released a standard guide [3], which has been updated through 2025 [4]. The International Organization for Standardization (ISO) issued ISO 18504:2017 [5] to standardize the terminology and procedures of sustainable remediation. China issued an association-type standard in 2020 to clarify sustainable restoration processes [6]. These GSR standards and guidelines usually define the sustainability of remediation strategies in terms of three dimensions: environmental, economic, and social. The environmental dimension is mainly related to resource and energy consumption, greenhouse gas emissions, and water impacts during the remediation process. The economic dimension focuses on direct remediation costs, operation and maintenance costs [7]. The social dimension mainly focuses on human health and potential impacts on neighboring communities [8]. However, these dimensions are mostly at the principle or qualitative level, and there is still a lack of quantitative and comprehensive tools that can directly support technology selection in prospective decision-making situations.
For contaminated site remediation, prospective technology selection plays a critical role in implementing GSR, which requires balancing multiple and conflicting environmental, economic, and social considerations. To determine if the technology complies with the GSR principles, qualitative, semi-quantitative, and quantitative analysis approaches are typically employed, considering the multifaceted and inconsistent evaluation indexes of GSR [9]. Qualitative evaluation, such as expert scoring, has the advantages of easy operation and low communication costs, but is highly dependent on subjective judgment. Although semi-quantitative evaluation assigns values or grades to the indicators, it is challenging to assess the trade-offs between various options in a multi-objective conflict situation [10].
In recent years, some quantitative methods for evaluating remediation technologies for contaminated sites have also emerged, but important limitations remain. Some studies only suggested an evaluation framework of coupled Health Risk Assessment (HRA) and Life Cycle Assessment (LCA), which incorporated the risk control effect and the secondary environmental impact of the remediation process into the same evaluation perspective [11]. However, the results of this study are still dominated by the environmental and risk dimensions and provide limited support for the unified quantification and direct comparison of economic and social impacts. Some studies proposed GSR evaluation frameworks but lacked a clear method for comparing remediation technologies. For example, Dong [12] constructed a GSR assessment method framework for contaminated sites based on methods such as Cost–Benefit Analysis (CBA) and LCA. Nevertheless, the results were mostly presented as parallel comparisons, and explicit ranking rules for selecting the best compromise solution under multi-objective conflict were still lacking. Some studies further introduced quantitative methods for social dimensions into sustainability assessment, but they were mainly concerned with the overall evaluation of remediation performance after implementation rather than with prospective technology selection. For instance, Li et al. [13] constructed a quantitative sustainability assessment framework by combining LCA, economic analysis and social data, but they focused more on the comprehensive assessment of the implementation effect of the restoration program, which is not enough to directly support the decision-making of technology preference in the pre-implementation stage of remediation. These studies have not yet provided a quantitative and operational decision-support tool for the prospective selection of contaminated site remediation technologies under GSR principles. Specifically, a transparent framework is still lacking that can simultaneously integrate environmental, economic, and social indicators, handle trade-offs among these criteria, and generate a clear ranking of remediation technologies for prospective decision-making.
In this context, a representative petroleum hydrocarbon-contaminated site in the Yangtze River Delta region of China is selected as the case study for prospective technology selection under GSR principles. The feasible remediation technologies for this case include chemical, thermal, and biological approaches [14], which differ markedly in their operational characteristics and impacts. Chemical oxidation relies on oxidants to degrade organic contaminants, and its performance depends on parameters such as oxidant dosage and reaction time [15]. Thermal desorption removes contaminants through high-temperature heating, with key operational parameters including carrier gas, heating rate, and heating time [16]. In contrast, biological remediation technologies such as biopiles utilize microbial activity to degrade contaminants under controlled nutrient conditions [17].
In addition to pollutant removal, the remediation process in the studied case may generate releases to air, water, and soil, as well as indirect emissions associated with energy use, material production, and transportation. Thermal desorption may additionally generate tail-gas emissions [16], whereas chemical and biological approaches may also generate secondary emissions and wastes related to reagent use and material inputs [18]. Therefore, the environmental impacts should be assessed in terms of secondary emissions and resource burdens generated during the remediation process. LCA provides an effective tool for quantifying such environmental burdens in accordance with ISO 14040 [19] and ISO 14044 [20], while a broader decision framework is still required to integrate environmental, economic, and social impacts, particularly when trade-offs among conflicting criteria must be addressed. In this context, Multi-Criteria Decision Analysis (MCDA) provides a suitable basis for such integrated decision-making [21]. Compared with commonly used MCDA methods that mainly focus on additive aggregation or distance-based ranking [10], VIsekriterijumska optimizacija i KOmpromisno Resenje (VIKOR) [22] is particularly suitable for the present study because it explicitly addresses trade-offs among conflicting criteria and identifies a compromise solution.
This paper therefore proposes a prospective technical decision-making model for contaminated site remediation technologies based on GSR. Quantifiable and comparable assessment indicators are selected in the environmental, economic and social dimensions, and the entropy weight method is used to determine the indicator weights objectively. VIKOR is then applied to provide a transparent compromise ranking of remediation technologies for prospective decision-making. In this way, the proposed model addresses the main gap in the existing literature by providing a quantitative and operational framework for prospective contaminated site technology selection under GSR principles.
2. Methods and Data
2.1. General Framework for the Model
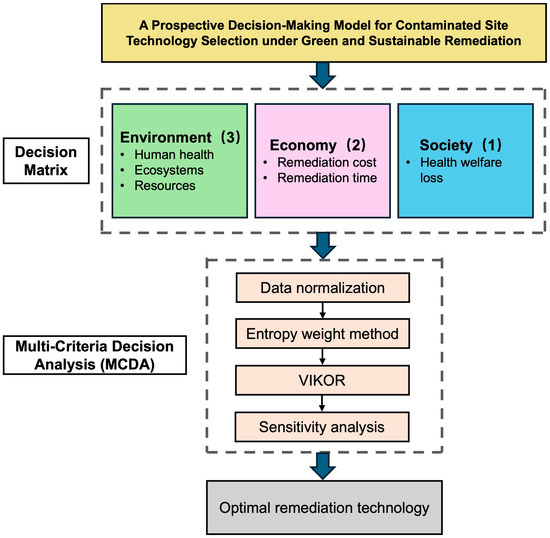
To illustrate the process of modeling in this paper, the general framework is shown in Figure 1. First, six decision matrix indicators are selected based on the GSR concept, including three environmental indicators (human health, ecosystems, and resources), two economic indicators (remediation cost and remediation time), and one social indicator (health welfare loss). Second, given the substantial differences in units and magnitudes among indicators, the indicator data are normalized to obtain a dimensionless matrix, preventing any indicator from dominating the aggregation process merely due to its numerical scale. Subsequently, the entropy weight method is used to assign objective weights to each indicator, and the VIKOR method is further introduced to conduct comprehensive decision-making and scenario analysis. Finally, deterministic sensitivity analysis is performed to further confirm the robustness of the model.
Figure 1.
The general framework for the model.
2.2. GSR-Based Prospective Decision Matrix Construction
In the prospective decision-making stage of contaminated site remediation, to realize the GSR comparison of different remediation technologies, it is necessary to select quantifiable and comparable indicators to characterize the impacts of the environmental, economic, and social dimensions, and the specific results of the selection are as follows:
- (1)
- Environmental dimension
LCA can be used to assess the environmental impact of energy consumption, resource use and waste generation at all stages of pollution-site remediation. Particularly in the ex-ante context of contaminated site remediation, decision-making is often conducted before full implementation, when operational data are not yet available. In such cases, LCA can be applied prospectively to estimate the potential environmental burdens of different remediation technologies based on engineering design and literature-derived inventory data, thereby supporting environmentally informed technology selection [23,24].
Among the commonly used life cycle impact assessment (LCIA) methods, ReCiPe 2016, TRACI, and CML 2001 are widely applied in environmental assessment studies. However, TRACI is primarily developed for North American conditions [25], while CML 2001 mainly provides midpoint-oriented results [26] and is less directly suited to the endpoint-level integration required for decision-making in this study. Therefore, the ReCiPe 2016 endpoint method was adopted in SimaPro 9.6.0.1 to compute the environmental indicators. This method provides an integrated framework that translates midpoint environmental impacts into endpoint damage categories, including human health, ecosystems, and resources [27], which were adopted in this study as the three environmental indicators in the decision matrix. The endpoint method can integrate and summarize the environmental impacts of multiple midpoints along the causal chain, and it avoids using too many midpoint indicators at the prospective decision stage, allowing for a clear comparison between remediation technologies.
- (2)
- Economic dimension
In this study, the economic dimension is designed for prospective decision-making. Accordingly, the economic performance of each remediation technology is represented by two comparable indicators, namely remediation cost (USD/m3) and remediation time (d/m3) per treatment volume. The remediation cost reflects the difference in remediation technologies in terms of the cost required for remediation implementation, and the remediation time characterizes the economic implications of remediation technologies in terms of implementation cycle and site resource occupation. In the prospective technology decision-making stage of the contaminated site, remediation time will directly affect the site redevelopment schedule, capital turnover efficiency, etc. To avoid duplication in the measurement of environmental and social impacts, this paper incorporates remediation time into the economic dimension and defines it as “the ratio of the time required for completing remediation to the treatment volume”.
- (3)
- Social dimension
In the prospective technology selection phase of contaminated site remediation, the works have not yet been implemented, and information on social impacts directly related to the remediation activities (social acceptance, community impacts, etc.) is usually difficult to obtain, highly dependent on the specific project implementation program and the regional social context, and is not applicable to quantitative comparisons at the pre-assessment stage. Consequently, health welfare loss (USD/m3) is chosen as a social indicator and is obtained by monetizing Disability-Adjusted Life Years (DALYs), which are derived from the human health impact endpoint results of LCA’s ReCiPe 2016 method [27]. The formula for this indicator is shown in Equation (1), where the Value of a Statistical Life Year (VSLY) is the unit value of monetized health risk and is set at 164,974 USD/a [28].
To ensure that different remediation technology solutions are comparable under the same boundary and scale, the functional unit is defined as “remediation of 1 m3 of contaminated soil to achieve the remediation goal”. In summary, the decision matrix of the model consists of six GSR-based prospective indicators (Table 1), which provide an input basis for subsequent multi-objective decision analysis.
Table 1.
GSR-based decision matrix indicators for prospective decision-making in contaminated site remediation.
2.3. Data Normalization and Entropy-Based Weighting
In multi-criteria decision-making problems, indicators are often expressed in heterogeneous units, and their numerical scales may differ by several orders of magnitude. To remove the influence of differing units, magnitudes, and value ranges among evaluation indicators on the comprehensive assessment results [29], the indicators’ results were first subjected to normalization. The six indicators in this paper are defined as negative indicators, meaning that the smaller the value of the indicator, the better the evaluation effect. The indicators were normalized using the Min–Max method [30], which transforms all variables to a common scale ranging from 0 to 1. This method is particularly suitable for the VIKOR approach, as it facilitates the comparison of distances to the ideal and nadir solutions [31]. Compared with alternative normalization methods (e.g., z-score [32]), the Min–Max method is more directly interpretable for subsequent weighting and ranking. All indicators were normalized using the Min–Max method by Equation (2) to eliminate unit and scale effects and to ensure comparability among heterogeneous indicators:
where denotes restoration technology options, denotes evaluation indicators, and represents the normalized value of the i-th technology under the j-th indicator.
The normalization decision matrix provides a consistent and unbiased basis for objective weight determination and multi-objective decision analysis, enabling the integration of environmental, economic, and social indicators within a unified decision framework.
Weight allocation uses an objective assignment method—the entropy weight method [33]—which determines the weight by the degree of dispersion of the indicator data after standardization. In this method, a greater dispersion of an indicator across technologies indicates that the indicator provides more information for distinguishing among the technologies, and it is therefore assigned a higher objective weight [34]. This objectivity is particularly critical for environmental remediation technology selection, where stakeholder interests may conflict and subjective judgments could compromise evaluation impartiality.
First, the weight of the i-th technology under the j-th indicator is calculated using Equation (3):
Then, the information entropy of the indicator is defined by Equation (4):
where the entropy value ranges from 0 to 1. A larger entropy value indicates lower variability and less discriminative information.
The final weight of indicators is given by Equation (5):
2.4. The VIKOR Method
For prospective contaminated site remediation, environmental, economic, and social indicators often show clear trade-offs, and decision-makers must consider not only the overall performance of a technology but also whether it performs unacceptably poorly on any critical criterion. Among the available MCDA approaches, VIKOR was selected because it is particularly suitable for problems involving conflicting criteria and the need for a compromise solution. VIKOR can make a trade-off between the maximum group utility and the minimum individual regret, making it suitable for finding the closest ideal solution under conditions of multi-objective conflict [35]. It aligns more closely with the decision-making context of remediating contaminated sites as an MCDA approach, where environmental, economic, and social impacts coexist [36].
Let denote the value of the i-th technology under the j-th indicator. The best value and the worst value are computed as follows:
The utility measure and the regret measure are calculated as follows:
In the VIKOR method, the coefficient v (ranging from 0 to 1) represents the weight of maximum group utility, while (1 − v) reflects the weight of individual regret [37]. A higher v indicates a greater focus on the program’s overall performance, whereas a lower v indicates a greater focus on avoiding dominance by the worst-performing criterion. Different values of the compromise coefficient v reflect the decision-maker’s preference [38], and the coefficient is used to describe the preference trade-off between maximum group utility (S) and minimum individual regret (R) [39].
To reflect the differences in decision-making preferences under different environmental management objectives, three representative scenarios of the compromise coefficient v (0.3, 0.5, and 0.7) are considered, and their definitions and management implications are shown in Table 2. Specifically, represents the balanced compromise scenario, while and place greater emphasis on individual regret and group utility, respectively.
Table 2.
Decision scenarios under different values of the compromise coefficient v.
Finally, calculate the VIKOR compromise (Q) to measure the comprehensive performance of each technology using Equation (10):
where .
The Q value is the final compromise index in the VIKOR method, integrating both group utility and individual regret, and a smaller Q indicates better comprehensive performance [40]. Therefore, comparing the Q-based ranking results provides a direct basis for identifying the preferred technology and for evaluating the stability of the ranking under different preference scenarios. The decision result is not affected by the decision-making preference if the ranking remains constant across a range of v values. If the ranking changes, the weights and trade-offs of individual indicators should be combined to determine the final decision.
The VIKOR method adopted in this paper is only used to identify the relative differences in the GSR performance of different restoration technologies at the prospective decision-making stage, rather than to make an absolute judgment on the merits of the technologies themselves.
2.5. Deterministic Sensitivity Analysis
Given that most of the relevant parameters in the prospective decision-making phase of contaminated site remediation are derived from the literature and preliminary engineering assumptions, it is usually difficult to obtain reliable information on probability distributions, and this input uncertainty propagates through the entropy weight method, leading to weighting uncertainty and then to ranking uncertainty. Deterministic sensitivity analysis is widely used to evaluate the robustness of ranking results against variations in inputs [41]. Therefore, this paper checks the robustness of the output results by changing the values of the input data and focuses on whether the comprehensive ranking results change within a reasonable range of perturbations.
In this study, uncertainty in the input parameters was simulated by introducing controlled random perturbations to the baseline decision matrix. Percentage-based perturbation is a commonly used local sensitivity analysis approach, and uncertain input values are varied within predefined ranges to test the stability of model outputs when precise probability distributions are not available [42]. Let the value of the i-th technology under the j-th indicator after perturbation be expressed by Equation (11):
where is the perturbation factor, which is generated by the Microsoft Excel random number function RAND [43].
Taking the results of the original data under as the baseline scenario, perturbations of reasonable magnitude are applied to the environmental and economic dimension indicators, respectively. The social indicator was calculated from the perturbed human health indicators without repeating the perturbation setup. In this study, ±10% and ±15% were selected as representative moderate perturbation levels for robustness testing. Specifically, ±15% was applied to the environmental indicators and ±10% to the economic indicators, while a joint perturbation scenario was used to test the stability of the ranking under multidimensional uncertainty.
2.6. Case Study Description
The studied site is in the Yangtze River Delta region of China, and a machinery factory is located there for steel production, with Total Petroleum Hydrocarbons (TPH) as the main pollutant. The average value of TPH in soil samples is 3921 mg/kg, and the remediation target is 826 mg/kg. The depth of contamination at the exceedance points is mainly concentrated between 0.0 and 3.0 m. The selected site is representative because it involves a common petroleum hydrocarbon contamination scenario frequently encountered in industrial land remediation and reuse.
In this case study, the proposed model was applied in a stepwise manner. First, chemical oxidation, thermal desorption, and biopiles were identified as three feasible remediation technologies for comparison [14], and the prospective life cycle inventories were constructed for the three selected remediation technologies (Tables S1–S3). For materials and transportation data, which are mainly determined by earthwork quantities and engineering design assumptions, published literature data [44,45,46] were used as references for prospective technology evaluation. For inputs directly related to pollutant removal (oxidants/catalysts for chemical oxidation, N/P nutrient salts, consumables for thermal desorption tail gas treatment, etc.), these inputs were parameterized according to site TPH loading. In the case of chemical oxidation technology, the dosage of chemical reagents was empirically calibrated with reference to the reported Fenton oxidation dosage for petroleum hydrocarbon-contaminated soil [47]. For biopiles, a C:N:P ratio of 100:10:1 was adopted for microbial bacterial agent dosage [48]. Second, after the environmental, economic, and social indicators had been quantified under a unified functional unit, their values were integrated into the original decision matrix. The matrix was then normalized, and the objective weights of the indicators were determined using the entropy weight method. Third, the VIKOR method was applied under different compromise scenarios, and sensitivity analysis was conducted to evaluate the robustness of the ranking results. Finally, a complementary LCA contribution analysis was conducted to interpret the environmental burden sources of the optimal and worst-performing technologies.
3. Results and Discussion
3.1. Indicator Results of the Decision Matrix
Based on the case data, the decision matrix (Table 3) was constructed for the three remediation technologies using six indicators across environmental, economic and social dimensions. Environmental indicators were derived from the prospective LCA results using the ReCiPe 2016 endpoint method, and the social indicator (health welfare loss) was calculated from monetized human health damage. Economic indicators (remediation costs and remediation time) were estimated based on the engineering cases summarized by the U.S. Environmental Protection Agency (EPA) [49] and data from the literature [50,51,52,53,54,55] and were further recalculated to ensure consistency with the functional unit and system boundary defined in this study.
Table 3.
Decision matrix showing the six indicator values for the three technologies.
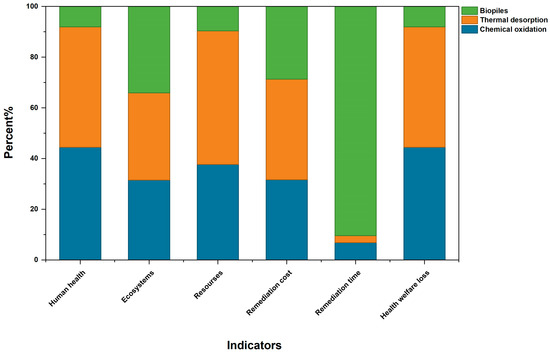
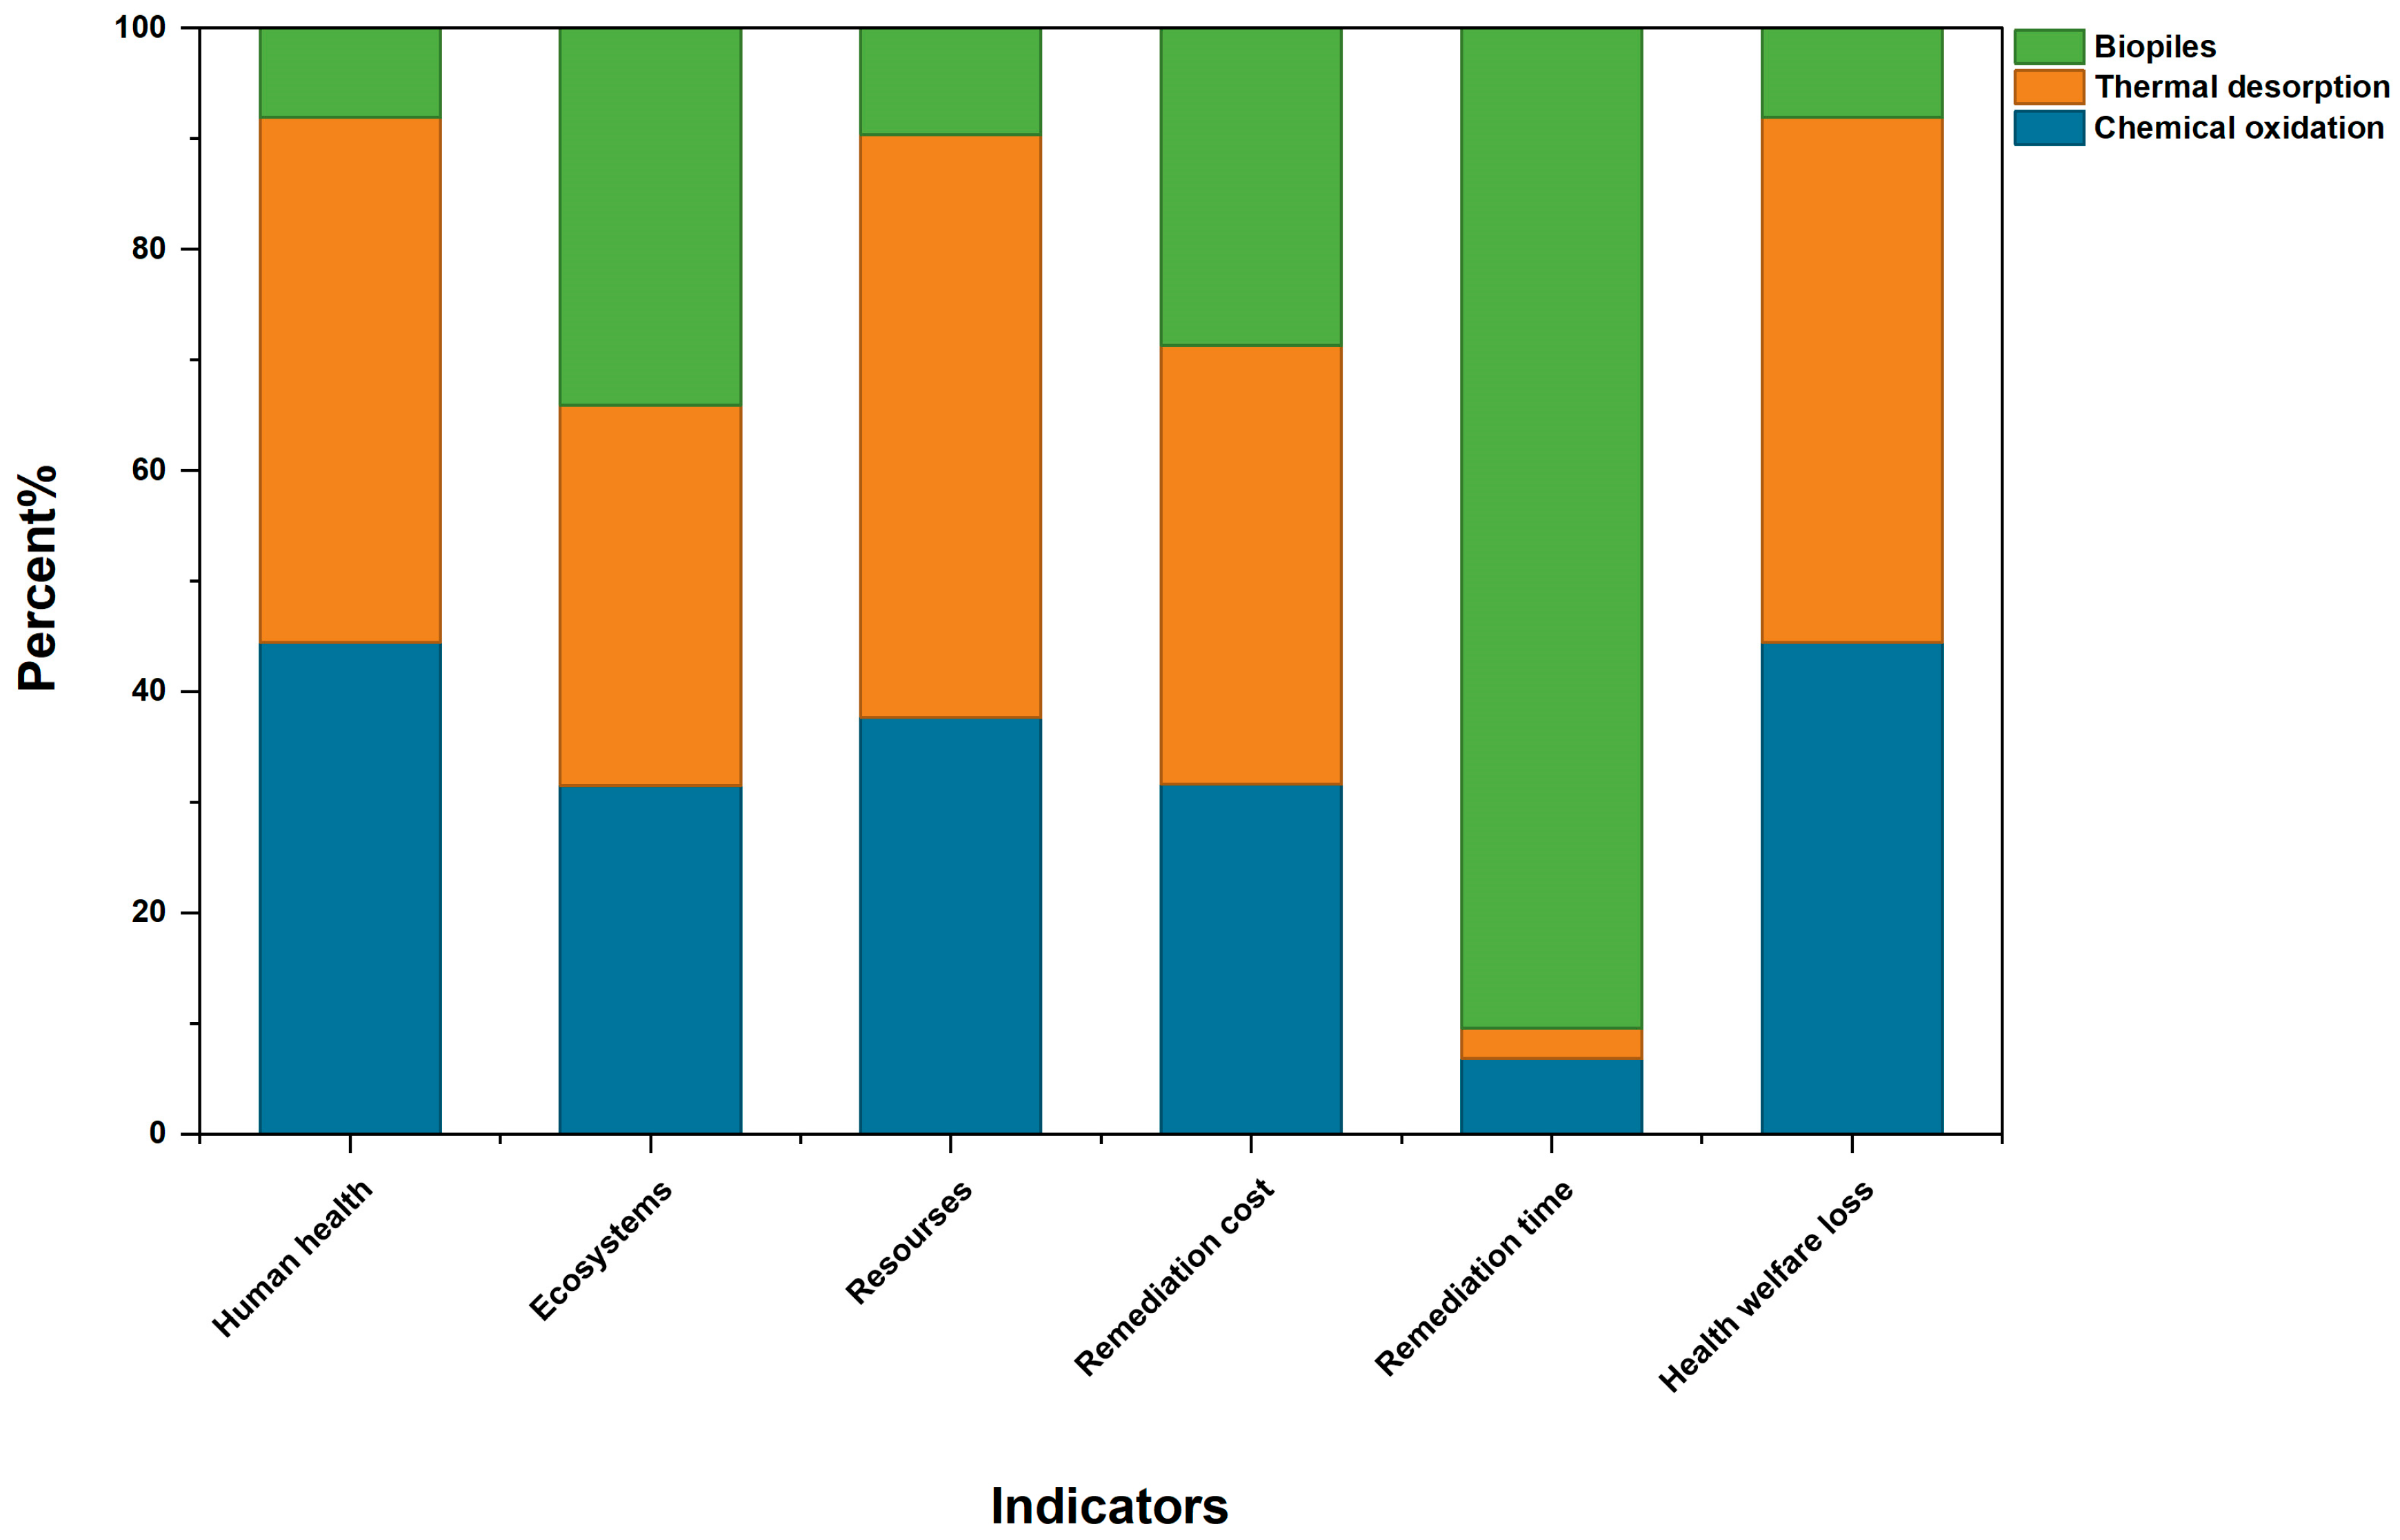
The percentage stacked plot of the indicator results (Figure 2) was constructed to illustrate the differences among the various remediation technologies across the individual indicators.
Figure 2.
Percentage stacked chart of indicator results.
As shown in Table 3 and Figure 2, the three remediation technologies exhibit clear differences across the environmental, economic, and social indicators. From the environmental perspective, biopiles exhibit the lowest impacts in the human health and resource indicators. Specifically, the human health impact of biopiles (1.08 × 10⁻⁴ DALY/m3) is approximately 81.8% lower than that of chemical oxidation and 83.0% lower than that of thermal desorption. Chemical oxidation has a relative advantage in ecosystem quality (9.25 × 10⁻⁷ species·yr/m3). The resource scarcity of biopiles (4.67 USD/m3) is approximately 74.5% lower than that of chemical oxidation and 81.8% lower than that of thermal desorption. Thermal desorption shows the highest values in all three environmental indicators, indicating relatively poor environmental performance among the three technologies.
In the economic dimension, biopiles exhibit the lowest remediation cost. However, biopiles also have the longest remediation time (0.66 d/m3), which is about 13.2 times that of chemical oxidation and 33 times that of thermal desorption. This trade-off between cost and time may reflect the comparatively lower treatment intensity and simpler engineering requirements of biopiles, together with the slower pace of the biological remediation process [56].
In the social dimension, biopiles also show the lowest health welfare loss (17.82 USD/m3), which is approximately 81.8% lower than that of chemical oxidation and 83.0% lower than that of thermal desorption. By contrast, thermal desorption exhibits the highest health welfare loss.
In conclusion, it is challenging to depict the overall GSR performance of various technologies in a multi-objective conflict scenario when comparing remediation technologies based on a single environmental, economic, or social indicator. This is also insufficient to support the decision-making process regarding technology preference during the pre-implementation stage of remediation. Therefore, it is necessary to introduce a multi-objective decision-making approach under a unified decision-making framework to integrate and rank multi-dimensional data.
3.2. Model Decision Results
The constructed decision matrix was normalized, and the entropy weight method was subsequently applied to determine the objective weights. The processed results are summarized in Table 4. Indicators with lower entropy values are given more weight since they show greater variety among options [57] and reflect the intrinsic data characteristics of the evaluated options. The entropy-based weighting results emphasize health-related and ecological indicators, which are consistent with the core principles of the GSR framework that prioritize environmental protection and human well-being in prospective remediation decision-making [2,5].
Table 4.
Entropy-based weights on the normalized decision matrix.
Subsequently, the S and R values, the VIKOR compromise index (Q) for the three technologies, and the ranking results under different v values were obtained, as shown in Table 5.
Table 5.
Compromise indicator Q for different compromise coefficient scenarios.
The results show that biopiles rank as the optimal technological solution, and thermal desorption ranks as the least preferred one at different v-values, with a consistent ranking order of biopiles > chemical oxidation > thermal desorption across all tested v values. This result is broadly consistent with previous studies [14,17,18] showing that biological remediation technologies, including biopiles, often present lower costs and lower overall environmental burden than more energy-intensive thermal approaches.
Remarkably, the biopile technology has a Q value of 0 for all three scenarios, demonstrating the optimal compromise ranking performance, and thermal desorption in all scenarios has a Q value of 1. As v controls the balance between group utility (S) and individual regret (R) in the Q calculation, the Q value for chemical oxidation shows a gradual decreasing trend with increasing v, resulting in a more favorable relative compromise ranking under group utility prioritization. In terms of decision mechanisms, the biopile technology is close to or reaches the ideal solution in most environmental, economic, and social metrics, and chemical oxidation has some advantages in terms of ecosystem quality, but the health and resource consumption burdens make it a slightly weaker overall trade-off than biopiles. In contrast, thermal desorption is unfavorable on key indicators such as energy consumption and remediation cost.
3.3. Deterministic Sensitivity Analysis Results
The recalculated ranking results under different perturbation scenarios are summarized in Table 6. In all scenarios, the ranking order remained unchanged as biopiles > chemical oxidation > thermal desorption. Despite some numerical fluctuations in the VIKOR compromise index Q across scenarios, the ranking results did not change, indicating that the model outputs are insensitive to parameter perturbations within reasonable ranges [58].
Table 6.
Summary of ranking results under different perturbation scenarios.
The above results verify that, in the GSR-based prospective decision-making model for contaminated site remediation technologies constructed in this paper, the results of remediation technology preference are mainly determined by the overall relative performance of each technology on multi-dimensional indicators rather than by the value of a single indicator or an extreme parameter, which verifies that the model has better robustness and decision-making reliability in the prospective remediation technology preference stage.
3.4. GSR Improvement Recommendations Derived from LCA
To further explain the environmental driving mechanism of the comprehensive ranking results, the optimal performing technology (biopiles) and the worst performing technology (thermal desorption) were selected as representative scenarios. The ReCiPe 2016 midpoint method does not consolidate environmental impacts into broad categories. Instead, it adopts a more refined analytical strategy, providing detailed evaluation results independently for each specific environmental impact category. This facilitates the identification of critical pollution sources, thereby providing a scientific basis for optimizing remediation strategies.
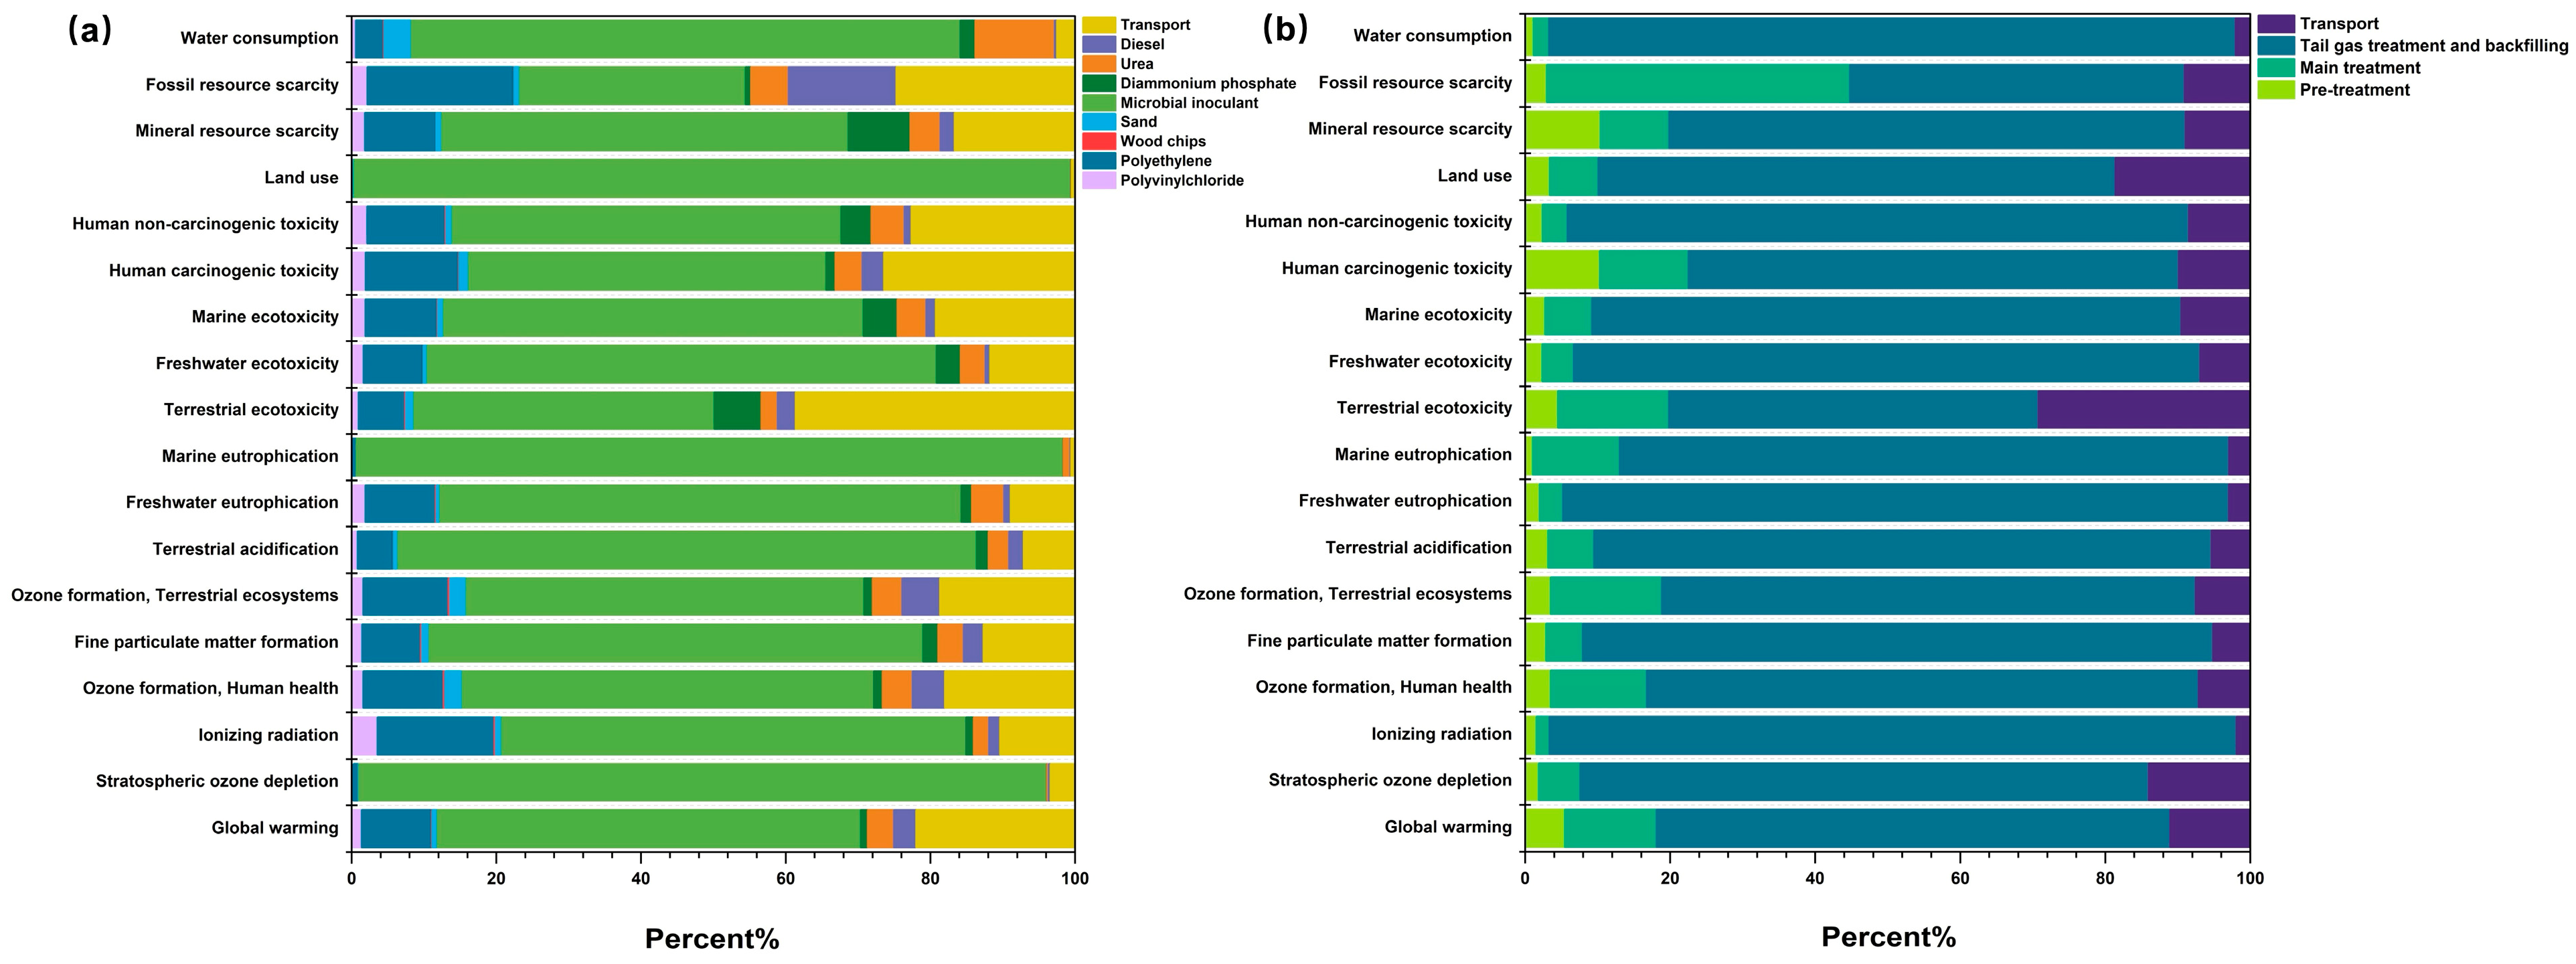
The ReCiPe 2016 midpoint method was used to conduct a complementary LCA to identify the key sources of environmental impacts behind the comprehensive ranking results at the midpoint level and to propose the direction of optimization and improvement for GSR recommendations. The normalized results of the two technologies for the 18 midpoint impact indicators were calculated to eliminate differences in the magnitudes of the different indicators and to highlight their relative contributions, as shown in Figure 3.
Figure 3.
Contribution analysis of environmental impacts: (a) Biopiles; (b) Thermal desorption.
As shown in Figure 3a, the environmental impacts of biopiles in the ReCiPe 2016 midpoint categories are primarily derived from nutrient and biologically related materials input during the remediation process, with diammonium phosphate and microbial inoculant contributing most significantly. Engineering support materials generally contribute less to overall environmental impacts in the midpoint categories.
The relatively lower environmental burden of biopiles in this study is accompanied by a contribution structure dominated by material-related inputs. This is in line with the literature on bioremediation [59,60], which emphasizes the importance of nutrient management, aeration, and other operating conditions in sustaining biodegradation performance. When further optimizing biopiles, priority should be given to reducing the eutrophication- and toxicity-related environmental impacts by improving nutrient use efficiency or adopting microbial inoculants with lower environmental impacts to enhance their GSR performance.
As illustrated in Figure 3b, the environmental impact contributions of thermal desorption technology are highly concentrated in most midpoint categories, mainly originating from the tail gas treatment and backfilling phase. In most categories, this phase accounts for the largest share, often exceeding 60% of the total contribution. The main treatment stage has a more significant impact on the resource scarcity category, which is consistent with the process characteristics of thermal desorption, which relies on high-temperature heating and requires a large supply of fuel [61]. The high-intensity energy inputs not only directly increase Greenhouse Gas (GHG) emissions and fossil resource consumption but also intensify the burden of air pollution through combustion emissions. This dominance of tail-gas treatment and backfilling in most midpoint categories, together with the notable contribution of the main treatment stage to resource scarcity, is broadly consistent with the energy-intensive nature of thermal remediation reported in previous studies [62,63].
Based on these findings, GSR improvement recommendations for thermal desorption should focus on three aspects. First, the unit energy consumption of high-temperature processes should be reduced by improving thermal efficiency and enhancing waste-heat recovery. Second, low-carbon energy sources or cleaner fuel alternatives should be promoted to mitigate climate-related impacts. Third, transportation organization and the proximity of disposal pathways should be optimized to reduce associated environmental burdens.
4. Conclusions
In this paper, a quantitative and operational decision-making model based on GSR is constructed around the problem of selecting remediation technologies in the pre-implementation phase of a contaminated site. The model selects six quantifiable indicators—human health, ecosystems, resources, remediation cost, remediation time, and health welfare loss—to form a decision matrix. By combining the entropy weight method with the VIKOR method, the study develops a prospective and multi-objective decision-making tool.
The model was applied to a petroleum hydrocarbon-contaminated site in the Yangtze River Delta region of China, and the results of the decision matrix showed that the impacts of different remediation technologies differed significantly. Biopiles performed optimally in human health, resources, remediation cost and health welfare loss, while chemical oxidation performed relatively better in ecosystem quality. Thermal desorption was at a relative disadvantage in most of the indicators. Further, the multi-objective decision-making model showed that the ranking results were consistent under different compromise coefficients (biopiles > chemical oxidation > thermal desorption), which indicated that the model had a stable decision-making output capacity under the conditions of changing target preferences, and the robustness of the model results was verified by deterministic sensitivity analysis. In addition, a complementary LCA based on the ReCiPe 2016 midpoint method was conducted for the optimal and worst-performing technologies to derive targeted GSR improvement recommendations. The results indicate that biopiles should be prioritized as a relatively low-input remediation option. By contrast, thermal desorption is associated with higher overall environmental and economic burdens and is more suitable for scenarios requiring rapid and intensive treatment.
In general, the proposed model provides a quantitative and operational basis for remediation technology selection and can be used as an effective supplement to the transformation of the GSR principles from qualitative guidance to quantitative decision-making in engineering practice, which can provide support for the scientific selection of remediation technologies and their sustainable implementation. In future research, the proposed model could be further optimized by incorporating input from a wider range of experts and stakeholders. The economic dimension could be further refined by incorporating more detailed indicators, such as a clearer decomposition of Capital Expenditure (CAPEX) and Operating Expenditure (OPEX), while the social dimension could also be expanded with additional relevant indicators.
Supplementary Materials
The following supporting information can be downloaded at: https://www.mdpi.com/article/10.3390/su18073553/s1, Table S1: Life cycle inventory of in situ chemical oxidation; Table S2: Life cycle inventory of ex situ thermal desorption; Table S3: Life cycle inventory of biopiles.
Author Contributions
Conceptualization, Y.S. and L.W.; methodology, Y.S.; software, L.W.; validation, Y.S. and Z.W.; formal analysis, Y.S.; investigation, Y.S.; resources, Y.S. and Z.W.; data curation, Z.W.; writing—original draft preparation, Y.S.; writing—review and editing, L.W.; visualization, Y.S.; supervision, L.W.; project administration, L.W.; funding acquisition, L.W. All authors have read and agreed to the published version of the manuscript.
Funding
This research was funded by the National Key Research and Development Program of China (No. 2023YFC3709600).
Institutional Review Board Statement
Not applicable.
Informed Consent Statement
Not applicable.
Data Availability Statement
Data are contained within the article and Supplementary Materials. Further inquiries can be directed to the corresponding author.
Conflicts of Interest
The authors declare no conflicts of interest.
References
- Ellis, D.E.; Hadley, P.W. Sustainable remediation white paper—Integrating sustainable principles, practices, and metrics into remediation projects. Remediat. J. 2009, 19, 5–114. [Google Scholar] [CrossRef] [Scilit]
- SuRF-UK. A framework for assessing the sustainability of soil and groundwater remediation. In Contaminated Land: Applications in Real Environments; CLAIRE: London, UK, 2010. [Google Scholar]
- ASTM E2876-13; Standard Guide for Integrating Sustainable Objectives into Cleanup. ASTM International: West Conshohocken, PA, USA, 2013.
- ASTM E2893-25; Standard Guide for Greener Cleanups. ASTM International: West Conshohocken, PA, USA, 2025.
- ISO 18504:2017; Soil Quality—Sustainable Remediation. International Organization for Standardization (ISO): Geneva, Switzerland, 2017.
- T/CAEPI 26—2020; Principles for Green and Sustainable Remediation. China Association of Environmental Protection Industry: Beijing, China, 2020.
- O’Connor, D.; Hou, D. Chapter 3—Sustainability assessment for remediation decision-making. In Sustainable Remediation of Contaminated Soil and Groundwater; Hou, D., Ed.; Butterworth-Heinemann: Oxford, UK, 2020; pp. 43–73. [Google Scholar]
- Harclerode, M.; Ridsdale, D.R.; Darmendrail, D.; Bardos, P.; Alexandrescu, F.; Nathanail, P.; Pizzol, L.; Rizzo, E. Integrating the Social Dimension in Remediation Decision-Making: State of the Practice and Way Forward. Remediat. J. 2015, 26, 11–42. [Google Scholar] [CrossRef] [Scilit]
- Bardos, P.; Bone, B.; Boyle, R.; Ellis, D.; Evans, F.; Harries, N.D.; Smith, J.W.N. Applying sustainable development principles to contaminated land management using the SuRF-UK framework. Remediat. J. 2011, 21, 77–100. [Google Scholar] [CrossRef] [Scilit]
- Cinelli, M.; Coles, S.R.; Kirwan, K. Analysis of the potentials of multi criteria decision analysis methods to conduct sustainability assessment. Ecol. Indic. 2014, 46, 138–148. [Google Scholar] [CrossRef] [Scilit]
- Pan, S.H.; Song, Y.N.; Wang, J.; Wang, J.; Hou, D.Y. Coupling health risk assessment and life cycle assessment for environmental and economic impact assessment of site remediation. Acta Sci. Circumst. 2021, 41, 4306–4314. [Google Scholar]
- Dong, J.Q. Assessment Methods and Case Studies on Contaminated Sites Green and Sustainable Remediation; China University of Geosciences: Beijing, China, 2019. [Google Scholar]
- Li, Y.; Chen, R.; Yang, X.; Liu, X.; Zhu, G.; Hu, Q. A Quantitative Sustainability Assessment Framework for Contaminated Site Remediation: Integrating LCA, Economic Analysis, and Social Big Data. Water 2025, 17, 3416. [Google Scholar] [CrossRef] [Scilit]
- Ossai, I.C.; Ahmed, A.; Hassan, A.; Hamid, F.S. Remediation of soil and water contaminated with petroleum hydrocarbon: A review. Environ. Technol. Innov. 2020, 17, 100526. [Google Scholar] [CrossRef] [Scilit]
- Liang, C.; Chien, Y.-C.; Lin, Y.-L. Impacts of ISCO Persulfate, Peroxide and Permanganate Oxidants on Soils: Soil Oxidant Demand and Soil Properties. Soil Sediment Contam. Int. J. 2012, 21, 701–719. [Google Scholar] [CrossRef] [Scilit]
- Zhao, C.; Dong, Y.; Feng, Y.; Li, Y.; Dong, Y. Thermal desorption for remediation of contaminated soil: A review. Chemosphere 2019, 221, 841–855. [Google Scholar] [CrossRef] [Scilit]
- Gomez, F.; Sartaj, M. Optimization of field scale biopiles for bioremediation of petroleum hydrocarbon contaminated soil at low temperature conditions by response surface methodology (RSM). Int. Biodeterior. Biodegrad. 2014, 89, 103–109. [Google Scholar] [CrossRef] [Scilit]
- Michael-Igolima, U.; Abbey, S.J.; Ifelebuegu, A.O. A systematic review on the effectiveness of remediation methods for oil contaminated soils. Environ. Adv. 2022, 9, 100319. [Google Scholar] [CrossRef] [Scilit]
- ISO 14040; Environmental Management: Life-Cycle Assessment: Principles and Framework. International Organization for Standardization (ISO): Geneva, Switzerland, 2006.
- ISO 14044; Environmental Management: Life Cycle Assessment: Requirements and Guidelines. International Organization for Standardization (ISO): Geneva, Switzerland, 2006.
- Abu Dabous, S.; Zeiada, W.; Zayed, T.; Al-Ruzouq, R. Sustainability-informed multi-criteria decision support framework for ranking and prioritization of pavement sections. J. Clean. Prod. 2020, 244, 118755. [Google Scholar] [CrossRef] [Scilit]
- Yazdani, M.; Graeml, F.R. VIKOR and its applications: A state-of-the-art survey. Int. J. Strateg. Decis. Sci. (IJSDS) 2014, 5, 56–83. [Google Scholar] [CrossRef] [Scilit]
- Cucurachi, S.; van der Giesen, C.; Guinée, J. Ex-ante LCA of Emerging Technologies. Procedia CIRP 2018, 69, 463–468. [Google Scholar] [CrossRef] [Scilit]
- Delpierre, M.; Quist, J.; Mertens, J.; Prieur-Vernat, A.; Cucurachi, S. Assessing the environmental impacts of wind-based hydrogen production in the Netherlands using ex-ante LCA and scenarios analysis. J. Clean. Prod. 2021, 299, 126866. [Google Scholar] [CrossRef] [Scilit]
- Norris, G.A. Impact characterization in the tool for the reduction and assessment of chemical and other environmental impacts: Methods for acidification, eutrophication, and ozone formation. J. Ind. Ecol. 2002, 6, 79–101. [Google Scholar] [CrossRef] [Scilit]
- Rybaczewska-Błażejowska, M.; Jezierski, D. Comparison of ReCiPe 2016, ILCD 2011, CML-IA baseline and IMPACT 2002+ LCIA methods: A case study based on the electricity consumption mix in Europe. Int. J. Life Cycle Assess. 2024, 29, 1799–1817. [Google Scholar] [CrossRef] [Scilit]
- Huijbregts, M.A.J.; Steinmann, Z.J.N.; Elshout, P.M.F.; Stam, G.; Verones, F.; Vieira, M.; Zijp, M.; Hollander, A.; van Zelm, R. ReCiPe2016: A harmonised life cycle impact assessment method at midpoint and endpoint level. Int. J. Life Cycle Assess. 2016, 22, 138–147. [Google Scholar] [CrossRef] [Scilit]
- Cai, N.; Zhao, Y.; Xu, F.; Jiang, M.; Han, L.; Zhu, B.; Wang, B. Integrated internal and external exposure models for dimethylformamide risk assessment and health risk monetization. Ecotoxicol. Environ. Saf. 2025, 291, 117890. [Google Scholar] [CrossRef] [Scilit]
- Krishnan, A.R. Past efforts in determining suitable normalization methods for multi-criteria decision-making: A short survey. Front. Big Data 2022, 5, 990699. [Google Scholar] [CrossRef] [Scilit]
- Sinsomboonthong, S. Performance Comparison of New Adjusted Min–Max with Decimal Scaling and Statistical Column Normalization Methods for Artificial Neural Network Classification. Int. J. Math. Math. Sci. 2022, 2022, 3584406. [Google Scholar] [CrossRef] [Scilit]
- Malefaki, S.; Markatos, D.; Filippatos, A.; Pantelakis, S. A Comparative Analysis of Multi-Criteria Decision-Making Methods and Normalization Techniques in Holistic Sustainability Assessment for Engineering Applications. Aerospace 2025, 12, 100. [Google Scholar] [CrossRef] [Scilit]
- Zhang, Z.; Cheng, Y.; Liu, N.C. Comparison of the effect of mean-based method and z-score for field normalization of citations at the level of Web of Science subject categories. Scientometrics 2014, 101, 1679–1693. [Google Scholar] [CrossRef] [Scilit]
- Kumar, R.; Singh, S.; Bilga, P.S.; Jatin; Singh, J.; Singh, S.; Scutaru, M.-L.; Pruncu, C.I. Revealing the benefits of entropy weights method for multi-objective optimization in machining operations: A critical review. J. Mater. Res. Technol. 2021, 10, 1471–1492. [Google Scholar] [CrossRef] [Scilit]
- Zhe, W.; Xigang, X.; Feng, Y. An abnormal phenomenon in entropy weight method in the dynamic evaluation of water quality index. Ecol. Indic. 2021, 131, 108137. [Google Scholar] [CrossRef] [Scilit]
- Kim, J.H.; Ahn, B.S. Extended VIKOR method using incomplete criteria weights. Expert Syst. Appl. 2019, 126, 124–132. [Google Scholar] [CrossRef] [Scilit]
- Anderson, R.; Norrman, J.; Back, P.-E.; Söderqvist, T.; Rosén, L. What’s the point? The contribution of a sustainability view in contaminated site remediation. Sci. Total Environ. 2018, 630, 103–116. [Google Scholar] [CrossRef] [Scilit]
- Opricovic, S.; Tzeng, G.-H. Compromise solution by MCDM methods: A comparative analysis of VIKOR and TOPSIS. Eur. J. Oper. Res. 2004, 156, 445–455. [Google Scholar] [CrossRef] [Scilit]
- Tao, X.; Jiang, W. Automatically interactive group VIKOR decision making mechanism based on BSO-SNA. Appl. Soft Comput. 2021, 113, 107979. [Google Scholar] [CrossRef] [Scilit]
- Patel, G.; Das, S.; Das, R. Evaluation of optimal normalization techniques in multi-criteria decision-making to rank CMIP6 climate models. Theor. Appl. Climatol. 2025, 156, 385. [Google Scholar] [CrossRef] [Scilit]
- Opricovic, S.; Tzeng, G.-H. Extended VIKOR method in comparison with outranking methods. Eur. J. Oper. Res. 2007, 178, 514–529. [Google Scholar] [CrossRef] [Scilit]
- Więckowski, J.; Sałabun, W. Sensitivity analysis approaches in multi-criteria decision analysis: A systematic review. Appl. Soft Comput. 2023, 148, 110915. [Google Scholar] [CrossRef] [Scilit]
- Mahmood, A.; Varabuntoonvit, V.; Mungkalasiri, J.; Silalertruksa, T.; Gheewala, S.H. A Tier-Wise Method for Evaluating Uncertainty in Life Cycle Assessment. Sustainability 2022, 14, 13400. [Google Scholar] [CrossRef] [Scilit]
- Tanackov, I.; Sinani, F.; Stanković, M.; Bogdanović, V.; Stević, Ž.; Vidić, M.; Mihaljev-Martinov, J. Natural Test for Random Numbers Generator Based on Exponential Distribution. Mathematics 2019, 7, 920. [Google Scholar] [CrossRef] [Scilit]
- Cai, Y.X. Evaluation of Greenhouse Gas Emissions in Soil Remediation Activities Based on the Integration of Machine Learning Models and Life Cycle Assessment. Master’s Thesis, Chinese Research Academy of Environmental Sciences, Beijing, China, 2025. [Google Scholar]
- Yuan, H.C.; Sang, Y.M.; Yang, L.; Yang, T.Y.; Song, Q.W.; Zhang, X.; Zhen, Z.S. Green sustainability analysis of soil thermal desorption remediation technology based on life cycle assessment. Pet. Process. Petrochem. 2024, 55, 118–128. [Google Scholar] [CrossRef]
- Sanscartier, D.; Margni, M.; Reimer, K.; Zeeb, B. Comparison of the secondary environmental impacts of three remediation alternatives for a diesel-contaminated site in Northern Canada. Soil Sediment Contam. 2010, 19, 338–355. [Google Scholar] [CrossRef] [Scilit]
- Villa, R.D.; Trovó, A.G.; Nogueira, R.F.P. Diesel degradation in soil by Fenton process. J. Braz. Chem. Soc. 2010, 21, 1089–1095. [Google Scholar] [CrossRef] [Scilit]
- Jin, W.B.; Wang, B.Z.; Song, L.H. Experimental study of composting treatment for crude-oil contaminated soil. Acta Sci. Circumst. 2002, 22, 405–407. [Google Scholar]
- U.S. Environmental Protection Agency. Application, Performance, and Costs for Biotreatment Technologies for Contaminated Soils; EPA: Cincinnati, OH, USA, 2002.
- McDade, J.M.; McGuire, T.M.; Newell, C.J. Analysis of DNAPL source-depletion costs at 36 field sites. Remediat. J. 2005, 15, 9–18. [Google Scholar] [CrossRef] [Scilit]
- Horst, J.; Munholland, J.; Hegele, P.; Klemmer, M.; Gattenby, J. In Situ Thermal Remediation for Source Areas: Technology Advances and a Review of the Market From 1988–2020. Ground Water Monit. Remediat. 2021, 41, 17. [Google Scholar] [CrossRef] [Scilit]
- Heron, G.; Parker, K.; Galligan, J.; Holmes, T.C. Thermal Treatment of Eight CVOC Source Zones to Near Nondetect Concentrations. Groundw. Monit. Remediat. 2009, 29, 56–65. [Google Scholar] [CrossRef] [Scilit]
- Chang, Y.-C.; Chen, T.-Y.; Tsai, Y.-P.; Chen, K.-F. Remediation of trichloroethene (TCE)-contaminated groundwater by persulfate oxidation: A field-scale study. RSC Adv. 2018, 8, 2433–2440. [Google Scholar] [CrossRef] [Scilit] [PubMed]
- Baker, R.S.; Nielsen, S.G.; Heron, G.; Ploug, N. How effective is thermal remediation of DNAPL source zones in reducing groundwater concentrations? Groundw. Monit. Remediat. 2016, 36, 38–53. [Google Scholar] [CrossRef] [Scilit]
- Iturbe, R.; Flores, C.; Chavez, C.; Bautista, G.; Torres, L.G. Remediation of contaminated soil using soil washing and biopile methodologies at a field level. J. Soils Sediments 2004, 4, 115–122. [Google Scholar] [CrossRef] [Scilit]
- McWatters, R.S.; Wilkins, D.; Spedding, T.; Hince, G.; Raymond, B.; Lagerewskij, G.; Terry, D.; Wise, L.; Snape, I. On site remediation of a fuel spill and soil reuse in Antarctica. Sci. Total Environ. 2016, 571, 963–973. [Google Scholar] [CrossRef] [Scilit]
- Roszkowska, E. Entropy and Normalization in MCDA: A Data-Driven Perspective on Ranking Stability. Entropy 2026, 28, 114. [Google Scholar] [CrossRef] [Scilit]
- Alinezhad, A.; Esfandiari, N. Sensitivity Analysis in the QUALIFLEX and VIKOR Methods. J. Optim. Ind. Eng. 2012, 10, 29–34. [Google Scholar]
- Kim, J.; Lee, A.H.; Chang, W. Enhanced bioremediation of nutrient-amended, petroleum hydrocarbon-contaminated soils over a cold-climate winter: The rate and extent of hydrocarbon biodegradation and microbial response in a pilot-scale biopile subjected to natural seasonal freeze-thaw temperatures. Sci. Total Environ. 2018, 612, 903–913. [Google Scholar] [CrossRef] [Scilit]
- Ostovar, M.; Muñana, S.; Galdames, A.; Berganza, J.; Orueta, M.; Esteban, J.J.; Brettes, P.; Vilela, J.L.V.; Rubio, L.R. Advancements in biopile-based sustainable soil remediation: A decade of improvements, integrating bioremediation technologies and AI-based innovative tools. Environ. Sci. Pollut. Res. 2025, 32, 22766–22793. [Google Scholar] [CrossRef] [Scilit]
- Vidonish, J.E.; Zygourakis, K.; Masiello, C.A.; Sabadell, G.; Alvarez, P.J.J. Thermal Treatment of Hydrocarbon-Impacted Soils: A Review of Technology Innovation for Sustainable Remediation. Engineering 2016, 2, 426–437. [Google Scholar] [CrossRef] [Scilit]
- Alazaiva, M.Y.D.; Albahnasawi, A.; Copty, N.K.; Ali, G.A.M.; Bashir, M.J.K.; Al Maskari, T.; Abu Amr, S.S.; Abujazar, M.S.S.; Nassani, D.E. Thermal based remediation technologies for soil and groundwater: A review. Desalination Water Treat. 2022, 259, 206–220. [Google Scholar] [CrossRef] [Scilit]
- Hou, D.; Gu, Q.; Ma, F.; O’Connell, S. Life cycle assessment comparison of thermal desorption and stabilization/solidification of mercury contaminated soil on agricultural land. J. Clean. Prod. 2016, 139, 949–956. [Google Scholar] [CrossRef] [Scilit]

Disclaimer/Publisher’s Note: The statements, opinions and data contained in all publications are solely those of the individual author(s) and contributor(s) and not of MDPI and/or the editor(s). MDPI and/or the editor(s) disclaim responsibility for any injury to people or property resulting from any ideas, methods, instructions or products referred to in the content. |
© 2026 by the authors. Licensee MDPI, Basel, Switzerland. This article is an open access article distributed under the terms and conditions of the Creative Commons Attribution (CC BY) license.